Embed Size (px)
Citation preview

TATIONpRÆSEN
5 DECEMBER 2013
“BERRYMEAT” CONSUMER EXPERIMENTS- A CASE OF NOVEL FOOD PRODUCTS’ CONSUMER ACCEPTANCE
ANALYSED THROUGHOUT THE CONSUMPTION CYCLE
MORTEN FENGERMAPP CENTRE FOR RESEARCH ON CUSTOMER RELATIONS IN THE FOOD SECTORAARHUS UNIVERSITET
1
BERRYMEATMORTEN FENGER
5 DECEMBER 2013
MAPP CENTRE FOR RESEARCH ON CUSTOMER RELATIONS IN THE FOOD SECTOR
AGENDA
› The BERRYMEAT project case1. The effect of ”storytelling” on product preference
2. Measuring quality expectations in throughout the consumption cycle
3. Explaining quality expectation changes over time
4. Explaining willingness-to-pay changes over time
2

BERRYMEATMORTEN FENGER
5 DECEMBER 2013
MAPP CENTRE FOR RESEARCH ON CUSTOMER RELATIONS IN THE FOOD SECTOR
THE BERRYMEAT PROJECT› Project title
› New market perspectives using herbs and berries in organic meat products – BERRYMEAT
› Partners› AU Food and Agriculture research (screen various herbs and berries for preserving effects)› Danish Meat Research Institute (scientifically testing the effect of preserving processed meat product
with the candidate herbs and berries, and combinations hereof)› MAPP centre (analyse consumer’s acceptance of BERRYMEAT products)› Hanegal (ecological major meat processor, project partner)› Tulip (conventional major meat processor, project partner)
› Project sponsor› The project is financed by GUDP Green Growth and Demonstration Programme, under the Danish
Ministry of Food, Agriculture and Fishery
› Project timeframe› 2011-2013
3

BERRYMEATMORTEN FENGER
5 DECEMBER 2013
MAPP CENTRE FOR RESEARCH ON CUSTOMER RELATIONS IN THE FOOD SECTOR
5 DECEMBER 2013
Identification of willingness-to-pay
for BERRYMEAT products
Pre/post purchase study
Consumer tests of BERRYMEAT
products and information
relating thereto
BACKGROUND FOR THE STUDY
”Products preserved with herbs and berries from WP2 and WP4
will be used for consumer tests where 150 consumers will receive
samples (…) for tasting, together with information on production
technology. Pre- and post-trial attitude to the preservation
technology and re-purchase intention will be measured. This will
show how attractive the products are to the consumer, e.g. how
the products are compared to traditional products and what price
the consumer is willing to pay”
4

BERRYMEATMORTEN FENGER
5 DECEMBER 2013
MAPP CENTRE FOR RESEARCH ON CUSTOMER RELATIONS IN THE FOOD SECTOR
5 DECEMBER 2013
FOOD PRODUCT LAUNCHES WITH NITRITE
› With nitrite, globally 1998-2013 (2013 up to 15. of August only)
› With nitrite, DK1998-2013(2013 up to 15. of August only)
5
(Source: Mintel GNDP)

BERRYMEATMORTEN FENGER
5 DECEMBER 2013
MAPP CENTRE FOR RESEARCH ON CUSTOMER RELATIONS IN THE FOOD SECTOR
THREE STEPS IN THE PROJECT1. Preliminary focus groups
› Which attitude does the consumers have towards the preservation technique, where berries and herbs are applied?
› Which berries and herbs are accepted in processed meats by Danish consumers?
› Can consumers accept a mix of meat and berries/herbs?2. Identification of the most promising products
› Which of the planned products are the consumers preferred ones?› Which product information does the consumers prefer?› Do ”storytelling” about the applied ingredients and used methods have any
effect on the questions above?3. Test of ”consumption cycle” with the most promising products
› How does the quality perception change during a consumption cycle? › Which prices are the consumers willing to pay for BERRYMEAT products?
6

BERRYMEATMORTEN FENGER
5 DECEMBER 2013
MAPP CENTRE FOR RESEARCH ON CUSTOMER RELATIONS IN THE FOOD SECTOR
AGENDA
› The BERRYMEAT project case1. The effect of ”storytelling” on product preference
2. Measuring quality expectations in throughout the consumption cycle
3. Explaining quality expectation changes over time
4. Explaining willingness-to-pay changes over time
7

BERRYMEATMORTEN FENGER
5 DECEMBER 2013
MAPP CENTRE FOR RESEARCH ON CUSTOMER RELATIONS IN THE FOOD SECTOR
CHOICE EXPERIMENTExperimental design
› Online survey with 1,350 representatively chosen respondents› 2*2 design (2 products: ham dice (Tulip) and barbeque sausages (Hanegal); 2 scenarios:
with/without “storytelling”)
Product 1: Hanegal barbeque sausages› 2 types of meat (pork / hen)
› 4 different marketing informations
› none / low amount of salt / without nitrite / without nitrite and with a low amount of salt› 4 different package sizes, however, all of them had the same price/kg› 4 different seasonings with varying ”complexity”
› neutral / rosehip-ramsons / buckthorn-parsley / rosehip-ramsons-buckthorn-parsley
� 16 choice sets in 4 blocks, i.e. 4 choices (between 2 products) per respondent
Product 2: Tulip ham dice› 15 different seasonings› 5 different ”meat types” (novel or traditional, with different product info given)› 5 different price levels
� 75 choice sets in 5 blocks, i.e. 15 choices (between 2 products) per respondent
8

BERRYMEATMORTEN FENGER
5 DECEMBER 2013
MAPP CENTRE FOR RESEARCH ON CUSTOMER RELATIONS IN THE FOOD SECTOR
5 DECEMBER 2013
CHOICE SET EXAMPLE (1:4)- BARBEQUE SAUSAGES
A B
9

BERRYMEATMORTEN FENGER
5 DECEMBER 2013
MAPP CENTRE FOR RESEARCH ON CUSTOMER RELATIONS IN THE FOOD SECTOR
5 DECEMBER 2013
CHOICE SET EXAMPLE (2:4)- BARBEQUE SAUSAGES WITH “STORYTELLING”
A B

BERRYMEATMORTEN FENGER
5 DECEMBER 2013
MAPP CENTRE FOR RESEARCH ON CUSTOMER RELATIONS IN THE FOOD SECTOR
5 DECEMBER 2013
CHOICE SET EXAMPLE (3:4)- HAM DICE
A B
11

BERRYMEATMORTEN FENGER
5 DECEMBER 2013
MAPP CENTRE FOR RESEARCH ON CUSTOMER RELATIONS IN THE FOOD SECTOR
5 DECEMBER 2013
CHOICE SET EXAMPLE (4:4)- HAM DICE WITH “STORYTELLING”
A B
12

BERRYMEATMORTEN FENGER
5 DECEMBER 2013
MAPP CENTRE FOR RESEARCH ON CUSTOMER RELATIONS IN THE FOOD SECTOR
5 DECEMBER 2013
› Below, the 95% significance intervals are illustrated in the different variants of product
properties to respectively Tulip’s ham dice in herbs and Hanegal’s barbeque sausages
› Since all the intervals below overlap, there is no immediate significant difference
between the utility value from the scenarios respectively with or without ”storytelling”
within each individual factor levels
RESULTS FROM THE CHOICE EXPERIMENT (1:3)- WITH/WITHOUT ”STORYTELLING”
13

BERRYMEATMORTEN FENGER
5 DECEMBER 2013
MAPP CENTRE FOR RESEARCH ON CUSTOMER RELATIONS IN THE FOOD SECTOR
5 DECEMBER 2013
RESULTS FROM THE CHOICE EXPERIMENT (2:3)- HANEGAL’S BARBEQUE SAUSAGES› Significant effect by taste and information of preservation! I.e. the respondents prefer the variants
without nitrite and without nitrite and with a low amount of salt
› The significant preference to without nitrite and without nitrite and with a low amount of salt in the scenario without ”storytelling” becomes void with ”storytelling”. I.e. A ”good story” deemphasize the products factual claims
14

BERRYMEATMORTEN FENGER
5 DECEMBER 2013
MAPP CENTRE FOR RESEARCH ON CUSTOMER RELATIONS IN THE FOOD SECTOR
5 DECEMBER 2013
› General significant preference to ham dice in herbs with the information ”without nitrite”› Clear preference to the seasoning variant ”nordic pesto” compared to the others› (berries/buckthorn & bell pepper/neutral)› Ingen signifikant pris effekt!
RESULTS FROM THE CHOICE EXPERIMENT (3:3)- TULIP’S HAM DICE IN HERBS
15

BERRYMEATMORTEN FENGER
5 DECEMBER 2013
MAPP CENTRE FOR RESEARCH ON CUSTOMER RELATIONS IN THE FOOD SECTOR
5 DECEMBER 2013
CONCLUSIONS FROM THE CHOICE EXPERIMENT- WITH/WITHOUT ”STORYTELLING”
› Storytelling:› No significant differences within individual factor levels’ utility values
between with/without ”storytelling”› However, it does have a moderate effect on the other information of the
products :› Barbeque sausages (organic): ”storytelling makes the otherwise significant
preference to ”a low amount of salt” and ”without nitrite” dissappear› Ham dice with herbs (conventional): ”storytelling” makes all the variants of
ham dice with herbs preferred significantly to normal ham dice
› Preferred product characteristics:› (doesn’t really matter for this presentation)
16

BERRYMEATMORTEN FENGER
5 DECEMBER 2013
MAPP CENTRE FOR RESEARCH ON CUSTOMER RELATIONS IN THE FOOD SECTOR
AGENDA
› The BERRYMEAT project case1. The effect of ”storytelling” on product preference
2. Measuring quality expectations in throughout the consumption cycle
3. Explaining quality expectation changes over time
4. Explaining willingness-to-pay changes over time
17

BERRYMEATMORTEN FENGER
5 DECEMBER 2013
MAPP CENTRE FOR RESEARCH ON CUSTOMER RELATIONS IN THE FOOD SECTOR
5 DECEMBER 2013
65
4321
BERRYMEAT
info
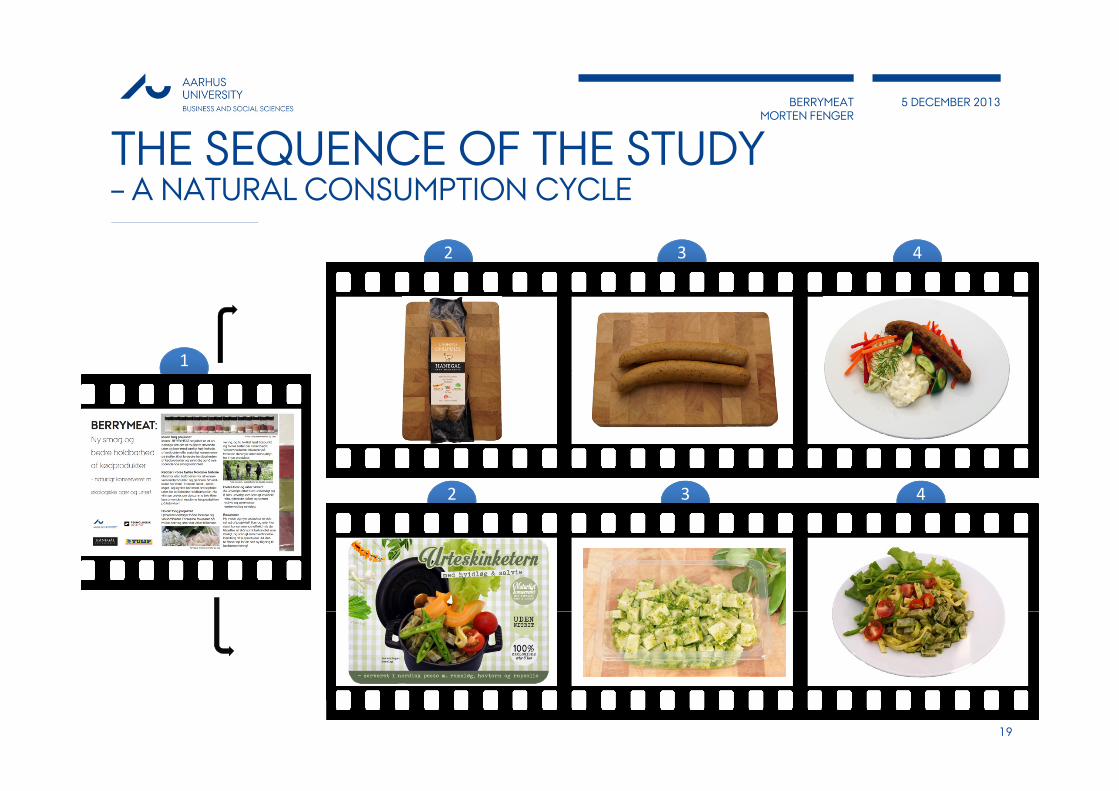
Unpacked
product
Packed
product
Serving
suggestion
Taste
sample
(post-trial)
Physical
product
(pre-trial)
- Quality expectations
- Feelings
- Spontaneous affect
- Eye-tracking
Me
asu
res
- Quality expectations
- Feelings
- Spontaneous affect
- Eye-tracking
- Quality expectations
- Feelings
- Spontaneous affect
- Eye-tracking
- Quality expectations
- Feelings
- Spontaneous affect
- Eye-tracking
- Quality perception
- Willingness-to-pay
- Quality expectations
- Willingness-to-pay
[Does the willingness-to-pay differ pre-/post-
trial and between different seasoning
intensities, and origin of herbs/berries?]
?
?
[Doubly repeated measures
MANOVA and step-down ANOVA
on quality expectations]
[Can spontaneous
affect explain changes
in quality perception?]
?
RESEARCH DESIGN- BERRYMEAT PRE-POST PURCHASE STUDY
18
BERRYMEATMORTEN FENGER
5 DECEMBER 2013
MAPP CENTRE FOR RESEARCH ON CUSTOMER RELATIONS IN THE FOOD SECTOR
432
432
1
THE SEQUENCE OF THE STUDY– A NATURAL CONSUMPTION CYCLE
19

BERRYMEATMORTEN FENGER
5 DECEMBER 2013
MAPP CENTRE FOR RESEARCH ON CUSTOMER RELATIONS IN THE FOOD SECTOR 20
20
QUESTIONS TO EACH PRODUCT- QUALITY EXPECTATIONS (7-POINT LIKERT SCALE)
(Health)
(Taste)
(Ingredients)
(Exciting)
(OverallQuality)
(WillPurchase)
(Usability)

BERRYMEATMORTEN FENGER
5 DECEMBER 2013
MAPP CENTRE FOR RESEARCH ON CUSTOMER RELATIONS IN THE FOOD SECTOR
DEVELOPMENT OF THE QUALITY EXPECTATION- THROUGH THE CONSUMPTIONS CYCLE
› 7 variables measured on an ascending scale from 1 to 7, by asking the respondents the same questions 6 repeated times during the consumption cycle’s 6 steps
› A PCA factor analysis identifies only one factor with a total eigenvalue of 4.44 (out of 7, thus. 63.5% variance explained)› The charts to the right shows the development in the average
quality expectations/perceptions through the consumption cycle
› A PCA of ∆QE’s identifies two factors with total communality of 4.57; one factor with all variables except ∆WillPurchase (factor 2). ∆Usability cross-loads (negatively on factor 2) [relevant for later…]
21
Quality Expectations, 95% confidence intervals

BERRYMEATMORTEN FENGER
5 DECEMBER 2013
MAPP CENTRE FOR RESEARCH ON CUSTOMER RELATIONS IN THE FOOD SECTOR
AGENDA
› The BERRYMEAT project case1. The effect of ”storytelling” on product preference
2. Measuring quality expectations in throughout the consumption cycle
3. Explaining quality expectation changes over time
4. Explaining willingness-to-pay changes over time
22

BERRYMEATMORTEN FENGER
5 DECEMBER 2013
MAPP CENTRE FOR RESEARCH ON CUSTOMER RELATIONS IN THE FOOD SECTOR
5 DECEMBER 2013
MEASURES OF SPONTANEOUS AFFECT - FACEREADER SOFTWARE
› Automatic recognition of several specific facial expressions like e.g. the “arch feelings”› Happiness› Sadness› Anger› Surprise› Fright› Disgust
23

BERRYMEATMORTEN FENGER
5 DECEMBER 2013
MAPP CENTRE FOR RESEARCH ON CUSTOMER RELATIONS IN THE FOOD SECTOR 24
METHODOLOGICAL APPROACH- QUESTIONNAIRE, FACEREADER AND EYE-TRACKER
0.5 sec 0.5 sec (30 measures/second)
1 2
∆Affect (mean differences)
∆Quality Expectations
Eye-tracking

BERRYMEATMORTEN FENGER
5 DECEMBER 2013
MAPP CENTRE FOR RESEARCH ON CUSTOMER RELATIONS IN THE FOOD SECTOR
CAN SPONTANEOUS AFFECT MEASURES EXPLAIN CHANGES IN QUALITY PERCEPTION?› Model the average quality expectation change from one step to the next in the
consumption cycle, based on: FaceReader feeling measures, step in consumption cycle (t) and product specific mean (comp)
› A multiple linear regression based on the above, produces the results below› Significant results for ∆Neutral, ∆Sad and (almost) ∆Happy at the 5% sig.level› Reasonable residual distribution
25

BERRYMEATMORTEN FENGER
5 DECEMBER 2013
MAPP CENTRE FOR RESEARCH ON CUSTOMER RELATIONS IN THE FOOD SECTOR
5 DECEMBER 2013
26
26
HEAT MAPS AND GAZEPLOTS, EXAMPLES

BERRYMEATMORTEN FENGER
5 DECEMBER 2013
MAPP CENTRE FOR RESEARCH ON CUSTOMER RELATIONS IN THE FOOD SECTOR
FACEREADER, EYE-TRACKING AND SURVEY QUESTIONS COMBINED IN A PLS MODEL
27
› In this model, the likeliness-to-purchase
variable is sought explained by:› Quality expectations dimension› Major FaceReader spontaneous affect measures› Eye-tracking TTFF measures (time-to-first-fixation)
for relevant AOI (area-of-interest) groups
› Case: BERRYMEAT info transition to
Tulips packaging label› QE dimension and Scared FaceReader affect
measure are both significant› TTFF product info from eye-tracking
is almost significant, too
› Bootstrap 95-CI’s of path coefficients:
*
*
**
WillPurchase R2 = 0.557

BERRYMEATMORTEN FENGER
5 DECEMBER 2013
MAPP CENTRE FOR RESEARCH ON CUSTOMER RELATIONS IN THE FOOD SECTOR
*
*
*
*
PLS MODEL TESTED DOWN
28
› Now both significant spontaneous affect measures, questionnaire variables and eye-tracking variables
› Preliminary results only – can be taken further
› Exemplifies the potential of combining these measures
› Model could be further refined with other autonomous nerve system responses such as temperature, heart rate, sweating hands etc.
'
****
› Bootstrap significance of paths:
WillPurchase R2 = 0.519

BERRYMEATMORTEN FENGER
5 DECEMBER 2013
MAPP CENTRE FOR RESEARCH ON CUSTOMER RELATIONS IN THE FOOD SECTOR
AGENDA
› The BERRYMEAT project case1. The effect of ”storytelling” on product preference
2. Measuring quality expectations in throughout the consumption cycle
3. Explaining quality expectation changes over time
4. Explaining willingness-to-pay changes over time
29

BERRYMEATMORTEN FENGER
5 DECEMBER 2013
MAPP CENTRE FOR RESEARCH ON CUSTOMER RELATIONS IN THE FOOD SECTOR
WILLINGNESS-TO-PAY (WTP)– EXPERIMENTAL AUCTIONS
› WTP was measured with experimental auctions in two rounds, and with the same 2 of the 4 ‘variants’ in both rounds
› Pre-trial (“first purchase” in the supermarket)› Post-trial (“repurchase situation”)
› The bids of the respondents are binding in both rounds, and by the time they placed the first bid, they did not know that we would allow them to change their bid after tasting samples
› Auction procedure for each round:› Place a bid for each product› Draw a “competing bid” from a lottery› If the competing bid is higher you’ve lost; if it is lower or equal to
your own bid, you pay the lower-or-equal price› If you win, you have to buy the product (however only forced to
buy one if winning both auctions); if you loose you get no chance to take home the product
› You have to pay immediately of the taxed DKK 250 received for your participation in the study
› This WTP auction type is specifically designed to obtain realistic bids for respondents real willingness to pay
30
ORIGIN NOT DECLARED/DECLARED FOR BERRIES AND HERBS
SE
AS
ON
ING
INTE
NS
ITY
ATTRIBUTE COMBINATIONS, SAUSAGES

BERRYMEATMORTEN FENGER
5 DECEMBER 2013
MAPP CENTRE FOR RESEARCH ON CUSTOMER RELATIONS IN THE FOOD SECTOR
CONCLUSIONS FROM AUCTIONS
› The bids are different pre/post trial (0.77 DKK), but not significant (p=0,190)› Higher seasoning intensity is significantly preferred (p=0,027) and valued at 1.33
DKK on average by the respondents› Declared origin of herbs and berries is almost significantly preferred (p=0,088)
and valued at 1.01 DKK on average by the respondents
31
PRE/POST TRIAL ORIGINSEASONING INTENSITY

BERRYMEATMORTEN FENGER
5 DECEMBER 2013
MAPP CENTRE FOR RESEARCH ON CUSTOMER RELATIONS IN THE FOOD SECTOR
5 DECEMBER 2013
SUMMING UP› Storytelling
› Significant effects of “storytelling” on product preference for two cases of novel food products› Storytelling makes the case for the new products with a story to tell!
› Measuring quality expectations throughout a consumption cycle› Very significant product specific effects (between products)› For some products, significant changes throughout the consumption cycle› Methodology can be used to assess where we “loose the customer” (if we do so) in the consumption
cycle, so that a product can be either respecified or it’s launch cancelled before failure in the market
› Explaining quality expectation changes over time› Changes in quality expectations can partly be explained by micro-step changes in what was felt
(spontaneous affect measures from FaceReader 0.5 seconds before/after new stimuli) and seen (eye-tracking measures)
› Explaining willingness-to-pay changes over time› Significant preference for high seasoning intensity with “exotic” Nordic herbs and berries› (Almost) significant positive preference for products with local origin of ingredients specified. However
no interaction (“I can taste the increased flavour of local seasonings”), thus a pure preference for local, with a relevant higher WTP (1.01 DKK our of an expected listing price of 18.95 i.e. 5% price premium)
32