Embed Size (px)
Citation preview


Introduction
Online Survey regarding marketing activitiesSent to exhibition organisersThe results analysed by trade and consumer show organisers
Our RespondentsThese companies represent just some of those who responded to the survey.

Measuring ROI of each element of marketing campaign
Trade – 54%Consumer – 70%
Do you accurately measure the return on investment each element of your event marketing programme delivers:

Visitor Marketing Campaign – when does it start:
Consumer – on average 21 weeks before the event (4.8 months)Trade – on average 23 weeks before the event (5.3 months)
TRADE CONSUMER
Mode – 3 to 4 months (40%)
More than 6 months before32%
Mode – 3 to 4 months (37%)
More than 6 months before33%
How soon before the event did you start your visitor marketing campaign:

36% increase
12% decrease
Marketing spend split – Consumer shows
Offline spend
Online spend
Last 12 months
Last 12 months
Next 12 months
Next 12 months
75%
25%
66%
34%
To what extent has your marketing spend increased/decreased over the last 12 months and to what extent do you expect it to change over the next 12 months:

Offline spending - Consumer
Last 12 months
Next 12 months
Direct Marketing 24% 25%
Magazine advertising 20% 19%
National newspapers 18% 17%
Radio advertising 16% 17%
PR 14% 14%
TV advertising 8% 7%
Please provide an estimate for the proportion of your event marketing budget spend on each of the following:

Online spending - Consumer
Last 12 months
Next 12 months
Event website 40% 38%
Email 22% 20%
SEO (search engine optimisation) 9% 8%
Affiliate 5% 8%
PR 7% 7%
Viral email campaigns 4% 6%
Online display on websites 9% 5%
Podcasts 2% 3%
Blogging 1% 3%
Mobile marketing 1% 2%
Please provide an estimate for the proportion of your event marketing budget spend on each of the following:

24% increase
12% decrease
Marketing spend split – Trade shows
Offline spend
Online spend
Last 12 months
Last 12 months
Next 12 months
Next 12 months
67%
33%
59%
41%
To what extent has your marketing spend increased/decreased over the last 12 months and to what extent do you expect it to change over the next 12 months:

Offline spending - Trade
Last 12 months
Next 12 months
Direct Marketing 50% 51%
Magazine advertising 28% 26%
PR 16% 18%
National newspapers 3% 3%
Radio advertising 1% 1%
TV advertising 1% <1%
Please provide an estimate for the proportion of your event marketing budget spend on each of the following:

Online spending - Trade
Last 12 months
Next 12 months
Event website 41% 41%
Email 29% 29%
Online display on websites 8% 8%
PR 8% 8%
SEO (search engine optimisation) 3% 4%
Viral email campaigns 3% 3%
Podcasts 2% 2%
Affiliate 2% 2%
Mobile marketing 1% 2%
Blogging 1% 2%
Please provide an estimate for the proportion of your event marketing budget spend on each of the following:
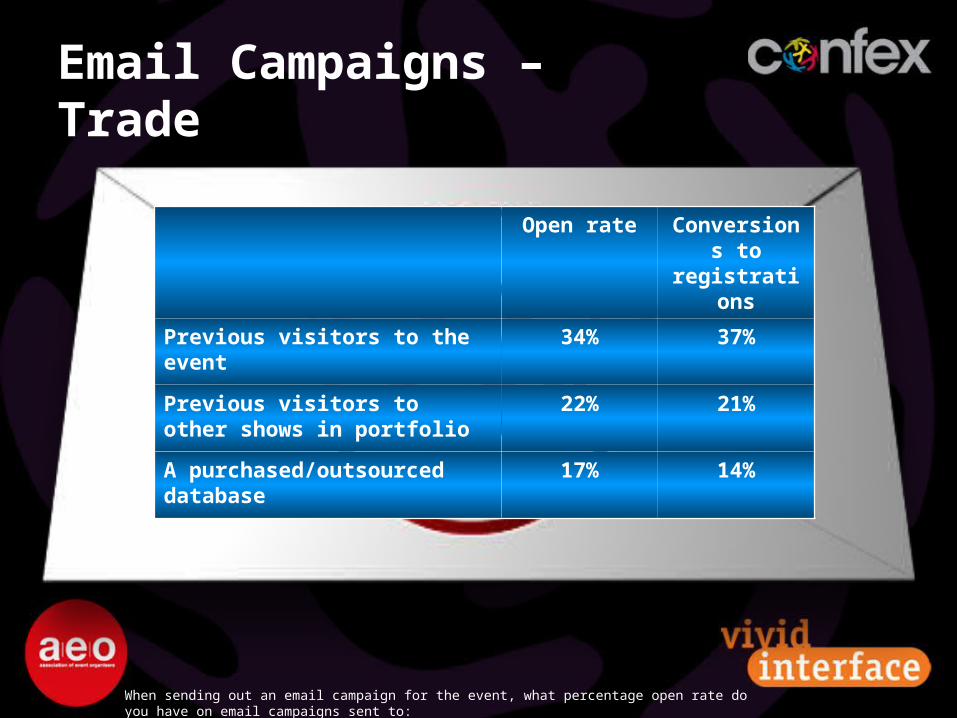
Email Campaigns – Trade
Open rate Conversions to
registrations
Previous visitors to the event
34% 37%
Previous visitors to other shows in portfolio
22% 21%
A purchased/outsourced database
17% 14%
When sending out an email campaign for the event, what percentage open rate do you have on email campaigns sent to:

Email Campaigns – Consumer
Open rate
Actual ticket sales
Total conversi
on
Previous visitors to the event
36% 28% 10%
Previous visitors to other shows in portfolio
18% 12% 2%
A purchased/outsourced database
10% 5% 0.5%
When sending out an email campaign for the event, what percentage open rate do you have on email campaigns sent to:

Taste of Christmas
VIL collected visitor dataat the Taste of LondonFestival
25% of advanced ticket sales were directly from this database

Percentage of visitors delivered - consumer
OFFLINE
67%
ONLINE
33%
Direct Marketing 28%
National newspapers 20%
Magazine advertising 18%
PR 16%
Radio advertising 14%
TV advertising 5%
Event website 48%
Email 23%
PR 10%
SEO 5%
Viral email campaigns 5%
Affiliate 2%
Online display on websites
2%
Podcasts 2%
Please provide an estimate of the percentage of visitors delivered by each marketing activity:

Percentage of visitors delivered overall - consumer
Direct marketing 18.5%
Event website 15.6%
National newspapers 13.5%
Magazine advertising 11.9%
Offline - PR 10.7%
Radio advertising 9.5%
Email 7.5%
Online - PR 3.4%
TV advertising 3.3%
SEO 1.5%
Viral email campaigns 1.5%
Podcasts 0.7%
Online display on websites 0.7%
Affiliate 0.7%
Please provide an estimate of the percentage of visitors delivered by each marketing activity:

Percentage of visitors delivered - trade
OFFLINE
41%
ONLINE
59%
Direct Marketing 62%
Magazine advertising 22%
PR 14%
National newspapers 1%
Radio advertising <1%
TV advertising 0%
Email 52%
Event website 30%
PR 5%
Online display on websites
4%
SEO 4%
Mobile marketing 1%
Please provide an estimate of the percentage of visitors delivered by each marketing activity:

Percentage of visitors delivered overall - trade
Email 30.9%
Direct marketing 25.5%
Event website 17.4%
Magazine advertising 9.1%
Offline - PR 5.7%
Online - PR 2.8%
Online display on websites 2.5%
SEO 2.4%
Podcasts 0.8%
Mobile marketing 0.8%
Affiliate 0.7%
National newspapers 0.5%
Viral email campaigns 0.4%
Radio advertising 0.2%
Please provide an estimate of the percentage of visitors delivered by each marketing activity:

Most successful marketing activities
TRADE CONSUMER
Direct marketing 43%
Email 34%
Event website 15%
Direct marketing 20%
TV advertising 15%
Radio advertising 15%
Event website 10%
Email 10%
Magazine advertising 10%
National newspapers 10%
We would like to understand if online/digital or offline media/marketing is most successful in getting visitors to the event. Which media is most successful:

Marketing spend increase / decrease - Trade Increase /
stay the same
Decrease
Last 12 months
Last 12 months
Next 12 months
Next 12 months
83%
17%
60%
40%
To what extent has your marketing spend increased/decreased over the last 12 months and to what extent do you expect it to change over the next 12 months:

Marketing spend increase / decrease - consumer Increase /
stay the same
Decrease
Last 12 months
Last 12 months
Next 12 months
Next 12 months
85%
15%
56%
44%
To what extent has your marketing spend increased/decreased over the last 12 months and to what extent do you expect it to change over the next 12 months:

Most cost-efficient marketing activities
TRADE
Online – 92%Offline – 3%
Don’t know – 5%
CONSUMER
Online – 74%Offline – 19%
Don’t know – 7%
Email 71%
Event website 16%
SEO 5%
Email 56%
Event website 16%
SEO 8%
Affiliate 8%
Which do you consider to be most cost-efficient:

Handle online/digital marketing
TRADE
In-house – 86%Specialist agency – 8%
Normal marketing agency – 8%
CONSUMER
In-house – 74%Specialist agency – 19%
Normal marketing agency – 15%
Do you handle online/digital marketing campaigns:

Event website
TRADE
Proportion of registrations – 65%
CONSUMER
Proportion of ticket sales – 44%
Average length of visit
8 mins
Average pages viewed 5
Average length of visit
8 mins
Average pages viewed 5
Advertising revenue 62%
Ticket sales 22%
Affiliate revenue 9%
No additional revenue 28%
Ticket sales 70%
Advertising revenue 41%
Affiliate revenue 22%
No additional revenue 19%
On average, how long do visitors to your event website spend on it:/ Does your event website provide any of the following types of revenue stream:

Website promotion
TRADE CONSUMER
Business networking sites
44%
Social networking sites
34%
Facebook 82%
LinkedIn 64%
You Tube 36%
Business networking sites
26%
Social networking sites
74%
You Tube 85%
Facebook 80%
MySpace 40%
Do you promote your event on any of the following websites:

Registrations - Trade
51% of those who pre-register actually attend the event21% of visitors register on-site42% actually charge on-site registered visitors
What percentage of your visitors who pre-register with you then actually attend the event:

Average distance travelled to an event
Consumer – 26% travel between 51 and 75 miles to the event.Trade – 26% travel over 75 miles to the event.
What is the average distance travelled by your visitors to your event:

Overall confidence for 2009
How would you rate your overall level of confidence in the current market place that your event serves in 2009:
Trade Consumer
Extremely confident 5% 11%
Very confident 15% 22%
Quite confident 57% 48%
Not very confident 23% 11%
Not at all confident 0% 7%

Vivid Interface
Research visitorsResearch exhibitorsResearch marketsEvent development strategiesExhibitor sales strategies with VISOR