Embed Size (px)
Citation preview

ANTIMICROBIAL PROPERTIES OF SELECTED ASIAN HERBS
By
THABILE PRECIOUS NKAMBULE
A THESIS PRESENTED TO THE GRADUATE SCHOOL OF THE UNIVERSITY OF FLORIDA IN PARTIAL FULFILLMENT
OF THE REQUIREMENTS FOR THE DEGREE OF MASTER OF SCIENCE
UNIVERSITY OF FLORIDA
2008
1

© 2008 Thabile Precious Nkambule
2

To my Family and Friends
3

ACKNOWLEDGMENTS
I would like to express my special appreciation to my advisor Dr. Amarat H. Simonne (my
supervisory committee chair) and Dr. Charles Sims, Dr. Samuel R. Farrah, and Dr. Maurice R.
Marshall, Jr., for serving on my committee. I would also like to thank Rob M. Pelick, Kimberly
Evans, and Wei-Yea Hsu for their assistance and support. I would also like to thank the faculty
and staff of Food Science and Human Nutrition department, University of Florida. I would like
the express much appreciation to my family for their love, encouragement, and support.
4

TABLE OF CONTENTS page
ACKNOWLEDGMENTS ...............................................................................................................4
LIST OF FIGURES .......................................................................................................................10
LIST OF ABBREVIATIONS........................................................................................................11
ABSTRACT...................................................................................................................................12
CHAPTER
1 INTRODUCTION ..................................................................................................................15
2 LITERATURE REVIEW .......................................................................................................19
Most Common Asian Herbs and Spices .................................................................................20 Lemongrass......................................................................................................................21 Turmeric ..........................................................................................................................22
Antimicrobial Activities of Lemongrass (Cymbopogon citratus)............................23 Antimicrobial Activities of Turmeric (Curcuma longa) ..........................................30
Drying Methods ......................................................................................................................33 Oven-Drying....................................................................................................................34 Freeze-Drying..................................................................................................................35
Extraction Solvents.................................................................................................................39 Dimethyl Sulfoxide (C2H6OS) ........................................................................................40 Water (H2O).....................................................................................................................40 Ethanol (C2H6O)..............................................................................................................41 Hexane (C6H14)................................................................................................................41 Acetone (C3H6O) .............................................................................................................41 Effect of Extraction Solvents on the Antimicrobial Properties of Herbs ........................41
Evaporation Techniques .........................................................................................................43 Rotary Rotavapor....................................................................................................................43
3 MATERIALS AND METHODS ...........................................................................................51
Bacterial Strains and Cultivation ............................................................................................51 Plant Materials ........................................................................................................................51 Preparation of Plant Material..................................................................................................52 Preparation of Plant Extracts ..................................................................................................52 Antimicrobial Assay ...............................................................................................................54 Minimum Inhibitory Concentration (MIC) Determination ....................................................55 Minimum Bactericidal Concentration (MBC) Determination................................................56 Experimental Design and Statistical Analysis........................................................................56
4 RESULTS AND DISCUSSION.............................................................................................60
5

Antimicrobial Activity of Lemongrass...................................................................................60 Inhibitory Zone of Lemongrass Extracts .........................................................................60 Minimum Inhibitory Concentration (MIC) and Minimum Bactericidal
Concentration (MBC) of Lemongrass Stem Extracts ..................................................64 Antimicrobial Activity of Turmeric Extracts .........................................................................66
Inhibitory Zone of Turmeric (Fresh Rhizomes and Dried Powder) Extracts ..................66 Minimum Inhibitory Concentration (MIC) and Minimum Bactericidal
Concentration (MBC) of Turmeric (Fresh Rhizomes and Dried Powder) Extracts ....68
5 SUMMARY AND CONCLUSSION.....................................................................................81
APPENDIX
A ANALYSIS OF VARIANCE (ANOVA) TABLES: ANTIMICROBIAL ACTIVITY OF LEMONGRASS STEMS .................................................................................................83
B ANALYSIS OF VARIANCE (ANOVA) TABLES: ANTIMICROBIAL ACTIVITY OF TURMERIC (FRESH RHIZOMES) ................................................................................91
C ANALYSIS OF VARIANCE (ANOVA) TABLES: ANTIMICROBIAL ACTIVITY OF TURMERIC (DRIED POWDER)....................................................................................96
LIST OF REFERENCES.............................................................................................................100
BIOGRAPHICAL SKETCH .......................................................................................................107
6

LIST OF TABLES
Table page 2-1 Reported and estimated cases, number of outbreaks and deaths caused by known
foodborne bacterial pathogens from 1983 to 1997. ...........................................................45
2-2 Most common pathogens associated with foodborne illness outbreaks ............................46
2-3 Common Asian herbs used for cooking.............................................................................48
2-4 Properties of different solvents ..........................................................................................49
4-1 Inhibitory zone (mm) of lemongrass stems extracts (solvent extracts) on bacterial pathogens ...........................................................................................................................71
4-2 Inhibitory zone (mm) of turmeric (fresh rhizome) extracts (solvent extracts) on bacterial pathogens.............................................................................................................72
4-3 Inhibitory zone (mm) of turmeric (dried powder) extracts (solvent extracts) on bacterial pathogens.............................................................................................................73
4-4 Overall comparison of solvents, drying methods, and harvest-time for lemongrass stem. ...................................................................................................................................74
4-5 Sensitivity of each Staphylococcus aureus strain to lemongrass stem ..............................75
4-6 Antimicrobial activities of fresh rhizome turmeric extracts ..............................................76
4-7 Sensitivity of each Staphylococcus aureus strain to fresh rhizome turmeric extracts.......77
4-8 Antimicrobial activities of dried powder turmeric extracts ...............................................78
4-9 Sensitivity of each Staphylococcus aureus strain to dried powder turmeric extracts........79
4-10 Comparison of lemongrass stem and turmeric (fresh rhizomes) extracts..........................80
4-11 Comparison of fresh rhizomes and dried powder turmeric extracts. .................................80
A-1 Inhibitory zone of lemongrass stems .................................................................................83
A-2 Minimum Inhibitory Concentration (MIC) of lemongrass stem........................................83
A-3 Minimum Bactericidal Concentration (MBC) of lemongrass stem...................................84
A-4 Inhibitory zone of lemongrass stems against Staphylococcus aureus ATCC 12600-U ....85
A-5 Minimum Inhibitory Concentration (MIC) of lemongrass stem against Staphylococcus aureus ATCC 12600-U............................................................................86
7

A-6 Minimum Bactericidal Concentration (MBC) of lemongrass stem against Staphylococcus aureus ATCC 12600-U............................................................................86
A-7 Inhibitory zone of lemongrass stems against Staphylococcus aureus ATCC 29247.........87
A-8 Minimum Inhibitory Concentration (MIC) of lemongrass stem against Staphylococcus aureus ATCC 29247 ................................................................................87
A-9 Minimum Bactericidal Concentration (MBC) of lemongrass stem against Staphylococcus aureus ATCC 29247 ................................................................................88
A-10 Inhibitory zone of lemongrass stems against Staphylococcus aureus ATCC A35548......89
A-11 Minimum Inhibitory Concentration (MIC) of lemongrass stem against Staphylococcus aureus ATCC A35548 .............................................................................89
A-12 Minimum Bactericidal Concentration (MBC) of lemongrass stem against Staphylococcus aureus ATCC A35548 .............................................................................90
B-1 Inhibitory zone of turmeric (fresh rhizomes).....................................................................91
B-2 Minimum Inhibitory Concentration (MIC) of turmeric (fresh rhizomes) .........................91
B-3 Minimum Bactericidal Concentration (MBC) of turmeric (fresh rhizomes).....................91
B-4 Inhibitory zone of turmeric (fresh rhizomes) against Staphylococcus aureus ATCC SA12600-U ........................................................................................................................92
B-5 Minimum Inhibitory Concentration (MIC) of turmeric (fresh rhizomes) against Staphylococcus aureus ATCC SA12600-U.......................................................................92
B-6 Minimum Bactericidal Concentration (MBC) of turmeric (fresh rhizomes) against Staphylococcus aureus ATCC SA12600-U.......................................................................92
B-7 Inhibitory zone of turmeric (fresh rhizomes) against Staphylococcus aureus ATCC SA29247 ............................................................................................................................93
B-8 Minimum Inhibitory Concentration (MIC) of turmeric (fresh rhizomes) Staphylococcus aureus ATCC SA29247 ...........................................................................93
B-9 Minimum Bactericidal Concentration (MBC) of turmeric (fresh rhizomes) Staphylococcus aureus ATCC SA29247 ...........................................................................94
B-10 Inhibitory zone of turmeric (fresh rhizomes) against Staphylococcus aureus ATCC 35548..................................................................................................................................95
B-11 Minimum Inhibitory Concentration (MIC) of turmeric (fresh rhizomes) against Staphylococcus aureus ATCC 35548 ................................................................................95
8
B-12 Minimum Bactericidal Concentration (MBC) of turmeric (fresh rhizomes) against Staphylococcus aureus ATCC 35548 ................................................................................95
C-1 Inhibitory zone of turmeric (dried powder) .......................................................................96
C-2 Minimum Inhibitory Concentration (MIC) of turmeric (dried powder)............................96
C-3 Minimum Bactericidal Concentration (MBC) of turmeric (dried powder) .......................96
C-4 Inhibitory zone of turmeric (dried powder) against Staphylococcus aureus ATCC 12600-U .............................................................................................................................97
C-5 Minimum Inhibitory Concentration (MIC) of turmeric (dried powder) against Staphylococcus aureus ATCC 12600-U............................................................................97
C-6 Minimum Bactericidal Concentration (MBC) of turmeric (dried powder) against Staphylococcus aureus ATCC 12600-U............................................................................97
C-7 Inhibitory zone of turmeric (dried powder) against Staphylococcus aureus ATCC 29247..................................................................................................................................98
C-8 Minimum Inhibitory Concentration (MIC) of turmeric (dried powder) Staphylococcus aureus ATCC 29247 ................................................................................98
C-9 Minimum Bactericidal Concentration (MBC) of turmeric (dried powder) Staphylococcus aureus ATCC 29247 ................................................................................98
C-10 Inhibitory zone of turmeric (dried powder) against Staphylococcus aureus ATCC 35548..................................................................................................................................99
C-11 Minimum Inhibitory Concentration (MIC) of turmeric (dried powder) against Staphylococcus aureus ATCC 35548 ................................................................................99
C-12 Minimum Bactericidal Concentration (MBC) of turmeric (dried powder) against Staphylococcus aureus ATCC 35548 ................................................................................99
9

LIST OF FIGURES
Figure page 2-1 Chemical structure of Citral (C10H16O) (3, 7-dimethyl-2, 6-octadienal) ...........................50
2-2 Chemical structure of Curcumin (C21H20O6 ) ....................................................................50
3-1 Lemongrass (Cymbopogon citratus) plants. ......................................................................57
3-2 Turmeric (Curcuma longa) rhizomes ................................................................................57
3-3 Lemongrass leaves .............................................................................................................58
3-4 Lemongrass stem ...............................................................................................................58
3-5 Inhibitory zone of lemongrass stem oven dried, hexane extracts on Staphylococcus aureus ATCC 29247. .........................................................................................................59
10

LIST OF ABBREVIATIONS
Antimicrobials A large variety of chemical compounds or substances that are used to destroy (kill) microorganisms or to prevent (or slow) their growth
MBC Minimum bactericidal concentration is the lowest concentration of an antimicrobial agent needed to kill 99.9% of the initial organism inoculums
MIC The minimum inhibitory concentration is as the lowest concentration of an antimicrobial that prevents the growth of microorganism after a specific incubation time
11

Abstract of Thesis Presented to the Graduate School of the University of Florida in Partial Fulfillment of the
Requirements for the Degree of Master of Science
ANTIMICROBIAL PROPERTIES OF SELECTED ASIAN HERBS
By
Thabile Precious Nkambule
May 2008 Chair: Amarat H. Simonne Major: Food Science and Human Nutrition
Many pathogens including Salmonella spp, Listeria monocytogenes, Staphylococcus
aureus and Escherichia coli O157:H7 are commonly implicated in foodborne illness outbreaks in
the United States. Increasing antibiotic resistance of bacterial foodborne pathogens has raised
concerns in the scientific community. Many herbs such as lemongrass and turmeric have been
considered medicinal plants that can be potentially used for controlling foodborne pathogens in
place of chemicals or antibiotics. Objective of this study was to systematically evaluate the
antimicrobial properties of lemongrass [Cymbopogon citratus (C. Nees) Stapf (Poaceae)] and
turmeric [Curcuma longa (Zingiberaceae)] as affected by drying methods (oven and freeze
drying) and different extraction solvents (water, acetone, hexane and ethanol). Antimicrobial
assay was done using an agar disc diffusion method against Staphylococcus aureus (ATCC
29247, 12600U, and 35548), Escherichia coli O157:H7 (204P, 301C and 505B) and Salmonella
serotypes Enteritidis, Typhimurium and Thompson (ATCC 8391) strains. Minimum inhibitory
concentration (MIC) was measured using the multiple tube dilution method. Minimum
bactericidal concentration (MBC) was measured using the colony-forming assay. Results showed
that among bacterial strains tested, Staphylococcus aureus strains were sensitive to the hexane
and acetone extracts from lemongrass stems; and to hexane, acetone and ethanol extracts from
12

turmeric. No antimicrobial activity was observed in any lemongrass leaf samples regardless of
solvents used in the extraction or drying methods. Water and ethanol extracts of lemongrass stem
did not show any antimicrobial activity against any of the test bacteria. Inhibitory zone from
lemongrass stem extracts ranged from 6.5 to 21 mm. For lemongrass stem, oven dried methods
yielded significantly higher (P < 0.0001) antimicrobial activity than that of stems prepared from
the freeze dried method. Hexane extract yielded significantly higher (P < 0.0001) antimicrobial
activity (MIC) than that of the acetone extracts. Seasonal variation was observed with respect to
antimicrobial activity for lemongrass stem; plants harvested in November showed a higher
activity (P < 0.0001) than plants which were harvested in October. Minimum inhibitory
concentration (MIC) and Minimum bactericidal concentration (MBC) range for lemongrass stem
was 0.8 – 17.4 mg/mL.
Water extracts of turmeric did not show any antimicrobial activity against any test bacterial
strains. Turmeric had a significantly lower (P < 0.0001) antimicrobial activity against
Staphylococcus aureus strains tested than that of lemongrass stem. However the antimicrobial
activity of turmeric was observed in extracts of the other solvents (acetone, hexane and ethanol)
than that of lemongrass (acetone and hexane). Inhibitory zone of turmeric extracts ranged from
6.5-11 mm.
Minimum inhibitory concentration (MIC) and Minimum bactericidal concentration (MBC)
range for dried and fresh turmeric were 12.5 – 40.0 mg/mL. Little variation in antimicrobial
activity was observed for dried and fresh turmeric extracts.
Results of the study demonstrated that hexane and acetone extracts from lemongrass stem
exhibit antimicrobial activity against Staphylococcus aureus, and hexane, acetone, and ethanol
extracts of dried powder and fresh turmeric rhizomes, exhibited antimicrobial activity against
13

14
Staphylococcus aureus. Both lemongrass stem and turmeric extracts could be potentially used for
controlling Staphylococcus aureus.

CHAPTER 1 INTRODUCTION
Foodborne diseases are still a major problem in the United States. Many microorganisms
such as Salmonella spp, Listeria monocytogenes, Escherichia coli O157:H7 and Staphylococcus
aureus are often reported as causative agents of foodborne diseases. Many of the pathogens of
greatest concern today (e.g., Campylobacter jejuni, Escherichia coli O157:H7, Listeria
monocytogenes, Cyclospora cayetanensis) were not recognized as causes of foodborne illness 20
years ago (Mead and others 1999). Thus, at present, many interventions including chemical
preservatives must be used to kill or prevent the growth of foodborne pathogens as well as
spoilage microorganisms in the food industry (Sagdic and Ozcan 2003). Due to consumer
concerns about the safety of food containing synthetic chemicals as preservatives and the
increasing antibiotic resistance of bacterial foodborne pathogens, there is a growing interest in
the use of natural antibacterial compounds such as herb and spice extracts because they have
both characteristic flavor as well as a potential antimicrobial activity (Smid and Gorris 1999).
Many herbs, such as lemongrass and turmeric, have been considered medicinal plants which can
be potentially used for controlling foodborne pathogens in place of chemicals or antibiotics.
The word herb is derived from the Latin ‘herba,’ meaning grass or, by extension, green
crop (Gerald 1975). Herb was originally applied to a wide range of leafy vegetables. Herbs are
seed plants that do not produce woody stems like a tree and will live long enough to develop and
produce flowers and seeds (Gerald 1975). For thousands of years herbs have been used for their
flavor, medicinal, antimicrobial, and antioxidative properties. Use of spices and herbs in cooking
is the oldest form of aromatherapy. Active components of spices and herbs are considered as
powerful tools to create a state of wellness such as stimulate production of enzymes that detoxify
carcinogens, inhibit cholesterol synthesis, block estrogen, lower blood pressure, and prevent
15

blood clotting (Uhl 2000). Early cultures recognized that certain herbs had healing powers;
therefore, some herbs were thought to have magical properties. In the ancient civilizations,
people began to associate less magic with the treatment of diseases. They understood that illness
was natural and not supernatural, and medicine should be given without magic. Chinese
herbalism is widely regarded as the oldest because it has the longest unbroken recorded history.
Chinese have practiced herbal use for 5000 years.
Early use of antimicrobial plant extracts (i.e. herbs and oils) was well documented in
ancient Egypt. Ancient Egyptians used plant extracts for food preservation as well as for
embalming the dead. Pliny, Virgil, and Hippocrates mentioned garlic as a treatment for a variety
of ailments, including indigestion, pneumonia, wounds, and infections (Conner 1993). Although
ancient civilizations recognized the antiseptic or antimicrobial potential of many plant extracts, it
was only in the eighteenth century that the scientific documentation of the preservative effects of
spices and spice-type extracts were developed or recorded (Conner 1993).
Many plant tissues contain a variety of compounds called “secondary” plant compounds
(metabolites) grouped as glucosides, saponins, tannins, alkaloids, essential oils, organic acids and
others (Fraenkel 1959). Phytoalexins another group of compounds of low molecular weight are
typically synthesized in response to environmental stress. Many of these phytoalexins have both
antimicrobial and antifungal properties. They are produced after infection as a defense
mechanism against microbial infection. These compounds interfere with the cell membrane
associated functions (Beuchat and Golden 1989). Major antimicrobial components of spices are
in their essential oils (Shibasaki 1982). Each compound in spices and herbs exhibits different
biological activity (Duke 1994; Webb 1997).
16

Amount of spices and herbs extracts used in food systems range from 0.05 to 0.1% (500 to
1000 ppm) (Salzer 1982). Billing and Sherman (1998) calculated that meat recipes contained
roughly 0.25-3.0 g/kg of spices (250-3000 ppm). Although many essential oils from spices and
herbs have antimicrobial activity against bacteria at less than 1000 ppm, some spices require
higher concentrations to exhibit antimicrobial activity (Zaika 1988). Antimicrobial activity of
herbs and spices varies widely, depending on the type of spice or herb, test medium, and
microorganism. Zaika (1988) summarized the factors that could affect the antimicrobial activity
of herbs and spices. Microorganisms differ in their resistance to a given spice or herb, and a
given microorganism differs in its resistance to many types of spices and herbs. In general,
bacteria are more resistant to antimicrobials than fungi. Furthermore, antimicrobial action on
spores may be different from that of vegetative cells. Gram-negative bacteria are more resistant
than Gram-positive bacteria. Effect of a spice or herb may either be inhibitory or germicidal.
Spices and herbs harbor microbial contaminants, and may serve as substrates for microbial
growth and toxin production. Generally, the amounts of spices and herbs added to foods are
generally too low to prevent spoilage by microorganisms. Active components of spices/herbs at
low concentrations may interact synergistically with other factors (NaCl, acids, and
preservatives) to increase preservation. Nutrients present in spices/herbs may stimulate growth
and/or biochemical activities of microorganisms. Lastly, the extent to which spices and herbs
inhibit microbial growth depends on their source and processing.
For these reasons, effectiveness of the antimicrobial properties of herbs and spice might be
questionable considering the concentration at which they are used in the food systems.
Therefore, the objective of this study was to systematically evaluate the antimicrobial activity of
Asian herbs (lemongrass [Cymbopogon citratus (C. Nees) Stapf (Poaceae)] and turmeric
17

[Cucuma longa (Zingiberaceae)]) using different extraction solvents (water, ethanol, hexane and
acetone) and drying methods (oven and freeze drying). Lemongrass extracts, from different
sources, were evaluated to compare results. Antimicrobial activity of commercial (dried powder)
turmeric was also evaluated. Hypothesis was that Asian herbs may have some antimicrobial
properties that may impact growth and survival of microbial pathogens in Asian foods. In order
to validate this hypothesis, Asian herbs were systematically evaluated for antimicrobial
properties using a non-polar solvent, slightly polar and highly polar solvents. Results of the study
could potentially be used in controlling some pathogens by using some Asian herbs.
18

CHAPTER 2 LITERATURE REVIEW
More than 200 known diseases are transmitted through food (Bryan 1982). In the United
States, foodborne diseases have been estimated to cause 6 million to 81 million illnesses and up
to 9,000 deaths each year (Archer and Kvenberg 1985; Todd 1989). Mead and others (1999)
estimated food-related illnesses, hospitalizations, and deaths from known pathogens to be
13,814, 924; 60, 854; and 1,809, respectively. Bacteria, parasites, and viruses accounted for 72%,
21%, and 7%, respectively including Salmonella (31%), Listeria (28%), Toxoplasma (21%),
Norwalk-like viruses (7%), Campylobacter (5%), and Escherichia coli O157:H7 (3%). Bennet
and others (1987) estimated that there are 2,100; 1,200; and 1,000 deaths each year due to
campylobacteriosis, staphylococcal food poisoning, and trichinosis, respectively; however, Mead
and others (1999) had a total estimate for all three diseases as 101 deaths. Severe illnesses caused
by Salmonella and Campylobacter accounted for 26% and 17% hospitalizations, respectively.
Bacteria causing the most reported foodborne outbreaks from 1983 to 1997 include Salmonella
(3,640), Shigella spp (1,476), Clostridium perfringens (654), Escherichia coli O157:H7 (500),
Staphylococcus aureus (487), Escherichia coli, enterotoxigenic (209), and Campylobacter spp
(146) (Mead and others 1999). Table 2-1 gives reported and estimated cases, number of
outbreaks, and deaths caused by known foodborne bacterial pathogens (Mead and others 1999).
Table 2-2 summarizes the pathogens most commonly implicated in foodborne illnesses in the
United States. It is important to note that these numbers tend to under estimate the actual
numbers because foodborne illnesses are often, not reported.
Even though the United States has one of the safest food supplies in the world, there are
still millions of cases of foodborne illnesses each year, and this may relate to the diversity of
ethnic foods (Beattie 2006). Simonne and Others (2004) examined the CDC foodborne illness
19

data (1990-2000) and they revealed that Asian foods had few numbers of foodborne illness
outbreaks compared to other ethnic foods. In all, only 79 total outbreaks were reported in Asian
foods compared to Italian and Mexican foods, which accounted for 152 and 147 outbreaks,
respectively. Asian foods had a different profile of microorganisms, which included Vibrio
parahaelymoticus, associated with Asian seafood dish. Major microorganism involved in the
outbreaks in Asian foods between 1990-2000 was Bacillus cereus (50%). Difference in the
profile of microorganisms may be attributed to the ingredients, cooking, and preparation
methods, and how food is served (Simonne and others 2004). Asian food usually contains many
herb ingredients. Among other factors, the lower foodborne outbreak incident in Asian foods
could be due to the spices and herbs that are used in this cuisine. Most distinctive feature of
Asian cuisines is the blending of seasonings - either fresh herbs, spices or a host of unusual
aromatics – to produce some of the world’s most flavorful food (Hutton 2003). For centuries,
people from different cultures around the world have embraced herbs, not only for their flavors
and aromas in their cuisines but also for the medicinal qualities of those herbs. In Thailand,
cooks love to throw cupfuls of basil (Ocimum basilicum) into their stir-fry and soups, treating
them no differently than vegetables. In Laos and Cambodia, herbs are used to garnish and flavor
noodle soups, broth soups, and salads (Pham 2001).
Most Common Asian Herbs and Spices
Most common herbs used in Asian dishes include but are not limited to lemongrass
(Cymbopogon citratus), turmeric (Curcuma longa), coriander (Coriandrum sativum), Chinese
chives (Allium ramosum-L), Thai basil (Ocimum basilicum), cress (Lepidium sativum L), chili
pepper (Capsicum frutescens), piper Chaba (Piper sarmentosum), and finger root (Boesenbergia
pandurata) (Table 2-3). These herbs add a unique flavor to many Asian dishes (Dudman 2005).
For this study, lemongrass (Cymbopogon citratus) and turmeric (Curcuma longa) were used for
20
the evaluation of their antimicrobial properties. They are also used in main Asian dishes to create
different flavors and color in these cuisines.
Lemongrass
Lemongrass (also known as citronella, fever grass, serai, sereh, takrai) is a perennial herb
widely cultivated in the tropics and subtropics with two different designated species, East Indian,
Cymbopogon flexuosus and West Indian, Cymbopogon citratus (Simon and others 1984). West
Indian lemongrass (Cymbopogon citratus) consists of many organic compounds such as
terpenoids, but the major component is citral. Other terpenoids in this species include nerol,
limonene, linaloale, β-caryophyllene, and a very low content of myrcene (Kasumov and Babaev,
1983). East Indian lemongrass (Cymbopogon flexuosus) consists of alcohols (20 to 30%
citronellol, geraniol) and aldehydes (15% geranial, 10% neral, 5% citronellal). This species of
lemongrass is dominantly used in the perfume industry and has a longer shelf life (Kasumov
and Babaev 1983).
Lemongrass, in general, grows in dense clumps up to 2 meters in diameter and has leaves
up to one meter long. Lemongrass is a very pungent herb and is normally used in small amounts.
Entire stalk of the grass can be used. Lemongrass is widely used in herbal teas, non-alcoholic
beverages, baked goods, and confectionary products. Oil from lemongrass is widely used as a
fragrance in perfumes and cosmetics products such as soaps and creams. Citral, (Figure 2-1),
extracted from lemongrass, is used in flavoring soft drinks, in scenting soaps and detergents, as a
fragrance in perfumes and cosmetics, and as a mask for disagreeable odors in several industrial
products (Simon and others 1984). Citral is a mixture of two geometric isomers of compounds in
lemongrass oil. Geranial is the trans isomer of citral in lemongrass, which accounts for 40-62%,
and neral is the cis isomer of citral in lemongrass, which accounts for 25-38% (Simon and others
1984).
21

Use of fresh lemongrass is typical for Southeast Asia and Sri Lanka. Lemongrass is most
popular in Thailand, Vietnam, Cambodia and Indonesia. In Thailand, finely ground fresh
lemongrass is added to curry pastes. Its fine fragrance goes well with poultry, fish and sea food.
In Vietnamese cooking, being much less spicy, makes use of lemongrass in several ways
including Vietnamese curries. Lemongrass is added to a popular Vietnamese meal bo nhung dam
[bò nhúng dấm], often translated “vinegar beef” or “Vietnamese fondue”. Lemongrass plant is
generally recognized as safe (GRAS) for human consumption and as a plant extract/essential oil
(21 CFR section 182.20) (Simon and others 1984).
Turmeric
Curcuma longa (Zingiberaceae) is a native plant of southern Asia and is cultivated
extensively throughout the warmer parts of the world. It is a member of the ginger family,
derived from an old Arabic name for the kurkum plant known as saffron (Crocus sativus L.).
It is the rhizome of turmeric plant that is used as a spice, usually in the dried form.
However, in some areas of the Far East, fresh turmeric is used and stored much like ginger
(Pulford 2003). Turmeric is used as an herb in Asian cooking such as curry dishes. It can also be
added to chutneys, pickles and mustards for its color. Rhizomes contain 3-4% volatile oil with
unique aromatic characteristics. Curcumin is the main biologically active phytochemical
compound of turmeric (Figure 2-2). Curcumin is the principal curcuminoid of turmeric.
Chemical formula of curcumin is C12H20O6. It has a molecular weight of 368.38 g/mol. These
curcuminoids are responsible for the yellow color of the root. In fact, it is the curcuminoids that
posses all the bio-protective properties in turmeric (Badmaev and others 2004). Turmeric has
long been used as a powerful anti-inflammatory in both the Chinese and Indian systems of
medicine (Gescher and others 2005). Turmeric is also documented to have wound healing
22

capacity (Biswas and Mukherjee 2003). Turmeric is taken in some Asian countries as a dietary
supplement, which allegedly helps with stomach problems and other ailments (Pulford 2003).
Due to negative consumer perceptions of artificial preservatives in foods, attention of the
scientific community worldwide is shifting towards spices and herbs to harness their
antimicrobial properties for use as natural food preservatives (Sagdic and Ozcan 2003). Large
variety of these including lemongrass and turmeric, have been examined for their inhibitory
action (antimicrobial activity) against the microorganisms responsible for food spoilage and
foodborne illnesses (Grag and Menon 2003). However, gaps of knowledge still exist. In this
study, lemongrass stem and leaves were evaluated separately; furthermore, dried and fresh
turmeric was also evaluated. In this study, several factors were considered when doing the
research; different sources (two local growers, for comparison purposes), different solvents
(hexane, acetone, ethanol and water), drying methods (oven drying and freeze drying) and
different bacterial pathogens (Gram positive and Gram negative). This was done to evaluate the
results obtained from all these different treatments and come up with the best combination that
could enhance the antimicrobial activity of lemongrass and turmeric extracts.
Antimicrobial Activities of Lemongrass (Cymbopogon citratus)
Kim and others (1995) evaluated the antimicrobial activity of citral (lemongrass oil),
carvacrol (thyme oil), geraniol (rose oil), and other oils against five foodborne pathogens; E. coli,
E. coli O157:H7, Salmonella Typhimurium, Listeria monocytogenes, and Vibrio vulnificus.
Carvacrol was to found to have the most inhibitory action on the bacteria tested, while citral and
geranial had potent antibacterial action against the five test bacteria. Antimicrobial activity of the
components was different for each bacterial culture and the response of these cultures varied
toward each component. Carvacrol (at 250 µL/mL), and citral and geraniol (at 500 µL/mL)
completely inhibited the growth of Salmonella Typhimurium. Lis-Balchin and Deans (1997)
23

studied 93 commercial essential oils against 20 Listeria monocytogenes strains. Lemongrass was
among the oils that exhibited antibacterial activity against all the Listeria strains tested. Same
essential oil had variable antibacterial activity against different strains of Listeria. Williams and
others (1998) evaluated essential oils with high antimicrobial properties for therapeutic use by
comparing the antimicrobial activity of the essential oils of Australian tea tree oil (Melaleuca
alternifolia), Australian lavender (Lavandula angustifolia), New Zealand manuka
(Leptospermum scoparium), lemongrass oil (Cymbopogon citratus), and eucalyptus oil
(Eucalyptus cinerea). Lemongrass oil had the highest antimicrobial activity (inhibition zones)
against Candida albicans (30 mm) and Stapyhlococcus aureus (38 mm). Baratta and others
(1998) evaluated antimicrobial and antioxidant properties of some commercial essential oils;
ylang-ylang (Cananga odorata), frankincense (Boswellia thurifera), lemongrass (Cymbopogon
citratus), marjoram (Marjorana hortensis), basil (Ocimum basilicum), rosemary (Rosmarinus
officinalis), cinnamon (Cinnamomum zeylanicum), and lemon (Citrus limon). Twenty-five
different genera of bacteria (spoilage and foodborne pathogens) and one fungal species
(Aspergillus niger) were tested in this study. These microorganisms included animal and plant
pathogens, food poisoning and spoilage bacteria and the spoilage fungus Aspergillus niger.
Volatile oils exhibited considerable inhibitory action against all the tested organisms. Oils also
demonstrated antioxidant capacities.
Hammer and others (1999) investigated 52 plant oils and extracts for activity against
Acinetobacter baumanii, Aeromonas veronii biogroup sobria, Candida albicans, Enterococcus
faecalis, Escherichia coli, Klebsiella pneumoniae, Pseudomonas aeruginosa, Salmonella
enterica subsp. enterica serotype Typhimurium, Serratia marcescens and Staphylococcus
aureus, using an agar dilution method. Lemongrass, oregano and bay inhibited all organisms at
24

concentrations of 2.0% (v/v). Twenty of the plant oils and extracts were investigated, using a
broth microdilution method, for activity against C. albicans, S. aureus and E. coli. Lowest
minimum inhibitory concentrations were 0.03% (v/v) for thyme oil against C. albicans and E.
coli and 0.008% (v/v) for vetiver oil against S. aureus. These results supported the notion that
plant essential oils and extracts may have a role as pharmaceuticals and preservatives.
Chao and others (2000) evaluated the inhibitory action of essential oils against a broad
spectrum of microorganisms including bacteria, yeast, molds, and two bacteriophages. Inhibitory
action of 45 essential oils on eight bacteria (four Gram positive and four Gram negative), two
fungi, and one yeast were examined using the disc assay method. All the oils that were tested
exhibited antimicrobial activity. However, several of the plant essential oils exhibited only weak
inhibition against several Gram positive bacteria. Gram negative bacteria were generally more
resistant than Gram positive bacteria to essential oil treatment with Pseudomonas aeruginosa
being the most resistant bacteria. Only cinnamon bark (Cinnamomum zeylanicum) and tea tree
(Melaleuca alternifolia) oils showed inhibitory action against all the test organisms and
bacteriophages. Coriander oil (Coriandrum sativum) highly inhibited Gram positive bacteria and
fungi. Lemongrass (Cymbopogon flexuosus) and Roman chamomile (Chamaemelum nobile) oils
showed a high degree of inhibition against both phage types, while some oils showed no
inhibition against either phage. Angelica (Angelica archangelica) and pine (Pinus sylvestris) oils
inhibited the bacteria, but had no effect on any fungi. Oils that exhibited high antimicrobial
properties and the broadest range of inhibition included cinnamon bark (Cinnamomum
zeylanicum), lemongrass (Cymbopogon flexuosus), savory (Satureja montana), Roman
chamomile (Chamaemelum nobile), rosewood (Aniba rosaeodora), spearmint (Mentha spicata)
25

and tea tree (Melaleuca alternifolia). Results of the study showed that lemongrass had a high
antimicrobial activity.
Mejlholm and Dalgaard (2002) evaluated the antimicrobial action of nine essential oils
(EO) on P. phosphoreum and also determined the action of oregano oil on the shelf-life of
modified atmosphere-packed (MAP) cod fillets. Oils of oregano and cinnamon had strongest
antimicrobial activity, followed by lemongrass, thyme, clove, bay, marjoram, sage, and basil oils.
Results of the study suggested that herbs essential oils, such as lemongrass, may be used in
modified atmosphere-packaged foods to reduce P. phosphoreum.
Siripongvutikorn and others (2005) evaluated the antimicrobial and antioxidant action of
Thai seasoning, Tom-Yum. Garlic, shallot, kaffir lime leaves, chili, galangal, and lemongrass are
the spices used in Tom-Yum. These spices were extracted using water. Fresh garlic had the
highest antimicrobial properties of the spices examined in this study. Shallot, lemongrass,
galangal, and chili had no antimicrobial action. This could be because only water was used for
extracting the herbs. Water only extracts the water soluble component and leaves other important
substances, which could be responsible for the antimicrobial activity of the plants.
Sacchetti and others (2005) did a comparative evaluation of 11 selected essential oils,
namely, ylang-ylang (Cananga odorata), Italian Cypress (Cupressus sempervirens), turmeric
(Curcuma longa), lemongrass (Cymbopogon citratus), Tasmanian blue gum (Eucalyptus
globules), Monterey pine (Pinus radiata), Piper crassinervium (no common name), guava
(Psidium guayava), rosemary (Rosmarinus officinalis), lemon thyme (Thymus x citriodorus), and
ginger (Zingiber officinale). Among the essential oils tested, lemongrass oil was the most
effective against five food-spoilage yeasts: Candida albicans ATCC 48274, Rhodotorula glutinis
ATCC 16740, Schizosaccharomyces pombe ATCC 60232, Saccharomyces cerevisiae ATCC
26
2365, and Yarrowia lypolitica ATCC 16617. This study demonstrated that not only lemongrass
has antimicrobial properties but also antifungal properties.
Raybaudi-Massilia and others (2006) evaluated the antimicrobial activity of essential oils
(lemongrass, girasol, and cinnamon) on Salmonella Enteritidis, Escherichia coli, and Listeria
innocula in fruit juices. Lemongrass, cinnamon, and girasol at concentration of 2 µL/mL
inactivated the pathogens in apple and pear juice. However in melon juice and tryptone soy broth
medium, concentrations of 8, and 10 µL/mL for cinnamon, were needed respectively. For
girasol, 6 µL/mL was necessary to eliminate the three microorganisms; whereas lemongrass
required only 5 µL/mL to inactivate them. Results of the study showed that lemongrass essential
oil had strong antimicrobial activity than cinnamon and girasol essential oils.
Kakuta and others (2006) tested the antimicrobial action of essential oils on four oral
pathogenic microorganisms. Pure essential oils; tea tree (Camellia sinensis), lemon
(Citrus limonium), peppermint (Mentha X piperita), sonnerat (Ravensara aromatic), lemongrass
(Cymbopogon citratus), lemon eucalyptus (Eucalyptus citriodora) and geranium bourbon
(Pelargonium graveolens), and one blended oil (consisted of tea tree, lemon and peppermint oils)
were tested against Porphyromonas gingivalis, Fusobacterium nuclatum, Streptococcus mutans
and Candida albicans. Minimum inhibitory concentration (MIC) of essential oils was measured
by liquid dilution assay, and the minimum bactericidal concentration (MBC) of essential oils was
measured by colony forming assay. Results indicated that MIC of lemongrass oil was the lowest
among the eight essential oils, concentration ranging from 0.26 to 0.84% (v/v). Minimum
bactericidal concentration of lemongrass oil was also the lowest with concentrations ranging
from 0.31 to 1.25% (v/v). On the other hand, Ravensara aromatica oil showed the highest MIC
27

(more than 5%) among the eight essential oils. Blended essential oil showed a lower MBC than
any of the pure essential oils, against all test microorganisms except F. nuclatum.
Schwiertz and others (2006) evaluated antibacterial and antifungal activity of ten essential
oils against a range of vaginal bacterial and fungal strains isolated from existing vaginal
infections including Atopobium vaginae, Gardnerella vaginalis, Bacteroides vulgatus,
Streptococcus agalactiae, H2O2-producing lactobacilli and non H2O2-producing lactobacilli,
Candida albicans, Candida glabrata, Candida parapsilosis, and Candida tropicalis. Results
revealed that lemongrass, tea tree, and lavender exhibited the lowest minimum inhibitory
concentration (MIC) and minimum bactericidal concentration (MBC) at 1–2.5 μL/mL, thus being
the most potent essential oils against the tested bacteria. Interestingly, the MIC and MBC values
of palmarosa, neroli, manuka, rose-scented geranium, rosemary, common thyme and clary sage
were at 7.5 μL/mL for protective H2O2-lactobacilli but lower for pathogenic bacteria. Overall,
lemongrass, palmarosa, lavender, and rose scented geranium were the most potent oils in the
inhibition of pathogenic bacteria and fungi.
Oussalah and others (2006) evaluated the antimicrobial action of selected plant essential
oils on the growth of Pseudomonas putida strain isolated from meat. Inhibitory action on 60
plants was examined. Results of the study showed that some plants have strong antimicrobial
activity while others had less antimicrobial activity. Lemongrass [stem (bulb) and leaf used
together] presented an MIC (0.8%) against Pseudomonas. Rojas-Grau and others (2006)
evaluated the mechanical barrier and antimicrobial properties of apple puree edible films
containing plant essential oils against Escherichia coli O157:H7. Effect of oregano, cinnamon,
and lemongrass in apple puree containing film was investigated along with mechanical and
physical properties of the film. Results indicated that the order of antimicrobial activities was:
28
oregano oil > lemongrass oil > cinnamon oil. Rojas-Grau and others (2007) evaluated the action
of plant essential oil compounds on mechanical, barrier and antimicrobial properties of alginate-
apple puree edible films against the foodborne pathogen Escherichia coli O157:H7. Results
indicated that the antimicrobial activities were in the following order: carvacrol > oregano oil >
citral > lemongrass oil > cinnamaldehyde > cinnamon oil. Results of the two studies above
indicated that lemongrass essential oil had considerable amount of antimicrobial activity. Results
also showed that citral, a main component of lemongrass, had stronger antimicrobial activity
than the lemongrass essential oil.
Akin-Osanaiye and others (2007) studied the antimicrobial activity of essential oil and
extracts of lemongrass and two other herbs. Freeze dried water extracts were used. Results of the
study showed that lemongrass oil had high antimicrobial activity against all microorganisms
tested (Salmonella typhi, Staphylococcus aureus and Escherichia coli). Maizura and others
(2007) evaluated the antimicrobial activity and mechanical properties of partially hydrolyzed
sago starch-alginate edible film containing lemongrass oil. Results indicated that the film
containing lemongrass was effective against Escherichia coli O157:H7 at all levels [0.1-0.4%
(v/v)] based on the inhibition zone assay.
Kotzekidou and others (2008) studied the antimicrobial activity of plant extracts and
essential oils against foodborne pathogens in vitro and against the inoculated pathogens in
chocolate. Plant extracts and essential oils used extensively as flavor ingredients in confectionery
products were used as antimicrobials in laboratory media against the following microorganisms:
Escherichia coli O157:H7, Salmonella Enteritidis, Salmonella Typhimurium, Staphylococcus
aureus, Listeria monocytogenes, and Bacillus cereus. Using the disc diffusion method, inhibition
zones in diameter ( > 20 mm) were observed by adding 10 μL of each antimicrobial substance on
29

the following microorganisms: lemon flavor applied on E. coli O157:H7, lemongrass essences
against S. aureus, plum flavor on B. cereus strain, and strawberry flavor on L. monocytogenes
strain. E. coli O157:H7 strains were the most susceptible microorganisms inhibited by 18
extracts, followed by S. Typhimurium and S. aureus, which were inhibited by 17 extracts.
Lemon flavor, lemongrass essences, pineapple, and strawberry flavor inhibited the foodborne
pathogens at the lowest concentration (5 mL/100 mL). Plant extracts and essential oils with
potent antimicrobial activities were tested in chocolate held at different temperatures (7 and
20°C) in dry or humidified environment, which resulted in different aw values of the product (i.e.
0.340, 0.450, and 0.822), in order to determine their efficacy on the fate of the inoculated
pathogens. Most inhibition was observed in lemon flavor applied on chocolate inoculated with E.
coli cocktail culture after storage at 20°C for 9 days. Plant extracts tested on chocolate showed
an enhanced inhibitory action during storage at 20°C indicating that their application may
provide protection for storage at the above temperature or even higher.
Antimicrobial Activities of Turmeric (Curcuma longa)
Huhtanen (1980) tested 33 spices against Clostridium botulinum, nutmeg, bay leaf, and
white and black pepper (125 ppm) were the most inhibitory while paprika, rosemary, cloves,
oregano, turmeric and thyme (500 ppm) only showed small inhibitory action against Clostridium
botulinum. Results of the study showed that turmeric had a weak antimicrobial activity against
Clostridium botulinum.
Packiyasothy and Kyle (2002) studied the antimicrobial properties of some herb essential
oils: sage, turmeric, thyme, mustard, and fenugreek. These essential oils exhibited antimicrobial
activity against Salmonella Typhimurium, Bacillus cereus, Escherichia coli, and Aspergillus
flavus. Turmeric exhibited a high potency for antimicrobial activity, while fenugreek gave a
weak antimicrobial activity. Turmeric exhibited a strong antibacterial activity at concentration of
30

20 mg/mL. Mandeel and others (2003) evaluated the antibacterial activity of seventeen selected
spices including turmeric. Ethanol extracts were evaluated against six Gram positive and Gram
negative bacteria using a well-diffusion assay. All the spice extracts, except black cardamom,
possess biological activity on one or more of the test bacteria. Clove extracts showed the highest
antimicrobial activity (19.5 mm) against Escherichia coli, followed by bay leaf extracts (19 mm)
against the same bacteria, and cumin extracts (19 mm) against Pseudomonas aeruginosa, at 1000
µg/100 µL. Galangal, turmeric, and fennel extracts also exhibited a broad spectrum of
antimicrobial activity. Results of the two studies above demonstrated that turmeric, essential oils
and extracts, at a high concentration were necessary to exhibit strong antimicrobial activity
against test organisms.
Goel (2005) evaluated the antimicrobial properties of turmeric. Turmeric showed
considerable amount of antimicrobial activity measured by a standard MIC assay. Pathogens
were inhibited at 20-100 µg/mL. Among the pathogens tested, no evidence of inhibition was
observed on Campylobacter jejuni for up to 100 µg/mL. Kim and others (2005) investigated the
antimicrobial activity of ethyl acetate, methanol and water extracts of Curcuma longa L. (C.
longa) against methicillin-resistant Staphylococcus aureus. Ethyl acetate extract of C. longa
demonstrated highest antibacterial activity than that of methanol or water extracts. Results of the
study suggested that the ethyl acetate extract of C. longa may have antibacterial activity.
Shivani and Ravishankar (2005) studied the antimicrobial action of garlic, ginger, carrot,
and turmeric pastes against Escherichia coli O157:H7 in laboratory buffer and a model food
system. Turmeric paste, fresh carrot, ginger and garlic pastes from roots, and commercial ginger
and garlic paste were heated alone or with buffered peptone water (BPW) or ground beef at 70°C
for 7 min. All samples were inoculated with a three-strain cocktail of overnight cultures of E.
31

coli O157: H7 and stored at 4°C and 8°C for 2 weeks. Each paste exhibited different
antimicrobial actions alone or in ground beef or BPW at 4°C and 8°C for 2 weeks. Commercial
ginger paste and fresh garlic paste showed the strongest antimicrobial activity with complete
inhibition of E. coli O157:H7 in the paste at 3 days fort 4 and 8°C. Carrot and turmeric pastes did
not show any antimicrobial activity at either at 4 or 8°C. Commercial garlic showed
antimicrobial activity at both 4 and 8°C (about 1 log cfu/g reduction) in the paste. However,
fresh ginger paste showed antimicrobial activity only at 8°C. Only commercial ginger paste had
antimicrobial activity in BPW at 4°C for 2 weeks. However, commercial ginger paste showed
antimicrobial activity in ground beef at 3 days and after (about 1–2 log cfu/g) compared to
control samples at 8°C for 2 weeks. Fresh garlic paste showed antimicrobial activity only in
BPW (1.3 log cfu/g) at 8°C. These results indicated that the antimicrobial activity of these pastes
is decreased in ground beef and laboratory buffer. This might be because lipids in foods reduce
the antimicrobial properties of herbs.
Oonmetta-aree and others (2006) evaluated ethanol extracts of Zingiberaceae family
(galangal, ginger, turmeric and krachai) for antimicrobial action on Staphylococcus aureus 209P
and Escherichia coli NIHJ JC-2 by using agar disc diffusion method. Galangal extract had the
strongest inhibitory action against Staphylococcus aureus. Results showed that Staphylococcus
aureus (Gram positive bacteria) was more sensitive than Escherichia coli (Gram negative
bacteria). Turmeric showed less growth inhibition for both Staphylococcus aureus and
Escherichia coli. Galangal, krachai and ginger had no effect on Escherichia coli.
All results from the above studies show different antimicrobial activity when different
plants were used against many groups of microorganisms. Difference in results depends on
factors including extraction solvents, type of microorganism studied, plant parts, type of herbs
32

used, oils or plant extracts, and the concentration of the oil or extract. Therefore, this study
focused on a systematic evaluation of the antimicrobial activity of lemongrass and turmeric
extracts against the following bacteria strains (Salmonella serotypes, Staphylococcus aureus, and
Escherichia coli O157:H7) using four extraction solvents (water, ethanol, hexane and acetone),
and two drying methods (freeze drying and oven drying).
Drying Methods
Many herbs and spices are often used in dried form. This is because drying preserves the
herbs and spices, prolonging their shelf life (Reynolds and Williams 1993). Drying also slows
down enzymatic reactions but does not eliminate them (Özcan and others 2005). When the food
is ready for use, the water maybe added back and the food returns to its original shape. Foods can
be dried in the sun, in an oven or in a food dehydrator by using the right combination of
temperatures, low humidity and air current (Ho and others 2002).
Optimum temperature for drying food is 140°F (Reynolds and Williams 1993). If higher
temperatures are used, the food will be cooked instead of drying. When the food is cooked on the
outside and the moisture cannot escape, "case hardening" can occur. Food will eventually be
moldy. Lowering humidity aids the drying process and the water must move from the food to the
surrounding air. If the surrounding air is humid, then drying will be slowed down. Furthermore,
an increase of the air current speeds up the drying process by moving the surrounding moist air
away from the food. To reduce the drying time, the air flow should be increased.
Most foods can be dried indoors using modern food dehydrators, counter-top convection
ovens or conventional ovens. Microwave ovens are recommended only for drying herbs, because
there is no way to create enough air flow to dry denser foods (Venskutonis 1997). There are
many existing methods for drying foods including herbs and spices. Initially, salting and drying
in the sun, an open room or on stove tops were the accepted methods. It wasn't until 1795 that the
33

first dehydrator was introduced in France for drying fruits and vegetables. Today a variety of
dried foods in the marketplace has created a multimillion dollar industry (Hughes and others
1994). Currently oven-drying, freeze-drying, dehydrator-drying (solar and electric) and
microwave vacuum drying are among commonly used drying methods (Hughes and others
1994). This study employed oven-drying and freeze-drying methods to dry the lemongrass and
turmeric plants. These drying methods were selected based on different operating principles as
well as on the interest to establish the method that could better preserve the important
antimicrobial components of the plants.
Oven-Drying
By combining the factors of heat, low humidity and air current, an oven can be used as a
dehydrator. An oven is ideal for occasional drying of meat jerky, fruit leathers, and banana chips
or for preserving excess produce like celery or mushrooms (Reynolds and Williams 1993).
Principle of oven-drying consists of two distinct phases, an initial fast rate of moisture loss
followed by a slower second phase. Initially, when the food surface is wet, water evaporates
from the food forming a thin boundary layer of high-humidity air. Thickness of this layer
determines the rate of drying in the first phase of drying. Positive air movement over the fruit
surface reduces the thickness of the high-humidity layer, which increases the evaporation rate.
During the second phase of drying, the rate of moisture loss decreases. Second phase
begins when the rate of moisture movement to the surface of the food is less than the rate of
evaporation from the surface - that is, the speed of drying is limited by the rate at which moisture
can move through the food tissue. Circulation can be improved by placing a fan outside the oven
near the door. Oven thermometer placed near the food gives an accurate reading. Temperature
dial should be adjusted to achieve the needed temperature of 140°F. Trays should be narrow
enough to clear the sides of the oven and should be 3 to 4 inches shorter than the oven from front
34

to back. Oven racks, holding the trays, should be 2 to 3 inches apart for air circulation (Ho and
others 2002).
Freeze-Drying
Freeze-dying is a technique that forms a vacuum while the food is freezing. Water in food
specimen is frozen and then removed by a process of sublimation, from solid to vapor phase,
maintaining the structure and chemical composition of the food. This avoids the use of chemical
dehydration and can be conveniently used to prepare bulk specimens. Boiling or hot-air
dehydration frequently impairs the chemical composition of a medicinal product. Freeze-drying
is frequently used in the commercial manufacture of antibiotics, vaccines, nutritional
supplements, and food products, because the technology employs very low temperatures and
high vacuum, and thus, it avoids overheating and perhaps deteriorating the organic product
(Brennan 1994).
Freeze-drying is based on a principle of quickly extracting humidity from a product with
a minimum of alteration of its molecular structure. If a product contains frozen water and is
exposed to a very low atmospheric pressure – a virtual vacuum – the water vaporizes directly. As
it does not go through the liquid state, steam requires a minimum of space to get out. If the
freezing process is done adequately, the structure of the organic matter is not altered. When a
food product is frozen very quickly, the water forms small ice crystals, and when heat is applied
in vacuum, the tiny water crystals are sublimated. Ice water crystals are converted directly to
steam, without breaking the molecular structure. (Brennan 1994).
Freeze-drying process is classically split into three stages: freezing, primary-drying, and
secondary-drying (Cameron 1997). Primary-drying is the removal of the free moisture that has
been frozen and the secondary-drying phase is the desorption of bound moisture. However, the
35
boundary between the primary and the free drying is not a clear-cut process. Freeze-drier
operates in a similar way during both stages of freeze drying (Cameron 1997).
There is a need for technology development in process monitoring, particularly in
developing a way to measure the status of the product during freezing and freeze-drying without
placing temperature measurement probes in individual vials of product. Current practice of
placing thermocouples in vials is uncertain with respect to reliability of the data, inconsistent
with elimination of personnel in close proximity to open vials of product in an aseptic
environment, and incompatible with technology for automatic material handling in freeze-drying.
In addition, a method for controlling the degree of super cooling during freezing would allow
better control of freezing rate and would, in many cases, result in more consistent product quality
(Nail and others 2002).
Botanical samples are often freeze-dried (lyophilized) for use in research studies, and a
variety of freeze-dried botanicals are marketed to the public. In both instances, there is an
underlying assumption that freeze-drying properly preserves the medicinal qualities of plants,
and is superior to other preservation methods (Abascal and others 2005). In fact, little systematic
research has been done to verify this assumption. Review of the existing research, done primarily
by the food and spice industry, indicates that freeze-drying has unanticipated and significant
effects on the constituent profiles of medicinal plants that puts into question whether freeze-
drying necessarily is the best method to preserve botanical medicines. Lerici (1976) performed a
research study to investigate the retention of volatile organic compounds in a freeze-dried model
food gel and the data from the study suggested a theory about the different mechanisms, which
influence the retention of volatiles during freeze-drying of foods. Van Sumere and others (1983)
concluded that freeze-drying of biological material, which is to be quantitatively analyzed
36

(micro-amount level) for compounds of low or intermediate molecular weight, should be either
omitted or handled under a strict control. This is because compounds such as amino acids,
sugars, flavonoids, glycosides, coenzymes, peptides, etc., might be removed from concentrates
and (or) the ground biological material by the high vacuum. Study by Asami and others (2003),
aimed at comparing the total phenolic and ascorbic acid content of freeze-dried and air-dried
marionberry, strawberry, and corn grown using conventional, organic, and sustainable
agricultural practices, showed that freeze-drying preserved higher levels of total phenolics in
comparison with air-drying. Research review by Abascal and others (2005) found there is
insufficient information to conclude that freeze-drying has negative effects on the medicinal
qualities of plants. However, because existing research indicated that freeze-drying imperfectly
preserves important classes of medicinal compounds (such as volatiles, phenolics and
carotenoids), may increase the mutation rate in unicellular organisms, and may diminish some
medicinal plant actions, researchers and practitioners should carefully consider how the use of
freeze-dried material may affect pharmacological and clinical study results.
Several research studies on the effect of drying methods show different results depending
on several factors such as the type of food and the compounds of interest studied. In a research
aimed at studying the effect of drying on the volatile constituents of thyme and sage, two
methods were used to study the effect of drying on aroma constituents of the widely used herbs
thyme (Thymus vulgaris L.) and sage (Salvia officinalis L.). Volatile constituents of herbs (fresh,
freeze-dried and oven dried at 30°C and 60°C) were isolated by dynamic headspace and
simultaneous distillation-extraction methods and analyzed by capillary gas chromatography and
coupled gas chromatography-mass spectrometry. In total, 68 compounds were identified in
thyme and 44 in sage, and more than 100 components were screened quantitatively. Significant
37

reduction in the amount of extracted volatiles was found only in the case of oven drying at 60°C,
mainly as a result of the loss of non-oxygenated monoterpenes. Character of the changes in the
headspace volatiles was more complex, especially for thyme, and the content of aroma
compounds were the highest when the herb was dried at 60°C (Venskutonis 1997). Mahanon and
others (1999) evaluated the effect of oven drying at 50oC for 9 hours, 70oC for 5 hours and freeze
drying on retention of chlorophyll, riboflavin, niacin, ascorbic acid and carotenoids in herbal
preparations consisting of eight medicinal plants. Medicinal plants were leaves of Apium
graveolens (saderi), Averrhoa bilimbi (belimbing buluh), Centella asiatica (pegaga), Mentha
arvensis (pudina), Psidium guajava (jambu batu), Sauropus androgynous (cekor manis),
Solanum nigrum (terung meranti) and Polygonum minus (kesum). Results of the study revealed
that both type and conditions of the drying treatments affected retention of all phytochemicals
analyzed. Herbal preparations developed using oven-drying was found to have inferior
phytochemical content compared to those obtained by freeze-drying method. However, herbal
preparations developed using all treatments still retained appreciable amount of phytochemicals
studied especially carotenoids, ascorbic acid, niacin and riboflavin, and thus, have potential for
commercial purposes.
Julkunen-Tiitto and Sorsa (2001) conducted a study to test the effects of drying methods
on willow flavonoids, tannins, and salicylates. They compared the effects of several preservation
methods on the secondary phenols of the mature leaves of purple willow (Salix purpurea L.,
salicaceae) with those in fresh leaves. Conventional freeze-drying, in which the leaves were first
frozen with liquid nitrogen and then placed in a freeze-dryer, produced substantial qualitative
and quantitative changes on willow flavonoids and salicylates. Modified freeze-drying, in which
leaves were put into a freeze-dryer without being pre-frozen, gave comparable concentrations of
38
most secondary components in fresh leaves. Reducing the freeze-dryer chamber temperature
delayed the decomposition of phenolics in prefrozen leaves and in leaves dried without
prefreezing. Heat drying induced substantial changes in the composition of all phenolics, except
for apigenin-7glucoside. Vacuum drying at room temperature gave the highest concentrations for
nearly all phenolics, while room temperature-drying with desiccation gave results that were
comparable with those obtained by fresh leaf analyses. Effect of different drying treatments on
the volatiles in bay leaf (Laurus nobilis L.) was studied by Pérez-Coello and others (2002). Four
drying treatments were employed: air-drying at ambient temperature, oven-drying at 45oC,
freezing, and freeze-drying. Oven-drying at 45o C and air-drying at ambient temperature
produced quite similar results and caused very little loss in volatiles as compared to the fresh
herb; whereas, freezing and freeze-drying brought about substantial losses in bay leaf aroma and
led to increases in the concentration levels of certain components, e.g., eugenol, elemicin (3,4,5-
trimethoxyallylbenzene) and spathulenol.
Among the performed studies on the effects of drying methods, none showed the effects of
drying methods on the antimicrobial properties of herbs, thus this study seeks to evaluate oven
drying and freeze drying method in order to determine the drying method that results in a better
retention of the antimicrobial properties of lemongrass and turmeric plants.
Extraction Solvents
Solvents differ in their extraction capabilities depending on their own chemical properties
and the solute’s chemical structures. Other factors affecting solvent selection are boiling point,
density, surface tension, viscosity, corrosiveness, flammability, toxicity, stability, compatibility
with product, availability, and cost (Cowan 1999). Many types of solvents are available for
extracting plant materials including water, ethanol, acetone, hexane, dimethyl sulfoxide, and
petroleum ether. Most widely used solvents are water and ethanol. Water is often referred to as a
39

universal solvent, (while ethanol is widely used in alcoholic beverages). For this study, water,
ethanol, hexane, and acetone were used. This is because all the solvents have different
properties; therefore they differ in the substances they extract. It is very important to utilize a
variety of solvents to be able to determine the one that gives the highest antimicrobial activity in
lemongrass and turmeric, as well as other herbs. Table 2-4 summarizes the properties of the
solvents that are discussed below.
Dimethyl Sulfoxide (C2H6OS)
Dimethyl sulfoxide (DMSO) is an important polar solvent. It is less toxic than other
members of its class such as dimethylformamide. It is a colorless liquid with slight odor. It has
an excellent solvating power that dissolves both polar and non-polar compounds and is miscible
in a wide range of organic solvents as well as water. Main problem with DMSO as a solvent is its
high boiling point (189oC), thus its solutions are not typically evaporated but instead diluted to
isolate the reaction product (Cheremisinoff 2003).
Water (H2O)
Water is referred to as the universal solvent, dissolving many types of substances.
Hydrophilic (water-loving) substances mix and dissolve well with water (Cowan 1999).
Properties and nature of water are due largely to the strong intramolecular hydrogen bonding
within the water molecule and intermolecular hydrogen bonding between water molecules. It
expands upon freezing. Water has a melting point of 0oC and a boiling point of 100oC. Water is a
highly polar solvent with polarity index value of 9 (Cheremisinoff 2003). In the presence of
miscible organic solvents, water might display less polarity and hydrogen bonding character. In
the home, dried plants can be ingested as teas (plants steeped in hot water) or, rarely, tinctures
(plants in alcoholic solutions) or inhaled via steam from boiling suspensions of the plant parts.
Initial screenings of plants for possible antimicrobial activities typically begins by using crude
40

aqueous or alcohol extractions, and then followed by various organic solvent extraction methods
(Cowan 1999).
Ethanol (C2H6O)
Ethanol, also known as ethyl alcohol, drinking alcohol or grain alcohol is a flammable,
colorless, slightly toxic chemical compound. Ethanol is best known as the alcohol found in
alcoholic beverages (Cheremisinoff 2003). In a common usage, ethanol is often referred to
simply as alcohol. Ethanol has a melting point of −114.3°C (158.8 K) and a boiling point of
78.4°C (351.6 K). It is volatile, and has a burning taste. Ethanol has no residual odor. Ethanol is
commonly used for dissolving medicines, food flavorings and coloring agents, which are not
water soluble. Ethanol can dissolve both polar and non-polar substances. Hydrophilic OH group
in ethanol helps dissolve both polar molecules and ionic substances (Scheflan and Jacobs 1953).
Hexane (C6H14)
Hexane is frequently used as an inert solvent in organic reactions because it is very non-
polar. Hexane is a colorless liquid with a melting point of −95°C (178 K) and a boiling point of
69°C (342 K). It is volatile and has a faint peculiar odor (Scheflan and Jacobs 1953). Among its
many uses, hexane is a solvent for extracting cooking oils (Cheremisinoff 2003).
Acetone (C3H6O)
Acetone is the strongest solvent available. Acetone is a colorless, flammable liquid with a
freezing point of −94.6°C and boiling point of 56.53°C. It has a relative density of 0.819 (at
0°C). It is readily soluble in water, ethanol, and ether. In laboratory, acetone is used as a polar
solvent in a variety of organic reactions (Scheflan and Jacobs 1953).
Effect of Extraction Solvents on the Antimicrobial Properties of Herbs
Very few studies have evaluated the ability of various solvents to solubilize antimicrobials
from plants. None of the studies have used water, acetone, hexane and ethanol together in one
41

study to determine a solvent that yields the highest antimicrobial activity of herbs. Therefore, this
study used all four solvents to determine the best solvent to extract antimicrobial compounds
from lemongrass and turmeric.
Elloff (1998) examined different solvents to determine which solvent should be used for
the screening and isolation of antimicrobial components from plants. Focus of this study was to
provide a more standardized extraction method for the wide variety of researchers working on
diverse settings. Freeze dried and finely ground leaves of two plants with known antimicrobial
activity, Anthocleista grandiflora and Combretum erythrophyllum were extracted with acetone,
ethanol, methanol, methylene dichloride, methanol/chloroform/water and water at a 1 to 10 (v/v)
ratio in each case. Acetone gave the best results with these plants followed by
methanol/chloroform/water, methylene dichloride, methanol, ethanol, and water. Afolayan and
Aliero (2006) examined a variety of solvents for their ability to solubilize antimicrobials from
plants. This study used acetone, methanol, and water for extraction. Results showed that acetone
and methanol extracts were active against the Gram positive and Gram negative bacteria at a
concentration of 5 mg/ml. Antimicrobial activities of acetone extracts were stronger on Gram
negative bacteria than on Gram positive bacteria, while the methanol extract displayed more
antimicrobial activity on Gram positive bacteria. There was little or no antimicrobial activity
from any water extracts. Rojas and others (2006) examined the antimicrobial activity of ten
medicinal plants used in Colombian folk medicine by using ethanol, hexane and water to extract
the plant materials. Results showed that the water extracts of Bidens pilosa L., Jacaranda
mimosifolia D.Don, and Piper pulchrum showed a higher antimicrobial activity against Bacillus
cereus and Escherichia coli than that of gentamycin sulfate (antibiotics). Similarly, the ethanol
extracts of most species were active against Staphylococcus aureus, except for Justicia secunda.
42

This means that different plants have different chemical components and some of which are
polar and other are non-polar compounds. Water extracts water soluble components (polar
components) while ethanol extracts both polar and non-polar substances. This means they will
produce different results on the antimicrobial properties of the plants based on the chemical
constituents of that particular plant.
Laohakunjit and others (2007) evaluated the antibacterial action of Zingiberaceae essential
oils using water, ethanol, and petroleum ether. Turmeric oil was among the oils that
demonstrated antibacterial activity. Ethanol extracts gave the highest antimicrobial activity
against the Gram positive bacteria. Gram negative bacteria were resistant to Turmeric oil (no
inhibition zone).
In this study; water, hexane, ethanol, and acetone were used for the extraction because they
have different properties (Table 2-4). This study was aimed to determine, which solvent yielded
the highest antimicrobial activity in lemongrass and turmeric plant extracts.
Evaporation Techniques
During the extraction of the plant materials, different solvents are used. These solvents are
then evaporated in a variety of ways. There are many types of evaporation techniques. These
include stationary evaporation and rotational type evaporation. Evaporation using a rotary
evaporator (rotavapor) is the most common method used to separate a solvent from plant
extracts. This study used the rotavapor evaporation technique because it evaporates solvents
efficiently without overheating the plant extracts.
Rotary Rotavapor
Rotary evaporator (rotavapor) is essentially an evaporation unit with a rotating evaporation
flask, which was invented by Buchi. Vacuum evaporation is the most frequently used method
because it is more efficient. Rotavapor will evaporate solvent at a much faster rate than the
43

stationary evaporation flasks. Its rotating flask produces a very efficient transfer of heat, whilst
ensuring thorough mixing and avoiding local overheating of the contents (Buchi 2008).
Rotation transfers a thin film of the liquid sample to the whole inner surface of the flask,
markedly increasing evaporation rate and assisting heat transfer from the heating bath. Rotating
flask and vapor duct have a sealing system, which allows operation under vacuum, further
accelerating the evaporation process because of the reduction in boiling point of the solvent and
efficient removal of the vapor phase. Vacuum operation also permits heat-labile materials to be
successfully concentrated without degradation (Buchi 2008).
44

45
Table 2-1. Reported and estimated cases, number of outbreaks and deaths caused by known foodborne bacterial pathogens from 1983 to 1997.
Pathogens Reported Cases Outbreaks Deaths % Salmonella spp 1,412,498 3,640 31 Shigella spp 448,240 1,476 0.8 Clostridium perfringens 248,520 654 0.4 Escherichia coli O157:H7 73,480 500 3 Staphylococcus aureus 18,5060 487 0.1 Listeria monocytogenes 2,518 373 28 Escherichia coli enterotoxigenic 79,420 209 0 Campylobacter spp 2,453,926 146 5.5 This table demonstrates the reported and estimated cases, outbreaks and deaths caused by known foodborne bacterial pathogens by Mead and others (1999). Bacteria are arranged according to the number of reported and estimated outbreaks, starting with the bacteria with the highest outbreak. Numbers of outbreak –related cases were calculated as the average annual number of cases reported to CDC from 1983 to 1997.

Table 2-2. Most common pathogens associated with foodborne illness outbreaks Pathogens Reservoirs Associated foods Symptoms/Incubation period
Salmonella spp. Humans and domestic or wild
animals Meat, poultry, egg or milk products
Headache, abdominal pain, diarrhea, nausea, vomiting, dehydration, fever and loss of appetite. Symptoms appear within 6-72 hours after the ingestion of the organism and may persist for as long as 2-3 days. Death is uncommon, except for the very young, very old and the immuno-compromised.
Shigella spp Humans are the most significant source. People may carry this pathogen for several weeks and excrete it in their feces.
Ready to eat foods: salads, raw vegetables, dairy products, and poultry
This illness is usually characterized by diarrhea, cramps and chills, often accompanied by fever. Symptoms usually appear within 12-96 hours, but can take as long as one week. Duration of illness is usually 4-7 days.
Clostridium perfringens
The bacteria can be found in soil, dust, sewage, and intestinal tracts of animals and humans. The organism grows in little or no oxygen.
Foods that have experienced temperature abuse such as meat dishes (gravies and beef stew)
Diarrhea and gas pains about 8 to 24 hours after eating. The illness usually lasts 1 day, but some symptoms may last 1 to 2 weeks for the elderly or very young.
E. coli O157:H7 Humans and animals Hamburger and other ground meat products
Severe abdominal pain, cramps, nausea, vomiting, diarrhea and occasionally fever. Hemolytic Uremic Syndrome (HUS) is a serious consequence of this disease and is the leading cause of kidney failure in children.
46

47
Table 2-2. Continued Pathogens Reservoirs Associated foods Symptoms/Incubation period
Staphylococcus aureus
Humans are the most common source, but cows, dogs and fowl also can be a source.
Contaminated ready-to-eat foods, Custard- or cream-filled baked goods, ham, tongue, poultry, dressing, gravy, eggs, potato salad, cream sauces, sandwich fillings
Nausea, vomiting, diarrhea, dehydration, cramps, subnormal temperatures and lowered blood pressure. Symptoms appear within 30 minutes to 7 hours (2-4 hours is most common) after eating the contaminated food, and may last for up to 24-48 hours.
Listeria monocytogenes
The organism is frequently found in environment such as soil, water and plant matter that animals ingest and excrete, allowing further transmission.
Ready to eta foods Nausea, vomiting, headaches, delirium, coma, collapse, shock and lesions on vital organs. In pregnant women, the illness can cause a miscarriage or result in stillbirths. Listeriosis may also cause severe retardation, meningitis and death in newborns.
Campylobacter jejuni
Healthy chicken carry this bacteria in their intestinal tracts sometimes causing the contamination of raw poultry. Raw milk can also be a source; the bacteria are carried by healthy cattle and by flies on farms. Non - chlorinated water may also be a source for the infection.
contaminated water, raw milk, and raw and undercooked meat, poultry or shellfish
Initial symptoms include fever, headache, and muscle pain followed by diarrhea, abdominal pain, and nausea. These symptoms may appear 2 to 5 days after eating and may last up to 7 to 10 days.
This table gives a brief description of the bacterial pathogens mostly associated with foodborne outbreaks. This table outlines the reservoirs, foods associated with pathogens and the symptoms/incubation period associated caused by bacterial pathogens. Sources: Beattie Sam (2006), FDA Bad bug book (2007), CDC (2005)

Table 2-3. Common Asian herbs used for cooking Botanical Name Common name Parts used in cooking Cymbopogon citratus Poaceae or Gramineae
Lemon grass stem, leaf
Curcuma longa Zingiberaceae, or the Ginger family
Turmeric Rhizome
Coriandrum sativum Apiaceae or Umbelliferae
Corienda (Cilantro leaves) Leaves
Allium ramosum - L. Alliaceae
Chinese chives Stem
Ocimum basilicum Lamiaceae or Labiatae
Thai Basil Leaf
Lepidium sativum L. Brassicaceae
Cress Leaf
Capsicum frutescens Solanaceae
Chili pepper Whole plant
Piper sarmentosum Piperaceae
Piper Chaba Leaf
Boesenbergia pandurata Zingiberaceae
Finger root Rhizome, finger root
This table presents some of the Asian herbs used for cooking. It gives the botanical name, common name and the different parts that are used in cooking.
48

49
Table 2-4. Properties of different solvents Solvents Chemical
formula Boiling point (oC)
Melting point (oC)
Molecular weight (g/mol)
Dielectric constant (Debye)
Dipole moment
Index Polarity
Dimethyl Sulfoxide
C2H6OS 189 18.45 78.14 47.2 3.96 7.2
Water H2O 100 0 18.02 80 1.85 9 Ethanol C2H6O 78.4 -114.3 46.07 24.3 1.69 5.2 Hexane C6H14 69 -95 86.18 2.02 ---- 0 Acetone C3H6O 56.5 -94 58.08 20.7 2.88 5.1
This table above presents the different properties of dimethyl sulfoxide, water, ethanol, hexane and acetone. Solvents are arranged according to their boiling point, starting from the highest to the lowest boiling point.

Figure 2-1. Chemical structure of Citral (C10H16O) (3, 7-dimethyl-2, 6-octadienal)
Figure 2-2. Chemical structure of Curcumin (C21H20O6 )
50
CHAPTER 3 MATERIALS AND METHODS
Bacterial Strains and Cultivation
Three strains of E. coli O157:H7 [204P, 301C, 505B] from Dr. Tun-Shi Haung (Auburn
University, Auburn, Ala), three strains of Salmonella species [Salmonella Thompson, Salmonella
Enteritidis, Salmonella Typhimurium], and three stains of Staphylococcus aureus [ATCC 29247,
ATCC 12600, and ATCC 35548] were used as tested organisms in all antibacterial assays. Both
Salmonella and Staphylococcus aureus strains were obtained from American Type Culture
Collection (ATCC). These organisms were selected because they are among many pathogens
often implicated in foodborne outbreaks in the United States. Different strains of bacteria were
streaked onto Tryptone Soy agar (TSA) (Becton, Dickinson and Company Sparks MD) to obtain
pure isolated colonies, following a standard aseptic technique and the four-way streak plate
inoculation (Cappuccino and Sherman 2005). Once the isolated colonies were obtained, the
bacterial strains were enumerated with Mueller Hinton Broth (MHB) for the next step of the
experiment, the antimicrobial assay.
Plant Materials
Lemongrass (Cymbopogon citratus (C. Nees) Stapf (Poaceae)) samples were obtained
from two local growers in Gainesville, FL. First harvest was in October 2007 and second harvest
was in November 2007. Figure 3-1 displays the lemongrass plant (Cymbopogon citratus)
Turmeric (Curcuma longa) samples were obtained from a major produce market in
Atlanta, GA (DeKalb Farmer’s Market). Two forms (fresh rhizomes and dried powder from) of
turmeric were obtained. Figure 3-2 displays fresh rhizome turmeric samples.
51
Preparation of Plant Material
Lemongrass (Cymbopogon citratus (C. Nees) Stapf (Poaceae)) – leaf (Figure 3-3) and stem
(Figure 3-4) - and turmeric (Curcuma longa) were used for examining the antimicrobial activity
against all nine bacterial strains. Plant samples were washed and sanitized in a 6% sodium
hypochlorite solution (50 ppm), (Clorox company; Oakland, CA) (Ritenour and others 2002).
After washing, the plant materials were left in the biological hood (LABGARD Laminar Flow
Biological Safety Cabinet; nuAire, Inc) to get rid of excess water, and then they were thinly
sliced (approximately 25 mm) and flatly spread in oven trays (13 in x 9 in) and freeze drier
containers (melamine organizer; 15 in x 6 in x 2 in). Plant materials in ovens trays were dried in
an oven-drier (Scientific Fisher Isotemp oven Standard 600) set at 60oC for 48 hours. For
samples to be freeze-dried, deionized water was added to the same level of the plants in the
freeze-drying containers and was first frozen in a regular freezer (Kenmore 19) set at -20oC
overnight, and then taken to the freeze-drier (Model 25 SRC Virtis Company Gardiner, NY) for
72 hrs. After drying, the plants were grounded using a 12-speed blender (Hamilton Beach;
Michael Graves Design) for 5 minutes.
Preparation of Plant Extracts
Ten grams of dried ground plant material (weighed by Fisher Scientific scale) was added to
500 mL conical flasks, and 150 mL of each solvent (water, acetone, hexane, and ethanol) was
added to each flask. Ratio (1 to 15) of the plant materials and solvents was determined following
a standard method for evaluation of antimicrobial in foods (Parish and Davidson 1993). Each
mixture was placed on a shaker (Excella E1 platform, New Brunswick Scientific) and left to
extract for 18 hours at a speed of about 133 rpm at room temperature (25oC). Extract was then
filtered using a conical flask with side arm, a filter funnel (size 2), and a 90 mm diameter filter
paper (Whatman #1). Filtered extract was then poured in a weighed 500 mL round bottom flask.
52

Solvent was evaporated with a rotary evaporator (Buchi). Temperature of the water bath in the
rotavapor was set at 40oC. This temperature was used because the evaporation under reduced
pressure makes it possible to evaporate at much lower temperatures. Evaporation time ranged
from 10 to 30 minutes depending on the solvent type. After evaporation of solvent, the flask was
weighed again. To determine the weight of the sample, the weight of flask was subtracted from
the weight of the flask and sample. Dimethyl sulfoxide (DMSO) and water was used to
reconstitute the extracts in order to make a stock solution using volumetric flasks. Extracts were
then sterilized by filtration using 0.45µm aqua membrane nylon filter disk (Becton, Dickinson
Company). Concentration was recorded on a weight by volume (w/v) basis. Stock solution was
stored it the freezer of a regular refrigerator (General Electric; Association of Home Appliance)
set at – 20oC. Working solutions were made from the stock solution. Concentration of the
working solution for lemongrass was 125 mg/mL, and 200 mg/mL for turmeric extracts.
Lemongrass has a strong flavor, and therefore, is being used in very small amounts to add flavor
in foods. Turmeric on the other hand is being used mainly to enhance color and to add a unique
taste to the food. Flavor of turmeric is not as strong as lemongrass, thus it is being used at
slightly high concentrations than lemongrass extract. Filtered and reconstituted extracts were
then prepared for the evaluation for antimicrobial properties against the nine bacterial strains.
This was done by taking 20 µL of each plant extract and impregnating a 6 mm blank paper disc
(Becton, Dickinson Company) and leaving them in the biological hood (LABCONCO Purifier
Class II biosafety cabinet; Kansas, Missouri) to dry. Concentration of the plants in the discs was
2.5 mg/disc for lemongrass and 4 mg/disc for turmeric. Negative controls were prepared the
same way as the extract impregnated discs but, using 95% ethanol (number: 61511-0040;
ACROS, New Jersey), to make the discs sterile. Antibiotics (imipenem and ampicillin 10
53

µg/disc) (Becton, Dickinson and Company Sparks, MD) were used as positive reference
standards or control.
Antimicrobial Assay
Five isolated colonies of each bacterial strain was inoculated in 5 mL of Mueller Hinton
Broth (MHB) (Becton Dickinson Microbiology Systems) using a sterile wood stick. The 5 mL
tubes were then incubated at 37oC for approximately 2 hours or until the bacterial density
reached 1.5x 10⁸ cfu/mL (Casimiri and Burstein 1998). Bacterial density was determined by
using a spectrophotometer (Spectronic 20+ series, Thermo Electron Corporation) at wavelength
of 600 nm. Blank of MHB alone was used to calibrate the spectrophotometer. After calibrating
the spectrometer, the inoculated tubes were put in the spectrophotometer and the reading was
taken. When the bacterial density was at the desirable level, the reading was 1.32. When the
reading was below that level, the tubes were incubated a little longer; and when the tubes reading
was above that level, the bacterial suspension was adjusted by diluting the inoculated bacteria
with MHB until it reached the desirable level. When the bacterial density reached a desirable
level (1.5 x 10⁸ cfu/mL), 100 µL bacterial suspension for each bacterial strain were spread on to
the surface of the Mueller Hinton Agar (MHA) (Difco Becton, Dickinson and Company Sparks
DM) using sterile swabs (Casimiri and Burstein 1998).
The 6 mm diameter filter paper discs (containing 20 µL of the particular plant extract)
were applied onto the surface of the spread MHA. Antibiotics; imipenem and ampicillin (10
µg/disc) (Becton, Dickinson and Company Sparks, MD) were used as positive reference
standards or control. Negative control (95% ethanol) was also used to make sure that the discs
were sterile. Plates were incubated at 37ºC for 24 hours and the inhibition zones were measured
to determine the effectiveness of the extract against each organism. Results were expressed as
54

the diameter (in millimeters) of inhibition for the paper disk (6 mm) with each extract (Figure 3-
5) (Parish and Davidson 1993).
Minimum Inhibitory Concentration (MIC) Determination
Minimum inhibitory concentration (MIC) is defined as the lowest concentration of an
antimicrobial that prevents the growth of microorganism after a specific incubation time. The
MIC was studied for the bacterial strains, being sensitive to the plant extracts in the disc
diffusion assay (Parish and Davidson 1993). The MIC was determined by using the 48 well
sterile plates (Costar Corning Incorporated, NY) which has a maximum volume capacity of 2
mL. For each well, 0.5 mL of MHB was added. Then the -prepared discs containing various
concentrations of plant extracts were added to achieve the desirable concentrations from the
highest to the lowest as described by previous literature (Duke and others, 2003). For
lemongrass, the concentrations used were 20, 10, 5, 2.5, 1.25, 0.625, 0.32, and 0.16 mg/mL. For
turmeric, the concentrations were 80, 40, 20, 10, 5, 2.5, and 1.25 mg/mL. Concentrations used
were based on previous research; lemongrass is said to be effective at lower concentrations than
turmeric (Duke and others, 2003). Bacterial innocula was prepared from MHB cultures and the
suspensions density were adjusted to standard turbidity (7.5 x 10⁵ cfu/mL) (Casimiri and
Burstein 1998). Bacterial density was measured in the same manner as the antibacterial assay
using a spectrophotometer. When the bacterial innocula had reached the required density (7.5 x
105 cfu/mL), 5 µL of the bacterial suspension was added to each well from the lowest to highest
extract concentration. Plates were then incubated at 37oC for 24 hours. Color reaction with p-
iodonitrotetrazolium violet (Bio Medicals, Inc.) was used in lieu of traditional turbidity
measurement to eliminate difficulties of observing turbidity for each 48 wells. One hundred
micro liters of p-iodonitrotetrazolium violet (0.2 mg/mL) in water was added to each well in the
48 well plates and the plates were incubated for 30 minutes at 37oC. Color changes were
55

observed thereafter. Wells showing red color indicated the bacterial growth (presence of
turbidity) and a well with the lowest concentration of plant extract without any red color was
determined as the minimum inhibitory concentration (MIC). Wells with no color change were
used for the determination of minimum bactericidal concentration (MBC).
Minimum Bactericidal Concentration (MBC) Determination
The MBC is defined as the lowest concentration of an antimicrobial agent needed to kill
99.9% of the initial inoculums. Minimum bactericidal concentration was determined on the
selected extracts in the 48 well plates that had the highest antimicrobial activities (i.e. those that
did not have any turbidity on the MIC determination) (Parish and Davidson 1993). Ten μL from
each well that showed no bacterial growth was taken and inoculated in Tryptone Soy agar (TSA)
plates that were divided into quadrants. Plates were incubated at 37oC for 24 hours, and then
bacterial growth was evaluated. Last quadrant (i.e. with the lowest concentration of plant extract)
showing no growth was taken as the MBC. Values were recorded as mg/mL.
Experimental Design and Statistical Analysis
A factorial design was used to design the experiment. Lemongrass factors were harvest
time x 2, trial x 2, pathogen x 3, solvent x 2, and drying method x 2. Fresh rhizome turmeric
factors were trial x 2, pathogen x 3, solvent x 3, and drying method x 2. Dried powder turmeric
factors were trial x 2, pathogen x 3, and solvent x 3. Microbial testing was done in triplicates for
each extract for each bacteria strain. General liner model procedure (PROG GLM) of the
Statistical Analyses System was employed and the significance among the different observed
antimicrobial activities were evaluated using Duncan’s multiple range test (SAS Institute, Inc.
1991, Cary, NC) at α = 0.05 level. Data generated from the procedures described in the
experimental sections were tabulated and discussed in the next chapters.
56

Figure 3-1. Lemongrass (Cymbopogon citratus) plants. Source:
http://www.paintedflowerfarm.com
Figure 3-2. Turmeric (Curcuma longa) rhizomes
57

Figure 3-3. Lemongrass leaves
Figure 3-4. Lemongrass stem
58

59
Figure 3-5. Inhibitory zone of lemongrass stem oven dried, hexane extracts on Staphylococcus
aureus ATCC 29247.

CHAPTER 4 RESULTS AND DISCUSSION
Antimicrobial Activity of Lemongrass
Inhibitory Zone of Lemongrass Extracts
Lemongrass leaves extracts (water, ethanol, acetone, and hexane) demonstrated no
antimicrobial activity (data not shown). This may be due to the fact that leaves of lemongrass are
exposed to the light. Although the lemongrass leaves contain citral, it is highly volatile and
instable to air, light and alkalis, thus citral hardly sustaining its activity in the leave part of the
lemongrass (United States Patent 2003; European Patent 2006).
Water and ethanol extracts of lemongrass stem (Table 4-1) did not show any antimicrobial
activity against any test bacterial strains. Neither water nor ethanol extract of lemongrass stem
yielded any antimicrobial activity (inhibition zone). Water is considered to have large dipole
molecules and a high dielectric constant. Thus, water is very polar and only miscible in itself.
However, the main compounds of the lemongrass are oily substances. Water has been used by
other researchers as an extract solvent, most of their results indicated that water extracts gave
little or no inhibitory effect (Siropngvutikorn and others 2005; Afolayan and Allerozo 2006).
One important factor of solvent effectiveness is the active components of the plants. If most of
the compounds contained in the plants are miscible in water, then an antimicrobial activity can
be observed. According to a study by Rojas and others (2006), some of the water extracts of
some plants such as Bidens pilosa L., Jacaranda mimosifolia D. Don and Piper pulchrum had
antimicrobial activity, but others such as Justica secunda did not. This means based on the
compounds’ miscibility in water, some will have antimicrobial action and some will not.
Unfortunately, in the home water is the major medium in food and drink preparation.
60

Ethanol is also classified as a polar solvent, although not very polar as water. This means
that this solvent is miscible in water and it will extract mostly the ionic compounds from
lemongrass. Ethanol has better dissolving capabilities than water because it has a slightly low
dipole and dielectric constant than water, thus it is slightly polar (Scheflan and Jacobs 1953).
Same reason that water did not have an effect as an extraction solvent could be the same reason
that ethanol was not effective since they are both said to be polar solvents (Cheremisinoff 2003).
These results from this study revealed that the benefit of antimicrobial properties from
lemongrass stem may not be achieved under a typical use of the lemongrass in water or ethanol
medium.
Hexane and acetone extracts of lemongrass stem showed antimicrobial activity against
Staphylococcus aureus strains (Table 4-1). Inhibitory zone of lemongrass stem extracts ranged
from 6.5 to 21 mm (also shown in Table 4-1).
Lemongrass samples prepared by the oven-dried methods yielded significantly higher (p <
0.0001) inhibition zone (Table 4-4) than those prepared by the freeze-dried method (with up to
21 mm inhibition zone). Results showed that the oven-dried lemongrass stem gave a better
overall antimicrobial activity (inhibition zone) than the freeze-dried lemongrass stem. These
results are in accordance with one study that demonstrated that oven-drying produced quite
similar results and caused hardly any loss in volatiles as compared to the fresh herb; whereas,
freezing and freeze-drying brought about substantial losses of aroma in bay leaf and led to
increases in the concentration levels of certain components (Pérez-Coello and others 2002).
However, other studies showed that freeze drying method retains compounds better (Mahanon
and others 1999; Julkunen-Titto and Sorsa 2001). Results may vary depending on the type of
plant and the compounds of interest. There is an underlying assumption that freeze-drying
61

properly preserves the medicinal qualities of plants, and is superior to other drying preservation
methods (Abascal and others 2005). However, little systematic research has been done to verify
this assumption (Abascal and others 2005). Our results had proved that the assumption that
freeze-drying is better than other drying methods might not always be true.
There was no significant difference (P > 0.05) on the level of antimicrobial activity
(inhibitory zone) of the lemongrass stem against the three Staphylococcus aureus strains.
Lemongrass stem extracts showed a considerable amount of inhibition zone against
Staphylococcus aureus strains tested in this study. As citral is the main component of
lemongrass, some researchers have found that this compound is the one responsible for the
antimicrobial activity of lemongrass (Kim and others 2005; Rojas-Grau and others 2007; and
Onawunmi 1989). Results showed that Gram positive bacteria are more sensitive to turmeric and
lemongrass stem extracts. These results are in agreements with previous reports by Zaika (1988);
Consentino and others (1999), and Karaman and others (2003). Staphylococcus aureus strains
are considered the most sensitive bacteria (Oonmetta-aree and others 2006); whereas, Gram
negative bacteria showed resistance (i.e. no inhibition zone) towards the plant extracts. Varying
degrees of sensitivity of the test bacteria may be due to both the intrinsic tolerance of
microorganisms and the nature and combinations of phytochemical compounds present in the
essential oil portion of the plants. Outer cell membrane of Gram-negative organisms has several
lipid compounds that protect the cells from antimicrobial agents (Shelef and others 1980; Russel
1991) and thus, protecting them from the action of the essential oils.
Seasonal variation in lemongrass stem extracts was observed with respect to the
antimicrobial activity (inhibition zone); plants harvested in November showed a higher activity
(p < 0.0001) than plants harvested in October. Inhibition zone of lemongrass stems were by the
62

harvesting time. Lemongrass harvested in November showed a higher antimicrobial activity than
the lemongrass harvested in October. This is in accordance with previous research that a
composition of essential oils could be influenced by time of harvest (Senatore 1996).
There was no significant difference (P > 0.05) in the inhibition zone of hexane and acetone
extracts of lemongrass stem. Both hexane and acetone extracts yielded the same inhibition zone
(13.7 mm). Acetone and hexane extracts of lemongrass stem displayed a considerable amount of
antimicrobial activity. This could be because acetone is considered to be a dipolar aprotic
solvent. This means that acetone is of medium polarity; therefore it can dissolve a wide range of
compounds (Scheflan and Jacobs 1953). It has a slightly lower dielectric constant than ethanol,
which could aid in not only dissolving water soluble compounds but also other compounds,
which dissolve in other less polar solvents (Cheremisinoff 2003). For acetone, having an extra
carbon than ethanol adds to its capability to extract other compounds other than what ethanol can
extract. Hexane has low dielectric constants and is not miscible with water. Chemical formula of
hexane (Table 2-3) shows it is the least polar solvent. This means because hexane has 100%
hydrocarbons, it has the capability to extract most of the hydrocarbon compounds that are in
lemongrass or at least the most abundant compound of lemongrass, citral.
Result of the inhibition zone (Table 4-5) by pathogens show a same trend of
antimicrobial activity against the Staphylococcus aureus strains tested. Inhibition zone of the
Staphylococcus aureus strains showed that oven-drying had a significantly higher (P < 0.0001)
inhibition zone than freeze-drying. Inhibition zone of oven-dried lemongrass extracts against
Staphylococcus aureus strains: ATCC 35548, ATCC 12600-U, and ATCC 29247 were 15.3,
16.1, and 17.4 mm, respectively; while the inhibition zone of freeze-dried lemongrass extracts
against the same strains were 11.1, 12.1, and 10.3 mm, respectively. Similarly, the
63

Staphylococcus aureus strains were more sensitive to lemongrass stem extracts harvested in
November than those that were harvested in October. Inhibitory zone of November harvested
extracts against Staphylococcus aureus strains: ATCC 35548, ATCC 12600-U, and ATCC
29247 were 14.9, 16.0, and 14.6 mm, respectively; while the inhibition zone of October
harvested extracts against the same strains were 11.5, 12.2, and 13.1 mm, respectively. Inhibition
zone of hexane and acetone extracts of lemongrass stem show a different trend against the
Staphylococcus aureus strains that were tested. Staphylococcus aureus ATCC 12600-U was
more sensitive to hexane extracts with an inhibition zone of 14.9 mm, than to acetone extracts
which had an inhibition zone of 13.3 mm. Interestingly, the Staphylococcus aureus ATCC 29247
and 35548 were more sensitive to acetone extracts. Both had an inhibition zone of 13.9 mm,
while hexane extracts had an inhibition zone of 12.8 and 12.5 mm, respectively. Even though
there was a variation observed among the solvent extracts, they both seemed to exhibit a
reasonable amount of antimicrobial activity (inhibition zone).
Minimum Inhibitory Concentration (MIC) and Minimum Bactericidal Concentration (MBC) of Lemongrass Stem Extracts
All other pathogens strains tested were not tested for MIC and MBC as they did not show
positive results on the antibacterial assay. The MIC and MBC values of lemongrass stem extracts
are presented in Tables 4-4 and 4-5. Results demonstrate a wide range of activities of the
different extracts against Staphylococcus aureus strains. Oven-dried lemongrass stem extracts
had lower MIC and MBC: 2.2 and 3.3 mg/mL, respectively than those of freeze-dried
lemongrass stem which had MIC and MBC of 3.1 and 7.1 mg/mL, respectively. Results
demonstrated that, overall, hexane extracts of lemongrass stem gave the lowest MIC (2.3
mg/mL) than acetone extracts (3.6 mg/mL), however there was no significant difference
demonstrated by the MBC between the hexane and acetone extracts in lemongrass stem. Hexane
64

and acetone extracts gave an MBC of 4.9 and 5.4 mg/ml, respectively. The MIC of lemongrass
stem did not demonstrate a statistical difference in the sensitivity of the Staphylococcus aureus
strains. Their sensitivity to the lemongrass stem was not statistically different; however for MBC
it was observed that the sensitivity of Staphylococcus aureus strain (ATCC 29247), was
statistically lower (p < 0.0001) MBC (4.2 mg/mL) than the two other Staphylococcus aureus
strains (ATCC 12600-U and 35548) which presented an MBC of 5.9 and 5.6 mg/mL
respectively. Results showed that the Staphylococcus aureus strain (ATCC 29247) may be more
sensitive to lemongrass stem extracts than the other Staphylococcus aureus strains used in the
study.
Results of the MIC and MBC of lemongrass stem extracts when analyzed against each
Staphylococcus aureus strain showed the same trend as the results discussed above. The MIC
and MBC of oven-dried lemongrass stem was significantly lower against all the Staphylococcus
aureus strains than MIC and MBC of freeze-dried lemongrass stem extracts. Oven-dried
lemongrass stem extracts presented an MIC and MBC of 1.9 and 3.9 mg/mL against both
Staphylococcus aureus strains: ATCC 12600-U and 35548; and 0.8 and 2.1 mg/mL against
Staphylococcus aureus strain (ATCC 29247). Freeze-dried lemongrass stem extracts presented
an MIC and MBC of 4.6 and 8.0 mg/mL; 4.4 and 6.3 mg/mL; and 4.4 and 7.1mg/mL, against
Staphylococcus aureus ATCC 1600-U, 29247, and 35548, respectively. These results show that
oven-dried lemongrass stem extracts had a stronger antimicrobial activity against all the
Staphylococcus aureus strains that were tested. Similar to the results obtained in the inhibition
zone, hexane extracts of lemongrass showed a lower MBC (5.2 mg/mL) against Staphylococcus
aureus ATCC 1600-U than acetone extracts which showed an MBC of 6.7 mg/mL. Both
Staphylococcus aureus ATCC 29247 and 35548 had a higher sensitivity to acetone extracts with
65

an MIC and MBC of 1.6 and 3.3 mg/mL; and 2.1 and 4.8 mg/mL, respectively, while hexane
extracts showed less sensitivity with a higher MIC and MBC of 3.5 and 5.0 mg/mL; and 4.0 and
6.2 mg/mL. Difference in the solvent extracts may be due to the previously suggested theory of
different mechanisms, which influence the retention of compounds during freeze drying (Lerici
1976).
Sensitivity of all the Staphylococcus aureus strains that were tested showed similar results
to those obtained in the inhibition zone assay. All strains were more sensitive to lemongrass stem
extracts from November harvest that those extracts from October harvest. Lower MIC and MBC
from the November harvest was expected because, as seen in the antimicrobial activity
(inhibition zone), antimicrobial properties of lemongrass were affected by the harvesting time in
accordance with previous research (Senatore 1996).
Antimicrobial Activity of Turmeric Extracts
Inhibitory Zone of Turmeric (Fresh Rhizomes and Dried Powder) Extracts
Water extracts of turmeric (prepared from fresh rhizomes) were observed to have no
antimicrobial activity against any of the test bacterial strains (Table 4-2). Water is very polar and
is only miscible in itself. This means that water cannot extract non-polar compounds in turmeric
Turmeric extracted by ethanol, acetone and hexane demonstrated antimicrobial activity
against Staphylococcus aureus strains (Table 4-2). This might be due to the difference in
chemical compounds found in lemongrass and turmeric. Differences were observed in their
chemical structures presented in Figure 2-1 and Figure 2-2. First figure, which shows the
chemical structure of citral, lacks the hydrogen (O-H) bond but contains a multiple bond between
the hydrocarbon and oxygen; and yet the chemical structure of curcumin contains two hydroxyl
groups and O-H bond. This means turmeric has polar components, which can be easily dissolved
in ethanol because ethanol also has a hydroxyl group. Another study showed that ethanol gave a
66

better antibacterial activity on turmeric plants compared to petroleum ether and water
(Laohakunjit and others 2007). Inhibitory zone of turmeric extracts against the Staphylococcus
aureus strains ranged from 6.5 mm - 11 mm.
E. coli O157:H7 and Salmonella strains were not affected by any turmeric extracts no
matter which solvent or drying method was used.
Staphylococcus aureus strain (ATCC 12600U) demonstrated a significantly higher
susceptibility (p < 0.0001) to turmeric extracts than the other Staphylococcus aureus strains
(Table 4-6). Turmeric extracts from samples prepared by freeze drying yielded a significantly
higher antimicrobial activity (inhibition zone) than those prepared from the oven drying method.
No significant difference (p> 0.05) was observed among different solvents (hexane, acetone and
ethanol).
Turmeric extracts (prepared from dried powder) demonstrated the same pattern as the
turmeric extracts from fresh rhizomes (Table 4-3). However a statistical difference was observed
in the Staphylococcus aureus strains’ susceptibility to the turmeric (dried powder) extracts
(Table 4-8). Staphylococcus aureus ATCC 35548 was the most sensitive (P < 0.0001) to the
turmeric extract prepared from dried turmeric powder, followed by the Staphylococcus aureus
ATCC 12600, and Staphylococcus aureus ATCC 29247, respectively. Neither E. coli O157:H7
or Salmonella test strains used in this study were sensitive to the dried powder turmeric extracts.
This is because Gram-negative bacteria are more resistant to antimicrobials than Gram-positive
bacteria (Shelef and others 1980; Russel 1991).
Acetone extracts of fresh turmeric rhizomes gave a significantly higher (P < 0.0001)
inhibition zone (8.0 mm) than the extracts prepared from hexane (8.0 mm), however acetone
extracts were not statistically different from inhibition zone of ethanol extracts (8.8 mm).
67

Acetone is a solvent of medium polarity and thus it can dissolve a wide range of compounds
(Scheflan and Jacobs 1953). Acetone dissolves water soluble compounds as well as other
compounds which dissolve in less polar solvents (Cheremisinoff 1953). Ethanol extracts of
turmeric also showed to have a higher inhibition zone. Results were in accordance with one
study which demonstrated that ethanol extracts of turmeric gave the highest antimicrobial
activity against Gram-positive bacteria (Laohakunjit and others 2007).
There was a statistical difference in the antimicrobial activity (inhibition zone) (p <0.
0001) between the turmeric extracts prepared from fresh rhizomes and the turmeric extracts
prepared from dried-powder (Table 4-11). Dried powder turmeric had a significantly higher
inhibition zone (8.6 mm) than fresh rhizome’s turmeric (7.7 mm); however the observed
difference was small.
Inhibitory zone of turmeric (fresh rhizomes) extracts (7.7 mm) was significantly lower
(p<0.0001) than that of lemongrass stem (13.7 mm) extracts (Table 4-10). This is in accordance
with previous research, which showed that turmeric only gave low inhibition compared to other
plant extracts against Clostridium botulinum (Huhtanen 1980).
Minimum Inhibitory Concentration (MIC) and Minimum Bactericidal Concentration (MBC) of Turmeric (Fresh Rhizomes and Dried Powder) Extracts
The MIC and MBC results of turmeric (prepared from fresh rhizomes) demonstrated no
significant difference (P > 0.05) in either solvents, drying methods or among the Staphylococcus
aureus strains. Results showed that all the solvent extracts and drying methods gave statistically
similar antimicrobial activity against Staphylococcus aureus strains. Sensitivity of the
Staphylococcus aureus strains to the fresh rhizome turmeric extracts was also similar. Very little
variations were observed (among trials, solvents and drying methods), demonstrating the
68

sensitivity of each Staphylococcus aureus strain to the fresh rhizome turmeric extracts (Table 4-
7).
Results of dried powder turmeric (Table 4-8) demonstrated that the MIC and MBC of
acetone extracts were significantly lower (P < 0.0001) than the extracts of ethanol and hexane.
Acetone extracts presented an MIC and MBC of 12.5 and 20.0 mg/mL, respectively, while the
MIC and MBC of ethanol and hexane were 19.2 and 33.0 mg/mL; and 26.6 and 40.0 mg/mL,
respectively. These results showed that acetone extracts of turmeric (dried powder) had a higher
antimicrobial activity than that of ethanol and hexane.
Turmeric extracts showed a higher antimicrobial activity against Staphylococcus aureus
ATCC 29247 with a low MIC of 18.3mg/mL. The MBC of turmeric (dried powder) extracts
against all the Staphylococcus aureus strains tested were not significantly different (P > 0.05).
Staphylococcus aureus ATCC 12600-U and 35548 both had an MBC of 31.7 mg/mL; and
Staphylococcus aureus ATCC 29247 had an MBC of 30.0 mg/mL. There was very little
variation observed (among trials and solvents) demonstrating the sensitivity of each
Staphylococcus aureus strain to the dried powder turmeric extracts (Table 4-9). Results showed
to be consistent with those presented in Table 4-8, which showed that acetone and ethanol
extracts had a higher antimicrobial activity than that of hexane extracts.
Lemongrass extracts had a significantly lower MIC and MBC than that of turmeric (Table
4-10). The MIC and MBC for lemongrass were 3.0 mg/mL and 5.2 mg/mL, respectively, yet for
turmeric; the MIC and MBC were observed to be 19.4 mg/mL and 29.3 mg/mL, respectively.
These results showed that the extracts of lemongrass stems were more powerful against
Staphylococcus aureus than turmeric extracts.
69

70
All the results on the MIC and MBC of lemongrass and turmeric are consistent with the
initial results showing the antimicrobial activity (inhibition zone) against the test pathogens. As
with inhibition zone, lemongrass was observed to have a lower MIC and MBC than turmeric
against Staphylococcus aureus strains. This was expected because the bigger the inhibition zones
the lower the MIC and MBC will be. These results are in accordance with most research studies
that have been done where the MIC and MBC of lemongrass are considerably lower ranging
from 0.16-20 µL/mL for most bacteria and 0.25- 10 µL/mL for most fungi (Duke and others
2003; Oussalah and others 2006; Raydaudi-Massilla and others 2006; Shwiertz and others 2006).
Results obtained in this study were in accordance with other research, which shows turmeric start
exhibiting antibacterial activity at 20 mg/mL (Packiyasothy and Kyle 2002). Another study
found that turmeric inhibited some pathogens at a wide range 20-100 µg/mL. This means that the
antimicrobial activity of herbs and spices varies widely, depending on the type of spice or herb,
test medium, and microorganism (Zaika 1988).

Table 4-1. Inhibitory zone (mm) of lemongrass stems extracts (solvent extracts) on bacterial pathogens Solvents and Drying methods Hexane Acetone Ethanol Water Pathogens OD FD OD FD OD FD OD FD Staphylococcus aureus ATCC 12600-U 19 ± 3 12 ± 2 14 ± 4
10 ± 1 0 0 0 0
Staphylococcus aureus ATCC 29247 18 ± 3 10 ± 2 14 ± 3
11 ± 1 0 0 0 0
Staphylococcus aureus ATCC 35548 18 ± 3 8 ± 1.5 15 ± 2
11 ± 2 0 0 0 0
Salmonella Typhimurium 0 0 0 0 0 0 0 0 Salmonella Thompson 0 0 0 0 0 0 0 0 Salmonella Enteritidis 0 0 0 0 0 0 0 0 E. coli O157:H7 204P 0 0 0 0 0 0 0 0 E. coli O157:H7 301C 0 0 0 0 0 0 0 0 E. coli O157:H7 505B 0 0 0 0 0 0 0 0 71
Values presented are averages of replicates of each bacterial strain. OD – Oven dried; FD – Freeze dried

72
Table 4-2. Inhibitory zone (mm) of turmeric (fresh rhizome) extracts (solvent extracts) on bacterial pathogens Solvents and Drying methods Hexane Acetone Ethanol Water Pathogens OD FD OD FD OD FD OD FD Staphylococcus aureus ATCC 12600-U 7 ± 0.5 7 ± 0.5 7 ± 0.5 8 ± 0.5 7 ± 0.5 7.5 ± 0.5 0 0 Staphylococcus aureus ATCC 29247 7.5 ± 0.5 9 ± 0.5 7 ± 0.5 8.5 ± 0.5 7 ± 0.5 7 ± 0.5 0 0 Staphylococcus aureus ATCC 35548 7 ± 0.5 7 ± 0.5 7 ± 0.5 8.5 ± 0.5 7 ± 0.5 7 ± 0.5 0 0 Salmonella Typhimurium 0 0 0 0 0 0 0 0 Salmonella Thompson 0 0 0 0 0 0 0 0 Salmonella Enteritidis 0 0 0 0 0 0 0 0 E. coli O157:H7 204P 0 0 0 0 0 0 0 0 E. coli O157:H7 301C 0 0 0 0 0 0 0 0 E. coli O157:H7 505B 0 0 0 0 0 0 0 0
Values presented are averages of replicates of each bacterial strain. OD – Oven dried; FD – Freeze dried

Table 4-3. Inhibitory zone (mm) of turmeric (dried powder) extracts (solvent extracts) on bacterial pathogens
Solvents Pathogens Hexane Acetone Ethanol Water Staphylococcus aureus ATCC 12600-U 8.5 ± 0.5 8.5 ± 0.5 9 ± 0.5 0 Staphylococcus aureus ATCC 29247 7.5 ± 0.5 9.5 ± 0.5 8.5 ± 0.5 0 Staphylococcus aureus ATCC 35548 8.5 ± 0.5 9 ± 0.5 9.5 ± 0.5 0 Salmonella Typhimurium 0 0 0 0 Salmonella Thompson 0 0 0 0 Salmonella Enteritidis 0 0 0 0 E. coli O157:H7 204P 0 0 0 0 E. coli O157:H7 301C 0 0 0 0 E. coli O157:H7 505B 0 0 0 0
Values presented are averages of replicates of each bacterial strain.
73

74
Table 4-4. Overall comparison of solvents, drying methods, and harvest-time for lemongrass
stem. Variables Lemongrass
Zone (mm) MIC (mg/mL) MBC (mg/mL)
Harvest time 1 (October) 12.3 B 4.0 A 6.9 A 2 (November) 15.2 A 2.0 B 3.5 B
Pathogens Staphylococcus aureus ATCC 12600-U 14.1 A 3.3 A 5.9 A Staphylococcus aureus ATCC 29247 13.8 A 2.6 A 4.2 B Staphylococcus aureus ATCC 35548 13.2 A 3.1 A 5.6 A Solvent Hexane 13.7 A 2.3 B 4.9 A Acetone 13.7 A 3.6 A 5.4 A
Drying methods Oven drying 16.3 A 2.2 B 3.3 B Freeze drying 11.2 B 3.0 A 7.1 A
Values presented are averages of three replicates. Values in the same column within each category following different uppercase letters designate a significant difference (Duncan’s multiple range test, P < 0.05).

Table 4-5. Sensitivity of each Staphylococcus aureus strain to lemongrass stem
Staphylococcus aureus ATCC 12600-U
Staphylococcus aureus ATCC 29247 Staphylococcus aureus ATCC 35548
Variables Zone (mm)
MIC (mg/mL)
MBC (mg/mL)
Zone (mm) MIC (mg/mL)
MBC (mg/mL) Zone (mm)
MIC (mg/mL)
MBC (mg/mL)
Harvest time 1 (October) 12.2 B 4.7 A 8.1 A 13.1 B 3.4 A 5.2 A 11.5 B 3.8 A 7.3 A 2 (November) 16.0 A 1.9 B 3.7 B 14.6 A 1.7 B 3.1 B 14.9 A 2.4 B 3.7 B Solvents Acetone 13.3 B 3.3 A 6.7 A 13.9 A 1.6 B 3.3 B 13.9 A 2.1 B 4.8 B Hexane 14.9 A 3.3 A 5.2 B 12.8 B 3.5 A 5.0 A 12.5 B 4.0 A 6.2 A
Drying methods
Oven drying 16.1 A 1.9 B 3.9 B 17.4 A 0.8 B 2.1 B 15.3 A 1.9 B 3.9 B Freeze drying 12.1 B 4.6 A 8.0 A 10.3 B 4.4 A 6.3 A 11.1 B 4.3 A 7.1 A
75
Values presented are averages of three replicates. Values in the same column within each category following different uppercase letters designate a significant difference (Duncan’s multiple range test, P < 0.05).
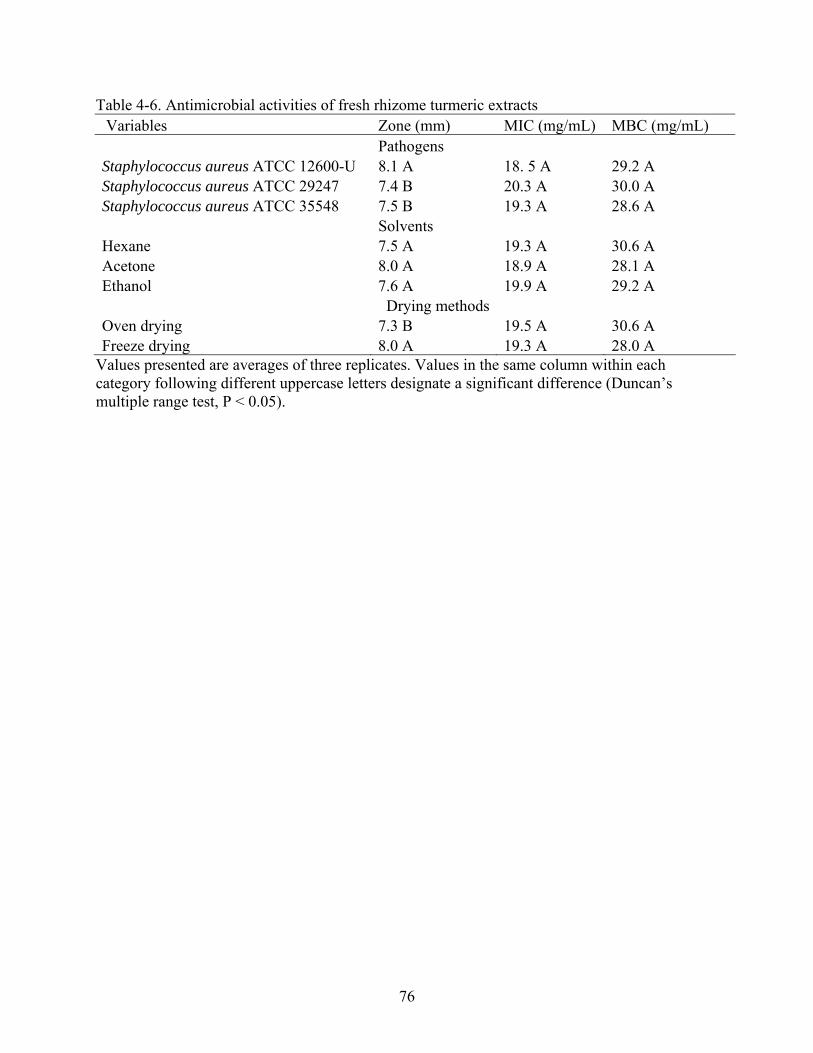
Table 4-6. Antimicrobial activities of fresh rhizome turmeric extracts Variables Zone (mm) MIC (mg/mL) MBC (mg/mL)
Pathogens Staphylococcus aureus ATCC 12600-U 8.1 A 18. 5 A 29.2 A Staphylococcus aureus ATCC 29247 7.4 B 20.3 A 30.0 A Staphylococcus aureus ATCC 35548 7.5 B 19.3 A 28.6 A
Solvents Hexane 7.5 A 19.3 A 30.6 A Acetone 8.0 A 18.9 A 28.1 A Ethanol 7.6 A 19.9 A 29.2 A
Drying methods Oven drying 7.3 B 19.5 A 30.6 A Freeze drying 8.0 A 19.3 A 28.0 A
Values presented are averages of three replicates. Values in the same column within each category following different uppercase letters designate a significant difference (Duncan’s multiple range test, P < 0.05).
76
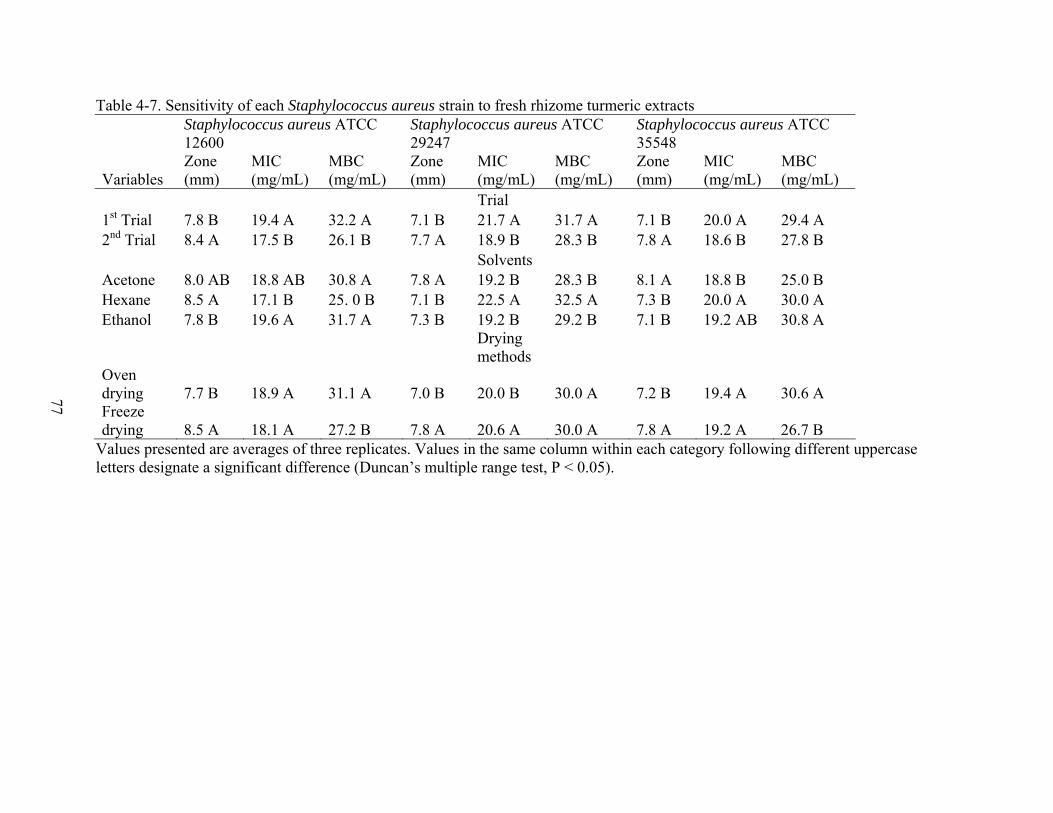
Table 4-7. Sensitivity of each Staphylococcus aureus strain to fresh rhizome turmeric extracts
Staphylococcus aureus ATCC 12600
Staphylococcus aureus ATCC 29247
Staphylococcus aureus ATCC 35548
Variables Zone (mm)
MIC (mg/mL)
MBC (mg/mL)
Zone (mm)
MIC (mg/mL)
MBC (mg/mL)
Zone (mm)
MIC (mg/mL)
MBC (mg/mL)
Trial 1st Trial 7.8 B 19.4 A 32.2 A 7.1 B 21.7 A 31.7 A 7.1 B 20.0 A 29.4 A 2nd Trial 8.4 A 17.5 B 26.1 B 7.7 A 18.9 B 28.3 B 7.8 A 18.6 B 27.8 B Solvents Acetone 8.0 AB 18.8 AB 30.8 A 7.8 A 19.2 B 28.3 B 8.1 A 18.8 B 25.0 B Hexane 8.5 A 17.1 B 25. 0 B 7.1 B 22.5 A 32.5 A 7.3 B 20.0 A 30.0 A Ethanol 7.8 B 19.6 A 31.7 A 7.3 B 19.2 B 29.2 B 7.1 B 19.2 AB 30.8 A
Drying methods
Oven drying 7.7 B 18.9 A 31.1 A 7.0 B 20.0 B 30.0 A 7.2 B 19.4 A 30.6 A Freeze drying 8.5 A 18.1 A 27.2 B 7.8 A 20.6 A 30.0 A 7.8 A 19.2 A 26.7 B
77
Values presented are averages of three replicates. Values in the same column within each category following different uppercase letters designate a significant difference (Duncan’s multiple range test, P < 0.05).

Table 4-8. Antimicrobial activities of dried powder turmeric extracts Variables Zone (mm) MIC (mg/mL) MBC (mg/mL) Pathogens Staphylococcus aureus ATCC 12600-U 8.7 B 19.7 A 31.7 A Staphylococcus aureus ATCC 29247 8.3 C 18.3 B 30.0 A Staphylococcus aureus ATCC 35548 9.0 A 20.3 A 31.7 A Solvents Hexane 8.0 B 26.6 A 40.0 A Acetone 9.1 A 12.5 C 20.0 C Ethanol 8.8 A 19.2 B 33.0 B Values presented are averages of three replicates. Values in the same column within each category following different uppercase letters designate a significant difference (Duncan’s multiple range test, P < 0.05).
78

Table 4-9. Sensitivity of each Staphylococcus aureus strain to dried powder turmeric extracts
Staphylococcus aureus ATCC 12600
Staphylococcus aureus ATCC 29247
Staphylococcus aureus ATCC 35548
Variables Zone (mm)
MIC (mg/mL)
MBC (mg/mL)
Zone (mm)
MIC (mg/mL)
MBC (mg/mL)
Zone (mm)
MIC (mg/mL)
MBC (mg/mL)
Trial 1st Trial 8.5 B 20.6 A 33.3 A 8.0 B 20.0 A 30.0 A 8.8 B 20.6 A 33.3 A 2nd Trial 8.8 A 18.9 A 30.0 B 8.6 A 16.7 B 30.0 A 9.2 A 20.0 B 30.0 B Solvents Acetone 8.8 A 20.0 B 20.0 C 9.3 A 17.5 B 20.0 C 9.3 A 20.0 B 20.0 C Hexane 8.3 A 26.7 A 40.0 A 7.2 C 25.0 A 40.0 A 8.6 B 28.3 A 40.0 A Ethanol 8.9 A 12.5 C 35.0 B 8.3 B 15.0 C 30.0 B 9.2 A 12.5 C 35.0 B
Values presented are averages of three replicates. Values in the same column within each category following different uppercase letters designate a significant difference (Duncan’s multiple range test, P < 0.05).
79
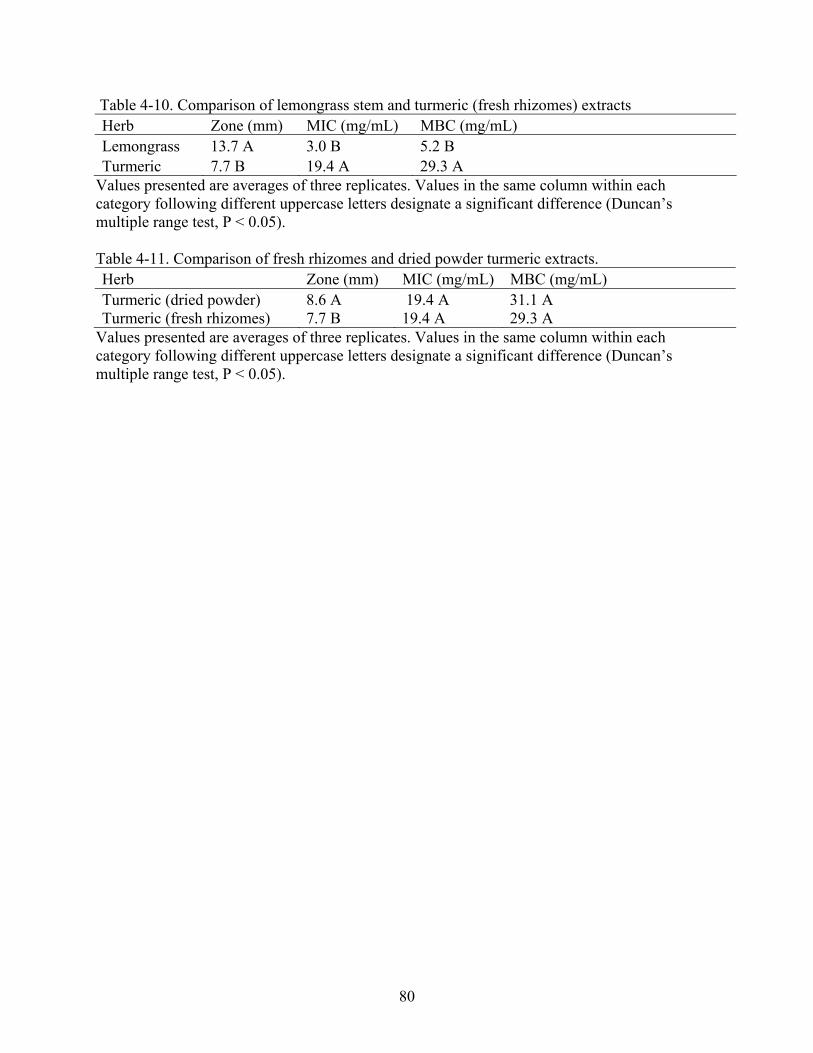
Table 4-10. Comparison of lemongrass stem and turmeric (fresh rhizomes) extracts Herb Zone (mm) MIC (mg/mL) MBC (mg/mL) Lemongrass 13.7 A 3.0 B 5.2 B Turmeric 7.7 B 19.4 A 29.3 A
Values presented are averages of three replicates. Values in the same column within each category following different uppercase letters designate a significant difference (Duncan’s multiple range test, P < 0.05). Table 4-11. Comparison of fresh rhizomes and dried powder turmeric extracts. Herb Zone (mm) MIC (mg/mL) MBC (mg/mL) Turmeric (dried powder) 8.6 A 19.4 A 31.1 A Turmeric (fresh rhizomes) 7.7 B 19.4 A 29.3 A
Values presented are averages of three replicates. Values in the same column within each category following different uppercase letters designate a significant difference (Duncan’s multiple range test, P < 0.05).
80
CHAPTER 5 SUMMARY AND CONCLUSSION
Lemongrass stem and turmeric (fresh rhizomes and dried powder) extracts showed
antimicrobial properties against Staphylococcus aureus strains used in this study. Lemongrass
stems showed antimicrobial properties only when acetone and hexane were used as extraction
solvents. Oven dried extracts of lemongrass stems gave a greater antimicrobial activity than that
of the freeze dried extracts. Both hexane and acetone extracts of lemongrass stem had a
considerable amount of antimicrobial activity. Lemongrass harvested in November had higher
antimicrobial properties than that from October harvest.
Turmeric showed antimicrobial properties when acetone, hexane and ethanol were used as
solvents for the extraction. Difference in the solvents performance could be attributable to their
properties. Dried powder and fresh rhizome turmeric extracts did not show any differences on
the antimicrobial activity regardless of the solvents and drying methods used in this study.
Turmeric had less antimicrobial action compared to lemongrass. This could be due to the
differences in compounds and the properties in both plants.
Antimicrobial activity of lemongrass and turmeric could be greatly affected by the solvents
used to extracts the plants. Drying methods could also affect the antimicrobial activity of plants
such as lemongrass. Turmeric whether purchased in fresh or dry form could provide the same
effect of antimicrobial activity against Staphylococcus aureus, therefore obtaining either one of
them would not make a difference. Lemongrass and turmeric could be potentially used for
controlling Staphylococcus aureus. Even though lemongrass leaves are widely used to make tea,
it was found that they did not have any antimicrobial properties.
Increasing the concentrations of lemongrass and turmeric extracts may be necessary for
antimicrobial activity to be observed in other bacterial pathogens. It might be of interest to study
81

82
other Gram positive bacteria such as Bacillus cereus to determine if the antimicrobial action will
be similar. Studying the compounds extracted from plants by using the different solvents could
also be of interest to determine the important compounds responsible for the antimicrobial
activity of each extract.

APPENDIX A ANALYSIS OF VARIANCE (ANOVA) TABLES: ANTIMICROBIAL ACTIVITY OF LEMONGRASS STEMS
Table A-1. Inhibitory zone of lemongrass stems Sum of Source DF Squares Mean Square F Value Pr > F Model 7 1507.96 215.42 28.34 <.0001 Error 136 1033.83 7.60 Corrected Total 143 2541.78 Source DF Type I SS Mean Square F Value Pr > F Harvest time 1 296.13 296.13 38.96 <.0001 Trial 1 28.00 28.00 3.68 0.0570 Pathogen 2 21.00 10.50 1.38 0.2547 Solvent 1 0.01 0.01 0.00 0.9759 Dry method 1 927.71 927.71 122.04 <.0001 Solvent*Dry method 1 235.11 235.11 30.93 <.0001 Table A-2. Minimum Inhibitory Concentration (MIC) of lemongrass stem Sum of Source DF Squares Mean Square F Value Pr > F Model 7 784.37 112.05 31.70 <.0001 Error 136 480.68 3.53 Corrected Total 143 1265.06 Source DF Type I SS Mean Square F Value Pr > F Harvest time 1 138.56 138.56 39.20 <.0001 Trial 1 13.69 13.69 3.87 0.0511 Pathogen 2 11.99 5.99 1.70 0.1871 Solvent 1 58.86 58.86 16.65 <.0001 Dry method 1 297.37 297.37 84.14 < .0001 Solvent*Dry method 1 263.88 263.88 74.66 <.0001
83

Table A-3. Minimum Bactericidal Concentration (MBC) of lemongrass stem Sum of Source DF Squares Mean Square F Value Pr > F Model 7 1259.70 179.95 43.65 <.0001 Error 136 560.65 4.12 Corrected Total 143 1820.36 Source DF Type I SS Mean Square F Value Pr > F Harvest time 1 408.05 408.05 98.98 <.0001 Trial 1 0.28 0.28 0.07 0.7927 Pathogen 2 80.73 40.36 9.79 0.0001 Solvent 1 10.88 10.88 2.64 0.1065 Dry method 1 532.47 532.47 129.16 <.0001 Solvent*Dry method 1 227.26 227.26 55.13 <.0001
84

Table A-4. Inhibitory zone of lemongrass stems against Staphylococcus aureus ATCC 12600-U Sum of Source DF Squares Mean Square F Value Pr > F Model 5 521.53 104.30 16.50 <.0001 Error 42 265.46 6.32 Corrected Total 47 786.99
Source DF Type I SS Mean Square F Value Pr > F Harvest time 1 167.81 167.81 26.55 <.0001 Trial 1 25.15 25.15 3.98 0.0525 Solvent 1 31.28 31.28 4.95 0.0315 Dry method 1 193.00 193.00 30.54 <.0001 Solvent*Dry method 1 104.28 104.28 16.50 0.0002
85

Table A-5. Minimum Inhibitory Concentration (MIC) of lemongrass stem against Staphylococcus aureus ATCC 12600-U
Sum of Source DF Squares Mean Square F Value Pr > F Model 5 322.91 64.5827367 21.96 <.0001 Error 42 123.49 2.9403678 Corrected Total 47 446.40 Source DF Type I SS Mean Square F Value Pr > F Harvest time 1 93.99 93.99 31.97 <.0001 Trial 1 14.10 14.10 4.80 0.0341 Solvent 1 0.00 0.00 0.00 0.9700 Dry method 1 89.51 89.51 30.44 <.0001 Solvent*Dry method 1 125.29 125.29 42.61 <.0001 Table A-6. Minimum Bactericidal Concentration (MBC) of lemongrass stem against
Staphylococcus aureus ATCC 12600-U Sum of Source DF Squares Mean Square F Value Pr > F Model 5 568.41 113.68 37.55 <.0001 Error 42 127.16 3.02 Corrected Total 47 695.58 Source DF Type I SS Mean Square F Value Pr > F Harvest time 1 235.89 235.89 77.91 <.0001 Trial 1 0.75 0.75 0.25 0.6213 Solvent 1 24.66 24.66 8.15 0.0067 Dry method 1 203.81 203.81 67.32 <.0001 Solvent*Dry method 1 103.28 103.28 34.11 <.0001
86

Table A-7. Inhibitory zone of lemongrass stems against Staphylococcus aureus ATCC 29247 Sum of Source DF Squares Mean Square F Value Pr > F Model 5 686.25 137.25 41.35 <.0001 Error 42 139.41 3.31 Corrected Total 47 825.66 Source DF Type I SS Mean Square F Value Pr > F Harvest time 1 25.52 25.52 7.69 0.0083 Trial 1 0.19 0.19 0.06 0.8133 Solvent 1 0.19 0.19 0.06 0.8133 Dry method 1 595.02 595.02 179.25 <.0001 Solvent*Dry method 1 65.33 65.33 19.68 <.0001 Table A-8. Minimum Inhibitory Concentration (MIC) of lemongrass stem against
Staphylococcus aureus ATCC 29247 Sum of Source DF Squares Mean Square F Value Pr > F Model 5 343.14 68.62 18.93 <.0001 Error 42 152.30 3.62 Corrected Total 47 495.45 Source DF Type I SS Mean Square F Value Pr > F Harvest time 1 33.85 33.85 9.33 0.0039 Trial 1 2.40 2.40 0.66 0.4198 Solvent 1 43.56 43.56 12.01 0.0012 Dry method 1 151.47 151.48 41.77 <.0001 Solvent*Dry method 1 111.84 111.84 30.84 <.0001
87

Table A-9. Minimum Bactericidal Concentration (MBC) of lemongrass stem against
Staphylococcus aureus ATCC 29247 Sum of Source DF Squares Mean Square F Value Pr > F Model 5 393.90 78.78 27.03 <.0001 Error 42 122.42 2.914 Corrected Total 47 516.33 Source DF Type I SS Mean Square F Value Pr > F Harvest time 1 51.57 51.57 17.69 0.0001 Trial 1 5.64 5.64 1.94 0.1713 Solvent 1 33.74 33.74 11.58 0.0015 Dry method 1 211.49 211.49 72.56 <.0001 Solvent*Dry method 1 91.45 91.45 31.37 <.0001
88

Table A-10. Inhibitory zone of lemongrass stems against Staphylococcus aureus ATCC A35548 Sum of Source DF Squares Mean Square F Value Pr > F Model 5 463.04 92.6096354 8.74 <.0001 Error 42 445.07 10.5970362 Corrected Total 47 908.12 Source DF Type I SS Mean Square F Value Pr > F Harvest time 1 139.23 139.23 13.14 0.0008 Trial 1 21.00 21.00 1.98 0.1666 Solvent 1 25.15 25.15 2.37 0.1309 Dry method 1 209.37 209.37 19.76 <.0001 Solvent*Dry method 1 68.28 68.28 6.44 0.0149 Table A-11. Minimum Inhibitory Concentration (MIC) of lemongrass stem against
Staphylococcus aureus ATCC A35548 Sum of Source DF Squares Mean Square F Value Pr > F Model 5 191.45 38.29 13.43 <.0001 Error 42 119.73 2.85 Corrected Total 47 311.19 Source DF Type I SS Mean Square F Value Pr > F Harvest time 1 23.76 23.76 8.34 0.0061 Trial 1 17.68 17.68 6.20 0.0168 Solvent 1 43.86 43.86 15.39 0.0003 Dry method 1 65.60 65.60 23.01 <.0001 Solvent*Dry method 1 40.54 40.54 14.22 0.0005
89

90
Table A-12. Minimum Bactericidal Concentration (MBC) of lemongrass stem against
Staphylococcus aureus ATCC A35548 Sum of Source DF Squares Mean Square F Value Pr > F Model 5 349.69 69.93 16.50 <.0001 Error 42 178.02 4.23 Corrected Total 47 527.71 Source DF Type I SS Mean Square F Value Pr > F Harvest time 1 154.94 154.94 36.55 <.0001 Trial 1 5.93 5.93 1.40 0.2433 Solvent 1 23.74 23.74 5.60 0.0226 Dry method 1 124.29 124.29 29.32 <.0001 Solvent*Dry method 1 40.77 40.77 9.62 0.0034

APPENDIX B ANALYSIS OF VARIANCE (ANOVA) TABLES: ANTIMICROBIAL ACTIVITY OF
TURMERIC (FRESH RHIZOMES)
Table B-1. Inhibitory zone of turmeric (fresh rhizomes) Sum of Source DF Squares Mean Square F Value Pr > F Model 8 90.99 11.37 39.11 <.0001 Error 207 60.21 0.29 Corrected Total 215 151.20 Source DF Type I SS Mean Square F Value Pr > F Trial 1 19.56 19.56 67.25 <.0001 Pathogen 2 21.67 10.83 37.26 <.0001 Solvent 2 10.64 5.32 18.30 <.0001 Dry method 1 29.62 29.62 101.86 <.0001 Solvent*dry method 2 9.48 4.74 16.31 <.0001 Table B-2. Minimum Inhibitory Concentration (MIC) of turmeric (fresh rhizomes) Sum of Source DF Squares Mean Square F Value Pr > F Model 8 462.03 57.754630 8.87 <.0001 Error 207 1347.22 6.508320 Corrected Total 215 1809.25 Source DF Type I SS Mean Square F Value Pr > F Trial 1 224.07 224.07 34.43 <.0001 Pathogen 2 117.59 58.79 9.03 0.0002 Solvent 2 34.25 17.12 2.63 0.0743 Dry method 1 1.85 1.8518 0.28 0.5943 Solvent*dry method 2 84.25 42.12 6.47 0.0019 Table B-3. Minimum Bactericidal Concentration (MBC) of turmeric (fresh rhizomes) Sum of Source DF Squares Mean Square F Value Pr > F Model 8 1959.25 244.90 12.93 <.0001 Error 207 3922.22 18.94 Corrected Total 215 5881.48 Source DF Type I SS Mean Square F Value Pr > F Trial 1 740.74 740.74 39.09 <.0001 Pathogen 2 70.370 35.18 1.86 0.1587 Solvent 2 225.92 112.96 5.96 0.0030 Dry method 1 362.96 362.96 19.16 <.0001 Solvent*dry method 2 559.25 279.62 14.76 <.0001
91
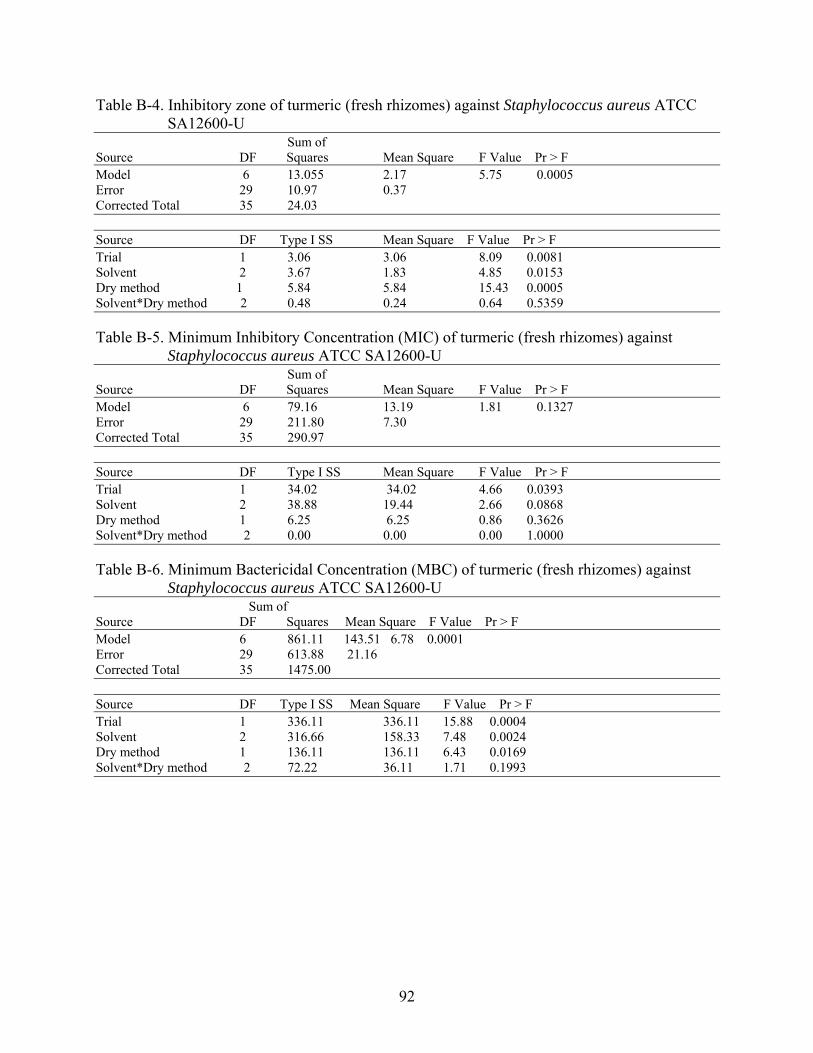
Table B-4. Inhibitory zone of turmeric (fresh rhizomes) against Staphylococcus aureus ATCC SA12600-U
Sum of Source DF Squares Mean Square F Value Pr > F Model 6 13.055 2.17 5.75 0.0005 Error 29 10.97 0.37 Corrected Total 35 24.03 Source DF Type I SS Mean Square F Value Pr > F Trial 1 3.06 3.06 8.09 0.0081 Solvent 2 3.67 1.83 4.85 0.0153 Dry method 1 5.84 5.84 15.43 0.0005 Solvent*Dry method 2 0.48 0.24 0.64 0.5359 Table B-5. Minimum Inhibitory Concentration (MIC) of turmeric (fresh rhizomes) against
Staphylococcus aureus ATCC SA12600-U Sum of Source DF Squares Mean Square F Value Pr > F Model 6 79.16 13.19 1.81 0.1327 Error 29 211.80 7.30 Corrected Total 35 290.97 Source DF Type I SS Mean Square F Value Pr > F Trial 1 34.02 34.02 4.66 0.0393 Solvent 2 38.88 19.44 2.66 0.0868 Dry method 1 6.25 6.25 0.86 0.3626 Solvent*Dry method 2 0.00 0.00 0.00 1.0000 Table B-6. Minimum Bactericidal Concentration (MBC) of turmeric (fresh rhizomes) against
Staphylococcus aureus ATCC SA12600-U Sum of Source DF Squares Mean Square F Value Pr > F Model 6 861.11 143.51 6.78 0.0001 Error 29 613.88 21.16 Corrected Total 35 1475.00 Source DF Type I SS Mean Square F Value Pr > F Trial 1 336.11 336.11 15.88 0.0004 Solvent 2 316.66 158.33 7.48 0.0024 Dry method 1 136.11 136.11 6.43 0.0169 Solvent*Dry method 2 72.22 36.11 1.71 0.1993
92

Table B-7. Inhibitory zone of turmeric (fresh rhizomes) against Staphylococcus aureus ATCC SA29247
Sum of Source DF Squares Mean Square F Value Pr > F Model 6 12.83 2.14 13.87 <.0001 Error 29 4.47 0.15 Corrected Total 35 17.31 Source DF Type I SS Mean Square F Value Pr > F Trial 1 2.64 2.64062500 17.12 0.0003 Solvent 2 3.14 1.57465278 10.21 0.0004 Dry method 1 6.46 6.46006944 41.87 <.0001 Solvent*Dry method 2 0.58 0.29340278 1.90 0.1675 Table B-8. Minimum Inhibitory Concentration (MIC) of turmeric (fresh rhizomes)
Staphylococcus aureus ATCC SA29247 Sum of Source DF Squares Mean Square F Value Pr > F Model 6 250.00 41.66 6.13 0.0003 Error 29 197.22 6.80 Corrected Total 35 447.22 Source DF Type I SS Mean Square F Value Pr > F Trial 1 69.44 69.44 10.21 0.0034 Solvent 2 88.88 44.44 6.54 0.0045 Dry method 1 2.77 2.77 0.41 0.5278 Solvent*Dry method 2 88.88 44.44 6.54 0.0045
93

Table B-9. Minimum Bactericidal Concentration (MBC) of turmeric (fresh rhizomes)
Staphylococcus aureus ATCC SA29247 Sum of Source DF Squares Mean Square F Value Pr > F Model 6 333.33 55.55 6.04 0.0003 Error 29 266.66 9.19 Corrected Total 35 600.00 Source DF Type I SS Mean Square F Value Pr > F Trial 1 100.00 100.00 10.88 0.0026 Solvent 2 116.66 58.33 6.34 0.0052 Dry method 1 0.00 0.00 0.00 1.0000 Solvent*Dry method 2 116.66 58.33 6.34 0.0052
94
Table B-10. Inhibitory zone of turmeric (fresh rhizomes) against Staphylococcus aureus ATCC 35548
Sum of Source DF Squares Mean Square F Value Pr > F Model 6 19.51 3.25 24.16 <.0001 Error 29 3.90 0.13 Corrected Total 35 23.42 Source DF Type I SS Mean Square F Value Pr > F Trial 1 4.16 4.16 30.96 <.0001 Solvent 2 6.50 3.25 24.14 <.0001 Dry method 1 2.91 2.91 21.68 <.0001 Solvent*Dry method 2 5.93 2.96 22.02 <.0001
Table B-11. Minimum Inhibitory Concentration (MIC) of turmeric (fresh rhizomes) against
Staphylococcus aureus ATCC 35548 Sum of Source DF Squares Mean Square F Value Pr > F Model 6 54.16 9.03 4.90 0.0014 Error 29 53.47 1.84 Corrected Total 35 107.63 Source DF Type I SS Mean Square F Value Pr > F Trial 1 17.36 17.36 9.42 0.0046 Solvent 2 9.72 4.86 2.64 0.0887 Dry method 1 0.69 0.69 0.38 0.5442 Solvent*Dry method 2 26.38 13.19 7.16 0.0030
Table B-12. Minimum Bactericidal Concentration (MBC) of turmeric (fresh rhizomes) against
Staphylococcus aureus ATCC 35548 Sum of Source DF Squares Mean Square F Value Pr > F Model 6 572.22 95.37 10.71 <.0001 Error 29 258.33 8.91 Corrected Total 35 830.55 Source DF Type I SS Mean Square F Value Pr > F Trial 1 25.00 25.00 2.81 0.1046 Solvent 2 238.88 119.44 13.41 <.0001 Dry method 1 136.11 136.11 15.28 0.0005 Solvent*Dry method 2 172.22 86.11 9.67 0.0006
95
APPENDIX C ANALYSIS OF VARIANCE (ANOVA) TABLES: ANTIMICROBIAL ACTIVITY OF
TURMERIC (DRIED POWDER)
Table C-1. Inhibitory zone of turmeric (dried powder) Sum of Source DF Squares Mean Square F Value Pr > F Model 5 38.78 7.75 44.88 <.0001 Error 102 17.62 0.17 Corrected Total 107 56.41 Source DF Type I SS Mean Square F Value Pr > F Trial 1 4.89 4.89 28.34 <.0001 Pathogen 2 10.16 5.08 29.41 <.0001 Solvent 2 23.72 11.86 68.62 <.0001 Table C-2. Minimum Inhibitory Concentration (MIC) of turmeric (dried powder) Sum of Source DF Squares Mean Square F Value Pr > F Model 5 3781.48 756.29 78.30 <.0001 Error 102 985.18 9.6586 Corrected Total 107 4766.67 Source DF Type I SS Mean Square F Value Pr > F Trial 1 92.59 92.59 9.59 0.0025 Pathogen 2 72.22 36.11 3.74 0.0271 Solvent 2 3616.66 1808.33 187.22 <.0001 Table C-3. Minimum Bactericidal Concentration (MBC) of turmeric (dried powder) Sum of Source DF Squares Mean Square F Value Pr > F Model 5 7666.67 1533.33 260.67 <.0001 Error 102 600.00 5.88 Corrected Total 107 8266.67 Source DF Type I SS Mean Square F Value Pr > F Trial 1 133.33 133.33 22.67 <.0001 Pathogen 2 66.67 33.33 5.67 0.0046 Solvent 2 7466.67 3733.33 634.67 <.0001
96

Table C-4. Inhibitory zone of turmeric (dried powder) against Staphylococcus aureus ATCC 12600-U
Sum of Source DF Squares Mean Square F Value Pr > F Model 3 4.17 1.38 15.69 <.0001 Error 32 2.83 0.08 Corrected Total 35 7.00 Source DF Type I SS Mean Square F Value Pr > F Trial 1 1.00 1.00 11.29 0.0020 Solvent 2 3.17 1.58 17.88 <.0001 Table C-5. Minimum Inhibitory Concentration (MIC) of turmeric (dried powder) against
Staphylococcus aureus ATCC 12600-U Sum of Source DF Squares Mean Square F Value Pr > F Model 3 1230.55 410.18 41.45 <.0001 Error 32 316.66 9.89 Corrected Total 35 1547.22 Source DF Type I SS Mean Square F Value Pr > F Trial 1 25.00 25.00 2.53 0.1218 Solvent 2 1205.55 602.77 60.91 <.0001 Table C-6. Minimum Bactericidal Concentration (MBC) of turmeric (dried powder) against
Staphylococcus aureus ATCC 12600-U Sum of Source DF Squares Mean Square F Value Pr > F Model 3 2700.00 900.00 144.00 <.0001 Error 32 200.00 6.25 Corrected Total 35 2900.00 Source DF Type I SS Mean Square F Value Pr > F Trial 1 100.00 100.00 16.00 0.0004 Solvent 2 2600.00 1300.00 208.00 <.0001
97

Table C-7. Inhibitory zone of turmeric (dried powder) against Staphylococcus aureus ATCC 29247
Sum of Source DF Squares Mean Square F Value Pr > F Model 3 29.52 9.84 115.70 <.0001 Error 32 2.72 0.08 Corrected Total 35 32.25 Source DF Type I SS Mean Square F Value Pr > F Trial 1 3.36 3.36 39.51 <.0001 Solvent 2 26.17 13.08 153.80 <.0001 Table C-8. Minimum Inhibitory Concentration (MIC) of turmeric (dried powder) Staphylococcus
aureus ATCC 29247 Sum of Source DF Squares Mean Square F Value Pr > F Model 3 1050.00 350.00 32.00 <.0001 Error 32 350.00 10.93 Corrected Total 35 1400.00 Source DF Type I SS Mean Square F Value Pr > F Trial 1 100.00 100.00 9.14 0.0049 Solvent 2 950.00 475.00 43.43 <.0001 Table C-9. Minimum Bactericidal Concentration (MBC) of turmeric (dried powder)
Staphylococcus aureus ATCC 29247 Sum of Source DF Squares Mean Square F Value Pr > F Model 3 2400.00 800.00 Infty <.0001 Error 32 0.00 0.00 Corrected Total 35 2400.00 Source DF Type I SS Mean Square F Value Pr > F Trial 1 0.00 0.00 . . Solvent 2 2400.00 1200.00 Infty <.0001
98

99
Table C-10. Inhibitory zone of turmeric (dried powder) against Staphylococcus aureus ATCC 35548
Sum of Source DF Squares Mean Square F Value Pr > F Model 3 4.16 1.38 15.69 <.0001 Error 32 2.83 0.08 Corrected Total 35 7.00 Source DF Type I SS Mean Square F Value Pr > F Trial 1 1.00 1.00 11.29 0.0020 Solvent 2 3.16 1.58 17.88 <.0001 Table C-11. Minimum Inhibitory Concentration (MIC) of turmeric (dried powder) against
Staphylococcus aureus ATCC 35548 Sum of Source DF Squares Mean Square F Value Pr > F Model 3 1508.33 502.77 67.35 <.0001 Error 32 238.88 7.46 Corrected Total 35 1747.22 Source DF Type I SS Mean Square F Value Pr > F Trial 1 2.77 2.77 0.37 0.5462 Solvent 2 1505.55 752.77 100.84 <.0001 Table C-12. Minimum Bactericidal Concentration (MBC) of turmeric (dried powder) against
Staphylococcus aureus ATCC 35548 Sum of Source DF Squares Mean Square F Value Pr > F Model 3 2700.00 900.00 144.00 <.0001 Error 32 200.00 6.25 Corrected Total 35 2900.00 Source DF Type I SS Mean Square F Value Pr > F Trial 1 100.00 100.00 16.00 0.0004 Solvent 2 2600.00 1300.00 208.00 <.0001

LIST OF REFERENCES
Abascal K, Ganoral L, Yarnell E. 2005. The effect of freeze-drying and its implications for botanical medicine: A review. Phytother. Res.; 19(8):655-660
Akin-Osanaiye BC, Agbaji AS, Dakare MA. 2007. Antimicrobial activity of oils and extracts of Cymbopogon citratus (Lemon grass), Eucalyptus citriodora and Eucalyptus camaldulensis, J. Med Sci., 7(4): 694-697.
Afolayan AJ and Aliero AA. 2006. Antimicrobial activity of Solanum tomentosum. Afri. J. Biotechnol., 5(4): 369-372
Archer DL, Kvenberg JE. 1985. Incidence and cost of foodborne diarrheal disease in the United States. J. Food Protect., 48: 887-894.
Asami DK, Hong YJ, Barrett DM, and Mitchell AE.2003. Comparison of the total phenolic and ascorbic acid content of freeze-dried and air-dried marionberry, strawberry, and corn grown using conventional, organic, and sustainable agricultural practices. J. Agric. Food Chem. 51: 1237-1241
Badmaev V, Majeed M, Prakash L. 2004. Curcuminoids: bioactive compounds from turmeric. Sabinsa Corporation, 2.
Baratta MT, Dorman HJD, Deans SD, Figueiredo AC, Barroso JG, Ruberto G. 1998. Antimicrobial and antioxidant properties of some commercial essential oils. J. Flavor and Fragar., 13(4): 235-244.
Beattie S. 2006. Common foodborne pathogens. Consumer and Processing Food Safety and Science, Iowa State University, USA http://www.extension.iastate.edu/foodsafety/pathogens/index.cfm
Bennet J, Holmberg S, Rogers M, Solomon S. 1987. Infectious and parasitic diseases. In: Almer R, Dull H, Ed., Closing the gap: the burden of unnecessary illness. New York: Oxford Univ. Press; p 102-114.
Beuchat LR, Golden DA. 1989. Antimicrobial occurring naturally in foods. Food Technol., 43: 134-143.
Billing J, Sherman PW. 1998. Antimicrobial function of spices: why some like it hot. Q. Rev. Biol., 73: 3-49.
Biswas TK, Mukherjee B. 2003. Plant medicines of Indian origin for wound healing activity: A healing review. Int. J. Low. Extrem. Wounds, 2(1): 25-39.
Brennan JG. 1994. Food dehydration a dictionary and guide. CRC Press Oxford: Butterworth-Heinemann, p 137-182.
100

Bryan FL. 1982. Diseases transmitted by foods. Sec. Ed. Atlanta, GA, Centers for Disease Control. http://chppm-www.apgea.army.mil/tsunami/Diseasesfromfood(2).pdf
Buchi Labortechnik AG. 2008. Rotary Evaporators. Buchi Corporation. www.buchi.com
Cameron P, Butler DL, Kinnary K, Monger P, Murgatroyd. 1997. Good Pharmaceutical Freeze-Drying Practice. Interpharm/CRC, Boca, Raton, London New York, Washington D.C. P1-269.
Cappuccino JG, Sherman N. 2005. Microbiology: A laboratory Manual, 7th Ed., Pearson Benjamin Community College, New York, NY, p 13-20.
Casimiri V, Burstein C. 1998.Biosensor for -lactate determination as an index of E. coli number in crude culture medium. J. Analytica Chimica Acta, 361 (1-2): 45-53
Centers for Disease Control and Prevention (CDC). 2005. Foodborne illnesses. Division of Bacterial and Mycotic Diseases. Atlanta, GA.
Chao SC, Young DG, Oberg CJ. 2000. Screening for inhibitory activity of essential oils on selected bacteria, fungi and viruses. J. Essent. Oil. Res.,12(5): 639-649.
Cheremisinoff NP. 2003. Industrial solvents Handbook. Second Edition. Marcel Dekker, Inc. New York.
Conner DE. 1993. Naturally Occurring Compounds. Editors: Davidson PM, Branen AL. Antimicrobials in foods. Second Ed.Marcel Dekker, New York, p 441-468
Cosentino S, Tuberoso CIG, Pisano B, Satta M, Mascia V, Arzedi E, Palmas F. 1999. In-vitro antimicrobial activity and chemical and chemical composition of Sardinian Thymus essential oils. Lett. Appl. Microbiol., 29: 130-135.
Cowan MM. 1999. Plant products as microbial agents. Clinical Microbiol. Rev., 12 (4), 564-582.
Dudman P. 2005. Growing Asian herbs and Spices. ABC North Coast.
Duke JA. 1994. Biologically active compounds in important spices. In spices, herbs and edible fungi, (G. Charalambous, ed.), Elservier, Mew York, p 225-250.
Duke JA, Bogenschutz-Gogwin MJ, duCellier J, Duke PK. 2003. CRC Handbook of medicinal spices. Health and Fitness, p 240-245.
Elloff JN. 1998. Which extract should be used for the screening and isolation of antimicrobial components from plants? J. Entropharmacol., 60(1): 1-8
European Patent. 2006. Microbial formulation comprising essential oils or their derivatives. EP, 1434486.
Food and Drug Administration (FDA/CFSAN). 2007. Bad bug book: Foodborne Pathogenic Microorganisms and natural Toxins Handbook.
101

Fraenkel GS. 1959. The raison d’Etre of secondary plant substances. Science, 129: 1466-1470.
Gescher A, Sharma R, Steward W. 2005. Curcumin: the story so far. Europ. J. Cancer, 41(13): 1955-1968.
Gerald J. 1975. The herbal or general history of plants. Arco Pub. Co., New York, p1-13.
Goel S. 2005. Bioprotective properties of turmeric: An investigation of the antioxidant and antimicrobial activities. J. Young Invest., 16(17): 1-6.
Grag SR, Menon KV. 2003. Spices and herbs- promising antimicrobial agents and natural food preservatives. Haryana Agricultural University Journal of Research: 3(1), 1-6.
Hammer KA, Carson CF, Riley TV. 1999. Antimicrobial activity of essential oils and other plant extracts. Journal of Applied Microbiology: 86(6): 985-990.
Ho JC, S. Chou SK, Chua KJ, Mujumdar AS and Hawlader MNA. 2002. Analytical study of cyclic temperature drying: effect on drying kinetics and product quality. J. Food Engineering, 51 (1): 65-75.
Hughes KV, Wellenberg BJ. 1994. Quality for keeps: Drying foods. DMCA, MU Extension, Columbia, MO.
Hutton W. 2003. Handy pocket Guide to Asian herbs and spices. Tuttle Publishing, Singapore. p 3-64.
Huhtanen CN. 1980. Inhibition of Clostridium botulinum by spice extracts and aliphatic alcohol. J. Food Prot., 43: 195-196.
Julkunen-Titto R, Sorsa S. 2001. Testing the effects of drying methods on willow flavonoids, tannins, and salicylates. J. Chem. Ecol. 27: 779–789.
Kakuta E, Ohshima T, Maeda N. 2006. The antimicrobial effects of essential oils against oral pathogenic microorganisms. Microbiol. Immunol. Infect. Control System, Preliminary Program for IADR General Session and Exhibition.
Karaman I, Sahin F, Gulluce M, Qgutcu H, Sengul M, Adiguzel A. 2003. Antimicrobial activity of aqueous and methanol extracts of Juniperous oxycedrus L. J. Ethnopharmacol, 85: 231-235.
Kasumov and Babaev RI. 1983. Components of the essential oil of lemongrass. Chem. Natural Comp., 19(1): 108.
Kim JM, Marshall MR, Cornell JA, Preston JF, Wei CI. 1995. Antibacterial activity of some essential oil components against five foodborne pathogens. J. Agric. Food Chem., 43: 2839-2845.
102

Kim KJ, Yu HH, Cha JD, Seo SJ, Choi NY, You YO. 2005. Antibacterial activity of Curcuma longa L. against methicillin resistant Staphylococcus aureus. Phytotherapy Res., 19(7): 599-604.
Kotzekidou P, Giannakidis P, Boulamastis A. 2008. Antimicrobial activity of some plant extracts and essential oils against foodborne pathogens in vitro and on the fate of inoculated pathogens in chocolate. J. Food Sci. Technol., 41(1): 119-127.
Laohakunjit N, Kerdchoechuen O, Norajit K. 2007. Antibacterial effect of five Zingiberaceae essential oils. Molecules, 12: 2047-2060.
Lerici CR. 1976. Retention of volatile compounds in a freeze dried model food gel. S TA NU., 6(1): 27-32.
Lis-Balchin M, Deans SG. 1997. Bioactivity of selected plant essential oils against Listeria monocytogenes. J. Appl. Microbiol., 82: 759-762.
Maizura M, Fazilah A, Norziah MH, Karim AA. 2007. Antibacterial activity and mechanical properties of partially hydrogenated sago starch-alginate edible film containing lemongrass oil. J. Food Sci., 72(6): 324-330.
Mahanon H, Azizah AH, Dzulkifly MH. 1999. Effect of drying methods on concentrations of several phytochemicals in herbal preparation of 8 medicinal plants leaves. Mal. J. Nutr., 5: 47-54.
Mandeel Q, Hassan A, Isa Z. 2003. Antibacterial activity of certain spice extracts. J. Spice Arom. Crops., 12(2): 146-153.
Mead PS, Slutsker L, Dietz V, McCaig LF, Breese JS, Shapiro C, Griffin PM, Tauxe RV. 1999. Food related illness and death in the United States. Emerg. Infect. Dis. 5: 607-625.
Mejlholm O, Dalgaard P. 2002. Antimicrobial effect of essential oils on the seafood spoilage micro-organism Photobacterium phosphoreum in liquid media and fish products. Lett. Appl. Microbiol., 34 (1): 27–31.
Nail SL, Jiang S, Chongprasert S, Knopp SA. 2002. Fundamentals of freeze drying. Pharm. Biotechnol., 14: 281-360.
Onawunmi, GO. 1989. Evaluation of the antimicrobial activity of citral. Lett. Appl. Microbial., 9: 105-108.
Oonmetta-aree J, Suzuki T, Gasaluck P, Eemkeb G. 2006. Antimicrobial properties and action of galangal (Alpinia galangal Linn.) on Staphylococcus aureus. J. Food Sci. and Technol., 39(10): 1214-1220.
103

Oussalah M, Caillet S, Saucier L, Lacroix M. 2006. Antimicrobial effects of selected essential oils on the growth of a Psuedomonas putida strain isolated from meat. Meat Sci., 73(2): 236-244.
Özcan M, Arslan D, Ünver A. 2005. Effect of drying methods on the mineral content of basil (Ocimum basilicum L.). J. Food Engin., 69(3): 375-379.
Packiyasothy EV, Kyle S. 2002. Antimicrobial properties of some herb essential oils. J. Food Aust., 54(9): 384-387.
Parish ME, Davidson PM. 1993. Methods for evaluation: In Antimicrobials in foods, 2nd Ed. Marcel Dekker, Inc., New York, p 597-615.
Pérez-Coello MS, Díaz-Maroto MC, Cabezudo MD. 2002. Effect of drying method on the volatiles in bay leaf (Laurus nobilis L.). J. Agric. Food Chem., 50 (16): 4520-4524.
Pham M. 2001. Asian herbs: For flavor and for health. HarperCollons Publishers.
Pulford A. 2003. Turmeric root. Health and Fitness: In Homeopathic material medica of graphical drug pictures, p 149-150.
Raybaudi-Massilia RM, Mosqueda-Melgar J, Martin-Belloso O. 2006. Antimicrobial activity of essential oils on Salmonella Enteritidis, Escherichia coli, and Listeria innocula in fruit juices. J. Food Prot., 69(7): 1579-1586.
Reynolds S, Williams P. 1993. So Easy to Preserve. Cooperative Extension Service, The University of Georgia. Revised by Judy Harrison.
Ritenour MA, Sargent SA, bartz JA. 2002. Chlorine use in produce packing lines. HS-761, IFAS Extension, Gainesville, FL; p1-4.
Rojas-Grau M, Avena Bustillos R, Friedman M, Henika P, Martin-Belloso O, McHugh T. 2006. Mechanical barrier and antimicrobial properties of apple puree edible films containing plant essential oils. J. Agric and Food Chem., 54: 9263-9267.
Rojas-Grau M, Olsen C, Avena Bustillos R, Friedman M, Henika P, Martin-Belloso O, Pan Z, McHugh T. 2007. Effects of plant essential oils and oil compounds on mechanical, barrier and antimicrobial properties of alginate-apple purees edible films. J. Food Engin., 81(3): 634-641.
Rojas JJ, Ochoa VJ, Ocampo SA, Muñoz JF. 2006. Screening for antimicrobial activity of ten medicinal plants used in Colombian folkloric medicine: A possible alternative in the treatment of non-nosocomial infections. BMC Complementary and Alternative Medicine, 6(2): 53-108.
104

Russell AD. 1991. Mechanisms of bacterial resistance to non-antibiotics: food additives and food and pharmaceutical preservatives. J. Appl. Microbiol., 71: 191-201.
Sacchetti G, Maietti S. Muzzoli M, Scaglianti M, Manfredini S, Radice M, Bruni R. 2005. Comparative evaluation of 11 essential oils of different origin as functional antioxidants, antiradicals and antimicrobials in foods. J. Food Chem., 91(4): 621-632.
Sagdic O, Ozcan M. 2003. Antibacterial activity of Turkish spice hydrosols. Food Control, 14: 141-143.
Salzer UJ. 1982. Antimicrobial action of some spice extracts and mixtures. Fleischwirtschaft, 62: 885-887.
SAS. 1991. SAS/STAT® User's Guide. 6.04 Ed. SAS Institute, Inc., Cary, NC.
Scheflan L, Jacobs MB. 1953. The handbook of solvents. First Edition. Robert E. Krieger Publishing Co., New York.
Schwiertz A, Duttke C, Hild J, Muller HJ. 2006. In vitro activity of essential oils on microorganisms isolated from vaginal infection. Int. J. Aromath., 16(3-4): 169-174.
Shelef LA, Naglik OA, Bogen DW. 1980. Sensitivity of some common foodborne bacteria to the spices sage, rosemary, and all spice. J. Food Sci., 45: 1042-1044.
Senatore F. 1996. Influence of harvesting time on yield and composition of essential oil of thyme (Thymus pulegioides L.) growing wild in Campania (Southern Italy). J. Agric. Food Chem., 44: 1327-1332.
Shibasaki I. 1982. Food preservation with nontraditional antimicrobial agents. J. Food Saf., 4: 35-58.
Shivani G, Ravishankar S. 2005. Foodborne Pathogens and Disease. A Comparison of the antimicrobial activity of garlic, ginger, carrot, and turmeric pastes against Escherichia coli O157:H7 in laboratory buffer and ground beef. Food Saf. Technol., 2(4): 330-340.
Simon, J.E., A.F. Chadwick and L.E. Craker. 1984. Herbs: An Indexed Bibliography. 1971-1980. The Scientific Literature on Selected Herbs, and Aromatic and Medicinal Plants of the Temperate Zone. Archon Books, 770 pp., Hamden, CT.
Simonne AH, Nille A, Evans K, Marshall, Jr MR. 2004. Ethnic foods safety trends in the United States based on CDC foodborne illness data. Food Prot. Tre., 24(8): 590-604.
Siripongvutikorn S, Thummaratwasik P, Huang Y. 2005. Antimicrobial and antioxidant effects of Thai seasoning, Tom-Yum. J. Food Sci. and Technol., 38(4): 347-352.
105
Smid EJ, Gorris LGM. 1999. Natural antimicrobials for food preservation. In handbook of food preservation; Rahman, MS, Ed.; Marcel Dekker: New York, p285-308.
Todd ECD. 1989. Preliminary estimates of costs of foodborne disease in the United States. J. Food Protect., 52: 595-601.
Uhl S. 2000. Spices: tools for alternative or complementary medicine. Food Technol., 54(5): 61-65.
United States Patent. 2003. Citral acetal. USP, 6506793.
Van Sumere C, Geiger H, Bral D, Fockenier G, Vande Casteele K, Martens M, Hanselaer R, Gevaert L. 1983. Freeze drying and analysis of plant and other biological material. Anal. Biochem., 131(2): 530-532.
Venskutonis PR. 1997. Effect of drying on the volatile constituents of thyme (Thymus vulgaris L.) and sage (Salvia officinalis L.). J. Food Chem.; 59(2):219-227.
Webb G. 1997. Herbs and spices with antioxidant and/or antimicrobial compounds. J. Amer. Botan. Council: 39 p20.
Williams LR, Stockley JK, Yan W, Home VN. 1998. Essential oils with high antimicrobial activity for therapeutic use. Int. J. Aromath., 8(4): 30-40.
Zaika LL. 1988. Spices and Herbs: their antimicrobial activity and its determination. J. Food Saf., 9: 97 – 118.
106

107
BIOGRAPHICAL SKETCH
Thabile Precious Nkambule, daughter of Annah S. Magagula, was born in Mbabane,
Swaziland. She completed her bachelor of science in home economics with a Dean’s Award at
the University of Swaziland (Faculty of Agriculture). Before attending the University of Florida
as a Fulbright Scholar, Thabile worked at UNICEF and REDI (Regional Excellence &
Development Initiative). Thabile also worked as a teacher at Dwalile Central High School in
Swaziland for three years. She taught food and nutrition, home economics, mathematics, and
fashion and fabrics. After finishing her master’s degree in food science, she plans to return to
Swaziland to resume a teaching position at the University of Swaziland (Faculty of Agriculture).