Embed Size (px)
Citation preview

1
Antifouling technologies for coastal pools
and platforms and community responses
Todd Walton
Supervisors:
Professor Peter Steinberg Dr Wendy Shaw Dr Tim Charlton
Submitted in partial fulfilment of the requirements for the degree of Bachelor of Environmental Science, School of Biological, Earth and Environmental Sciences,
Faculty of Science, The University of New South Wales
October 2009
2
Faculty of Science School of Biological, Earth and Environmental Sciences
Honours Thesis Declaration I hereby declare that this submission is my own work and to the best of my knowledge it contains no materials previously published or written by another person, nor material which to a substantial extent has been accepted for the award of any other degree or diploma at UNSW or any other educational institution, except where the acknowledgement is made in the thesis. Any contribution made to the research by others, with whom I have worked at UNSW or elsewhere, is explicitly acknowledged in the thesis. I also declare that the intellectual content of this thesis is the product of my own work, except to the extent that assistance from others in the project's design and conceptions or in style, presentation and linguistic expression is acknowledged. I HAVE submitted a digital copy of this thesis. Word count excluding references, tables and captions: 9150 (Signed)…………………………………………Date………………………. Thesis committee (names, not signatures): Supervisor: Prof Peter Steinberg Co‐supervisors: Dr Wendy Shaw, Dr Tim Charlton Committee: Dr Rob Brander, Dr Jes Sammut I am fully aware that the School retains a copy of the thesis and is free to allow them to be consulted or borrowed. The thesis may be restricted for up to 2 years or longer by a written request to the Head of School.
3
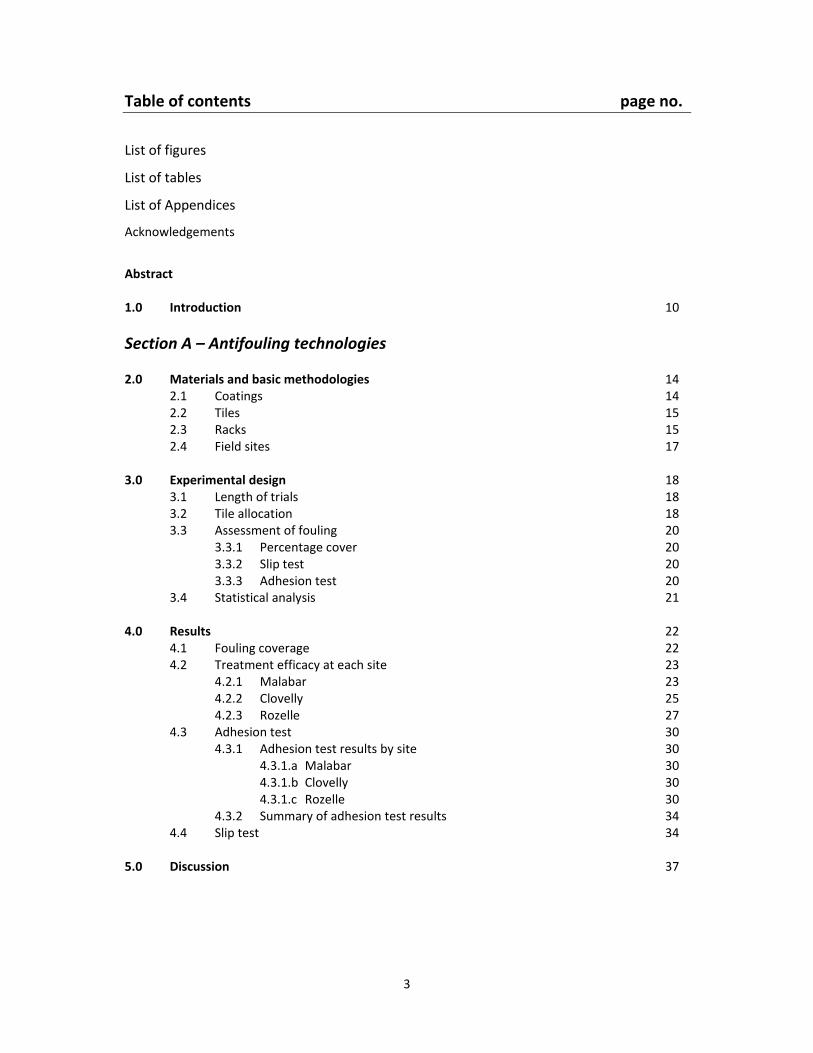
Table of contents page no.
List of figures
List of tables
List of Appendices
Acknowledgements
Abstract 1.0 Introduction 10
Section A – Antifouling technologies 2.0 Materials and basic methodologies 14
2.1 Coatings 14 2.2 Tiles 15 2.3 Racks 15 2.4 Field sites 17
3.0 Experimental design 18
3.1 Length of trials 18 3.2 Tile allocation 18 3.3 Assessment of fouling 20
3.3.1 Percentage cover 20 3.3.2 Slip test 20 3.3.3 Adhesion test 20
3.4 Statistical analysis 21 4.0 Results 22
4.1 Fouling coverage 22 4.2 Treatment efficacy at each site 23
4.2.1 Malabar 23 4.2.2 Clovelly 25 4.2.3 Rozelle 27
4.3 Adhesion test 30 4.3.1 Adhesion test results by site 30
4.3.1.a Malabar 30 4.3.1.b Clovelly 30 4.3.1.c Rozelle 30
4.3.2 Summary of adhesion test results 34 4.4 Slip test 34
5.0 Discussion 37

4
Table of contents page no.
Section B – Community responses 6.0 Survey methodology 40 6.1 Role of survey 40 6.2 Survey design 40 6.3 Questionnaire 41 6.4 Data collection 41 7.0 Results 42 7.1 Age and suburb 42 7.1.1 Age structure 42 7.1.2 Locality of respondents 43 7.2 Ocean pool usage 44 7.3 Hazards associated with ocean pool use 45 7.4 Slip hazard 46 7.5 Council treatment of slippery surfaces 47 7.6 Antifouling of ocean pools 49 7.7 Altered pool usage 50 8.0 Discussion 51 Conclusion 54 Antifouling technologies Community responses References Appendix
5
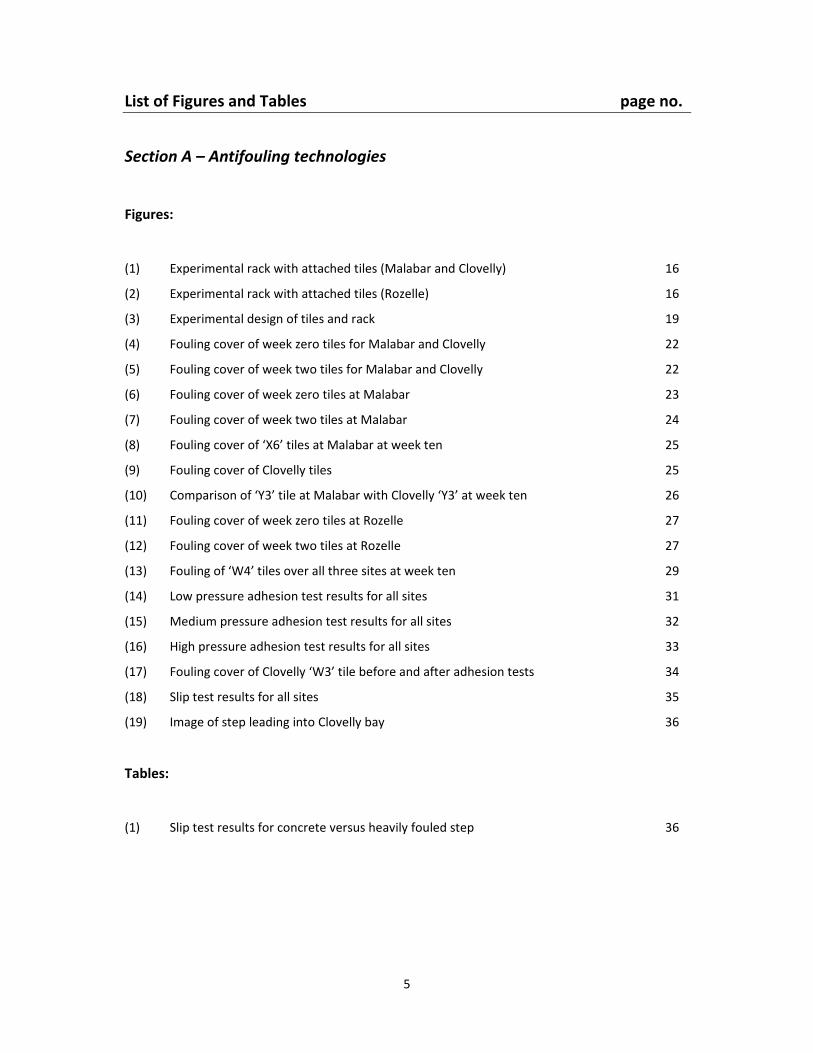
List of Figures and Tables page no.
Section A – Antifouling technologies
Figures:
(1) Experimental rack with attached tiles (Malabar and Clovelly) 16
(2) Experimental rack with attached tiles (Rozelle) 16
(3) Experimental design of tiles and rack 19
(4) Fouling cover of week zero tiles for Malabar and Clovelly 22
(5) Fouling cover of week two tiles for Malabar and Clovelly 22
(6) Fouling cover of week zero tiles at Malabar 23
(7) Fouling cover of week two tiles at Malabar 24
(8) Fouling cover of ‘X6’ tiles at Malabar at week ten 25
(9) Fouling cover of Clovelly tiles 25
(10) Comparison of ‘Y3’ tile at Malabar with Clovelly ‘Y3’ at week ten 26
(11) Fouling cover of week zero tiles at Rozelle 27
(12) Fouling cover of week two tiles at Rozelle 27
(13) Fouling of ‘W4’ tiles over all three sites at week ten 29
(14) Low pressure adhesion test results for all sites 31
(15) Medium pressure adhesion test results for all sites 32
(16) High pressure adhesion test results for all sites 33
(17) Fouling cover of Clovelly ‘W3’ tile before and after adhesion tests 34
(18) Slip test results for all sites 35
(19) Image of step leading into Clovelly bay 36
Tables:
(1) Slip test results for concrete versus heavily fouled step 36
6
List of Figures and Tables page no.
Section B – Community responses
Figures:
(1) Age structure of respondents 42
(2) Location of survey participants within Randwick LGA 43
(3) Frequency of respondent pool usage 44
(4) Respondent awareness of council treatment of fouled surfaces at pool 47
(5) Respondent opinion of council antifouling efficiency 48
(6) Respondent attitude against antifouling coatings at pool 49
Tables:
(1) Respondent rating of pool hazards 45
(2) Summary of respondent rating of pool hazards 45
(3) Incidents impacting respondent use of the pool 50

7
List of Appendices
Section A – Antifouling technologies
A1 Images of experiment treatments
A2 Percent fouling cover (5‐10 weeks)
A3 Adhesion test results
A4 Percent fouling loss due to adhesion test
A5 Slip test results
Section B – Community responses
B1 Letter of approval for survey from Randwick City Council
B2 Letter of approval for survey from UNSW ethics committee
B3 Sample survey
B4 List of respondent suburbs
B5 List of pool hazards (respondent opinion)

8
Acknowledgments
Firstly thanks to my three supervisors, Prof Peter Steinberg for giving me a shot and taking me on as
his honours student, Dr Wendy Shaw for her good advice whenever I needed it and Dr Tim Charlton
for all his time and effort throughout the year.
Thanks heaps to Dr Rebecca Swanson for everything she did. Without Rebecca’s help this thesis
would not have been possible.
Thank you to Alex and Shaun in the post grad room for helping me out with my stats, it was really
appreciated. I also extend my gratitude to Ann and Matt at the BEES office for their help and
patience.
Thanks to all the boys back home for leaving me alone when I asked during the last few weeks of
writing.
Lastly thank you to my family; mum and dad for putting up with me, Jarrod for letting me use the
computer and Nana for being awesome.
Without help and support from everyone mentioned, this year would not have been half as good.

9
Abstract
This study addressed the issues associated with slippery surfaces that result from the growth of
algae around public ocean pools, and the potential for an antifouling paint as a solution. It also
acknowledges the role of public opinion in such matters with the inclusion of results from a
community survey.
Sydney’s Coastal Council’s faces a continual challenge from the settlement and growth of marine
organisms (fouling) on coastal rock pools, platforms, steps and ramps leading into bays and pools.
The challenge arises from public health and safety concerns (and associated council liability) for
bathers who can slip on the fouled surfaces. In this project, eight non‐toxic, near commercially
available antifouling coatings were trialled to find an alternative to the costly and largely inadequate
method of mechanical cleaning currently used at ocean pools. The coatings were each applied to
separate 10cm X 10cm cement tiles and trialled over a ten week period with fouling accumulated
over this time analysed and assessed. The results suggested four coatings displayed potential for
future application, whilst no coating was as yet ready for use on coastal platforms at the conclusion
of this study. Wax coatings on two of the treatments were the most successful with around 50%
fouling coverage after ten weeks of fouling, compared with 80‐90% coverage of controls.
In conjunction with trialling coatings, a social survey of the public was conducted using a
representative sample of stakeholders relevant to the issue of slippery surfaces around ocean pools.
Through use of a questionnaire, pool user attitude was established pertaining to antifouling of ocean
pools as well as the subsequent slip hazard of fouled surfaces. The research was conducted with
approval from Randwick City Council, as the study locations were located within the Randwick Local
Government Area (Malabar rock pool and Clovelly beach). Findings from the study suggest public
opinion is neither significantly for or against the use of environmentally friendly antifouling
alternatives with 79% having no objection, although 76% of respondents acknowledged that the
current method (physical cleaning) is sufficient. Thus, a successful antifouling coating with non‐toxic
properties would likely be accepted by the Randwick community.

10
1.0 Introduction
In most shallow, hard‐bottom marine habitats, sessile life forms dominate the benthic community in
terms of number of individuals and species. These species make up the living component of what is
known as fouling, a process by which free‐living planktonic larva spores or other ‘propagules’ attach
to a substratum (Richmond and Seed, 1991) thereby also creating settlement surfaces for other
epibionts (Wahl, 1989; Richmond and Seed, 1991; Evans, 2000; Railkin, 2004).
All inert surfaces including human‐made structures deployed either deliberately or accidentally into
the sea are subject to levels of biological fouling (Little and Wagner, 1997; Evans, 2000; Hughes et
al., 2005; Afsar, 2008; Ralston and Swain, 2009). Known as biofouling, this process presents
problems for many marine industries and poses a major economic and technical problem worldwide
(Evans, 1988; Lewis, 1994; Abbott et al., 2000; Asfar, 2008). The shipping industry alone spends
billions of dollars a year on cleaning and antifouling of ship’s hulls (Haak, 1996; Asfar, 2008).
The fouling problem is not only confined to the shipping industry but is of major concern for oil and
gas structures, seawater piping systems and in the aquaculture industry where huge monetary
impacts are incurred cleaning and preventing forms of biofouling (Lewis, 1994; Costa‐Pierce and
Bridger, 2002). Lewis (1994 p.32) estimates an approximate annual spending of $800,000 on
structural fouling issues for the Australian salmon industry alone.
Existing commercial technology intended to minimise or control impacts of fouling primarily involves
applying antifouling coatings (Rittschof, 2001) and/or physical cleaning (Gotoh, 2007). The latter
applies particularly where toxin‐based coatings are hazardous to aquaculture, humans or animals
who consume them, but it is labour intensive and costly (Asfar, 2008). The most common and
effective antifouling coating is based on organotin compounds (e.g., tributyltin (TBT)(Champ and

11
Seligman, 1996; Haak, 1996; Abbott et al., 2000)), these however have widely known adverse non‐
target environmental effects (Ralston and Swain, 2009) and the resultant pressure from social and
governmental responses to these negative impacts have resulted in a push to finding less damaging
alternatives (Rittschof, 2001). A ban on TBT coatings was put in place by the International Maritime
Organisation (IMO) effective as of September 2008. Currently, the major active ingredient in
antifouling coatings is copper. Alternative coatings have used zinc or copper based pyrithiones,
which have become two of the biggest selling organic actives in marine antifouling technologies.
Some studies have indicated however, that these too have non‐target effects on marine organisms
(Asfar, 2008). Neither copper nor organic biocides inhibit all potential fouling organisms (Champ and
Seligman, 1996).
As a consequence of the toxic nature of these current antifouling solutions, much research into non‐
toxic, environmentally friendly alternatives has been (Kjelleberg and Holmstrom, 1994; Steinberg
and de Nys, 1995; Rittschof, 2001), and is currently, being undertaken (Ralston and Swain 2009;
Asfar 2008). One strategy involving foul‐release, non‐stick coatings was first introduced in the 1990s
(Callow et al., 2003) provides a promising alternative to current heavy metal based antifouling
coatings (Munn, 2004; Asfar, 2008). Other possible alternatives include wax coatings, surface and/or
coating topography methods and non‐toxic deterrents.
High use public areas such as ocean rock pools are an example of an area in need of an effective
non‐toxic antifouling solution. Pools provide a refuge for coastal fouling organisms against many of
the stresses associated with intertidal living (Hayes, 2007); the resulting communities are of
particular concern when they eventually grow large enough to create a slip hazard. This is of concern
for Local Councils who are required by the Civil Liabilities Act 2002 and under the Local Government
(General) Regulation 2005 to clean public areas of hazards (which include fouling). The current
method used by local authorities primarily involves manual cleaning in the form of a (water) Jet

12
Blaster truck. At the moment there is one truck that services the entire Randwick Council area and is
used to clean other public areas (parks) in addition to coastal platforms/pool access which get
cleaned about once a month. The frequent mechanical cleaning of fouled surfaces costs Sydney’s
coastal councils hundreds of thousands of dollars per annum in labour (Charlton, 2008).
This project has trialled a series of coatings designed to prevent fouling of intermittently wet
concrete surfaces. An antifouling technology in the form of paint or a wax could deter fouling
eliminating or significantly reducing the need for mechanical cleaning of surfaces. There is an
obvious potential to reduce the cost of labour for Sydney’s coastal councils associated with
mechanical cleaning and the maintenance of safe coastal pools and platforms.
As well as being a liability for associated councils in the form of cleaning and compensation, slippery
fouled surfaces form a public health and safety concern. Being a major stakeholder in the issue, it is
relevant to assess public opinion regarding the situation which may entail significant changes. This
was done using qualitative social research methods. Playing a fundamental in better understanding
social structures and individual experiences (McGuirk and O’Neill 2005), qualitative social research is
done through the use of social surveys, and specifically in this research, questionnaire. The most
common method of collecting survey data, questionnaire design involves thinking ahead about the
research problem, what the concepts mean and how to analyses the data (De Vaus, 2002; Hoggart et
al., 2002; McGuirk and O’Neill 2005). Surveys incorporate not just questionnaires, but other
techniques such as in depth‐interviews, observations and content analysis are also used (De Vaus,
2002; Hoggart et al., 2002; Winchester, 2005). There are criticisms on the use and validity of survey
data (Briggs, 1986). However, the key advantage of social surveys, and reason for inclusion in this
study, arises from their ability to obtain broad coverage of populations (Hoggart et al., 2002) with a
much smaller representative sample.

13
Thus in this project two main questions were asked:
1) Are there environmentally benign antifouling coatings which are effective in determining
fouling on coastal platforms, pools, and;
2) What are public attitudes to fouling and the use of antifouling technologies?
The experimental application of a number of non‐toxic antifouling coatings were tested in this study
and their potential as a substitute for mechanical cleaning of coastal ocean pools was assessed. Also
included in this research are the results of a social survey, which investigated community attitudes
towards the possible integration of an antifouling coating onto coastal platforms at Clovelly and
Malabar pools.

14
SECTION A – ANTIFOULING TECHNOLOGY
This section details the trial of antifouling coatings for use on coastal platforms. Firstly the
methodology and experimental design of the trial process, followed by a detailed description of
findings from the trial period. The results are then discussed and recommendations made for further
developing the technology. Community responses are discussed in section B, with overall
conclusions outlined at the end of the thesis.
2.0 Materials and basic methodologies
2.1 Coatings
A number of paint companies were contacted for involvement in the project and a total of eight
antifouling coatings were obtained and used in the field trials. The outsourced paints had to adhere
to a set of guidelines appropriate to the conditions experienced around public‐used coastal
platforms.
‐Coating specifications. These were established by Professor Peter Steinberg, Centre for Marine Bio‐
Innovation, in consultation with the Sydney Coastal Councils Group.
Mandatory:
Prevent fouling for at least 6 months
Non‐slip when wet or dry
(Substantially) Non‐toxic and non‐hazardous to humans and non‐target species
Biocides used must be biodegradable
Secondary (preferred):
Takes less than 2 hours to dry
Cures while exposed to salt spray and water
Can be applied to a wet surface
The paints used were commercial or near‐commercially available. They were water based and any
low toxicity biocides used were, for example used in other products such as anti‐dandruff shampoos
(McDonnell, 2007)), as well as being erodible with particulate material to make them non‐slip. The
coating specifications excluded many standard antifouling coatings because of the actives used or
for other reasons. Generally, standard antifouling paints need to be applied to a dry surface and a
curing time of up to three days is often required. Paints that require standard application procedures

15
in‐situ are not suitable for coastal platform areas that are exposed intermittently at low tide or
constantly wet from spray.
2.2 Tiles
Tiles of sand and cement were used as test plates for the coatings in the field. Making the tiles
involved pouring cement mix in to 10cm x 10cm x 1cm thick moulded plastic trays where they were
left for five to six days to cure.
Due to swell and wave action it was necessary to make the tiles as tough as possible. This was
achieved through reinforcing each tile with aluminium chicken wire cut to fit inside the tiles.
The surface of the tiles were roughened to promote fouling, this was done by putting fly screen in
the mould and removing it after the mix had dried, creating a mesh‐like surface on the tile.
The tiles sent to Company A were prepared differently to the other trials in that they had a smooth
surface as opposed to roughened mesh. In order to rectify this, the painted tiles, before being sent
to Company A, were scratched with a chisel to make the surface more consistent with the tiles
representing the other companies, as can be seen in figure 1.
2.3 Racks
Two types of racks were used as frames to which the coated tiles were attached. These acted as
platforms for the tiles.
Rack type one was a Perspex plate, the biggest of which holds up to nine tiles. The tiles were tied on
using cable ties. Holes in the four corners of each tile were drilled (before being sent away for
coating) and aligning holes were drilled on the plate allowing for the cable ties to hold the block in
place on the mat. The racks were bolted in place at the trial site with ‘Dynabolts’ © hammered into
holes drilled into the concrete surface of the test site.

16
Figure 1. Example of rack laid at Clovelly and Malabar field sites. Scratched company ‘A’ (blue) tiles pictured.
Rack type two was a net of nylon rope reinforced with PVC piping approximately 2m x 1m. The tiles
were held in place with cable ties which were tied through the holes on the tiles and around the
rope netting of the rack. The rack was held in place on location by tying off the corners to a
surrounding pontoon with ropes with buoyancy assisted by empty drink bottles.
Figure 2. Picture of the rack and experimental tiles at Rozelle Bay.

17
2.4 Field Sites
Three field sites were chosen as a representative sample of Sydney’s coastal ocean pools and
platforms.
Clovelly
There are five access points (stairs) that lead into Clovelly bay from the southern promenade. The
access points are stainless steel steps that lead down to a concrete platform that is submerged most
of the time except around low tide. This platform gets heavily fouled with green algae (Ulva spp.)
within one to two weeks of cleaning and becomes extremely slippery and dangerous for bathers.
The experiment was located on the platform at the bottom of the steps leading into the bay directly
opposite Clovelly surf club.
Malabar
Malabar ocean pool has two sets of steps entering the pool in the north east and south east corners
as well as an access ramp in the south east corner. The steps get heavily fouled by a brown
microfouling alga (most likely Porphyra spp.) and can become very slippery after about two weeks of
being cleaned. The site for this trial was located on the third step on the south eastern corner which
is almost always submerged.
Rozelle
The super yacht marina in Rozelle Bay located in Sydney harbour was the location for the third set of
tiles. The rack was placed under the water among the docked yachts and tied off to one of the
pontoons. The harbour location experiences a different and set of foulers, including the barnacles’ B.
variegatea and B. amphirite (Jones, 1992) and the occasional polychaete worm. Trials in the harbour
also made it possible to compare the trial coatings against a toxic, heavy metal based commercial
antifouling paint.
18
3.0 Experimental design
3.1 Length of trials
In order to rule on a coating’s success or failure it had to be subject to conditions under which
fouling is possible. For this, the racks of tiles were left on location for ten weeks from the 22/07/09
to 29/09/09, allowing adequate time for fouling to occur under normal circumstances.
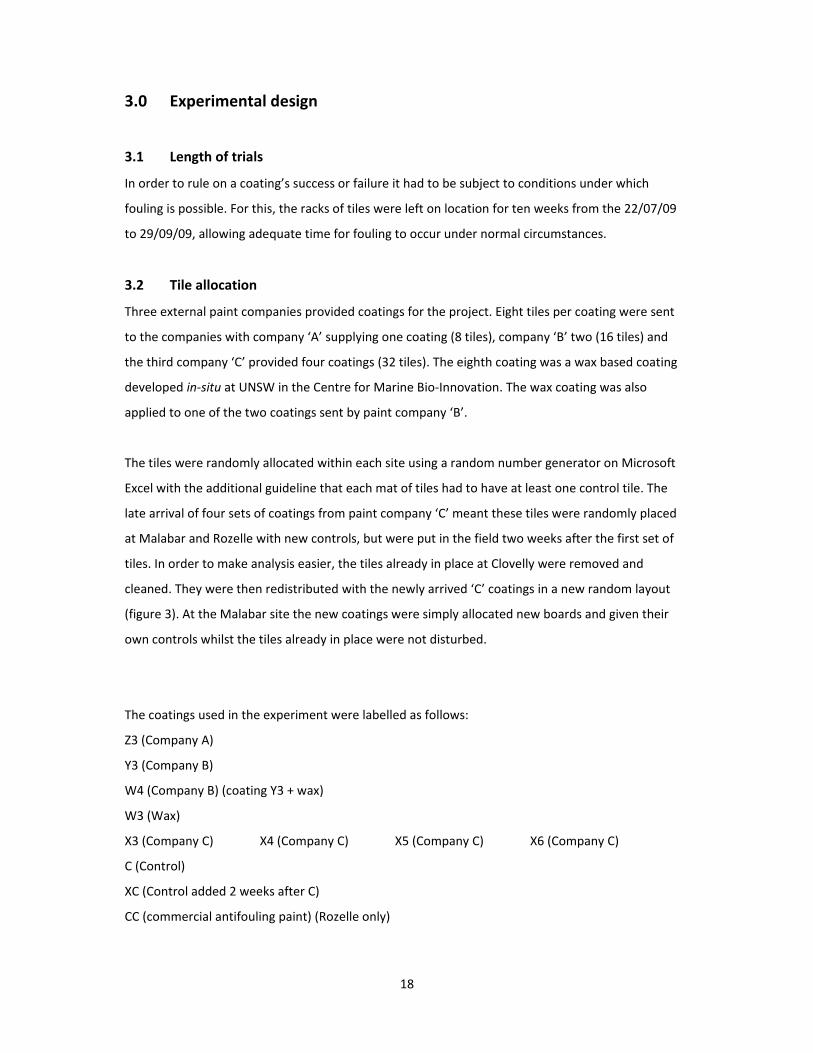
3.2 Tile allocation
Three external paint companies provided coatings for the project. Eight tiles per coating were sent
to the companies with company ‘A’ supplying one coating (8 tiles), company ‘B’ two (16 tiles) and
the third company ‘C’ provided four coatings (32 tiles). The eighth coating was a wax based coating
developed in‐situ at UNSW in the Centre for Marine Bio‐Innovation. The wax coating was also
applied to one of the two coatings sent by paint company ‘B’.
The tiles were randomly allocated within each site using a random number generator on Microsoft
Excel with the additional guideline that each mat of tiles had to have at least one control tile. The
late arrival of four sets of coatings from paint company ‘C’ meant these tiles were randomly placed
at Malabar and Rozelle with new controls, but were put in the field two weeks after the first set of
tiles. In order to make analysis easier, the tiles already in place at Clovelly were removed and
cleaned. They were then redistributed with the newly arrived ‘C’ coatings in a new random layout
(figure 3). At the Malabar site the new coatings were simply allocated new boards and given their
own controls whilst the tiles already in place were not disturbed.
The coatings used in the experiment were labelled as follows:
Z3 (Company A)
Y3 (Company B)
W4 (Company B) (coating Y3 + wax)
W3 (Wax)
X3 (Company C) X4 (Company C) X5 (Company C) X6 (Company C)
C (Control)
XC (Control added 2 weeks after C)
CC (commercial antifouling paint) (Rozelle only)

19
The layout of the different treatments was:
Malabar
Board 1 Board 2
Board 3 Board 8
Clovelly
Board 4 Board 5
X3 Y3 C
W3 Y3 W4
W4 Z3 Z3
Board 6
X4 W3 X5
X4 X6 C
X5 W4 X3
Rozelle
W4 Y3 X3 W3 C C CC X4
X5 W3 CC X4 X6 W4 Z3 [W2]
XC X3 XC X6 Y3 X5 Z3 [W2] Figure 3. Experimental design of racks deployed with attached tiles. Boards 1, 2, 3 and 7 were assigned to
Malabar; 4, 5, 6 assigned to Clovelly and the large rack (bottom) was deployed at Rozelle Bay. W2 tiles on
the Rozelle rack were not a part of this report.
Z3 Z3
W4 Y3
W3 C
W4 W4 Z3
C Y3 W3
C W3 Y3
X5 X3 X3
XC X4 X4
X5 XC X6
X6 X5
XC X6
X3 X4
C X3 X4
X5 Y3 Z3
X6 W3 X6
20
3.3 Assessment of fouling
3.3.1 Percentage cover
Analysis of fouling for all field experiments was based upon percentage cover determination over an
8 to 10 week period in the field. Once a week over the time of the trial, photographs of each rack
were taken and later on in the trial, photographs of each individual tile. The latter was performed
when fouling had become substantially visible; this occurred after 6 to 8 weeks depending on the
site. Photographs were taken using a Canon Power Shot A2000 digital camera and then uploaded
onto a computer for digital analysis. The image analysis software Image J was used to determine
percentage cover of fouling (which was almost entirely algal) there was on each tile.
3.3.2 Slip test
Since ultimately the coatings are intended to reduce slipperiness to bathers, at the completion of the
ten week trial period a slip test was performed on site on all 57 test tiles. The method to test this
involved attaching a force measurement gauge to a small container, or ‘sled’, which had a weight
inside and a foam mat at its base to slide along the tile’s surface. The force gauge was held in hand
while a rope attached it to the sled which was pulled horizontally over about 5cm of the tile. The
gauge was held at about a 20 degree angle to the sled and a consistent force was applied over the
length of the slide. These results were then compared with the slip‐test data prior to setting the tiles
out in the field.
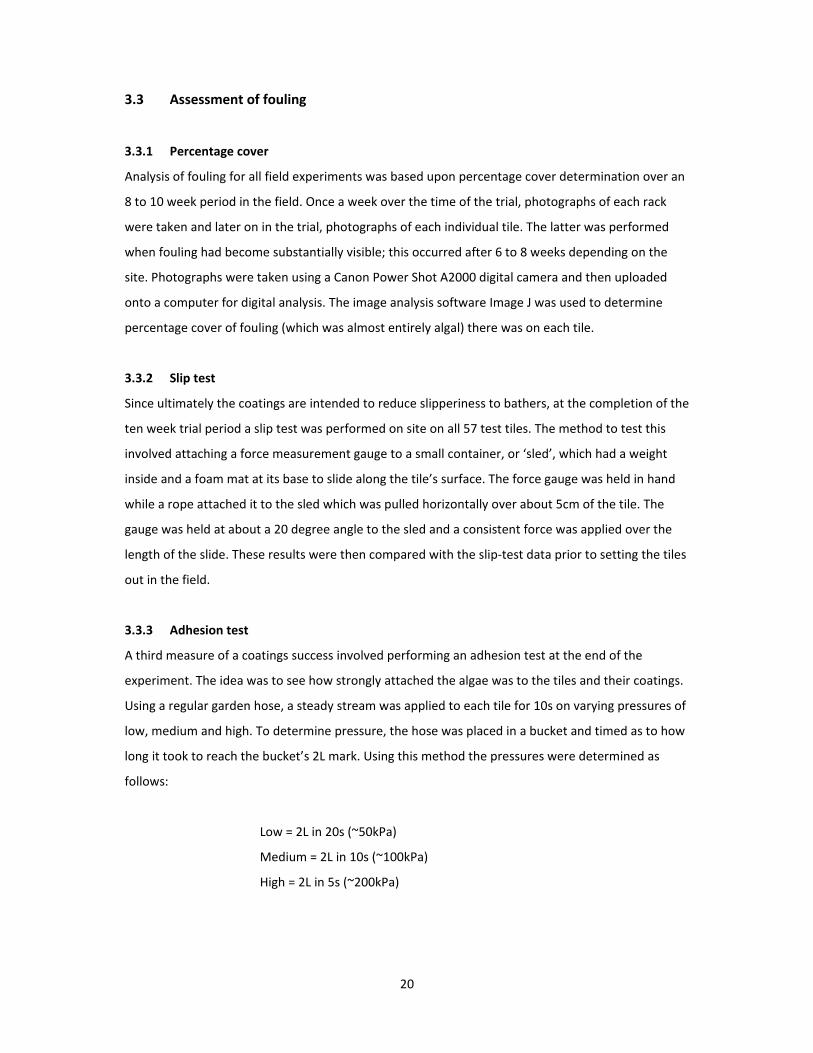
3.3.3 Adhesion test
A third measure of a coatings success involved performing an adhesion test at the end of the
experiment. The idea was to see how strongly attached the algae was to the tiles and their coatings.
Using a regular garden hose, a steady stream was applied to each tile for 10s on varying pressures of
low, medium and high. To determine pressure, the hose was placed in a bucket and timed as to how
long it took to reach the bucket’s 2L mark. Using this method the pressures were determined as
follows:
Low = 2L in 20s (~50kPa)
Medium = 2L in 10s (~100kPa)
High = 2L in 5s (~200kPa)

21
Photographs were taken of the racks after each pressure test, and the images uploaded to a
computer for Image J analysis.
3.4 Statistical Analysis
Differences in percentage fouling cover and fouling adhesion among sites, among treatments and
over time were analysed by analysis of variance (ANOVA). One‐way ANOVA’s were used for
assessing fouling cover and tile slipperiness, whilst two‐way ANOVA were (with different coatings as
treatments) used in analysing differences in adhesion tests against treatment and level of water
pressure.
To determine whether the data satisfied the assumptions of ANOVA, homogeneity of variance
(p>0.05 and p>0.01) was examined using Levene’s test, and normality explained using Kolmogorov‐
Smirnov’s test (p>0.05). Most data was transformed by arcsin√p, the common transformation for
percentage and proportion data (Sheskin, 2004). Some data failed to meet the assumptions of
ANOVA, so to minimise the increased risk of Type 1 error, alpha significance levels in these instances
were set to 0.01 instead of 0.05; this applied notably to Rozelle fouling coverage and pre‐
deployment slip test data sets.
Tukey’s multiple‐comparison test was used to identify differences between treatments following
ANOVA with α=0.05 for all samples.
22
4.0 Results
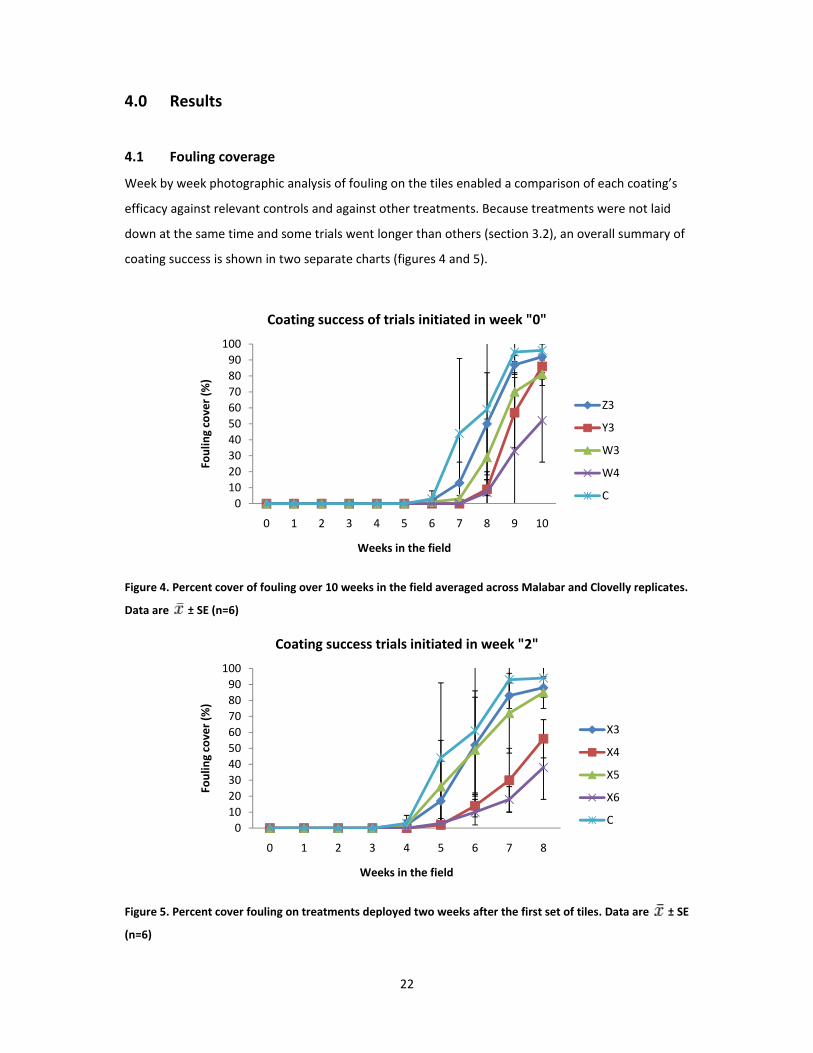
4.1 Fouling coverage
Week by week photographic analysis of fouling on the tiles enabled a comparison of each coating’s
efficacy against relevant controls and against other treatments. Because treatments were not laid
down at the same time and some trials went longer than others (section 3.2), an overall summary of
coating success is shown in two separate charts (figures 4 and 5).
Figure 4. Percent cover of fouling over 10 weeks in the field averaged across Malabar and Clovelly replicates.
Data are ± SE (n=6)
Figure 5. Percent cover fouling on treatments deployed two weeks after the first set of tiles. Data are ± SE
(n=6)
0
10
20
30
40
50
60
70
80
90
100
0 1 2 3 4 5 6 7 8 9 10
Foulin
g cover (%
)
Weeks in the field
Coating success of trials initiated in week "0"
Z3
Y3
W3
W4
C
0
10
20
30
40
50
60
70
80
90
100
0 1 2 3 4 5 6 7 8
Foulin
g cover (%
)
Weeks in the field
Coating success trials initiated in week "2"
X3
X4
X5
X6
C

23
Figures 4 and 5 suggest that the most successful coatings were W4 and X6. After X6, the coating that
remained foul‐free for the longest time was Y3, although once fouling occurred accumulation was
fast, as seen in the week 8 data for Y3. Fouling was visible for most treatments after four to five
weeks. Analysis of variance (ANOVA) was not performed on this data instead, data for each site was
analysed.
4.2 Treatment efficacy at each site
The data displayed in figures 4 and 5 is a summary of results for treatment success over all three
field locations. To more accurately examine the results for each coating a site by site analysis was
performed.
4.2.1 Malabar
The first sets of tiles and a control set (Z3, Y3, W3, W4, C) were placed on location at Malabar rock
pool in week zero. The second sets of tiles were placed in week two (X3, X4, X5, X6, XC) with a
separate set of controls.
Figure 6. Percent fouling cover for week zero deployed treatments. Data are ± SE (n=3)
0
10
20
30
40
50
60
70
80
90
100
0 1 2 3 4 5 6 7 8 9 10
Foulin
g cover (%
)
Weeks in the field
Malabar treatment success (week zero trials)
Z3
Y3
W3
W4
C

24
Figure 7. Percent fouling cover for week two deployed treatments. Data are ± SE (n=3)
Fouling appears to begin for all tiles within the sixth week of the trial, even tiles that were
submerged two weeks after the start of the experiment. Once visible fouling begun, most tiles were
quickly covered to a large extent. X6 performed the strongest, with X4 also appearing to have some
success compared with the controls.
One‐way ANOVA indicated significant differences in fouling between the week zero treatments
(F4,10=19.9, p<0.01, Fig. 6) at week ten. Tukey’s test (α=0.05) indicated a significant difference
between W3 and the control, and W4 and the control, both with a p‐value of 0.001. A one‐way
ANOVA of the week two deployed coatings also showed a significant difference between treatments
(F4,10=9.9, p<0.01, Fig. 7) at week ten. Tukey’s pairwise comparison showed a significant difference
for X6 against XC at p<0.01.
Although X6 appears to have performed well, it should be noted the fact that one of its replicates
had significantly less fouling than the other two replicates. The first two X6 tiles gave an end point
fouling cover of 40 and 59% whilst the third had only 13% cover (figure 8).
0
10
20
30
40
50
60
70
80
90
100
0 1 2 3 4 5 6 7 8
Foulin
g cover (%
)
Weeks in the field
Malabar treatment success (week two trials)
X3
X4
X5
X6
XC

25
Figure 8. Replicates of the treatment ‘X6’, illustrating a possible outlier in the third (far right) replicate.
This phenomenon was most likely due to the feeding of small aquatic snails. A large number of black
Nerita sp. were found huddled in a cluster next to the tile in question. Nerita atramentosa eat algae
(Wilson 1993).
4.2.2 Clovelly
All tiles at the Clovelly filed site were measured over the same time frame, as opposed to the
Malabar site where an extra set of controls were required. Tiles were originally laid down in week
zero, however with the arrival of the second set of coatings (X3, X4, X5, X6), the racks were taken out
of the water and the tiles were washed and scrubbed so the fouling process could restart and a new
set of controls was not needed.
Figure 9. Percent fouling cover of Clovelly treatments over 8 weeks. Data are ± SE (n=3)
0
10
20
30
40
50
60
70
80
90
100
0 1 2 3 4 5 6 7 8
Foulin
g cover (%
)
Weeks in the field
Clovelly treatment success
Z3
Y3
W3
W4
X3
X4
X5
X6
C

26
One‐way ANOVA revealed significant differences (F8,18=43.4, p<0.01, Fig. 9) between treatments at
the Clovelly site after eight weeks of fouling, with Tukey’s test revealing W4, X4 and X6 were
significantly different to the control (p<0.01 for all three).
The Y3 treated tiles up to the eighth week of testing were, along with W4, the most successful tiles
in terms of fouling cover. These tiles (Y3) appear to have been fouled by a different organism to the
green (Ulva spp.) algae which dominated all other tiles at the Malabar and Clovelly sites.
Figure 10. Y3 treated tile (top left) at Malabar versus Y3 treated tile at Clovelly (top right), and the same
Clovelly tile compared with other tiles. Both Y3 tiles (centre and top centre) appear to have a different
dominant fouling organism.
The brown/reddish (when submerged) coloured fouling on the Y3 replicates was most likely the red
algae Porphyra sp.

27
4.2.3 Rozelle
Similarly to the Malabar site, the late arriving ‘X’ coated tiles from company C, were simply added to
the rack already in place at Rozelle. This meant that the first set of tiles was submerged for ten
weeks as opposed to the eight week submersion of the company C tiles (with a new control set).
Figure 11. Percent fouling cover of week zero treatments at Rozelle. Data are ± SE (n=2)
Figure 12. Percent fouling cover of week two treatments at Rozelle. Data are ± SE (n=2)
0
10
20
30
40
50
60
70
80
90
100
0 1 2 3 5 8 10
Foulin
g cover (%
)
Trial week
Rozelle treatment success (week zero trials)
Z3
Y3
W3
W4
C
CC
0
10
20
30
40
50
60
70
80
90
100
0 1 2 3 5 8 10
Foulin
g cover (%
)
Trial Week
Rozelle treatment success (week two trials)
X3
X4
X5
X6
XC
CC

28
Photos of the Rozelle experiments were taken during weeks 1, 2, 3, 5, 8 and 10 as it was decided
that a week by week analysis was not required. Fouling data from Clovelly and Malabar was thought
to be more important so images were taken more frequently at these sites compared with Rozelle.
A one‐way ANOVA was performed showing no significant difference between week zero treatments
(Z3, Y3, W3, W4, C, CC) at the end of the experiment (F5,6=6.7, p>0.01, Fig. 11). A second ANOVA was
then run without the presence of the commercial control returning values of F4,5=3.2, p=0.1 as
Tukey’s test revealed treatment ‘CC’ was the only significantly different treatment from the control
(p<0.04). The week two trials (X3, X4, X5, X6, XC) were also compared with the commercial anti‐
fouling coating (F 5,6=110.9, p<0.01, Fig. 12) and without (F4,5=8.6, p>0.01), the later showing no
significant variation. X5 was reported to be the best performer out of the week two trials (Tukey’s p‐
value=0.02).
Fouling of the tiles at Rozelle became visible somewhere between three to five weeks in the water.
At each visit to the site, the rack was lifted from the harbour to analyse the tiles which had
accumulated a layer of slime or dirt. This slime was not attached to the tiles so was not considered
to be fouling and was subsequently washed away with a bucket of water before images of the tiles
were taken. The commercially available antifouling coating denoted ‘CC’ was the least fouled (figures
11 and 12). Of the non‐toxic, experimental coatings, X4 and W3 appear to have had the most
success. Interestingly, many of the fouling means dropped from week eight to week ten.
The W4 treated tiles significantly inhibited fouling at Clovelly and Rozelle and had some success at
Malabar. It was observed that much of the fouling on these tiles had accumulated in between the
blotches of wax, which was patchy in application (figure 13).

29
Figure 13. Replicates of W4 coated tiles from Malabar (top), Clovelly (centre) and Rozelle (bottom) showing
accumulation of algae around wax treated areas.

30
4.3 Adhesion test
4.3.1 Adhesion test results by site
Tests were carried out at the conclusion of the ten week experiment on location at each respective
field site immediately after the racks were removed from the steps or from out of the water.
4.3.1.a Malabar
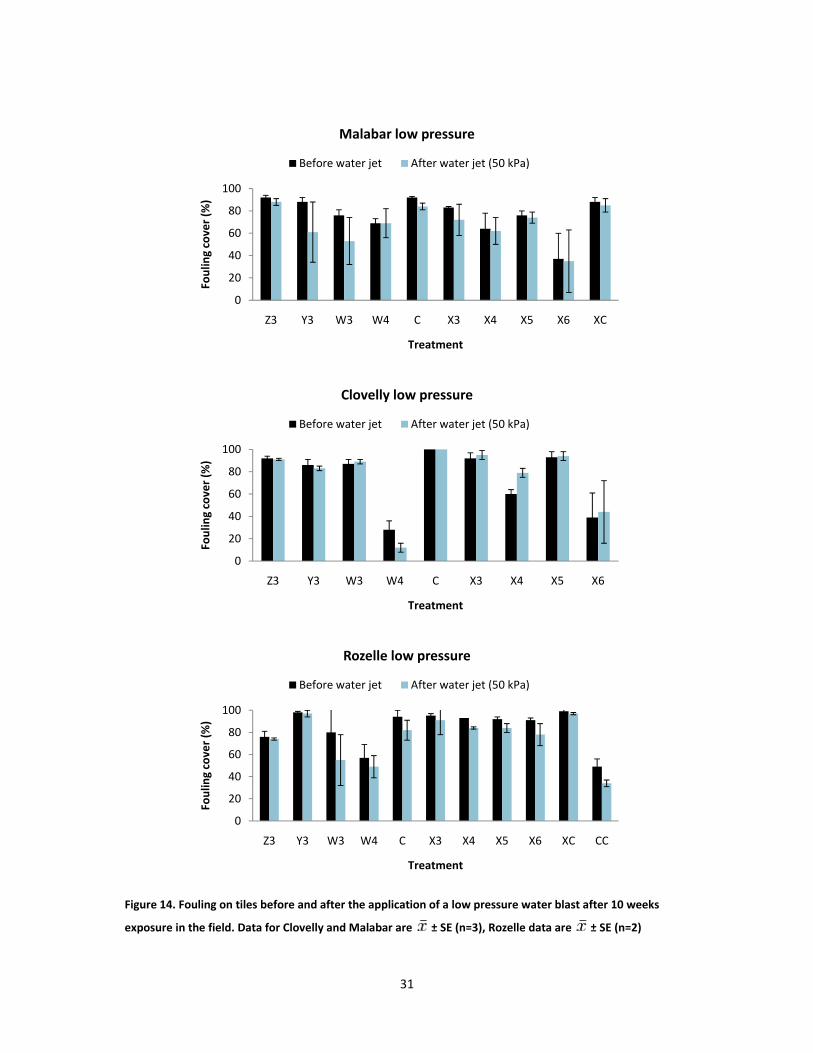
Two‐way ANOVA indicated significant differences in adhesion among pressure levels (F3,80=4.2,
p<0.01, Fig. 13, 14 and 15), but there was no differences among treatments or in the interaction of
pressure and treatment (F27,80=0.9, p = 0.67). Tukey’s multiple comparisons test showed a significant
difference between the pre‐test fouling cover of the tiles and the cover after high pressure blasting
(p<0.01). Significant difference was not detected for low (p=0.06) or medium (p=0.07) pressure.
4.3.1.b Clovelly
According to two‐way analysis of variance there was no significant difference between water
pressure tests (F3,72=0.6, p = 0.6, Fig. 13, 14 and 15) or in the interaction between pressure and
treatments (F24,72=0.4) at Clovelly.
4.3.1.c Rozelle
The pressure tests at Rozelle were significantly different (two‐way ANOVA; F3,44=9.7, p<0.01, Fig. 13,
14 and 15), however fouling loss from water blasting was consistent over treatments (p=0.9).
Tukey’s test showed significant differences in fouling percentage cover between all three pressure
levels and the pre‐test cover (all p<0.05); although from low to medium (p = 0.2) and medium to
high (p = 0.3) there was no significant difference.
31
Figure 14. Fouling on tiles before and after the application of a low pressure water blast after 10 weeks
exposure in the field. Data for Clovelly and Malabar are ± SE (n=3), Rozelle data are ± SE (n=2)
0
20
40
60
80
100
Z3 Y3 W3 W4 C X3 X4 X5 X6 XC
Foulin
g cover (%
)
Treatment
Malabar low pressure
Before water jet After water jet (50 kPa)
0
20
40
60
80
100
Z3 Y3 W3 W4 C X3 X4 X5 X6
Foulin
g cover (%
)
Treatment
Clovelly low pressure
Before water jet After water jet (50 kPa)
0
20
40
60
80
100
Z3 Y3 W3 W4 C X3 X4 X5 X6 XC CC
Foulin
g cover (%
)
Treatment
Rozelle low pressure
Before water jet After water jet (50 kPa)

32
Figure 15. Fouling on tiles before and after the application of a medium pressure water blast after 10 weeks
exposure in the field. Data for Clovelly and Malabar are ± SE (n=3), Rozelle data are ± SE (n=2)
0
20
40
60
80
100
Z3 Y3 W3 W4 C X3 X4 X5 X6 XC
Foulin
g cover (%
)
Treatment
Malabar medium pressure
Before water jet After water jet (100 kPa)
0
20
40
60
80
100
Z3 Y3 W3 W4 C X3 X4 X5 X6
Foulin
g cover (%
)
Treatment
Clovelly medium pressure
Before water jet After water jet (100 kPa)
0
20
40
60
80
100
Z3 Y3 W3 W4 C X3 X4 X5 X6 XC CC
Foulin
g cover (%
)
Treatment
Rozelle medium pressure
Before water jet After water jet (100 kPa)

33
Figure 16. Fouling on tiles before and after the application of a low pressure water blast after 10 weeks
exposure in the field. Data for Clovelly and Malabar are ± SE (n=3), Rozelle data are ± SE (n=2)
0
20
40
60
80
100
Z3 Y3 W3 W4 C X3 X4 X5 X6 XC
Foulin
g cover (%
)
Treatment
Malabar high pressure
Before water jet After water jet (200 kPa)
0
20
40
60
80
100
Z3 Y3 W3 W4 C X3 X4 X5 X6
Foulin
g cover (%
)
Treatment
Clovelly high pressure
Before water jet After water jet (200 kPa)
0
20
40
60
80
100
Z3 Y3 W3 W4 C X3 X4 X5 X6 XC CC
Foulin
g cover (%
)
Treatment
Rozelle high pressure
Before water jet After water jet (200 kPa)

34
4.3.2 Summary of adhesion test results
Along with ‘W4’, treatment W3 had a relatively higher percentage loss compared with other
treatments (figures 14, 15 and 16). Reason for this may have been due to the fact that whilst blasting
the W3 treated tiles (especially with high pressure), small amounts of wax coating with fouling
attached would break away (figure 17).
Figure 17. W3 treated tile before water blasting (left) versus the same tile after high pressure water blasting
(right).
The treated tiles at the Rozelle site appeared to be the most responsive to the adhesion tests whilst
Clovelly tiles were the least, with the exception of W4 and W3.
4.4 Slip test
Slip tests were performed on the first set of trials (Z3, Y3, W3, W4, C) before deployment only for
Malabar and Clovelly field sites; and only Clovelly’s ‘X’ treated tiles had slip tests performed on
them. This should not have any implication on the results, as all replicates were presumed to be the
same when received from the participating companies.
One‐way ANOVA performed on tiles before deployment, revealed a significant difference between
the slipperiness of treatment surfaces (F8,72=13.9, p<0.01, Fig. 18). Tukey’s test revealed that W4
(p<0.01) and Y3 (p<0.01) were significantly less slippery.

35
Figure 18. Mean slip test results for treatments across all three sites (Malabar; top, Clovelly; centre and
Rozelle; bottom) for week zero and week ten. Note ‘CC’ did not have a slip test performed on before
deployment at week zero. Data for Clovelly and Malabar are ± SE (n=9), Rozelle data are ± SE (n=6)
0
2
4
6
8
Z3 Y3 W3 W4 X3 X4 X5 X6 C
Force (N)
Treatment
Malabar slip test
Week zero Week ten
0
2
4
6
8
Z3 Y3 W3 W4 X3 X4 X5 X6 C
Force (N)
Treatment
Clovelly slip test
Week zero Week ten
0
2
4
6
8
Z3 Y3 W3 W4 X3 X4 X5 X6 C CC
Force (N)
Treatment
Rozelle slip test
Week zero Week ten

36
There was no significant difference between the slipperiness of treatments at the end of the
experiment at Malabar (one‐way ANOVA, F8,72=1.8, p=0.097, Fig. 18). There was a significant
difference detected at Clovelly (one‐way ANOVA, F8,72=2.4, p<0.05) although Tukey’s test indicated
that no treatment was significantly different from the control; the closest however was Y3 (p =
0.183). One‐way ANOVA of the Rozelle results suggested a significant variation between treatments
(F9,50=3.9, p<0.01), however no treatment performed significantly better than the control (Tukey’s
test, α=0.05).
A slip test was performed at Clovelly on a heavily fouled step 10m from the experiment site. On the
set of steps one step up, it was observed that the step was free of fouling. A slip test was performed
on the foul‐free concrete step also.
Figure 19. Picture of a step leading into the bay at Clovelly from the southern promenade.
Test 1 Test 2 Test 3 Test 4
Algae 2.88 3.38 2.68 3.08
Concrete 5.7 4.84 5.44 4.08 Table 1. Results of slip test on Clovelly step (figure 19). Values were obtained using a force gauge and are
expressed in Newtons.

37
5.0 Discussion
Once submerged in a marine environment, an object will within a matter of hours begin to
accumulate biological settlers, a process known as biofouling (Wahl, 1989; Richmond and Seed,
1991; Underwood and Anderson 1994; Round, 1996; Wahl, 1997; Evans, 2000; Railkin, 2004; Ralston
and Swain, 2009). Biofouling initially begins with the settlement of a biofilm (Wahl, 1989; Little and
Wagner, 1997), followed later by the growth of macroalgae such as seaweeds and after a couple of
months, barnacles (Wahl, 1989; Evans, 2000; Railkin, 2004). Fouling of coastal platforms is a major
concern for public safety and liability. Areas subject to high levels of foot traffic are particularly
vulnerable to the possibility of an incident that may result in injury and/or legal action. The inability
of current antifouling technology to address this issue means research into possible alternatives
provides an opportunity for the development of a unique, highly marketable solution. The increased
restrictions on heavy metal based antifouling paints (Rittschof, 2001) also means an environmentally
friendly coating developed for coastal platforms could offer wider application possibilities for marine
industries (Clare, 1996; Holmstrom et al., 2004).
The first aim of this study was to trial a number of near commercially available, non‐toxic antifouling
coatings that could be applied to high‐use public areas. The second was to assess public opinion on
the issue (Section B). In total, eight prospective coatings were reviewed with varying results. Fouling
was typically dominated by green algae (Ulva australis) without the presence of barnacles, which
usually take longer than ten weeks to appear. This is representative of what type of fouling generally
occurs on ocean pool platforms. The outcome at the conclusion of the ten week experiment saw, for
the most part, all eight coatings substantially fouled. The success of a coating was therefore judged
on comparison with untreated controls, and in this context a number of coatings had significant
efficacy over ten weeks. Treatments X4, X6 and W4 had the greatest efficacy. Fouling coverage of
W4 (figure 4), X4 and X6 (figure 5) after ten weeks all averaged below 50% at the Malabar and
Clovelly field sites compared with >80% for the other treatments. Coating Z3 performed the most
poorly (section 4.2), >90% covered by the dominant Ulva sp. at Malabar and Clovelly. Fouling
organisms typically prefer roughened surfaces as opposed to smooth (Underwood and Anderson,
1994; Lin and Shao, 2002), an exposed patch of rough, untreated cement on the Z3 tiles likely lead to
edge effect fouling (section 2.2 and appendix A1). This occurs when fouling first happens on a more
suitable environment (untreated part of tile) and then spreads to less suitable areas through growth
and space/resource requirements (Nandakumar et al., 2004). This phenomenon would have
undoubtedly impacted most of the treatments if not every replicate.
38
Treatment efficacy varied between sites. This was most notable for treatment Y3, which was the
only coating that experienced settlement of varying fouling organisms. Where all other tiles were
fouled by the green Ulva sp. algae, Y3 replicates at Clovelly were covered by Porphyra sp., a red alga.
One reason for this may be the black colour of the coating as studies have found optimal growth of
some red algae sporelings are increased by exposure to different wavelengths (Round, 1996) or the
surface roughness (Howell and Behrends, 2006). Little however is actually known about the
physiological effects of surfaces on spore attachment and growth (Round, 1996). The red alga, which
appeared two weeks after the visible attachment of Ulva sp. (figure 10), was less slippery than the
green algae covered tiles (figure 18). In fact the mean force measurements (slip test) for Y3 at
Clovelly after ten weeks (around 5 N) were very similar to that of an un‐fouled concrete step (table
1).
Tiles coated with wax (W3) developed in the Centre for Marine Bio‐Innovation, were reasonably
successful in inhibiting fouling at Malabar and Rozelle. Both locations are low wave impact sites
compared with the rough conditions experienced by the steps leading into Clovelly bay. This, and the
fact that the W3 tiles were most affected by adhesion testing (figures 14 to 16), suggests their
application may be more suited to calm, low impact areas. Thus not surprisingly, one significant
issue for these coatings at Clovelly was the removal of the wax coating itself from the test tile. This
may be an application issue that needs to be adjusted. W4 was the most successful coating after ten
weeks exposure at Clovelly and Rozelle and was significantly less fouled than the controls at Malabar
(section 4.2). Similar to tiles coated with Z3, the success of the wax treated portion of the tiles may
have been compromised by edge effects (Round, 1996) from the less successful exposed Y3 part of
the tiles. Interestingly also is the absence of Porphyra sp. from the W4 tiles which, like all but the Y3
tiles at Clovelly, were covered in green Ulva sp.
Whilst they were deployed two weeks after the first set of trials, the tiles from company C (X3, X4,
X5 and X6), begun to experience visible fouling around the same time as the week zero tiles at
Malabar and Rozelle. It was concluded that this was most likely due to an external occurrence such
as a rain or storm event which brought increased nutrients to promote fouling (Richmond and Seed,
1991; Underwood and Anderson 1994; Round, 1996; Wahl, 1997; Evans, 2000; Railkin, 2004; Ralston
and Swain, 2009).

39
Two of the four coatings supplied by company C, X4 and X6, showed promise for future applications.
X3 and X5 had results similar, in terms of fouling levels, to that of the control tiles. X6, even without
the assistance of snails (Nerita atramentosa) (figure 8), demonstrated strong antifouling properties.
X4 and X6 both were significantly less fouled than the controls at Clovelly (figure 9) and also
performed well at Malabar (figure 7).
An issue with this project was the low power associated with the statistical analysis of results. This
was due to the small number of replicates (three at Malabar and Clovelly, and two at Rozelle) of
each treatment, which was dictated by the coating and tiles supplied by the commercial partners.
Despite this however success (or lack thereof) of the different coatings was still adequately
determined without the need for a higher significance level such as used by Xavier et al. (2008)
where larger significance levels were chosen (α=10%) to reduce the chance of Type II error
(Underwood, 1997). Efficacy of treatments within this study was easily quantifiable as a success or
failure with the amount of replication used. It is also worth noting that the overall aim of the project
was to trial as many different variations of coatings as possible, which necessarily constrained the
amount of replication per coating.
40
SECTION B – COMMUNITY RESPONSES
Section B details the process of data collection and analysis used in assessing public opinion related
to issues associated with Section A. This is followed by a detailed account of results representing
Sydney pool users. Results have then been discussed with conclusions drawn from the findings.
6.0 Survey methodology
6.1 Role of survey
A qualitative assessment was required to assess the extent to which a new antifouling technology
would be accepted by the public, and any possible reason to the contrary. This data was then used
to help better decide on the possible integration of a successful coating.
6.2 Survey design
Using a representative sample of the population, a survey was used to gain primary data regarding
project impacts. A questionnaire was developed to elicit information specific to the issue of slippery
surfaces. As outlined by McGuirk and O’Neill (2005, p.147), this includes questioning designed to
garner an understanding of what community stakeholders of this project’s, attitudes are to the issue
and the proposed solutions.
One of the initial tasks required was to set out a set of questions that could be reasonably answered
by members of the target demographic: “To conduct a survey we must translate any concepts into a
form in which they are measurable.” (De Vaus, 2002 p.43) The issues in question therefore were put
into a quantifiable questionnaire. The questions asked required that the respondents have some
knowledge of the situation which is why swimming pool (ocean bath) ‘users’ were chosen as
representatives. The term ‘pool’ refers not so much to the actual pool itself, although it is included,
but to the platforms, stairs and ramps that make up the whole pool area. For the Malabar field site
this area is decidedly smaller than Clovelly, this fact however should not impact significantly on the
results of the questionnaire.
The questionnaire was designed to obtain as many respondents as possible in one outing. This was
done by making the questioning process short enough for respondents to agree to participate, whilst
still being in depth enough to get the necessary information. Additionally, the survey was conducted
in person, and this combination resulted in a high positive response rate which reached almost 90%.
41
6.3 Questionnaire
The questionnaire contained a combination of questioning methods including likert scales1 and open
and closed questions offering a change of pace assisting in maintaining respondents’ interests
(Neuman, 2000) and limiting the non‐response rate (Lindner 2001; De Vaus, 2002; Stoop, 2005).
A sample of the survey can be viewed in appendix B3.
6.4 Data collection
With permission from Randwick council (appendix B1), respondents were recruited at the Malabar
and Clovelly field sites by approach. The questionnaire was conducted on the spot by verbal
questioning and answers recorded on clipboard and paper. The questionnaire took on average about
four minutes to complete with participants recruited between the 20/08/2009 to 06/09/2009.
It should also be noted that up to 80% of respondents were recruited from the Clovelly site.
1Also known as summated rating scales, likert scales are used in attitude assessment to place the extent to which a respondent agrees with a particular question. For example a rating from one to five, five being strongly agree, one being strongly disagree. (Corbetta, 2003)
42
7.0 Results
The survey was conducted over two weeks with a total 128 respondents to the questionnaire. The
following details the data obtained over the fortnight and its significance.
7.1 Age and suburb
At the conclusion of each survey, the respondent was asked to supply the interviewer with some
anonymous but personal information. The respondents were queried on their age and the suburb
they lived in, and were told that this part of the survey was optional meaning if they did not want to
divulge their age or location they did not have to.
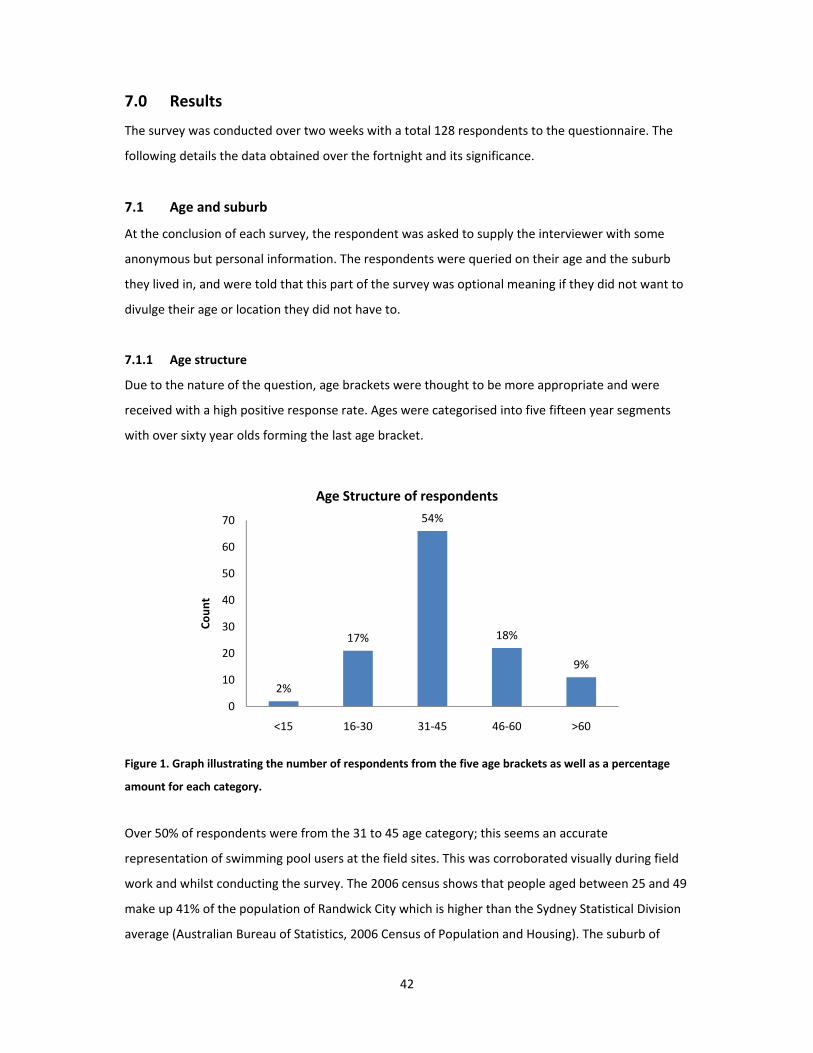
7.1.1 Age structure
Due to the nature of the question, age brackets were thought to be more appropriate and were
received with a high positive response rate. Ages were categorised into five fifteen year segments
with over sixty year olds forming the last age bracket.
Figure 1. Graph illustrating the number of respondents from the five age brackets as well as a percentage
amount for each category.
Over 50% of respondents were from the 31 to 45 age category; this seems an accurate
representation of swimming pool users at the field sites. This was corroborated visually during field
work and whilst conducting the survey. The 2006 census shows that people aged between 25 and 49
make up 41% of the population of Randwick City which is higher than the Sydney Statistical Division
average (Australian Bureau of Statistics, 2006 Census of Population and Housing). The suburb of
2%
17%
54%
18%
9%
0
10
20
30
40
50
60
70
<15 16‐30 31‐45 46‐60 >60
Count
Age Structure of respondents

43
Clovelly, where a large number of respondents were from (figure 2), shows an even greater
percentage, 48%, of residents aged 25 to 49.
The age structure of a population is an indicator of an area’s residential role and function and how it
is likely to change in the future. For example an ageing community is likely to see less development
of youth infrastructure such as skate parks and playgrounds, and more attention given to care
facilities and hospitals. Age is an important determinant, which shapes both demographic and
economic dynamics (Singh, 2007). What this means for this research is that in any steps taken to
implement change, consideration must be given to the needs and desires (as revealed via the
survey), and potential impacts on the dominant age group, being 31 to 45 years old at present (and
ageing).
7.1.2 Locality of respondents
The last question in the survey asked what suburb does the respondent live in. Respondents were
told prior to answering that this information was optional.
Figure 2. Graph showing location of local residents whom participated in the survey. In total 88 respondents
were from Randwick City.
It was found that 69% of respondents were, at the time of the survey, living within the Randwick
local government area, 31% of which were from the suburb of Clovelly. This equates to Clovelly
representing over 20% of total participants. The full list of suburbs can be viewed in appendix B4.
0
5
10
15
20
25
30
Count
Location of local participants
44
“People’s lives are circumscribed by the localities in which they live” (Peet, 1998 p.181) and the fate
of these places are influenced by the people who live in them and vice versa. Localities can be seen
as simply an outcome of structural determination (Cook, 1989), this however fails to acknowledge
the potentially effective power of the active practices of local people. ‘People power’ often has a
leading role in shaping an area; as seen in the town of Taos, New Mexico where locals grow their
own food and recycle everything without electricity or outside assistance. Combined with a strong
sense of community, stakeholder locality is a powerful determinant in shaping an area’s future.
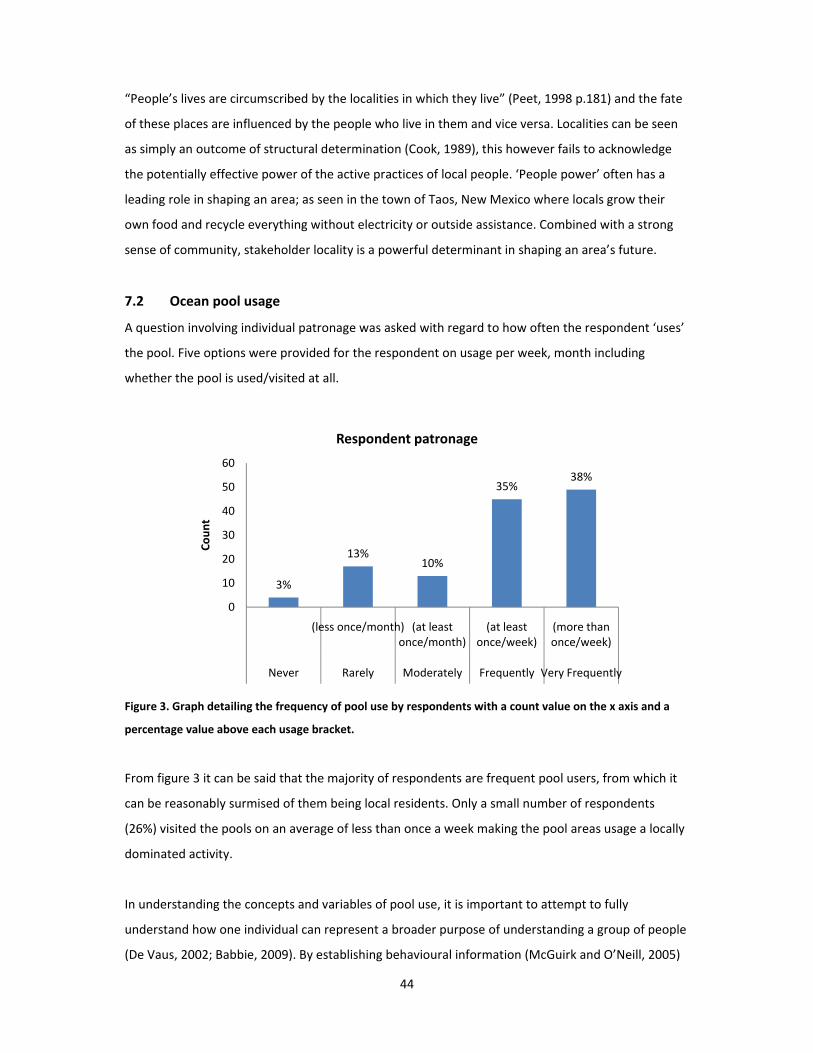
7.2 Ocean pool usage
A question involving individual patronage was asked with regard to how often the respondent ‘uses’
the pool. Five options were provided for the respondent on usage per week, month including
whether the pool is used/visited at all.
Figure 3. Graph detailing the frequency of pool use by respondents with a count value on the x axis and a
percentage value above each usage bracket.
From figure 3 it can be said that the majority of respondents are frequent pool users, from which it
can be reasonably surmised of them being local residents. Only a small number of respondents
(26%) visited the pools on an average of less than once a week making the pool areas usage a locally
dominated activity.
In understanding the concepts and variables of pool use, it is important to attempt to fully
understand how one individual can represent a broader purpose of understanding a group of people
(De Vaus, 2002; Babbie, 2009). By establishing behavioural information (McGuirk and O’Neill, 2005)
3%
13%10%
35%38%
0
10
20
30
40
50
60
(less once/month) (at least once/month)
(at least once/week)
(more than once/week)
Never Rarely Moderately Frequently Very Frequently
Count
Respondent patronage

45
such as pool usage, a stakeholder’s reaction to change can be more accurately assumed. Within the
example above, determining the patronage of individuals, mostly members of the majority group
(locals), is vital in gauging the importance of the pool for the local community.
7.3 Hazards associated with ocean pool use
In order to find out what pool users believe to be issues of concern regarding their health, a question
about pool dangers was asked using a likert scale1 system. Each respondent was asked to rate a set
of potential dangers that were read out to them. Each participant ranked, from one to five, the least
concerning through to five, the most dangerous potential hazard.
Dangerous
surf/weather Rock falls Pollution
Slippery surfaces
Blue Bottles
1 70% 66% 23% 16% 51%
2 16% 25% 34% 35% 36%
3 6% 6% 16% 26% 4%
4 4% 2% 23% 13% 3%
5 3% 1% 4% 10% 6% Table 1. Lists individuals’ responses from 1 to 5 on the extent of danger each column represents to them as a
pool user. Each row (1‐5) represents what percent of users rated the issue with the corresponding score out
of five.
This data was then quantified. This was achieved by giving each score from one to five a value. In this
system a score of one equals one point, a score of two equates to two points and so on up to five
equalling five points. The count of each score was then made a value and added up with the other
scores for that hazard to create a total, for example; for dangerous surf and weather:
90 people gave a score of 1 = 90 points
21 people gave a score of 2 = 42 points
8 people gave a score of 3 = 24 points total equals 196.
4 people gave a score of 4 = 16 points
5 people gave a score of 5 = 25 points
Dangerous
surf/weather Rock falls Pollution
Slippery surfaces
Blue Bottles
Score 196 189 320 342 228 Table 2. Aggregate score of each hazard as determined by ranking system described on p.45. The scores are
an overall mark determined from all age categories.

46
From this it is seen that the general user consensus is that pollution and slippery surfaces provide
the most risk to pool user’s health (table 2). During the questionnaire the respondent was given the
option of describing any other issue they consider to be a health hazard, these can be viewed in
appendix B5.
The study of individual concerns is vital in establishing an overall view, as Babbie (2009, p.15)
explains “(s)ocial research, involves the study of variables and their relationships. Social theories are
written in a language of variables, and people get involved as the “carriers” of those variables.”
Establishing what is considered dangerous to each individual, a trend emerged about what was
thought to be of least and most significance. Slippery surfaces, as determined in table 2, present the
highest perceived danger to the represented community. But, as alluded to, this may vary by age‐
group.
7.4 Slip hazard
To meet the aims of this project requires knowledge of the occurrence of injury resulting from a slip
incident. To satisfy this, survey participants were asked bivariatively if at any time in the past they
have indeed been injured by slipping over whilst using the pool area. Twenty‐nine individuals, or
23% of respondents, had hurt themselves from slipping over. The other 99 had never slipped and
been hurt. Injuries that were sustained by those who answered ‘yes’ included;
Cuts and bruises
Lacerated leg
Lacerated back of head
Broken wrist
Two respondents explained that they were ‘taking action’ against Randwick Council for
compensation. One slipped on an access ramp at Malabar pool and hurt their forehead and claimed
medicated cream for the injury. The second compensation claim occurred when the other individual
slipped on the steps leading into Clovelly bay and resulted in them injuring their back and requiring
physiotherapy.
Of the twenty‐nine slip victims, four resulted in a trip to the hospital equating to 3% of the sample
population.

47
The respondent was asked firstly if they had ever slipped and if they replied ‘no’, the follow‐up
questions of “how were you injured” and “did you take action” were not asked. Gathering sensitive
information such as asking a respondent to recall an incident resulting in harm or injury is often
necessary to a research plan, as it is in this instance. Anonymity in response can play a major role in
a respondents’ choice whether or not to answer truthfully or answer at all. As Walden (2006 p.262)
states; in minimising both response and non‐response bias in surveys, a common technique is to
combine sensitive questions with innocuous ones in a manner in which responses can be attributed
to respondents only on a probability basis. This method could be viewed as unethical, depending on
the invasiveness of the question being asked (De Vaus, 2002). This issue is avoided in this study due
to the mostly un‐intrusive nature of the topic.
7.5 Council treatment of slippery surfaces
Respondents were queried on their knowledge of council treatment of slippery surfaces. They were
asked whether or not they are aware of any current council program or activity to remove algae off
coastal platforms which in turn minimises the slip hazard.
Figure 4. Pie chart displaying the percentage of survey respondents aware of Randwick Council’s algae
removal treatment.
Fifty respondents displayed some knowledge of council treatment; four still think chlorine is used. Of
the individuals aware of treatment, 32 (64%) know of it involving water blasting.
No61%
Yes39%
Respondents with knowledge of council treatment
48
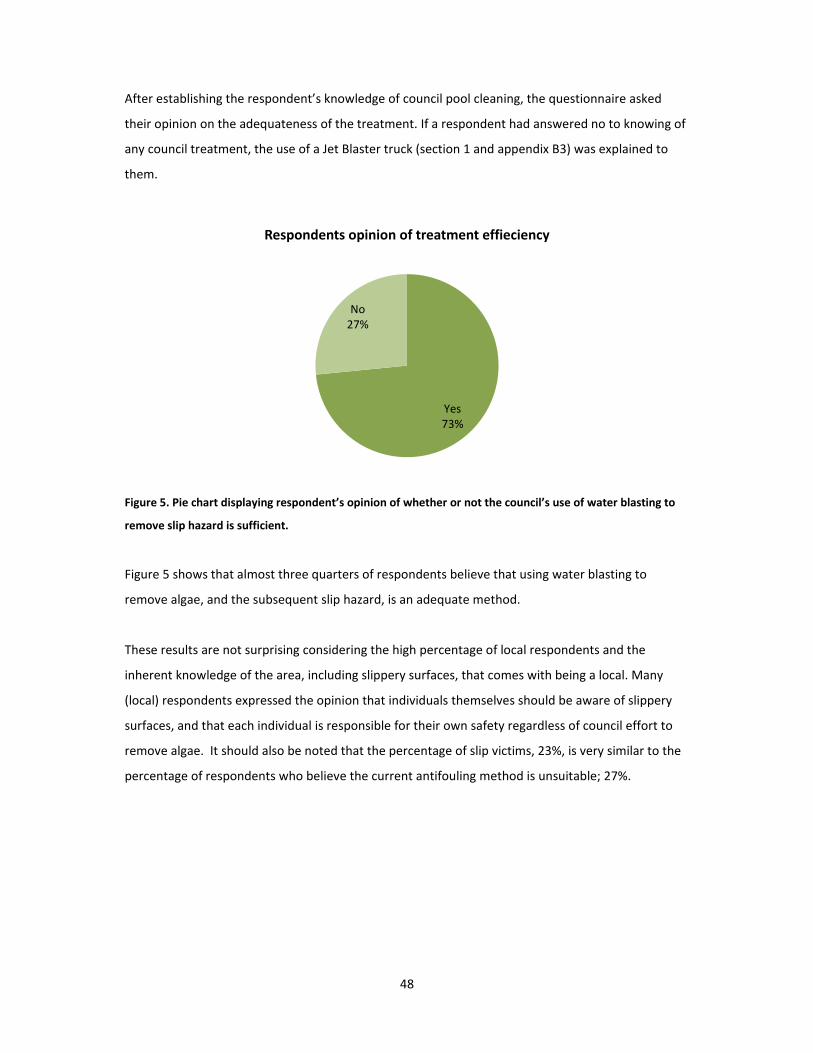
After establishing the respondent’s knowledge of council pool cleaning, the questionnaire asked
their opinion on the adequateness of the treatment. If a respondent had answered no to knowing of
any council treatment, the use of a Jet Blaster truck (section 1 and appendix B3) was explained to
them.
Figure 5. Pie chart displaying respondent’s opinion of whether or not the council’s use of water blasting to
remove slip hazard is sufficient.
Figure 5 shows that almost three quarters of respondents believe that using water blasting to
remove algae, and the subsequent slip hazard, is an adequate method.
These results are not surprising considering the high percentage of local respondents and the
inherent knowledge of the area, including slippery surfaces, that comes with being a local. Many
(local) respondents expressed the opinion that individuals themselves should be aware of slippery
surfaces, and that each individual is responsible for their own safety regardless of council effort to
remove algae. It should also be noted that the percentage of slip victims, 23%, is very similar to the
percentage of respondents who believe the current antifouling method is unsuitable; 27%.
Yes73%
No27%
Respondents opinion of treatment effieciency
49
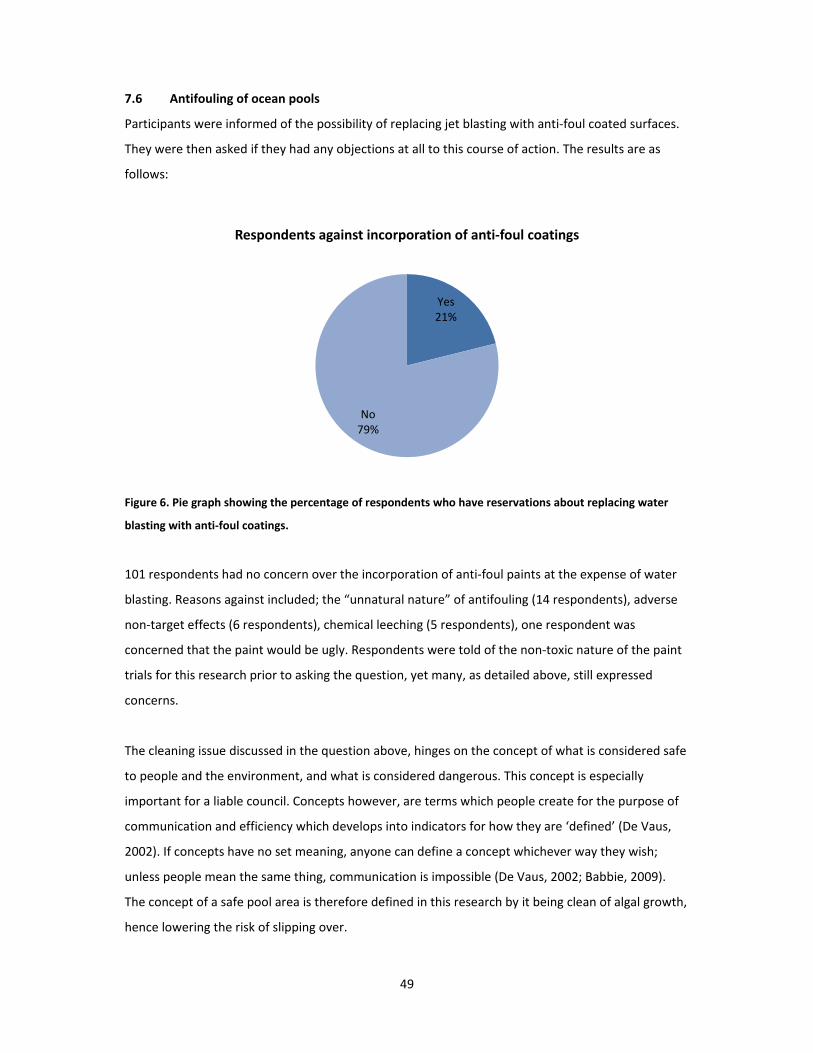
7.6 Antifouling of ocean pools
Participants were informed of the possibility of replacing jet blasting with anti‐foul coated surfaces.
They were then asked if they had any objections at all to this course of action. The results are as
follows:
Figure 6. Pie graph showing the percentage of respondents who have reservations about replacing water
blasting with anti‐foul coatings.
101 respondents had no concern over the incorporation of anti‐foul paints at the expense of water
blasting. Reasons against included; the “unnatural nature” of antifouling (14 respondents), adverse
non‐target effects (6 respondents), chemical leeching (5 respondents), one respondent was
concerned that the paint would be ugly. Respondents were told of the non‐toxic nature of the paint
trials for this research prior to asking the question, yet many, as detailed above, still expressed
concerns.
The cleaning issue discussed in the question above, hinges on the concept of what is considered safe
to people and the environment, and what is considered dangerous. This concept is especially
important for a liable council. Concepts however, are terms which people create for the purpose of
communication and efficiency which develops into indicators for how they are ‘defined’ (De Vaus,
2002). If concepts have no set meaning, anyone can define a concept whichever way they wish;
unless people mean the same thing, communication is impossible (De Vaus, 2002; Babbie, 2009).
The concept of a safe pool area is therefore defined in this research by it being clean of algal growth,
hence lowering the risk of slipping over.
Yes21%
No79%
Respondents against incorporation of anti‐foul coatings

50
7.7 Altered pool usage
The theory behind altered pool use is based around whether a respondent’s patronage would
decrease under certain circumstances. Three scenarios were presented to each respondent who
were to answer whether they would reduce using the pool, stop use altogether or continue using
the pool unchanged.
Slipped and
hurt Water blasting replaced with antifouling paint Algae left to
grow
Reduce 8% 3% 29%
Stop 6% 2% 18% Table 3. Table showing the percent of respondents who would alter their pool use under certain
circumstances.
Table 3 suggests respondents are, for the most part, unlikely to stop or limit pool usage if water
blasting is replaced with antifouling paints. 47% of respondents would limit or stop using the pool if
algae growth was allowed to thrive unabated, however only 14% would alter their usage if they
slipped and hurt themselves.
Social research often studies motivations that affect individuals. However the individual as such is
seldom the subject of the research, instead, the objects of the study are typically aggregates, or
collections of social groups rather than individuals (Babbie, 2009). The motivation of individuals to
cease or continue using a pool in this instance is based on the variables of perceived danger and in
some instances aesthetics. The system therefore, is reliant on group opinion of what affects pool
patronage, which is comprised of varying individual attitudes.

51
8.0 Discussion
Evaluating the significance of respondent opinion – which is sometimes based on experience – is an
important part of social research (Babbie, 2009). The fact that the respondent’s represent a social
group that will be impacted by the results of this research, does not necessarily lend weight to their
opinion or stance on the issue. What makes their opinion vital is the scale of impact the research,
and any subsequent change, may have on them. Patton (2002, p.568) explains that “researchers
should strive to neither overestimate nor underestimate their (projects) effects but to take seriously
their responsibility to describe and study what those effects are.” One of the issues in assessing the
data is interpreting the meaning of people’s responses. Individuals can experience similar events
that may mean different things or indicate different things and elicit different behavioural responses
for some people (De Vaus, 2002). This issue is partly overcome by using varying questioning
techniques (Neuman, 2000; Sutton, 2004 McGuirk and O’Neill, 2005; Walden, 2006). De Vaus (2002,
p.54) explains that the patterns of people’s responses can help us understand the meaning of a
particular response, where other information can be used to help put the response to a particular
question in context. With this in mind it can be said that the results suggest respondents in general
prefer the pool area to be free of algae but not so much free of a the slip hazard. This is
demonstrated by respondent’s opinion of the current treatment’s efficiency (figure 5) and the local’s
ideal of self accountability.
Public opinion although integral to social research, can be ambiguous and often misleading
(Neuman, 2000). Empirical research requires the linking of data to concepts. Where opinions are
involved this means focusing on group attitude as a whole and not individual case studies (Babbie,
2009). Punch (2005, p.45) stresses the idea behind empirical research as a link between research
questions and data, or between concepts and indicators all form part of the overall logic chain within
a social study. Some constituents in this research are so opposed to replacing water blasting with
antifouling paints, they would consider ceasing all use of a treated area. The vast majority however,
95%, maintain that this change would not impact their patronage at all. The empirical criterion of
research questions requires that the link is made from concept to data (Punch, 2005); the concept of
discontinued pool use due to paints replacing blasting is operationally defined and quantified by
asking respondents if they would cease using the pool if antifouling coatings were applied instead of
water blasting (table 3).

52
Establishing group attitudes from a representative sample, a researcher is often faced with the issue
of non‐response (Linder, 2001; De Vaus, 2002; Stoop, 2005). A high rate of non‐response can pose a
threat to survey quality by causing unwanted systematic deviations from the true outcome of a
survey. Of the three survey protagonists (interviewers, respondents and non‐respondents), non‐
respondents are often over looked when they can in fact be a major player in results and in bias
(Stoop, 2005). This issue is very hard to overcome in whatever form of social research being
conducted, a lot of the time the only thing that can be done is to take it (non‐response) into
consideration. This is not the only response issue however; Groves and Couper (1998, p.62) in the
meta‐analysis of their research were concerned over the high response rate (82% to 97%) and
cooperation rate (87% to 98%) they had received. If overall survey cooperation exceeds 90%, it is
difficult to detect subgroups that exhibit large differences in cooperation (Stoop, 2005). A similar
response rate (88%) was experienced in this research. The reason for this could be attributed to high
local patronage and a sense of ownership many local patrons exhibit. The stake the local community
hold in the management of pools within Randwick could be viewed has high with local groups often
performing their own cleaning and maintenance on pools; such as the Bondi Icebergs swimming
club, sacrificing much of their own time and money to maintain the pool at Bondi beach.
Although some local opinion preaches self‐liability regarding pool safety, it is hard to say for certain
the extent to which locals, and any other pool users, would tolerate a slippery unsafe pool area, or
how many would consider holding council liable for any resultant injury. According to Marie‐Louise
McDermott (2005) of the NSW Heritage Office:
“attitudes toward management of the associated risks of rock pool usage have changed over
time; nineteenth century bathers were expected to be prudent enough to avoid dangerous
situations, as the pleasures of a ‘dip’ were thought to outweigh any minor injuries sustained
as pools were seen as a safer swim option than rough, shark‐infested beaches. Today,
people are more likely to seek compensation from council’s for injuries sustained at pools or
other council‐controlled spaces. Councils found the cost of public liability insurance rising to
barely affordable levels and sought to minimise their risk exposure.”
Gauging the sort of information required to understand how likely it is for someone to sue a council
is beyond the scope of this research (and is possibly unethical). What can be deduced is how likely
people are to use, or continue using the pool in the face of some event (table 3).

53
There were some issues encountered whilst analysing the results of this social research. First, as a
group cannot be surveyed as an individual respondent due to bias (De Vaus, 2002; David and Sutton,
2004; Walden, 2006), it was often difficult to recruit some individuals who were within a group.
These individuals were requested, but in no way coerced, to step out of the group to perform the
survey. This was the source of most denials. Although most days of the week and times of day were
covered in the recruiting process, a factor that may or may not influence the results pertains to the
time of year the research was conducted. Respondents were recruited in the months of August and
September where cleaning of pools is performed more often leading into summer. Also in the colder
months patronage patterns are likely to be much different and would elicit different results.
As all data was pooled, individual survey results were not available. These could have been
used to correlate variables such as age and injury, or patronage and locality. Instead most of these
have been reported as observations instead of detailed in quantifiable data. However, the data
gathered during this study was sufficient to satisfy the original goals of the research and to draw
conclusions relevant to public opinion of antifouling and safety.

54
Conclusion
Fouling on coastal platforms provides an ongoing challenge for stakeholders. This study investigated
possible solutions to this issue through trialling a number of antifouling candidates that could
resolve the issue of slippery surfaces on these platforms.
The wax application on W4 was the most successful component of all treatments. However, the
overall concept of a wax as an antifouling coating for coastal platforms has logistical difficulties. It
would be difficult to apply to vast areas, as seen around many ocean pools. Its effectiveness as an
antifouling coating however is apparent, as investigated by Asfar (2008), and does have potential for
future applications. Coatings X4 and X6, though not ready as a solution, showed potential with
further refinement and experimentation. The same applies to the wax coating W3 whose
performance was best suited to calm, low impact conditions, as is seen at a harbour location or bay.
The success of Y3 at Clovelly suggests its use at similar sites (as Clovelly) could be further
investigated and could quite reasonably be applied as a substitute to physical cleaning. Otherwise, a
period of using the coating with a lower frequency of cleaning could be adopted. The roughness of
the surface on Y3 could mean it could be used as an anti‐slip coating for occasionally wet/fouled
surfaces, such as the Clovelly promenade.
The results of the survey display a vested concern of pool users in pool maintenance and safety. The
introduction of antifouling paints at the expense of water blasting is likely to draw more interest
than objection from patrons. The major issue expressed by the public relates to how much algal
growth there is around the pool, whether this relates to a perceived danger or an aesthetic concern,
depends entirely on the success of the treatment. Public response to use of an antifouling coating
will largely be determined by the non‐toxic nature of the coating (section 7.6) as well as its ability to
inhibit fouling (section 7.7). If antifouling paints were to be integrated, pool use is likely to remain
stable neither attracting nor discouraging pool users either way.
With the development of an antifouling coating that is both environmentally friendly and can
substantially inhibit fouling, mechanical cleaning of ocean platforms may no longer be necessary.
Future direction in the development of such a coating could look at the success of wax based
coatings such as those trialled in this study, and note the positive response from the public to a
coating that meets the aforementioned criteria of non‐toxic and anti‐slip.

55

56
References Abbott, A., Abel, P. D., Arnold, D. W. and Milne, A., (2000) Cost‐benefit analysis of the use of TBT: the
case for a treatment approach. The science of the total environment, 258: 5‐19. Asfar, A., (2008) Settlement of marine fouling organisms in response to novel antifouling coatings.
PhD Thesis, UNSW, Sydney. Babbie, E. R., (2009) The practice of modern research. 12th edition, Cengage Learning, 1‐390 Briggs, C. L., (1986) Learning how to ask: a socio‐liguistic appraisal of the role of the interview in
social science research. Cambridge University Press, Cambridge, 13‐43. Callow, M. E., Anderson, C., Atlar, M., Candries, M., Nilne, A. and Townsin, R. .L, (2003) The
development of foul‐release coatings for seagoing vessels. Marine design and operations, B4 Champ, M. A. and Seligman, P. F., (1996) An introduction to organotin compounds and their use in
antifouling coatings. In: Champ, M. A. and Seligman, P. F., (eds.) Organotin: environmental fate and effects. 1st edition, Springer, San Diego, 1‐26.
Charlton, T., (2008) Antifouling technologies for coastal pools and platforms. Project proposal,
UNSW, (unpublished) Clare, A. S., (1996) Marine natural product antifoulants: status and potential. Biofouling 9: 211–229 Cook, P., (1989) Localities: the changing face of urban Britain, Unwin Hyman, London, xiv – 321 Corbetta, P., (2003) Social research: theory, methods and techniques. SAGE, 164‐193 Costa‐Pierce, B. A. and Bridger, C. J., (2002) The role of marine aquaculture facilities as habitats and
ecosystems. In: Stickney, R. R. and McVey, J. P., Responsible marine aquaculture. CBAI, U.K., 105‐144
David, M. and Sutton, C. D., (2004) Social research: the basics. SAGE, 15‐22 De Vaus, D. A., (2002) Surveys in social research. 5th edition, Routledge, 22‐96. Evans, L. V., (1988) Marine biofouling. In: Algae and human affairs. Lembi, C. A. and Waaland, J. R.,
(eds.), Cambridge University Press, 433‐455. Evans, L. V., (2000) Biofilms: recent advances in their study and control. 1st edition, CRC press, 101‐
117. Gotoh, K., (2007) Cleaning using a high speed impinging jet. In: Kohli, R. and Mittal, K. L., (eds.)
Developments in surface contamination and cleaning. William Andrew Publishing, 889‐918. Groves, R. M. and Couper, M. P., (1998) Nonresponse in household interview surveys. John Wiley,
New York, 62

57
Haak, P. W., (1996) Antifouling systems, current status and developments. In: The present status of TBT‐copolymer antifouling paints: proceedings of the international symposium on antifouling paints for ocean‐going vessels. The Hague, 9‐16.
Hayes, C., (2007) Vertical distribution of algal species in rock pools in south‐eastern Australia. Cross‐
sections, Australian National University, 3 Hoggart, K., Lees, L. and Davies, A., (2002) Researching human geography. Oxford University Press
Inc, New York, 169‐175. Holmstrom, C., Steinberg, P. and Kjelleberg, S., (2004) Bioprospecting novel antifoulants and anti‐
biofilm agents from microbes. In: Bull, A. T., Microbial diversity and bioprospecting. ASM Press, 405‐414
Howell, D. and Behrends, B., (2006) A review of surface roughness in antifouling coatings illustrating
the importance of cutoff length. School of Marine Science and Technology, University of Newcastle, U.K., Biofouling 22(6): 401‐410
Hughes, D. J., Cook, E. J. and Sayer, M. D. J., (2005) Biofiltration and biofouling on artificial structures
in Europe: the potential for mitigating organic impacts. Oceanographic and Marine Biology Annual Review 43: 123‐172.
Jones, D. S., (1992) A review of Australian fouling barnacles. In: Morton, B., Asian marine biology.
Hong Kong University Press, Hong Kong, 9‐10: 89‐100 Kjelleberg, S. and Holmstrom, C., (1994) Antifoulants from bacteria. Proceedings of an International
Workshop, Biofouling: Problems and Solutions, 32‐38 Lewis, T., (1994) Impact of biofouling on the aquaculture industry. In: Kjelleberg, S. and Steinberg, P.,
(eds.) Biofouling: problems and solutions: proceedings of an international workshop. UNSW, Sydney, 32‐38.
Lin, H. J. and Shao, K. T., (2002) The development of subtidal fouling assemblages on artificial
structures in Keelung Harbor, Northern Taiwan. Zoological Studies 41(2): 170‐182 Lindner, J. R., (2001) Handling of nonresponse error. Journal of International Agricultural and
Extension Education, 9(3) 55‐60 Little, B. J. and Wagner, P. A., (1997) Succession in microfouling. In: Nagabhushanam, R. and
Thompson, M., (eds.) Fouling organisms in the Indian Ocean: biology and control technology. Oxford & IBH Publ Co Put Ltd, New Delhi, 105‐134.
McDonnell, G. E., (2007) Antisepsis, disinfection, and sterilization: types, action, and resistance.
Wiley‐Blackwell, United States, 144‐156. McGuirk, M. and O’Neill, P., (2005) Using questionnaires in qualitative human geography. In: Hay, I.,
(ed.) Qualitative research methods in human geography. 2nd edition, Oxford University Press, Victoria, 147‐162.
Munn, C. B., (2004) Marine microbiology: ecology and application. 1st edition, BIOS Scientific Publ,
New York, 255‐272.

58
Nandakumar, K., Sekar, R., Venugopalan, V. P., Nair, K. V. K. and Rao, V. N. R., (2004) Hydrobiologia: early stages of biofilm succession in a lentic freshwater environment. Springer, Netherlands, 512: 97‐108
Neuman, W. L., (2000) Social research methods: Qualitative and quantitative methods. Allyne and
Bacon, Boston, 327‐341 Patton, M. Q., (2002) Qualitative research and evaluation methods. 3rd edition, SAGE, 541‐574 Peet, R., (1998) Modern geographical thought. Wiley‐Blackwell 147‐193 Punch, K., (2005) Introduction to social research: quantitative and qualitative approaches. 2nd
edition, SAGE, 44‐61 Railkin, A. I., (2004) Marine biofouling: colonization processes and defences. 1st edition, CRC press,
25‐227. Ralston, E. and Swain, G., (2009) Bioinspiration – the solution to biofouling control? Bioinspiration
and Biometrics, Center for Corrosion and Biofouling Control, Florida Institute of Technology, Florida 4(1): 15007
Richmond, M. D. and Seed, R. A., (1991) A review of marine macrofouling communities with special
reference to animal fouling. Biofouling 2: 151‐168. Rittscof, D., (2001) Natural product antifoulants and coatings development. In: McClintock, J. B. and
Baker, B. J., (eds.) Marine chemical ecology. 1st edition, CRC Press, New York, 543‐559. Round, F. E., (1996) The ecology of algae. UMI Books, 653 Sheskin, D., (2004) Handbook of parametric and nonparametric statistical procedures. 3rd edition,
CRC Press, 406‐410 Singh, K., (2007) Qauntitative social research methods. SAGE, 271‐307 Steinberg, P. D. and de Nys, R., (1994) Natural Antifoulants from seaweeds. Proceedings of an
International Workshop, Biofouling: Problems and Solutions, 70‐76 Stoop, I. A. L., (2005) The hunt for the last respondent: nonresponse in sample surveys. Sociaal en
Cultureel Planbu, 23‐63 Underwood, A. J. and Anderson, M. J., (1994) Seasonal and temporal aspects of recruitment and
succession in an intertidal estuarine fouling assemblage. J. Mar. Biol. Ass. U.K. 74: 563‐584 Underwood, A. J., (1997) Experiments in ecology: Their logical design and interpretation using
analysis of variance. Cambridge University Press, U.K., 504 Wahl, M., (1989), Marine epibiosis. I. Fouling and antifouling: some basic aspects. Marine Ecology
Progress Series 58: 175‐189.
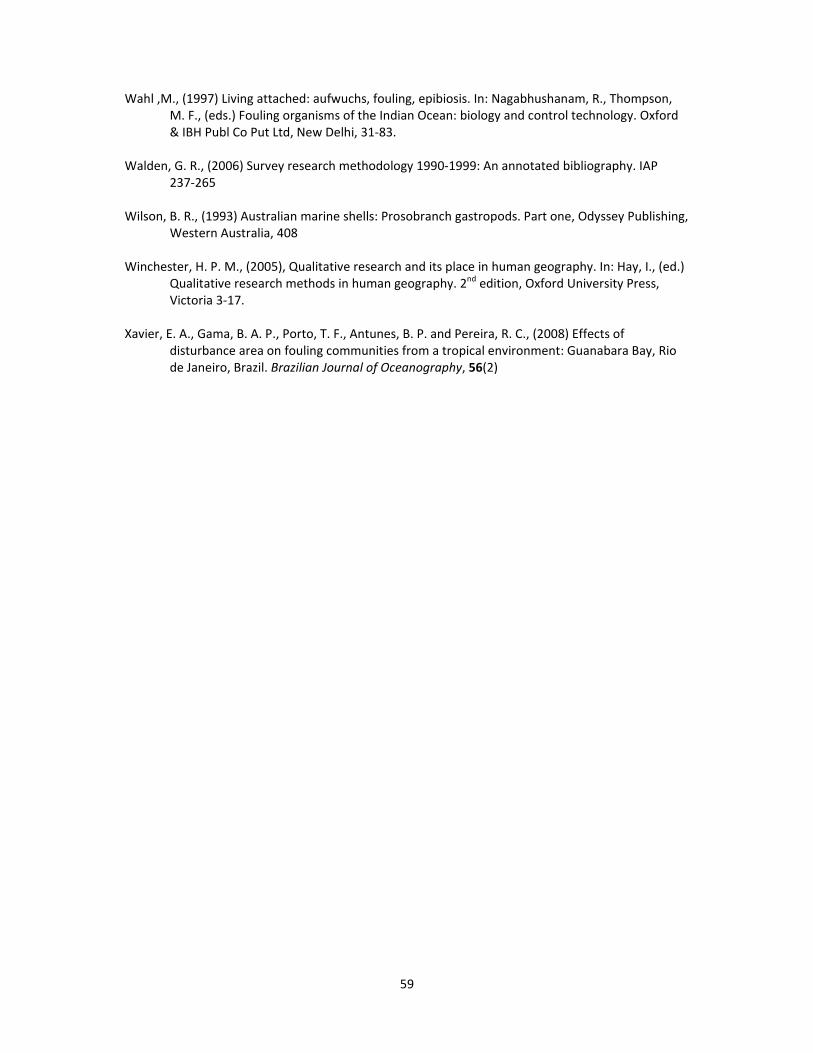
59
Wahl ,M., (1997) Living attached: aufwuchs, fouling, epibiosis. In: Nagabhushanam, R., Thompson, M. F., (eds.) Fouling organisms of the Indian Ocean: biology and control technology. Oxford & IBH Publ Co Put Ltd, New Delhi, 31‐83.
Walden, G. R., (2006) Survey research methodology 1990‐1999: An annotated bibliography. IAP
237‐265 Wilson, B. R., (1993) Australian marine shells: Prosobranch gastropods. Part one, Odyssey Publishing,
Western Australia, 408 Winchester, H. P. M., (2005), Qualitative research and its place in human geography. In: Hay, I., (ed.)
Qualitative research methods in human geography. 2nd edition, Oxford University Press, Victoria 3‐17.
Xavier, E. A., Gama, B. A. P., Porto, T. F., Antunes, B. P. and Pereira, R. C., (2008) Effects of
disturbance area on fouling communities from a tropical environment: Guanabara Bay, Rio de Janeiro, Brazil. Brazilian Journal of Oceanography, 56(2)

60
Appendices

61
Appendix A1:
Images of treated tiles used in experiments
Z3 Y3
W3 W4
X3 X4
X5 X6
C/XC CC

62
Appendix A2:
Percentage fouling cover on tiles after five weeks (note: no visible fouling weeks 1 ‐4) (4.2)
Site Treatment Score Site Treatment Score Site Treatment Score
Malabar Z3 0 Clovelly Z3 0 Rozelle Z3 4
Malabar Z3 0 Clovelly Z3 0 Rozelle Z3 6
Malabar Z3 0 Clovelly Z3 0 Rozelle Y3 26
Malabar Y3 0 Clovelly Y3 0 Rozelle Y3 40
Malabar Y3 0 Clovelly Y3 0 Rozelle W3 21
Malabar Y3 0 Clovelly Y3 0 Rozelle W3 20
Malabar W3 0 Clovelly W3 0 Rozelle W4 6
Malabar W3 0 Clovelly W3 0 Rozelle W4 10
Malabar W3 0 Clovelly W3 0 Rozelle C 37
Malabar W4 0 Clovelly W4 0 Rozelle C 27
Malabar W4 0 Clovelly W4 0 Rozelle X3 8
Malabar W4 0 Clovelly W4 0 Rozelle X3 14
Malabar C 0 Clovelly C 0 Rozelle X4 17
Malabar C 0 Clovelly C 0 Rozelle X4 23
Malabar C 0 Clovelly C 0 Rozelle X5 5
Malabar X3 0 Clovelly X3 0 Rozelle X5 5
Malabar X3 0 Clovelly X3 0 Rozelle X6 9
Malabar X3 0 Clovelly X3 0 Rozelle X6 22
Malabar X4 0 Clovelly X4 0 Rozelle XC 3
Malabar X4 0 Clovelly X4 0 Rozelle XC 2
Malabar X4 0 Clovelly X4 0 Rozelle CC 3
Malabar X5 0 Clovelly X5 0 Rozelle CC 2
Malabar X5 0 Clovelly X5 0
Malabar X5 0 Clovelly X5 0
Malabar X6 0 Clovelly X6 0
Malabar X6 0 Clovelly X6 0
Malabar X6 0 Clovelly X6 0
Malabar XC 0
Malabar XC 0
Malabar XC 0
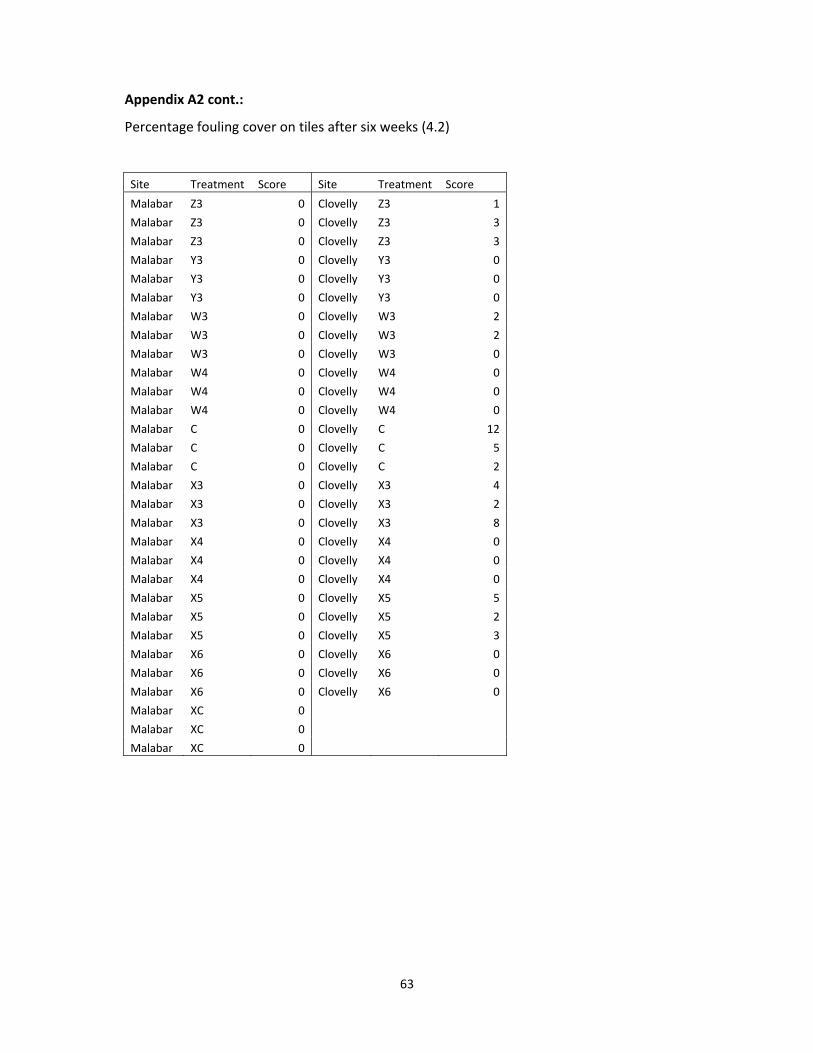
63
Appendix A2 cont.:
Percentage fouling cover on tiles after six weeks (4.2)
Site Treatment Score Site Treatment Score
Malabar Z3 0 Clovelly Z3 1
Malabar Z3 0 Clovelly Z3 3
Malabar Z3 0 Clovelly Z3 3
Malabar Y3 0 Clovelly Y3 0
Malabar Y3 0 Clovelly Y3 0
Malabar Y3 0 Clovelly Y3 0
Malabar W3 0 Clovelly W3 2
Malabar W3 0 Clovelly W3 2
Malabar W3 0 Clovelly W3 0
Malabar W4 0 Clovelly W4 0
Malabar W4 0 Clovelly W4 0
Malabar W4 0 Clovelly W4 0
Malabar C 0 Clovelly C 12
Malabar C 0 Clovelly C 5
Malabar C 0 Clovelly C 2
Malabar X3 0 Clovelly X3 4
Malabar X3 0 Clovelly X3 2
Malabar X3 0 Clovelly X3 8
Malabar X4 0 Clovelly X4 0
Malabar X4 0 Clovelly X4 0
Malabar X4 0 Clovelly X4 0
Malabar X5 0 Clovelly X5 5
Malabar X5 0 Clovelly X5 2
Malabar X5 0 Clovelly X5 3
Malabar X6 0 Clovelly X6 0
Malabar X6 0 Clovelly X6 0
Malabar X6 0 Clovelly X6 0
Malabar XC 0
Malabar XC 0
Malabar XC 0

64
Appendix A2 cont.:
Percentage fouling cover on tiles after seven weeks (4.2)
Site Treatment Score Site Treatment Score
Malabar Z3 0 Clovelly Z3 25
Malabar Z3 2 Clovelly Z3 30
Malabar Z3 4 Clovelly Z3 19
Malabar Y3 0 Clovelly Y3 0
Malabar Y3 0 Clovelly Y3 4
Malabar Y3 0 Clovelly Y3 0
Malabar W3 2 Clovelly W3 5
Malabar W3 3 Clovelly W3 5
Malabar W3 0 Clovelly W3 3
Malabar W4 0 Clovelly W4 0
Malabar W4 0 Clovelly W4 0
Malabar W4 0 Clovelly W4 0
Malabar C 2 Clovelly C 81
Malabar C 1 Clovelly C 89
Malabar C 1 Clovelly C 90
Malabar X3 2 Clovelly X3 12
Malabar X3 2 Clovelly X3 15
Malabar X3 1 Clovelly X3 67
Malabar X4 0 Clovelly X4 2
Malabar X4 0 Clovelly X4 3
Malabar X4 2 Clovelly X4 4
Malabar X5 2 Clovelly X5 70
Malabar X5 1 Clovelly X5 44
Malabar X5 1 Clovelly X5 39
Malabar X6 0 Clovelly X6 8
Malabar X6 2 Clovelly X6 7
Malabar X6 1 Clovelly X6 1
Malabar XC 2
Malabar XC 2
Malabar XC 2

65
Appendix A2 cont.:
Percentage fouling cover on tiles after eight weeks (4.2)
Site Treatment Score Site Treatment Score Site Treatment Score
Malabar Z3 17 Clovelly Z3 79 Rozelle Z3 90
Malabar Z3 16 Clovelly Z3 82 Rozelle Z3 87
Malabar Z3 32 Clovelly Z3 74 Rozelle Y3 99
Malabar Y3 14 Clovelly Y3 0 Rozelle Y3 95
Malabar Y3 24 Clovelly Y3 0 Rozelle W3 79
Malabar Y3 18 Clovelly Y3 0 Rozelle W3 78
Malabar W3 16 Clovelly W3 63 Rozelle W4 76
Malabar W3 3 Clovelly W3 41 Rozelle W4 54
Malabar W3 4 Clovelly W3 44 Rozelle C 83
Malabar W4 6 Clovelly W4 2 Rozelle C 84
Malabar W4 15 Clovelly W4 0 Rozelle X3 80
Malabar W4 18 Clovelly W4 0 Rozelle X3 85
Malabar C 12 Clovelly C 99 Rozelle X4 88
Malabar C 20 Clovelly C 98 Rozelle X4 89
Malabar C 23 Clovelly C 99 Rozelle X5 88
Malabar X3 24 Clovelly X3 85 Rozelle X5 86
Malabar X3 26 Clovelly X3 59 Rozelle X6 89
Malabar X3 30 Clovelly X3 90 Rozelle X6 82
Malabar X4 7 Clovelly X4 12 Rozelle XC 91
Malabar X4 7 Clovelly X4 17 Rozelle XC 91
Malabar X4 26 Clovelly X4 16 Rozelle CC 32
Malabar X5 21 Clovelly X5 91 Rozelle CC 41
Malabar X5 16 Clovelly X5 76
Malabar X5 11 Clovelly X5 79
Malabar X6 5 Clovelly X6 20
Malabar X6 11 Clovelly X6 18
Malabar X6 3 Clovelly X6 2
Malabar XC 18
Malabar XC 23
Malabar XC 30

66
Appendix A2 cont.:
Percentage fouling cover on tiles after nine weeks (4.2)
Site Treatment Score Site Treatment Score
Malabar Z3 92 Clovelly Z3 80
Malabar Z3 90 Clovelly Z3 82
Malabar Z3 95 Clovelly Z3 84
Malabar Y3 77 Clovelly Y3 38
Malabar Y3 83 Clovelly Y3 33
Malabar Y3 69 Clovelly Y3 40
Malabar W3 76 Clovelly W3 81
Malabar W3 52 Clovelly W3 64
Malabar W3 61 Clovelly W3 83
Malabar W4 45 Clovelly W4 1
Malabar W4 78 Clovelly W4 0
Malabar W4 72 Clovelly W4 3
Malabar C 88 Clovelly C 100
Malabar C 91 Clovelly C 100
Malabar C 90 Clovelly C 100
Malabar X3 78 Clovelly X3 89
Malabar X3 74 Clovelly X3 76
Malabar X3 89 Clovelly X3 91
Malabar X4 25 Clovelly X4 20
Malabar X4 23 Clovelly X4 21
Malabar X4 71 Clovelly X4 21
Malabar X5 82 Clovelly X5 93
Malabar X5 76 Clovelly X5 82
Malabar X5 23 Clovelly X5 75
Malabar X6 24 Clovelly X6 24
Malabar X6 22 Clovelly X6 22
Malabar X6 3 Clovelly X6 14
Malabar XC 83
Malabar XC 79
Malabar XC 94

67
Appendix A2 cont.:
Percentage fouling cover on tiles after ten weeks (4.2)
Site Treatment Score Site Treatment Score Site Treatment Score
Malabar Z3 94 Clovelly Z3 93 Rozelle Z3 82
Malabar Z3 91 Clovelly Z3 90 Rozelle Z3 75
Malabar Z3 91 Clovelly Z3 92 Rozelle Y3 95
Malabar Y3 86 Clovelly Y3 91 Rozelle Y3 93
Malabar Y3 82 Clovelly Y3 85 Rozelle W3 81
Malabar Y3 90 Clovelly Y3 81 Rozelle W3 43
Malabar W3 80 Clovelly W3 83 Rozelle W4 60
Malabar W3 74 Clovelly W3 87 Rozelle W4 43
Malabar W3 71 Clovelly W3 90 Rozelle C 89
Malabar W4 79 Clovelly W4 22 Rozelle C 81
Malabar W4 72 Clovelly W4 26 Rozelle X3 93
Malabar W4 76 Clovelly W4 37 Rozelle X3 90
Malabar C 91 Clovelly C 100 Rozelle X4 91
Malabar C 93 Clovelly C 100 Rozelle X4 91
Malabar C 92 Clovelly C 100 Rozelle X5 90
Malabar X3 82 Clovelly X3 88 Rozelle X5 87
Malabar X3 82 Clovelly X3 92 Rozelle X6 88
Malabar X3 84 Clovelly X3 97 Rozelle X6 91
Malabar X4 60 Clovelly X4 44 Rozelle XC 97
Malabar X4 53 Clovelly X4 48 Rozelle XC 100
Malabar X4 80 Clovelly X4 51 Rozelle CC 26
Malabar X5 79 Clovelly X5 98 Rozelle CC 36
Malabar X5 72 Clovelly X5 92
Malabar X5 77 Clovelly X5 89
Malabar X6 40 Clovelly X6 47
Malabar X6 59 Clovelly X6 56
Malabar X6 13 Clovelly X6 14
Malabar XC 88
Malabar XC 85
Malabar XC 92
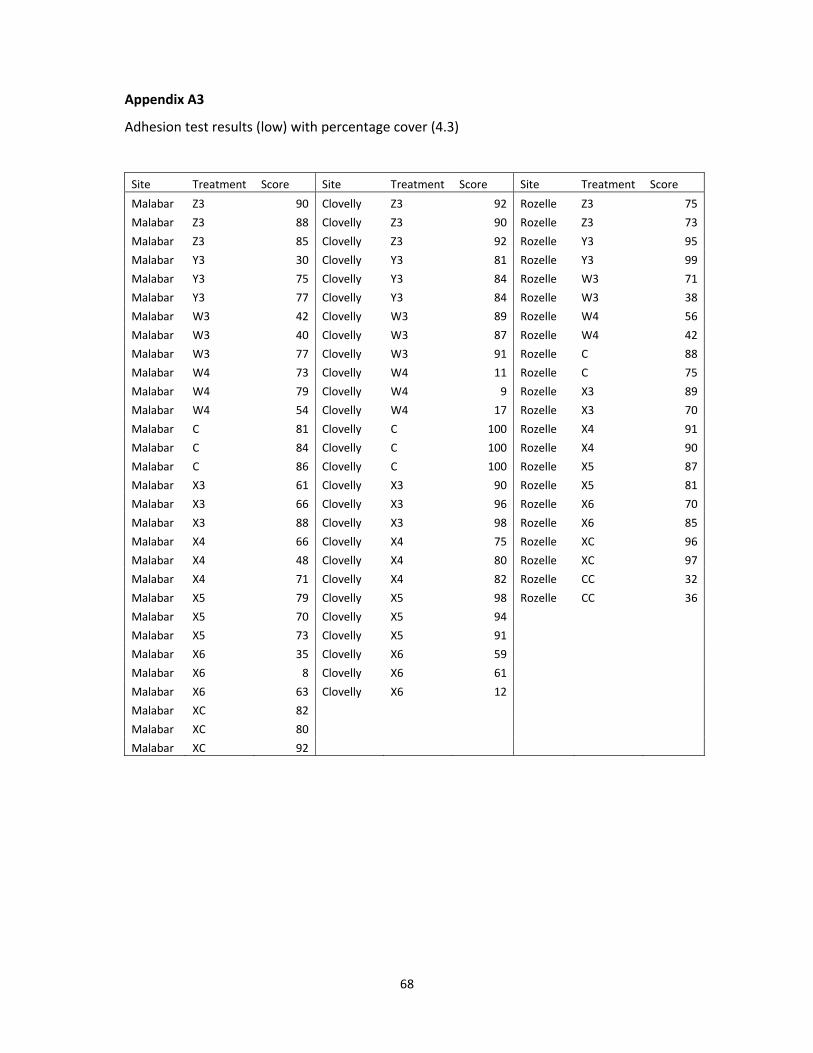
68
Appendix A3
Adhesion test results (low) with percentage cover (4.3)
Site Treatment Score Site Treatment Score Site Treatment Score
Malabar Z3 90 Clovelly Z3 92 Rozelle Z3 75
Malabar Z3 88 Clovelly Z3 90 Rozelle Z3 73
Malabar Z3 85 Clovelly Z3 92 Rozelle Y3 95
Malabar Y3 30 Clovelly Y3 81 Rozelle Y3 99
Malabar Y3 75 Clovelly Y3 84 Rozelle W3 71
Malabar Y3 77 Clovelly Y3 84 Rozelle W3 38
Malabar W3 42 Clovelly W3 89 Rozelle W4 56
Malabar W3 40 Clovelly W3 87 Rozelle W4 42
Malabar W3 77 Clovelly W3 91 Rozelle C 88
Malabar W4 73 Clovelly W4 11 Rozelle C 75
Malabar W4 79 Clovelly W4 9 Rozelle X3 89
Malabar W4 54 Clovelly W4 17 Rozelle X3 70
Malabar C 81 Clovelly C 100 Rozelle X4 91
Malabar C 84 Clovelly C 100 Rozelle X4 90
Malabar C 86 Clovelly C 100 Rozelle X5 87
Malabar X3 61 Clovelly X3 90 Rozelle X5 81
Malabar X3 66 Clovelly X3 96 Rozelle X6 70
Malabar X3 88 Clovelly X3 98 Rozelle X6 85
Malabar X4 66 Clovelly X4 75 Rozelle XC 96
Malabar X4 48 Clovelly X4 80 Rozelle XC 97
Malabar X4 71 Clovelly X4 82 Rozelle CC 32
Malabar X5 79 Clovelly X5 98 Rozelle CC 36
Malabar X5 70 Clovelly X5 94
Malabar X5 73 Clovelly X5 91
Malabar X6 35 Clovelly X6 59
Malabar X6 8 Clovelly X6 61
Malabar X6 63 Clovelly X6 12
Malabar XC 82
Malabar XC 80
Malabar XC 92

69
Appendix A3 cont.:
Adhesion test results (medium) with percentage cover (4.3)
Site Treatment Score Site Treatment Score Site Treatment Score
Malabar Z3 90 Clovelly Z3 92 Rozelle Z3 68
Malabar Z3 84 Clovelly Z3 90 Rozelle Z3 65
Malabar Z3 85 Clovelly Z3 93 Rozelle Y3 90
Malabar Y3 25 Clovelly Y3 92 Rozelle Y3 95
Malabar Y3 67 Clovelly Y3 94 Rozelle W3 66
Malabar Y3 62 Clovelly Y3 88 Rozelle W3 27
Malabar W3 30 Clovelly W3 83 Rozelle W4 40
Malabar W3 36 Clovelly W3 88 Rozelle W4 31
Malabar W3 69 Clovelly W3 93 Rozelle C 78
Malabar W4 69 Clovelly W4 7 Rozelle C 59
Malabar W4 71 Clovelly W4 10 Rozelle X3 87
Malabar W4 58 Clovelly W4 22 Rozelle X3 79
Malabar C 88 Clovelly C 99 Rozelle X4 90
Malabar C 83 Clovelly C 100 Rozelle X4 90
Malabar C 91 Clovelly C 99 Rozelle X5 89
Malabar X3 81 Clovelly X3 89 Rozelle X5 76
Malabar X3 85 Clovelly X3 91 Rozelle X6 73
Malabar X3 82 Clovelly X3 98 Rozelle X6 79
Malabar X4 63 Clovelly X4 55 Rozelle XC 99
Malabar X4 53 Clovelly X4 74 Rozelle XC 94
Malabar X4 80 Clovelly X4 78 Rozelle CC 18
Malabar X5 70 Clovelly X5 98 Rozelle CC 21
Malabar X5 68 Clovelly X5 94
Malabar X5 76 Clovelly X5 90
Malabar X6 37 Clovelly X6 70
Malabar X6 9 Clovelly X6 78
Malabar X6 71 Clovelly X6 19
Malabar XC 84
Malabar XC 83
Malabar XC 97
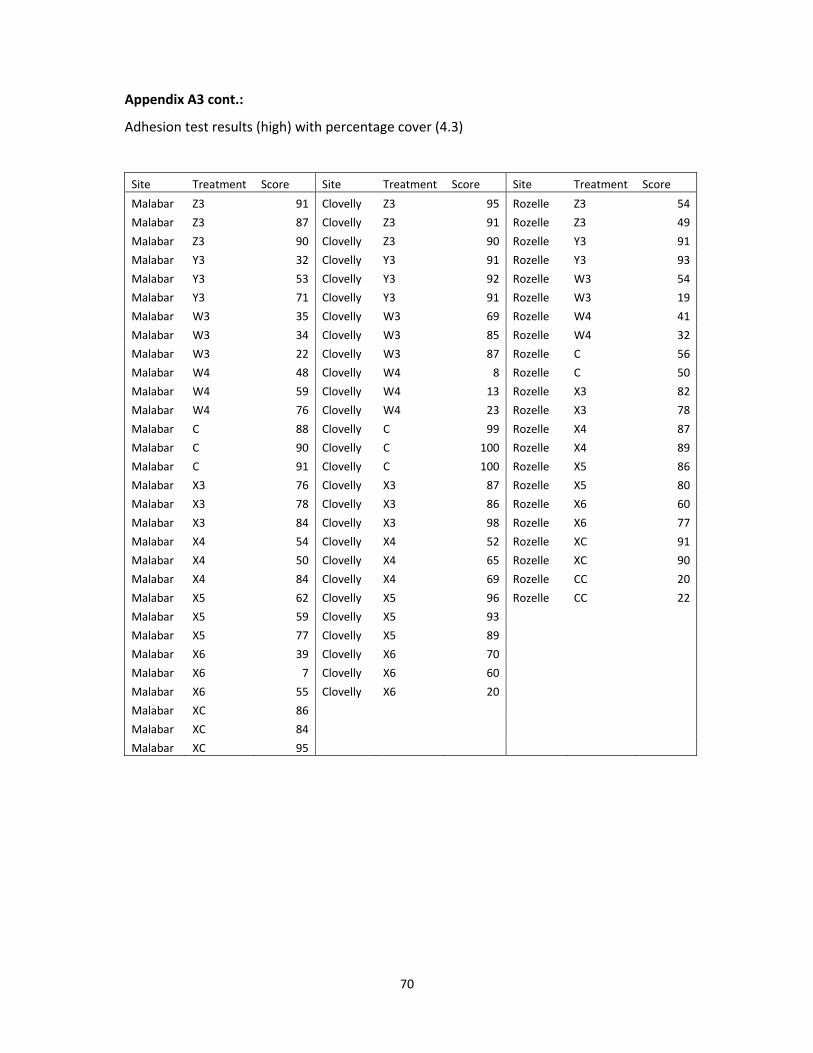
70
Appendix A3 cont.:
Adhesion test results (high) with percentage cover (4.3)
Site Treatment Score Site Treatment Score Site Treatment Score
Malabar Z3 91 Clovelly Z3 95 Rozelle Z3 54
Malabar Z3 87 Clovelly Z3 91 Rozelle Z3 49
Malabar Z3 90 Clovelly Z3 90 Rozelle Y3 91
Malabar Y3 32 Clovelly Y3 91 Rozelle Y3 93
Malabar Y3 53 Clovelly Y3 92 Rozelle W3 54
Malabar Y3 71 Clovelly Y3 91 Rozelle W3 19
Malabar W3 35 Clovelly W3 69 Rozelle W4 41
Malabar W3 34 Clovelly W3 85 Rozelle W4 32
Malabar W3 22 Clovelly W3 87 Rozelle C 56
Malabar W4 48 Clovelly W4 8 Rozelle C 50
Malabar W4 59 Clovelly W4 13 Rozelle X3 82
Malabar W4 76 Clovelly W4 23 Rozelle X3 78
Malabar C 88 Clovelly C 99 Rozelle X4 87
Malabar C 90 Clovelly C 100 Rozelle X4 89
Malabar C 91 Clovelly C 100 Rozelle X5 86
Malabar X3 76 Clovelly X3 87 Rozelle X5 80
Malabar X3 78 Clovelly X3 86 Rozelle X6 60
Malabar X3 84 Clovelly X3 98 Rozelle X6 77
Malabar X4 54 Clovelly X4 52 Rozelle XC 91
Malabar X4 50 Clovelly X4 65 Rozelle XC 90
Malabar X4 84 Clovelly X4 69 Rozelle CC 20
Malabar X5 62 Clovelly X5 96 Rozelle CC 22
Malabar X5 59 Clovelly X5 93
Malabar X5 77 Clovelly X5 89
Malabar X6 39 Clovelly X6 70
Malabar X6 7 Clovelly X6 60
Malabar X6 55 Clovelly X6 20
Malabar XC 86
Malabar XC 84
Malabar XC 95

71
Appendix A4:
Mean percentage fouling loss due to pressure (4.3.2) (data are ± SE (n=3(n=2, Rozelle))
Site Treatment Low pressure Medium pressure High pressure
Malabar Z3 4 7 3 Y3 31 42 41 W3 30 41 61 W4 0 4 10 C 9 5 2 X3 13 0 5 X4 3 0 2 X5 3 7 13 X6 5 0 8 XC 3 0 0
Clovelly Z3 1 0 0 Y3 3 0 0 W3 0 0 8 W4 57 54 46 X3 0 0 2 X4 0 0 0 X5 0 0 0 X6 0 0 0 C 0 1 1
Rozelle Z3 3 12 32 Y3 1 5 6 W3 31 46 54 W4 14 37 35 C 13 27 44 X3 4 13 16 X4 10 3 5 X5 9 10 10 X6 14 16 24 XC 2 2 8 CC 31 59 57
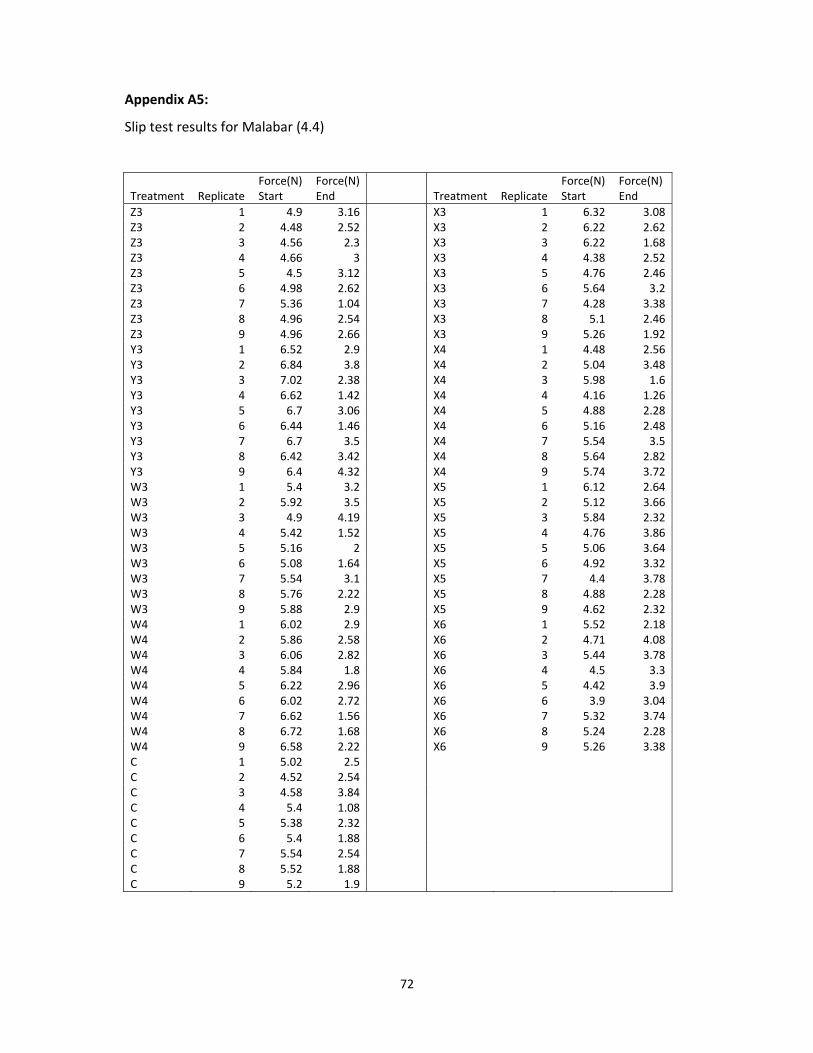
72
Appendix A5:
Slip test results for Malabar (4.4)
Force(N) Force(N) Force(N) Force(N)Treatment Replicate Start End Treatment Replicate Start End
Z3 1 4.9 3.16 X3 1 6.32 3.08Z3 2 4.48 2.52 X3 2 6.22 2.62Z3 3 4.56 2.3 X3 3 6.22 1.68Z3 4 4.66 3 X3 4 4.38 2.52Z3 5 4.5 3.12 X3 5 4.76 2.46Z3 6 4.98 2.62 X3 6 5.64 3.2Z3 7 5.36 1.04 X3 7 4.28 3.38Z3 8 4.96 2.54 X3 8 5.1 2.46Z3 9 4.96 2.66 X3 9 5.26 1.92Y3 1 6.52 2.9 X4 1 4.48 2.56Y3 2 6.84 3.8 X4 2 5.04 3.48Y3 3 7.02 2.38 X4 3 5.98 1.6Y3 4 6.62 1.42 X4 4 4.16 1.26Y3 5 6.7 3.06 X4 5 4.88 2.28Y3 6 6.44 1.46 X4 6 5.16 2.48Y3 7 6.7 3.5 X4 7 5.54 3.5Y3 8 6.42 3.42 X4 8 5.64 2.82Y3 9 6.4 4.32 X4 9 5.74 3.72W3 1 5.4 3.2 X5 1 6.12 2.64W3 2 5.92 3.5 X5 2 5.12 3.66W3 3 4.9 4.19 X5 3 5.84 2.32W3 4 5.42 1.52 X5 4 4.76 3.86W3 5 5.16 2 X5 5 5.06 3.64W3 6 5.08 1.64 X5 6 4.92 3.32W3 7 5.54 3.1 X5 7 4.4 3.78W3 8 5.76 2.22 X5 8 4.88 2.28W3 9 5.88 2.9 X5 9 4.62 2.32W4 1 6.02 2.9 X6 1 5.52 2.18W4 2 5.86 2.58 X6 2 4.71 4.08W4 3 6.06 2.82 X6 3 5.44 3.78W4 4 5.84 1.8 X6 4 4.5 3.3W4 5 6.22 2.96 X6 5 4.42 3.9W4 6 6.02 2.72 X6 6 3.9 3.04W4 7 6.62 1.56 X6 7 5.32 3.74W4 8 6.72 1.68 X6 8 5.24 2.28W4 9 6.58 2.22 X6 9 5.26 3.38C 1 5.02 2.5C 2 4.52 2.54C 3 4.58 3.84C 4 5.4 1.08C 5 5.38 2.32C 6 5.4 1.88C 7 5.54 2.54C 8 5.52 1.88C 9 5.2 1.9

73
Appendix A5 cont.:
Slip test results for Clovelly
Force(N) Force(N) Force(N) Force(N)Treatment Replicate Start End Treatment Replicate Start End
Z3 1 4.9 4.06 X3 1 6.32 3.94Z3 2 4.48 3.44 X3 2 6.22 1.92Z3 3 4.56 3.88 X3 3 6.22 2.18Z3 4 4.66 3.84 X3 4 4.38 4.56Z3 5 4.5 1.24 X3 5 4.76 4.5Z3 6 4.98 3.72 X3 6 5.64 3.46Z3 7 5.36 3.04 X3 7 4.28 2.66Z3 8 4.96 4.02 X3 8 5.1 3.88Z3 9 4.96 3.18 X3 9 5.26 2.84Y3 1 6.52 4.26 X4 1 4.48 2.8Y3 2 6.84 4.08 X4 2 5.04 2.88Y3 3 7.02 3.96 X4 3 5.98 2.64Y3 4 6.62 6.78 X4 4 4.16 5.52Y3 5 6.7 5.42 X4 5 4.88 3.38Y3 6 6.44 3.92 X4 6 5.16 3.52Y3 7 6.7 5.14 X4 7 5.54 3.12Y3 8 6.42 4.26 X4 8 5.64 4.66Y3 9 6.4 4.48 X4 9 5.74 3.02W3 1 5.4 3.88 X5 1 6.12 1.62W3 2 5.92 4.1 X5 2 5.12 1.42W3 3 4.9 3.14 X5 3 5.84 3.84W3 4 5.42 3.7 X5 4 4.76 2.54W3 5 5.16 3.02 X5 5 5.06 4.1W3 6 5.08 3.62 X5 6 4.92 4.04W3 7 5.54 3.08 X5 7 4.4 4.34W3 8 5.76 4.58 X5 8 4.88 3.82W3 9 5.88 3.04 X5 9 4.62 1.72W4 1 6.02 4.06 X6 1 5.52 3.52W4 2 5.86 4.04 X6 2 4.71 2.94W4 3 6.06 3.72 X6 3 5.44 2.96W4 4 5.84 2.56 X6 4 4.5 4W4 5 6.22 4.6 X6 5 4.42 4.5W4 6 6.02 4.8 X6 6 3.9 4.06W4 7 6.62 2.46 X6 7 5.32 2.52W4 8 6.72 4.23 X6 8 5.24 4.04W4 9 6.58 2.8 X6 9 5.26 4.06C 1 5.02 4.6C 2 4.52 2.22C 3 4.58 3.32C 4 5.4 4.32C 5 5.38 3.7C 6 5.4 3.02C 7 5.54 3.72C 8 5.52 3.32C 9 5.2 4.12

74
Appendix A5 cont.:
Slip test results for Rozelle
Force(N) Force(N) Force(N) Force(N)Treatment Replicate Start End Treatment Replicate Start End
Z3 1 4.9 3.28 X3 1 6.32 2.24Z3 2 4.48 3.88 X3 2 6.22 3.88Z3 3 4.56 4.23 X3 3 6.22 2.58Z3 4 4.66 2.96 X3 4 4.38 3.24Z3 5 4.5 2.88 X3 5 4.76 2.24Z3 6 4.98 2.54 X3 6 5.64 4.9Z3 7 5.36 X3 7 4.28 Z3 8 4.96 X3 8 5.1 Z3 9 4.96 X3 9 5.26 Y3 1 6.52 6.3 X4 1 4.48 5.33Y3 2 6.84 3.58 X4 2 5.04 5.66Y3 3 7.02 4.96 X4 3 5.98 4.3Y3 4 6.62 3.14 X4 4 4.16 5.46Y3 5 6.7 2.9 X4 5 4.88 2.86Y3 6 6.44 2.16 X4 6 5.16 5.64Y3 7 6.7 X4 7 5.54 Y3 8 6.42 X4 8 5.64 Y3 9 6.4 X4 9 5.74 W3 1 5.4 5.74 X5 1 6.12 3.54W3 2 5.92 5.26 X5 2 5.12 4.5W3 3 4.9 5.16 X5 3 5.84 4.28W3 4 5.42 5.88 X5 4 4.76 2.54W3 5 5.16 4.36 X5 5 5.06 2.32W3 6 5.08 5.96 X5 6 4.92 3.44W3 7 5.54 X5 7 4.4 W3 8 5.76 X5 8 4.88 W3 9 5.88 X5 9 4.62 W4 1 6.02 3.26 X6 1 5.52 2.56W4 2 5.86 2.96 X6 2 4.71 3.74W4 3 6.06 3.62 X6 3 5.44 3.8W4 4 5.84 4.58 X6 4 4.5 4.48W4 5 6.22 4.86 X6 5 4.42 4.84W4 6 6.02 3.88 X6 6 3.9 4.82W4 7 6.62 X6 7 5.32 W4 8 6.72 X6 8 5.24 W4 9 6.58 X6 9 5.26 C 1 5.02 4.5 CC 1 4.9C 2 4.52 5.7 CC 2 5.26C 3 4.58 6.06 CC 3 5.7C 4 5.4 1.58 CC 4 5.36C 5 5.38 5.64 CC 5 5.02C 6 5.4 3.78 CC 6 6.16C 7 5.54 C 8 5.52 C 9 5.2
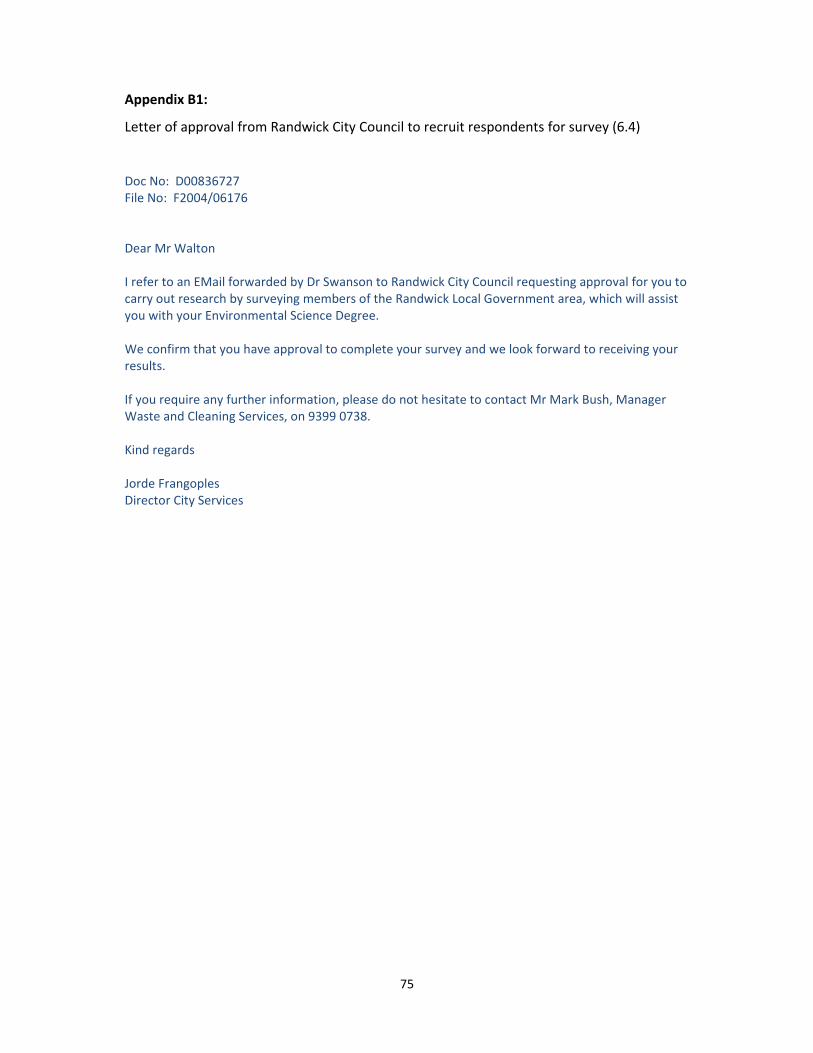
75
Appendix B1:
Letter of approval from Randwick City Council to recruit respondents for survey (6.4)
Doc No: D00836727
File No: F2004/06176
Dear Mr Walton
I refer to an EMail forwarded by Dr Swanson to Randwick City Council requesting approval for you to carry out research by surveying members of the Randwick Local Government area, which will assist you with your Environmental Science Degree. We confirm that you have approval to complete your survey and we look forward to receiving your results. If you require any further information, please do not hesitate to contact Mr Mark Bush, Manager Waste and Cleaning Services, on 9399 0738. Kind regards Jorde Frangoples Director City Services

76
Appendix B2:
Confirmation of ethics approval from UNSW to recruit respondents for survey (6.4)
Dear Todd and Wendy Your application File No. 1194 Title: “Antifouling technologies for coastal pools and platforms and community responses” has received ethical clearance. You may proceed to recruit participants for your project. Please quote your file number in any future correspondence. Regards Linda Linda Camilleri Personal Assistant to Head of School School of Psychology University of New South Wales Room 1013, Mathews Building Sydney NSW 2052, AUSTRALIA

77
Appendix B3
Copy of survey used in study (6.3)
SURVEY OF RANDWICK CITY COUNCIL OCEAN POOL USERS
For the University of New South Wales
In association with Sydney Coastal Councils Group
And Randwick City Council

78
‐How often do you use this pool?
Never
Rarely (less than once a month)
Moderately (at least once a month)
Frequently (at least once a week)
Very frequently (more than once a week)
‐Do you consider any of the following to be a significant health hazard to you
and other pool users?
(if yes scale from 1‐5 with 5 being the most hazardous and 1 being the least)
(No Hazard)(Least Hazard ) (Most Hazard)
0 1 2 3 4 5
Dangerous surf/weather
Rock falls
Pollution
Slippery surfaces
Blue bottles
Other/_________________

79
‐Have you ever slipped over whilst walking around the pool area?
(if yes how badly were you hurt? Scale 1‐5 where 1 is not badly hurt and 5 is
badly hurt)
(Never slipped) (Badly hurt)
0 1 2 3 4 5
‐If yes, how were you injured?
‐Did you take any action due to this event? If yes what sort of action?
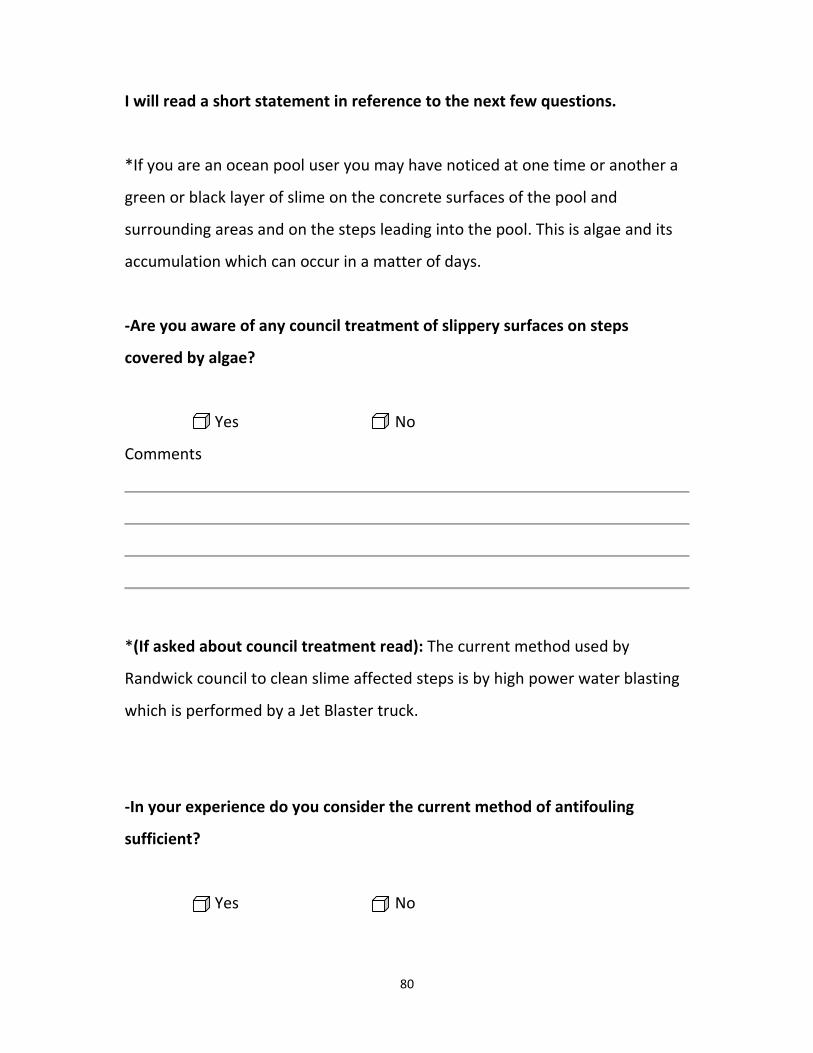
80
I will read a short statement in reference to the next few questions.
*If you are an ocean pool user you may have noticed at one time or another a
green or black layer of slime on the concrete surfaces of the pool and
surrounding areas and on the steps leading into the pool. This is algae and its
accumulation which can occur in a matter of days.
‐Are you aware of any council treatment of slippery surfaces on steps
covered by algae?
Yes No
Comments
*(If asked about council treatment read): The current method used by
Randwick council to clean slime affected steps is by high power water blasting
which is performed by a Jet Blaster truck.
‐In your experience do you consider the current method of antifouling
sufficient?
Yes No

81
‐The slip hazard may be reduced by limiting algal growth with non‐toxic
coatings. Would you have any reservations about the use of these antifouling
coatings as an alternative to jet blasting? If yes why?
Yes No
‐Do you have any proposed alternatives or suggestions to the current
method of antifouling?

82
‐Would you cease or reduce using the pool if:
Yes No Reduce
You slipped and hurt yourself?
Water blasting was replaced with antifouling coating?
Algae was left to grow without cleaning?
GENERAL INFORMATION
What age bracket do you belong to?
Under 15 16‐30 31‐45 46‐60 Over 60
What suburb do you live in?
Thank you very much for your time and effort!
If you have any questions about this survey and its purpose please don’t
hesitate to contact me at the following address.
E‐mail: [email protected]
Regards,
Todd Walton
University of New South Wales
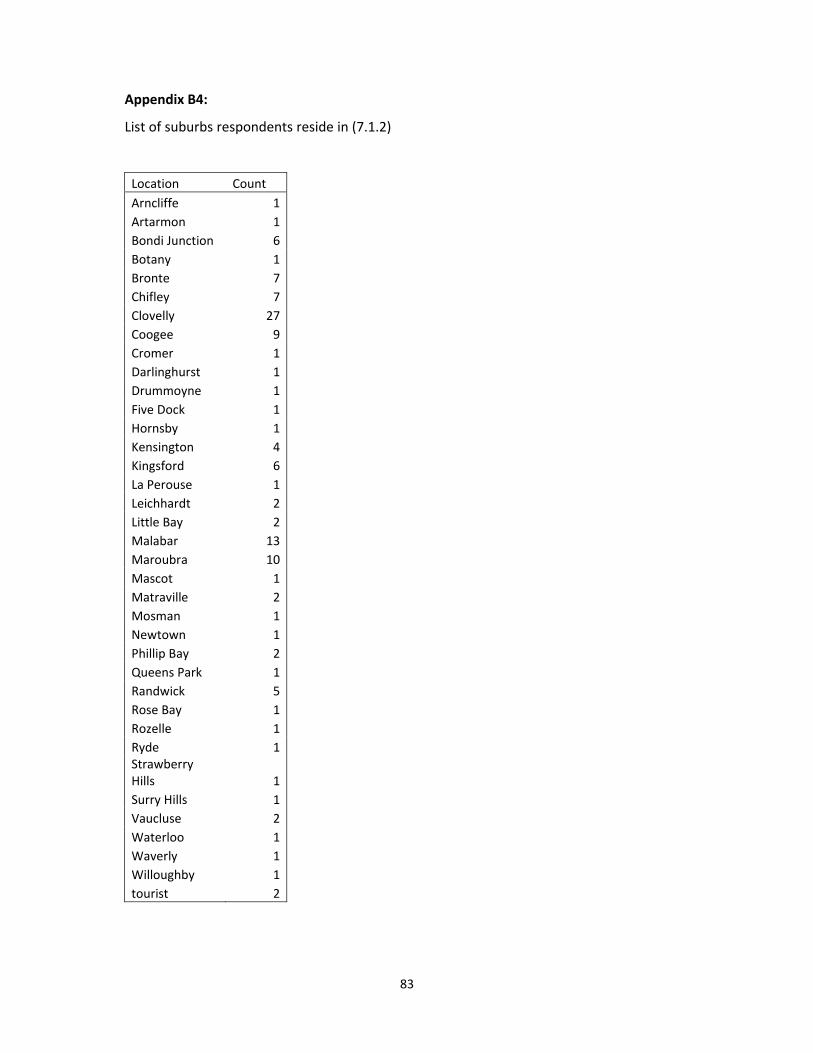
83
Appendix B4:
List of suburbs respondents reside in (7.1.2)
Location Count
Arncliffe 1
Artarmon 1
Bondi Junction 6
Botany 1
Bronte 7
Chifley 7
Clovelly 27
Coogee 9
Cromer 1
Darlinghurst 1
Drummoyne 1
Five Dock 1
Hornsby 1
Kensington 4
Kingsford 6
La Perouse 1
Leichhardt 2
Little Bay 2
Malabar 13
Maroubra 10
Mascot 1
Matraville 2
Mosman 1
Newtown 1
Phillip Bay 2
Queens Park 1
Randwick 5
Rose Bay 1
Rozelle 1
Ryde 1 Strawberry Hills 1
Surry Hills 1
Vaucluse 2
Waterloo 1
Waverly 1
Willoughby 1
tourist 2

84
Appendix B5:
List of occurrences around pools considered hazards by respondents (7.3)
Hazard Count
Broken bottles 1
Bad behaviour 4
Cars 2
Gaps in the railings 1
Not enough lifeguards 1
Shallow rocks/banks 11
Sharks 25
Tourists 1
Uneven surfaces 1
Unsupervised children 1
Urchins/oysters 15