Embed Size (px)
Citation preview
Presented at the 8th Annual CMAS Conference, Chapel Hill, NC, October 19-21, 2009
1
ANTHROPOGENIC IMPACTS ON ORGANIC AEROSOL: REGIONAL AIR QUALITY MODELING RESULTS FROM THE 2007 BAQS-MET FIELD STUDY
Craig Stroud*, Paul Makar, Michael Moran, Wanmin Gong, Sunling Gong, Junhua Zhang, Jeff Brook, Veronique Bouchet
Air Quality Research Division, Environment Canada, Toronto, Canada
Jonathan Abbatt, Jay Slowik, Steve Sjosted Department of Chemistry, University of Toronto, Toronto, Canada
1. INTRODUCTION Atmospheric aerosols have important human
health impacts and are estimated to cause more than a million premature deaths globally per year (Davidson et al., 2005). Organics comprise approximately half of the PM2.5 (particulate matter with diameter less than 2.5 µm) and may be a major player in the aerosol health effects. Ambient data indicate that oxygenated organic aerosol (OOA) comprises a large fraction of the organic aerosol (OA). However, our understanding of the origin, transformation and fate of OOA is poorly known. As a result, our understanding of the OA budget is highly uncertain.
Most modeling studies underpredict OA concentrations especially in urban air masses. Emission inventories treat primary OA (POA) as non-volatile; however, recent research results suggest that fresh POA is relatively volatile at ambient organic particle concentrations (Robinson et al., 2007) and can evaporate, oxidize and re-condense to form OOA relatively quickly (time scale of a few hours).
Source contribution OA studies are also highly uncertain. Carbon radioactive dating studies suggest the majority of the organic aerosol carbon is not from fossil fuel sources (Szidat et al., 2004). However, recent results from field programs downwind of major urban centers suggest that OA mass concentration is larger in urban plumes and that the carbon is from fossil fuel origin (de Gouw et al., 2008). Biomass burning has been identified as an episodic OA source and wood burning for heat has seasonal contributions.
The Border Air Quality and Meteorology Study (BAQS-Met 2007) was an opportunity to collect high temporal resolution AMS OA data at two
*Corresponding author: Craig Stroud, Air Quality Research Division, Environment Canada, 4905 Dufferin Street, Toronto, ON, Canada, M3H 5T4, 416-739-4849; e-mail: [email protected]
super-sites (Bear Creek and Harrow) in southern Ontario. Important local emissions include the Detroit/Windsor urban area and point source industries along Lake Huron, Lake St Clair and Lake Erie. The proximity of the emissions to the Great Lakes provides the opportunity for plumes (and associated chemical aging of emissions) to be modified by the lake-breeze circulations. The goal of this study is to evaluate Environment Canadaʹ′s model, AURAMS (A Unified Regional Air Quality Modeling System). AURAMS will also be used to estimate important precursor contributions to SOA formation on urban and regionally polluted scales in southern Ontario. 2. EXPERIMENTAL 2.1 Regional Air Quality Modeling
Organic aerosol loadings were predicted using AURAMS version 1.4.0: an off-line regional chemical-transport model that is driven by the Canadian operational weather forecast model, GEM (Global Environmental Multiscale model) (Cote et al., 1998). A recent description of AURAMS can be found in Stroud et al., (2007). Hourly anthropogenic point, area and mobile emissions were prepared for AURAMS with the 2005 Canadian and U.S. national emission inventories and version 2.3 of the SMOKE emissions processing system. Biogenic emissions were calculated online by AURAMS using BEIS version 3.09 algorithms, the Biogenic Emissions Landcover Database (BELD3) vegetation data set and meteorological fields. Biogenic VOC emissions are speciated for isoprene, monoterpenes, sesquiterpenes and “other VOCs”. Sesquiterpenes are calculated as a temperature-dependent function of monoterpene emission. Intermediate volatile organic compounds (IVOCs) are not resolved in the emissions inventories; following and were assumed to be proportional to
Presented at the 8th Annual CMAS Conference, Chapel Hill, NC, October 19-21, 2009
2
1.5x the POA emissions (Robinson et al., 2007). The existing POA emissions were also modified to represent assumed sub-grid scale evaporation and recondensation. The existing POA emissions were multiplied by 0.75 and assigned as SOA while the remaining 0.25 fraction stayed as POA. This split was based on a gas-particle volatility calculation at an organic loading of 10 µg m-3 assuming the POA mass-volatility distribution in Robinson et al., (1997).
The gas-phase chemical mechanism in AURAMS is ADOM-II mechanism with additional auxiliary diagnostic reactions to track more speciated VOCs. Numerical solution is via the KPP-generated Rosenbrock solver. The VOC speciation was expanded to include a representation of benzene (BENZ) oxidation with the hydroxyl radical (OH). A lumped sesquiterpene species was added to the ADOM-‐II mechanism and modeled with β-‐caryophyllene O3/OH/NO3 kinetics. An IVOC species was added to the mechanism and modeled with an OH oxidation rate coefficient of 3x10-11 cm3 molec-1 sec-1 (Robison et. al., 2007). A lumped monoterpene species was separated from the original ADOM-‐II anthropogenic long-‐chain alkene species and assigned the OH/O3/NO3 kinetics of α-‐pinene (PINE).
A description of the organic aerosol parameterization and references can be found in Slowik et al., (2009). The organic aerosol yield approach was applied to the following VOC precursor species: isoprene (ISOP), monoterpenes (PINE), sesquiterpenes (SESQ), benzene (BENZ), mono-‐substituted aromatics (TOLU), multi-‐substituted aromatics (AROM), long chain anthropogenic alkenes (ALKE), and long chain anthropogenic alkanes (ALKA). Aerosol yields were calculated for low and high NOx limits as a function of existing organic aerosol loadings (including both primary and secondary aerosol) and temperature. A linear interpolation between the low NOx and high NOx incremental SOA mass was performed based on the fraction of the RO2 radicals which react with HOx vs. NOx . AURAMS incorporates the Canadian aerosol module (CAM), which is a size-resolved, multi-component, sectional aerosol algorithm for solving nucleation, condensation, coagulation, hygroscopicity, and particle deposition. Equilibrium inorganic gas-aerosol partitioning was solved with the vectorized HETV module. Dry deposition of gases is based on Wesley’s resistance parameterization. In-cloud aerosol scavenging (aerosol activation to cloud droplets), below-cloud scavenging of gases and particles, evaporation, and in-cloud aqueous chemistry were solved with a cloud processing module. Currently, AURAMS
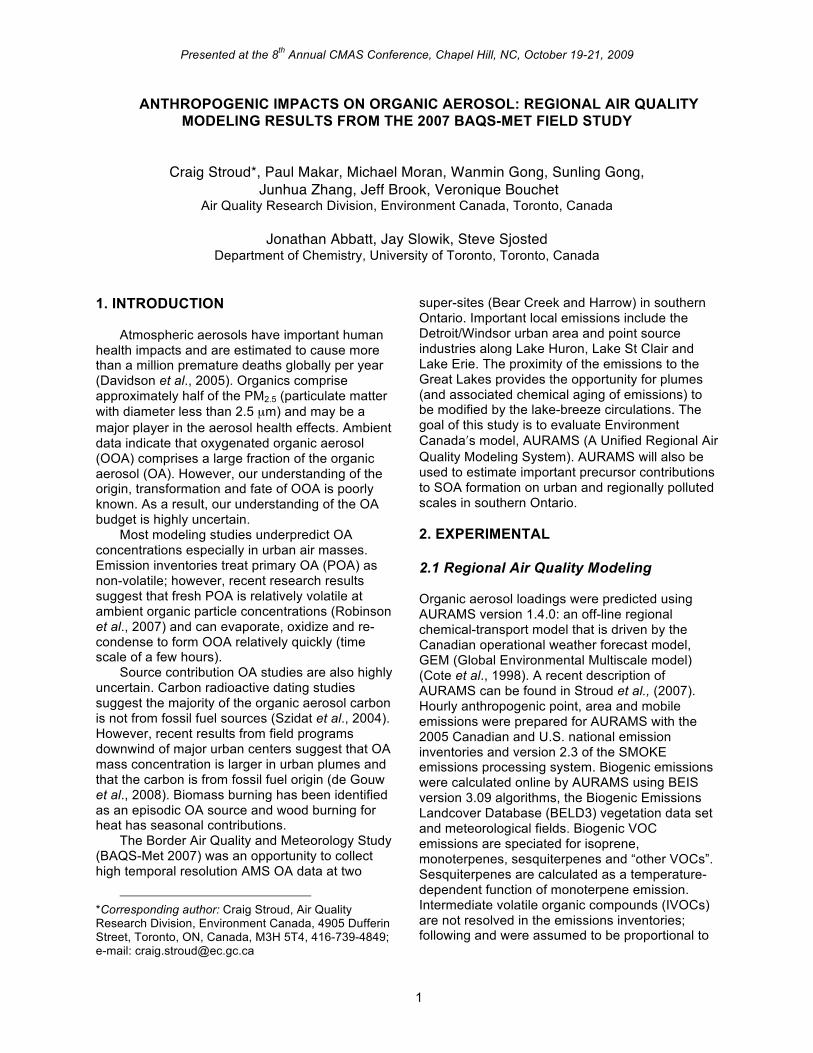
considers 12 particle-diameter size bins between 0.01 and 41 µm and nine chemical components (POA, SOA, elemental carbon (EC), sulfate, nitrate, ammonium, sea-salt, crustal material, and particle-bound water). Condensation of the SOA to the particle size distribution is described by a modified Fuchs-‐Sutugin equation. A nested grid configuration was used for the chemical-‐transport model with an outer continental grid at 42 km resolution, an inner eastern North American grid at 15 km resolution, and a fine-‐scale 2.5 km grid over the BAQS-‐Met study region. Twenty-‐eight terrain-‐following vertical layers were used with the lowest layer at a thickness of 15 m. AURAMS was run on the 42 km and 15 km grids from June 1 to July 15, 2007 and for the period July 1 to July 8, 2007 for the high resolution 2.5 km grid. 2.2 Measurements Organic aerosol sampling for the BAQS-‐Met field intensive took place at Harrow, ON from 18 June to 11 July 2007 and at Bear Creek, ON from 28 June to 10 July 2007. Harrow is a rural location of mostly farmland approximately 40 km southeast of Detroit/Windsor. Bear Creek is a rural location also of mostly farmland approximately 60 km northeast of Detroit/Windsor across Lake St. Clair. The size-‐resolved, non-‐refractory composition of submicron aerosol particles was measured with an Aerodyne aerosol mass spectrometer (AMS) at both sites. The AMS organic mass spectra were analyzed using a positive matrix factorization (PMF) technique as described in Slowik et al. (2009). Four factors were derived at both sites and were identified as OOA-‐1 (aged oxygenated), OOA-‐2 (fresh oxygenated), HOA (hydrocarbon-‐line) and UNKN (unknown local). Simulated organic aerosol was also compared to the 24-hr average observations from the STN network made every third day between June 3 and July 15, 2007. STN uses the thermo-optical reflectance (TOR) protocol to determine fine organic carbon (OC) concentrations. Figure 1 illustrates the STN sites in northeastern U.S. and eastern Canada which resulted in a data set of 946 samples. Samples were collected on quartz filters and analyzed for fine OC.
Presented at the 8th Annual CMAS Conference, Chapel Hill, NC, October 19-21, 2009
3
Fig. 1. STN sites in the AURAMS 15-km domain.
3. RESULTS AND DISCUSSION 3.1 Evaluation with STN Data
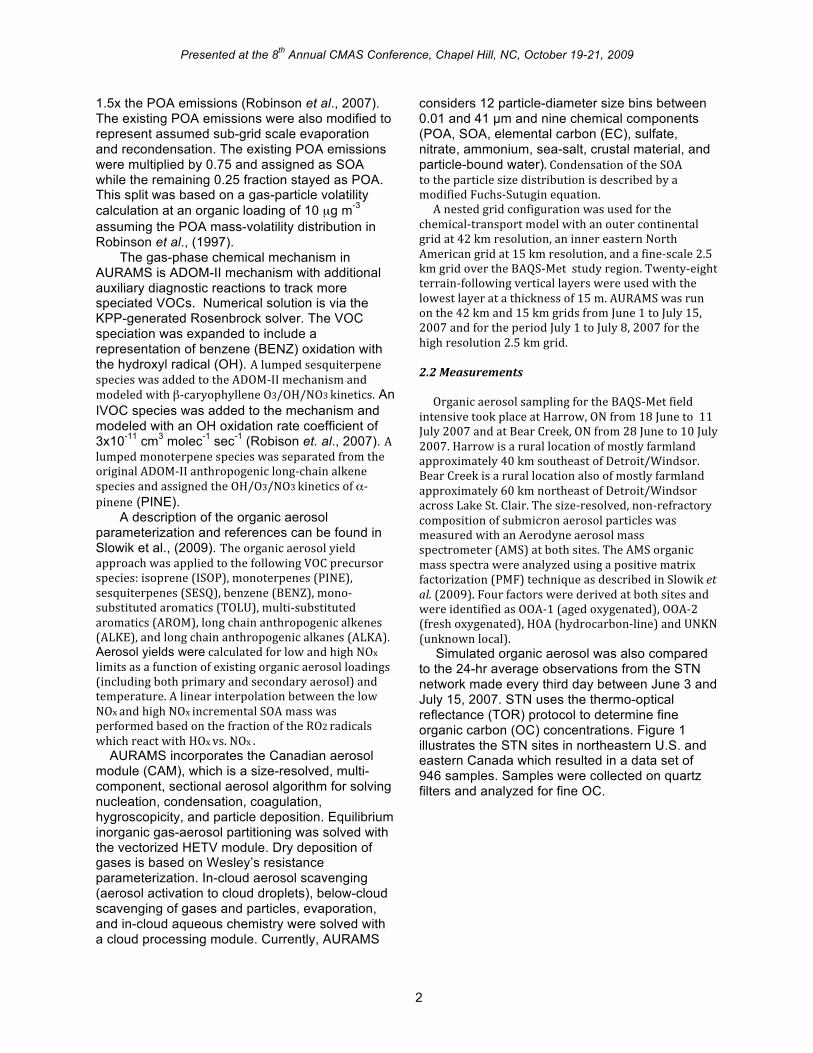
Figure 1 illustrates the AURAMS PM2.5 OA
correlation with STN PM2.5 OA for the AURAMS simulation at 15 km grid spacing.
Fig. 2. AURAMS PM2.5 OA correlation with STN data.
Table 1 lists the statistics for the comparison
with the STN data. The STN data average over all the sites was 6.5±2.9 ug/m3. The model has a mean bias of -1.7 ug/m3 and a root mean square error (RMSE) of 3.2 ug/m3. The correlation coefficient, R, is 0.50 which is comparable to other secondary aerosol components (e.g. sulfate
aerosol). The slope and intercept imply that the observations have a wider range than model (higher maxima and lower minima).
Table 1. Comparison of AURAMS (15 km grid spacing) with STN data N=946 pts June 3 - July 15, 2007
AURAMS v1.4.0 beta
Model OA Average 4.8±2.7 µg m-3
Data OA Average 6.5±2.9 µg m-3
Slope 0.49±0.03
Intercept 1.7±0.2 µg m-3
Slope (forced intercept to zero)
0.98±0.02
Mean Bias -1.7 µg m-3
RMSE 3.2 µg m-3
Correlation, R 0.51
Assumed an OA to OC ratio of 1.4 (by mass) for STN data.
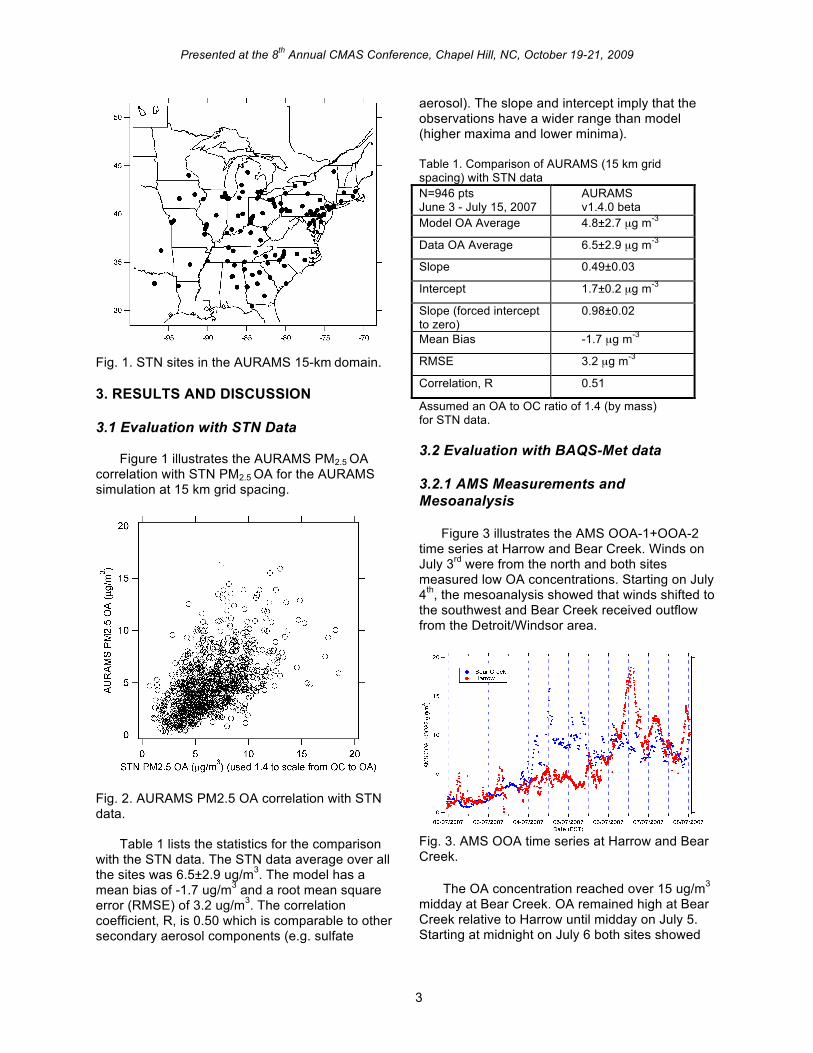
3.2 Evaluation with BAQS-Met data 3.2.1 AMS Measurements and Mesoanalysis Figure 3 illustrates the AMS OOA-1+OOA-2 time series at Harrow and Bear Creek. Winds on July 3rd were from the north and both sites measured low OA concentrations. Starting on July 4th, the mesoanalysis showed that winds shifted to the southwest and Bear Creek received outflow from the Detroit/Windsor area.
Fig. 3. AMS OOA time series at Harrow and Bear Creek.
The OA concentration reached over 15 ug/m3 midday at Bear Creek. OA remained high at Bear Creek relative to Harrow until midday on July 5. Starting at midnight on July 6 both sites showed

Presented at the 8th Annual CMAS Conference, Chapel Hill, NC, October 19-21, 2009
4
an OA increase likely reflecting an increase in the regional background for the study region. By midday on July 6th, the mesoanalysis showed that the flow had switched to the northwest and Harrow received outflow from the Detroit/Windsor area. The OA peaked at 18 ug/m3 midday for Harrow on July 6. On July 7th, OA measured at both sites tracked well and reflects the high regional background in southern Ontario. 3.2.2 Model Time Series and Surface Maps
Figure 4 illustrates the model SOA time series at Bear Creek and Harrow at both 15 km and 2.5 km resolution. The model predicts low concentrations on July 3rd, similar to the measurements.
Fig. 4. AURAMS SOA time series at Harrow and Bear Creek. Starting midday on July 4th, AURAMS predicts a multi-peak maximum at midday. The time series of AURAMS surface maps suggest the first peak is from the Chatham urban plume, the second peak is from the Greater Detroit/Windsor area and the third peak may be the Greater Detroit/Windsor plume with influence from ship emissions at the mouth of the St. Clair River.
Fig. 5. AURAMS surface SOA distribution at July 4, 18Z. The timing and magnitude of the second model peak at July 4th, 13 EST is similar to the measured maximum. Starting on July 6th at midnight, the model predicted an increase in the regional background which affected both sites. However, the July 6th midday measured maximum at Harrow was not captured by the model. The model surface map does capture the lake breeze front near the northern shore of Lake Erie. The model- measurement comparison suggests the lake breeze may be too strong in the model pushing the modeled Detroit/Windsor plume inland and to the east (Figure 6.).
Fig. 6. AURAMS surface SOA distribution at July 6, 21Z. On July 7th, the model predicts that both sites are in the high regionally distributed background air mass. The comparison between the model time series for the 15 km and 2.5 km resolution suggests that the 15 km resolution is reasonable to capture regionally distributed air masses; however, the high resolution model predicts higher SOA in the plumes. This likely reflects the enhanced ability of the high resolution model to capture the non-linearities in the SOA formation mechanism. The Odum et al. yield equations are very sensitive to the model grid spacing due to the feedback through the organic aerosol loading term. Coarse model grids may help to explain the general trend of model organic aerosol underpredictions in the literature. 3.3 SOA Precursor Contributions 3.3.1 Case Study Periods
Several sensitivity simulations were performed to address the question about the relative importance of the precursor species to SOA
Presented at the 8th Annual CMAS Conference, Chapel Hill, NC, October 19-21, 2009
5
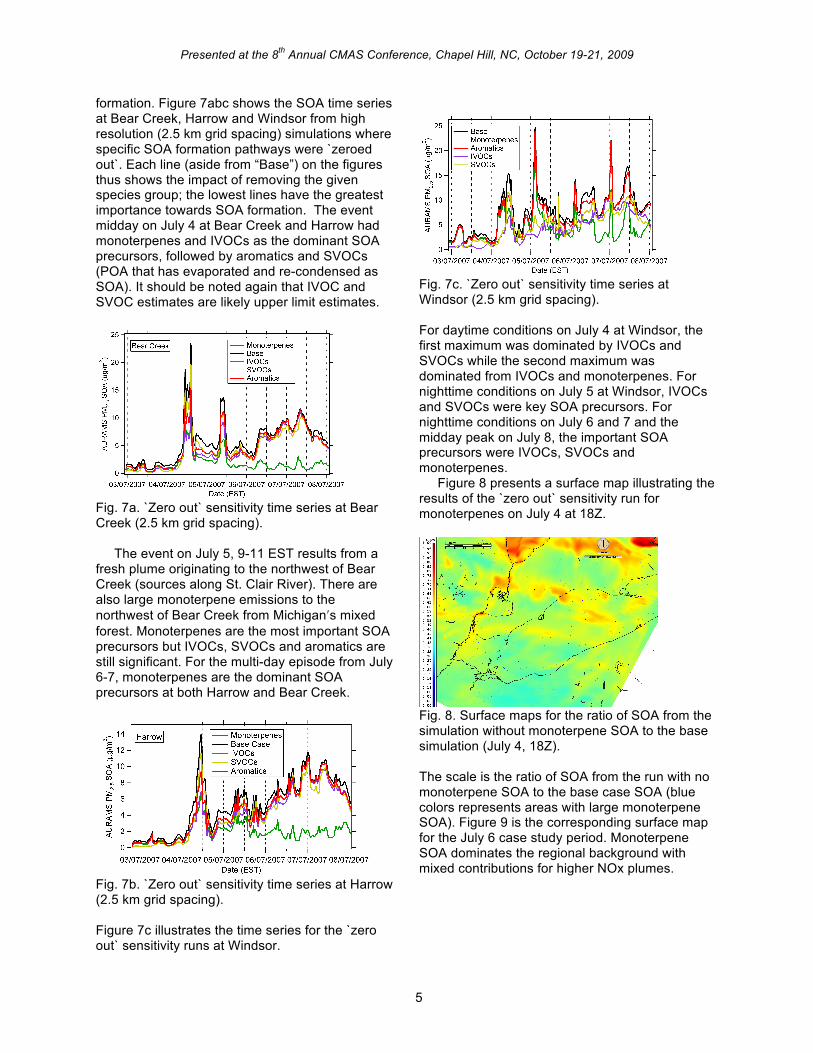
formation. Figure 7abc shows the SOA time series at Bear Creek, Harrow and Windsor from high resolution (2.5 km grid spacing) simulations where specific SOA formation pathways were `zeroed out`. Each line (aside from “Base”) on the figures thus shows the impact of removing the given species group; the lowest lines have the greatest importance towards SOA formation. The event midday on July 4 at Bear Creek and Harrow had monoterpenes and IVOCs as the dominant SOA precursors, followed by aromatics and SVOCs (POA that has evaporated and re-condensed as SOA). It should be noted again that IVOC and SVOC estimates are likely upper limit estimates.
Fig. 7a. `Zero out` sensitivity time series at Bear Creek (2.5 km grid spacing).
The event on July 5, 9-11 EST results from a fresh plume originating to the northwest of Bear Creek (sources along St. Clair River). There are also large monoterpene emissions to the northwest of Bear Creek from Michiganʹ′s mixed forest. Monoterpenes are the most important SOA precursors but IVOCs, SVOCs and aromatics are still significant. For the multi-day episode from July 6-7, monoterpenes are the dominant SOA precursors at both Harrow and Bear Creek.
Fig. 7b. `Zero out` sensitivity time series at Harrow (2.5 km grid spacing). Figure 7c illustrates the time series for the `zero out` sensitivity runs at Windsor.
Fig. 7c. `Zero out` sensitivity time series at Windsor (2.5 km grid spacing).
For daytime conditions on July 4 at Windsor, the first maximum was dominated by IVOCs and SVOCs while the second maximum was dominated from IVOCs and monoterpenes. For nighttime conditions on July 5 at Windsor, IVOCs and SVOCs were key SOA precursors. For nighttime conditions on July 6 and 7 and the midday peak on July 8, the important SOA precursors were IVOCs, SVOCs and monoterpenes. Figure 8 presents a surface map illustrating the results of the `zero out` sensitivity run for monoterpenes on July 4 at 18Z.
Fig. 8. Surface maps for the ratio of SOA from the simulation without monoterpene SOA to the base simulation (July 4, 18Z). The scale is the ratio of SOA from the run with no monoterpene SOA to the base case SOA (blue colors represents areas with large monoterpene SOA). Figure 9 is the corresponding surface map for the July 6 case study period. Monoterpene SOA dominates the regional background with mixed contributions for higher NOx plumes.
Presented at the 8th Annual CMAS Conference, Chapel Hill, NC, October 19-21, 2009
6
Fig. 9. Surface maps for the ratio of SOA from the simulation without monoterpene SOA to the base simulation (July 6, 21Z).
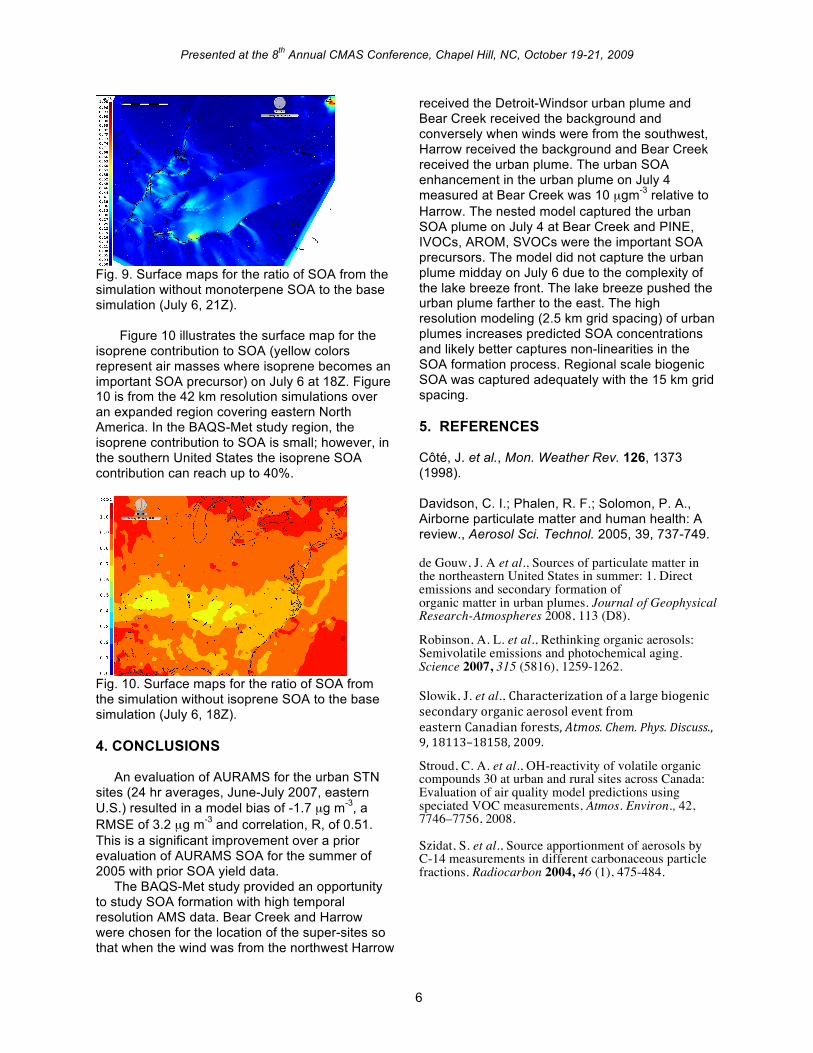
Figure 10 illustrates the surface map for the isoprene contribution to SOA (yellow colors represent air masses where isoprene becomes an important SOA precursor) on July 6 at 18Z. Figure 10 is from the 42 km resolution simulations over an expanded region covering eastern North America. In the BAQS-Met study region, the isoprene contribution to SOA is small; however, in the southern United States the isoprene SOA contribution can reach up to 40%.
Fig. 10. Surface maps for the ratio of SOA from the simulation without isoprene SOA to the base simulation (July 6, 18Z). 4. CONCLUSIONS An evaluation of AURAMS for the urban STN sites (24 hr averages, June-July 2007, eastern U.S.) resulted in a model bias of -1.7 µg m-3, a RMSE of 3.2 µg m-3 and correlation, R, of 0.51. This is a significant improvement over a prior evaluation of AURAMS SOA for the summer of 2005 with prior SOA yield data. The BAQS-Met study provided an opportunity to study SOA formation with high temporal resolution AMS data. Bear Creek and Harrow were chosen for the location of the super-sites so that when the wind was from the northwest Harrow
received the Detroit-Windsor urban plume and Bear Creek received the background and conversely when winds were from the southwest, Harrow received the background and Bear Creek received the urban plume. The urban SOA enhancement in the urban plume on July 4 measured at Bear Creek was 10 µgm-3 relative to Harrow. The nested model captured the urban SOA plume on July 4 at Bear Creek and PINE, IVOCs, AROM, SVOCs were the important SOA precursors. The model did not capture the urban plume midday on July 6 due to the complexity of the lake breeze front. The lake breeze pushed the urban plume farther to the east. The high resolution modeling (2.5 km grid spacing) of urban plumes increases predicted SOA concentrations and likely better captures non-linearities in the SOA formation process. Regional scale biogenic SOA was captured adequately with the 15 km grid spacing. 5. REFERENCES Côté, J. et al., Mon. Weather Rev. 126, 1373 (1998). Davidson, C. I.; Phalen, R. F.; Solomon, P. A., Airborne particulate matter and human health: A review., Aerosol Sci. Technol. 2005, 39, 737-749. de Gouw, J. A et al., Sources of particulate matter in the northeastern United States in summer: 1. Direct emissions and secondary formation of organic matter in urban plumes. Journal of Geophysical Research-Atmospheres 2008, 113 (D8). Robinson, A. L. et al., Rethinking organic aerosols: Semivolatile emissions and photochemical aging. Science 2007, 315 (5816), 1259-1262. Slowik, J. et al., Characterization of a large biogenic secondary organic aerosol event from eastern Canadian forests, Atmos. Chem. Phys. Discuss., 9, 18113–18158, 2009. Stroud, C. A. et al., OH-reactivity of volatile organic compounds 30 at urban and rural sites across Canada: Evaluation of air quality model predictions using speciated VOC measurements, Atmos. Environ., 42, 7746–7756, 2008. Szidat, S. et al., Source apportionment of aerosols by C-14 measurements in different carbonaceous particle fractions. Radiocarbon 2004, 46 (1), 475-484.