Embed Size (px)
Citation preview
Master Thesis in Geosciences
Anthropogenic Impacts on Groundwater Resources
in the urban Environment of Dire Dawa, Ethiopia
Eyilachew Y. Abate
Anthropogenic Impacts on Groundwater Resources in the
Urban Environment of Dire Dawa, Ethiopia
Eyilachew Y. Abate
Master Thesis in Geosciences
Discipline: Environmental Geology and Geosciences
Department of Geosciences
Faculty of Mathematics and Natural Sciences
UNIVERSITY OF OSLO
January 2010

© Eyilachew Y. Abate, 2010
Tutor(s): Professor Per Aagaard (UiO) and Professor Gijs D. Breedveld (NGI)
This work is published digitally through DUO – Digitale Utgivelser ved UiO
http://www.duo.uio.no
It is also catalogued in BIBSYS (http://www.bibsys.no/english)
All rights reserved. No part of this publication may be reproduced or transmitted, in any form or by any means,
without permission.
ii
Acknowledgements
I would like to express my gratitude to all those who contributed to this thesis. I want to thank
my Advisers, Prof. Per Aagaard at the University of Oslo and Professor Gijs D. Breedveld (NGI)
for their motivated and professional contribution. Further more I would like to acknowledge
Prof. Per Aagaard in special way that advised and generously shared his experience and giving
me reference books and software. His critical reading of the zero-draft master thesis and
invaluable comments give the present shape of this thesis.
Many thanks to my wife Wubalem Demeke, for her love and assist a lot for the success of my
study by cooking food and shopping stuffs. Thanks to everybody who in one way or the other
contributed for all the valuable moral support and continuous encouragement during my study
and the completion of my thesis work.
Oslo, January, 2010
Eyilachew Y. Abate
iii
Table of Contents pages
Acknowledgement ........................................................................................ …..ii
Table of contents ………………………………………………………………iii
List of figures .................................................................................................... iv
List of tables ....................................................................................................... v
List of annexes .................................................................................................... v
Abstract ......................................................................................................... vi
1. Introduction ………………………………………………………….... 1
1.1. Back ground .............................................................................. ……….1
1.2. Objective ................................................................................................ 2
1.3. Methodology ......................................................................................... 3
1.4. Previous works ...................................................................................... 4
2. General overview of the study area ................................................ 5
2.1. Location of the study area ..................................................................... 5
2.2. Physiography and Drainage .................................................................. 6
2.3. Climate and hydrology ........................................................................ 8
2.4. Water Supply and Sanitation ................................................................ 9
3. Hydrogeological Settings and Anthropogenic Activities ...... 12
3.1. Geologic and Stratigaphy profile ....................................................... 12
3.2. Hydrogeology and Aquifer properties ................................................ 15
3.2.1. Types of Aquifer and Hydraulic Properties ............................. 16
3.3. Groundwater Resources and Anthropogenic Activities ..................... 17
3.3.1. Land use system and urbanization ........................................... 18
3.3.2. Groundwater Quality Degradation .......................................... 22
3.3.3. Nitrate and Sources ................................................................ 22
4. Water Quality Analysis & Hydrogeochemical processes ...... 24
4.1. Water types and its sources ................................................................. 24
4.2. Hydrogeochemical processes .............................................................. 28
iv
4.2.1. Silicate weathering and carbonates ........................................... 29
4.2.2. Water quality modification and ionic exchange process .......... 31
5. Contaminant Transport and Conceptual Model ................... 34
5.1. Groundwater flow and influence of production wells ......................... 34
5.2. Nitrate and zone of pluming in phreatic aquifer ................................. 36
5.3. Contaminant Transport in unconfined aquifer .................................... 38
5.3.1. Conceptual box model for simulating the nitrate plume ........... 38
5.3.2. Contaminant transport ........................................................... …43
5.4. Result and discussion ......................................................................... 47
6. Conclusions and Recommendations ............................................. 52
6.1. Conclusions...................................................................................... …52
6.2. Recommendations……………………………………………………53
7. References ……………………………………………………………….54
Annexes …………………………………..…..................................................57
Lists of figures
Fig.1 Simple conceptual flow of the general methodology ………………….. ………….……..4
Fig.2 Location map of the study area ……………………………………………........................5
Fig.3 Satellite image enhanced (E-W) filtered and geological tonal variation …………….……7
Fig.4 Water points and drainage system in the Dire Dawa Basin ……………………….………8
Fig.5 Monthly water balance on a fine sandy soil at Dire Dawa area ………………….………..9
Fig.6 Regional Geological map of Dire Dawa and Harer Region ……………………………....12
Fig.7 Geology of Dire Dawa Area ………………………………………………..….…..…......14
Fig.8 Land use and urbanization map of Dire Dawa …...…………………………...…...….…19
Fig.9 Population density (Persons/ha) map of Dire Dawa …………..……………….........…...20
Fig.10 Piper plots of water types from Dire Dawa Area …………….…….................................27
Fig.11 Stiff plot diagram of the three water types (FSP-5, SnBh-1 & TDW-1) …………….......28
Fig.12 The schematic model of water- rock interaction in relation of discharge-recharge areas..28
Fig.13 The diagram presentation of rain water-groundwater evolution in Dire Dawa area ….....29
Fig.14 Sodium, Chloride, Nitrate & Sulphate relations in Dire Dawa groundwater …...……….31
Fig .15 Chlorides versus Nitrates relation in the Dire condition ……………………..……...….32
v
Fig.16 Groundwater contours and flow direction in Dire Dawa Area …………………….....…35
Fig.17 Groundwater contours and water points in the vicinity of Dire Dawa Area…………......36
Fig. 18 The pluming zone of nitrate along groundwater flow direction in downstream…….......37
Fig.19 Conceptual box model under homogeneous phreatic aquifer and contaminant pluming...40
Fig.20 Mode of contaminants transport and natural attenuation at different aquifer media …....44
Fig.21 Transport of contaminants in the aquifer with non-reaction simulated in Dire Dawa ….....46
Lists of tables
Table.1 Top ten diseases, DDAC, 1999/ 2000……………………………………….…………11
Table .2 The geological events of Dire Dawa area …………………………………………….14
Table.3 Summary of transimissivity of the different geological formation ……………………16
Table.4 Urban Toilet facilities of Dire Dawa by housing unit……………………………..…...21
Table.5 Solid waste/Garbage disposal situations in Dire Dawa ……………………………......21
Table.6 Water laboratory result (mg/l) water sample from Dire Dawa …………..…………....25
Table.7 Recalculation of water samples into mmol/l from (mg/l/ (gram formula weight) ….....26
Table.8 The contribution of weathering from silicates/carbonates of (FSP-1) spring water…...30
Table.9 Spring-borehole water geochemical evolution (mmol/l) in Dire Dawa .. …………..…31
Lists of Annexes ……………………………………………………………………....…...…..57
Annex-I Water sample result from Dire Dawa area …………………………………………....57
Annex-II Mean monthly values of Dire Dawa Meteorological element ………………….........58
Annex-III Aquifers type and their productivity in DDAC ……………………….…………….58
Annex-IV Geological x-section and Stratigraphy of the Dire Dawa Area …………………......59
Annex-V Groundwater points and water level in the Dire Dawa catchment area …………..….60
vi
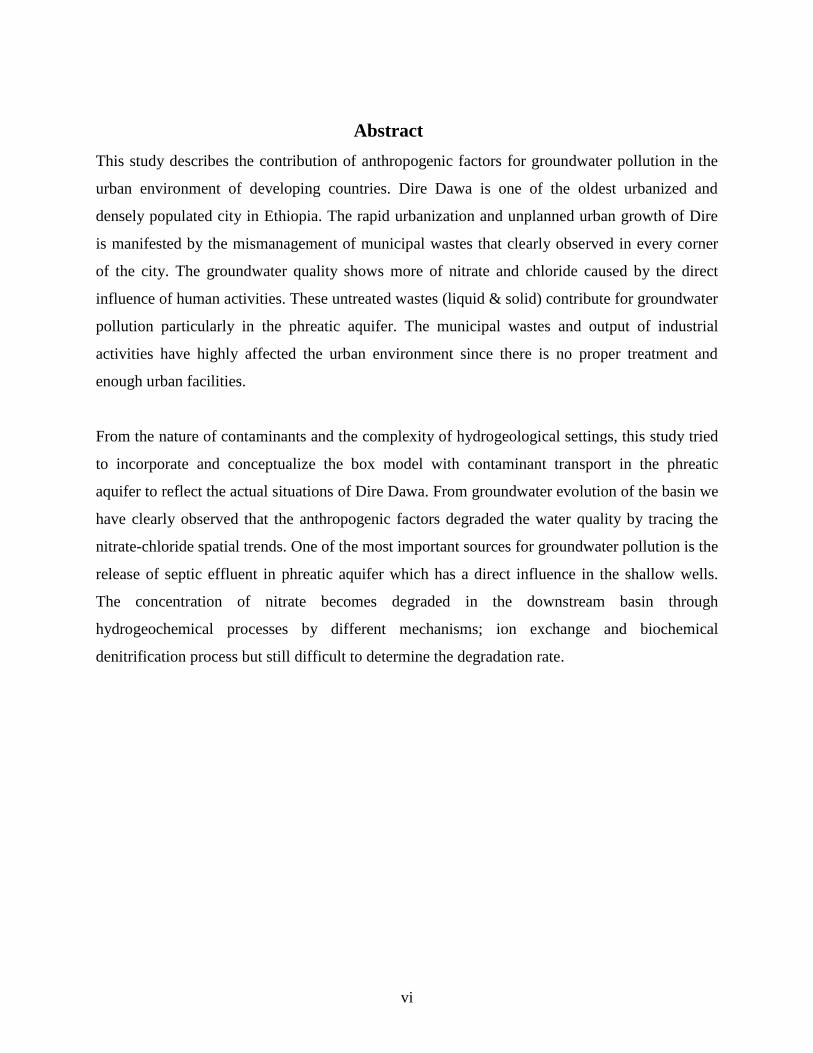
Abstract
This study describes the contribution of anthropogenic factors for groundwater pollution in the
urban environment of developing countries. Dire Dawa is one of the oldest urbanized and
densely populated city in Ethiopia. The rapid urbanization and unplanned urban growth of Dire
is manifested by the mismanagement of municipal wastes that clearly observed in every corner
of the city. The groundwater quality shows more of nitrate and chloride caused by the direct
influence of human activities. These untreated wastes (liquid & solid) contribute for groundwater
pollution particularly in the phreatic aquifer. The municipal wastes and output of industrial
activities have highly affected the urban environment since there is no proper treatment and
enough urban facilities.
From the nature of contaminants and the complexity of hydrogeological settings, this study tried
to incorporate and conceptualize the box model with contaminant transport in the phreatic
aquifer to reflect the actual situations of Dire Dawa. From groundwater evolution of the basin we
have clearly observed that the anthropogenic factors degraded the water quality by tracing the
nitrate-chloride spatial trends. One of the most important sources for groundwater pollution is the
release of septic effluent in phreatic aquifer which has a direct influence in the shallow wells.
The concentration of nitrate becomes degraded in the downstream basin through
hydrogeochemical processes by different mechanisms; ion exchange and biochemical
denitrification process but still difficult to determine the degradation rate.

vii
1
1. Introduction
1.1 Background
Water is a fundamental resource for socio-economic development & transformation; it is essential
for maintaining healthy environment and ecosystems. There is a raising demand for fresh water
resources as a result of increasing population and even by the advancement of technology; it has
become difficult to treat the current context of growing pollution world-wide. This matter requires
urgent attention, since water is scarce and such an important resource needs detailed scientific
research all over the world in order to sustain and protect the water resource from pollution and for
its wise utilization.
In many countries of the world groundwater is the only available natural resource for water supply
and other activities. As a source of water supply groundwater has a number of essential advantages
when compared with surface water. These advantages coupled with reduced groundwater
vulnerability to pollution have resulted in wide groundwater usage for basic human needs,
agricultural and industrial developments in the world. To meet the increasing demand of water due
to rapid growth of population, urbanization and industrialization especially in developing countries,
it is very important to evaluate groundwater resource qualitatively for future development plans of
the region. Without fresh water of adequate quantity and quality, sustainable development will be
impossible and life is in danger in the near future particularly in the south.
Urbanization is a challenging issue particularly in developing cities like Dire Dawa in Ethiopia due
to groundwater pollution and aquifer vulnerability.The human intervention in the natural system has
a significant effect on the quality of natural waters. Human activities like disposal of untreated toxic
chemical and industrial waste into streams, unplanned urban development, lack of sewerage system,
overpumping of aquifers, contamination of water bodies with substances that promote algal growth
(possibly leading to eutrophication) and global warming are some of the prevailing causes of water
quality degradation.
In the case of Dire Dawa area, groundwater is the only resource for water supply and industrial
activities; as no surface water sources are available in the region. Keeping this vital resource is the
primary issue for the sustainable development of the Dire Dawa town and its vicinity. The
groundwater quality varies from place to place due to natural and human factors which depend on
the nature of precipitation, geology, climate, biological, anthropogenic activities, and also
2
hydrogeochemical processes. The hydrogeochmical evolution is also controlled by different
mechanisms such as weathering processes, ion-exchange, redox reaction, biodegradation and other
activities.
In the study area the geology is rather complex, which contribute to the natural modification of
water quality in the upper part of the basin. The area is mostly covered by major geological
complexes ranging from Precambrian rocks at higher elevations to the recent alluvial formation at
the lower part of the basin (Seife, 1985). The presence of several salt lakes and proximity of Red
Sea to the study area contribute for the change of water chemistry through evaporation-precipitation
and water-rock interaction. Point and non-point sources of municipal wastes are major causes of
groundwater pollution. The inputs of substances in the agriculture fields such a fertilizers,
insecticides, and herbicides may pollute water sources and modified its quality. The water-rock
interaction and its evolution play important role for the change of water chemistry in the
groundwater system (Appelo, 2005).
The potential pollutant sources of in the Dire Dawa groundwater need more investigation in order to
propose the possible remedial measures through scientific studies. The delineation of contaminant
plumes is difficult because of the various potential emission sources. Thus, detection, quantification
and remediation of contaminated sites in a city need more integrative approaches. This study helps
to formulate environmental protection policy, effluent standards, the utilization of groundwater and
the proper municipal waste management mechanisms. This study is also important to evaluate the
future urban development plan for Dire Dawa city in particular and the region in general.
Several studies have been conducted related to geology and hydrogeology in the study area and its
surroundings. The main gap here is to identify the pollutant sources (contaminated zone) and
conceptualize the groundwater flow in relation with the contaminant transport towards the well-
fields. Many factors may enhance the hydrochemical processes in the groundwater system. This
study has tried to address and conceptualize the hydrogeodymanic system by applying different
modeling techniques in order to identify pollutant sources, its fate and transport.
1.2. Objective
The general objective of this study is to identify the contaminated zone of aquifers in the Dire Dawa
region by conceptualizing and assimilating the hydrogeochemical evolution of the Dire Dawa
3
groundwater basin. This practice might help for effective and proper utilization of groundwater
resource and environmental protection. It is also important for scientific work to exercise different
modeling concepts by applying available data.
The specific objectives of the study include:
To identify the different sources of pollutants and define the contaminant zone that influence
the groundwater quality
To evaluate the behavior of contaminants and mode of transport in groundwater system
To conceptualize the fate and transport of contaminants in an unconfined aquifer based on
the theoretical background and from practical field conditions
To predict the possible influence area and travel time of the plumes towards the well-field
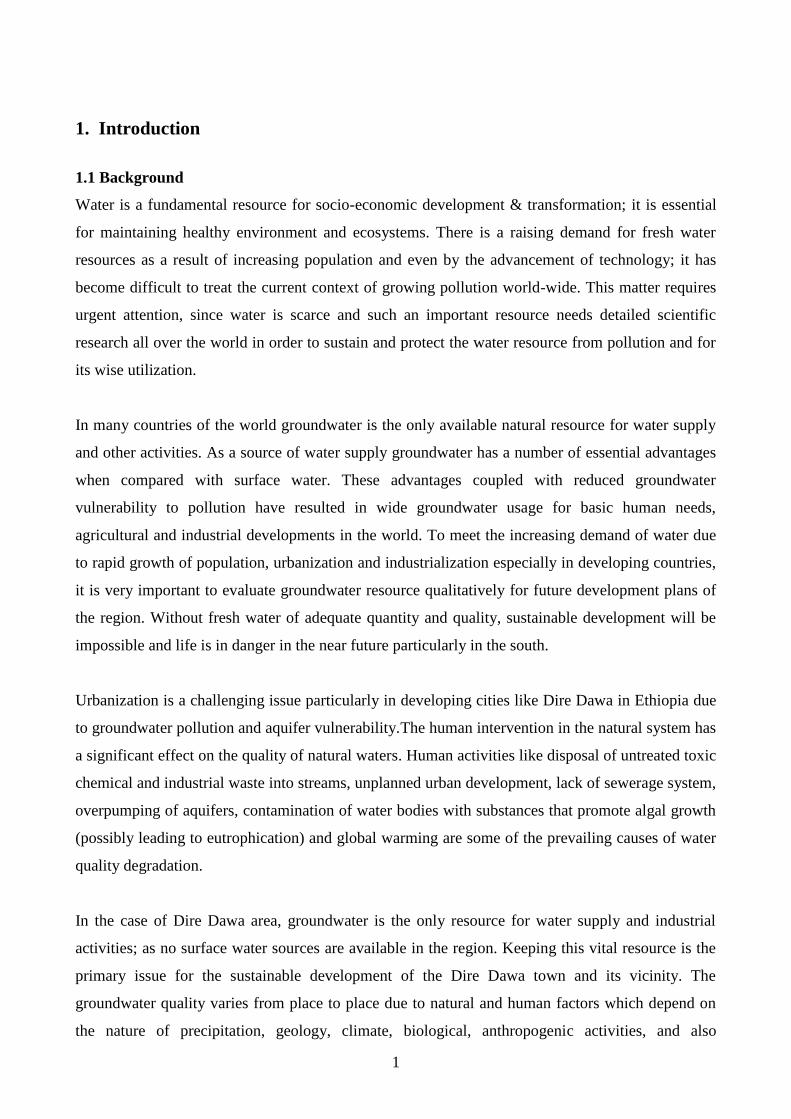
1.3 Methodology
In order to attain the above objectives the following methods used as shown in the simple
conceptual flow chart model (Fig.1);
Review and analysis of available data or related studies:
Study of previous works and literature on geological, hydrogeological and
hydrochemistry of the area
Tabulating water points ,evaluating water quality and accuracy of chemical analysis
Visualizing hydrogeochemical data and geological settings of the study area
Conceptualize model:
Schematically describe the hydrogeochemical processes and rainwater-soilwater-
groundwater evolution
Identifation of different water quality modifiers at different stages
Conceptualize the box model to evaluate contaminant transport
Assimilation and simulation of contaminant transport
Analysis of results and discussion in connection with the contaminant in Dire Dawa aquifer
A simple conceptual flow chart model (Fig.1) of the methodology shows the systematic
arrangement of the available data and conceptualizes the system by applying different hydraulic
parameters
4
Fig.1 Simple conceptual flow of the general methodology
1.4 Previous works
Previously geological, hydrogeological, water quality the studies and other related works have been
performed for different purpose in the Dire Dawa region. Most of studies have been conducted by
the Federal sector organization of Addis Ababa and DDAC (Dire Dawa Adminstration council) in
Dire Dawa i.e. Ministry of Water Resources (MoWR), Water Well Drilling Enterprise, Ethiopian
Institute of Geological Survey (EIGS), Water Work Design and Supervision Enterprise (WWDSE),
DDAC of Water Mines and Energy office and Hara water supply emergency project. These are the
most important institutions working at the water sector in Ethiopia. The main hydrogeological work
here was to plan and design water supply facilities for Dire Dawa and Harar towns as the ever
increasing water demand far exceeded water supply. According to Minalah B. (2007), most of the
previous works deal with specific issue but more comprehensive work was done by WWDSE
(2004).
These studies have been conducted by those institutions for different purposes in the study area,
which contribute a lot to achieve the above objectives of the research proposal. The data give
enough background to conceptualize the situation and in order to identify the different sources of
pollutants and to define the contaminant zone by applying different modeling techniques i.e box-
model and application of GIS/ Surfer for analysis and presentation of the result.
5
2. General Overview of the study area
2.1 Location of Study Area
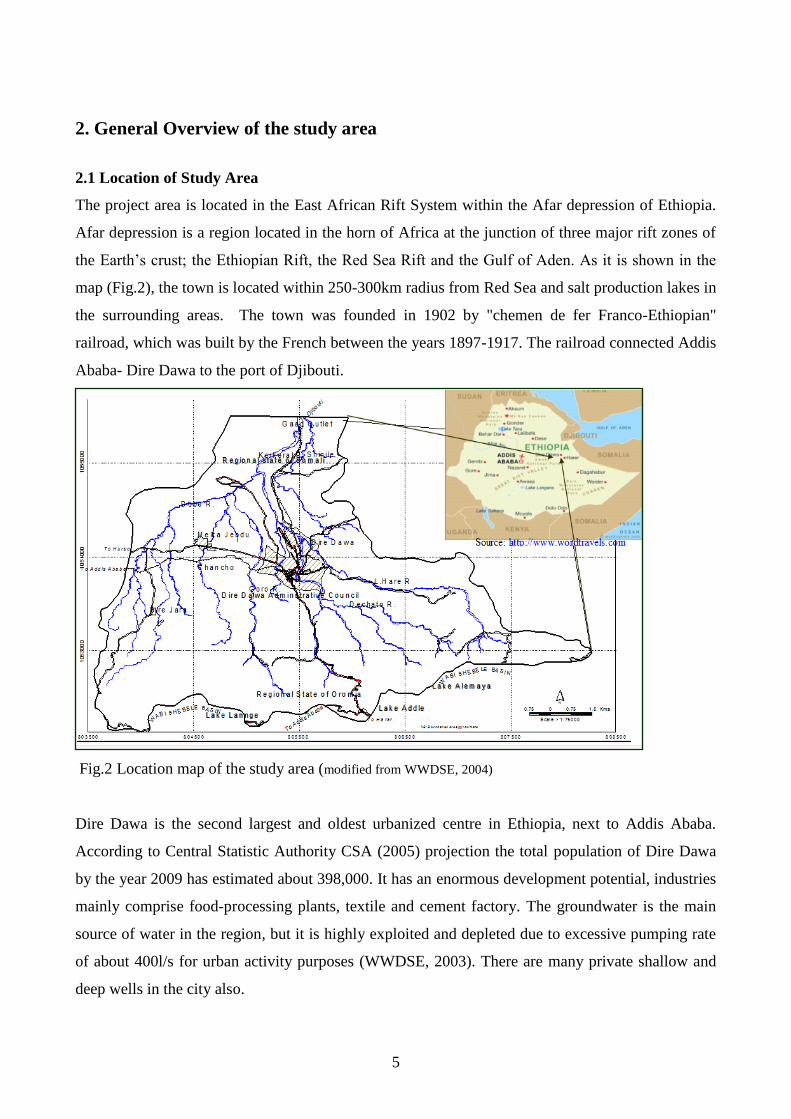
The project area is located in the East African Rift System within the Afar depression of Ethiopia.
Afar depression is a region located in the horn of Africa at the junction of three major rift zones of
the Earth‟s crust; the Ethiopian Rift, the Red Sea Rift and the Gulf of Aden. As it is shown in the
map (Fig.2), the town is located within 250-300km radius from Red Sea and salt production lakes in
the surrounding areas. The town was founded in 1902 by "chemen de fer Franco-Ethiopian"
railroad, which was built by the French between the years 1897-1917. The railroad connected Addis
Ababa- Dire Dawa to the port of Djibouti.
Fig.2 Location map of the study area (modified from WWDSE, 2004)
Dire Dawa is the second largest and oldest urbanized centre in Ethiopia, next to Addis Ababa.
According to Central Statistic Authority CSA (2005) projection the total population of Dire Dawa
by the year 2009 has estimated about 398,000. It has an enormous development potential, industries
mainly comprise food-processing plants, textile and cement factory. The groundwater is the main
source of water in the region, but it is highly exploited and depleted due to excessive pumping rate
of about 400l/s for urban activity purposes (WWDSE, 2003). There are many private shallow and
deep wells in the city also.
6
2.2 Physiography and Drainage
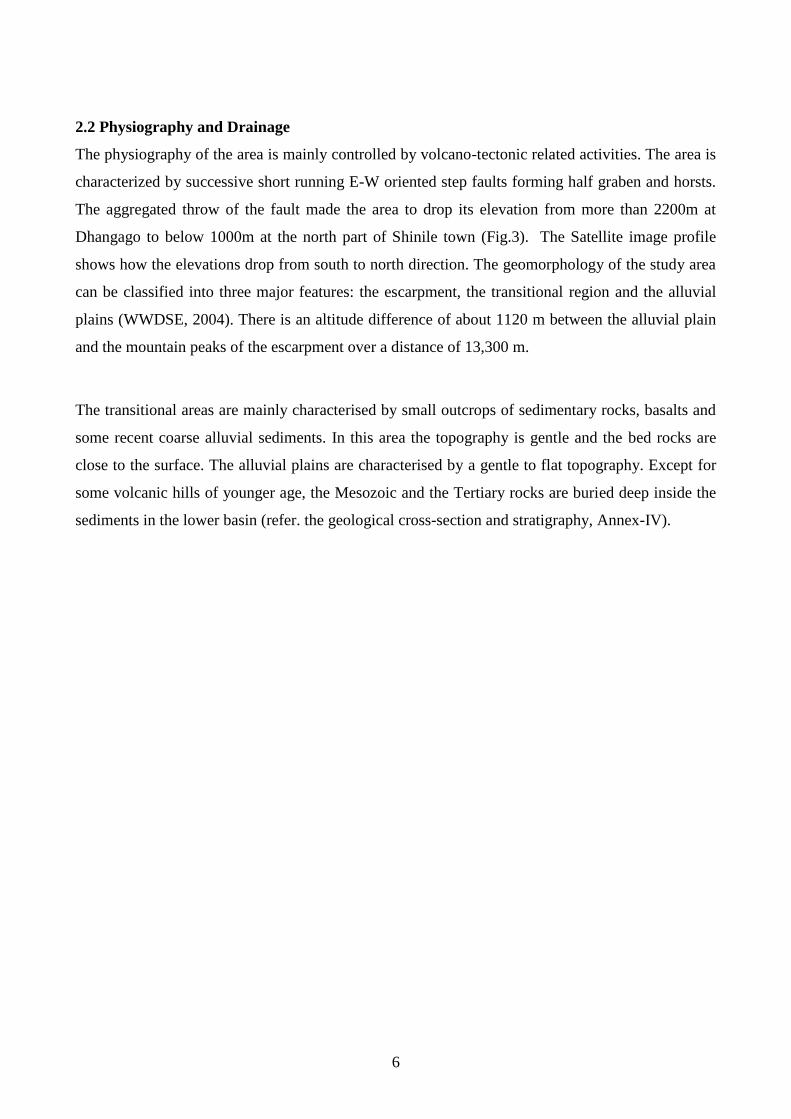
The physiography of the area is mainly controlled by volcano-tectonic related activities. The area is
characterized by successive short running E-W oriented step faults forming half graben and horsts.
The aggregated throw of the fault made the area to drop its elevation from more than 2200m at
Dhangago to below 1000m at the north part of Shinile town (Fig.3). The Satellite image profile
shows how the elevations drop from south to north direction. The geomorphology of the study area
can be classified into three major features: the escarpment, the transitional region and the alluvial
plains (WWDSE, 2004). There is an altitude difference of about 1120 m between the alluvial plain
and the mountain peaks of the escarpment over a distance of 13,300 m.
The transitional areas are mainly characterised by small outcrops of sedimentary rocks, basalts and
some recent coarse alluvial sediments. In this area the topography is gentle and the bed rocks are
close to the surface. The alluvial plains are characterised by a gentle to flat topography. Except for
some volcanic hills of younger age, the Mesozoic and the Tertiary rocks are buried deep inside the
sediments in the lower basin (refer. the geological cross-section and stratigraphy, Annex-IV).
7
Fig.3 Satellite image enhanced (E-W) filtered and geological tonal variation (modified after Mirus, 2003)

8
As we can observe from Fig.4, most of the drainage patterns are South-North direction. Most of
seasonal streams begin from the basin divider of Wabi Shebele-Awash River basin and flow
towards the Dire Dawa plain areas. Springs originated from the escarpment zone of the catchment
area, mostly within the Mesozoic sedimentary terrain. More than 100 deep bore holes and hand dug
wells are located in the down stream (Fig.4) in the Dire Dawa town and its vicinity.
Fig.4 Water points and drainage system in the Dire Dawa Basin ( WWDSE, E. Abate, MoWR, 2004)
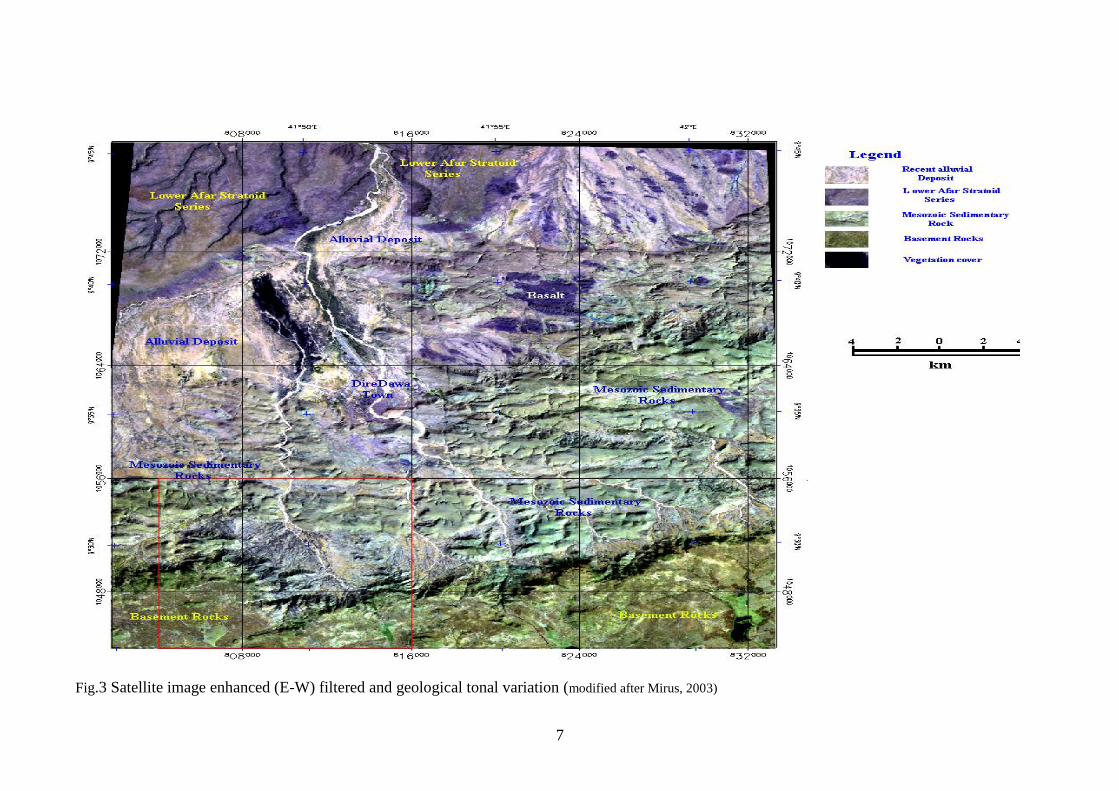
2.3 Climate and Hydrology
The study area is generally characterized by arid or semi-arid climate. Based on the National
Meteorological Service data of Dire Dawa(1972-2002), the mean (min.-max.) annual temperature of
Dire-Dawa town varies from 190C to 35
0C (annex-II). The annual precipitation varies from 440.8
mm to 855.2mm with mean precipitation of 618mm. Since Dire Dawa is located in the arid and
semi-arid zone, the potential evapotaranspiration (PET) is higher than the actual evapotranspriration
(AET) in the area (Fig.5) by applying THORNTHWAITE & MATHER method. The town is
situated at 1160 meter above sea level. There is no any perennial stream/river except intermittent-
flashing streams along the Dechato channel.
803 500 808 500807 500806 500805 500804 500
10
55
00
01
05
40
00
10
53
00
0
#Y
#Y
#Y
#Y#Y#Y
#Y
#Y
#Y
#Y#Y#Y#Y#Y
#Y
#Y#Y#Y#Y#Y
#Y
#Y#Y
#Y
#Y
#Y
#Y#Y
#Y
#Y
#Y
#Y#Y
#Y#Y
#Y#Y
#Y
#Y
#Y
#Y#Y
#Y#Y#Y#Y#Y#Y#Y#Y
#Y#Y
#Y
#Y
#Y
#Y#Y#Y
#Y#Y
#Y
#Y#Y#Y
#Y#Y
#Y
#Y#Y #Y#Y#Y#Y#Y #Y
#Y
#Y#Y#Y
#Y #Y
#Y#Y
#Y
#Y%[
%[
%[
%[%[
%[%[
%[%[ %[%[
%[
%[%[
%[
%[%[
%[%[%[
%[%[
%[
%[
%[
%[
%[
%[
%[
%[
%[ %[
%[%[
%[
%[%[%[
EE EEE
E
E
E E
EE
E
EE
EE
E
E
EEE
E
E
DRAINAGE AND SAMPLING SITES LOCATION
OF THE STUDY AREA
2 0 2 4 6 Kms
Scale 1: 2 00 000
To Add is Aba ba
W
ABI SHEBELE BASIN
To Hu rso
To A
ddi s A
b aba
W
ABI SHEBELE BASIN
Rivers
Main Rive r (Se ason al)
Se co nd ary Rive r (Se ason al)
Roads
Main Roa d (Aspha lt )
All W e ath er Ro ad
Dry W e athe r Ro ad
Rail W a y
#Y Boreholes
%[ Dugwells
E Springs
LEGEND
N
Grid
Town Boundary
9
Fig.5 Monthly water balance on a fine sandy soil at Dire Dawa
2.4 Water Supply and Sanitation
The main source of water for domestic supply is groundwater from Sabiyan well-field located
within the city expansion and scatter settlement part at the northwestern periphery of the Dire
Dawa. Groundwater is the only water source in the Dire Dawa region. At present almost 100%
water supply for domestic, industrial and irrigation purposes come from bore holes, hand-dug wells
and springs for city and surrounding rural population. According to WWDSE (2004) preliminary
estimation of the groundwater recharge is about 300-370 l/s, but the actual abstraction is more than
this figure which includes the private bore holes.
The poor sanitation condition together with the lack of proper waste disposal mechanisms attributed
to severely effect of pollution of both surface (seasonal) and ground water resources of the area.
The most serious effect of pollution was observed in shallow wells, which is the reflection of all
anthropogenic impact in the groundwater bodies. Taye A. (1988) report stated that Dire Dawa town
is a fast growing industrial and commercial town, which produces pollutants in great quantities. The
town has no sewer system and wastewater treatment plant. The main sources of pollution are
multiple point sources pollution of pit latrines, septic tanks and linear source pollution of industrial
and domestic waste disposal along the sandy seasonal river channels.
10
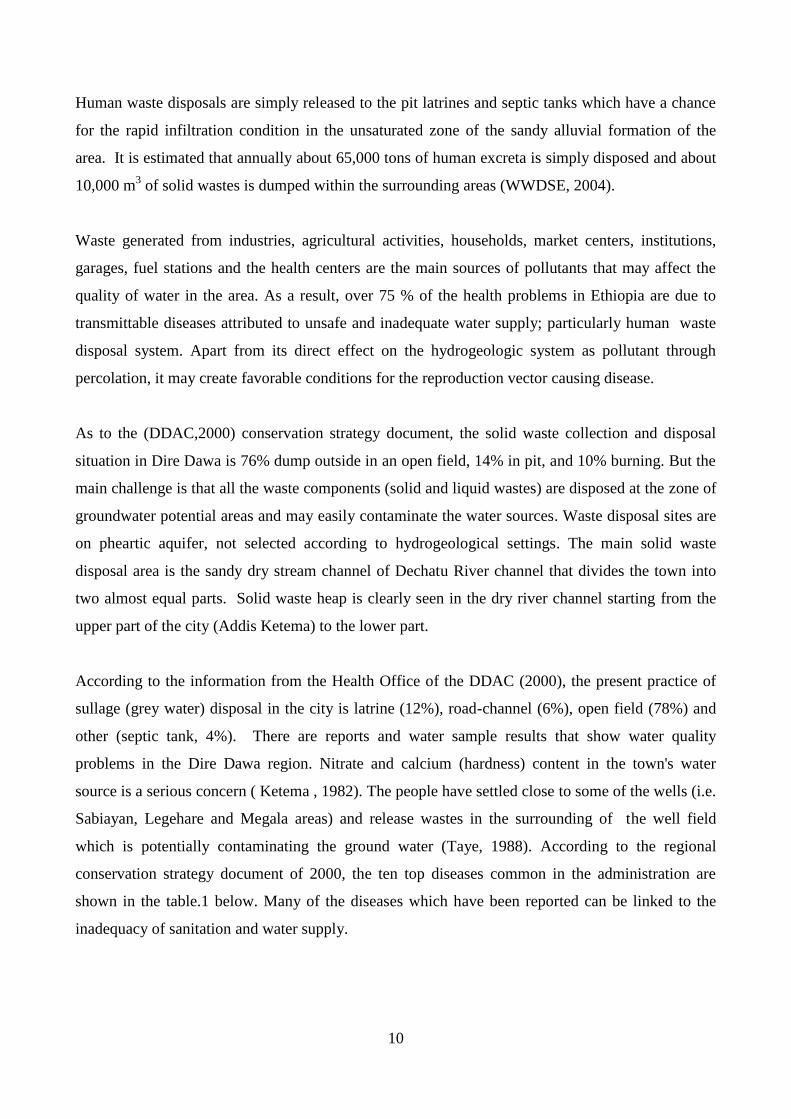
Human waste disposals are simply released to the pit latrines and septic tanks which have a chance
for the rapid infiltration condition in the unsaturated zone of the sandy alluvial formation of the
area. It is estimated that annually about 65,000 tons of human excreta is simply disposed and about
10,000 m3 of solid wastes is dumped within the surrounding areas (WWDSE, 2004).
Waste generated from industries, agricultural activities, households, market centers, institutions,
garages, fuel stations and the health centers are the main sources of pollutants that may affect the
quality of water in the area. As a result, over 75 % of the health problems in Ethiopia are due to
transmittable diseases attributed to unsafe and inadequate water supply; particularly human waste
disposal system. Apart from its direct effect on the hydrogeologic system as pollutant through
percolation, it may create favorable conditions for the reproduction vector causing disease.
As to the (DDAC,2000) conservation strategy document, the solid waste collection and disposal
situation in Dire Dawa is 76% dump outside in an open field, 14% in pit, and 10% burning. But the
main challenge is that all the waste components (solid and liquid wastes) are disposed at the zone of
groundwater potential areas and may easily contaminate the water sources. Waste disposal sites are
on pheartic aquifer, not selected according to hydrogeological settings. The main solid waste
disposal area is the sandy dry stream channel of Dechatu River channel that divides the town into
two almost equal parts. Solid waste heap is clearly seen in the dry river channel starting from the
upper part of the city (Addis Ketema) to the lower part.
According to the information from the Health Office of the DDAC (2000), the present practice of
sullage (grey water) disposal in the city is latrine (12%), road-channel (6%), open field (78%) and
other (septic tank, 4%). There are reports and water sample results that show water quality
problems in the Dire Dawa region. Nitrate and calcium (hardness) content in the town's water
source is a serious concern ( Ketema , 1982). The people have settled close to some of the wells (i.e.
Sabiayan, Legehare and Megala areas) and release wastes in the surrounding of the well field
which is potentially contaminating the ground water (Taye, 1988). According to the regional
conservation strategy document of 2000, the ten top diseases common in the administration are
shown in the table.1 below. Many of the diseases which have been reported can be linked to the
inadequacy of sanitation and water supply.
11
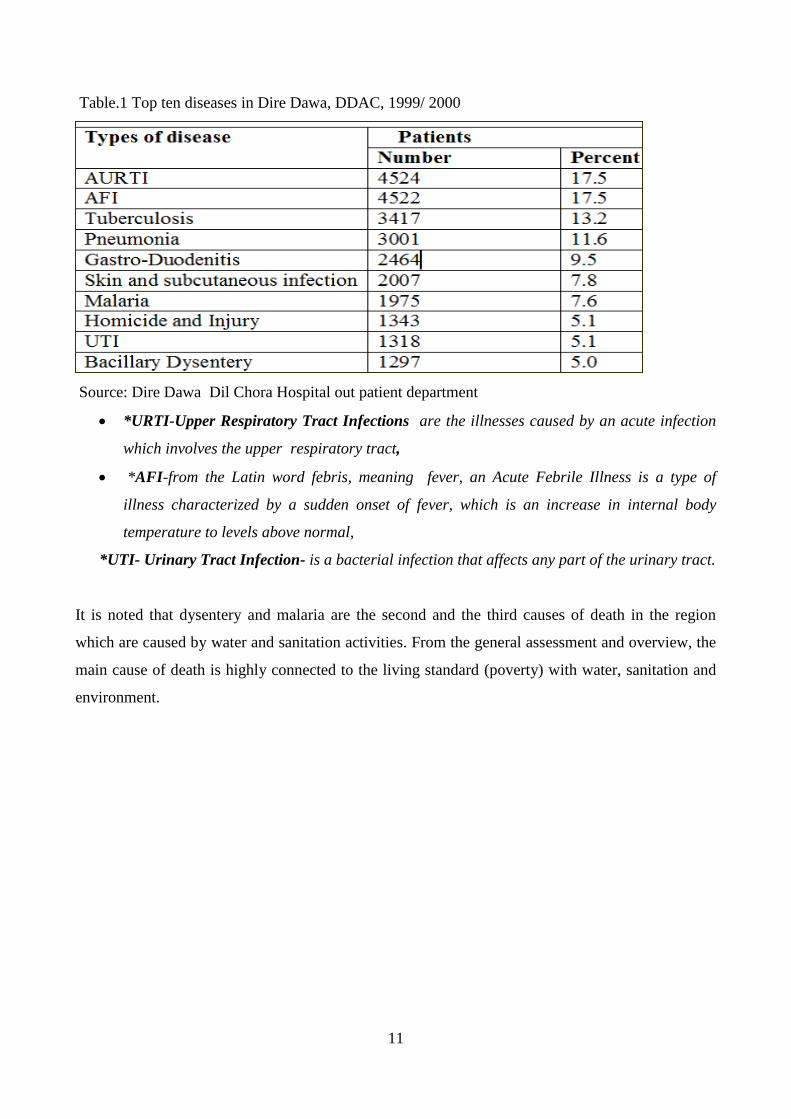
Table.1 Top ten diseases in Dire Dawa, DDAC, 1999/ 2000
Source: Dire Dawa Dil Chora Hospital out patient department
*URTI-Upper Respiratory Tract Infections are the illnesses caused by an acute infection
which involves the upper respiratory tract,
*AFI-from the Latin word febris, meaning fever, an Acute Febrile Illness is a type of
illness characterized by a sudden onset of fever, which is an increase in internal body
temperature to levels above normal,
*UTI- Urinary Tract Infection- is a bacterial infection that affects any part of the urinary tract.
It is noted that dysentery and malaria are the second and the third causes of death in the region
which are caused by water and sanitation activities. From the general assessment and overview, the
main cause of death is highly connected to the living standard (poverty) with water, sanitation and
environment.
12
3. Hydrogeological Settings and Anthropogenic Activities
3.1. Geologic and Stratigaphy profile
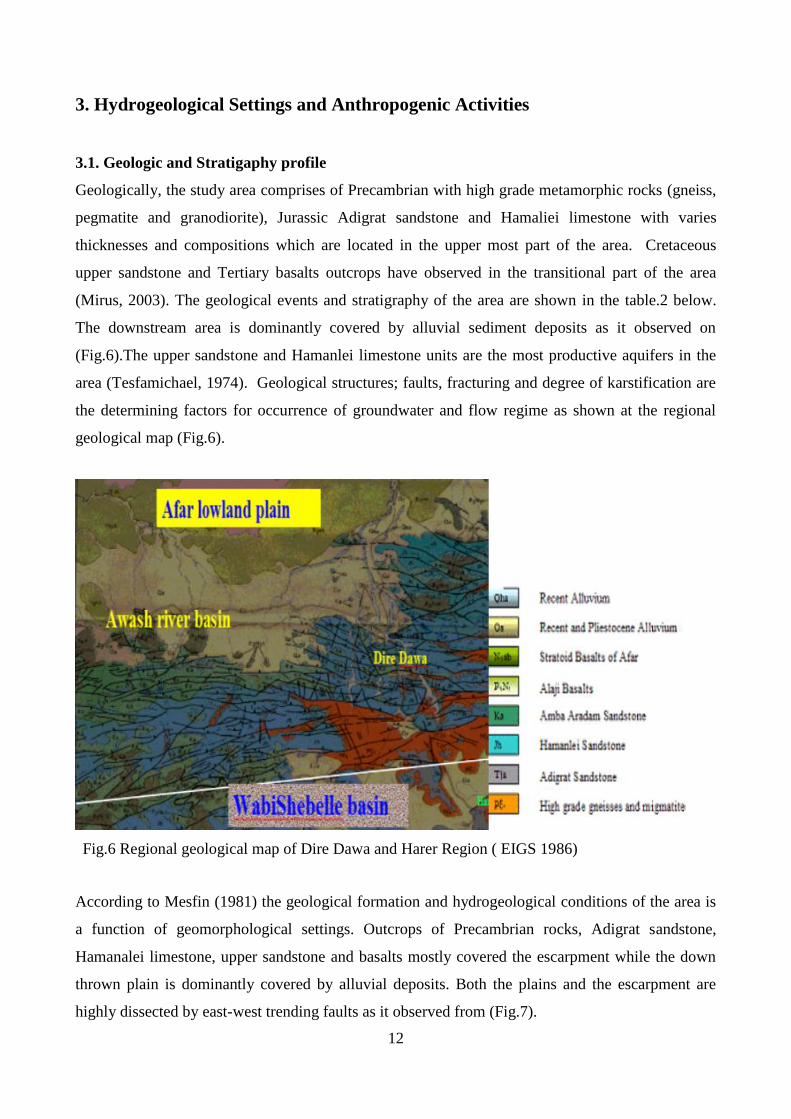
Geologically, the study area comprises of Precambrian with high grade metamorphic rocks (gneiss,
pegmatite and granodiorite), Jurassic Adigrat sandstone and Hamaliei limestone with varies
thicknesses and compositions which are located in the upper most part of the area. Cretaceous
upper sandstone and Tertiary basalts outcrops have observed in the transitional part of the area
(Mirus, 2003). The geological events and stratigraphy of the area are shown in the table.2 below.
The downstream area is dominantly covered by alluvial sediment deposits as it observed on
(Fig.6).The upper sandstone and Hamanlei limestone units are the most productive aquifers in the
area (Tesfamichael, 1974). Geological structures; faults, fracturing and degree of karstification are
the determining factors for occurrence of groundwater and flow regime as shown at the regional
geological map (Fig.6).
Fig.6 Regional geological map of Dire Dawa and Harer Region ( EIGS 1986)
According to Mesfin (1981) the geological formation and hydrogeological conditions of the area is
a function of geomorphological settings. Outcrops of Precambrian rocks, Adigrat sandstone,
Hamanalei limestone, upper sandstone and basalts mostly covered the escarpment while the down
thrown plain is dominantly covered by alluvial deposits. Both the plains and the escarpment are
highly dissected by east-west trending faults as it observed from (Fig.7).
13
Based on stratigraphy and tectonic activities, the Dire Dawa area can be classified in to four main
geological units (WWDSE, 2004) and the geological events are summarized in (table.2).These units
are:
a. Basement complex rocks: composed of gneiss, pegmatite and granodiorite of metamorphic
rocks which covered in the upper part of the Dire Dawa Basin. Fractured and weathered part
of this formation may have very little water. Practically it is impervious.
b. Mesozoic sediments (lower & upper sandstones and the limestone unite): This formation
mainly located in the transitional zone and the potential aquifer of the study area.
Jurassic Adigrat sandstones un-conformably overlie the basement complex with a
thickness of not more than 20 meters, fractured and pervious formation.
Jurassic Hamanlei limestone (middle) varies in thickness up to 200 meters and its lower
part is interbeded with shales overlain with oolitic limestone. This formation together
with upper sandstone makes the main water-bearing horizon in the area.
Cretaceous Amba-aradam sandstones: composed of quartzose sand stone, thickness from
150 to 200 meters at some places interbeded with basaltic flows (lava flows within the
sediments or sills) and limestone intercalations. This formation is the main water-bearing
horizon in the area.
c. Tertiary volcanoes: Alaji formation (Acidic, lower trap basalts) predominantly basalts and
Afar Stratoid Basalts. The Alaji formation overlies on the upper sandstone un-conformably.
It has a wide spread area coverage and is practically impervious.
d. Quaternary formation: All rivers and streams descending from the escarpment have built
large areas extended and thick alluvial deposits. These deposits consist of cobbles and
coarse-grained sediments near the escarpment, while they consist of fine detrital sediments
in the plain area. The alluvial sediment is one of the water bearing formation in the area.
14
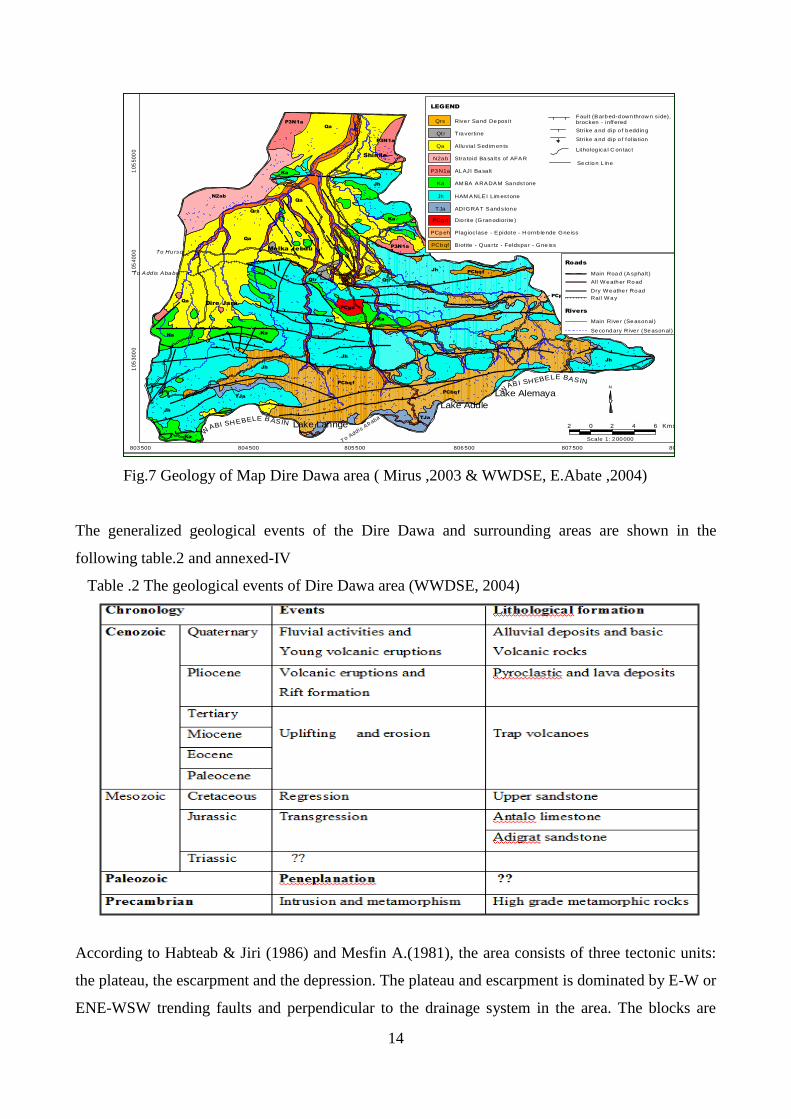
Fig.7 Geology of Map Dire Dawa area ( Mirus ,2003 & WWDSE, E.Abate ,2004)
The generalized geological events of the Dire Dawa and surrounding areas are shown in the
following table.2 and annexed-IV
Table .2 The geological events of Dire Dawa area (WWDSE, 2004)
According to Habteab & Jiri (1986) and Mesfin A.(1981), the area consists of three tectonic units:
the plateau, the escarpment and the depression. The plateau and escarpment is dominated by E-W or
ENE-WSW trending faults and perpendicular to the drainage system in the area. The blocks are
N
N2ab
P3N1a
Qa
Qa
PCbqf
Jh
PCgd
PCbqf
#
Qa
# PCpeh
#
TJa
Ka
Ka
Qa
P3N1a
Ka
Ka
P3N1a
Qa
Jh
Jh
Jh
Ka
TJa
Jh
PCbqf#
Qtr
#
Qtr
#
Qrs
Ka
Jh
10
53
00
01
05
40
00
10
55
00
0
804 500 805 500 806 500 807 500 808 500803 500
Rivers
Main Rive r (Se ason al)
Se co nd ary Rive r (Se ason al)
Roads
Main Roa d (Aspha lt )
All W e ath er Ro ad
Dry W e athe r Ro ad
Rail W a y
N
2 0 2 4 6 Kms
Scale 1: 2 00 000
To Add is Aba ba
WABI SHEBELE BASIN
To Hu rso
To A
ddi s A
b aba
WABI SHEBELE BASIN
LEGEND
Jh
TJa
PCg d
PCp eh
PCb qf Biotite - Qua rtz - Feldspa r - Gne iss
Plag ioclase - Epidote - H ornb le nde Gne iss
Dio rite (Gran odiorite )
ADIGRAT Sand ston e
HAM ANLEI Lim estone
Qrs
Qt r
Qa
N2a b
P3 N1a
Ka AM BA ARADAM Sa ndstone
AL AJI Ba sa lt
Stra toid Ba sa lts of AFAR
Allu via l Sed im en ts
Tra vertine
Rive r Sa nd De posit
Litholog ica l C on tact
Se ct io n L in e
Strike a nd dip o f folia tion
Fault (Barb ed-d own throw n side), brocken - inffered
Strike a nd dip o f b edd in g
Fig 4.2 Geological map of Dire Dawa drainage basin
Melka Jebdu
Dire Jara
Shinile
Lake Alemaya
Lake Addle
Lake Lannge

15
downthrown to the north and form the boundary of the rift system. Abrupt change in slope gradient
on the escarpment causes decreases in velocity of surface water, which has resulted in forming fans
at the foot of the escarpment.
3.2 Hydrogeology and Aquifer properties
Many valuable geological and hydrogeological works have been done by Tesfamichael (1974) and
Ketema (1982) in the Dire Dawa area and surroundings. Associated Engineering Survey Ltd.
Canada (1982) had also done a feasibility study for Dire Dawa water supply. Integrated Resource
Master Plan of ADDC study has been undertaken by the WWDSE (2004) and Dire Dawa Water
Mines and Energy Office and others had conducted a lot of studies in this research area.
From drilling results (MoWR, 1999a), it was found that the upper sandstone was overlain by
alluvium at the Sabiyian wells. The upper sandstone was penetrated after drilling through alluvium
and basalts at Dire Jara well field and TW4 (north west of Dire Dawa town). The upper sandstone is
intruded by basaltic dykes, sills and batholiths and extensively faulted which makes the unit a
potential aquifer in the basin. The drilled wells in the aquifer show that the thickness of the aquifer
is variable. The thickness of the aquifer penetrated at the Dire Jara well field is 36 meters (W-4) and
at TW4 is 108 meters. Furthermore, most of the production wells at Sabiyian and Dire Jara well
field do not fully penetrate the sandstone aquifers.
From TW-4 information, the groundwater was struck at 98 meters depth and the static water level
stabilized at 31 meters. It is recorded in the Dire Jara well accomplishment report (WWDSE,2001)
as a general conclusion that the groundwater was struck from 100-120 meters and the static water
level is stabilized at 50 to 60meters below the ground surface. The sandstone at the Sabiyian area is
also considered as a confined aquifer although the pumping test results show leaky aquifer (MoWR,
1999b). In general the main aquifer is confined aquifer in the region where the confining layer
could be basalt, clay and intercalation of shale with in the sandstone.
Drilling results (WWDSE, 2001) show that the limestone unconformablly underlies the upper
sandstone (see Annex-IV). The limestone at Dire Jara area is highly fractured and karsted , forms a
complex water bearing formation together with the upper sandstone; where as at Dire Dawa town,
the limestone is massive with low groundwater productivity.
16
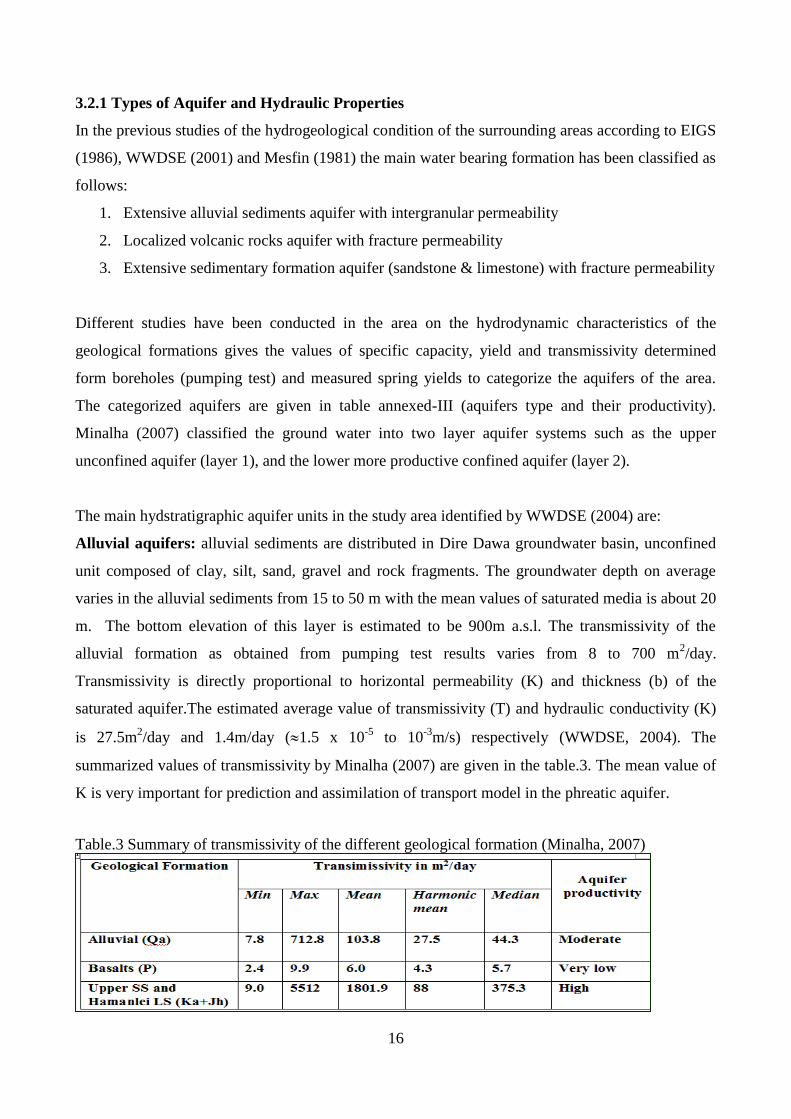
3.2.1 Types of Aquifer and Hydraulic Properties
In the previous studies of the hydrogeological condition of the surrounding areas according to EIGS
(1986), WWDSE (2001) and Mesfin (1981) the main water bearing formation has been classified as
follows:
1. Extensive alluvial sediments aquifer with intergranular permeability
2. Localized volcanic rocks aquifer with fracture permeability
3. Extensive sedimentary formation aquifer (sandstone & limestone) with fracture permeability
Different studies have been conducted in the area on the hydrodynamic characteristics of the
geological formations gives the values of specific capacity, yield and transmissivity determined
form boreholes (pumping test) and measured spring yields to categorize the aquifers of the area.
The categorized aquifers are given in table annexed-III (aquifers type and their productivity).
Minalha (2007) classified the ground water into two layer aquifer systems such as the upper
unconfined aquifer (layer 1), and the lower more productive confined aquifer (layer 2).
The main hydstratigraphic aquifer units in the study area identified by WWDSE (2004) are:
Alluvial aquifers: alluvial sediments are distributed in Dire Dawa groundwater basin, unconfined
unit composed of clay, silt, sand, gravel and rock fragments. The groundwater depth on average
varies in the alluvial sediments from 15 to 50 m with the mean values of saturated media is about 20
m. The bottom elevation of this layer is estimated to be 900m a.s.l. The transmissivity of the
alluvial formation as obtained from pumping test results varies from 8 to 700 m2/day.
Transmissivity is directly proportional to horizontal permeability (K) and thickness (b) of the
saturated aquifer.The estimated average value of transmissivity (T) and hydraulic conductivity (K)
is 27.5m2/day and 1.4m/day (1.5 x 10
-5 to 10
-3m/s) respectively (WWDSE, 2004). The
summarized values of transmissivity by Minalha (2007) are given in the table.3. The mean value of
K is very important for prediction and assimilation of transport model in the phreatic aquifer.
Table.3 Summary of transmissivity of the different geological formation (Minalha, 2007)
17
Tertiary volcanic rocks: These rocks refer to the stratiod and Alaji basalt outcrops that occupy the
elevated areas at the north and northeastern part of the area. This formation is generally a regional
aquiclude and is the confining layer for the lower highly productive confined aquifer with
transmissivity less than 5m2/day (the average T value is 5.7m
2/day). For modeling purpose this unit
is assumed to have a constant thickness of 50m.
Cretaceous upper sandstones: this unit is found below the confining layer and alluvial deposits in
most part of the lower part of the study area. The drilled wells in the aquifer show that the thickness
of the aquifer is variable. The minimum thickness of the aquifer penetrated at the Dire Jara well
field is 36m. However the estimated average thickness of the unit is 200m (Tesfamichael, 1974).
The static water level varies from 10m (Sabiyian) to 70m (Dire-Jara) with the specific discharge of
0.13 to 68 lit/sec/m.
Jurassic Hamanalei limestone: the drilling results show that the limestone uncomfortably
underlies the upper sandstone. The limestone in the study area could not be independently
characterized and the aquifer characterization for the upper sandstone applies also for the limestone.
The lower part of the limestone is a gray-white limestone inter-bedded with shale overlain with
oolitic limestone and the upper part is well-bedded gray fossiliferous limestone (Seife B. 1982,
Habteab Z. & Jiri S.1986).
In the Sabiyan Wellfield, there are nine production wells which were constructed by 1987 in the
western expansion part of the city. The wells have the capacity to supply about 250 l/s for the entire
city population. The Sabiyan well field has two types of aquifers (MoWR, 1999a); one is a shallow
unconfined aquifer in the recent deposits about 15 to 25m depth while the second aquifer is situated
in the deeper quartz sandstone with water bearing fractures at depths greater than 35m. Six of the
boreholes were completed in the main quartz sandstone aquifer and one borehole (PW-8) was
completed in calcareous sandstone.
3.3. Groundwater Resources and Anthropogenic Activities
Urbanisation as a driving force; the increasing size and population of cities and towns is facilitated
by the „pushing-pulling factors‟, migration from rural areas due to a major environmental change.
During the twentieth century, the world‟s rural population will be doubled but the urban population
increased more than tenfold (WWAP, 2006). A lot of changes will be faced as a result of
urbanization.
18
Wastes generated from the urban environment may be contaminated the aquifer as well as affected
the quality of water in the area (Wondewosun, 2003). The poor sanitation condition together with
the lack of proper waste disposal mechanisms attributed to sever effect of pollution of both surface
and ground water resources of the area. As Lerner, (2003) presented the most sever effect of
pollution was observed in shallow wells, which is the reflection of all anthropogenic impact on
water bodies of the area. Assessing the fate and behaviour of the NPS (Non Point Source) pollutants
is a complex environmental problem due to heterogeneity of the subsurface system and the spread
of NPS over large areas in relatively low concentrations (Al-Zabet 2002). Depending on the local
conditions, the same anthropogenic influence does not always cause the same effects of the same
magnitude. By analysis of the correlation coefficients and a factor analysis, groups of parameters
which originate from common sources were derived but also influenced by anthropogenic factors
(Schiedek et al.2008).
3.3.1 Land use System and Urbanization
Dire Dawa is one of the fast growing towns in Ethiopia. It has recorded a dramatic growth since its
foundation. The first Master plan of Dire Dawa was prepared in 1967 that has now become
outdated. The land use master plan that dates back to late 1967 and 1994 (NUPI-National Urban
plan Institute) indicates that the total planned area was 2928 and 3241 hectares respectively. By the
year (2004), the town extended to 8386 hectares (Fig.8) and still the town is expanding.
The land use system of the town is dominantly mixed as shown in Fig.8, especially residential areas
with commercial activities. This is true notably in the central part of the town where almost all
buildings along the streets are used for commercial activities and their backyards or internal
courtyards are used for dwelling purpose. Residential areas cover around 680 ha (10%); squatter
settlement is estimated 980 ha (12%) and all about consists of 50% of the total built-up area.
19
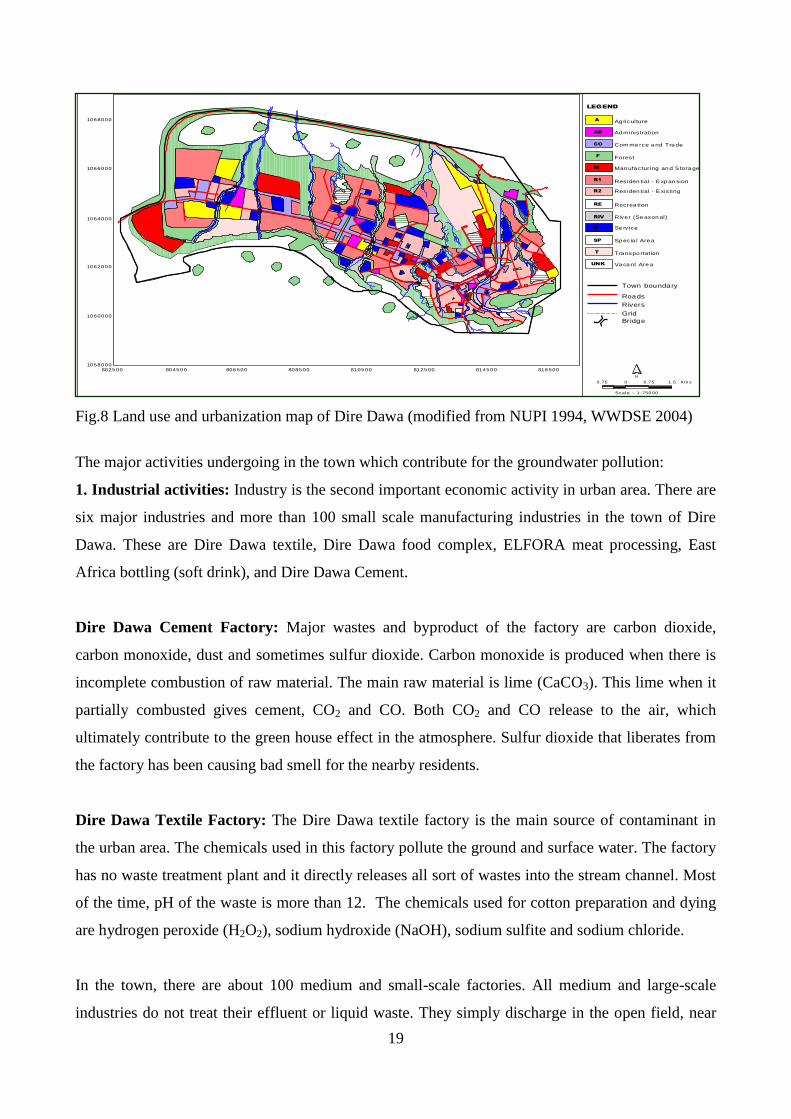
Fig.8 Land use and urbanization map of Dire Dawa (modified from NUPI 1994, WWDSE 2004)
The major activities undergoing in the town which contribute for the groundwater pollution:
1. Industrial activities: Industry is the second important economic activity in urban area. There are
six major industries and more than 100 small scale manufacturing industries in the town of Dire
Dawa. These are Dire Dawa textile, Dire Dawa food complex, ELFORA meat processing, East
Africa bottling (soft drink), and Dire Dawa Cement.
Dire Dawa Cement Factory: Major wastes and byproduct of the factory are carbon dioxide,
carbon monoxide, dust and sometimes sulfur dioxide. Carbon monoxide is produced when there is
incomplete combustion of raw material. The main raw material is lime (CaCO3). This lime when it
partially combusted gives cement, CO2 and CO. Both CO2 and CO release to the air, which
ultimately contribute to the green house effect in the atmosphere. Sulfur dioxide that liberates from
the factory has been causing bad smell for the nearby residents.
Dire Dawa Textile Factory: The Dire Dawa textile factory is the main source of contaminant in
the urban area. The chemicals used in this factory pollute the ground and surface water. The factory
has no waste treatment plant and it directly releases all sort of wastes into the stream channel. Most
of the time, pH of the waste is more than 12. The chemicals used for cotton preparation and dying
are hydrogen peroxide (H2O2), sodium hydroxide (NaOH), sodium sulfite and sodium chloride.
In the town, there are about 100 medium and small-scale factories. All medium and large-scale
industries do not treat their effluent or liquid waste. They simply discharge in the open field, near
Bridge
Rivers
Roads
Grid
Town boundary
Ag riculture
LEGEND
Fig 9.1 Landuse and urbanization map of Dire Dawa town
NB: Boundaries are approximate
0.75 0 0.75 1.5 Km s
N
Scal e :- 1 :750 00
Ad ministration
Com me rce a nd Tra de
Forest
Man ufa cturing an d S tora ge
Residen tial - Exp an sion
Residen tial - Existing
Recrea tion
Se rvice
Sp ecia l Are a
Tra nspo rtat ion
AD
CO
F
M
R1
R2
RE
RIV
S
SP
T
UNK
A
Rive r (Se ason al)
Va ca nt Are a
1068000
1066000
1064000
1062000
1058000
1060000
816500814500812500810500808500806500804500802500
20
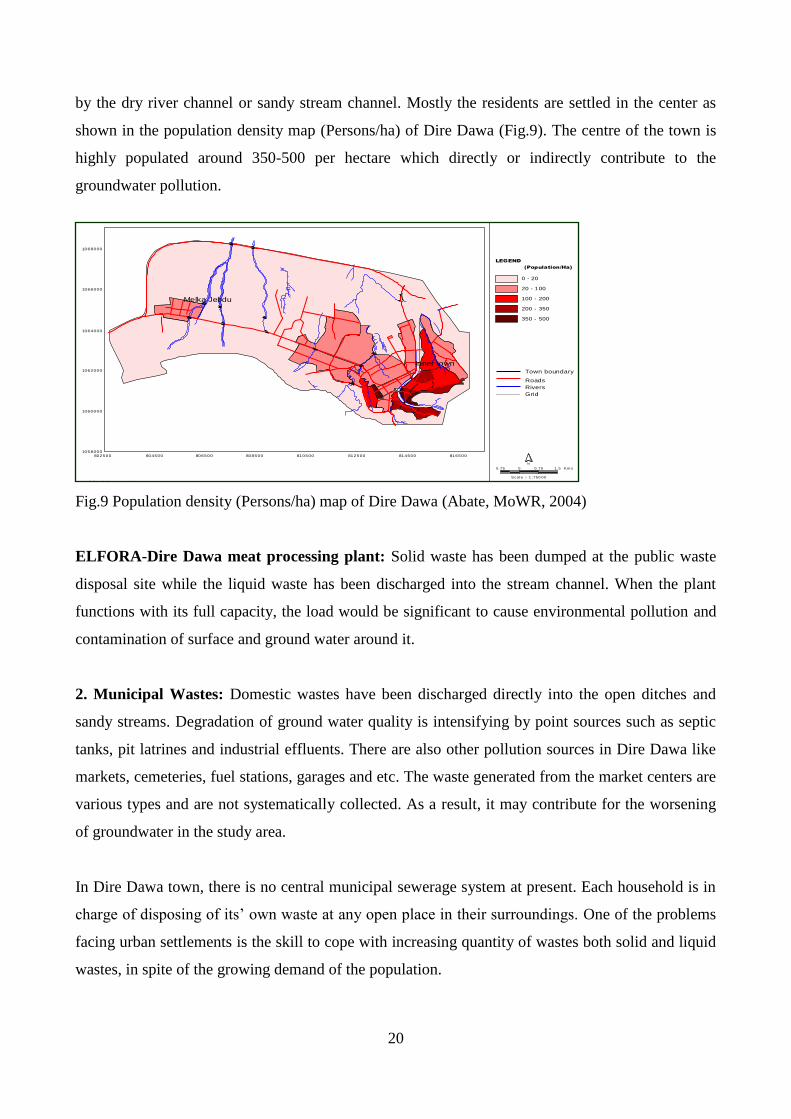
by the dry river channel or sandy stream channel. Mostly the residents are settled in the center as
shown in the population density map (Persons/ha) of Dire Dawa (Fig.9). The centre of the town is
highly populated around 350-500 per hectare which directly or indirectly contribute to the
groundwater pollution.
Fig.9 Population density (Persons/ha) map of Dire Dawa (Abate, MoWR, 2004)
ELFORA-Dire Dawa meat processing plant: Solid waste has been dumped at the public waste
disposal site while the liquid waste has been discharged into the stream channel. When the plant
functions with its full capacity, the load would be significant to cause environmental pollution and
contamination of surface and ground water around it.
2. Municipal Wastes: Domestic wastes have been discharged directly into the open ditches and
sandy streams. Degradation of ground water quality is intensifying by point sources such as septic
tanks, pit latrines and industrial effluents. There are also other pollution sources in Dire Dawa like
markets, cemeteries, fuel stations, garages and etc. The waste generated from the market centers are
various types and are not systematically collected. As a result, it may contribute for the worsening
of groundwater in the study area.
In Dire Dawa town, there is no central municipal sewerage system at present. Each household is in
charge of disposing of its‟ own waste at any open place in their surroundings. One of the problems
facing urban settlements is the skill to cope with increasing quantity of wastes both solid and liquid
wastes, in spite of the growing demand of the population.
0 - 20
20 - 100
100 - 200
200 - 350
350 - 500
Town boundary
Grid
Roads
Rivers
LEGEND
(Population/Ha)
Fig 9.2 Population density map of Dire Dawa town (population /ha)
NB: Boundaries are approximate
0.75 0 0.75 1.5 Km s
N
Scal e :- 1 :750 00
802500 804500 806500 808500 810500 812500 814500 816500
1060000
1058000
1062000
1064000
1066000
1068000
Melka Jebdu
Inner town

21
As a result urban settlements are facing with serious health and environmental complications, as the
existing sanitation conditions turn out to be worst by unrestrained population increase and
urbanization. For example the distributions of housing units or households are made by types of
toilet facilities used shown in the table.4 below. As to the information obtained from CSA (1998)
the sanitation facility coverage is more than 75% in the town of DDAC.
Table.4 Urban toilet facilities of Dire Dawa by housing unit (CSA, 1998)
Towns
All
Housing
units
Type of Toilet facilities
Has no
Toilet
Flushed
Toilet
private
Flushed
Toilet
shared
Pit Private Pit Shared Not
stated
Dire Dawa 34680 20% 4.6% 2.3% 28.3% 37.7% 1.8%
MelkaJebdu 1702 2.8% - - 1.5% 0.25% -
Dire Dawa 36382 23.4% 4.6% 2.3% 29.8% 38% 1.8%
The solid waste disposal system is generally weak. The solid waste collection mechanisms and
location sites of containers are not systematically in place. The dumping site also has conducted at
open fields. Solid waste/garbage disposal situation in Dire Dawa town, as per 1998 CSA data is
indicated in the table.5 below.
Table.5 Solid waste/garbage disposal situations in Dire Dawa (CSA, 1998)
Status Vehicle container Dug out Thrown away Others Total
Rural 3.1% 1.1% 93% 2.8% 100%
Urban 46.55 11% 37.4% 5.1% 100%
As to the conservation strategy document prepared in the year 2000, the solid waste collection and
disposal situation in Dire Dawa is 76% dump outside in an open field, 14% in pit, and 10% burning.
3. Agricultural Wastes: In the city and its vicinity, there are numerous urban agricultural activities
such as Tony farm, „chat‟ farm, Amdael diary farm, Hafecat diary, and other small-scale cattle
breeding and horticulture producers in the town. Generally, the agricultural inputs and by-products
are the major constitutes of wastes and have a chance to contribute for the groundwater pollution.
Animal wastes are classified as solid and liquid. Such animal waste may become the source of
groundwater pollution.
22
3.3.2 Groundwater Quality Degradation
Results from laboratory analysis which was conducted on water samples taken from different
localities at different times indicate that the level of groundwater pollution is increasing at an
alarming rate. For instance, according to the hydrochemical analysis conducted by an Israeli
geologist (Greitzer, 1959), the maximum concentration of NO3-
at the centre of the town was
45mg/l. After twenty-two years by Ketema (1982) reported 230mg/l NO3- concentration observed
within Dire Dawa town. On the other hand, water sampled by MoWR (2003) from Dire Dawa food
complex borehole (FBH) was analyzed by EIGS-laboratory and an even higher concentration
(266mg/l) of nitrate was observed.
According to Taye (1988) Dire Dawa town is a fast growing industrial and commercial town, which
produces pollutants in large amount. The degree of nitrate concentration in the groundwater also
depends on the population density; recharge condition and geological nature of the area.The
domestic as well as industrial wastes have been discharged directly into the open ditches and sandy
alluvial flashing streams. From the nature of its topography and soil, the groundwater resource of
the study area is very sensitive to pollution.
3.3.3 Nitrate and its sources
Nitrate is a chemical compound of one part nitrogen and three parts oxygen that is designated by the
symbol “'NO3-”. It is the most common form of nitrogen found in water. In water, nitrate has no
taste or scent and can only be detected through a chemical test. The Maximum Acceptable
Concentration (MAC) for nitrate in drinking water in British Columbia (BC) is 45mg/l while
according to WHO's drinking-water quality, set up in Genea 1993 is 50 mg/l of total nitrogen. For
laboratory tests reported as nitrate-nitrogen (NO3- N, the amount of nitrogen present in nitrate) the
MAC is 10 mg/l (BC, 2007).
1. Sources of nitrate: There are many sources of nitrogen (both natural and anthropogenic) that
could potentially lead to the pollution of the groundwater with nitrates; the anthropogenic sources
are really the ones that most often causes of nitrate to rise to a dangerous level. Waste materials are
one of the anthropogenic sources of nitrate contamination of groundwater. Many local sources of
potential nitrate contamination of groundwater exist such as, "sites used for disposal of human and
animal sewage; industrial wastes related to food processing, munitions, and some polyresin
facilities; and sites where handling and accidental spills of nitrogenous materials may accumulate"
(Hallberg and Keeney, 1993). Septic tanks are another example of anthropogenic source nitrogen
23
contamination of the groundwater. Groundwater contamination is usually related to the density of
septic systems (Hallberg and Keeney, 1993). In densely populated areas, septic systems can
represent a major local source of nitrate to the groundwater. However in less populated areas septic
systems don't really pose much of a threat to groundwater contamination.
2. Nitrate in groundwater system: According Wakida (2008) the rapid growth of urban population
in developing countries leads to unplanned settlements where limited pit latrines or septic tanks are
the only options available for sewage disposal. Urban sources of nitrate-N may have a high impact
on groundwater quality because of the high concentration of potential sources in a smaller area than
agricultural land (Wakida and Lerner, 2005). The mobility of N with respect to groundwater is
related to chemical properties that affect the ease of transport with water and adsorption to soil
particles. Nitrate (NO3) is the most mobile form of N because of its high solubility and negative
charge (Seelig & Nowatzki, 2001).
Ammonia is produced by the breakdown of organic sources of nitrogen; being a major constituent
of proteins and nucleic acids. Municipal wastewaters contain large amounts of organic wastes, so
the wastewater will have a high ammonia concentration. With this high concentration of ammonia,
the wastewater would harm downstream ecosystems if released (Henze et al.1997). Ammonia is
toxic to aquatic life at these concentrations, and the nitrification process requires oxygen (ammonia
contributes to the BOD of the wastewater) so it will use up the oxygen needed by other organisms.
The rates of nitrification reaction are highly dependent on a number of environmental factors.
These include the substrate and oxygen concentration, temperature, pH, and the presence of toxic or
inhibiting substances (Butcher et al, 1992). According to Butcher et al (1992) one striking aspect of
environmental nitrogen chemistry is the coexistence of reduced compounds (ammonia N oxidation
state = -3) and fully oxidized species (e.g., nitrate N oxidation state =+5). This results from chemical
and biochemical processing that occurs in both aerobic and anaerobic environments.
Bacteria play an important role as catalysts in almost all nitrogen transformations in nature. In
microbiology (Krumbein, 1983; Zehnder, 1988) the two important overall reactions are
denitrification and nitrification. Denitrification stimulates the reduction of nitrate to N2(g) by
bacteria, through a complicated pathway involving intermediates like nitrite. It should be noted that
denitrification is not a reversible reaction. During nitrification, bacteria oxidize amines from organic
matter to nitrite and nitrate.
24
3. The environmental health concerns: Though nitrate is considered relatively non-toxic, a high
nitrate concentration in drinking water is an environmental health concern because it can harm
infants by reducing the ability of blood to transport oxygen. In babies, especially those under six
months old, methaemoglobinaemia, commonly called “blue-baby syndrome,” can result from
oxygen deprivation caused by drinking water high in nitrate. Methemoglobinemia is the condition
in the blood which causes infant cyanosis, or blue-baby syndrome. Methemoglobin is probably
formed in the intestinal tract of an infant when bacteria convert the nitrate ion to nitrite ion (Comly,
1987). One nitrite molecule then reacts with two molecules of hemoglobin to form methemoglobin.
In acid mediums, such as the stomach, the reaction occurs quite rapidly (Comly, 1987). This altered
form of blood protein prevents the blood cells from absorbing oxygen which leads to slow
suffocation of the infant which may lead to death (Gustafson, 1993; Finley, 1990).
25
4. Water Quality Analysis and Hydrogeochemical processes
4.1 Water types and its sources
Water analyses (Annex-I and Table.6) show that the groundwater composition is highly mixed and
modified by manmade and natural factors. The major sources of anions like sulphate, and chloride
are of sedimentary origin like gypsum and halite. Bicarbonate may be from both sources;
dissolution of carbonate rocks and silicate weathering processes. It needs to be conceptualized in
order to trace the source rock and the contribution of different minerals in the groundwater system.
The water quality result has changed due to different sources (rain and spring water and water from
Bh (inner-town) & Bh (out-down)) and involving mechanisms. The chemical composition of waters varied
from place to place through groundwater evolution on major cations and anions. In the Table.6 the
sampling sites are located from upper part of the basin (FSP-5 Fechass Spring) towards the lower
part of Shinile Bh (downstream). The values of nitrate and chloride have similar trend. At TDW-1
(Tsehaye dug well) values increased which is 155mg/l nitrate and 197mg/l of chloride due to some
sort of modification at this area. The nitrate value goes down (i.e 44mg/l) at the downstream of
Shinile Bh (SnBh-1) by denitrification process and other mechanisms. Nitrate is the most mobile
form of N because of its high solubility and transport with water and adsorption by soil particles.
Ammonium (NH4+) is missed in laboratory sample analysis but the are many possible sources from
municipal wastes. The pH of rain water also is not indicated.
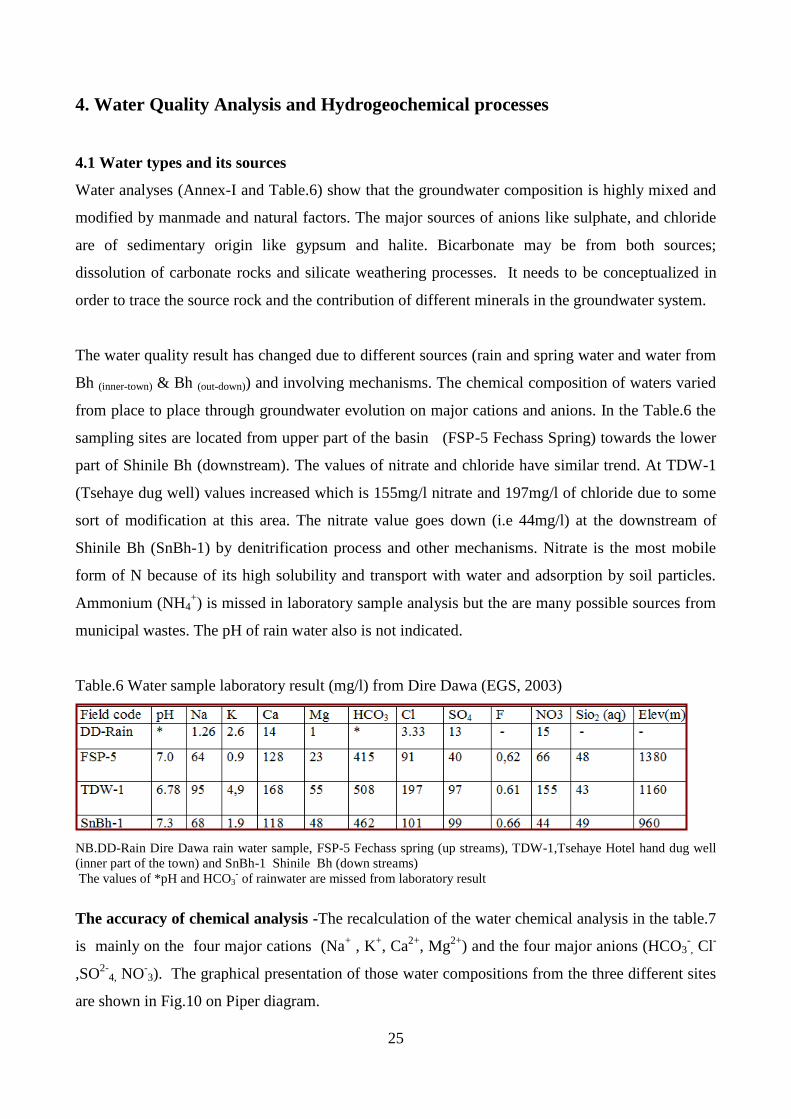
Table.6 Water sample laboratory result (mg/l) from Dire Dawa (EGS, 2003)
NB.DD-Rain Dire Dawa rain water sample, FSP-5 Fechass spring (up streams), TDW-1,Tsehaye Hotel hand dug well
(inner part of the town) and SnBh-1 Shinile Bh (down streams)
The values of *pH and HCO3- of rainwater are missed from laboratory result
The accuracy of chemical analysis -The recalculation of the water chemical analysis in the table.7
is mainly on the four major cations (Na+ , K
+, Ca
2+, Mg
2+) and the four major anions (HCO3
-, Cl
-
,SO2-
4, NO-3). The graphical presentation of those water compositions from the three different sites
are shown in Fig.10 on Piper diagram.
26
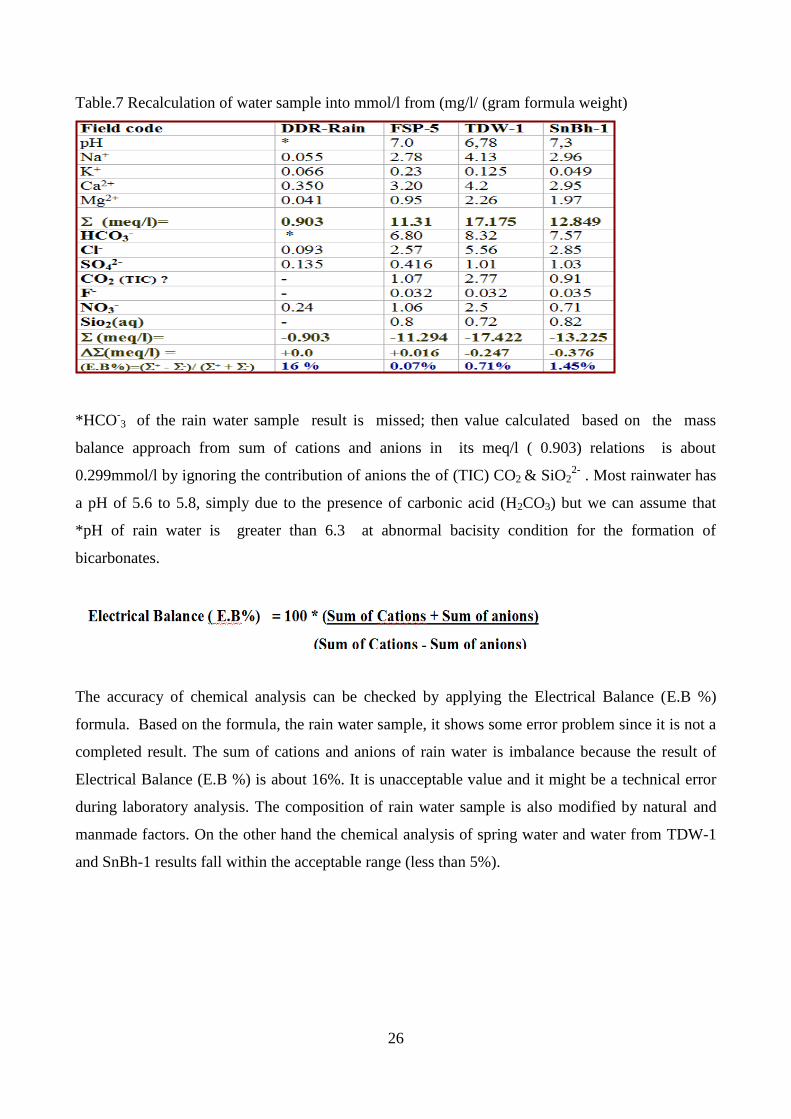
Table.7 Recalculation of water sample into mmol/l from (mg/l/ (gram formula weight)
*HCO-3 of the rain water sample result is missed; then value calculated based on the mass
balance approach from sum of cations and anions in its meq/l ( 0.903) relations is about
0.299mmol/l by ignoring the contribution of anions the of (TIC) CO2 & SiO2
2- . Most rainwater has
a pH of 5.6 to 5.8, simply due to the presence of carbonic acid (H2CO3) but we can assume that
*pH of rain water is greater than 6.3 at abnormal bacisity condition for the formation of
bicarbonates.
The accuracy of chemical analysis can be checked by applying the Electrical Balance (E.B %)
formula. Based on the formula, the rain water sample, it shows some error problem since it is not a
completed result. The sum of cations and anions of rain water is imbalance because the result of
Electrical Balance (E.B %) is about 16%. It is unacceptable value and it might be a technical error
during laboratory analysis. The composition of rain water sample is also modified by natural and
manmade factors. On the other hand the chemical analysis of spring water and water from TDW-1
and SnBh-1 results fall within the acceptable range (less than 5%).
27
+
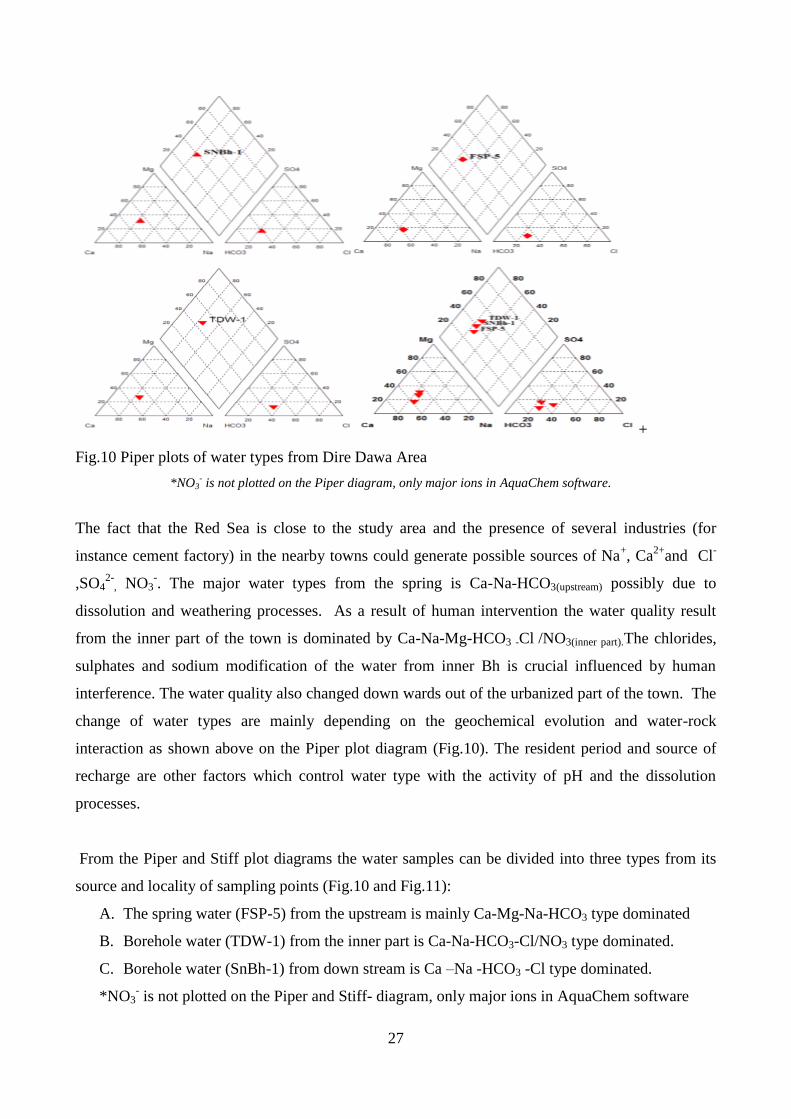
Fig.10 Piper plots of water types from Dire Dawa Area
*NO3- is not plotted on the Piper diagram, only major ions in AquaChem software.
The fact that the Red Sea is close to the study area and the presence of several industries (for
instance cement factory) in the nearby towns could generate possible sources of Na+, Ca
2+and Cl
-
,SO42-
, NO3-. The major water types from the spring is Ca-Na-HCO3(upstream) possibly due to
dissolution and weathering processes. As a result of human intervention the water quality result
from the inner part of the town is dominated by Ca-Na-Mg-HCO3 -Cl /NO3(inner part).The chlorides,
sulphates and sodium modification of the water from inner Bh is crucial influenced by human
interference. The water quality also changed down wards out of the urbanized part of the town. The
change of water types are mainly depending on the geochemical evolution and water-rock
interaction as shown above on the Piper plot diagram (Fig.10). The resident period and source of
recharge are other factors which control water type with the activity of pH and the dissolution
processes.
From the Piper and Stiff plot diagrams the water samples can be divided into three types from its
source and locality of sampling points (Fig.10 and Fig.11):
A. The spring water (FSP-5) from the upstream is mainly Ca-Mg-Na-HCO3 type dominated
B. Borehole water (TDW-1) from the inner part is Ca-Na-HCO3-Cl/NO3 type dominated.
C. Borehole water (SnBh-1) from down stream is Ca –Na -HCO3 -Cl type dominated.
*NO3- is not plotted on the Piper and Stiff- diagram, only major ions in AquaChem software
28
Fig.11 Stiff plot diagram of the three water types (FSP-5, SnBh-1 & TDW-1)
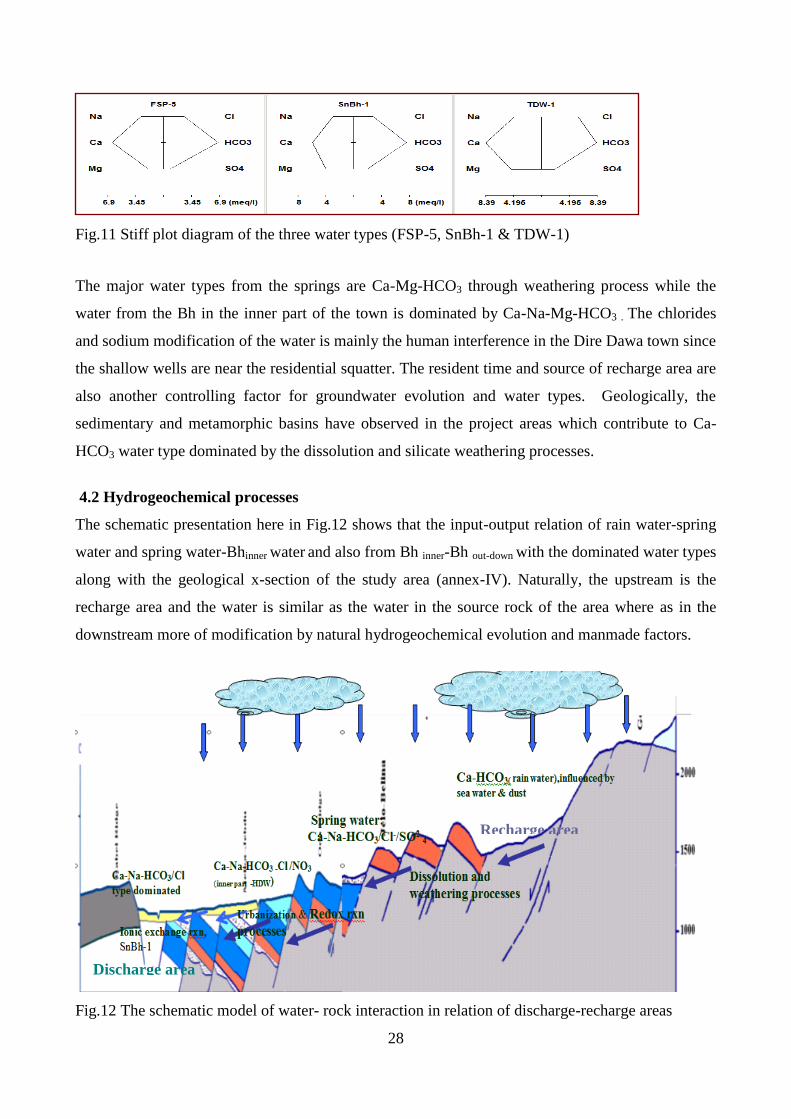
The major water types from the springs are Ca-Mg-HCO3 through weathering process while the
water from the Bh in the inner part of the town is dominated by Ca-Na-Mg-HCO3 . The chlorides
and sodium modification of the water is mainly the human interference in the Dire Dawa town since
the shallow wells are near the residential squatter. The resident time and source of recharge area are
also another controlling factor for groundwater evolution and water types. Geologically, the
sedimentary and metamorphic basins have observed in the project areas which contribute to Ca-
HCO3 water type dominated by the dissolution and silicate weathering processes.
4.2 Hydrogeochemical processes
The schematic presentation here in Fig.12 shows that the input-output relation of rain water-spring
water and spring water-Bhinner water and also from Bh inner-Bh out-down with the dominated water types
along with the geological x-section of the study area (annex-IV). Naturally, the upstream is the
recharge area and the water is similar as the water in the source rock of the area where as in the
downstream more of modification by natural hydrogeochemical evolution and manmade factors.
Fig.12 The schematic model of water- rock interaction in relation of discharge-recharge areas
Recharge area
Discharge area
29
4.2.1 Silicate weathering and carbonates
The water type of the spring is mainly bicarbonate (Ca-Mg/Na-HCO3). Most of the springs
originate from the escarpment part of the region. The limestone unit and fractured basement
complex of the region making a favorable condition for the origin of springs which contribute for
the bicarbonate water. The mass balance approach is important in weathering process to trace the
relative changes of water chemistry though the dissolution or precipitation of minerals and in order
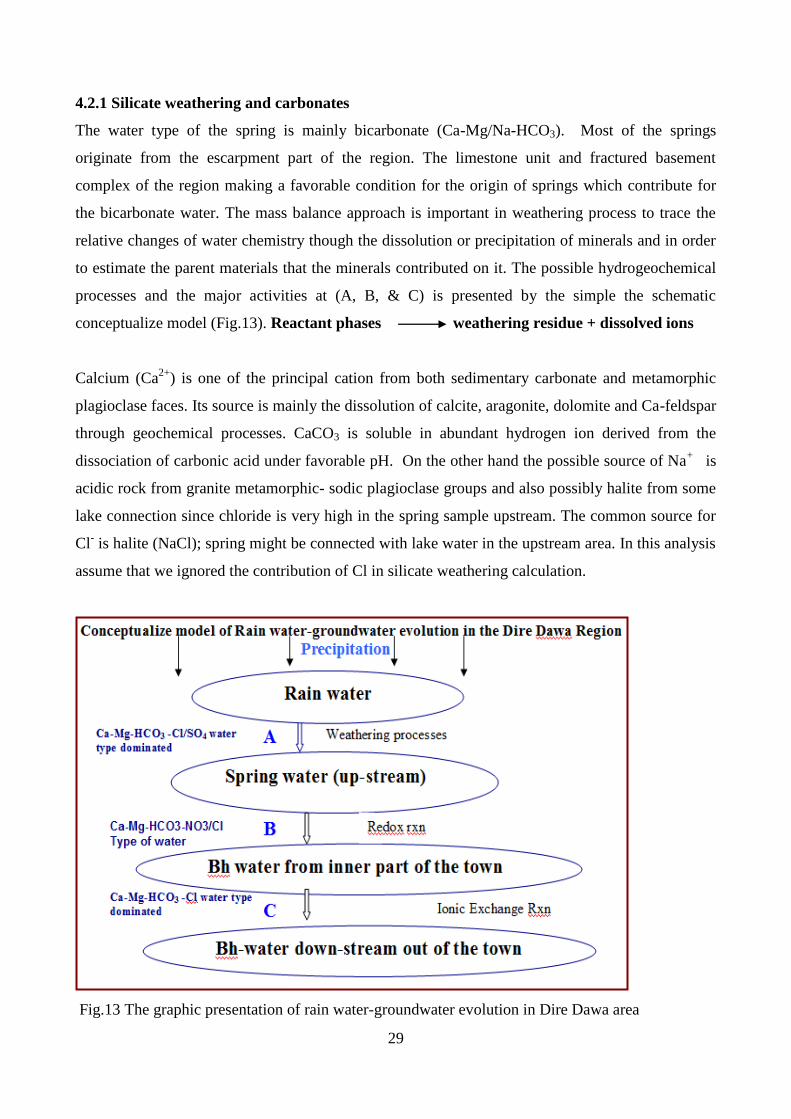
to estimate the parent materials that the minerals contributed on it. The possible hydrogeochemical
processes and the major activities at (A, B, & C) is presented by the simple the schematic
conceptualize model (Fig.13). Reactant phases weathering residue + dissolved ions
Calcium (Ca2+
) is one of the principal cation from both sedimentary carbonate and metamorphic
plagioclase faces. Its source is mainly the dissolution of calcite, aragonite, dolomite and Ca-feldspar
through geochemical processes. CaCO3 is soluble in abundant hydrogen ion derived from the
dissociation of carbonic acid under favorable pH. On the other hand the possible source of Na+
is
acidic rock from granite metamorphic- sodic plagioclase groups and also possibly halite from some
lake connection since chloride is very high in the spring sample upstream. The common source for
Cl- is halite (NaCl); spring might be connected with lake water in the upstream area. In this analysis
assume that we ignored the contribution of Cl in silicate weathering calculation.
Fig.13 The graphic presentation of rain water-groundwater evolution in Dire Dawa area
30
There are a lot of sources for bicarbonate (HCO-3) water depending on the pH activity. In the table.8
below the water composition of spring is possible the product of dissolution of carbonates and
silicate weathering reactions. The concentration in rain water subtracted from the spring water to
obtain the contribution of rock weathering through water- source rock interaction.
Table.8 The contribution of weathering from silicates/carbonates of (FSP-1) spring water (mmol/l)
From the spring water chemistry it is possible to estimate the mineral sources/parent rock material.
Halite (NaCl), gypsum (CaSO4), plagioclase, calcite (CaCO3) and silica (quarz SiO2) are the most
primary minerals present in the rocks that contribute for the spring water composition in upstream
areas. The differences in composition between the rain water and perennial springs are due to
reactions between water and rocks/minerals it contacts probably a longer residence time in the
subsoil.
Carbonates/CO2 and major cations: The occurrence of carbonates and bicarbonates in spring
water is largely dependent on pH value. From the theoretical background, at pH greater than 10.3
the dissociation of bicarbonate ions into carbonate ions is the predominant species. At PH less than
10.3 most carbonate ions become bicarbonate ions. HCO3 is more abundant at pH< 10.3. The
production of bicarbonate is very high at low pH and open system.
The most common carbonate minerals in spring water are calcite (CaCO3) and dolomite
(CaMg(CO3)2). The carbonate reactions are very important to control the groundwater chemistry.
Springs have excessively higher hardnesses. The hardness of spring water also depends mainly on
the presence of dissolved calcium and magnesium from carbonate rocks with bicarbonate anion
associated with limestone and dolomite. The major causes of hardness is water passes through or
over deposits such as limestone, the levels of Ca2+
, Mg2+,
and HCO3- ions present in the water can
greatly increase and cause the water to be classified as hard water. Total hardness of FSP-5 spring
water in Dire Dawa is around 8.3meq/l by applying the formula (TH= 3.2Ca*2 + 0.95Mg*2
=8.3meq/l). Total hardness is a measure of the amount of calcium and magnesium, and is expressed
as calcium carbonate.
31
4.2.2 Water quality modification and Ionic exchange process
Reduction and oxidation processes play a great role for the change of water quality in the
groundwater evolution with the contribution of natural phenomena and manmade inputs.
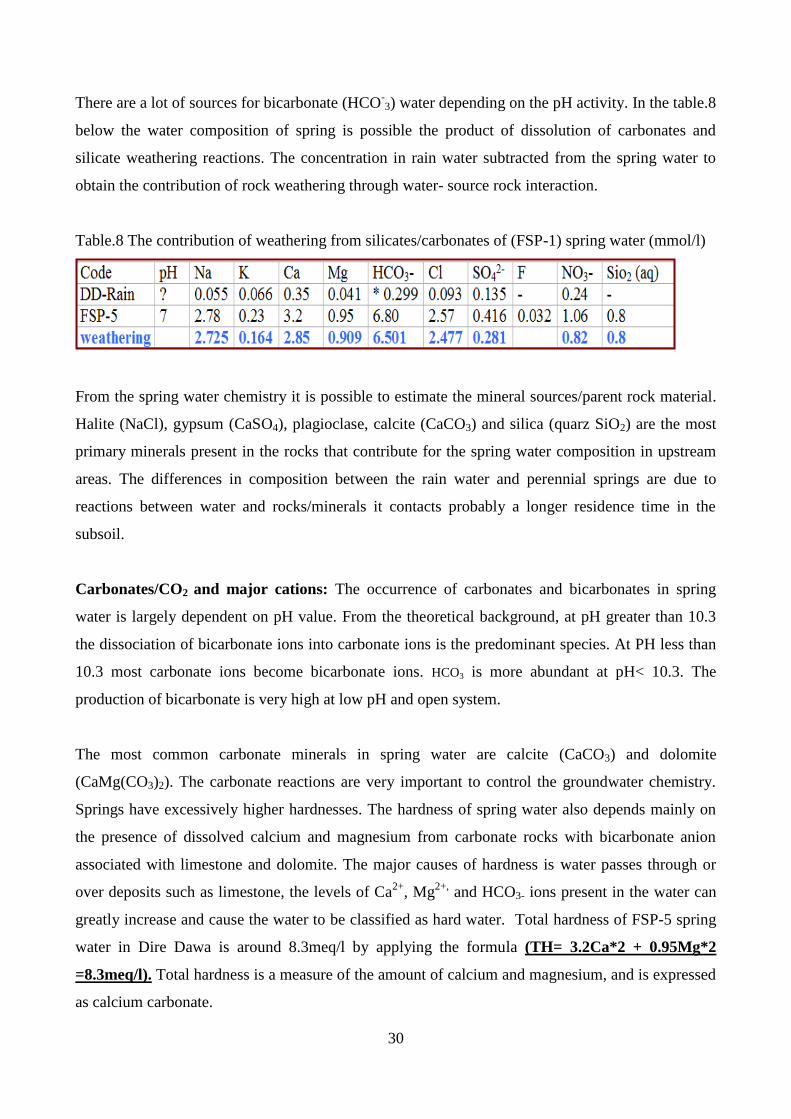
In table.9 the value of major cations and anions have increased from FSP-5 spring towards the
Tsehaye dug well (TDW-1) in the inner city as a result of certain inputs. The concentration of
nitrate becomes excess in the shallow wells of the city. Bacteria in water quickly convert nitrites
(NO-2) to nitrates (NO
-3) mainly by nitrification. The geochemical processes are enhanced for the
change of water quality from (TDW-1) to the downstream of Shinle bore hole (SnBh-1) in the basin
that presented at (Fig.12 and Fig.13) above.
Table.9 Spring-borehole water geochemical evolution (mmol/l) in Dire Dawa
In the table.9, the concentration of major cations and anions are changed in groundwater at TDW-1
station where as moving downstream (SnBh-1) at the sometime it become decreased the dilution
processes. Hydrochemical results show that there is some sort of artificial inputs discharged into the
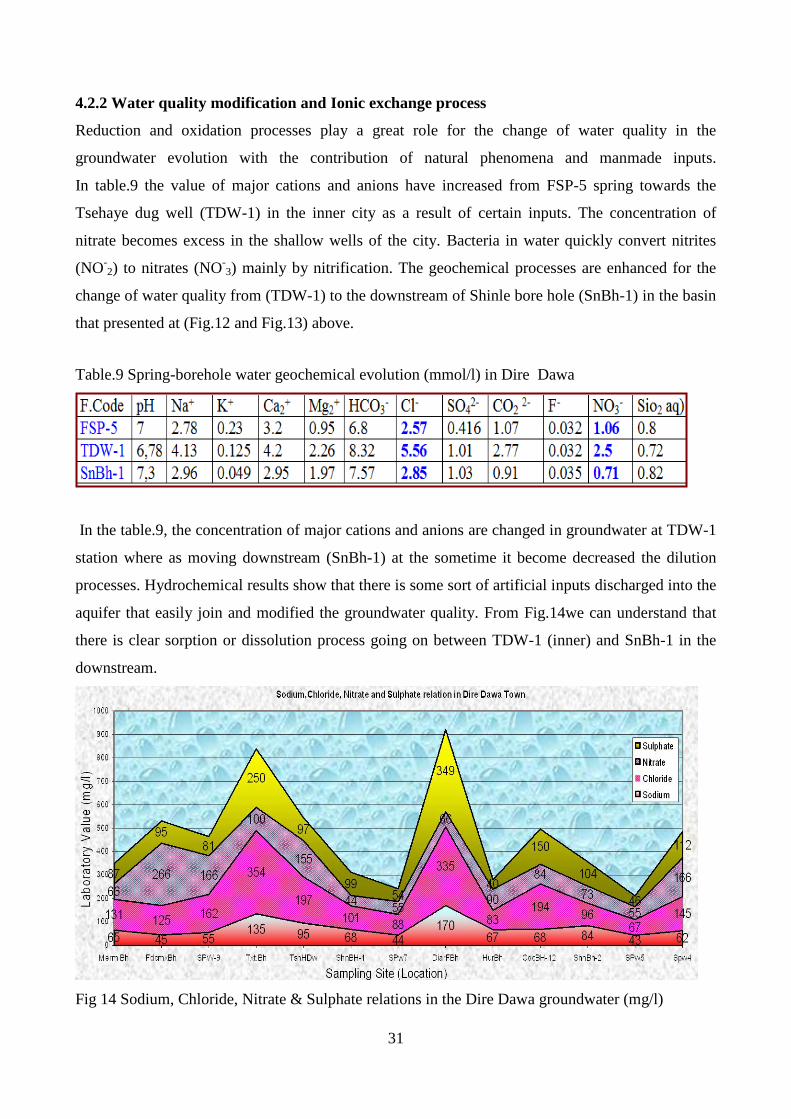
aquifer that easily join and modified the groundwater quality. From Fig.14we can understand that
there is clear sorption or dissolution process going on between TDW-1 (inner) and SnBh-1 in the
downstream.
Fig 14 Sodium, Chloride, Nitrate & Sulphate relations in the Dire Dawa groundwater (mg/l)
32
The major anion values have increased at Txt.Bh and FBh bore holes as shown in (Fig 14) due to
the influence of human factors where as the value the of the springs are much lower at Spw-5 and
Spw-7 sampling stations (annex-I). Concentration of nitrate is high in the spring water. The
potential source of nitrate in the spring sample is the use of ammonia, forest coverage and manure
as fertilizers, the major acidifying process in the soil since; NH+
4 + 2O2 NO-3 + H
+ + H2O. In
general there is groundwater modification by human interference since anions are increasing and
decreasing at the same time that clearly observed in the Fig.14.
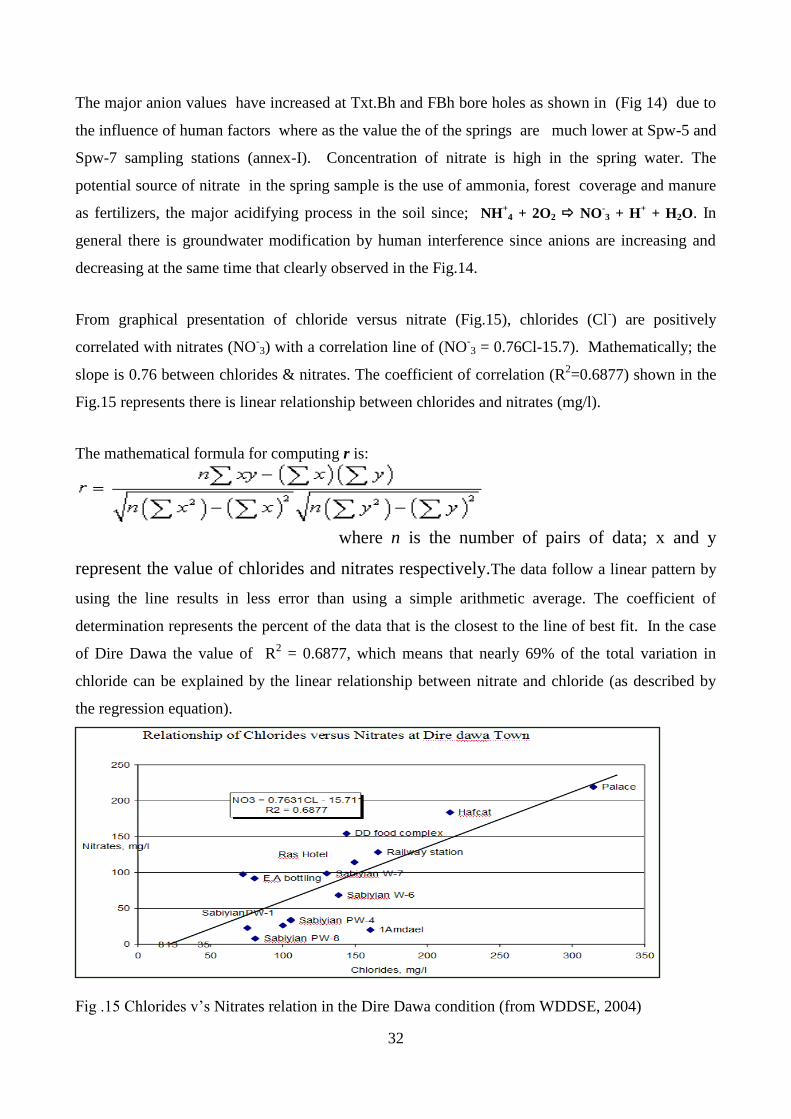
From graphical presentation of chloride versus nitrate (Fig.15), chlorides (Cl-) are positively
correlated with nitrates (NO-3) with a correlation line of (NO
-3 = 0.76Cl-15.7). Mathematically; the
slope is 0.76 between chlorides & nitrates. The coefficient of correlation (R2=0.6877) shown in the
Fig.15 represents there is linear relationship between chlorides and nitrates (mg/l).
The mathematical formula for computing r is:
where n is the number of pairs of data; x and y
represent the value of chlorides and nitrates respectively.The data follow a linear pattern by
using the line results in less error than using a simple arithmetic average. The coefficient of
determination represents the percent of the data that is the closest to the line of best fit. In the case
of Dire Dawa the value of R2 = 0.6877, which means that nearly 69% of the total variation in
chloride can be explained by the linear relationship between nitrate and chloride (as described by
the regression equation).
Fig .15 Chlorides v‟s Nitrates relation in the Dire Dawa condition (from WDDSE, 2004)
33
The graph (Fig.15) shows most of the shallow bore holes are located above the line i.e DD food
complex and Ras hotel which have the nitrate values of 155mg/l and 188mg/l while most of the
values chloride show less than 160mg/l below the line except Palace borehole at the pick value of
320mg/l. Nitrates are highly soluble and have more chance to be depleted through reduction and
biochemical reaction in the system as shown from DD food complex to Sabiyan Pw-1 since
chloride is non-reactive.
Mostly the source of the Na+ and NO3- is derived from municipal wastewaters contain large
amounts of organic wastes, so the wastewater will have a high ammonia concentration. Na+
become depleted in the downstream flow as compared the borehole samples at different water
points since part of Na+
is sorbed by the sediment or phreatic aquifer in the geochemical processes.
In general the concentration of the solute/contaminant is decreasing in relation along the flow
distance and time from the point source. Sorption tends to cause contaminants to move more slowly
than the groundwater, therefore the effects must be taken into consideration when calculating how
far the contaminant has traveled in a given time period. Most of the inorganic contaminants liquid
can be dissolved in water at a specified temperature and pH in the groundwater system.
34
5. Contaminant Transport and Conceptual Model
Modeling is very important in order to understand and conceptualize the field conditions of
groundwater system by analyzing and simulating the physical and chemical parameters into the
model. It is a complex process to model the subsurface groundwater system in connection with the
contaminant transport in the aquifers. It requires detailed and valid data; defining the flow lines of
groundwater in the aquifer, calculating the travel times of water along the flow lines and calculating
the dispersion of solutes (Appelo, 2005). Contaminants transport is controlled by the physical,
chemical, and biological processes in groundwater with various interacting processes, advection,
dispersion and chemical reactions that influence the movement and fate of contaminants.
It is possible to develop a model from simple (Darcy's Law) to complex (finite method/3D) by
defining all input parameter values and selected site characterization. The most important issue here
is conceptualizing the geological and hydrogeological settings and also human inputs in the system.
No model is perfect for all situations. A mathematical equation or computer generated model does
not provide a unique solution to an environmental problem. It provides a scenario based on specific
assumptions and specific input values. Varying certain input parameters can have a dramatic effect
on the results of a model. Selecting proper boundary conditions and other parameters can be quite
problematic. Any modeling effort should include a full written description of sensitivity analysis
results and a written justification for any assumptions and input parameter values used other than
model defaults (Steven A., 2001).
5.1 Groundwater flow and influence of production wells
The groundwater flow direction is controlled by many factors under subsurface condition. There are
different types of complexity in the subsurface; faulting and bedding, slopes, the hydrological
characteristics of the materials and locations of water all helps to define how the water will move
into the subsurface system. In the case of Dire Dawa area, as it has observed from the groundwater
contour map (Fig.16), there are two types of groundwater flow; local and regional. Locally, towards
the well-field which is highly influenced by production wells and the regional groundwater flows
towards the north direction that is similar to the surface flow.
Groundwater contour map can be produced by applying Surfer Golden software (refers, Fig.16);
using the water point coordinates (x, y) and the groundwater elevation point at the z-dimension as
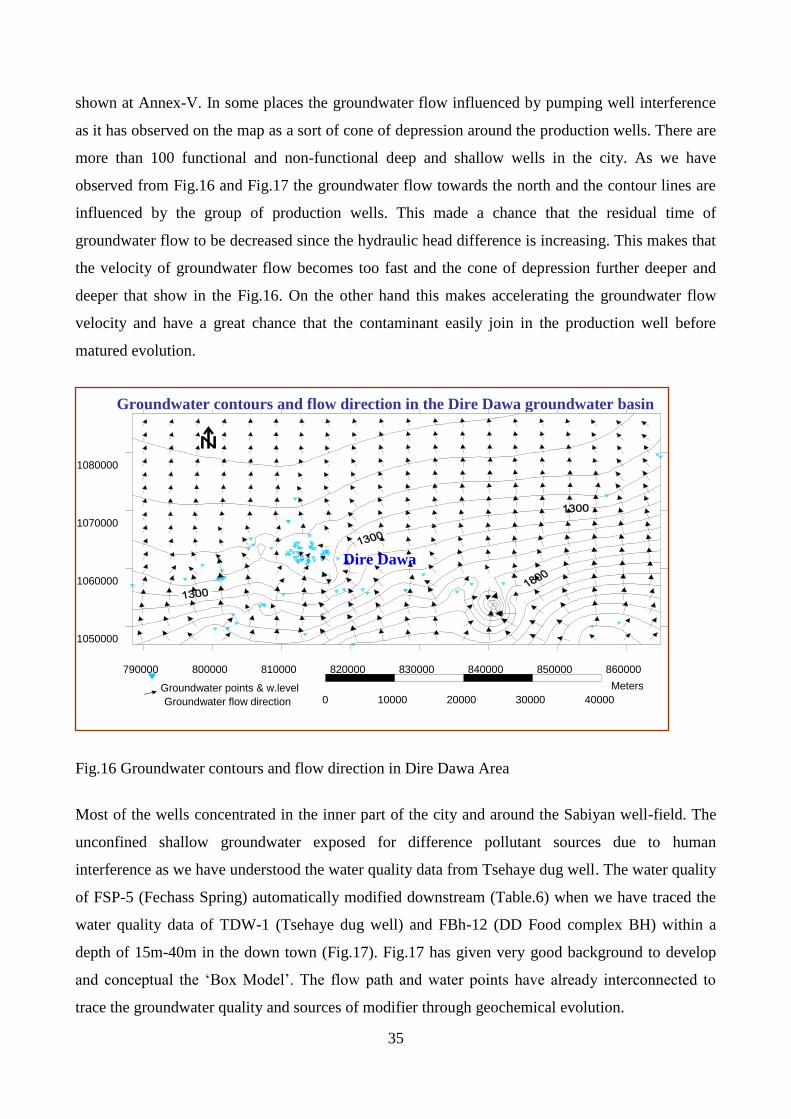
35
shown at Annex-V. In some places the groundwater flow influenced by pumping well interference
as it has observed on the map as a sort of cone of depression around the production wells. There are
more than 100 functional and non-functional deep and shallow wells in the city. As we have
observed from Fig.16 and Fig.17 the groundwater flow towards the north and the contour lines are
influenced by the group of production wells. This made a chance that the residual time of
groundwater flow to be decreased since the hydraulic head difference is increasing. This makes that
the velocity of groundwater flow becomes too fast and the cone of depression further deeper and
deeper that show in the Fig.16. On the other hand this makes accelerating the groundwater flow
velocity and have a great chance that the contaminant easily join in the production well before
matured evolution.
Fig.16 Groundwater contours and flow direction in Dire Dawa Area
Most of the wells concentrated in the inner part of the city and around the Sabiyan well-field. The
unconfined shallow groundwater exposed for difference pollutant sources due to human
interference as we have understood the water quality data from Tsehaye dug well. The water quality
of FSP-5 (Fechass Spring) automatically modified downstream (Table.6) when we have traced the
water quality data of TDW-1 (Tsehaye dug well) and FBh-12 (DD Food complex BH) within a
depth of 15m-40m in the down town (Fig.17). Fig.17 has given very good background to develop
and conceptual the „Box Model‟. The flow path and water points have already interconnected to
trace the groundwater quality and sources of modifier through geochemical evolution.
790000 800000 810000 820000 830000 840000 850000 860000
1050000
1060000
1070000
1080000
Groundwater points & w.level 0 10000 20000 30000 40000
Meters Groundwater flow direction
Groundwater contours and flow direction in the Dire Dawa groundwater basin
Dire Dawa
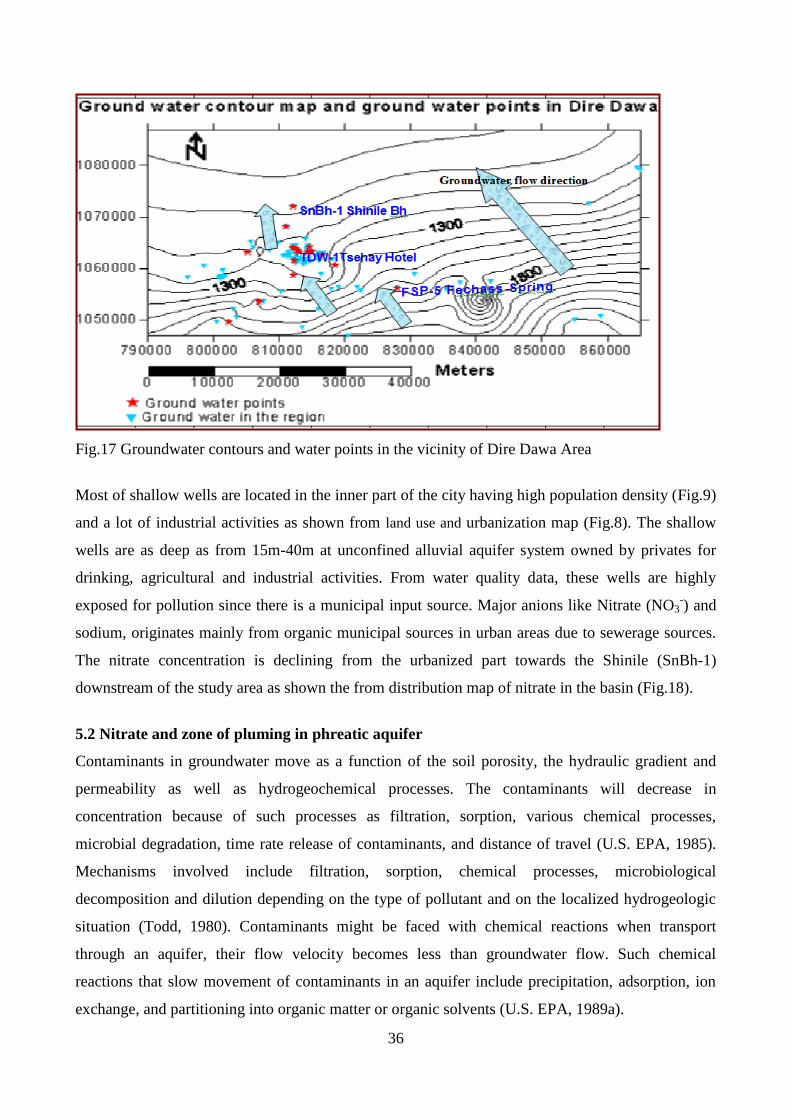
36
Fig.17 Groundwater contours and water points in the vicinity of Dire Dawa Area
Most of shallow wells are located in the inner part of the city having high population density (Fig.9)
and a lot of industrial activities as shown from land use and urbanization map (Fig.8). The shallow
wells are as deep as from 15m-40m at unconfined alluvial aquifer system owned by privates for
drinking, agricultural and industrial activities. From water quality data, these wells are highly
exposed for pollution since there is a municipal input source. Major anions like Nitrate (NO3-) and
sodium, originates mainly from organic municipal sources in urban areas due to sewerage sources.
The nitrate concentration is declining from the urbanized part towards the Shinile (SnBh-1)
downstream of the study area as shown the from distribution map of nitrate in the basin (Fig.18).
5.2 Nitrate and zone of pluming in phreatic aquifer
Contaminants in groundwater move as a function of the soil porosity, the hydraulic gradient and
permeability as well as hydrogeochemical processes. The contaminants will decrease in
concentration because of such processes as filtration, sorption, various chemical processes,
microbial degradation, time rate release of contaminants, and distance of travel (U.S. EPA, 1985).
Mechanisms involved include filtration, sorption, chemical processes, microbiological
decomposition and dilution depending on the type of pollutant and on the localized hydrogeologic
situation (Todd, 1980). Contaminants might be faced with chemical reactions when transport
through an aquifer, their flow velocity becomes less than groundwater flow. Such chemical
reactions that slow movement of contaminants in an aquifer include precipitation, adsorption, ion
exchange, and partitioning into organic matter or organic solvents (U.S. EPA, 1989a).
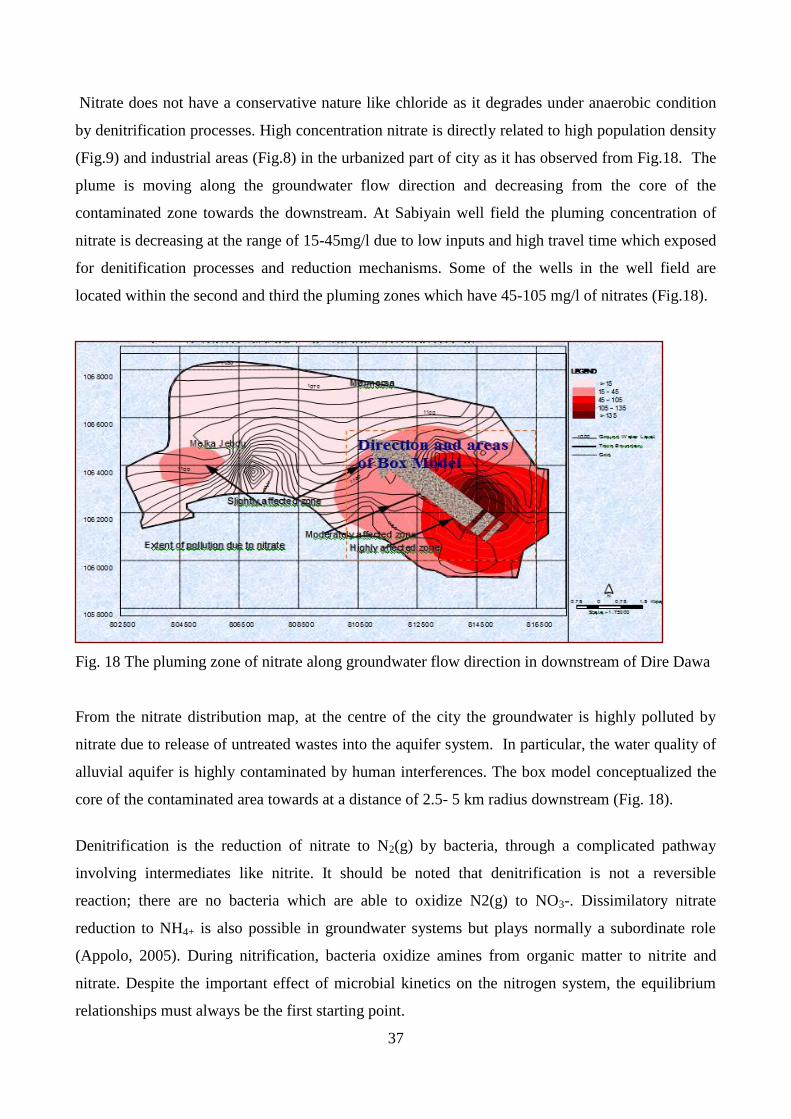
37
Nitrate does not have a conservative nature like chloride as it degrades under anaerobic condition
by denitrification processes. High concentration nitrate is directly related to high population density
(Fig.9) and industrial areas (Fig.8) in the urbanized part of city as it has observed from Fig.18. The
plume is moving along the groundwater flow direction and decreasing from the core of the
contaminated zone towards the downstream. At Sabiyain well field the pluming concentration of
nitrate is decreasing at the range of 15-45mg/l due to low inputs and high travel time which exposed
for denitification processes and reduction mechanisms. Some of the wells in the well field are
located within the second and third the pluming zones which have 45-105 mg/l of nitrates (Fig.18).
Fig. 18 The pluming zone of nitrate along groundwater flow direction in downstream of Dire Dawa
From the nitrate distribution map, at the centre of the city the groundwater is highly polluted by
nitrate due to release of untreated wastes into the aquifer system. In particular, the water quality of
alluvial aquifer is highly contaminated by human interferences. The box model conceptualized the
core of the contaminated area towards at a distance of 2.5- 5 km radius downstream (Fig. 18).
Denitrification is the reduction of nitrate to N2(g) by bacteria, through a complicated pathway
involving intermediates like nitrite. It should be noted that denitrification is not a reversible
reaction; there are no bacteria which are able to oxidize N2(g) to NO3-. Dissimilatory nitrate
reduction to NH4+ is also possible in groundwater systems but plays normally a subordinate role
(Appolo, 2005). During nitrification, bacteria oxidize amines from organic matter to nitrite and
nitrate. Despite the important effect of microbial kinetics on the nitrogen system, the equilibrium
relationships must always be the first starting point.
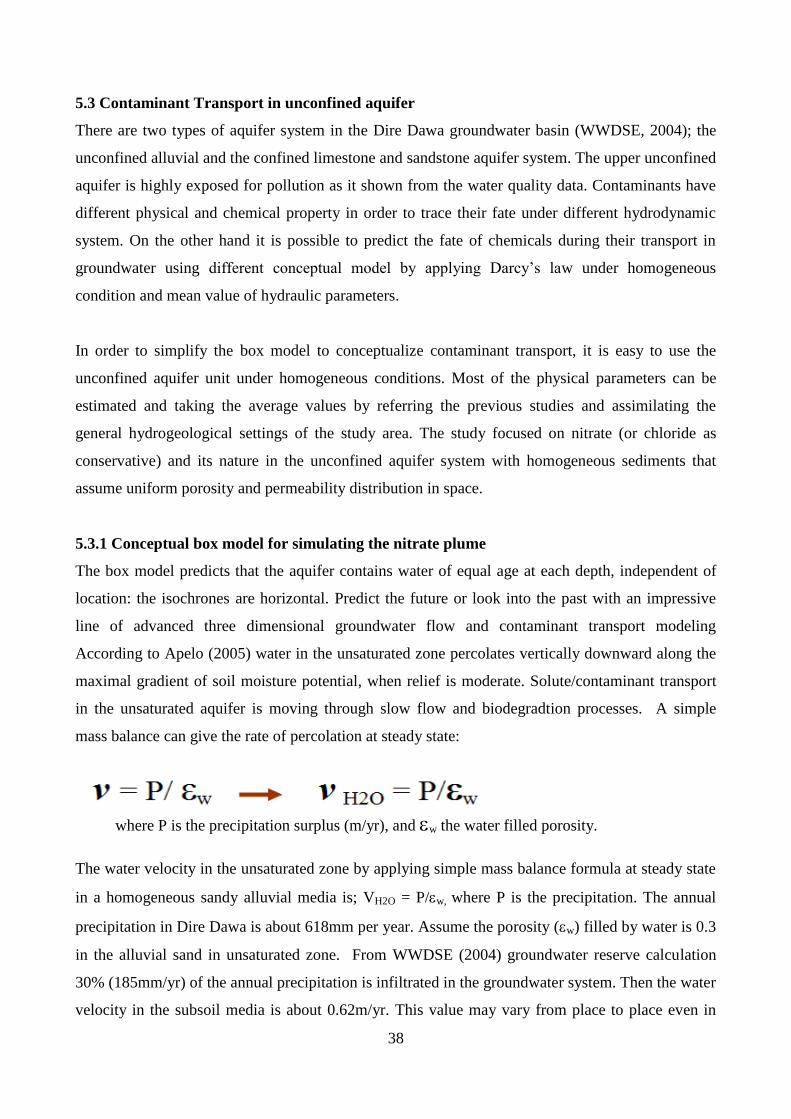
38
5.3 Contaminant Transport in unconfined aquifer
There are two types of aquifer system in the Dire Dawa groundwater basin (WWDSE, 2004); the
unconfined alluvial and the confined limestone and sandstone aquifer system. The upper unconfined
aquifer is highly exposed for pollution as it shown from the water quality data. Contaminants have
different physical and chemical property in order to trace their fate under different hydrodynamic
system. On the other hand it is possible to predict the fate of chemicals during their transport in
groundwater using different conceptual model by applying Darcy‟s law under homogeneous
condition and mean value of hydraulic parameters.
In order to simplify the box model to conceptualize contaminant transport, it is easy to use the
unconfined aquifer unit under homogeneous conditions. Most of the physical parameters can be
estimated and taking the average values by referring the previous studies and assimilating the
general hydrogeological settings of the study area. The study focused on nitrate (or chloride as
conservative) and its nature in the unconfined aquifer system with homogeneous sediments that
assume uniform porosity and permeability distribution in space.
5.3.1 Conceptual box model for simulating the nitrate plume
The box model predicts that the aquifer contains water of equal age at each depth, independent of
location: the isochrones are horizontal. Predict the future or look into the past with an impressive
line of advanced three dimensional groundwater flow and contaminant transport modeling
According to Apelo (2005) water in the unsaturated zone percolates vertically downward along the
maximal gradient of soil moisture potential, when relief is moderate. Solute/contaminant transport
in the unsaturated aquifer is moving through slow flow and biodegradtion processes. A simple
mass balance can give the rate of percolation at steady state:
where P is the precipitation surplus (m/yr), and w the water filled porosity.
The water velocity in the unsaturated zone by applying simple mass balance formula at steady state
in a homogeneous sandy alluvial media is; VH2O = P/w, where P is the precipitation. The annual
precipitation in Dire Dawa is about 618mm per year. Assume the porosity (w) filled by water is 0.3
in the alluvial sand in unsaturated zone. From WWDSE (2004) groundwater reserve calculation
30% (185mm/yr) of the annual precipitation is infiltrated in the groundwater system. Then the water
velocity in the subsoil media is about 0.62m/yr. This value may vary from place to place even in
39
unconfined aquifer system because the groundwater level is fluctuated from season to seasons and
highly exploited by the residents. It is important to understand that the groundwater flow velocity
increases with distance from the divider, since more precipitation must be discharged through the
same thickness and also the effects on production wells.
In the unconfined alluvial aquifer and homogeneous system, to simulate the box model assume the
porosity and permeability should be equal everywhere in the model area. To exercise this model we
can take the three water point sites at different locality along groundwater flow direction. This
conceptual model is more of assumption and integration by assimilating the physical and chemical
parameters based on the available information rather than to reflect the reality since the
hydrogeological setting is complex. From the spatial distribution of groundwater points, Tsehaye
Dug Well (TDW-1) is located at the city centre as a source of leachate from the waste that
percolating into the aquifer at the surface elevation of 1160m. The Sabyian well field and Shinile
Bore hole (SnBh-1) are located at a distance of 2500m and 5000m (Fig.19) apart downstream from
the city at 1160m and 1100m surface elevation respectively (Fig.17 & Fig.19).
This simple „box model‟ method is can be used estimate the travel distance and time in order to
predict pluming of contaminant transport in phreatic aquifer system. Contaminants have different
conservative and non-conservative behaviors during the transport mode. Contaminant transport in
the groundwater is moving through faster flow with dilution (dissolution) and
geochemical/biogeochemical reaction (Appelo, 2005). From the chemical data analysis chloride and
nitrate have similar trend on the contaminant flow map and graphical presentation. It is possible to
conceptualize in the „box model‟ as shown in Fig.19 for the transport of chloride or nitrate from the
inner part of the city towards Sabiyan well field at the distance of (2500m). We assume that the
values of hydraulic parameters (porosity. gradient and permeability) are constant everywhere and
there is a point source of contaminants within 25m radius as a source area.
Groundwater flow at a given location depends on the permeability of the subsoil and hydraulic
gradient. The specific discharge is given by Darcy's law as: vD =-k(dh/dx) where vD is specific
discharge or Darcy velocity (m/day), K is permeability or hydraulic conductivity in m/day which
has estimated about 1.4m/day (or 1.5 x 10⁻⁵
to 10-3
m/s) and (dh/dx) is the 1D - hydraulic gradient
(Minalha, 2007).
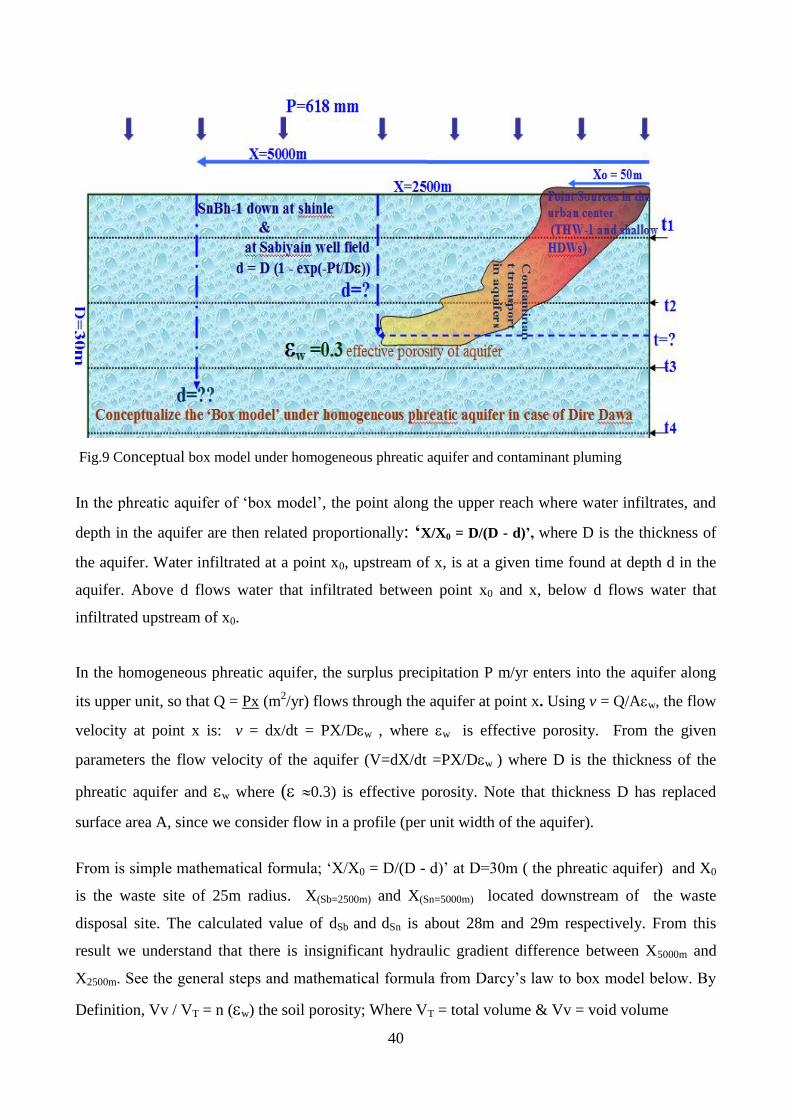
40
Fig.9 Conceptual box model under homogeneous phreatic aquifer and contaminant pluming
In the phreatic aquifer of „box model‟, the point along the upper reach where water infiltrates, and
depth in the aquifer are then related proportionally: ‘X/X0 = D/(D - d)’, where D is the thickness of
the aquifer. Water infiltrated at a point x0, upstream of x, is at a given time found at depth d in the
aquifer. Above d flows water that infiltrated between point x0 and x, below d flows water that
infiltrated upstream of x0.
In the homogeneous phreatic aquifer, the surplus precipitation P m/yr enters into the aquifer along
its upper unit, so that Q = Px (m2/yr) flows through the aquifer at point x. Using v = Q/Aw, the flow
velocity at point x is: v = dx/dt = PX/Dw , where w is effective porosity. From the given
parameters the flow velocity of the aquifer (V=dX/dt =PX/Dw ) where D is the thickness of the
phreatic aquifer and w where ( 0.3) is effective porosity. Note that thickness D has replaced
surface area A, since we consider flow in a profile (per unit width of the aquifer).
From is simple mathematical formula; „X/X0 = D/(D - d)‟ at D=30m ( the phreatic aquifer) and X0
is the waste site of 25m radius. X(Sb=2500m) and X(Sn=5000m) located downstream of the waste
disposal site. The calculated value of dSb and dSn is about 28m and 29m respectively. From this
result we understand that there is insignificant hydraulic gradient difference between X5000m and
X2500m. See the general steps and mathematical formula from Darcy‟s law to box model below. By
Definition, Vv / VT = n (w) the soil porosity; Where VT = total volume & Vv = void volume
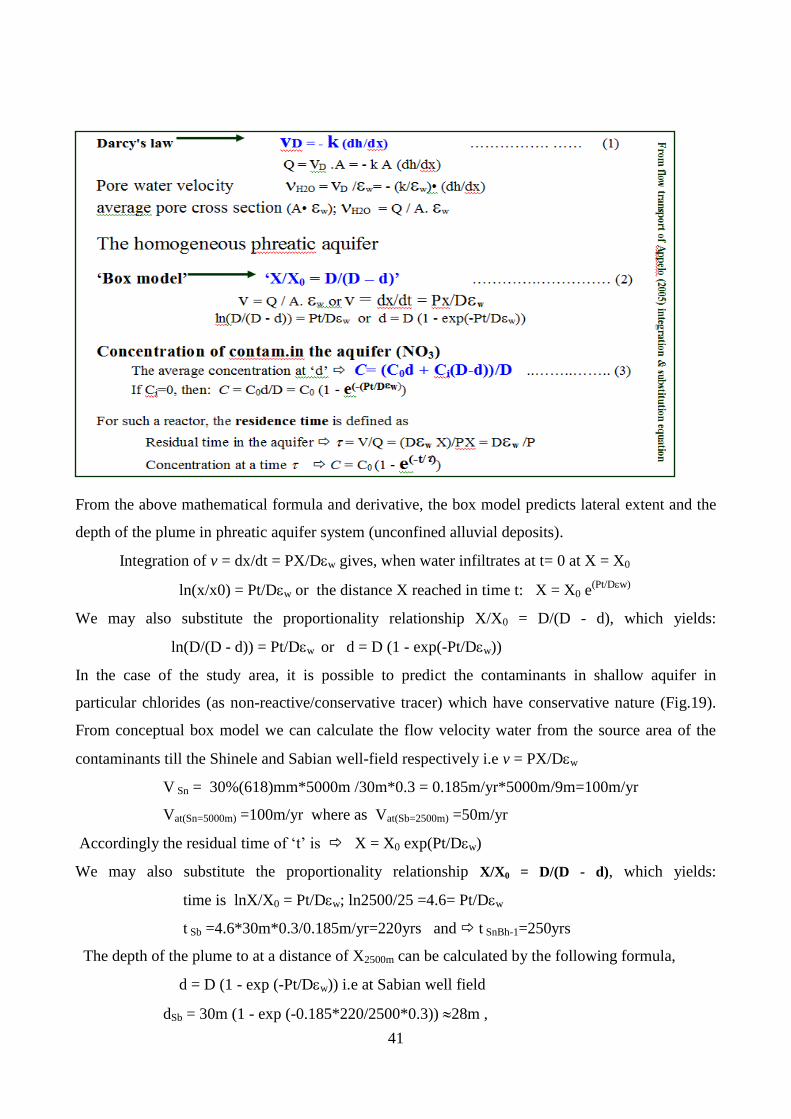
41
From the above mathematical formula and derivative, the box model predicts lateral extent and the
depth of the plume in phreatic aquifer system (unconfined alluvial deposits).
Integration of v = dx/dt = PX/Dw gives, when water infiltrates at t= 0 at X = X0
ln(x/x0) = Pt/Dw or the distance X reached in time t: X = X0 e(Pt/Dw)
We may also substitute the proportionality relationship X/X0 = D/(D - d), which yields:
ln(D/(D - d)) = Pt/Dw or d = D (1 - exp(-Pt/Dw))
In the case of the study area, it is possible to predict the contaminants in shallow aquifer in
particular chlorides (as non-reactive/conservative tracer) which have conservative nature (Fig.19).
From conceptual box model we can calculate the flow velocity water from the source area of the
contaminants till the Shinele and Sabian well-field respectively i.e v = PX/Dw
V Sn = 30%(618)mm*5000m /30m*0.3 = 0.185m/yr*5000m/9m=100m/yr
Vat(Sn=5000m) =100m/yr where as Vat(Sb=2500m) =50m/yr
Accordingly the residual time of „t‟ is X = X0 exp(Pt/Dw)
We may also substitute the proportionality relationship X/X0 = D/(D - d), which yields:
time is lnX/X0 = Pt/Dw; ln2500/25 =4.6= Pt/Dw
t Sb =4.6*30m*0.3/0.185m/yr=220yrs and t SnBh-1=250yrs
The depth of the plume to at a distance of X2500m can be calculated by the following formula,
d = D (1 - exp (-Pt/Dw)) i.e at Sabian well field
dSb = 30m (1 - exp (-0.185*220/2500*0.3)) 28m ,
42
The calculated result show, there is no significant different between the depth of the Sabyian well
field and Shinile bore holes along the downstream direction.
Aquifer as a chemical reactor: The concentration contaminants have changed in a certain depth
and travel distance enhanced by dissolved substance and geochemical reaction. Assume a situation
where the infiltrating water change from an initial concentration Ci at t<0 to C0 at t=0. When the
concentration front arrives at„d‟, the average concentration is:
C = (C0d + Ci (D-d))/D
If Ci =0, then: C = C0 d/D = C0(1 - exp(-Pt/Dw ))
This function is similar to the “ideal mixed reactor” used in chemical engineering (Appelo, 2005).
For such a reactor, the residence time is defined as,
= V/Q = (Dw X)/PX = Dw/P
C = C0(1 - exp(-t/))
It is possible to calculate the residence time and the depth of the contaminant along the flow
direction in the subsurface system that the aquifer contains water of equal age at each depth,
independent of location. The residence time and concentration of nitrate (Ci=155mg/l) at the aquifer
depth of D=30m is defined as:
= V/Q = (DwX)/PX = Dw /P =30m*0.3/0.185 (m/yr) =48yrs.
C= C0d/D = C0 (1 - exp(-Pt/Dw)) = 155mg/l*.62 =96mg/l.
The estimated time to reduce nitrate at 45mg/l level is expressed;
C= Ci e-t/
C/Ci = e-t/
ln C/Ci =-t/ t=-ln45/155=-48 *-1.2=60yrs;
From the above calculation, it demands more than 60 years in order to minimize (45mg/l) from the
existing nitrate (155mg/l) concentration at the city centre assume the source inputs discontinued at
the same time. This value is just to conceptualize the system; it does not present the real cases of
Dire Dawa since some of the parameters are more of assumptions.
The physical environment is very warm and the biodegradation rate may be faster and the estimated
time becomes shorter than the simulated value. For example the concentration of NO3 (mg/l)
become depleted at the depth of „dSn‟ (44 mg/l) towards SnBh-1 compared with TDW-1 (155mg/l)
from the centre since contaminants are moving through dilution (dissolution) and geochemical
reaction in the groundwater with high reduction and denitrification processes.
The unconfined alluvial aquifer unit of Dire Dawa is composed of poorly sorted fluvial gravel,
43
sandy and siltstones, mainly formed through fluvial processes. So the residence time of the
contaminants may be estimated less than the calculated value. The residence time becomes 24 years
if we apply different artificial mechanisms in the system since there are a lot of factors which
influence the route and excluded in the model. In general the box model is more sensitive for
hydraulic conductivity than the hydraulic gradients and infilitration rate of precipitation.There are
many factors in the study area that posatively or negatively influence the model result more
described in uncertainty part.
5.3.2 Contaminant transport
There are complex factors that control the movement of contaminants in groundwater and soil in
order to predict the movement and extent of the plumes. Processes such as hydrodynamic dispersion
affect all contaminants equally, while sorption, chemical processes, and degradation may affect
various contaminants at different rates (U.S. EPA, 1985). The retardation factor, R (calculated) will
be 1.0, if the solute is non-reactive and moves with the groundwater. If R is greater than 1.0, the
average velocity of the solute is less than the velocity of the ground water flow, and the dispersion
of the solute is reduced. Contaminants with lower retardation factors are transported greater
distances over a given time than contaminants with larger retardation factors (U.S. EPA, 1989a).
There are lot of controlling factors for natural attenuation of contaminants in the soil and
groundwater as it is shown in Fig. 20. There are more than 65, 000 tones municipal wastes of Dire
Dawa simply released into the unconfined aquifer per year. The contaminants in the aquifer have
different evolution stages and captured by different electron acceptors. The most important
processes that affecting the attenuation of contaminants shown (Fig.20); volatilization/evaporation,
advection, sorption (absorption & adsorption) and biodegradation (aerobic & anaerobic). Most of
these processes are dependent on the aquifer and/or contaminant properties.
From the water sample result analysis (part-4), Sodium (Na) becomes retarded by ionic exchange
and sorption activities. Mostly the source of the Na+ and NO3 is derived from municipal sewerage
(pit latrines) in the urban centre. Na+
becomes retarded in the downstream flow velocity as a result
of sorption by the sediment or aquifer in the geochemical processes. Relatively Ca2+
and Mg2+
also
retarded in the aquifer. The water sample results show that there is clear redox and sorption process
going between water sample TDW-1 (from the inner) and SnBh-1 in the downstream. The
concentration of the solute/contaminant is decreasing along the flow distance comparing with from
the point source. Sorption tends to cause contaminants to move more slowly than the groundwater,
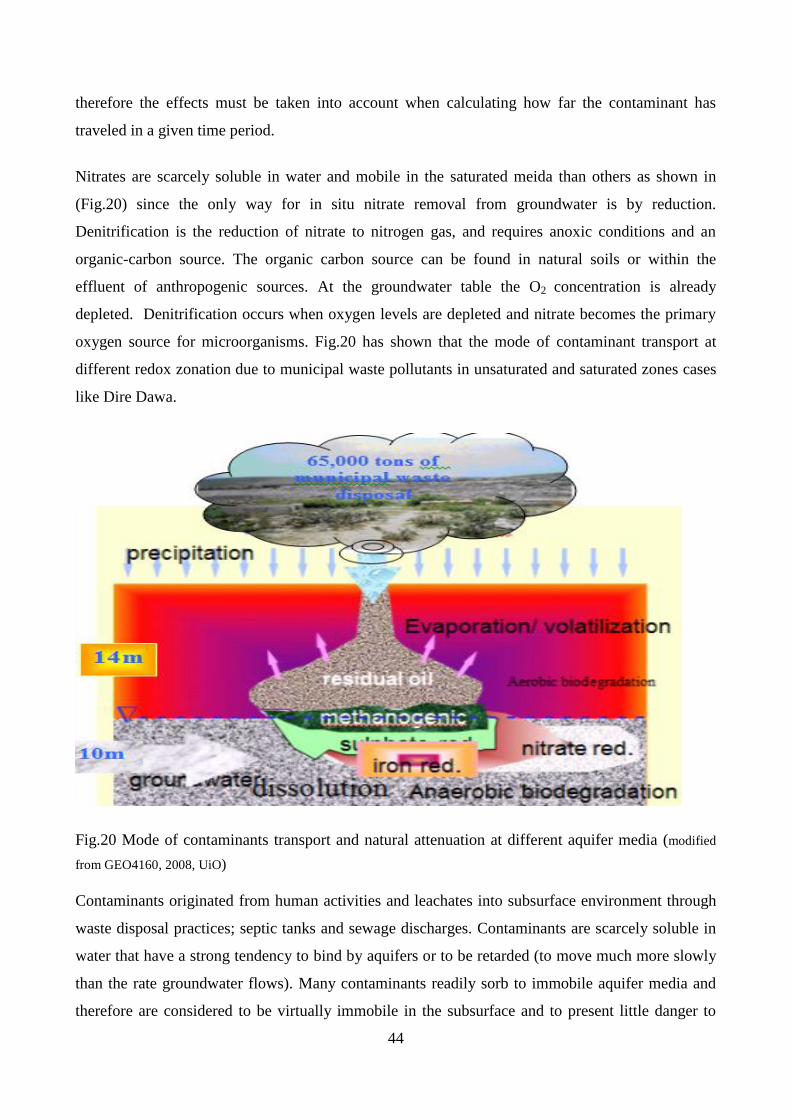
44
therefore the effects must be taken into account when calculating how far the contaminant has
traveled in a given time period.
Nitrates are scarcely soluble in water and mobile in the saturated meida than others as shown in
(Fig.20) since the only way for in situ nitrate removal from groundwater is by reduction.
Denitrification is the reduction of nitrate to nitrogen gas, and requires anoxic conditions and an
organic-carbon source. The organic carbon source can be found in natural soils or within the
effluent of anthropogenic sources. At the groundwater table the O2 concentration is already
depleted. Denitrification occurs when oxygen levels are depleted and nitrate becomes the primary
oxygen source for microorganisms. Fig.20 has shown that the mode of contaminant transport at
different redox zonation due to municipal waste pollutants in unsaturated and saturated zones cases
like Dire Dawa.
Fig.20 Mode of contaminants transport and natural attenuation at different aquifer media (modified
from GEO4160, 2008, UiO)
Contaminants originated from human activities and leachates into subsurface environment through
waste disposal practices; septic tanks and sewage discharges. Contaminants are scarcely soluble in
water that have a strong tendency to bind by aquifers or to be retarded (to move much more slowly
than the rate groundwater flows). Many contaminants readily sorb to immobile aquifer media and
therefore are considered to be virtually immobile in the subsurface and to present little danger to
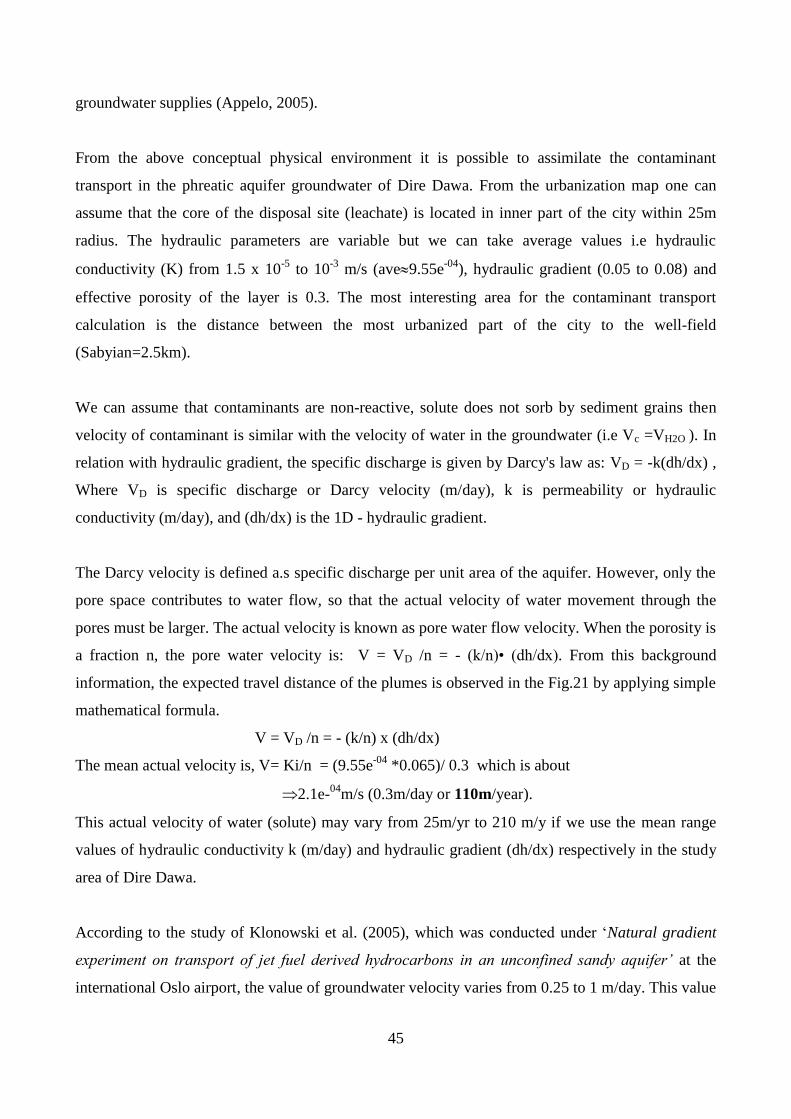
45
groundwater supplies (Appelo, 2005).
From the above conceptual physical environment it is possible to assimilate the contaminant
transport in the phreatic aquifer groundwater of Dire Dawa. From the urbanization map one can
assume that the core of the disposal site (leachate) is located in inner part of the city within 25m
radius. The hydraulic parameters are variable but we can take average values i.e hydraulic
conductivity (K) from 1.5 x 10⁻⁵
to 10-3
m/s (ave9.55e-04
), hydraulic gradient (0.05 to 0.08) and
effective porosity of the layer is 0.3. The most interesting area for the contaminant transport
calculation is the distance between the most urbanized part of the city to the well-field
(Sabyian=2.5km).
We can assume that contaminants are non-reactive, solute does not sorb by sediment grains then
velocity of contaminant is similar with the velocity of water in the groundwater (i.e Vc =VH2O ). In
relation with hydraulic gradient, the specific discharge is given by Darcy's law as: VD = -k(dh/dx) ,
Where VD is specific discharge or Darcy velocity (m/day), k is permeability or hydraulic
conductivity (m/day), and (dh/dx) is the 1D - hydraulic gradient.
The Darcy velocity is defined a.s specific discharge per unit area of the aquifer. However, only the
pore space contributes to water flow, so that the actual velocity of water movement through the
pores must be larger. The actual velocity is known as pore water flow velocity. When the porosity is
a fraction n, the pore water velocity is: V = VD /n = - (k/n)• (dh/dx). From this background
information, the expected travel distance of the plumes is observed in the Fig.21 by applying simple
mathematical formula.
V = VD /n = - (k/n) x (dh/dx)
The mean actual velocity is, V= Ki/n = (9.55e-04
*0.065)/ 0.3 which is about
2.1e-04
m/s (0.3m/day or 110m/year).
This actual velocity of water (solute) may vary from 25m/yr to 210 m/y if we use the mean range
values of hydraulic conductivity k (m/day) and hydraulic gradient (dh/dx) respectively in the study
area of Dire Dawa.
According to the study of Klonowski et al. (2005), which was conducted under „Natural gradient
experiment on transport of jet fuel derived hydrocarbons in an unconfined sandy aquifer’ at the
international Oslo airport, the value of groundwater velocity varies from 0.25 to 1 m/day. This value
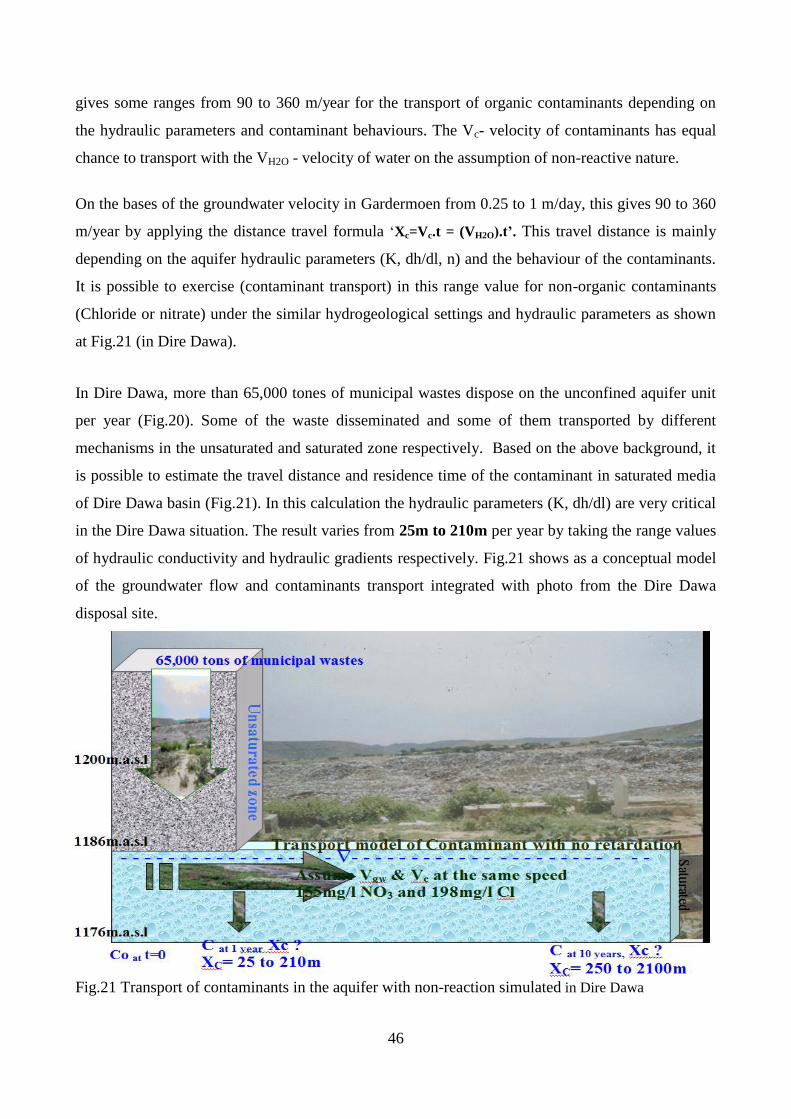
46
gives some ranges from 90 to 360 m/year for the transport of organic contaminants depending on
the hydraulic parameters and contaminant behaviours. The Vc- velocity of contaminants has equal
chance to transport with the VH2O - velocity of water on the assumption of non-reactive nature.
On the bases of the groundwater velocity in Gardermoen from 0.25 to 1 m/day, this gives 90 to 360
m/year by applying the distance travel formula „Xc=Vc.t = (VH2O).t’. This travel distance is mainly
depending on the aquifer hydraulic parameters (K, dh/dl, n) and the behaviour of the contaminants.
It is possible to exercise (contaminant transport) in this range value for non-organic contaminants
(Chloride or nitrate) under the similar hydrogeological settings and hydraulic parameters as shown
at Fig.21 (in Dire Dawa).
In Dire Dawa, more than 65,000 tones of municipal wastes dispose on the unconfined aquifer unit
per year (Fig.20). Some of the waste disseminated and some of them transported by different
mechanisms in the unsaturated and saturated zone respectively. Based on the above background, it
is possible to estimate the travel distance and residence time of the contaminant in saturated media
of Dire Dawa basin (Fig.21). In this calculation the hydraulic parameters (K, dh/dl) are very critical
in the Dire Dawa situation. The result varies from 25m to 210m per year by taking the range values
of hydraulic conductivity and hydraulic gradients respectively. Fig.21 shows as a conceptual model
of the groundwater flow and contaminants transport integrated with photo from the Dire Dawa
disposal site.
Fig.21 Transport of contaminants in the aquifer with non-reaction simulated in Dire Dawa
47
The hydrogeological settings and hydraulic parameters (K, dh/dl, n) of the Gardermoen area has
similar hydrogeology complex with Dire Dawa basin because the alluvial aquifer in Dire Dawa
composed of cobbly gravel and coarse sands as well as interbeded layers of the gravely, coarse
sands and fine, silty sands formed through fluvial deposits. If we compare the calculated result of
the groundwater velocity (110m/year) and other hydraulic parameters in Dire Dawa, the values are
similar within the ranges Klonowski (2005) experiment study on transport at the Gardermoen area.
Based on the above assumption the travel distance of the plume having non-reactive, 155 mg/l
nitrate and 198 mg/l chloride concentration is presented in Fig.21. In Gardermoen, it takes 10 years
to travel 900m to 3600m. This distance lies within the Dire Dawa to Sabyian range that is about
(2500m). So it takes 12years to 100years to travel the contaminants to reach the Sabyian well field
of 2.5 km in Dire Dawa. At the same time it requires up to 100years to clean up contaminated
phreatic aquifer assume the source of leachate should be disconnected. Comparing the box model,
the plume travel time is about 24 to 60 years at a distance of 2500m with some sort of modification
and assumptions. Nitrate has different chemical processes at different media but pluming has still
expanded to 2.5km distance from the sources area. There are many non-point sources in-between
the main source (leachate) and the well field that helps to amplify the pluming zone.
5.4 Result and discussion
Existing Situation and Pollutant Sources: In the study area, the main geological formations and
outcrops are pre-Cambrian rocks, the Jurassic Adigrat sandstone and Hamanalei limestone, the
Cretaceous upper sandstones, Tertiary basalts and Quaternary alluvial deposits. The groundwater
occurrence and distribution in the basin is mainly a function of the geological formations,
geomorphology and tectonic activities. The alluvial aquifers are mainly developed in the
downstream of Dire Dawa basin. The unconfined aquifer unit in the alluvial deposits is the main
interest area to exercise the study objective(s). The occurrence of groundwater in this formation is
limited along the alluvial fans and river channel deposits. The thickness of the alluvial sediment on
average varies mainly from 15 to 50 meters. The ground water depth varies in the alluvial sediments
from 5 to 45 meters. The transmissivity of the alluvial formation is variable from 8 to 700 m2/day,
(pumping test result). On average the hydraulic conductivity is from 9.55 x 10⁻⁴
m/s at the aquifer
thickness of 20m within the hydraulic gradient (0.05 to 0.08) and porosity the layer is 0.3. These
values mostly applied for box model and contaminant transport prediction.

48
In Dire Dawa the potential evapotaranspiration (PET) is much higher than the actual
evapotranspriration (AET). The annual precipitation in Dire Dawa is about 618mm per year. From
groundwater reserve calculation 30% (185mm/yr) of the annual precipitation is infiltrated in the
groundwater system. A precipitation surplus of P which infiltrates into the aquifer is 0.185 m/yr.
There is excessive pumping and the groundwater has been depleted because the recharge estimation
is about 300-370 l/s but the actual abstraction is 400m/l. The recharge estimation is not reflected the
actual production either there should be some sort of trans-boundary groundwater sources
contributing for the Dire Dawa groundwater basin or some error in order to balance recharge-
discharge conditions.
The land use system Dire Dawa is mixed. All the urban activities are going on together. The city
centre is highly populated around 350-500 per hectare (above the normal standard) with poor urban
facilities. The rapid urbanization and lack of master plan implementation strategy are the main
causes of pollution. The city has weak waste management mechanisms. The main sources of
pollution are multiple point sources of pit latrines, septic tanks and linear source pollution of
industrial and domestic waste disposal. Annually, about 10,000 m3 of solid wastes and 65,000 tones
of human excreta are simply released into the surrounding environment without any pre-treatment
mechanisms. There is no 3R (Recycle – Reduce – Reuse) waste management principles. Domestic
and industrial wastes are the main sources of pollution.These all urban activities directly or
indirectly contribute for the surface and subsurface environmental pollution.
Results of chemical analysis: The physical environment and the hydrogeological settings
contribute for change of water quality in the study area. Mostly springs originated at the
escarpment zone from the contacts and fractures of the limestone-sandstone units. The water
chemistry of escarpment zone is dominantly carbonate and bicarbonates type as a result of
dissolution of carbonate rocks and silicate weathering processes. The major sources of anions like
sulphate, and chloride are sedimentary origin of gypsum and halite.
There are many factors for change of water types; the geochemical evolution and water-rock
interaction are playing important role. The residence time and sources of recharge are other factors
which control water type with the activity of pH and the dissolution processes. The water quality of
alluvial aquifer is highly modified as compared to water from upstream springs. There is no
intensive agriculture in the region. The sources of nitrates, chlorides, sulphates and sodium
modification of the groundwater in the study area is mainly influenced by human interference
49
especially hand dug wells that are near to residential areas. The water types from upstream are
mainly Ca-HCO3 and Ca-Mg-HCO3 but the water at downstream (Dire Dawa area) is changed by
domestic activities to Ca-HCO3-Cl, Ca-Na-HCO3-Cl/NO3, Ca-Mg-HCO3-Cl and Na-Ca-HCO3-SO4.
The most possible source of nitrate in the groundwater is pollution from the inappropriate
wastewater collection and disposal system of city which is directly connected with the land use
system and urbanization trends of Dire Dawa. The degradation of groundwater quality is also
escalating by point source contamination such as septic tanks, pit latrines and industrial effluents.
Results of box model: Modeling is very important in order to understand and conceptualize the
field conditions. But the hydrogeological setting of Dire Dawa and contaminant behaviour in
groundwater system is very complex to simulate the hydraulic parameters into the model.
Contaminants transport is also controlled by various mechanisms that influence the movement and
fate of contaminants. Box model is important to assess the flow direction, solute travel time and
also characterize the contaminated area (pluming zone) at a certain distance-depth by using simple
manual calculation.
In the study area the groundwater flow is mainly towards the north direction that is parallel to the
surface flow. The group of production wells and excessively pumping is highly affecting the local
groundwater flow. This excessive pumping rate has depleted the aquifer and makes a chance the
residual time of groundwater flow to be decreased since the hydraulic head difference is increasing.
On the other hand this makes accelerating the groundwater flow velocity that the contaminants
easily join in the production well system before matured evolution. The high concentration plume is
flowing along the groundwater flow direction and decreasing in concentrations from the urbanized
contaminated zone towards the downstream groundwater basin.
Applying simple mass balance formula at steady state in a homogeneous phreatic aquifer is critical
to conceptualize the box model and contaminant transport in the Dire Dawa downstream. Most of
the physical parameters used in the model were estimations and the average values by referring the
previous studies and assimilating the general hydrogeological settings. Assuming the unconfined
alluvial is homogeneous sediments that has the porosity and permeability are equal everywhere.
Three water point sites (Tsehaye hand dug well (TDW-1), Sabyian well field and Shinile bore hole
(SnBh-1)) considered in the box model at different localities along the groundwater flow direction.
From the chemical data analysis chlorides and nitrates (as non-reactive tracer) have similar trend on
the contaminant flow map and graphical presentation to exercise the box model and predict the
50
pluming zone. The calculated flow velocity is 50m/yr to move towards Sabiyan from the inner part
of the city at the distance of (2500m) while the residual time based on „box model,canculation is
about 220yrs. These values are the results of box model by assuming that the values of hydraulic
parameters (porosity. gradient and permeability) are constant everywhere and a point source of
contaminants within 25m radius in the city. From this simple mathematical formula; „X/X0 = D/(D
- d)‟ at D=30m the depth of contaminant at the localities of X(Sn=5000m) and X(Sb=2500m) the values
of „dSn and dSb are 29m and 28m respectively. From this result we can estimate that the pluming
has insignificant hydraulic gradient difference between X(Sn=5000m) and X(Sb=2500m).
In order to reduce the concentration of nitrate from 155mg/l to bring down at the National drinking
water limit of Ethiopia (=45mg/l); it has required more than 60 years by discontinued the source
inputs at the same time. But by changing some values, for example at a depth of D = 20m, w=0.3
and if P=0.3m/yr by applying artificial recharge in the aquifer system the residence time in the
aquifer will become 24 years. This result shows that precipitation surplus highly influence the
residence time of the contaminants and sensitive to the model.
Contaminant transport: The most interesting area for the contaminant transport calculation is the
distance between from the most urbanized part of the city to the well field (Sabyian=2.5km). From
the urbanization map, one has assumed that the core of the disposal site (leachate area) is located in
inner part of the city within 25m radius. The groundwater velocity (VSb) from the box model
calculation is 50m/yr (5.5 x10⁻⁴
m/s). The result‟s of box model has similar nature with the
contaminant transport because the hydraulic parameters are similar and applied basic Darcy‟s law.
The velocity of contaminant is similar with the velocity groundwater assuming that no-reactive
nature of the contaminants.
The expected travel distance of the plume is 2500m (approximately from city centre to the Sabyian
well field) with constant concentration. The mean actual velocity by applying the Darcy‟s formula
(V=Ki/n = (0.000955 *0.065)/ 0.3 is about 0.298m/day (110m/year). This result is similar within
the study of Klonowski (2005) range values from 90 to 360 m/year for natural gradient experiment
transport of organic contaminants. The hydrogeological settings and hydraulic parameters (K,
dh/dl, n) of Gardermoen area are similar with alluvial sediment composition of Dire Dawa area.
The travel distance of the plume having non-reactive concentration will take 250m to 2100m within
12 to 100 years time. These distance values are within the waste site (leachate) to Sabyian well-field
51
distance range. Depending on hydraulic parameters, on average it takes more than 15 years the
contaminants to travel and break into the Sabyian well field. At the same time it requires up to
100years to clean up contaminated phreatic aquifer assume the source of leachate should be
disconnected. Comparing the box model, the plume travel time is about 24 to 60 years at a distance
of 2500m with some sort of modification and assumptions. There are many non-point sources in-
between the main source (leachate) and the well field that helps to amplify the pluming zone.
Actually the plume of nitrate is more mobile and soluble in saturated media. It may be removed and
degraded from groundwater by reduction and availability of organic matters through anaerobic
biodegradation processes. Sodium becomes depleted in the groundwater system of Dire Dawa
mainly solubility nature and sorption activities in the aquifer. Mostly the source of the Na+ and
NO3- is derived from municipal sewerage (pit latrines) sources in the urban centre. In general the
concentration of the solute/contaminant is decreasing in along the flow path and captured by
different electron acceptors from its point sources. Major cations-anions depleted in the downstream
basin by geochemical processes as we have observed from the groundwater evolution.
Model uncertainties: In the study area there are many input factors that make a variation on the
output of a mathematical model result directly or indirectly. Most hydraulic parameters are more
sensitivity in box model and contaminant transport calculation that can amplify model results. The
most important factors that posatively or negatively contribute for groundwater flow and
contaminats transport model are:
hydraulic conductivity and hydraulic gradient
inflitration rate of surplus precipitation
built up area the city (50% built up area from 8,000ha)
thickness of aquifer and homogeneity
arfificial recharge from human sources ( amount of leachates)
floods and intermittent streams sink along sandy river channel
Non-point pollutant sources out of the main pont sources(25m radius)
All the above parameters and indicators are important factors that determine the model result but
most of the parameters are estimated and simulated from the measured data in order to
conceptualize the hydrogeochemical dynamic system. These issues are not enough to address the
uncertainty in model; it depends on the scale of the study. This type of approach may be useful in
some places to realize the actual environment based on the available data still it has some
limitations due to the complexity of nature.
52
6. Conclusions and Recommendations
6.1 Conclusions
Groundwater resources are under increasing threat from growing demands, wasteful use,
urbanization and contamination. To face the challenge, scientific studies and proper utilization plan
are needed. A key to the management of groundwater is the ability to model the movement of fluids
and contaminants in the subsurface. The purpose of this study is to formulate groundwater flow and
contaminant transport model that can provide preliminary information for proper groundwater
resource utilization and management in the Dire Dawa area.
The study has also tried to conceptualize the groundwater evolution in the Dire Dawa area by
considering the hydrogeological settings and influence of anthropogenic activities. The geology and
aquifer units are quite complex, so it is hard to develop modeling concepts and present the real
situation of the area. The water chemistry results show a mixed type since the geological formation
is complex with contributions both from natural processes and anthropogenic sources. The
groundwater quality is modified by anthropogenic factors and natural groundwater evolution along
the groundwater flow path. In general the water quality is hard and mostly carbonates water types
at upstream and more modified in the downstream basin especially in the shallow wells with high
chlorides and nitrates due to contamination of the aquifer by human activities.
The water quality data provide enough background to identify pollutant sources and to
conceptualize the contaminated aquifer zone by applying simple box model and contaminant
transport. Contaminants have different attenuation and degradation rate in the subsurface conditions
in order to identify the pluming zone under Dire Dawa hydrogeological settings. The alluvial plain
aquifer in Dire Dawa area contains unconsolidated sediment deposited by fluvial processes that
facilitated the groundwater pollution.
Major cations-anions have been depeleted in the downstream basin by geochemical processes.
There are human factors which have enhanced or modified the hydrochemical processes in the
groundwater system as we have observed in the groundwater evolution. From the conceptual
model, it is possible to realize the geochemical evolution from the rain to the spring water via urban
environment towards the downstream basin. All these processes show that there is the availability
of electron acceptors and electron donors between the upstream and downstream in the aquifer
system to facilitate anion-exchange and contaminant degradation.
53
6.2 Recommendations
In Dire Dawa, urbanization is a major challenge for the city development. There is continuing rural-
urban migration due to „pushing-pulling‟ factors. There is no enough urban facility, lack of
integrated waste management and regulatory body. It is challenging for next generation to clean-up
the contaminated aquifer. So integrated waste management strategy and proper groundwater
management should be implmented for sustainable development of the city.
It is possible to improve the model by defining certain parameters and clarifying uncertainties that
contribute to model. The contaminant transport model is based on assumption and simplifications.
This part could be improved even in a simplified way with additional detailed hydrogeological
parameters
The model is very sensitive for hydraulic conductively and recharge (surplus precipitation). But on
the aquifer reserve calculation, the estimation of recharge and discharge is in imbalance, it needs
more analysis. The contribution of artificial recharge should also be evaluated, as groundwater
recharge from wastewater disposal in the upper aquifer will be active.
The study area is very interesting to apply and develop different modeling techniques for the future.
The degradation rate of contaminants in the aquifer should be investigated by applying appropriate
modeling and software techniques, and not at least kinetic data.
54
7. References
Al-Zabet, T., (2002) Evaluation of aquifer vulnerability to contamination potential using the
DRASTIC method: Environmental Geology,43, 203–208 , (ISSN 0943-0105), vol. 43, no1-
2, pp. 203-208, United Arab Emirates University, United Arab Emirates.
Associated Engineering Survey Ltd. Canada (1982) Dire Dawa feasibility study for water
supply, Ethiopia.
Butcher, S. S.; Charlson, R. J.; Orians, G. H.; Wolfe, G., V.(1992) Global Biogeochemical Cycles;
Academic Press: London.
Chiang, W.-H. and W. Kinzelbach, 1998a, PMPATH 98. An advective transport model for
Processing Modflow and Modflow.
Chiang, W.-H. and W. Kinzelbach, 1998b Processing Mudflow, A Simulation System for
Modeling Groundwater Flow and Pollution.
Comly, H. H., (1987), Cyanosis in Infants Caused by Nitrates in Well Water,
Journal of the American Medical Association, v. 257, p. 2788-2792.
CSA (1998) Population and housing census, Central Statistical Agency, Addis Ababa Ethiopia
Urban waste facilities of Dire Dawa Administrative council by Housing unit
CSA ,(2005) Population and housing census, Central Statistical Agency, Addis Ababa Ethiopia.
EIGS (1986) Regional Geological map of Dire Dawa and Harer region, Ethiopia Institute of
Geological Survey, Ethiopia.
DDAC (2000), Regional Conservation Strategy document of Dire Dawa Administrative Council,
Dire Dawa, Ethiopia.
Eyilachew A., (2004) Hydrochemical variation and aquifer characterization in Dire Dawa and its
surroundings. Unpublished MSc Thesis Addis Ababa University, Ethiopia.
Finley, B. (1990), Well-water Nitrates Endanger N. Colorado, Denver (Colorado)
Post, 16 November
Greitzer Y, (1959), Stratigraphy, Hydrogeology and Jurassic Ammonites of the Harar and Dire
Dawa area, Ethiopia. PhD thesis submitted for the Degree-Doctor of Philosophy, Hebrew
University, Israel
Gustafson, D. I., 1993, Pesticides in Drinking Water, Van Hostrand Reinhold, New
York, p. 241.
Habteab Z. and Jiri S. (1986), Hydrogeology and Hydrochemistry of the Dire Dawa Area NC 37-
12 Sheet, Ethiopia Institute of Geological Survey, Ethiopia
Hallberg, G.R. and Keeney, D.R., (1993), Nitrate, Alley, William A., ed., Regional
55
Ground-water Quality, Van Nostrand Reinhold, New York, p.297-322.
Henze, Mogens, Harremoës P., Jes la Cour Jansen, and Arvin E. (1997) Wastewater Treatment,
Biological and Chemical Processes. Berlin, Germany: Springer.
Ketema T. (1982) Hydrogeology of the Dire Dawa Area, Technical Report (880-551-17) EIGS,
Ethiopia.
Lerner, D.N. (2003) Estimating urban loads of nitrogen to groundwater. Journal of the Chartered
Institution of Water and Environmental Management, 17(4): 239-244.
Maciej R. Konowski, Gijs D. Breedveld and Per Aagaard (2005) Natural gradient experiment on
transport of jet fuel derived hydrocarbons in an unconfined sandy aquifer.
Mesfin A. (1981) Hydrogeology of Northeastern part of Haraghe Geological Survey of Ethiopia,
Addis Ababa, Ethiopia.
MoWR (1999a) 8 towns water supply project production well drilling works by Ministry of Water
Resource, Ethiopia
MoWR (1999b), Technical assessment for immediate rehabilitation of Dire Dawa water supply
system by Ministry of Water Resources, Addis Ababa, Ethiopia.
Minalah B. (2007) Numerical Groundwater Flow Modelling Of the Dire Dawa Area Addis Ababa
, University School of graduate studies.
Mirus H. (2003) Rift margin development, in the case of southern Afar, Dire Dawa area,Addis
Ababa , University School of graduate studies.
NUPI (1994) Urban master plan of Dire Dawa town by National Urban planning Institute, Addis
Ababa, Ethiopia.
Postma, A. C. A. J. a. (2005). Geochemistry, groundwater and pollution, A.A. Balkema publishers,
Amsterdam, the Nethrlands.
Schiedek T., Beier M., Ebhardt G. (2008) Monitoring urban impact on groundwater quality -
statistical analyses in Darmstadt, Germany, Geophysical Research Abstracts,Vol. 10,
EGU2008-A-12070, 2008 SRef-ID: 1607-7962/gra/EGU2008-A-12070 ,EGU General
Assembly 2008.
Seelig B. & Nowatzki J. (2001) How to Assess for Nitrogen Problems in water Resources,
NDSU extension service, North Dakota State University
Seife M. B. (1985) Geological Map of the Dire Dawa Sheet, NC 37-12, Ethiopia Institute of
Geological survey, Addis Ababa Ethiopia.
Taye A. (1988) Contamination of the Hydrogeological System in Dire Dawa, Ethiopia
Tesfamichael K. (1974) Hydrogeology of the Dire Dawa, A statement of present knowledge (880-
551-07) Ethiopian Geological Survey, Ethiopia
56
Todd, D.K. ,(1980) Ground-water hydrology (Second Edition): John Wiley and Sons, New York.
U.S. E.P.A (1985) United State Environmental Protection Agency
U.S. E.P.A (1989a) United State Environmental Protection Agency
Wakida, F.T. and Lerner, D.N. (2005) Non agricultural sources of groundwater nitrate: a review and
a case study. Water research 39: 3-16.
Wakida F.T (2008) Sources of nitrate in urban groundwater, Universidad Autonoma de Baja
California Facultad de Ciencias Quimicas e ingenieria Calzada Universidad ,Tijuana Baja
California Mexico.
WWAP (2006) Water: a shared responsibility. The 2nd
United Nations World Water Development
Report 2. UNESCO, Paris and Berghahn Books, New York.
WWDSE (2001) Groundwater resources evaluation of Dire Jara well field for Harar town water
supply, Water Works Desigh and Supervion Enterprise Ethiopia.
WWDSE (2003) Dire Dawa Administrative Council preliminary development master plan study,
Water Works Desigh and Supervion Enterprise, Ethiopia
WWDSE(2004) Dire Dawa Administrative Council integrated resource development master plan
study, Water Works Desigh and Supervion Enterprise, Ethiopia.
W.E. Krumbein (1983) Microbial mats as bioreactors: populations, processes and products,
Department of Marine Sciences, University of Connecticut, Groton, CT 06340, United States.
Yewondwosen M. (2003) Hydrogeology of Bahir Dar Area, Addis Ababa ( M.Sc. Thesis), Addis
Ababa University, Ethiopia
Zehnder, A. J. B. and W. Stumm (1988), Geochemistry and Biogeochemistry of anaerobic habitats.
In A.J.B. Zehnder (ed.) Biology of Anaerobic Micro-organisms. John Wiley & Sons, New
York 1988, pp. 1-38.
http://wwwbrr.cr.usgs.gov/projects/GWC_coupled/ phreeqc /html/final-1.html(10/09/08) ,
Parkhurst, D. L. and C. A. J. Appelo (1999), "User's Guide to PHREEQC (Version 2)--A
Computer Program for Speciation, Batch-Reaction, One-Dimensional Transport, and Inverse
Geochemical Calculations."
The British Colombia Groundwater Association Drinking Water Protection Act and Regulations
(2007),http://www.env.gov.bc.ca/wsd/plan_protect_sustain/groundwater/library/ground_fact
_sheets/pdfs/no3(020715)_fin2.pdf (07/02/2009).
Groundwater Modelling and Contaminant Transport, Land Protection Division Oklahoma
Department of Environmental Quality authorized by Steven A. Thompson, Executive
Director.October30,2001http://www.deq.state.ok.us/lpdnew/FactSheets/Computer%20Modeling%
20Policy.pdf(01.03.2009)
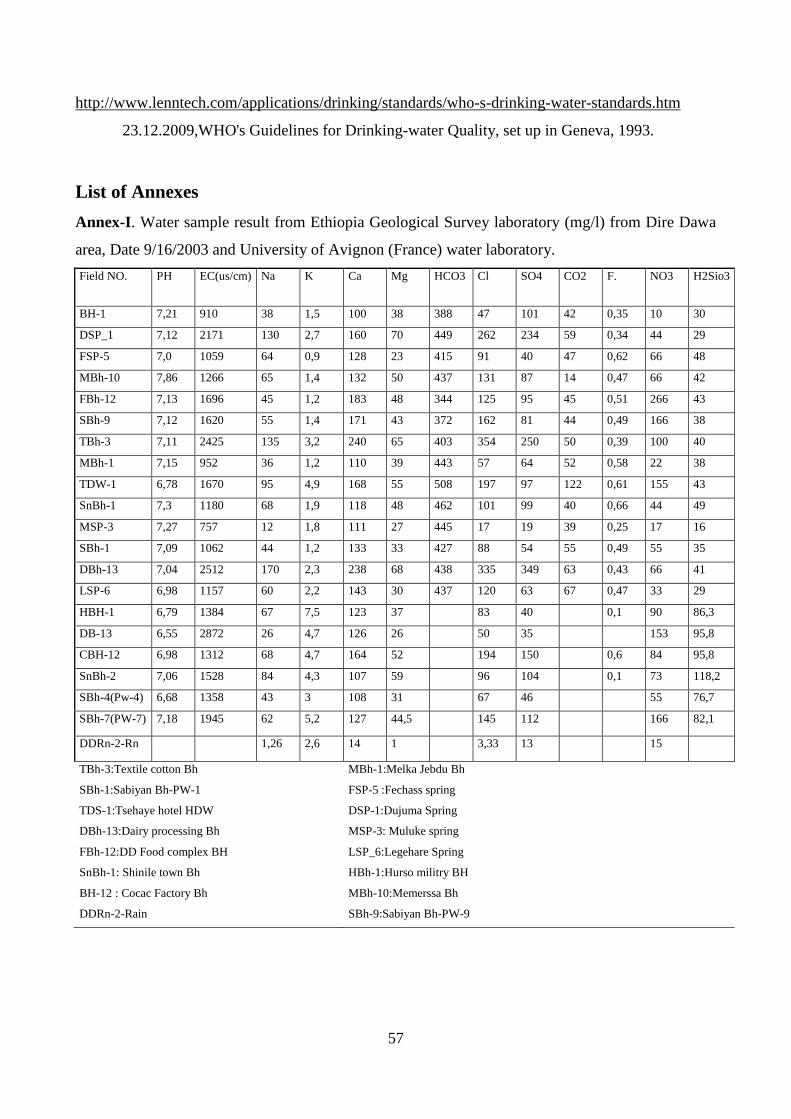
57
http://www.lenntech.com/applications/drinking/standards/who-s-drinking-water-standards.htm
23.12.2009,WHO's Guidelines for Drinking-water Quality, set up in Geneva, 1993.
List of Annexes
Annex-I. Water sample result from Ethiopia Geological Survey laboratory (mg/l) from Dire Dawa
area, Date 9/16/2003 and University of Avignon (France) water laboratory.
Field NO. PH EC(us/cm) Na K Ca Mg HCO3 Cl SO4 CO2 F. NO3 H2Sio3
BH-1 7,21 910 38 1,5 100 38 388 47 101 42 0,35 10 30
DSP_1 7,12 2171 130 2,7 160 70 449 262 234 59 0,34 44 29
FSP-5 7,0 1059 64 0,9 128 23 415 91 40 47 0,62 66 48
MBh-10 7,86 1266 65 1,4 132 50 437 131 87 14 0,47 66 42
FBh-12 7,13 1696 45 1,2 183 48 344 125 95 45 0,51 266 43
SBh-9 7,12 1620 55 1,4 171 43 372 162 81 44 0,49 166 38
TBh-3 7,11 2425 135 3,2 240 65 403 354 250 50 0,39 100 40
MBh-1 7,15 952 36 1,2 110 39 443 57 64 52 0,58 22 38
TDW-1 6,78 1670 95 4,9 168 55 508 197 97 122 0,61 155 43
SnBh-1 7,3 1180 68 1,9 118 48 462 101 99 40 0,66 44 49
MSP-3 7,27 757 12 1,8 111 27 445 17 19 39 0,25 17 16
SBh-1 7,09 1062 44 1,2 133 33 427 88 54 55 0,49 55 35
DBh-13 7,04 2512 170 2,3 238 68 438 335 349 63 0,43 66 41
LSP-6 6,98 1157 60 2,2 143 30 437 120 63 67 0,47 33 29
HBH-1 6,79 1384 67 7,5 123 37 83 40 0,1 90 86,3
DB-13 6,55 2872 26 4,7 126 26 50 35 153 95,8
CBH-12 6,98 1312 68 4,7 164 52 194 150 0,6 84 95,8
SnBh-2 7,06 1528 84 4,3 107 59 96 104 0,1 73 118,2
SBh-4(Pw-4) 6,68 1358 43 3 108 31 67 46 55 76,7
SBh-7(PW-7) 7,18 1945 62 5,2 127 44,5 145 112 166 82,1
DDRn-2-Rn 1,26 2,6 14 1 3,33 13 15
TBh-3:Textile cotton Bh
SBh-1:Sabiyan Bh-PW-1
TDS-1:Tsehaye hotel HDW
DBh-13:Dairy processing Bh
FBh-12:DD Food complex BH
SnBh-1: Shinile town Bh
BH-12 : Cocac Factory Bh
DDRn-2-Rain
MBh-1:Melka Jebdu Bh
FSP-5 :Fechass spring
DSP-1:Dujuma Spring
MSP-3: Muluke spring
LSP_6:Legehare Spring
HBh-1:Hurso militry BH
MBh-10:Memerssa Bh
SBh-9:Sabiyan Bh-PW-9
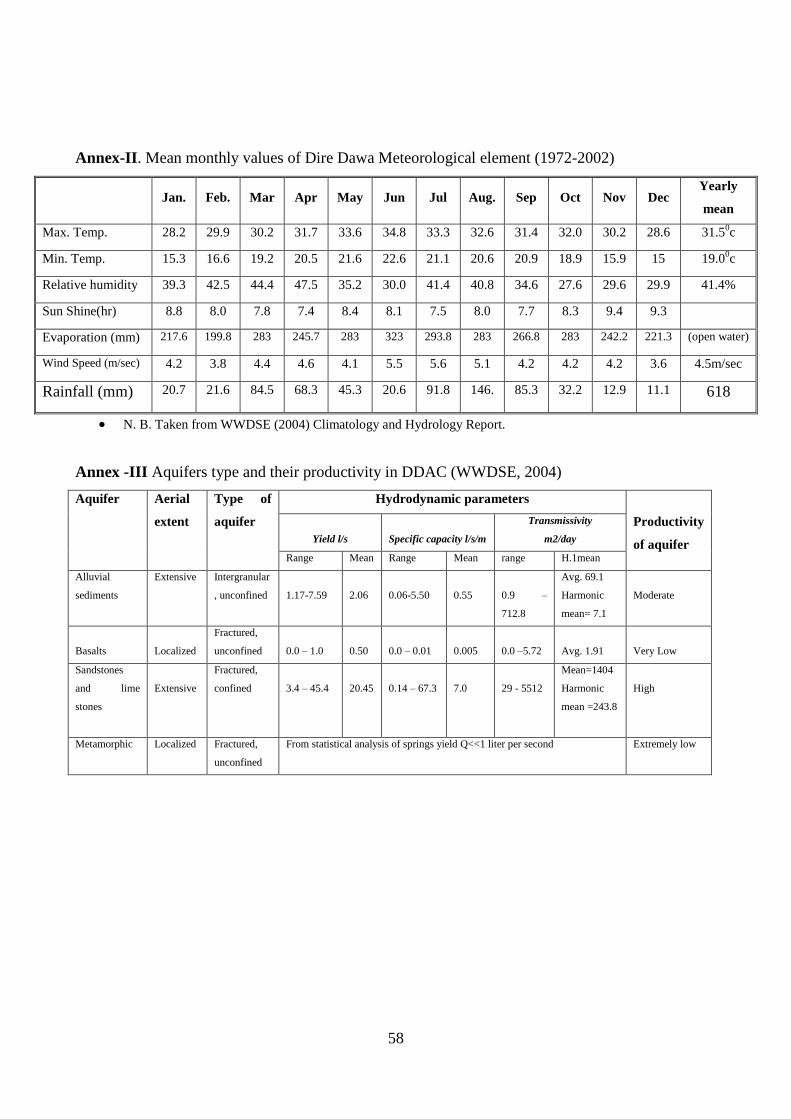
58
Annex-II. Mean monthly values of Dire Dawa Meteorological element (1972-2002)
Jan. Feb. Mar Apr May Jun Jul Aug. Sep Oct Nov Dec Yearly
mean
Max. Temp. 28.2 29.9 30.2 31.7 33.6 34.8 33.3 32.6 31.4 32.0 30.2 28.6 31.50c
Min. Temp. 15.3 16.6 19.2 20.5 21.6 22.6 21.1 20.6 20.9 18.9 15.9 15 19.00c
Relative humidity 39.3 42.5 44.4 47.5 35.2 30.0 41.4 40.8 34.6 27.6 29.6 29.9 41.4%
Sun Shine(hr) 8.8 8.0 7.8 7.4 8.4 8.1 7.5 8.0 7.7 8.3 9.4 9.3
Evaporation (mm) 217.6 199.8 283 245.7 283 323 293.8 283 266.8 283 242.2 221.3 (open water)
Wind Speed (m/sec) 4.2 3.8 4.4 4.6 4.1 5.5 5.6 5.1 4.2 4.2 4.2 3.6 4.5m/sec
Rainfall (mm) 20.7 21.6 84.5 68.3 45.3 20.6 91.8 146. 85.3 32.2 12.9 11.1 618
N. B. Taken from WWDSE (2004) Climatology and Hydrology Report.
Annex -III Aquifers type and their productivity in DDAC (WWDSE, 2004)
Aquifer Aerial
extent
Type of
aquifer
Hydrodynamic parameters
Productivity
of aquifer
Yield l/s
Specific capacity l/s/m
Transmissivity
m2/day
Range Mean Range Mean range H.1mean
Alluvial
sediments
Extensive Intergranular
, unconfined
1.17-7.59
2.06
0.06-5.50
0.55
0.9 –
712.8
Avg. 69.1
Harmonic
mean= 7.1
Moderate
Basalts
Localized
Fractured,
unconfined
0.0 – 1.0
0.50
0.0 – 0.01
0.005
0.0 –5.72
Avg. 1.91
Very Low
Sandstones
and lime
stones
Extensive
Fractured,
confined
3.4 – 45.4
20.45
0.14 – 67.3
7.0
29 - 5512
Mean=1404
Harmonic
mean =243.8
High
Metamorphic Localized Fractured,
unconfined
From statistical analysis of springs yield Q<<1 liter per second Extremely low
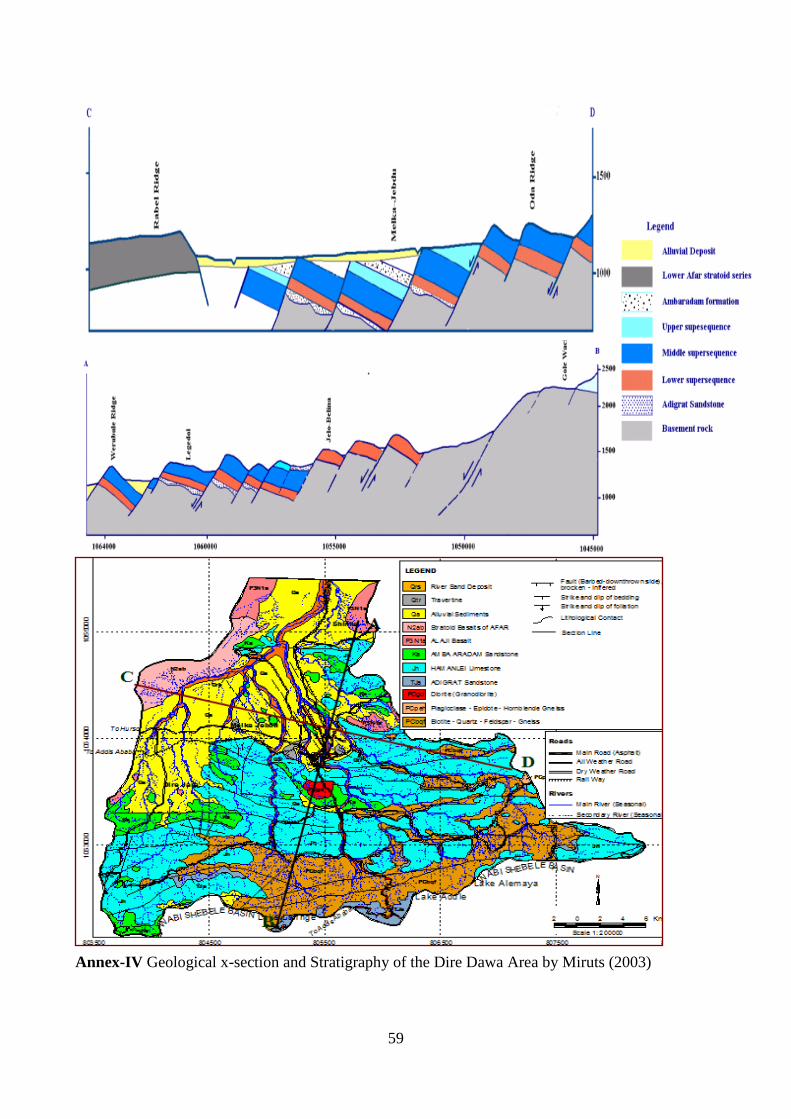
59
Annex-IV Geological x-section and Stratigraphy of the Dire Dawa Area by Miruts (2003)
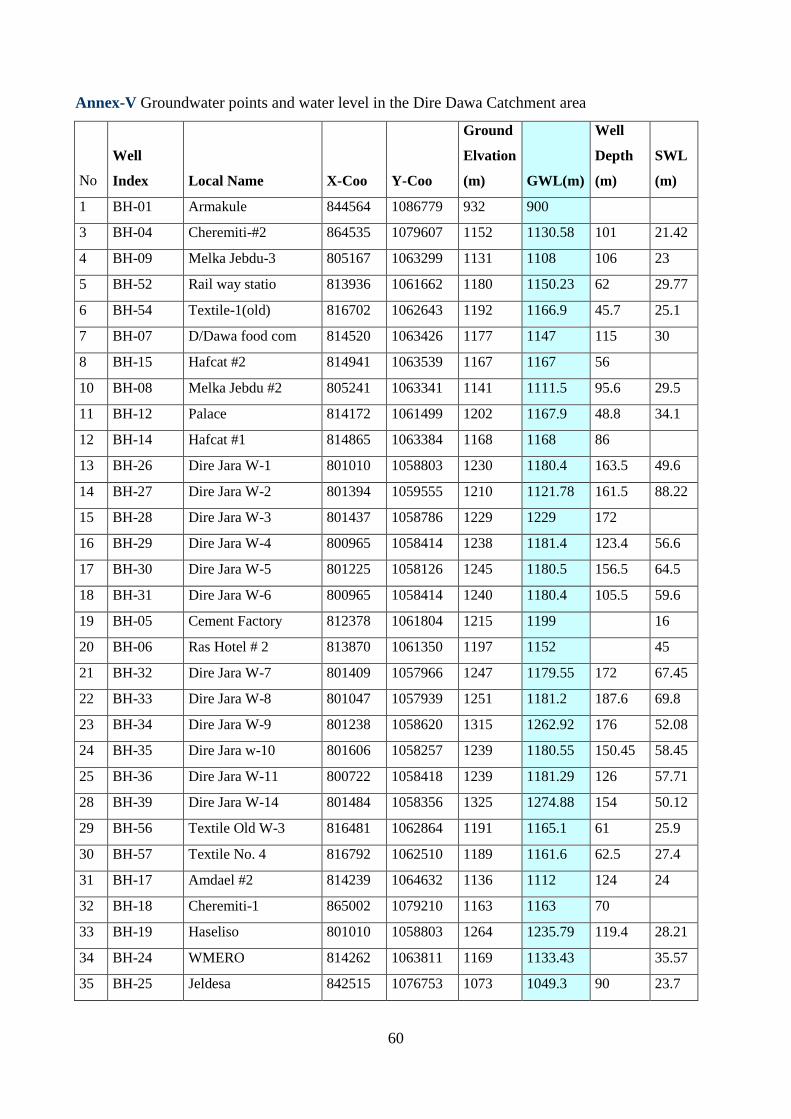
60
Annex-V Groundwater points and water level in the Dire Dawa Catchment area
No
Well
Index Local Name X-Coo Y-Coo
Ground
Elvation
(m) GWL(m)
Well
Depth
(m)
SWL
(m)
1 BH-01 Armakule 844564 1086779 932 900
3 BH-04 Cheremiti-#2 864535 1079607 1152 1130.58 101 21.42
4 BH-09 Melka Jebdu-3 805167 1063299 1131 1108 106 23
5 BH-52 Rail way statio 813936 1061662 1180 1150.23 62 29.77
6 BH-54 Textile-1(old) 816702 1062643 1192 1166.9 45.7 25.1
7 BH-07 D/Dawa food com 814520 1063426 1177 1147 115 30
8 BH-15 Hafcat #2 814941 1063539 1167 1167 56
10 BH-08 Melka Jebdu #2 805241 1063341 1141 1111.5 95.6 29.5
11 BH-12 Palace 814172 1061499 1202 1167.9 48.8 34.1
12 BH-14 Hafcat #1 814865 1063384 1168 1168 86
13 BH-26 Dire Jara W-1 801010 1058803 1230 1180.4 163.5 49.6
14 BH-27 Dire Jara W-2 801394 1059555 1210 1121.78 161.5 88.22
15 BH-28 Dire Jara W-3 801437 1058786 1229 1229 172
16 BH-29 Dire Jara W-4 800965 1058414 1238 1181.4 123.4 56.6
17 BH-30 Dire Jara W-5 801225 1058126 1245 1180.5 156.5 64.5
18 BH-31 Dire Jara W-6 800965 1058414 1240 1180.4 105.5 59.6
19 BH-05 Cement Factory 812378 1061804 1215 1199 16
20 BH-06 Ras Hotel # 2 813870 1061350 1197 1152 45
21 BH-32 Dire Jara W-7 801409 1057966 1247 1179.55 172 67.45
22 BH-33 Dire Jara W-8 801047 1057939 1251 1181.2 187.6 69.8
23 BH-34 Dire Jara W-9 801238 1058620 1315 1262.92 176 52.08
24 BH-35 Dire Jara w-10 801606 1058257 1239 1180.55 150.45 58.45
25 BH-36 Dire Jara W-11 800722 1058418 1239 1181.29 126 57.71
28 BH-39 Dire Jara W-14 801484 1058356 1325 1274.88 154 50.12
29 BH-56 Textile Old W-3 816481 1062864 1191 1165.1 61 25.9
30 BH-57 Textile No. 4 816792 1062510 1189 1161.6 62.5 27.4
31 BH-17 Amdael #2 814239 1064632 1136 1112 124 24
32 BH-18 Cheremiti-1 865002 1079210 1163 1163 70
33 BH-19 Haseliso 801010 1058803 1264 1235.79 119.4 28.21
34 BH-24 WMERO 814262 1063811 1169 1133.43 35.57
35 BH-25 Jeldesa 842515 1076753 1073 1049.3 90 23.7
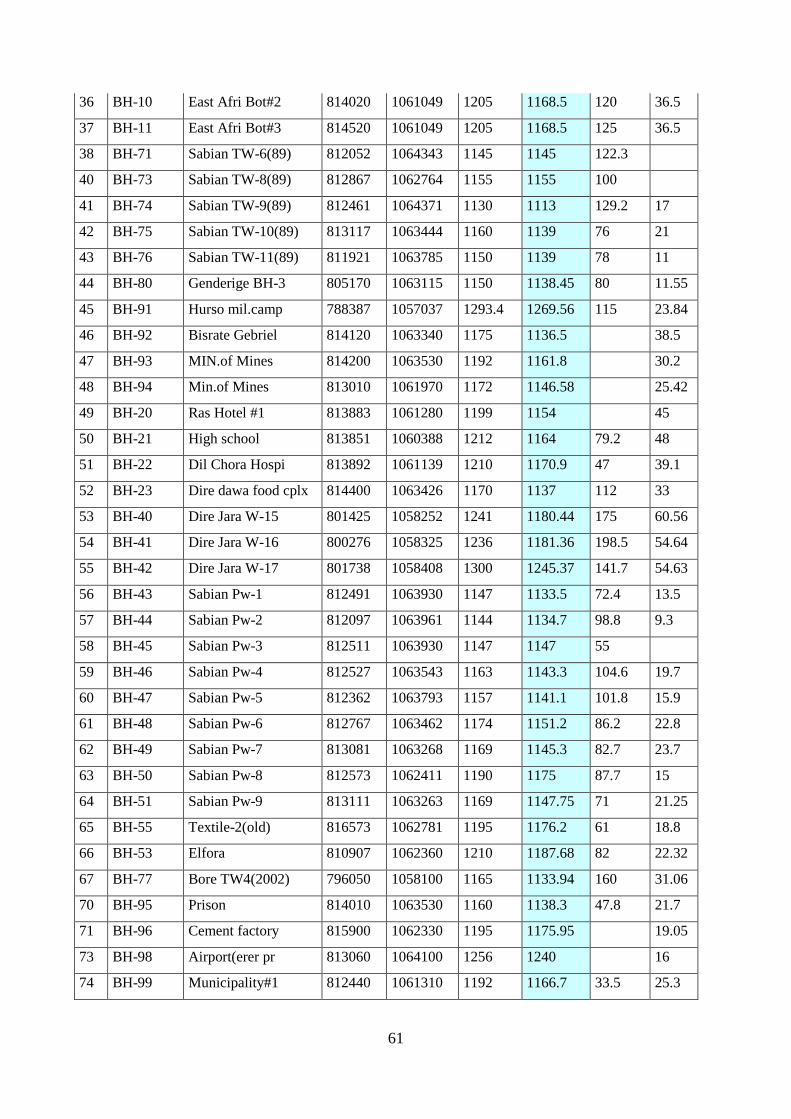
61
36 BH-10 East Afri Bot#2 814020 1061049 1205 1168.5 120 36.5
37 BH-11 East Afri Bot#3 814520 1061049 1205 1168.5 125 36.5
38 BH-71 Sabian TW-6(89) 812052 1064343 1145 1145 122.3
40 BH-73 Sabian TW-8(89) 812867 1062764 1155 1155 100
41 BH-74 Sabian TW-9(89) 812461 1064371 1130 1113 129.2 17
42 BH-75 Sabian TW-10(89) 813117 1063444 1160 1139 76 21
43 BH-76 Sabian TW-11(89) 811921 1063785 1150 1139 78 11
44 BH-80 Genderige BH-3 805170 1063115 1150 1138.45 80 11.55
45 BH-91 Hurso mil.camp 788387 1057037 1293.4 1269.56 115 23.84
46 BH-92 Bisrate Gebriel 814120 1063340 1175 1136.5 38.5
47 BH-93 MIN.of Mines 814200 1063530 1192 1161.8 30.2
48 BH-94 Min.of Mines 813010 1061970 1172 1146.58 25.42
49 BH-20 Ras Hotel #1 813883 1061280 1199 1154 45
50 BH-21 High school 813851 1060388 1212 1164 79.2 48
51 BH-22 Dil Chora Hospi 813892 1061139 1210 1170.9 47 39.1
52 BH-23 Dire dawa food cplx 814400 1063426 1170 1137 112 33
53 BH-40 Dire Jara W-15 801425 1058252 1241 1180.44 175 60.56
54 BH-41 Dire Jara W-16 800276 1058325 1236 1181.36 198.5 54.64
55 BH-42 Dire Jara W-17 801738 1058408 1300 1245.37 141.7 54.63
56 BH-43 Sabian Pw-1 812491 1063930 1147 1133.5 72.4 13.5
57 BH-44 Sabian Pw-2 812097 1063961 1144 1134.7 98.8 9.3
58 BH-45 Sabian Pw-3 812511 1063930 1147 1147 55
59 BH-46 Sabian Pw-4 812527 1063543 1163 1143.3 104.6 19.7
60 BH-47 Sabian Pw-5 812362 1063793 1157 1141.1 101.8 15.9
61 BH-48 Sabian Pw-6 812767 1063462 1174 1151.2 86.2 22.8
62 BH-49 Sabian Pw-7 813081 1063268 1169 1145.3 82.7 23.7
63 BH-50 Sabian Pw-8 812573 1062411 1190 1175 87.7 15
64 BH-51 Sabian Pw-9 813111 1063263 1169 1147.75 71 21.25
65 BH-55 Textile-2(old) 816573 1062781 1195 1176.2 61 18.8
66 BH-53 Elfora 810907 1062360 1210 1187.68 82 22.32
67 BH-77 Bore TW4(2002) 796050 1058100 1165 1133.94 160 31.06
70 BH-95 Prison 814010 1063530 1160 1138.3 47.8 21.7
71 BH-96 Cement factory 815900 1062330 1195 1175.95 19.05
73 BH-98 Airport(erer pr 813060 1064100 1256 1240 16
74 BH-99 Municipality#1 812440 1061310 1192 1166.7 33.5 25.3
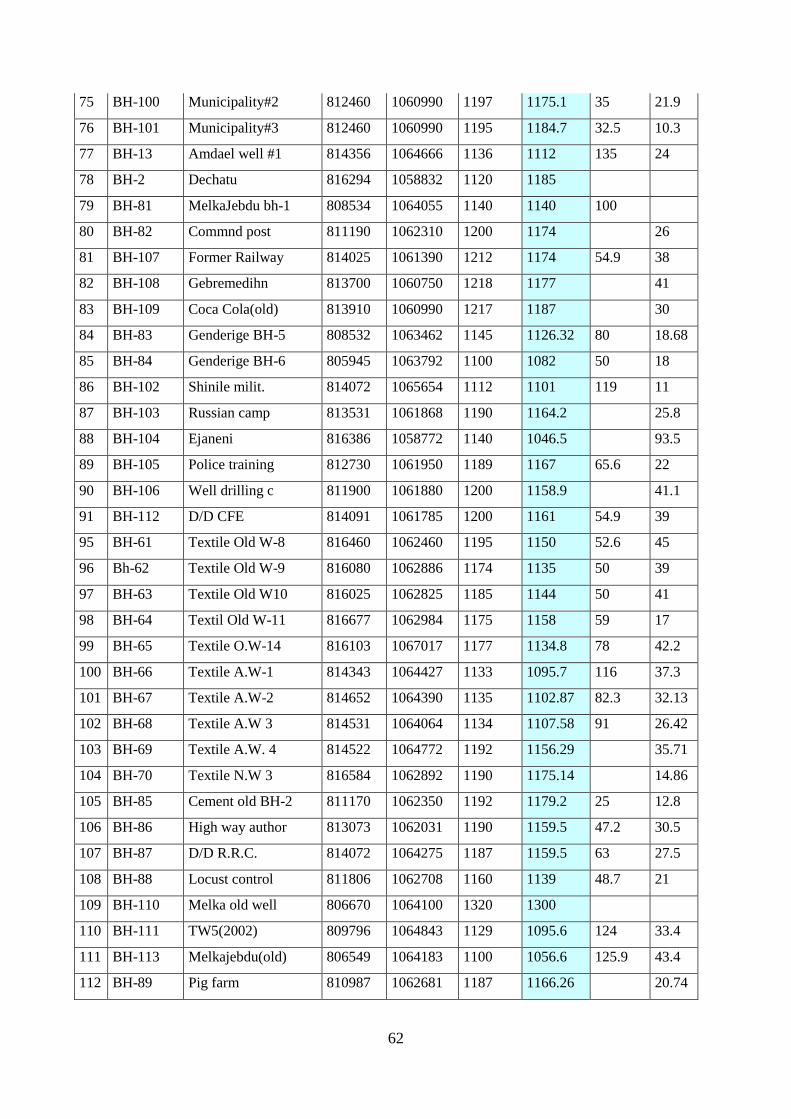
62
75 BH-100 Municipality#2 812460 1060990 1197 1175.1 35 21.9
76 BH-101 Municipality#3 812460 1060990 1195 1184.7 32.5 10.3
77 BH-13 Amdael well #1 814356 1064666 1136 1112 135 24
78 BH-2 Dechatu 816294 1058832 1120 1185
79 BH-81 MelkaJebdu bh-1 808534 1064055 1140 1140 100
80 BH-82 Commnd post 811190 1062310 1200 1174 26
81 BH-107 Former Railway 814025 1061390 1212 1174 54.9 38
82 BH-108 Gebremedihn 813700 1060750 1218 1177 41
83 BH-109 Coca Cola(old) 813910 1060990 1217 1187 30
84 BH-83 Genderige BH-5 808532 1063462 1145 1126.32 80 18.68
85 BH-84 Genderige BH-6 805945 1063792 1100 1082 50 18
86 BH-102 Shinile milit. 814072 1065654 1112 1101 119 11
87 BH-103 Russian camp 813531 1061868 1190 1164.2 25.8
88 BH-104 Ejaneni 816386 1058772 1140 1046.5 93.5
89 BH-105 Police training 812730 1061950 1189 1167 65.6 22
90 BH-106 Well drilling c 811900 1061880 1200 1158.9 41.1
91 BH-112 D/D CFE 814091 1061785 1200 1161 54.9 39
95 BH-61 Textile Old W-8 816460 1062460 1195 1150 52.6 45
96 Bh-62 Textile Old W-9 816080 1062886 1174 1135 50 39
97 BH-63 Textile Old W10 816025 1062825 1185 1144 50 41
98 BH-64 Textil Old W-11 816677 1062984 1175 1158 59 17
99 BH-65 Textile O.W-14 816103 1067017 1177 1134.8 78 42.2
100 BH-66 Textile A.W-1 814343 1064427 1133 1095.7 116 37.3
101 BH-67 Textile A.W-2 814652 1064390 1135 1102.87 82.3 32.13
102 BH-68 Textile A.W 3 814531 1064064 1134 1107.58 91 26.42
103 BH-69 Textile A.W. 4 814522 1064772 1192 1156.29 35.71
104 BH-70 Textile N.W 3 816584 1062892 1190 1175.14 14.86
105 BH-85 Cement old BH-2 811170 1062350 1192 1179.2 25 12.8
106 BH-86 High way author 813073 1062031 1190 1159.5 47.2 30.5
107 BH-87 D/D R.R.C. 814072 1064275 1187 1159.5 63 27.5
108 BH-88 Locust control 811806 1062708 1160 1139 48.7 21
109 BH-110 Melka old well 806670 1064100 1320 1300
110 BH-111 TW5(2002) 809796 1064843 1129 1095.6 124 33.4
111 BH-113 Melkajebdu(old) 806549 1064183 1100 1056.6 125.9 43.4
112 BH-89 Pig farm 810987 1062681 1187 1166.26 20.74
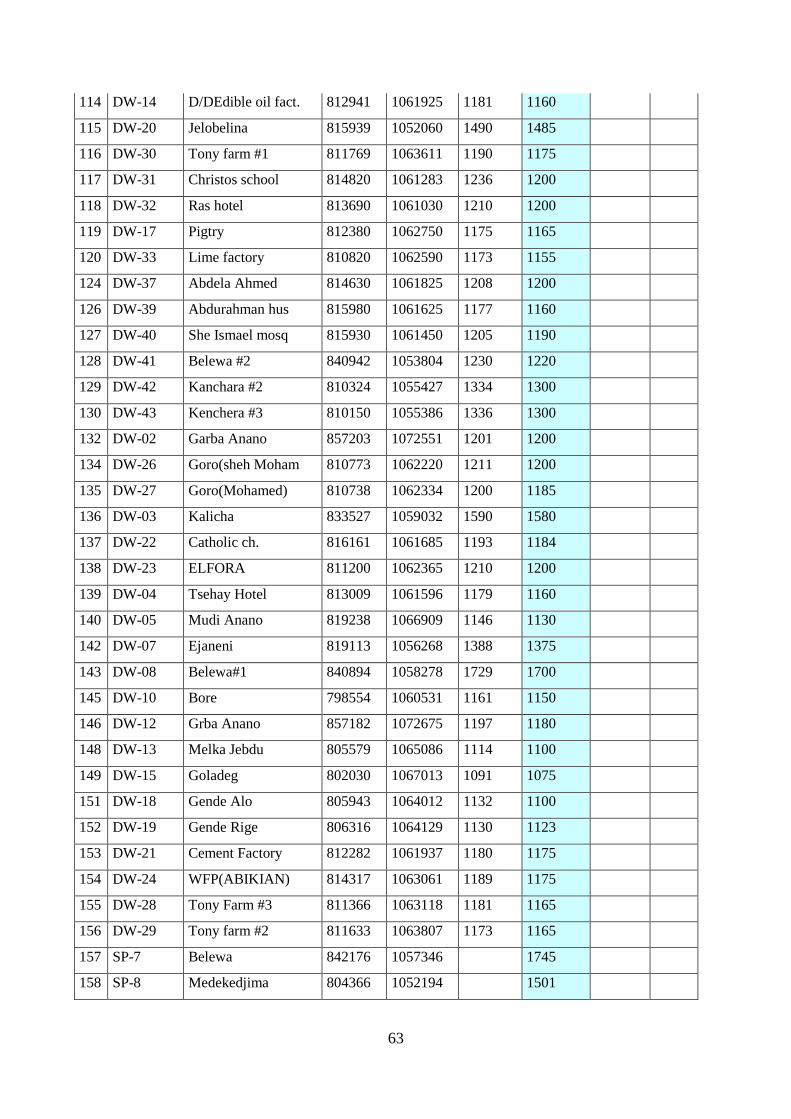
63
114 DW-14 D/DEdible oil fact. 812941 1061925 1181 1160
115 DW-20 Jelobelina 815939 1052060 1490 1485
116 DW-30 Tony farm #1 811769 1063611 1190 1175
117 DW-31 Christos school 814820 1061283 1236 1200
118 DW-32 Ras hotel 813690 1061030 1210 1200
119 DW-17 Pigtry 812380 1062750 1175 1165
120 DW-33 Lime factory 810820 1062590 1173 1155
124 DW-37 Abdela Ahmed 814630 1061825 1208 1200
126 DW-39 Abdurahman hus 815980 1061625 1177 1160
127 DW-40 She Ismael mosq 815930 1061450 1205 1190
128 DW-41 Belewa #2 840942 1053804 1230 1220
129 DW-42 Kanchara #2 810324 1055427 1334 1300
130 DW-43 Kenchera #3 810150 1055386 1336 1300
132 DW-02 Garba Anano 857203 1072551 1201 1200
134 DW-26 Goro(sheh Moham 810773 1062220 1211 1200
135 DW-27 Goro(Mohamed) 810738 1062334 1200 1185
136 DW-03 Kalicha 833527 1059032 1590 1580
137 DW-22 Catholic ch. 816161 1061685 1193 1184
138 DW-23 ELFORA 811200 1062365 1210 1200
139 DW-04 Tsehay Hotel 813009 1061596 1179 1160
140 DW-05 Mudi Anano 819238 1066909 1146 1130
142 DW-07 Ejaneni 819113 1056268 1388 1375
143 DW-08 Belewa#1 840894 1058278 1729 1700
145 DW-10 Bore 798554 1060531 1161 1150
146 DW-12 Grba Anano 857182 1072675 1197 1180
148 DW-13 Melka Jebdu 805579 1065086 1114 1100
149 DW-15 Goladeg 802030 1067013 1091 1075
151 DW-18 Gende Alo 805943 1064012 1132 1100
152 DW-19 Gende Rige 806316 1064129 1130 1123
153 DW-21 Cement Factory 812282 1061937 1180 1175
154 DW-24 WFP(ABIKIAN) 814317 1063061 1189 1175
155 DW-28 Tony Farm #3 811366 1063118 1181 1165
156 DW-29 Tony farm #2 811633 1063807 1173 1165
157 SP-7 Belewa 842176 1057346 1745
158 SP-8 Medekedjima 804366 1052194 1501
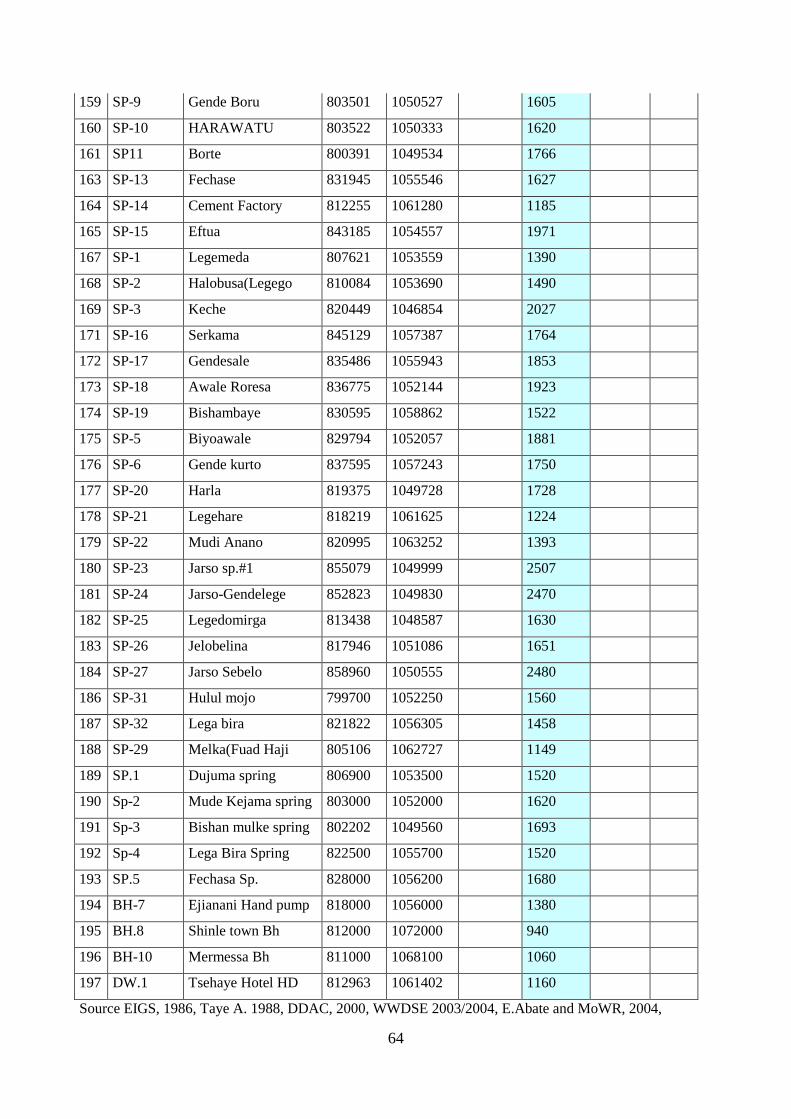
64
159 SP-9 Gende Boru 803501 1050527 1605
160 SP-10 HARAWATU 803522 1050333 1620
161 SP11 Borte 800391 1049534 1766
163 SP-13 Fechase 831945 1055546 1627
164 SP-14 Cement Factory 812255 1061280 1185
165 SP-15 Eftua 843185 1054557 1971
167 SP-1 Legemeda 807621 1053559 1390
168 SP-2 Halobusa(Legego 810084 1053690 1490
169 SP-3 Keche 820449 1046854 2027
171 SP-16 Serkama 845129 1057387 1764
172 SP-17 Gendesale 835486 1055943 1853
173 SP-18 Awale Roresa 836775 1052144 1923
174 SP-19 Bishambaye 830595 1058862 1522
175 SP-5 Biyoawale 829794 1052057 1881
176 SP-6 Gende kurto 837595 1057243 1750
177 SP-20 Harla 819375 1049728 1728
178 SP-21 Legehare 818219 1061625 1224
179 SP-22 Mudi Anano 820995 1063252 1393
180 SP-23 Jarso sp.#1 855079 1049999 2507
181 SP-24 Jarso-Gendelege 852823 1049830 2470
182 SP-25 Legedomirga 813438 1048587 1630
183 SP-26 Jelobelina 817946 1051086 1651
184 SP-27 Jarso Sebelo 858960 1050555 2480
186 SP-31 Hulul mojo 799700 1052250 1560
187 SP-32 Lega bira 821822 1056305 1458
188 SP-29 Melka(Fuad Haji 805106 1062727 1149
189 SP.1 Dujuma spring 806900 1053500 1520
190 Sp-2 Mude Kejama spring 803000 1052000 1620
191 Sp-3 Bishan mulke spring 802202 1049560 1693
192 Sp-4 Lega Bira Spring 822500 1055700 1520
193 SP.5 Fechasa Sp. 828000 1056200 1680
194 BH-7 Ejianani Hand pump 818000 1056000 1380
195 BH.8 Shinle town Bh 812000 1072000 940
196 BH-10 Mermessa Bh 811000 1068100 1060
197 DW.1 Tsehaye Hotel HD 812963 1061402 1160
Source EIGS, 1986, Taye A. 1988, DDAC, 2000, WWDSE 2003/2004, E.Abate and MoWR, 2004,