Embed Size (px)
Citation preview

Results
EuroTrak Switzerland 20181. Introduction2. Market overview3. Analysis of hearing aid owners4. Analysis of hearing impaired non-owners5. Appendix
Research to create value
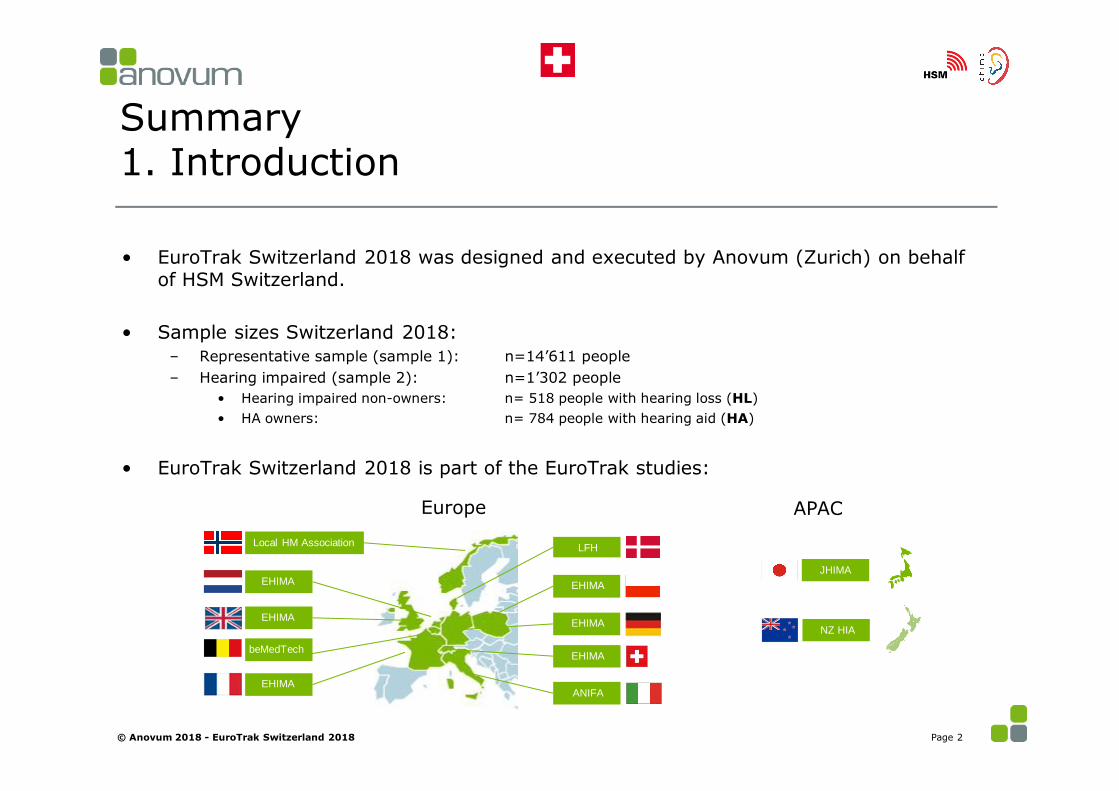
Summary 1. Introduction
• EuroTrak Switzerland 2018 was designed and executed by Anovum (Zurich) on behalf of HSM Switzerland.
• Sample sizes Switzerland 2018:– Representative sample (sample 1): n=14’611 people– Hearing impaired (sample 2): n=1’302 people
• Hearing impaired non-owners: n= 518 people with hearing loss (HL)• HA owners: n= 784 people with hearing aid (HA)
• EuroTrak Switzerland 2018 is part of the EuroTrak studies:
© Anovum 2018 - EuroTrak Switzerland 2018 Page 2
EHIMA
EHIMA
Local HM Association
Local HM AssociationEHIMA
EHIMA
EHIMA
ANIFA
LFH
EHIMA
EHIMAbeMedTech
Europe
JHIMA
NZ HIA
APAC
Summary2. Market overview• Stated hearing loss prevalence
– Total: 7.7%, 18+: 9.1% (2015: 8.0%, 18+: 9.5%).– Binaural hearing loss: HA owners: 87%, HA non-owners: 61%.– Hearing Tests: 34% (2015: 35%) had a hearing test in the last 5 years, most tests done by family doctors
• Hearing aid adoption rate (HA penetration)– Total: 43.7% (2015: 41.4%).– Total age group 18+: 43.6% (2015: 41.9%).– 81% of HA owners have binaural treatment.
• The route to the hearing aid– 79% of the hearing impaired discussed hearing loss with an ENT doctor or family doctor.– 52% got hearing aids recommended from the ENT or family doctor.– 25% of the GP consultations referred to an audiologist.– 61% of the GP consultations referred to an ENT, 19% recommended no further action. – 44% of ENT consultations referred to an audiologist, 34% recommended no action.
• Potential social cost-savings due to the use of hearing aids– Hearing aids are believed to have a positive impact on the job.– Quality of sleep seems to improve if hearing impaired use hearing aids.
© Anovum 2018 - EuroTrak Switzerland 2018 Page 3

Summary 3. Analysis of hearing aid owners• Hearing aid ownership, usage and accessories
– 85% of all HA owners received some kind of 3rd party reimbursement. – 60% of the currently owned HAs were bought in 2015 or later.– The average age of the currently owned HAs is 4.1 years (2015: 3.8 years).– The median age of hearing aids before replacement is 6 years.– On average, HAs are worn 9.8 hours a day (2015: 9.0).– 68% of today’s hearing aid owners are aware of their hearing aid brand.– 47% have been informed about hearing aid accessories by the HCP, 25% use a HA accessory.
• Importance of listening situations and satisfaction with HAs– 80% of the hearing aid owners say their hearing aid works better than or as expected– 80% (2015:81%) of the HA owners are satisfied with their HAs.– The more hours worn per day, the higher the satisfaction.– Satisfaction with newer hearing aids is higher than with older hearing aids.– Talking at home with family members, conversations, talking on a phone, in a large lecture hall and watching
TV with others are the most important listening situations.• Positive impact of HAs
– Significant positive impact of HAs on different aspects – especially communication, participating in group activities, social life, sense of safety and relationships at home.
– 98% of hearing aid owners declare that their hearing aids improve their quality of life at least sometimes
© Anovum 2018 - EuroTrak Switzerland 2018 Page 4

Summary 4. Analysis of hearing impaired non-owners• Reasons not to own/use HAs
– The main reasons for not using hearing aids are that people say they hear well enough in most situations, hearing loss is not severe enough, ENTs opinion, they do not work in noisy situations and they can’t afford a HA.
– 5% who own HAs don’t use them at all (0 hours); 13% use them less than one hour/day (0-1 hour).
• Social rejection, buying intentions and triggers to buy– 87% of hearing aid owners feel that people never make fun of or reject them because of their hearing aids.
It is more likely somebody makes fun or rejects a hearing impaired without hearing aid (only 48% say they are never made fun of because of their hearing loss).
– The most important influencing factors for getting hearing aids are worsening hearing loss, ENT, spouse and the audiologist. Insurance coverage/price of hearing aids is much more relevant for the non owners.
© Anovum 2018 - EuroTrak Switzerland 2018 Page 5

Detailed Results: RoadmapNew topics for EuroTrak 2018 are highlighted in red
© Anovum 2018 - EuroTrak Switzerland 2018 Page 6
1. Introduction– Organisation of EuroTrak 2018– Recruitment process: In search of hearing impaired people
2. Market overview– Prevalence of hearing loss and hearing aid adoption rate– Hearing tests and where hearing is tested– The route to the hearing aid: Sources of information and drop-out rates– Potential social cost-savings due to the use of hearing aids: Work competitiveness, depressive symptoms, sleep
quality, co-morbidities3. Analysis of hearing aid owners
– Hearing aid ownership, awareness of hearing loss before getting hearing aids, lifetime of hearing aids and usage– Reasons for getting hearing aids sooner– Channels for getting hearing aids, recommendation of channel (NPS)– Awareness and usage of accessories– Satisfaction with hearing aids and drivers– Importance of listening situations– Positive impact of hearing aids, safety due to hearing aids, quality of life
4. Analysis of hearing impaired non-owners– Reasons for not having hearing aids– Social rejection because of hearing loss compared to the acceptance of hearing aids– Most important triggers to buy
5. Appendix– Demographics: Hearing instrument adoption rates and populations

1. Introduction
© Anovum 2018 - EuroTrak Switzerland 2018 Page 7
Organisation of EuroTrak 2018
© Anovum 2018 - EuroTrak Switzerland 2018 Page 8
Organisation• Principal of the project EuroTrak Switzerland is HSM Switzerland.• Anovum Zurich developed the concept of EuroTrak, designed the questionnaire and conducted the fieldwork in
cooperation with a panel company. Furthermore Anovum analysed the data and prepared the presentation.• The European Hearing Instrument Manufacturers Association [EHIMA] approved the questionnaire.
Use of the data• HSM Switzerland may use the anonymous delivered tables, charts, reports and conclusions of the survey for
further research projects, for archiving and publication in any form whatsoever.
• The raw dataset remains at Anovum. If HSM Switzerland uses the anonymous data (delivered tables, charts, reports) and conclusions of the survey for publications the source of the data needs to be mentioned in the following way:“Source: Anovum – EuroTrak – Switzerland/2018/n=[relevant sample size]”
• HSM Switzerland member companies can ask Anovum to further analyse the raw data in specific ways at their own expense.
• HSM Switzerland companies can order a report with satisfaction scores for their brand (if feasible). The other brands will be shown as benchmarks without denomination (brand A, brand B etc.). The report will show all satisfaction values. It is not allowed to communicate any information from these reports outside the HSM Switzerland company.

Recruitment process: In search of hearing impaired people
© Anovum 2018 - EuroTrak Switzerland 2018 Page 9
Step 1: Screening interviews
Objective: Prevalence of hearing loss and hearing aid ownership
Process: 1. Representative sample with strict quotas that represent the overall population (Age/Gender
interlocked; soft quota on region)2. Contacts from panelist pools of more than 50’000 people3. Screening questionnaire: Stated hearing loss and hearing aid usage + demographics4. Result: Representative sample of n=14’611 people based on census data.
Step 2: Target population interviews
Objective: Details about satisfaction with hearing aids and reasons for non-adoption
Process:1. Main questionnaires: Owners and hearing impaired non-owners 2. Balancing through weighting according to representative screening interviews3. Resulting sample: n=784 hearing aid owners and n=518 hearing impaired non-owners

2. Market overview
© Anovum 2018 - EuroTrak Switzerland 2018 Page 10

Prevalence of hearing loss and adoption rate
© Anovum 2018 - EuroTrak Switzerland 2018 Page 11

7.2%
5.2%
6.7%
6.7%
7.3%
5.9%
4.3%
3.6%
0.0%
0.0%
0.1%
0.2%
0.3%
0.3%
0.4%
0.7%
0.0%
0.0%
0.0%
0.0%
0.1%
0.2%
0.3%
0.9%
7.6%
5.5%
6.8%
6.8%
7.3%
5.7%
3.6%
2.0%
0.0%
0.1%
0.1%
0.2%
0.4%
0.4%
0.6%
0.6%
0.0%
0.0%
0.0%
0.0%
0.1%
0.3%
0.5%
0.8%
<= 14
15 - 24
25 - 34
35 - 44
45 - 54
55 - 64
65 - 74
74+
Age
gro
up
Women: Unimpaired non-owner Women: Impaired non-user Women: HA owner
Men: Unimpaired non-owner Men: Impaired non-user Men: HA owner
Hearing loss and hearing instrument ownership by gender/age
© Anovum 2018 - EuroTrak Switzerland 2018 Page 12
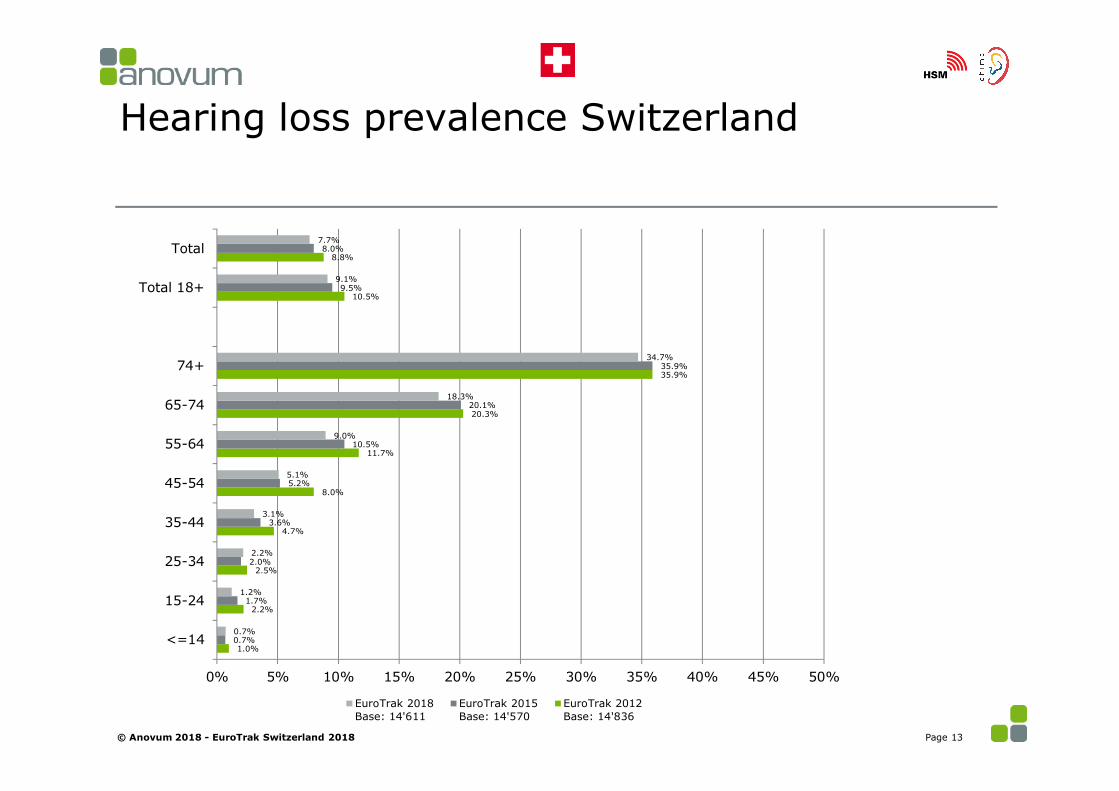
Hearing loss prevalence Switzerland
Page 13© Anovum 2018 - EuroTrak Switzerland 2018
1.0%
2.2%
2.5%
4.7%
8.0%
11.7%
20.3%
35.9%
10.5%
8.8%
0.7%
1.7%
2.0%
3.6%
5.2%
10.5%
20.1%
35.9%
9.5%
8.0%
0.7%
1.2%
2.2%
3.1%
5.1%
9.0%
18.3%
34.7%
9.1%
7.7%
0% 5% 10% 15% 20% 25% 30% 35% 40% 45% 50%
<=14
15-24
25-34
35-44
45-54
55-64
65-74
74+
Total 18+
Total
EuroTrak 2018Base: 14'611
EuroTrak 2015Base: 14'570
EuroTrak 2012Base: 14'836

Overview hearing loss prevalence and hearing aid adoption
Page 14© Anovum 2018 - EuroTrak Switzerland 2018
7.7% 8.0% 8.8%
3.3% 3.3% 3.4%
43.7%41.4%
38.8%
0%
5%
10%
15%
20%
25%
30%
35%
40%
45%
50%
Euro Trak 2018 Euro Trak 2015 Euro Trak 2012
Hearing impaired (stated) Adoption (% of population) Adoption (% of stated impaired)
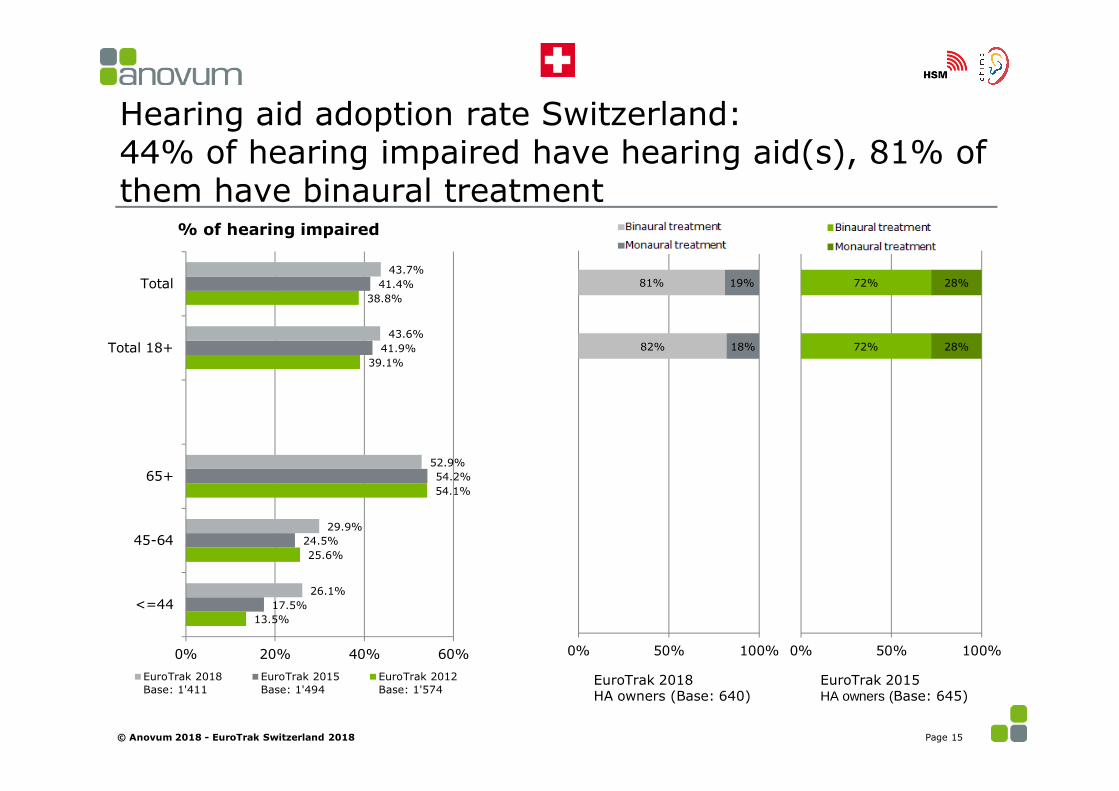
Hearing aid adoption rate Switzerland:44% of hearing impaired have hearing aid(s), 81% of them have binaural treatment
Page 15
82%
81%
18%
19%
0% 50% 100%
% of hearing impaired
72%
72%
28%
28%
0% 50% 100%
EuroTrak 2018HA owners (Base: 640)
EuroTrak 2015HA owners (Base: 645)
© Anovum 2018 - EuroTrak Switzerland 2018
13.5%
25.6%
54.1%
39.1%
38.8%
17.5%
24.5%
54.2%
41.9%
41.4%
26.1%
29.9%
52.9%
43.6%
43.7%
0% 20% 40% 60%
<=44
45-64
65+
Total 18+
Total
EuroTrak 2018Base: 1'411
EuroTrak 2015Base: 1'494
EuroTrak 2012Base: 1'574

The more severe the hearing loss, the higher the adoption rate
Hearing loss 6-groups HA-non-owner, n=518HA-owner, n=784
* Construction of 6-groups: A factor analysis was performed to identify one factor “degree of hearing loss”. The following questions were included in the factor:• Number of ears impaired (one or two)• Stated hearing loss (Mild to Profound)• Scores on 6 APHAB-EC – like questions (Scaled 1-5)• When NOT using a hearing aid, how difficult is it for you to follow conversations in the presence of noiseà People were segmented into 6 groups of same size (16.67% of all hearing impaired in the sample).
13%24% 34%
49%68%
90%87%
76% 66%51%
32%10%
0%
10%
20%
30%
40%
50%
60%
70%
80%
90%
100%
1 2 3 4 5 6
Hearing aid No Hearing aid
© Anovum 2018 - EuroTrak Switzerland 2018 Page 16

Hearing loss
Hearing loss characteristics: Owners compared to non-owners
Page 17
n’s are unweighted whereas the shown results are weighted* combined “severe” and “profound” because n is too small
© Anovum 2018 - EuroTrak Switzerland 2018
HA-Non-owner n=518
HA Ownern=784
Hearing Aid Adoption (%)
Ears impaired (stated)
Unilateral loss 39% 13% 22%
Bilateral loss 61% 87% 54%
Perceived loss
Mild 51% 11% 14%
Moderate 37% 53% 53%
Severe 7% 28%71%*
Profound 4% 8%

Hearing tests and where hearing is tested
© Anovum 2018 - EuroTrak Switzerland 2018 Page 18
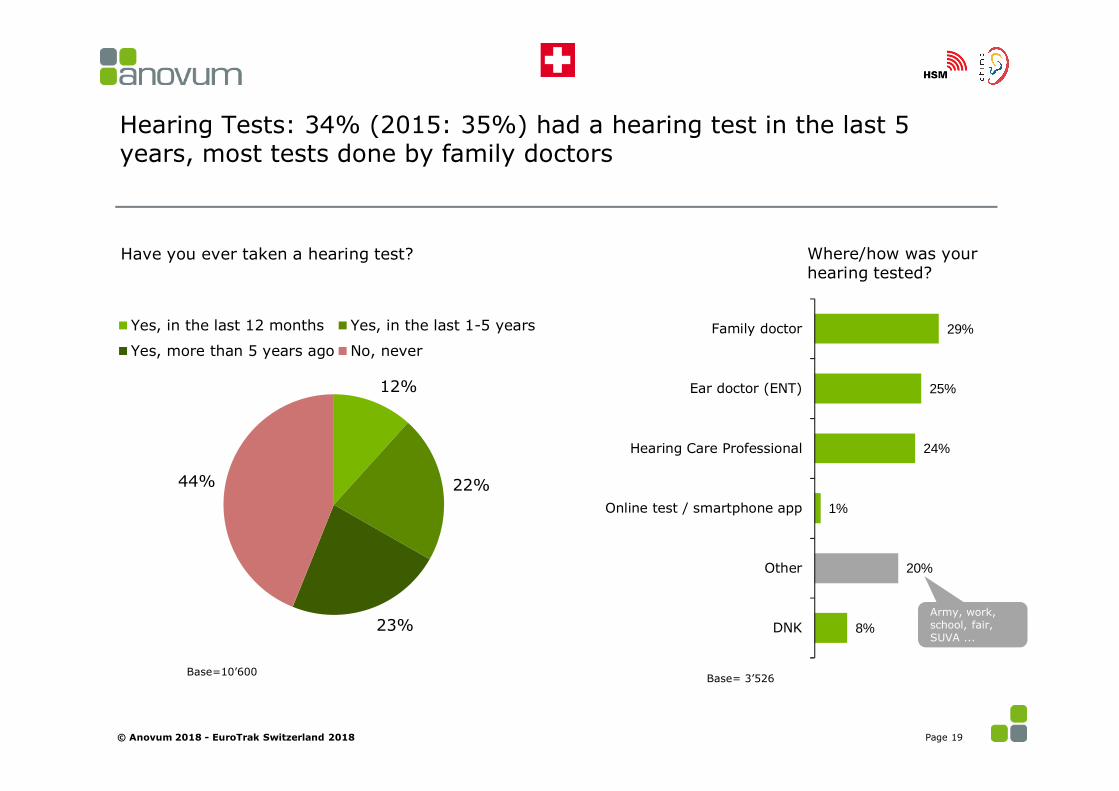
12%
22%
23%
44%
Yes, in the last 12 months Yes, in the last 1-5 years
Yes, more than 5 years ago No, never
Hearing Tests: 34% (2015: 35%) had a hearing test in the last 5 years, most tests done by family doctors
Base=10’600
© Anovum 2018 - EuroTrak Switzerland 2018
Where/how was your hearing tested?
Base= 3’526
Page 19
Have you ever taken a hearing test?
29%
25%
24%
1%
20%
8%
Family doctor
Ear doctor (ENT)
Hearing Care Professional
Online test / smartphone app
Other
DNKArmy, work, school, fair, SUVA ...

The route to the hearing aid:Sources of information and drop-out rates
© Anovum 2018 - EuroTrak Switzerland 2018 Page 20
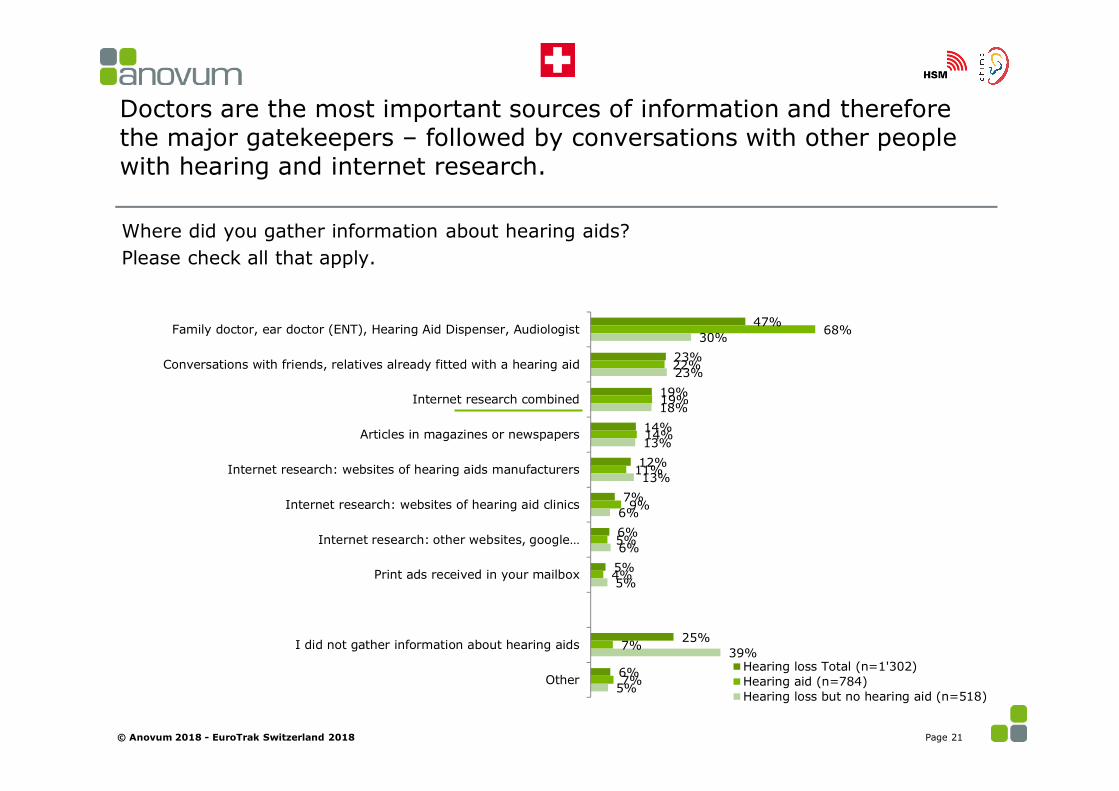
Doctors are the most important sources of information and therefore the major gatekeepers – followed by conversations with other people with hearing and internet research.
Where did you gather information about hearing aids?Please check all that apply.
© Anovum 2018 - EuroTrak Switzerland 2018
47%
23%
19%
14%
12%
7%
6%
5%
25%
6%
68%
22%
19%
14%
11%
9%
5%
4%
7%
7%
30%
23%
18%
13%
13%
6%
6%
5%
39%
5%
Family doctor, ear doctor (ENT), Hearing Aid Dispenser, Audiologist
Conversations with friends, relatives already fitted with a hearing aid
Internet research combined
Articles in magazines or newspapers
Internet research: websites of hearing aids manufacturers
Internet research: websites of hearing aid clinics
Internet research: other websites, google…
Print ads received in your mailbox
I did not gather information about hearing aids
OtherHearing loss Total (n=1'302)Hearing aid (n=784)Hearing loss but no hearing aid (n=518)
Page 21
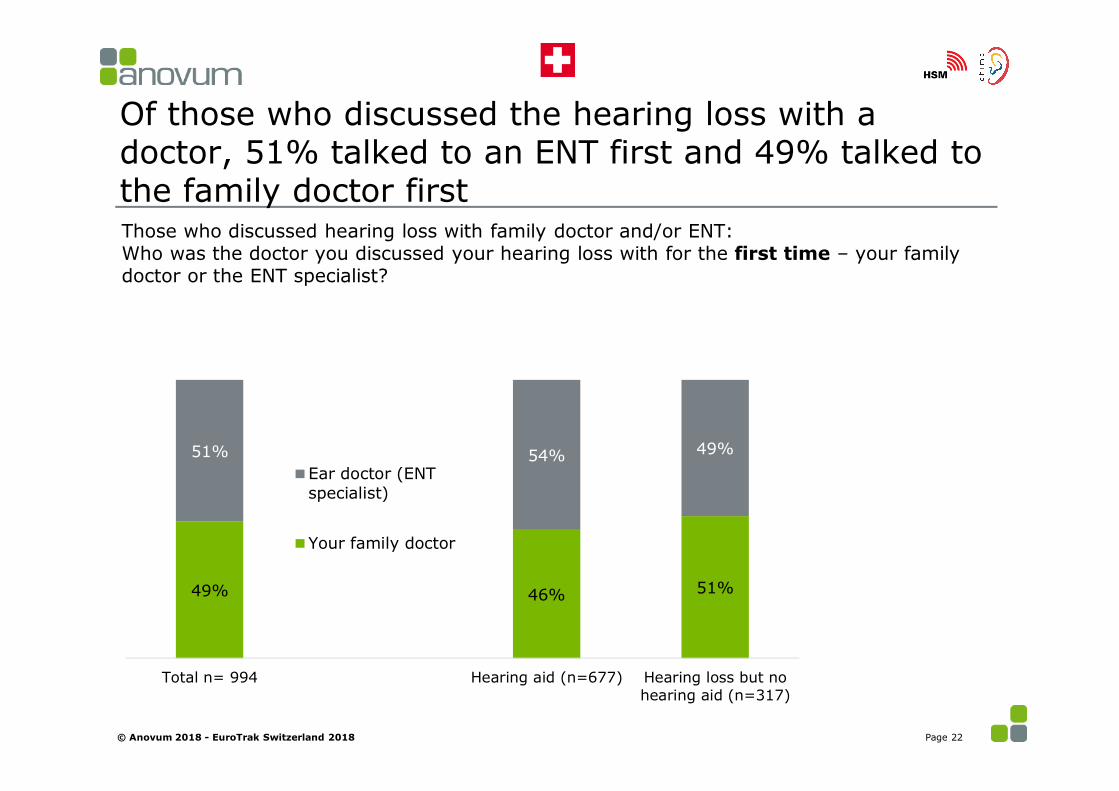
Of those who discussed the hearing loss with a doctor, 51% talked to an ENT first and 49% talked to the family doctor firstThose who discussed hearing loss with family doctor and/or ENT:Who was the doctor you discussed your hearing loss with for the first time – your family doctor or the ENT specialist?
© Anovum 2018 - EuroTrak Switzerland 2018
49% 46% 51%
51% 54% 49%
Total n= 994 Hearing aid (n=677) Hearing loss but nohearing aid (n=317)
Ear doctor (ENTspecialist)
Your family doctor
Page 22

The route to the hearing aid: Compared to 2018 drop out 1 was reduced
Base: n=1’302
© Anovum 2018 - EuroTrak Switzerland 2018 Page 23
2015: 26%
2015: 35%2015: 13%

Much higher drop-out-rates for the lower hearing loss segments
Low 50% hearing loss*
Top 50% hearing loss*
* Construction of 6-groups: A factor analysis was performed to identify one factor “degree of hearing loss”. The following questions were included in the factor:• Number of ears impaired (one or two)• Stated hearing loss (Mild to Profound)• Scores on 6 APHAB-EC – like questions (Scaled 1-5)• When NOT using a hearing aid, how difficult is it for you to follow conversations in the presence of noiseà People were segmented into 6 groups of same size (16.67% of all hearing impaired in the sample).
© Anovum 2018 - EuroTrak Switzerland 2018 Page 24
Base: n=1‘302
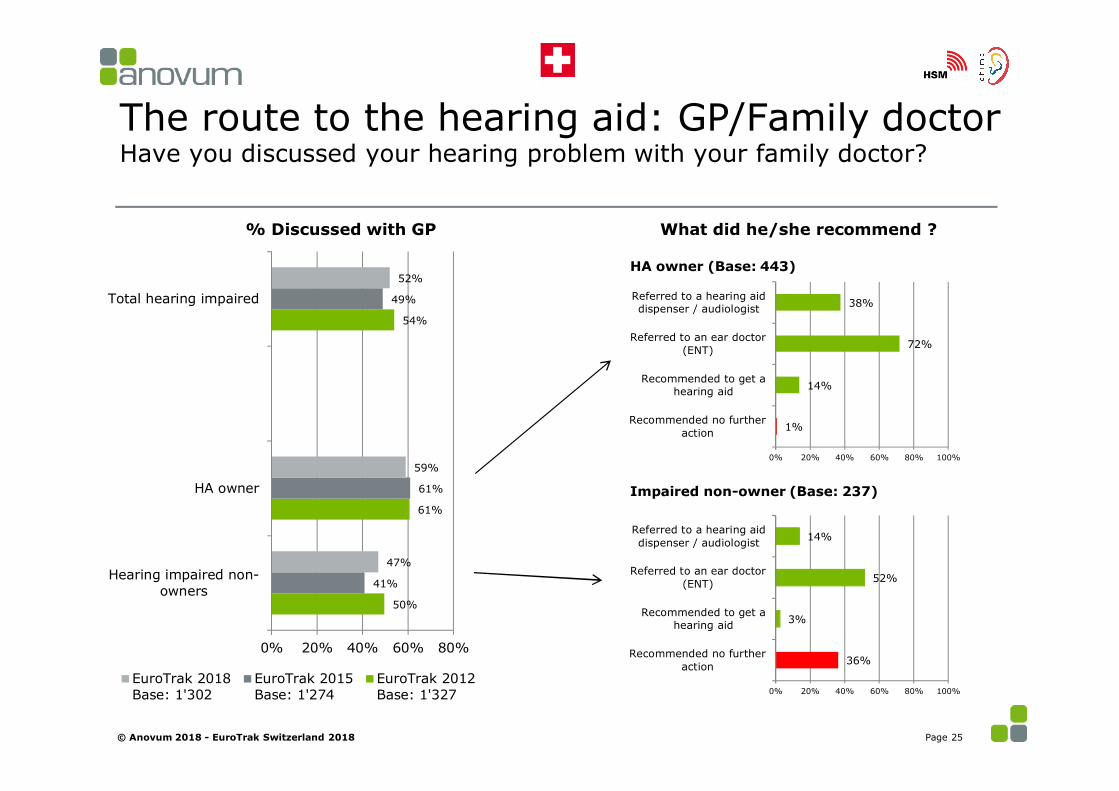
The route to the hearing aid: GP/Family doctorHave you discussed your hearing problem with your family doctor?
Page 25
50%
61%
54%
41%
61%
49%
47%
59%
52%
0% 20% 40% 60% 80%
Hearing impaired non-owners
HA owner
Total hearing impaired
EuroTrak 2018Base: 1'302
EuroTrak 2015Base: 1'274
EuroTrak 2012Base: 1'327
% Discussed with GP
38%
72%
14%
1%
0% 20% 40% 60% 80% 100%
Referred to a hearing aiddispenser / audiologist
Referred to an ear doctor(ENT)
Recommended to get ahearing aid
Recommended no furtheraction
What did he/she recommend ?
14%
52%
3%
36%
0% 20% 40% 60% 80% 100%
Referred to a hearing aiddispenser / audiologist
Referred to an ear doctor(ENT)
Recommended to get ahearing aid
Recommended no furtheraction
HA owner (Base: 443)
Impaired non-owner (Base: 237)
© Anovum 2018 - EuroTrak Switzerland 2018

The route to the hearing aid: ENTHave you discussed your hearing problem with an ear doctor (ENT)?
Page 26
50%
81%
62%
50%
84%
64%
54%
88%
69%
0% 20% 40% 60% 80%100%
Hearing impaired non-owners
HA owner
Total hearing impaired
EuroTrak 2018Base: 1'332
EuroTrak 2015Base: 1'274
EuroTrak 2012Base: 1'327
% Discussed with ENT What did he/she recommend ?
HA owner (Base: 679)
Impaired non-owner (Base: 272)
© Anovum 2018 - EuroTrak Switzerland 2018
49%
61%
3%
0% 20% 40% 60% 80% 100%
Did prescribe a hearing aid
Referred to a hearing aiddispenser / audiologist
Recommended no furtheraction
5%
23%
72%
0% 20% 40% 60% 80% 100%
Did prescribe a hearing aid
Referred to a hearing aiddispenser / audiologist
Recommended no furtheraction
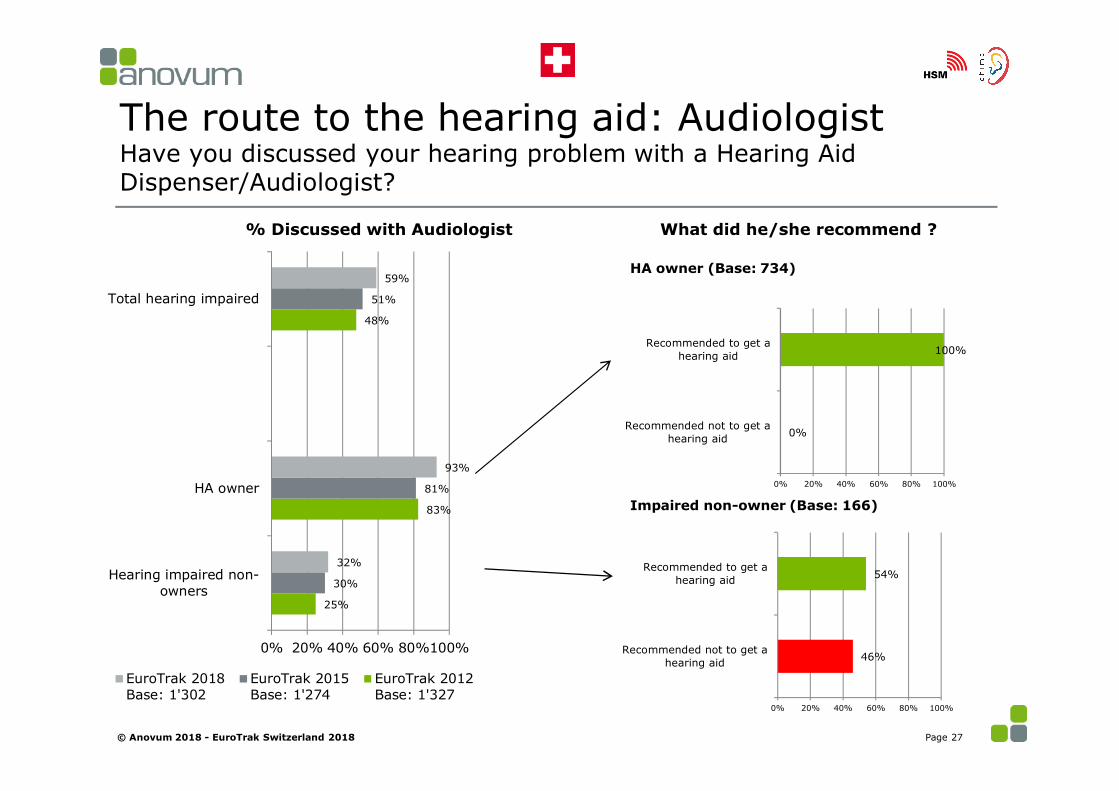
The route to the hearing aid: AudiologistHave you discussed your hearing problem with a Hearing Aid Dispenser/Audiologist?
Page 27
25%
83%
48%
30%
81%
51%
32%
93%
59%
0% 20% 40% 60% 80%100%
Hearing impaired non-owners
HA owner
Total hearing impaired
EuroTrak 2018Base: 1'302
EuroTrak 2015Base: 1'274
EuroTrak 2012Base: 1'327
% Discussed with Audiologist What did he/she recommend ?
HA owner (Base: 734)
Impaired non-owner (Base: 166)
© Anovum 2018 - EuroTrak Switzerland 2018
54%
46%
0% 20% 40% 60% 80% 100%
Recommended to get ahearing aid
Recommended not to get ahearing aid
100%
0%
0% 20% 40% 60% 80% 100%
Recommended to get ahearing aid
Recommended not to get ahearing aid

Recommendations by profession
Page 28
61%
25%
44%
8%
30%
86%
19%
34%
14%
0%
10%
20%
30%
40%
50%
60%
70%
80%
90%
100%
GP(N=680)
ENT(N=951)
Audiologist(N=900)
Referred to an ear doctor (ENT)
Referred to a hearing aid dispenser/ audiologist
Recommended to get a hearing aid
Recommended no further action
© Anovum 2018 - EuroTrak Switzerland 2018

© Anovum 2018 - EuroTrak Switzerland 2018 Page 29
Potential social cost-savings due to the use of hearing aids: Work competitiveness, depressive symptoms, sleep quality, co-morbidities
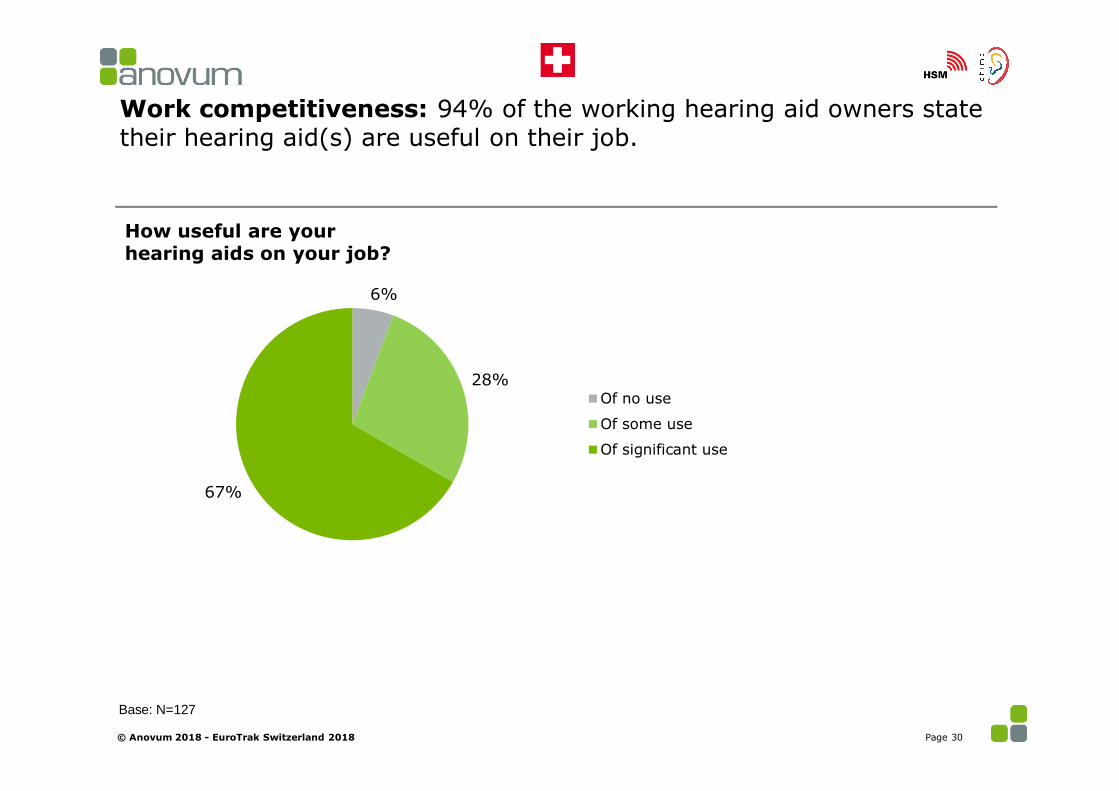
Work competitiveness: 94% of the working hearing aid owners state their hearing aid(s) are useful on their job.
6%
28%
67%
Of no use
Of some use
Of significant use
How useful are your hearing aids on your job?
Base: N=127
© Anovum 2018 - EuroTrak Switzerland 2018 Page 30
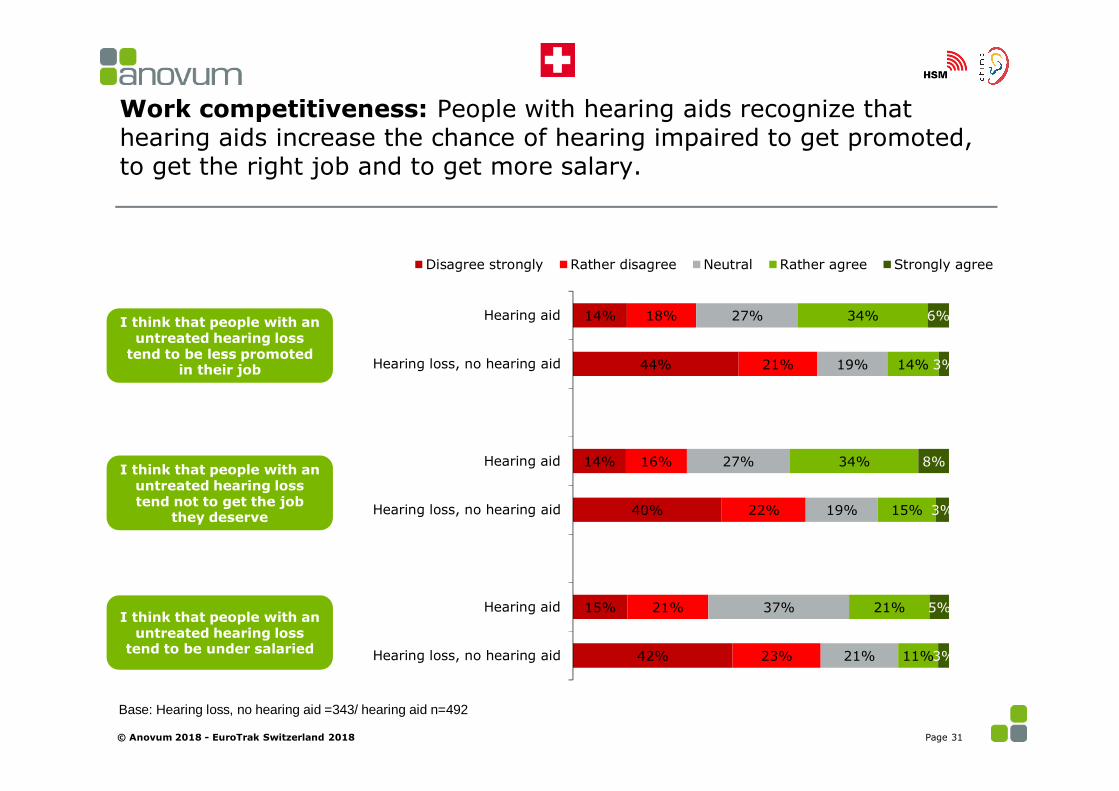
Work competitiveness: People with hearing aids recognize that hearing aids increase the chance of hearing impaired to get promoted, to get the right job and to get more salary.
14%
44%
14%
40%
15%
42%
18%
21%
16%
22%
21%
23%
27%
19%
27%
19%
37%
21%
34%
14%
34%
15%
21%
11%
6%
3%
8%
3%
5%
3%
Hearing aid
Hearing loss, no hearing aid
Hearing aid
Hearing loss, no hearing aid
Hearing aid
Hearing loss, no hearing aid
Disagree strongly Rather disagree Neutral Rather agree Strongly agree
Base: Hearing loss, no hearing aid =343/ hearing aid n=492
I think that people with an untreated hearing loss
tend to be less promoted in their job
I think that people with an untreated hearing loss tend not to get the job
they deserve
I think that people with an untreated hearing loss
tend to be under salaried
© Anovum 2018 - EuroTrak Switzerland 2018 Page 31
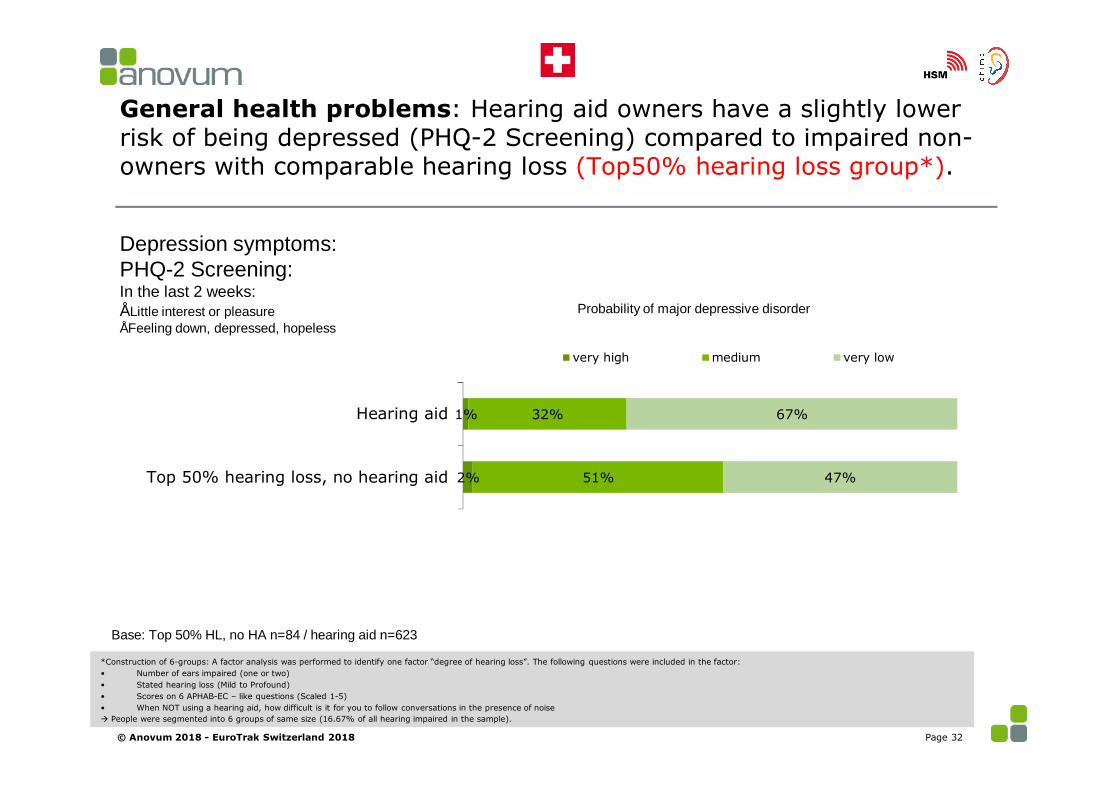
General health problems: Hearing aid owners have a slightly lower risk of being depressed (PHQ-2 Screening) compared to impaired non-owners with comparable hearing loss (Top50% hearing loss group*).
*Construction of 6-groups: A factor analysis was performed to identify one factor “degree of hearing loss”. The following questions were included in the factor:• Number of ears impaired (one or two)• Stated hearing loss (Mild to Profound)• Scores on 6 APHAB-EC – like questions (Scaled 1-5)• When NOT using a hearing aid, how difficult is it for you to follow conversations in the presence of noiseà People were segmented into 6 groups of same size (16.67% of all hearing impaired in the sample).
© Anovum 2018 - EuroTrak Switzerland 2018 Page 32
Depression symptoms:PHQ-2 Screening:In the last 2 weeks:• Little interest or pleasure• Feeling down, depressed, hopeless
Base: Top 50% HL, no HA n=84 / hearing aid n=623
2%
1%
51%
32%
47%
67%
Top 50% hearing loss, no hearing aid
Hearing aid
very high medium very low
Probability of major depressive disorder

General health problems: Compared to impaired hearing aid non-owners with significant hearing loss (Top 50% hearing loss*), hearing aid owners feel less exhausted in the evenings
Base: Top 50% HL, no HA n=84 / hearing aid n=613
21%
25%
26%
28%
32%
22%
32%
26%
20%
10%
21%
15%
22%
35%
17%
20%
5%
8%
4%
11%
Hearing aid
Top 50% hearing loss, no hearing aid
Hearing aid
Top 50% hearing loss, no hearing aid
Disagree strongly Rather disagree Neutral Rather agree Strongly agree
In the evenings I often feel physically exhausted
In the evenings I often feel mentally exhausted
*Construction of 6-groups: A factor analysis was performed to identify one factor “degree of hearing loss”. The following questions were included in the factor:• Number of ears impaired (one or two)• Stated hearing loss (Mild to Profound)• Scores on 6 APHAB-EC – like questions (Scaled 1-5)• When NOT using a hearing aid, how difficult is it for you to follow conversations in the presence of noiseà People were segmented into 6 groups of same size (16.67% of all hearing impaired in the sample).
© Anovum 2018 - EuroTrak Switzerland 2018 Page 33
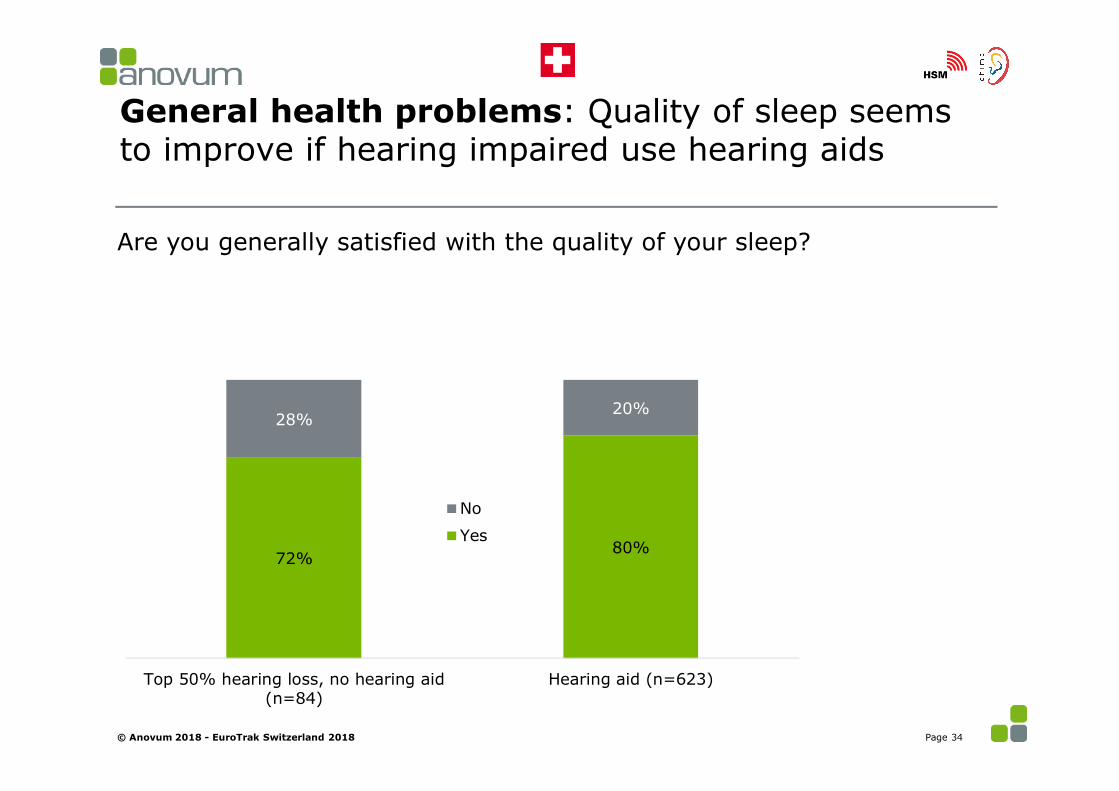
General health problems: Quality of sleep seems to improve if hearing impaired use hearing aids
72%80%
28%20%
Top 50% hearing loss, no hearing aid(n=84)
Hearing aid (n=623)
No
Yes
© Anovum 2018 - EuroTrak Switzerland 2018
Are you generally satisfied with the quality of your sleep?
Page 34

34% of all hearing impaired think that hearing loss could be linked to depression.
Please tick all of the health issues below which you think could be linked to one’s hearing loss.
Hearing impaired, N=1’302
© Anovum 2018 - EuroTrak Switzerland 2018 Page 35
56%
3%
4%
5%
9%
10%
16%
34%
Hearing loss is not linked to any of those healthissues
Back problems
Diabetes
Poor eyesight
High blood pressure
Dementia
Sleeping disorder
Depression

3. Analysis of hearing aid owners
© Anovum 2018 - EuroTrak Switzerland 2018 Page 36
© Anovum 2018 - EuroTrak Switzerland 2018 Page 37
Hearing aid ownership, awareness of hearing loss before getting hearing aids, lifetime of hearing aids and usage

4% 12%
29% 5%
Low adoption rates within mild and moderate hearing loss
Profound
Severe
Moderate
Adoption rate %
(6%)
(16%)
(44%)
(% of impaired population*)
Sums can differ from 100% due to rounding* combined “severe” and “profound” because n is too small
Stated hearing loss
21% 23%
(34%)Mild
Base: n=1’302
2% 4%
© Anovum 2018 - EuroTrak Switzerland 2018
2018
Page 38
52%
Adoption rate %
15%
63%*
2015
50%
14%
68%*
2012
53%
14%
71%*
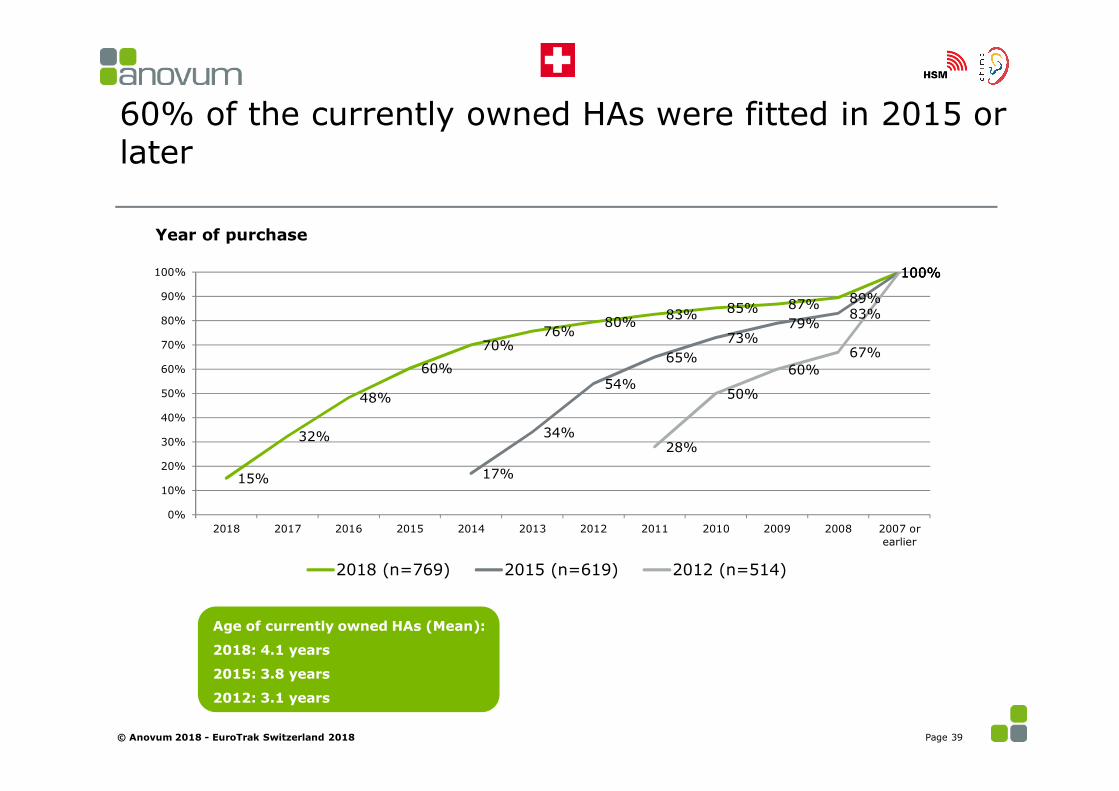
60% of the currently owned HAs were fitted in 2015 or later
Age of currently owned HAs (Mean):
2018: 4.1 years
2015: 3.8 years
2012: 3.1 years
Page 39
15%
32%
48%
60%
70%76%
80% 83% 85% 87% 89%
100%
17%
34%
54%
65%73%
79%83%
100%
28%
50%
60%67%
100%
0%
10%
20%
30%
40%
50%
60%
70%
80%
90%
100%
2018 2017 2016 2015 2014 2013 2012 2011 2010 2009 2008 2007 orearlier
2018 (n=769) 2015 (n=619) 2012 (n=514)
Year of purchase
© Anovum 2018 - EuroTrak Switzerland 2018

On average 2-3 years pass between becoming aware of the hearing loss and the purchase of hearing aids. Hearing aids are used for 6 years before they are being replaced.
51%
49%Yes
No
9% 48% 28% 14%
1-3 years 4-6 years 7-10 years 11 years or longer
Age of HA before it has been replaced:2018: 6 years (median)2015: 6 years (median)
Base: n=377
HA-owner, n=784
© Anovum 2018 - EuroTrak Switzerland 2018
20% 23% 21% 20% 16%
1 year 2 years 3 years 4-6 years more than 6 years
Base: n=346
Page 40
2015: 57%
Current HAs = first HAs?
Thinking back before you purchased your first hearing aid: How many years have passed since you became aware of your hearing loss until you purchased a hearing aid?
How many years did you own your previous HAs?
7%
78%
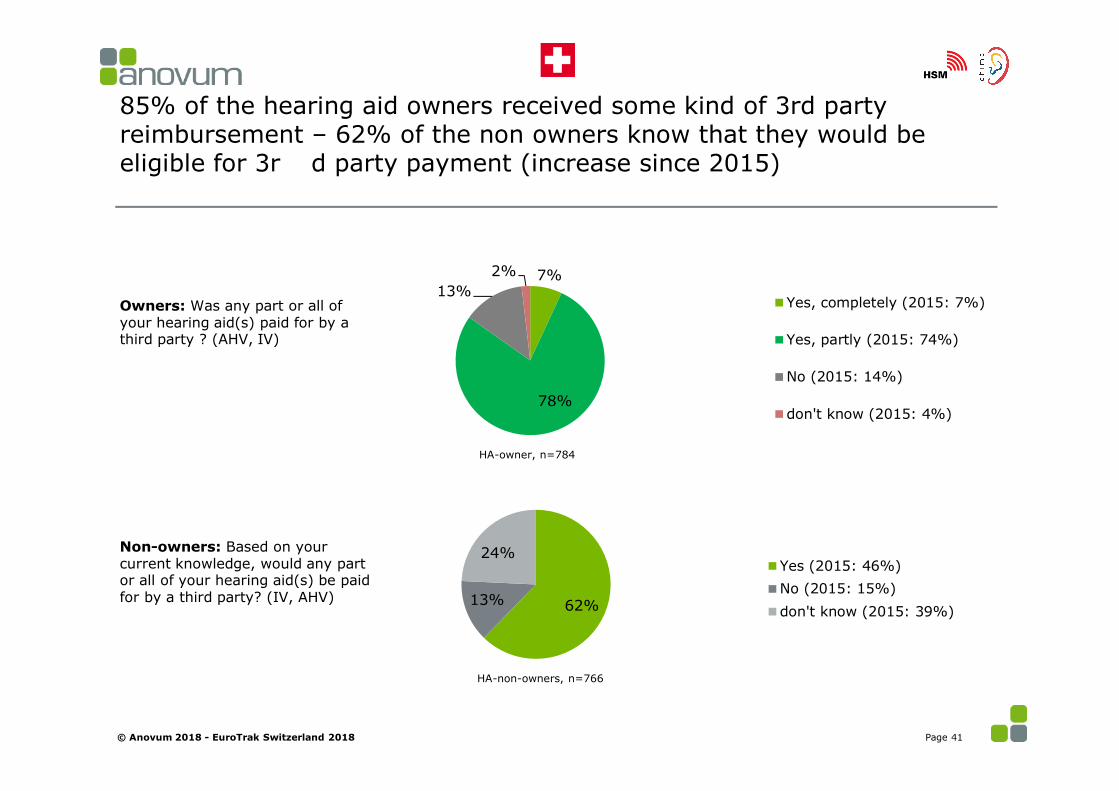
13%2%
Yes, completely (2015: 7%)
Yes, partly (2015: 74%)
No (2015: 14%)
don't know (2015: 4%)
62%13%
24%Yes (2015: 46%)No (2015: 15%)don't know (2015: 39%)
85% of the hearing aid owners received some kind of 3rd party reimbursement – 62% of the non owners know that they would be eligible for 3r d party payment (increase since 2015)
Page 41
HA-owner, n=784
HA-non-owners, n=766
© Anovum 2018 - EuroTrak Switzerland 2018
Owners: Was any part or all ofyour hearing aid(s) paid for by a third party ? (AHV, IV)
Non-owners: Based on your current knowledge, would any part or all of your hearing aid(s) be paid for by a third party? (IV, AHV)

More than 1 out of 3 HA owners think they should have gotten their HAs sooner! Main reason is missing out on social life.
Thinking back before you obtained your first hearing aid(s): do you think, you should have gotten them sooner?
37%
63%
Yes
No
Base: n=212
HA-owner, n=784
© Anovum 2018 - EuroTrak Switzerland 2018
IF YES:What are the reasons why you think you should have gotten your hearing aid(s) sooner? What are the opportunities you think you have missed because of this?Please tick all that apply
Page 42
10%
24%
30%
38%
71%
Other opportunity
Less fatigue in the evening
Better performance at work
Better mental/emotional health
Better social life

Specialized hearing aid store is by far the preferred place for obtaining hearing aids (both for owners and non owners).
OWNERS:Where was your most current hearing aid obtained?
HA-owner, n=784
© Anovum 2018 - EuroTrak Switzerland 2018
NON OWNERS:If you were to get hearing aids, where would you go?
Page 43
2%
0%
0%
1%
3%
3%
91%
Other
Department store
Club store
Online
Pharmacy
Optician
Specialized hearing aid store
HA-non-owner, n=518
4%
0%
1%
2%
3%
3%
88%
Other
Department store
Club store
Online
Pharmacy
Optician
Specialized hearing aid store

Recommendation intention of the place where the hearing aid(s) have been obtained is good, with a positive NPS score of 33.
© Anovum 2018 - EuroTrak Switzerland 2018 Page 44
0=not at all likely 10=extremely likely
3% 1% 2% 2% 1%8% 5% 8%
14% 16%
40%
0 1 2 3 4 5 6 7 8 9 10
Considering your complete experience, how likely would you be to recommend the place where you obtained your hearing aids to a friend or colleague?
NPS = PROMOTERS – DETRACTORS = 33
DETRACTORS23%
PASSIVES22%
PROMOTERS56%
HA-owner, n=784
5%
8%
3% 2%
4% 3%
5%
2%
9%
2%
8%
1%
13%
3%
8%
12%11%
1% 2%0%
2%
4%
6%
8%
10%
12%
14%
16%
18%
20%
5%
13% 16% 18%21%
24%29% 31%
40% 42%
50% 51%
64% 66%
74%
86%
97% 98%
0%
10%
20%
30%
40%
50%
60%
70%
80%
90%
100%
0 1.0 2.0 3.0 4.0 5.0 6.0 7.0 8.0 9.0 10.0 11.0 12.0 13.0 14.0 15.0 16.0 17.0 18+
2018 2015 2012
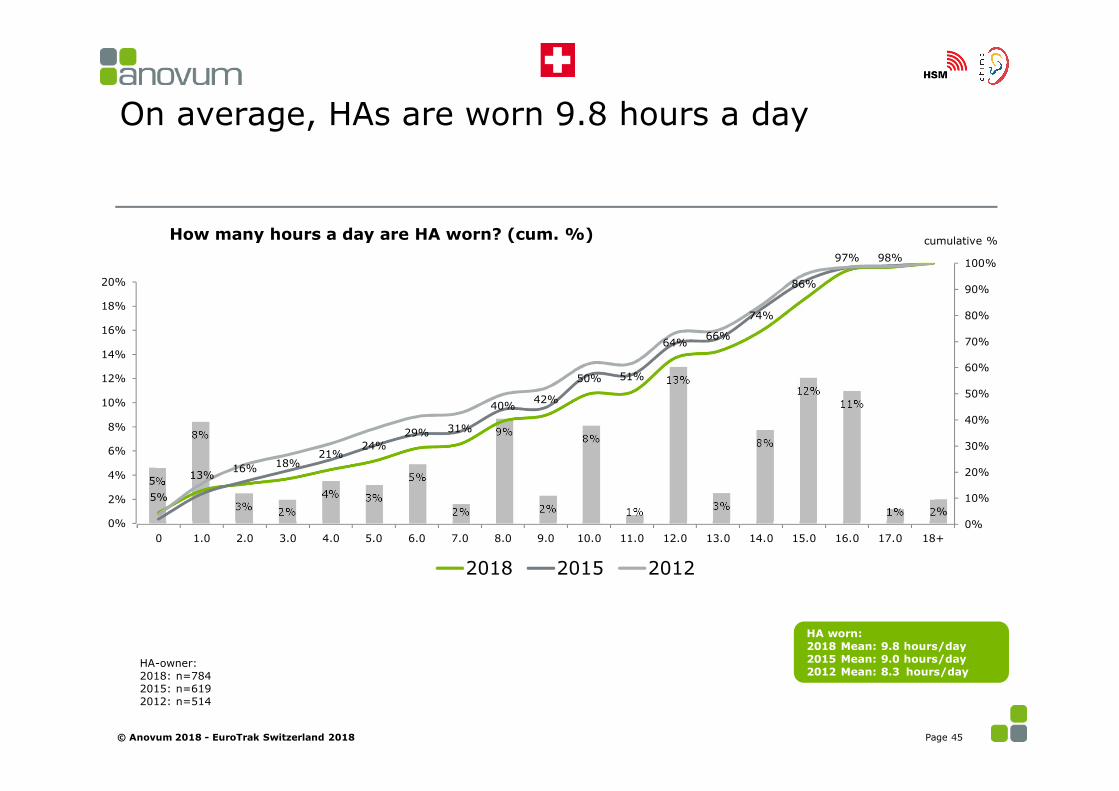
On average, HAs are worn 9.8 hours a day
How many hours a day are HA worn? (cum. %)
© Anovum 2018 - EuroTrak Switzerland 2018 Page 45
cumulative %
HA worn:2018 Mean: 9.8 hours/day2015 Mean: 9.0 hours/day2012 Mean: 8.3 hours/day
HA-owner:2018: n=7842015: n=6192012: n=514

68% of today’s hearing aid owners are aware of their hearing aid brand.
68%
27%
5%
Yes, I know it byheart
No, but I couldfind out
No, and can't findout
Are you aware of the brand of your hearing aid(s)?
Base: N=784
© Anovum 2018 - EuroTrak Switzerland 2018 Page 46
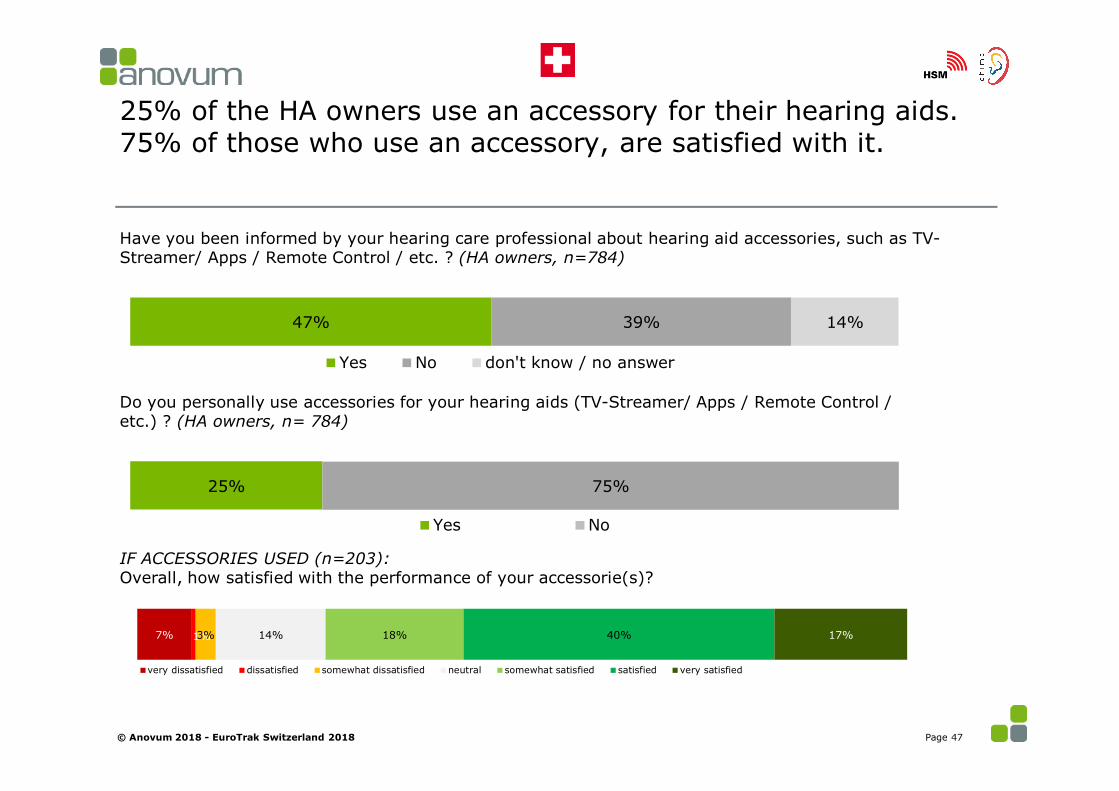
25% of the HA owners use an accessory for their hearing aids. 75% of those who use an accessory, are satisfied with it.
© Anovum 2018 - EuroTrak Switzerland 2018
47% 39% 14%
Yes No don't know / no answer
Have you been informed by your hearing care professional about hearing aid accessories, such as TV-Streamer/ Apps / Remote Control / etc. ? (HA owners, n=784)
Page 47
25% 75%
Yes No
Do you personally use accessories for your hearing aids (TV-Streamer/ Apps / Remote Control / etc.) ? (HA owners, n= 784)
7% 1%3% 14% 18% 40% 17%
very dissatisfied dissatisfied somewhat dissatisfied neutral somewhat satisfied satisfied very satisfied
IF ACCESSORIES USED (n=203):Overall, how satisfied with the performance of your accessorie(s)?
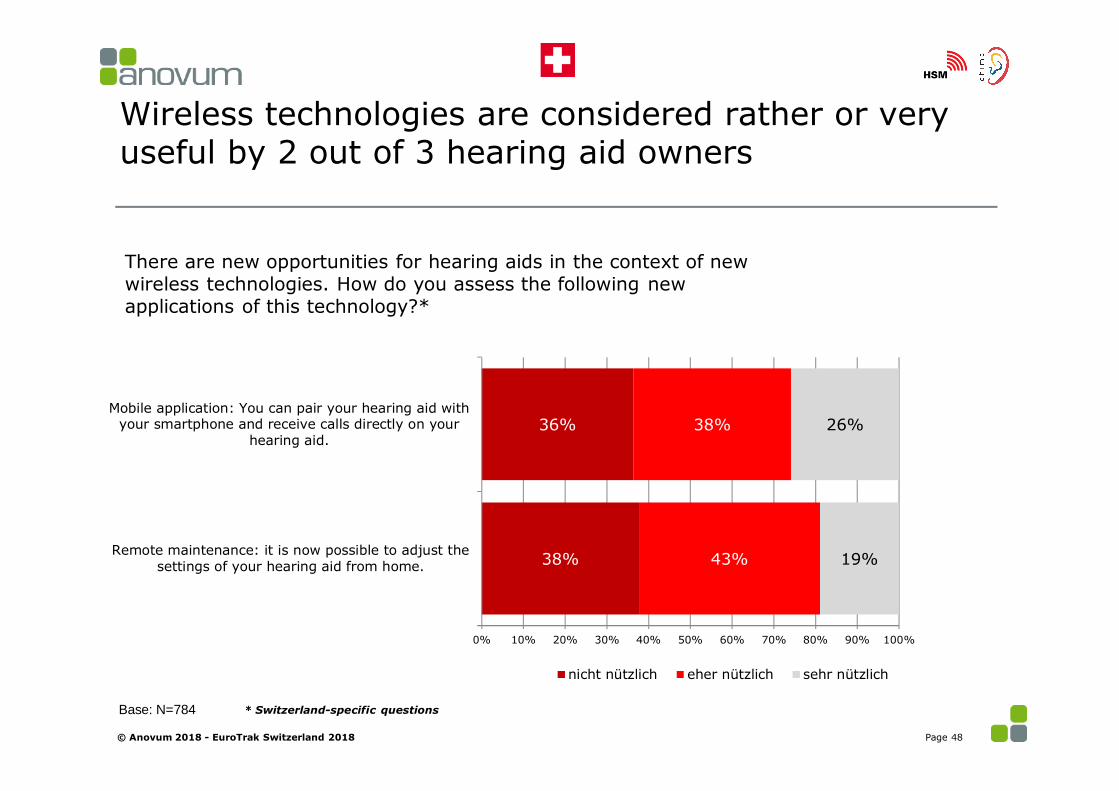
Wireless technologies are considered rather or very useful by 2 out of 3 hearing aid owners
There are new opportunities for hearing aids in the context of new wireless technologies. How do you assess the following new applications of this technology?*
Base: N=784
© Anovum 2018 - EuroTrak Switzerland 2018 Page 48
38%
36%
43%
38%
19%
26%
0% 10% 20% 30% 40% 50% 60% 70% 80% 90% 100%
Remote maintenance: it is now possible to adjust thesettings of your hearing aid from home.
Mobile application: You can pair your hearing aid withyour smartphone and receive calls directly on your
hearing aid.
nicht nützlich eher nützlich sehr nützlich
* Switzerland-specific questions

Satisfaction with hearing aids and drivers
© Anovum 2018 - EuroTrak Switzerland 2018 Page 49

80% of the hearing aid owners say their hearing aid works better than or as expected
21%
59%
20%
hearing aids work betterthan I expected
hearing aids work as Iexpected
hearing aids work worsethan I expected
How have the expectations you had towards hearing aids before trying them on for the first time been met?
Base: N=784
© Anovum 2018 - EuroTrak Switzerland 2018 Page 50
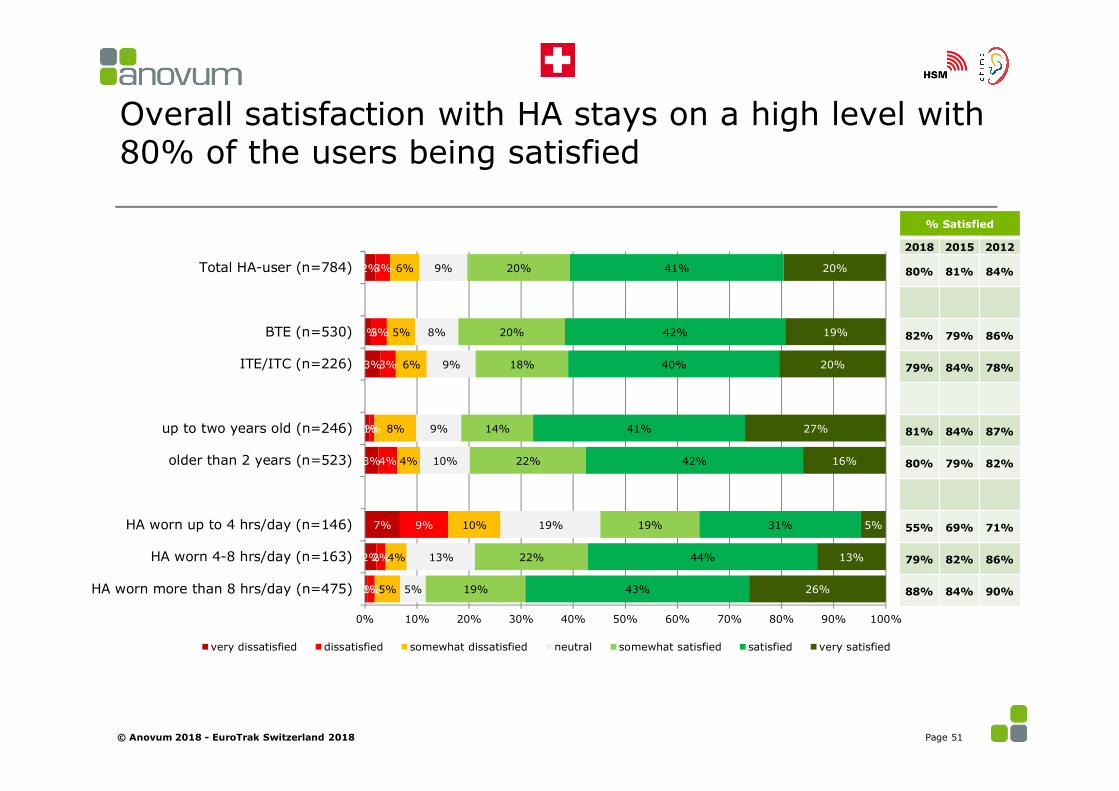
Overall satisfaction with HA stays on a high level with 80% of the users being satisfied
© Anovum 2018 - EuroTrak Switzerland 2018 Page 51
1%
2%
7%
3%
1%
3%
1%
2%
1%
2%
9%
4%
1%
3%
3%
3%
5%
4%
10%
4%
8%
6%
5%
6%
5%
13%
19%
10%
9%
9%
8%
9%
19%
22%
19%
22%
14%
18%
20%
20%
43%
44%
31%
42%
41%
40%
42%
41%
26%
13%
5%
16%
27%
20%
19%
20%
0% 10% 20% 30% 40% 50% 60% 70% 80% 90% 100%
HA worn more than 8 hrs/day (n=475)
HA worn 4-8 hrs/day (n=163)
HA worn up to 4 hrs/day (n=146)
older than 2 years (n=523)
up to two years old (n=246)
ITE/ITC (n=226)
BTE (n=530)
Total HA-user (n=784)
very dissatisfied dissatisfied somewhat dissatisfied neutral somewhat satisfied satisfied very satisfied
% Satisfied
2018 2015 2012
80% 81% 84%
82% 79% 86%
79% 84% 78%
81% 84% 87%
80% 79% 82%
55% 69% 71%
79% 82% 86%
88% 84% 90%

Overall Satisfaction with HA: Country comparison
© Anovum 2018 - EuroTrak Switzerland 2018 Page 52
UK Bel-gium
Nether-lands Poland France Switzer
-landDen-mark Norway Italy Japan
Overall satisfaction 2012
72% - - - 80% 84% 70% 72% 70% 36%
Overall satisfaction 2015/16/17
70% 80% 73% 80% 84% 81% 71% - 79% 39%
Overall satisfaction 2018
74% 82% 80% 81% 38%

Satisfaction with current hearing aids I
5%
6%
7%
5%
10%
9%
10%
13%
7%
4%6%
7%
9%
22%
24%
91%
90%
90%
89%
78%
78%
76%
69%
90%
89%
88%
86%
78%
64%
57%
-100%-80% -60% -40% -20% 0% 20% 40% 60% 80% 100%
Professionalism of HCP
Quality of service during hearing aid fitting period
Quality of dispensers counseling
Quality of service after purchase
Clearness of tone and sound
Natural sounding
Richness or fidelity of sound
Comfort with loud sounds
Ease of changing battery
Visibility to others
Reliability
Overall fit/ Comfort
Managing whistling/feedback/buzzing
Battery life
Value (performance versus money spent)
dissatisfied satisfied HA-owner, n=784
HCP
Sound quality signal process.
Product features
%dissatisfied= % very dissatisfied + % dissatisfied + % somewhat dissatisfied %satisfied= % somewhat satisfied + % satisfied + % very satisfied
© Anovum 2018 - EuroTrak Switzerland 2018
Trend*
+1%-3%+2%-6%
-3%-5%-2%-4%
-2%-1%-3%-3%+0%-2%+0%
Page 53
* % of satisfied HA owners compared to EuroTrak 2015

Satisfaction with current hearing aids II
6%
6%
7%
7%
8%
10%
9%8%
9%
12%
12%
11%
9%
12%
17%
20%
22%
90%
87%
86%
85%
82%
82%
81%
81%
77%
76%
76%
73%
73%
68%
68%
67%
62%
,100% ,80% ,60% ,40% ,20% ,0% ,20% ,40% ,60% ,80%,100%
Conversation with one Person
At home with family members
Outdoors
In a store, when shopping
Conversation in small groups
When riding in a car
Listening to Music
When talking to children
Leisure activities
On the telephone
Watching TV
At a movie theater
In the workplace
In school or a classroom (as an observer or student)
In a larger lecture hall (e.g., theater, concert hall,…
Conversation in large groups
Use in noisy situations
disatisfied satisfied HA-owner, n=784
%dissatisfied= % very dissatisfied + % dissatisfied + % somewhat dissatisfied %satisfied= % somewhat satisfied + % satisfied + % very satisfied
© Anovum 2018 - EuroTrak Switzerland 2018
Trend*
+2%-2%-2%-1%-2%-5%+0%-2%-1%+2%+1%-7%-6%-4%+6%+1%+3%
Listening situation
Page 54
* % of satisfied HA owners compared to EuroTrak 2015
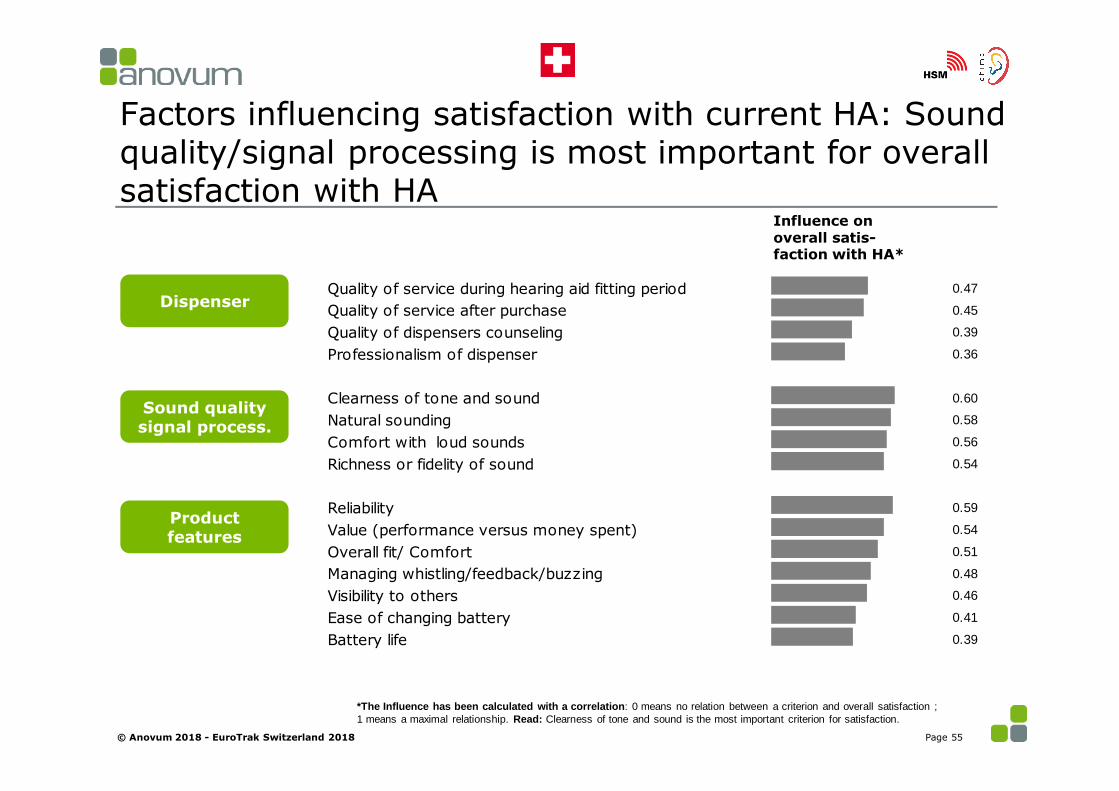
Factors influencing satisfaction with current HA: Sound quality/signal processing is most important for overall satisfaction with HA
Dispenser
Sound quality signal process.
Product features
*The Influence has been calculated with a correlation: 0 means no relation between a criterion and overall satisfaction ;1 means a maximal relationship. Read: Clearness of tone and sound is the most important criterion for satisfaction.
Influence on overall satis-faction with HA*
© Anovum 2018 - EuroTrak Switzerland 2018 Page 55
Quality of service during hearing aid fitting period 0.47
Quality of service after purchase 0.45
Quality of dispensers counseling 0.39
Professionalism of dispenser 0.36
Clearness of tone and sound 0.60
Natural sounding 0.58
Comfort with loud sounds 0.56
Richness or fidelity of sound 0.54
Reliability 0.59
Value (performance versus money spent) 0.54
Overall fit/ Comfort 0.51
Managing whistling/feedback/buzzing 0.48
Visibility to others 0.46
Ease of changing battery 0.41
Battery life 0.39

Important listening situations
In which of these situations is it most important for you to hear well? (choose up to 5)
© Anovum 2018 - EuroTrak Switzerland 2018
55%
51%
47%
44%
43%
39%
30%
27%
22%
21%
15%
15%
8%
8%
8%
7%
6%
At home with family membersIn conversations with 1 person
In conversations with small groupsIn conversations with large groups
When talking on a phoneIn a larger lecture hall (e.g., theater, concert hall, place of…
When watching TV with othersIn noisy situations
In the workplaceWhen listening to musicWhen talking to children
When riding in a carDuring leisure activities (e.g., exercising, taking a walk, etc.)
In a store, when shoppingOutdoors
In school or a classroom (as an observer or student)At a movie theater
Hearing loss Total (n=1'302)Hearing aid (n=784)Hearing loss but no hearing aid (n=518)
Page 56

Positive impact of hearing aids, quality of life
© Anovum 2018 - EuroTrak Switzerland 2018 Page 57

Significant positive impact of HAs on different aspects: Especially communication effectiveness, participating in group activities, social life, sense of safety and relationships at work improve with hearing aids.
HA-owner, n=784
2%
2%
4%
3%
2%
4%
2%
1%
4%
4%
5%
4%
70%
62%
54%
55%
53%
49%
50%
47%
42%
38%
29%
23%
19%
24%
29%
28%
32%
32%
34%
35%
36%
42%
50%
55%
9%
12%
13%
14%
12%
15%
14%
17%
18%
16%
15%
18%
0% 10% 20% 30% 40% 50% 60% 70% 80% 90% 100%
Physical health
Mental ability
Feelings about yourself
Confidence in yourself
Mental/emotional health
Sense of independence
Relationships at home
Relationships at work
Sense of safety
Social life
Ability to participate in group activities
Overall ability to communicate more effectively in most…
a lot worse worse the same better a lot better
© Anovum 2018 - EuroTrak Switzerland 2018 Page 58
Since you started using your hearing aid(s), please rate the changes you have experienced in each of the following areas, that you believe are due to your hearing aid(s).

Impact of HAs is perceived more positive by patients with a Top 50% hearing loss in all aspects
67%
58%
45%40% 38% 36% 38% 39%
31% 30%25% 23%
73%67%
61%57% 56%
51% 50%45% 45% 46%
39%
30%
0%
10%
20%
30%
40%
50%
60%
70%
80%
90%
100%
Low 50% hearing loss (n=193) Top 50% hearing loss (n=529)
% of HA owners feeling better/a lot better
© Anovum 2018 - EuroTrak Switzerland 2018 Page 59

2 out of 3 hearing aid owners feel more confident moving in a city since wearing hearing aids!
63%
37% Yes
No
Since wearing a hearing aid, do you feel more confident moving in a city, e.g. because you hear traffic signals/vehicles approaching?
Base: N=784
© Anovum 2018 - EuroTrak Switzerland 2018 Page 60

Even for other people in the household/relatives, the situation improves when the person with hearing loss starts wearing hearing aids
Someone in HH / parent has HA, n=521
4%
3%
4%
5%
74%
75%
58%
35%
14%
13%
24%
38%
7%
9%
12%
19%
0% 10% 20% 30% 40% 50% 60% 70% 80% 90% 100%
Quarrels/disputes with Person
Personal relationship with Person
Social activities together with Person
Communication with Person
a lot worse worse the same better a lot better
How did the following aspects change since person X is wearing hearing aids?
© Anovum 2018 - EuroTrak Switzerland 2018 Page 61

98% of hearing aid owners declare that their hearing aids improve their quality of life at least sometimes
2% 8%
30%
60%
Never
Rarely
Occasionally
Regularly
How often do your hearing aids improve your quality of life?
Base: N=784
© Anovum 2018 - EuroTrak Switzerland 2018 Page 62

4. Analysis of hearing impaired non-owners
© Anovum 2018 - EuroTrak Switzerland 2018 Page 63

To analyse reasons of non-adoption we look at the Top 50% HL group, as the structure of hearing loss is more similar to that of HA owners
HA Owner2018: n=784
HA-Non-owner Low 50% HL n=308
HA Non-owner Top 50% HLn=114
Ears impaired
Unilateral loss 13% 44% 29%Bilateral loss 87% 56% 71%
Perceived loss
Mild 11% 61% 22%Moderate 53% 32% 53%Severe 28% 4% 16%Profound 8% 3% 9%
Hearing loss characteristics: Owners compared to non-owners
More similar hearing loss-structure
© Anovum 2018 - EuroTrak Switzerland 2018 Page 64

Top 10 reasons for not having a hearing aid (I/II)
Base: non owners Top 50% HL: n=114
28%
22%
26%
20%
31%
30%
31%
38%
37%
32%
9%
16%
14%
19%
15%
17%
20%
12%
27%
35%
63%
61%
60%
60%
54%
53%
50%
50%
36%
33%
0% 10% 20% 30% 40% 50% 60% 70% 80% 90% 100%
Family doctors opinion (GP)
Hearing Aid Dispenser/Audiologists opinion
They do not restore your hearing to normal
Have more serious priorities
Uncomfortable
Cannot afford a hearing aid
They do not work well in noisy situations
Ear doctors opinion (ENT)
Hearing loss not severe enough
Hear well enough in most situations
Reason Somewhat a reason Not a reason
© Anovum 2018 - EuroTrak Switzerland 2018 Page 65

Less important reasons for not having a hearing aid (II/II)
7%
6%
6%
10%
17%
11%
10%
20%
14%
17%
10%
11%
23%
19%
21%
30%
26%
1%
5%
10%
7%
3%
10%
13%
5%
13%
11%
18%
18%
8%
15%
15%
6%
10%
92%
89%
84%
83%
80%
79%
77%
75%
73%
72%
71%
71%
69%
66%
64%
63%
63%
0% 10% 20% 30% 40% 50% 60% 70% 80% 90% 100%
Do not know where to get hearing aidsHad surgery - hearing aids wont help
I have vision or dexterity problemsDo not trust Hearing Aid Dispenser/Audiologist
Hearing problem requires surgeryHave not had hearing tested yet
Have hearing loss only with low frequency soundsHave tried hearing aid and they do not work
Social / Family opinion such as child, spouse, friendDo not admit I have a hearing loss in public
Another hearing aid owners opinionBad design
Would be embarrassed to wear a hearing aidHave hearing loss in only one ear
Have hearing loss only with high pitch soundsHave Sensor-neural hearing loss (nerve deafness)
Have tinnitus (ringing in ears)
Reason Somewhat a reason Not a reason
Base: non owners Top 50% HL: n=114
© Anovum 2018 - EuroTrak Switzerland 2018 Page 66
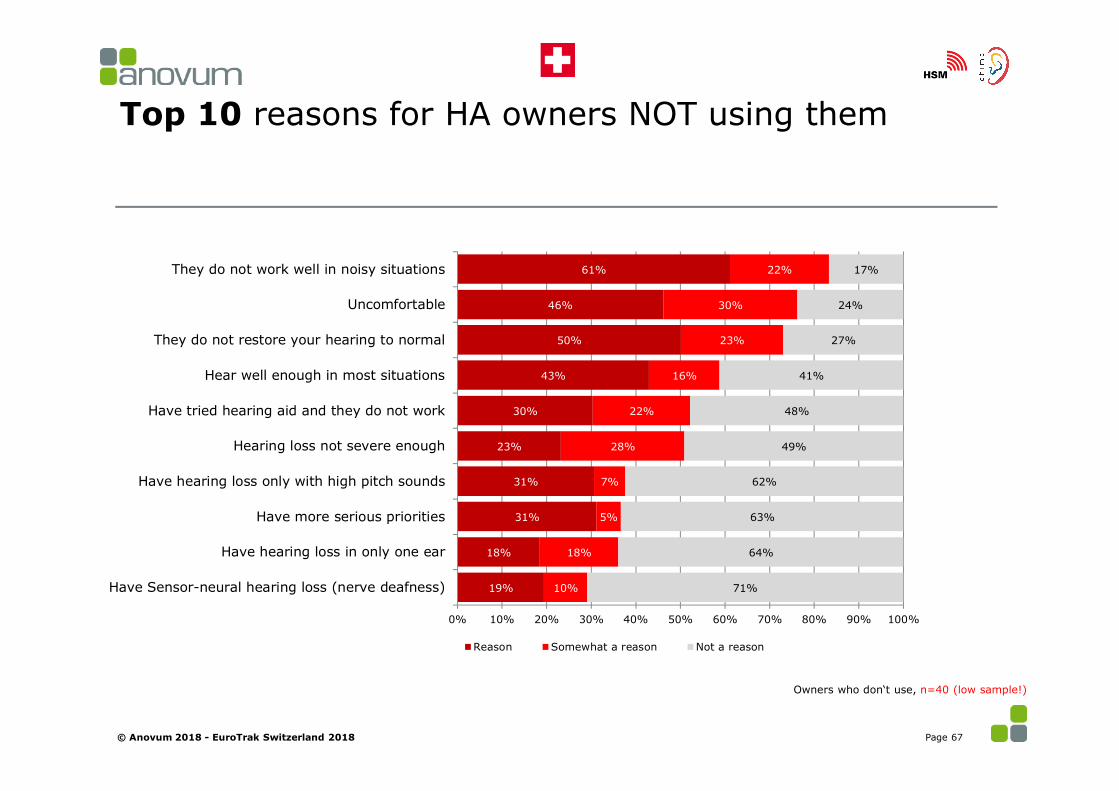
Top 10 reasons for HA owners NOT using them
Owners who don‘t use, n=40 (low sample!)
19%
18%
31%
31%
23%
30%
43%
50%
46%
61%
10%
18%
5%
7%
28%
22%
16%
23%
30%
22%
71%
64%
63%
62%
49%
48%
41%
27%
24%
17%
0% 10% 20% 30% 40% 50% 60% 70% 80% 90% 100%
Have Sensor-neural hearing loss (nerve deafness)
Have hearing loss in only one ear
Have more serious priorities
Have hearing loss only with high pitch sounds
Hearing loss not severe enough
Have tried hearing aid and they do not work
Hear well enough in most situations
They do not restore your hearing to normal
Uncomfortable
They do not work well in noisy situations
Reason Somewhat a reason Not a reason
© Anovum 2018 - EuroTrak Switzerland 2018 Page 67

© Anovum 2018 - EuroTrak Switzerland 2018 Page 68
Social rejection because of hearing loss compared to the acceptance of hearing aids

87% of hearing aid owners feel that people never make fun of or reject them because of their hearing aids. It is more likely somebody makes fun or rejects a hearing impaired without hearing aids.
87%
7%5%1%
Never
Rarely
Occasionally
Regularly
Hearing aid owners:How often do you feel you are made fun of or rejected because you are wearing a hearing aid?
Base: N=784
© Anovum 2018 - EuroTrak Switzerland 2018
Hearing impaired non-owners:How often do you feel you are made fun of or rejected because your hearing loss?
Base: Top 50% hearing loss, no hearing aid N=114
48%
36%
15%1%
Page 69

Most important triggers to buy
© Anovum 2018 - EuroTrak Switzerland 2018 Page 70

The most important influencing factors are worsening hearing loss, ENT, GP and significant others (and: price for non owners)
Non-owner: Think about the option to obtain / purchase a hearing aid. What do you think would influence you to obtain / purchase a hearing aid ?
Owner: Thinking back to when you obtained your first hearing aid(s), what influenced you to obtain /purchase the hearing aid(s)?
62%45%
42%44%
21%21%
5%7%
17%11%
9%3%4%
7%6%
3%3%
3%2%3%
1%1%
0%0%0%
74%51%
44%37%36%
33%41%
35%26%
19%14%14%
11%8%
7%4%
2%2%2%
1%3%
1%2%2%
0%
Hearing loss gest/got worseENT/ Ear Doctor
SpouseHörgeräteakustiker / Audiologist
GP /Family doctorAnother hearing aid owner (word of mouth)
Free due to coverage by Insurance / Received hearing aid…Price of hearing aid
Relative, friendChild
Safety concernsFinancial Situation improved
Information/advice about hearing loss from consumer…Co-worker or boss
Hearing loss article or literatureTV advertisement
Newspaper advertisementInternet: Websites of hearing aids manufacturers
Magazine advertisementInternet: Websites of hearing aid clinics
Direct mail pieceInternet: Other websites, google…
Celebrity or public PersonalityRadio advertisement
Telemarketing phone call
Owner (n=784)
Non-Owner (n=518)
© Anovum 2018 - EuroTrak Switzerland 2018 Page 71
=Top 5 influences for owners in EuroTrak 2015=Top 5 influences for non owners in EuroTrak 2015

The most important triggers to buy a hearing aid are worsening hearing loss, the ENT, spouse and the audiologist.What made you finally decide to get your actual hearing aid(s)?
43%
15%
14%
11%
3%
3%
2%
1%
1%
1%
1%
Hearing loss got/gets worse
ENT/ Ear Doctor
Spouse
Hörgeräteakustiker / Audiologist
GP /Family doctor
Another hearing aid owner (word of mouth)
Friend / relative
Co-worker or boss
Child
Safety concerns
Financial Situation improved
Hearing aid owner (n=784)
© Anovum 2018 - EuroTrak Switzerland 2018 Page 72

5. Switzerland-specific questions
© Anovum 2018 - EuroTrak Switzerland 2018 Page 73

Only 4% of the people in Switzerland have a negative image of the hearing healthcare industry
36%
26%
4%
20%
29%
28%
1%
0%
5%
1%
1%
1%
3%
2%
2%
3%
3%
3%
14%
12%
16%
17%
12%
12%
38%
47%
57%
48%
45%
45%
8%
12%
16%
12%
11%
11%
0% 10% 20% 30% 40% 50% 60% 70% 80% 90% 100%
French part (n=1008)
German part (n=2994)
HA owners (n=91)
Impaired non owners (N=108)
Not impaired (n=3803)
Total population (n=4002)
don't know very negative rather negative mediocre positive very positive
© Anovum 2018 - EuroTrak Switzerland 2018
What’s your overall image of the hearing healthcare industry in Switzerland?
Page 74

40% state that the overall image of the hearing healthcare industry in Switzerland got better
3%
3%
7%
5%
3%
3%
61%
56%
46%
58%
58%
58%
36%
41%
47%
37%
39%
40%
0% 10% 20% 30% 40% 50% 60% 70% 80% 90% 100%
French part (n=658)
German part (n=2235)
HA owners (n=88)
Impaired non owners (N=86)
Not impaired (n=2719)
Total population (n=2893)
got worse remained the same got better
© Anovum 2018 - EuroTrak Switzerland 2018
How did the overall image of the hearing healthcare industry in Switzerland change in the last few years?
Page 75
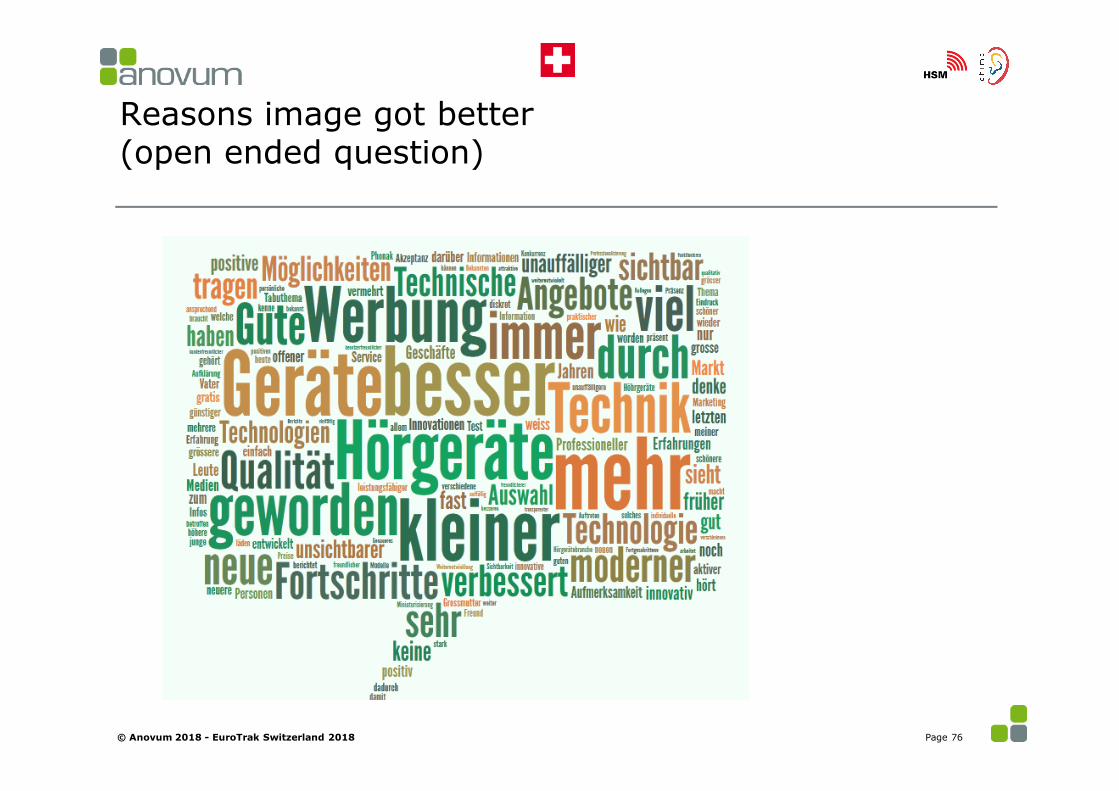
Reasons image got better(open ended question)
© Anovum 2018 - EuroTrak Switzerland 2018 Page 76

Reasons image got worse(open ended question)
© Anovum 2018 - EuroTrak Switzerland 2018 Page 77
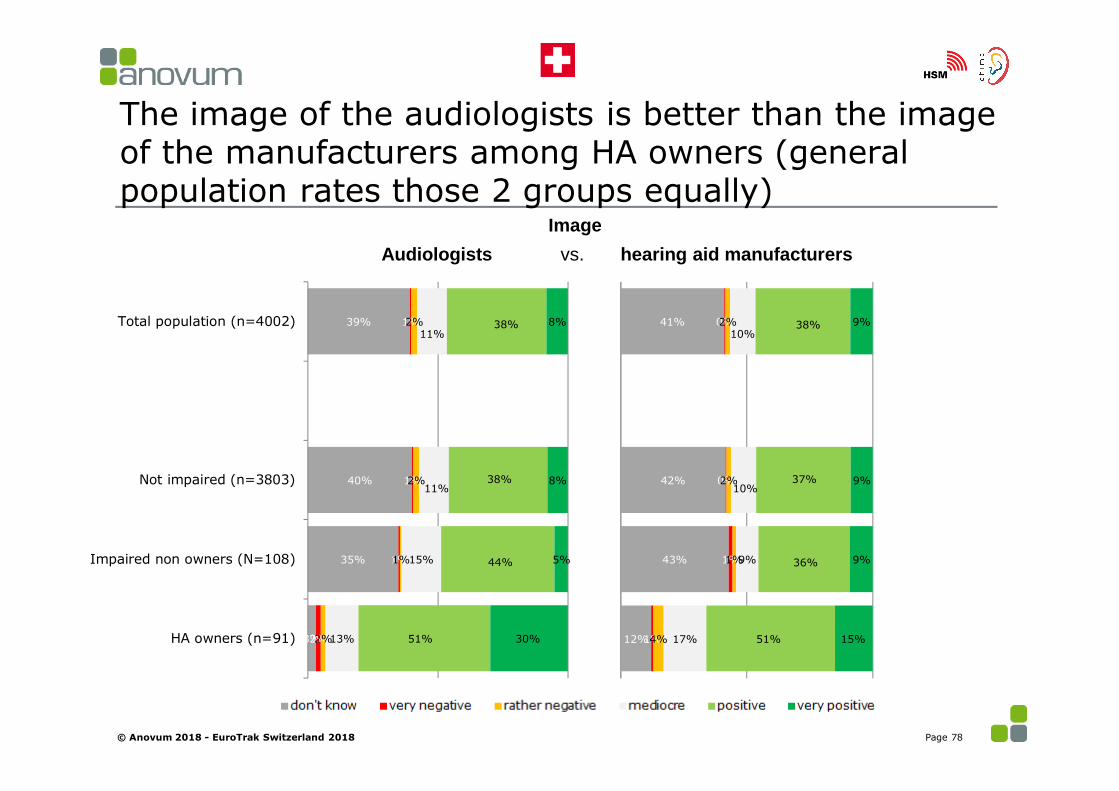
The image of the audiologists is better than the imageof the manufacturers among HA owners (general population rates those 2 groups equally)
39%
40%
35%
3%
1%
1%
1%
2%
2%
2%
1%
2%
11%
11%
15%
13%
38%
38%
44%
51%
8%
8%
5%
30%
Total population (n=4002)
Not impaired (n=3803)
Impaired non owners (N=108)
HA owners (n=91)
© Anovum 2018 - EuroTrak Switzerland 2018
ImageAudiologists vs. hearing aid manufacturers
41%
42%
43%
12%
0%
0%
1%
1%
2%
2%
1%
4%
10%
10%
9%
17%
38%
37%
36%
51%
9%
9%
9%
15%
Page 78

Around 50% of the non owners are not aware of the distinction between audiologists and hearing aid manufacturers
Were you aware of the distinction between audiologists and hearing aid manufacturers?
© Anovum 2018 - EuroTrak Switzerland 2018
Not impaired (n=3791/3803) Impaired non owners (n=126/108) HA owners (n=83/91)
52% 52%
48% 48%
2015 2018
Yes No
60% 59%
40% 41%
2015 2018
Yes No
84% 84%
16% 16%
2015 2018
Yes No
Page 79

Characteristics of HCPs are considered positive, especially expertise and being likeable and pleasant
34%
42%
59%
62%
71%
36%
31%
31%
26%
20%
26%
21%
7%
10%
5%
4%
6%
3%
3%
3%
1%
0%
1%
0%
0%
0% 10% 20% 30% 40% 50% 60% 70% 80% 90% 100%
stylish
innovative
enjoyable
pleasant
expert
+2 +1 0 -1 -2
Below are 5 pairs of attributes. Please enter in each case how you perceived your hearing care professional.
© Anovum 2018 - EuroTrak Switzerland 2018 Page 80
amateurish
unpleasant
displeasing
conservative
lacking in style
Base: N=784

APPENDIX
© Anovum 2018 - EuroTrak Switzerland 2018 Page 82

Sample size and random sample error: Rules of thumb
Sample size Random sample error
Real value is within interval:
Level of proportion: 50%/50% Level of proportion: 15%/85%
50 +- 13.9 +- 9.9
100 +- 9.8 +- 7.0
250 +- 6.2 +- 4.4
500 +- 4.4 +- 3.1
1000 +- 3.1 +- 2.2
5’000 +- 1.4 +- 1.0
10’000 +- 1.0 +- 0.7
© Anovum 2018 - EuroTrak Switzerland 2018 Page 83
READ: At a sample size of n=500 and a value of 15% we would expect the real value of an interval +-3.1 around 15% - which means between 11.9% and 18.1% (Conservative assumption: 95% confidence level)

Demographics (1) Hearing instrument adoption rates and populations
* Small sample sizes in some categories© Anovum 2018 - EuroTrak Switzerland 2018 Page 84
Count Hearing difficultyHearing aid adoption rate % (Base=hearing
impaired)No hearing loss Hearing loss but no
hearing aidHearing aid
GENDERMale 7'244 8.4% 42.7% 49.2% 55.1% 52.9%
Female 7'367 7.0% 44.9% 50.8% 44.9% 47.1%Age
1 - 14 2'186 0.7% 55.9% 16.1% 1.1% 1.8%15 - 24 1'585 1.2% 22.8% 11.6% 2.4% 0.9%25 - 34 2'018 2.2% 29.2% 14.6% 4.9% 2.6%35 - 44 2'037 3.1% 17.6% 14.6% 8.2% 2.3%45 - 54 2'250 5.1% 15.8% 15.8% 15.3% 3.7%55 - 64 1'866 9.0% 39.5% 12.6% 16.1% 13.5%65 - 74 1'415 18.3% 46.4% 8.6% 22.0% 24.6%
74+ 1'255 34.7% 56.8% 6.1% 29.9% 50.6%Type of household
single household 1'680 13.7% 49.3% 10.7% 18.5% 23.2%Couple, no kids 4'386 11.9% 49.7% 28.6% 41.8% 53.3%
Couple w ith kid(s) 6'579 3.2% 25.5% 47.2% 25.3% 11.1%Single mom/dad w ith kid(s) 690 3.6% 25.7% 4.9% 2.9% 1.3%
Retirement home, hospital etc. 136 41.9% 49.3% 0.6% 4.6% 5.7%Other 1'140 6.1% 37.9% 7.9% 6.8% 5.3%
Profiles: Categories add to 100%*
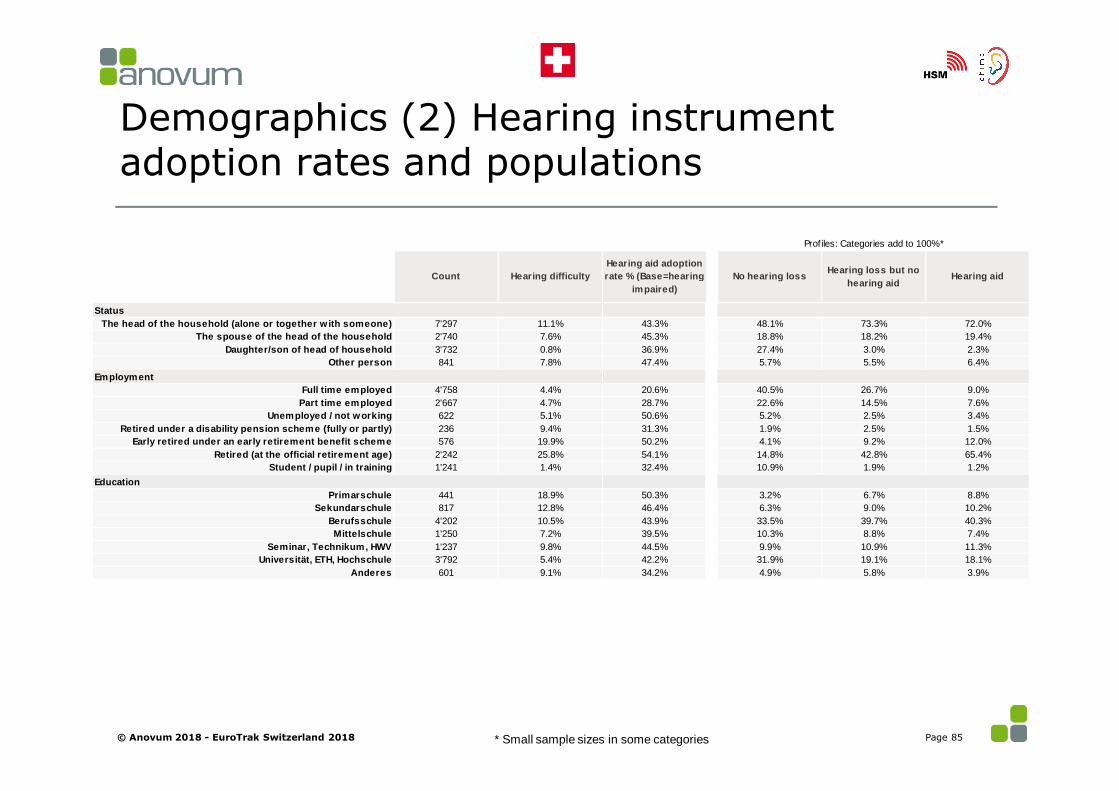
Count Hearing difficultyHearing aid adoption rate % (Base=hearing
impaired)No hearing loss Hearing loss but no
hearing aidHearing aid
StatusThe head of the household (alone or together w ith someone) 7'297 11.1% 43.3% 48.1% 73.3% 72.0%
The spouse of the head of the household 2'740 7.6% 45.3% 18.8% 18.2% 19.4%Daughter/son of head of household 3'732 0.8% 36.9% 27.4% 3.0% 2.3%
Other person 841 7.8% 47.4% 5.7% 5.5% 6.4%Employment
Full time employed 4'758 4.4% 20.6% 40.5% 26.7% 9.0%Part time employed 2'667 4.7% 28.7% 22.6% 14.5% 7.6%
Unemployed / not working 622 5.1% 50.6% 5.2% 2.5% 3.4%Retired under a disability pension scheme (fully or partly) 236 9.4% 31.3% 1.9% 2.5% 1.5%
Early retired under an early retirement benefit scheme 576 19.9% 50.2% 4.1% 9.2% 12.0%Retired (at the official retirement age) 2'242 25.8% 54.1% 14.8% 42.8% 65.4%
Student / pupil / in training 1'241 1.4% 32.4% 10.9% 1.9% 1.2%Education
Primarschule 441 18.9% 50.3% 3.2% 6.7% 8.8%Sekundarschule 817 12.8% 46.4% 6.3% 9.0% 10.2%
Berufsschule 4'202 10.5% 43.9% 33.5% 39.7% 40.3%Mittelschule 1'250 7.2% 39.5% 10.3% 8.8% 7.4%
Seminar, Technikum, HWV 1'237 9.8% 44.5% 9.9% 10.9% 11.3%Universität, ETH, Hochschule 3'792 5.4% 42.2% 31.9% 19.1% 18.1%
Anderes 601 9.1% 34.2% 4.9% 5.8% 3.9%
Profiles: Categories add to 100%*
Demographics (2) Hearing instrument adoption rates and populations
* Small sample sizes in some categories© Anovum 2018 - EuroTrak Switzerland 2018 Page 85