Embed Size (px)
Citation preview

EuroTrak: New survey of themarket for hearing aids inGermany, France and the U.K.
Søren Hougaard, EHIMAStefan Ruf, Anovum
First globally comparative study ofhearing, hearing loss and hearing aids

Agenda
1. Background and Methodology
2. Market overview
3. Hearing aid owners
4. Hearing impaired non-owners
(c) Anovum 2009 - Euro Trak 2009 Page 2

EuroTrak: Background & Ambition
(c) Anovum 2009 - Euro Trak 2009 Page 3
• MarkeTrak surveys (USA): >20 years history
• EuroTrak is the European equivalent to MarkeTrak
• Combining MarkeTrak and EuroTrak: first globallycomparative study. Yields a core data set which can be usedinternationally. A new standard for hearing healthcaresurveys.
• Designed and executed by Anovum on behalf of EHIMA
About EHIMA
(c) Anovum 2009 - Euro Trak 2009 Page 4
• The European Hearing Instrument Manufacturers Association (EHIMA) was founded in1985 and represents the six major European hearing instrument manufacturers,producing up to 90% of hearing aids made in Europe.
• The members of EHIMA are:
• Secretary General of EHIMA: Soeren Hougaard
1984 – 2002: marketing manager, Widex Denmark
2002 – 2009: mananing director, Phonak Denmark
2009 - ? : secretary general, EHIMA

Gathering information about the Market based oninterviews with target groups
(c) Anovum 2009 - Euro Trak 2009 Page 5

Data collection: In search of hearingimpaired people for the interviews
Step 1: Representative sample
Target group: General population
Objective: Prevalence of hearing loss and hearing aid ownership
Step 2: Interviews with hearing impaired
Target groups:• Hearing impaired (HI) without hearing aid (HA)• Hearing impaired with hearing aid
Objective: Details about satisfaction with hearing aids and reasons for non-adoption
Page 6(c) Anovum 2009 - Euro Trak 2009

Same sampling structure and samemethodology in all countries
• Sample sizes Germany 2009:– Total representative sample: n=14’185 people
– Total full interviews hearing impaired: n=1’308 people
• Hearing impaired non-owners: n=805 people with hearing loss (HL)
• HA owners: n=503 people with hearing aid (HA)
• Sample sizes France 2009:– Total representative sample: n=15’545 people
– Total hearing impaired: n=1’304 people
• Hearing impaired non-owners: n=803 people with hearing loss (HL)
• HA owners: n=501 people with hearing aid (HA)
• Sample sizes UK 2009:– Total representative sample: n=14’980 people
– Total hearing impaired: n=1’335 people
• Hearing impaired non-owners: n=822 people with hearing loss (HL)
• HA owners: n=513 people with hearing aid (HA)
• Sample sizes USA 2008– Total representative sample: n= 46’843 people
– Total hearing impaired: n= 5’713 people
• Hearing impaired non-owners: n= 4’339 people with hearing loss (HL)
• HA owners: n= 3’174 people with hearing loss (HA)
(c) Anovum 2009 - Euro Trak 2009 Page 7
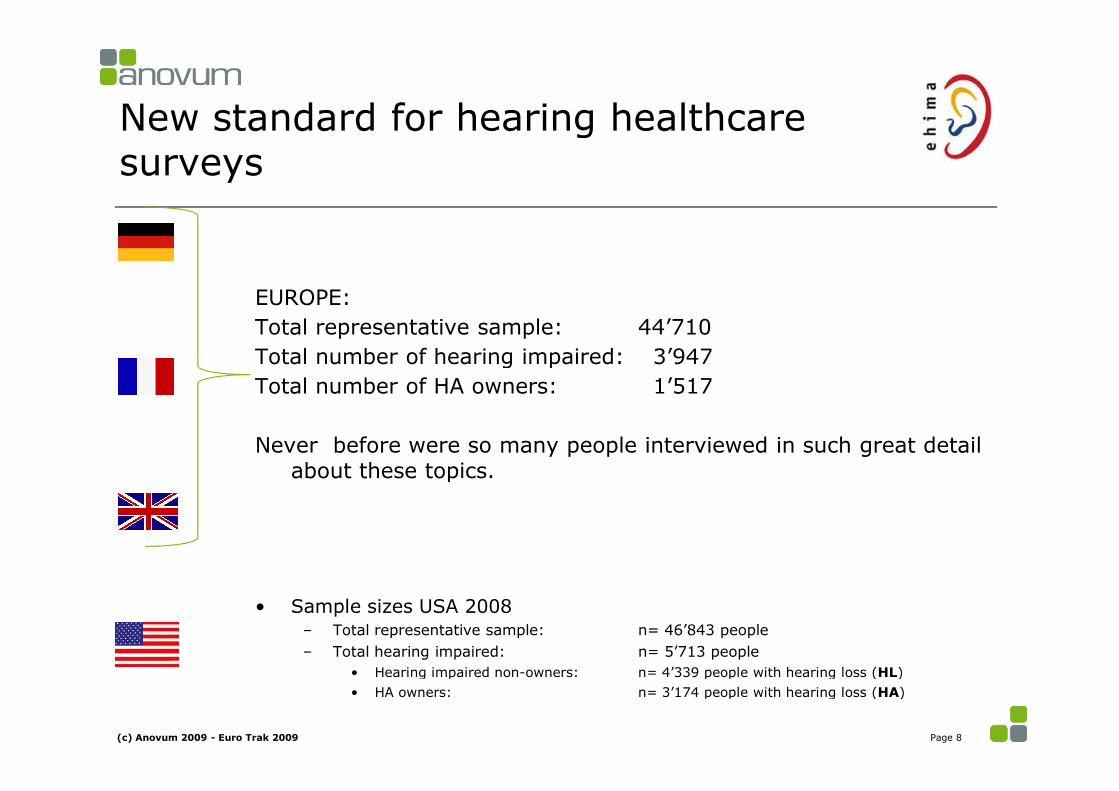
New standard for hearing healthcaresurveys
EUROPE:
Total representative sample: 44’710
Total number of hearing impaired: 3’947
Total number of HA owners: 1’517
Never before were so many people interviewed in such great detailabout these topics.
• Sample sizes USA 2008– Total representative sample: n= 46’843 people
– Total hearing impaired: n= 5’713 people
• Hearing impaired non-owners: n= 4’339 people with hearing loss (HL)
• HA owners: n= 3’174 people with hearing loss (HA)
(c) Anovum 2009 - Euro Trak 2009 Page 8

Agenda
1. Background and Methodology
2. Market overview
3. Hearing aid owners
4. Hearing impaired non-owners
(c) Anovum 2009 - Euro Trak 2009 Page 9

Hearing loss prevalence
(c) Anovum 2009 - Euro Trak 2009 Page 10
13.1%
9.5%10.4%
11.3%
15.1%
11.5%12.7%
0%
5%
10%
15%
20%
Germany UK France USA
Hearing impaired (stated) Hearing impaired 18+ (stated)
Euro Trak 2009 Euro Trak 2009 Euro Trak 2009 Marke Trak VIII 2008

Demographic differences: The population in Germany isolder. Older people tend to suffer more frequently fromhearing loss.
(c) Anovum 2009 - Euro Trak 2009 Page 11
Source: US Census Bureau

Stated vs measured
Important: Stated is not measured HL!
Many factors that can influence stated hearing loss
German Green Cross 1985: measured = 27%
(c) Anovum 2009 - Euro Trak 2009 Page 12

Hearing loss prevalence 2009
Page 13(c) Anovum 2009 - Euro Trak 2009

Hearing loss prevalence and hearing aidadoption
(c) Anovum 2009 - Euro Trak 2009 Page 14
13.1%
9.5% 10.4% 11.3%
4.2% 3.7% 3.1% 2.8%
31.8%
38.6%
29.8%
24.6%
0%
5%
10%
15%
20%
25%
30%
35%
40%
Germany UK France USA
Hearing impaired (stated) Adoption (% of population) Adoption (% of stated impaired)
Euro Trak 2009 Euro Trak 2009 Euro Trak 2009 Marke Trak VIII 2008

Hearing aid adoption rate 2009Total adoption rate is 31.8%
Base: n= 550 (HAowners)
Page 15(c) Anovum 2009 - Euro Trak 2009
Example:

Binaural rate
(c) Anovum 2009 - Euro Trak 2009 Page 16
60%
47%
58%
74%
0%
20%
40%
60%
80%
100%
Germany UK France USAEuro Trak 2009 Euro Trak 2009 Euro Trak 2009 Marke Trak VIII 2008

Agenda
1. Background and Methodology
2. Market overview
3. Hearing aid owners
4. Hearing impaired non-owners
(c) Anovum 2009 - Euro Trak 2009 Page 17

3rd party payment
(c) Anovum 2009 - Euro Trak GER/UK/FRA 2009
Owners: : Was any part or all of your hearing aid(s)paid for by a third party ? (Insurance, Government, …)
79%
17%
4%
Yes
No
don't know
52%41%
7%
Yes
No
don't know
74%
24%
2%
NHS
Privatesector
don't know

Overall satisfaction with HA: The more hours worn, thehigher the satisfaction.
Seite 19
HA-owner, n=503
(c) Anovum 2009 - Euro Trak 2009
Example:
2
2
4
2
1
1
4
2
3
8
10
6
13
11
31
17
23
24
28
25
28
44
17
30
30
10
6
18
0% 10% 20% 30% 40% 50% 60% 70% 80% 90% 100%
HA worn more than 8 hrs/day (n=229)
HA worn 4-8 hrs/day (n=148)
HA worn up to 4 hrs/day (n=126)
Total HA-user (n=503)
1= very dissatisfied 2=dissatisfied 3=somewhat dissatisfied 4=neutral 5=somewhat satisfied 6=satisfied 7=very satisfied
MEAN
5.2
4.5
5.3
5.6

Satisfaction with current HA:Highly satisfied with dispensers. Still a challenge: Difficultlistening situations
HA-owner, n=503
NSS*
67
66
63
61
70
57
53
51
24
23
12
40
37
36
29
60
58
45
45
27
21
19
*NSS= Net Satisfaction Score (%satisfied – %dissatisfied)
Dispenser
Sound qualitysignal process.
Productfeatures
Listeningsituation
%dissatisfied= % very dissatisfied (1) + % dissatisfied (2) + % somewhat dissatisfied (3)%satisfied= % somewhat satisfied (5) + % satisfied (6) + % very satisfied (7)
Page 20(c) Anovum 2009 - Euro Trak Germany 2009
* NSS can differ from showed difference due to rounding
Example:

New technology makes a difference
(c) Anovum 2009 - Euro Trak 2009 Page 21
For each country: The newer the HA - the higher the satisfaction

Satisfaction with sound quality and signalprocessing increased with the new HA generations.
NSS= Net Satisfaction Score (%satisfied – %dissatisfied)
r6
9
7
15
-2
14
12
12
33
25
23
18
27
28
19
4
13
19
24
27
23
11
rØ = 9
rØ = 17
rØ = 23
rØ = 17
Dispenser
Sound qualitysignal process.
Productfeatures
Listeningsituation
Page 22(c) Anovum 2009 - Euro Trak Germany 2009
2009-2007(n=256)
2006 or earlier(n=236)
Example:
NSS= Net Satisfaction Score (%satisfied – %dissatisfied)
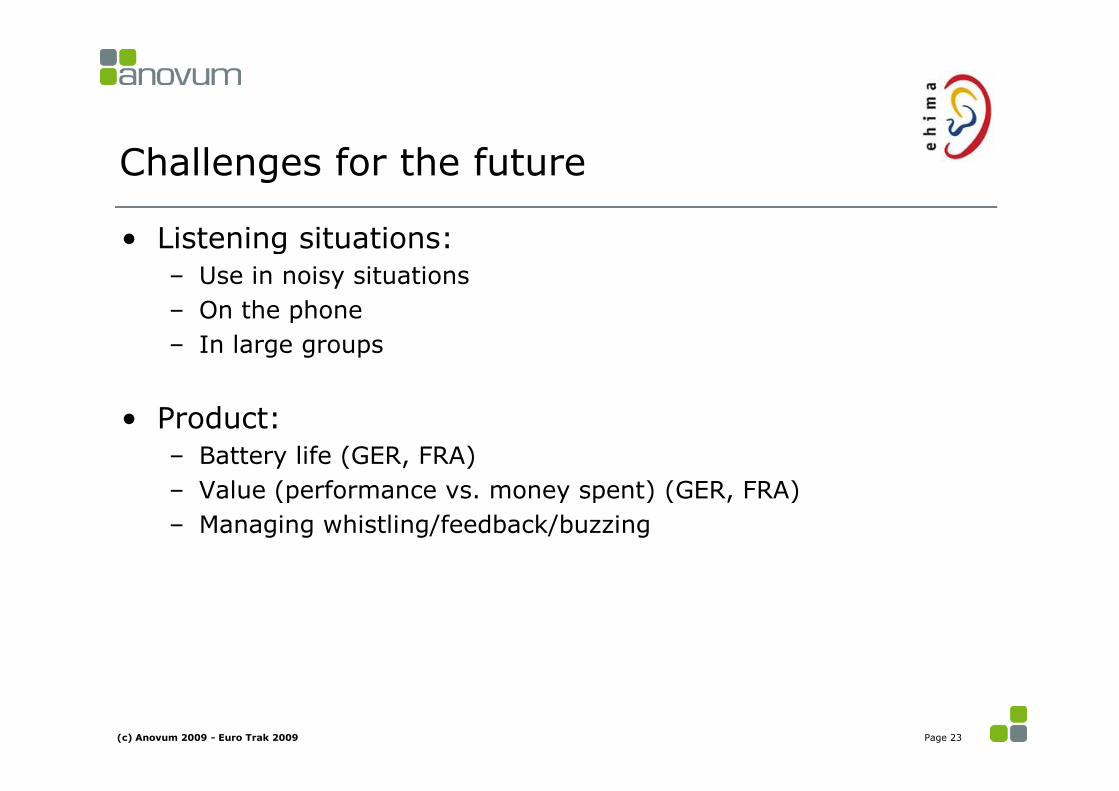
Challenges for the future
• Listening situations:– Use in noisy situations
– On the phone
– In large groups
• Product:– Battery life (GER, FRA)
– Value (performance vs. money spent) (GER, FRA)
– Managing whistling/feedback/buzzing
(c) Anovum 2009 - Euro Trak 2009 Page 23

Positive impact of hearing aids
(c) Anovum 2009 - Euro Trak 2009 Page 24*only asked in France/UK
What hearing aid owners say (top 4 reasons): % who state with hearing aid is better
79% 67% 68%
74% 53% 59%
71% 47% 54%
68% 58% 60%
4
2
2
2
5
6
9
10
56
42
36
25
21
29
33
33
15
21
22
30
0% 20% 40% 60% 80% 100%
Quarrels/disputes
Personalrelationship
Social activities
Communication
1=a lot worse 2=worse 3=the same 4=better 5=a lot better
What significant others say :(since the impaired person in household/parent is wearing hearing aids)
63% 50% *
55% 34% *
50% 28% *
36% 21% *
n=496n=414

Agenda
1. Background and Methodology
2. Market overview
3. Hearing aid owners
4. Hearing impaired non-owners
(c) Anovum 2009 - Euro Trak 2009 Page 25
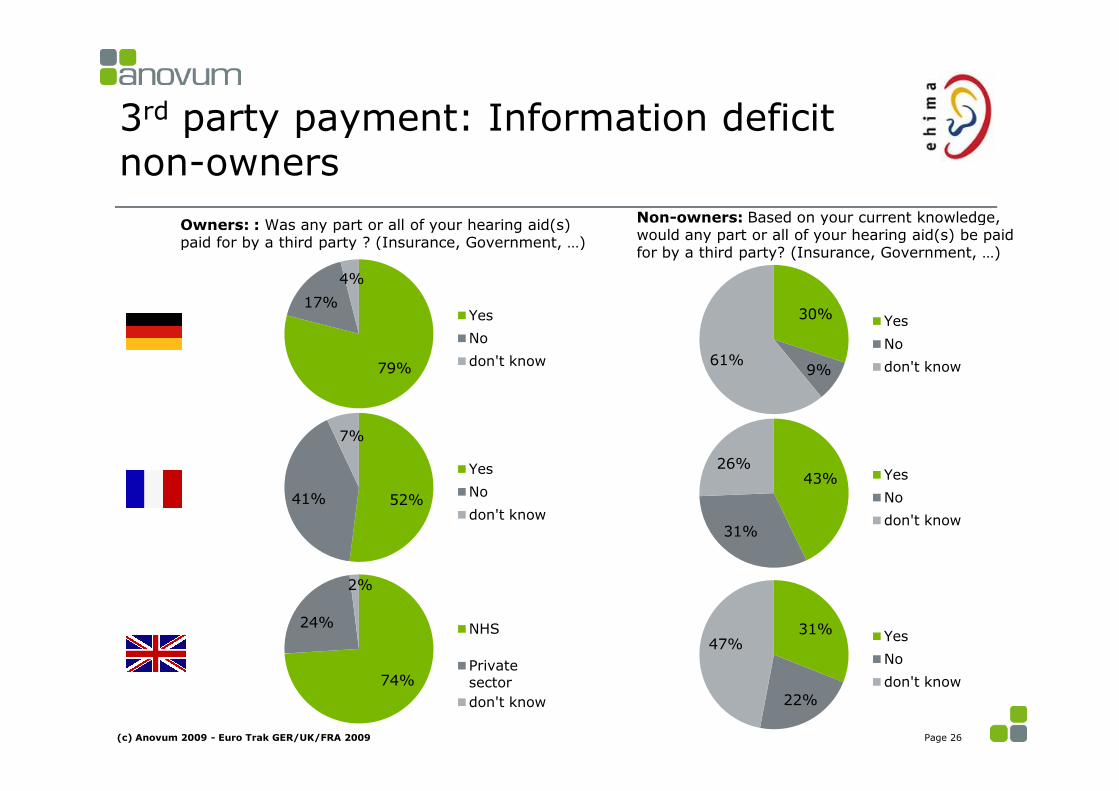
3rd party payment: Information deficitnon-owners
Page 26(c) Anovum 2009 - Euro Trak GER/UK/FRA 2009
Owners: : Was any part or all of your hearing aid(s)paid for by a third party ? (Insurance, Government, …)
79%
17%
4%
Yes
No
don't know
52%41%
7%
Yes
No
don't know
Non-owners: Based on your current knowledge,would any part or all of your hearing aid(s) be paidfor by a third party? (Insurance, Government, …)
30%
9%61%
Yes
No
don't know
43%
31%
26%Yes
No
don't know
31%
22%
47%Yes
No
don't know74%
24%
2%
NHS
Privatesector
don't know

Non-owners with Top 50% hearing loss: The main reasons for notowning hearing aids are that these people say they hear enough andthey argue hearing aids don’t work and are uncomfortable.
37%
37%
44%
31%
38%
39%
37%
37%
35%
35%
31%
30%
26%
29%
28%
29%
27%
28%
26%
23%
21%
13%
17%
12%
14%
21%
5%
29%
26%
18%
27%
19%
16%
18%
16%
18%
14%
18%
16%
18%
13%
14%
10%
13%
10%
9%
11%
8%
16%
12%
12%
9%
2%
3%
34%
37%
38%
42%
43%
45%
45%
47%
48%
51%
51%
54%
56%
58%
59%
60%
61%
62%
65%
66%
70%
71%
71%
77%
77%
77%
92%
0% 10% 20% 30% 40% 50% 60% 70% 80% 90% 100%
Hear well enough in most situations
Hearing loss not severe enough
They do not work well in noisy situations
Uncomfortable
They do not restore your hearing to normal
Have hearing loss in only one ear
Ear doctors' opinion (Hals-Nasen-Ohrenarzt)
Cannot afford hearing aids
Have more serious priorities
Have hearing loss only with high pitch sounds
Bad design
Would be embarrassed towear hearing aids
Another hearing aid owner's opinion
HA-specialist's opinion (HörgeräteAkustiker)
Family doctor's opinion (Hausarzt)
Do not admit I have a hearing loss in public
Have sensory-neural hearing loss (nerve deafness)
Have tinnitus (ringing in ears)
Have tried hearing aids and theydo not work
Have not had hearing tested yet
Hearing problemrequires surgery
Social / Family opinion such as child, spouse, friend
Have hearing loss only with low frequency sounds
Do not trust HA-specialist (HörgeräteAkustiker)
I have vision or dexterity problems
Had surgery - hearing aids won't help
Do not know where to get hearing aids
Definite Somewhat Definitely not
Non owners with top 50% hearing loss = 273
Page 27(c) Anovum 2009 - Euro Trak Germany 2009
Example:
Hearing loss not severe enough
Hear well enough in most situations

What non-owners say would influence them to buy is not necessarilywhat owners say influenced them to buy. The most importantinfluencing factors are worse hearing loss, ENT and audiologist.
Non-owner: Think about the option to obtain / purchase a hearing aid.What do you think would influence you to obtain / purchase a hearingaid ?
68%
47%
34%
30%
24%
22%
22%
20%
18%
10%
6%
5%
4%
3%
2%
2%
2%
1%
1%
1%
59%
59%
39%
9%
45%
3%
26%
10%
9%
10%
3%
3%
3%
2%
2%
1%
2%
2%
1%
0%
Hearing loss got (gets) worse
ENT/ Ear Doctor
Spouse, relative, child, friend
Price of hearing aid
Audiologist
Financial Situation improved
GP /Family doctor
Free due to coverage by Insurance / Received…
Another hearing aid owner (word of mouth)
Safety concerns
Co-worker or boss
Internet
Hearing loss article or literature
TV advertisement
Direct mail piece
Celebrity or public personality
Newspaper advertisement
Magazine advertisement
Telemarketing phone call
Radio advertisement
% Mentioned
Non-owner
Owner
Owner: Thinking back to when you obtained your first hearing aid(s),what influenced you to obtain /purchase the hearing aid(s)?
HA-non-owner, n=805HA-owner, n=503
Page 28(c) Anovum 2009 - Euro Trak Germany 2009
Example:

What non-owners say would influencethem to buy:
(c) Anovum 2009 - Euro Trak 2009 Page 29
Worsehearingloss
Worsehearingloss
Worsehearingloss
GPENT ENT
Insurancecoverage

Hearing impaired non-owners tend to feel less sound andsafe and participate less in social activity compared tosatisfied hearing aid-owners.
HA-non-owner, n=805HA-owner, n=503
MEAN
3.69
3.59
3.02
3.73
4.10
3.06
3.11
2.69
3.25
3.27
Generally I feel safe and sound
I participate regularly in social activities
Page 30(c) Anovum 2009 - Euro Trak Germany 2009
Example:

To recap
• Hearing aids have positive impact on the quality of life ofhearing impaired people.
• Demographic differences and different health care systemsimpact …– hearing loss awareness
– reasons why not to use hearing aids
– ownership of hearing aids (adoption)
– and therefore hearing aids sold in a country.
• Hearing aid owners …– are highly satisfied with dispensers/fitters
– are significantly more satisfied with new hearing aid generations
– think that the challenges are still the difficult listening situations
(c) Anovum 2009 - Euro Trak 2009 Page 31

The future
• It is EHIMA’s intention to repeat the surveys in Germany,France and UK on a regular basis, e.g. every 2 years
• Would give us longitudinal data and the chance to studytrends in the European markets
• Ambition: EuroTrak becomes a point of reference asMarkeTrak has been in the USA. For users, hearinghealthcare professionals, health insurance companies andlawmakers. The combined EuroTrak-MarkeTrak data providesa solid background.
• Planned publication with more details in:
(c) Anovum 2009 - Euro Trak 2009 Page 32

Thank you !