Embed Size (px)
Citation preview

Zurich Open Repository andArchiveUniversity of ZurichMain LibraryStrickhofstrasse 39CH-8057 Zurichwww.zora.uzh.ch
Year: 2018
Another piece of the puzzle: Firms’ investment in training as production ofoptimal skills inventory
Pfeifer, Harald ; Backes-Gellner, Uschi
Abstract: Background By applying the inventory theory to hiring skilled workers under uncertainty,the authors explain how firms decide on their optimum investment in an “inventory of skills.” This pa-per investigates the conditions under which firms are willing to make investments in a skilled workforcethemselves rather than relying on skills produced within the education system or by other companies.By applying inventory theory to investments into apprenticeship training, the authors explain how firmsdecide on producing an optimum “inventory of skills” today to meet future demand. The authors derivehypotheses on how much firms are willing to invest in having a larger inventory of skilled workers depend-ing on different types of inventory costs (overage costs, underage costs, demand structure). Methods Theauthors use data from the BIBB Cost–Benefit-Survey 2012/2013, which comprises detailed informationon different costs and benefits of training investments from the firm’s perspective. The study applies anegative binomial estimation model. Results Results are threefold: firms are willing to invest in a largerinventory of skilled workers, i.e., to train more apprentices, first, if the costs of producing and retainingan excessive number of skilled workers (overage costs) are lower, second, if the costs of being short ofskilled workers (underage costs) are higher, and third, given an identical cost structure, if it is more likelythat the demand for skilled workers may be high in the future. Even more important is the relation-ship of the three: the combination of a firm’s critical ratio (underage costs in relation to overage costs)with its demand structure (industry volatility) is associated with a higher inventory of skills. ConclusionThe findings (particularly the relation of underage and overage costs, in combination with the demandstructure) have important policy implications for firms’ incentives to invest in apprenticeship training.
DOI: https://doi.org/10.1186/s40461-018-0067-6
Posted at the Zurich Open Repository and Archive, University of ZurichZORA URL: https://doi.org/10.5167/uzh-159751Journal ArticlePublished Version
The following work is licensed under a Creative Commons: Attribution 4.0 International (CC BY 4.0)License.
Originally published at:Pfeifer, Harald; Backes-Gellner, Uschi (2018). Another piece of the puzzle: Firms’ investment in trainingas production of optimal skills inventory. Empirical Research in Vocational Education and Training:10:6.DOI: https://doi.org/10.1186/s40461-018-0067-6
Another piece of the puzzle: Firms’ investment in training as production of optimal skills inventory
Harald Pfeifer1* and Uschi Backes-Gellner2
Introduction
Firms have to decide in advance on how many unskilled workers, e.g. apprentices, they
will train to meet an expected future demand for skilled workers who complete tasks
independently and well. We argue that a firm decides on the optimal production of
Abstract
Background: By applying the inventory theory to hiring skilled workers under uncertainty, the authors explain how firms decide on their optimum investment in an “inventory of skills.” This paper investigates the conditions under which firms are willing to make investments in a skilled workforce themselves rather than relying on skills produced within the education system or by other companies. By applying inventory theory to investments into apprenticeship training, the authors explain how firms decide on producing an optimum “inventory of skills” today to meet future demand. The authors derive hypotheses on how much firms are willing to invest in having a larger inventory of skilled workers depending on different types of inventory costs (overage costs, underage costs, demand structure).
Methods: The authors use data from the BIBB Cost–Benefit-Survey 2012/2013, which comprises detailed information on different costs and benefits of training investments from the firm’s perspective. The study applies a negative binomial estimation model.
Results: Results are threefold: firms are willing to invest in a larger inventory of skilled workers, i.e., to train more apprentices, first, if the costs of producing and retaining an excessive number of skilled workers (overage costs) are lower, second, if the costs of being short of skilled workers (underage costs) are higher, and third, given an identical cost structure, if it is more likely that the demand for skilled workers may be high in the future. Even more important is the relationship of the three: the combination of a firm’s critical ratio (underage costs in relation to overage costs) with its demand structure (industry volatility) is associated with a higher inventory of skills.
Conclusion: The findings (particularly the relation of underage and overage costs, in combination with the demand structure) have important policy implications for firms’ incentives to invest in apprenticeship training.
Keywords: Vocational education and training (VET), Inventory decision, Overage and underage costs, Demand structure
Open Access
© The Author(s) 2018. This article is distributed under the terms of the Creative Commons Attribution 4.0 International License (http://creat iveco mmons .org/licen ses/by/4.0/), which permits unrestricted use, distribution, and reproduction in any medium, provided you give appropriate credit to the original author(s) and the source, provide a link to the Creative Commons license, and indicate if changes were made.
RESEARCH
Pfeifer and Backes‑Gellner
Empirical Res Voc Ed Train (2018) 10:6
https://doi.org/10.1186/s40461‑018‑0067‑6
*Correspondence: [email protected] 1 Federal Institute for Vocational Education and Training, Robert-Schuman-Platz 3, 53175 Bonn, GermanyFull list of author information is available at the end of the article
Page 2 of 17Pfeifer and Backes‑Gellner Empirical Res Voc Ed Train (2018) 10:6
skilled workers by minimizing two opposing costs—overage (too much inventory of
skills) and underage (not enough inventory of skills)—given an anticipated future labor
market situation.
Previous studies focused on the one hand side on discounted (net) training costs and
showed that an excessive inventory of skilled workers can cause both obsolescence of
skills and a total loss of training investment if trained workers leave the firm (e.g., Mue-
hlemann et al. 2007; Wolter and Ryan 2011). Previous studies on the other hand side
focused on the benefits of internally trained workers (e.g., Winkelmann 1996; Wolter
2008; Mohrenweiser and Backes-Gellner 2010; Muehlemann et al. 2010; Blatter et al.
2012, 2016; Muehlemann and Pfeifer 2016). However, the second group of studies
neglected the possibility of a shortage of skilled workers. A shortage would cause missed
business opportunities and potentially lost sales, thereby leading to higher underage
costs. Previous studies did not take into account the “expected demand”, which has been
modelled first by Harris (1913) in his inventory decision model. This model, usually
applied to warehouse stock, shows that all three components—overage costs, underage
costs, and expected demand—are the drivers for firms’ decisions as to when to invest
in an inventory of goods; likewise the three components are the drivers for firms’ deci-
sions to invest in training to meet future needs rather than relying on externally trained
workers when future needs are already prevalent. Backes-Gellner (1996) was the first to
apply an inventory model and its components to apprenticeship training. We draw on
the hypothesis developed in her study and use more detailed information on firms’ costs
to empirically show how firms make their training decisions. The paper adds to the lit-
erature by using a comprehensive empirical analysis of firms’ training decisions, factor-
ing in the three components of overage costs, underage costs, and the demand structure.
Apprenticeship training in Germany makes an excellent empirical case because detailed
firm-level data on the different costs and benefits of training apprentices is available
from BIBB Cost–Benefit-Surveys (BIBB CBS).
Background
The inventory model
The inventory theory helps to minimize costs of warehouse stock given the relevant
market situation (Harris 1913).1 To investigate the firms’ decisions on producing skilled
workers, we apply a model from the inventory theory to apprenticeship training. This
model assumes that firms decide in advance on how much inventory of skilled work-
ers to produce. Moreover, firms are bound to their decision for the training period of
approximately 3 years, the expected demand for skills cannot be predicted with cer-
tainty, and firms face some probability to end up with too many or not enough appren-
tices in the future. Furthermore, the classical inventory model assumes that holding
costs are proportional to the quantity and time of goods in inventory and that ordering
costs are fixed as well as decreasing with quantity (Erlenkotter 1990).
1 The inventory theory provides models that are applicable to different specifications; for an overview, see Chikán (1990, p 107 ff.).

Page 3 of 17Pfeifer and Backes‑Gellner Empirical Res Voc Ed Train (2018) 10:6
The inventory model considers the overage costs, underage costs, the underlying
demand structure, as well as the interaction of these fundamental determinants—and is
therefore ideal to analyze our research question2:
with A*: optimal inventory of skills, i.e., optimal number of apprentices, OC: overage
costs, UC: underage costs, CR: critical ratio, DS: demand structure. We explain these
components in the following section.
Overage costs, underage costs, and demand structure
To begin with, overage costs originate from firms training apprentices internally that
they may or may not need in the future. Producing skilled workers requires time and
money. If a firm trains too many apprentices, either it is stuck with inventory, thereby
facing storage costs such as wage, or it encounters trained apprentices leaving (Cappelli
2008). Therefore, if firms overshoot demand, they face costs of having excess inventory.
Since expected costs of a surplus increase monotonically with increasing inventory, we
expect a firm’s overage costs to be negatively related to the level of skills inventory held
(Backes-Gellner 1996).
In contrast, underage costs derive from not having enough skilled workers (or trained
apprentices) available when needed. Consuming trained apprentices beyond built inven-
tories makes the firm experience delays and deficiencies, thus causing lost business
opportunities unless the firm finds substitute workers in due time (Cappelli 2008). Hir-
ing skilled workers from the external labor market brings its own costs, though, which
are comparable to ordering costs of inventory. Therefore, if firms undershoot demand,
they face a risk of being short of inventory. Since expected costs of a shortage decrease
monotonically with increasing inventory, we expect a firm’s underage costs to be posi-
tively related to the level of skills inventory held (Backes-Gellner 1996).
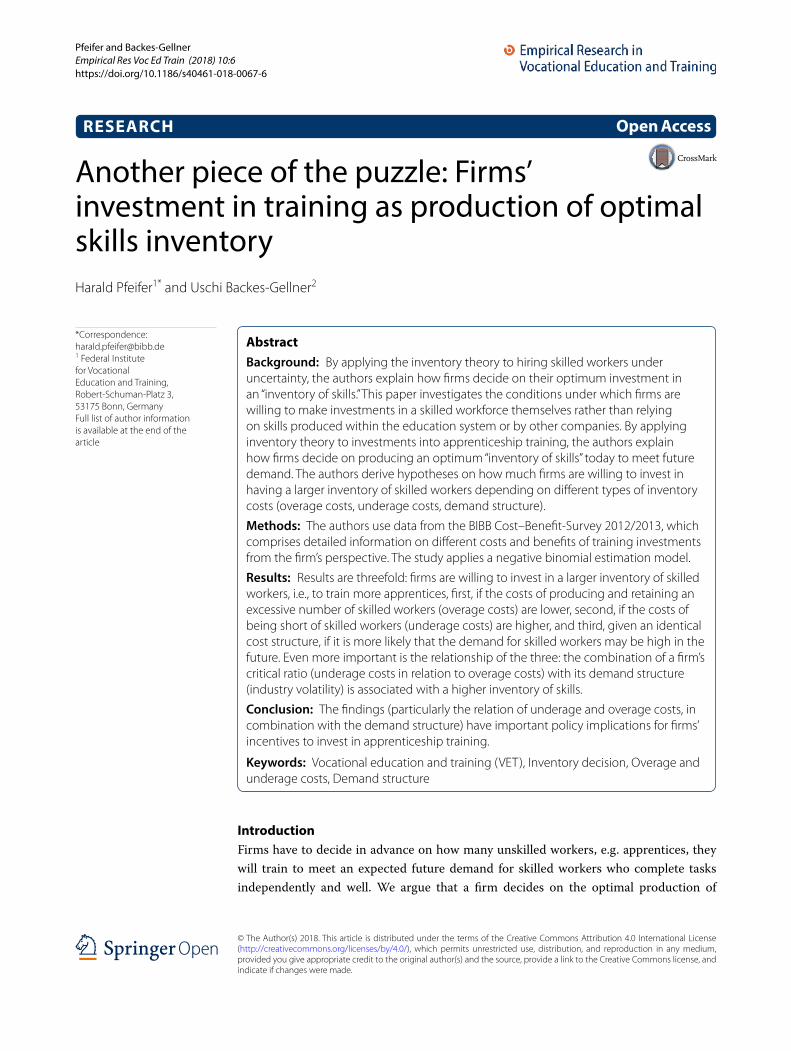
Furthermore, the demand structure represents a firm’s expectations of future demand.
Whereas future demand for skilled workers is unknown, the probability distribution
is known. Thus, the density function in Fig. 1 describes the probability that firms will
actually demand the amount ‘a’ of skilled workers in the future (Backes-Gellner 1996).
As a simplification, we consider two opposing extremes for the probability density of
skills demand: very high and very low demand expectations.3 A positively skewed den-
sity function represents a high probability for high expected demand for skilled workers,
i.e., a high probability that many skilled workers are needed in the future (Fig. 1b). In
contrast, a negatively skewed density function characterizes a high probability for low
expected demand for skills, i.e., a high probability that few skilled workers are needed in
the future (Fig. 1c).4
A∗
= f(OC, UC, DS, DS × CR),
2 The inventory decision itself occurs at a specific point in time. We refrain from discounting the costs due to our focus on short- and medium term effects.3 Generally, we assume that the demand for skills is a derived demand. The specific operationalization of high and low demand follows in the next chapter.4 Both probability densities can be characterized by a beta prime distribution, which enables a formal analysis of the optimal inventory level given different cost structures (Backes-Gellner 1996, pp 61–62).

Page 4 of 17Pfeifer and Backes‑Gellner Empirical Res Voc Ed Train (2018) 10:6
Accordingly, the distribution function in Fig. 2 shows the cumulative demand of skilled
workers (Backes-Gellner 1996).
Optimal inventory
The optimal inventory level is calculated by minimizing the expected sum of the two
specified cost components, overage costs and underage costs, given the demand struc-
ture. Total costs are a stochastic variable C(D,a) with the following properties (Backes-
Gellner 1996):
where a firm ends up with overage costs (OC) if it has trained more apprentices than
demanded, and underage costs (UC) if it demands more apprentices than trained.
To deduct hypotheses for a firm’s optimal inventory strategy, we assume cost mini-
mization as optimality criterion. Thus, the specific amount ‘a*’ of skills inventory mini-
mizes the expected value of underage costs and overage costs5:
C(D, a) = OC max (0, a − D) + UC max(0, D − a),
DS(
a∗)
=1
1 +OCUC
=UC
UC + OC= CR,
Fig. 1 Characteristic demand structures for a uniform, b high, c low, and d medium future expected demand of skills (with a: level of skills inventory, and ds(a): density function of demand for specific level of skilled workers) (Source Authors’ illustration, in line with Backes-Gellner (1996))
Fig. 2 Characteristic cumulative demand for a uniform, b high, c low, and d medium future expected demand of skills (with a: level of skills inventory, and ds(a): distribution function of demand for specific level of skilled workers) (Source Authors’ illustration, in line with Backes-Gellner (1996))
5 Backes-Gellner shows the comprehensive mathematical derivation (1996, pp 54–55).

Page 5 of 17Pfeifer and Backes‑Gellner Empirical Res Voc Ed Train (2018) 10:6
with D: demand for skilled workers, a: level of skills inventory, i.e., number of appren-
tices, DS(a): distribution function of the demand for qualifications,6 i.e., the probability
that skilled workers are actually needed in the future, OC: overage costs, UC: underage
costs, CR: critical ratio.
Consequently, the optimal inventory level depends on the assumed distribution func-
tion of demand as well as on the relation of a firm’s overage (OC) and underage costs
(UC), as expressed by the critical ratio (CR). A high critical ratio results from high
underage costs or from low overage costs, i.e., if underage costs are relatively high com-
pared to overage costs (Fig. 3, dashed line). By contrast, a low critical ratio results from
low underage costs or from high overage costs, i.e., underage costs are relatively low
compared to overage costs (Fig. 3, dotted line).
Hypotheses
Generally, we expect a firm to build a higher skills inventory by training apprentices if
overage costs are relatively low compared to underage costs, i.e., in case of a high critical
ratio. However, Fig. 3 shows that firms may provide little training despite low overage
costs (and thus, a high critical ratio) if they expect future demand to be low, or that firms
may provide much training despite high overage costs (and thus, a low critical ratio) if
they expect future demand to be high. In fact, we find the optimal level of skills inven-
tory for both, low and high demand expectations, by identifying the x-axis value for a
specific critical ratio on the y-axis of the distribution function of skills demand. Overall,
the critical ratio (e.g., high underage costs compared to overage costs) together with the
demand structure (e.g., high expected demand) have a positive, enhancing effect on the
inventory of skills.
We formulate the following hypotheses on the optimal number of apprentices in a firm
(analogous to Backes-Gellner 1996):
H1: The lower a firm’s overage costs given equal underage costs, the higher is c.p. its
investment in an inventory of skilled workers, i.e., the more apprentices it trains.
H2: The lower a firm’s underage costs given equal overage costs, the lower is c.p. its
Fig. 3 Characteristic cumulative demand for given critical ratios. Figure 3 shows characteristic cumulative demand for a uniform, b high, c low, and d medium future expected demand of skills (with a: level of skills inventory, and ds(a): distribution function of demand for specific level of skilled workers, CRH: UC > OC and CRL: UC < OC). (Source Authors’ authors’ illustration, in line with Backes-Gellner (1996))
6 Given that OC and UC are both greater or equal to zero, a corresponding distribution function DS(a) implies a sec-ond derivation larger than zero, i.e., the equation presents a cost minimum. Furthermore, optimal level of inventory a* always exists for a continuous distribution.

Page 6 of 17Pfeifer and Backes‑Gellner Empirical Res Voc Ed Train (2018) 10:6
investment in an inventory of skilled workers, i.e., the less apprentices it trains.
H3: Given an identical cost structure, the higher the probability that a firm has a high
expected demand for skilled workers, the higher is its investment in an inventory
of skilled workers, i.e., the more apprentices it trains.
H4: The effect of a higher probability of need for skilled workers on the investment
in an inventory of skilled workers is even larger for a high critical ratio, i.e., the
number of apprentices does not only depend on the expected demand but much
more on its combination with the relation of underage to overage costs.
To sum up, we investigate how the training intensity, i.e. the optimal inventory level,
depends on a firm’s overage costs, underage costs, demand structure as well as the com-
binations of these three.
The German apprenticeship training
The apprenticeship system (in Germany,7 Switzerland and Austria) allows the firms to
produce skilled workers and to manage their inventory of skills according to their needs.
In other words, firms decide on the number of apprentices they train depending on their
overage costs, underage costs, and their expected demand.8
In Germany, the apprentices spend about 70–80% of their time on-the-job, where the
firm trains them according to the training curricula of one of the 320 registered occupa-
tions (BIBB 2016). Therefore, apprentices acquire skills relevant for their occupation and
get integrated in the production process of the firm. In addition, apprentices visit voca-
tional schools. After 2–3.5 years, apprentices complete an external exam that is nation-
ally recognized, allowing them to work as skilled workers anywhere in the respective
occupation. Subsequent to the training, the firm decides whether to make an offer for
retention, which the apprentice then can accept or not. The apprenticeship system thus
enables the firms to decide on the number of skilled workers they would like to train.
The choice on how many apprentices to train depends on the different components of
costs and the expected demand for skilled workers.9
Operationalization of variables
As our dependent variable, we use the Number of Apprentices presently trained in a firm,
which is a count variable bounded at zero and has a strongly skewed distribution. We
take the absolute number rather than a ratio and simultaneously control for firm size.
7 In general, German apprenticeship training has had a long tradition as a major upper secondary education pathway for young adults where almost 60% of a cohort of school graduates enter the “dual apprenticeship system” (DESTA-TIS 2015).8 Note that the literature discusses different training motives for firms. Most studies discuss the dichotomy of invest-ment motive (i.e. high net-costs, high retention rate) and production motive (low or negative net-costs and low retention rate). Both motives can be integrated in the inventory model with more production-oriented firms having low overage costs and low (or no) underage costs and more investment oriented firms having high overage costs and high underage costs.9 The inventory model does not explicitly model the supply side of apprenticeship training. If there is a shortage of apprentice applicants, this would make hiring apprentices more expensive and would thus increase the gross-costs for an apprenticeship trainee. Thus, within an inventory model these and other supply-side factors would be integrated in the recruitment costs of apprentices, which—as Wenzelmann et al. (2017) have shown—are indeed correlated with local supply-side conditions.

Page 7 of 17Pfeifer and Backes‑Gellner Empirical Res Voc Ed Train (2018) 10:6
The independent variable Overage Costs originates from training (and retaining)
apprentices internally. In the context of apprenticeship training, overage costs (per
apprentice) include three main components.
First, set-up costs are the net costs that a firm invests to train its apprentices. Net
Training Costs in Euros include the average gross costs, e.g., costs for apprentices
(wages), costs for trainers, physical costs and other costs, minus the corresponding ben-
efits such as productive contribution of apprentices during their training.10 Net training
costs can be positive (i.e., a net investment) or negative (i.e., a net benefit). Empirically,
non-training firms might not train apprentices because of significantly higher net train-
ing costs in contrast to training firms (Wolter et al. 2006). Therefore, training costs for
non-training firms would systematically differ if these firms were to switch to a training
policy. Muehlemann et al. (2010) provide a solution to this problem by using selection
models to investigate the potential costs and benefits of non-training firms. Analogously,
we estimate training costs for non-training firms with identical selection models and the
same exclusion restriction, i.e., availability of skilled workers.11 Subsequently, we mul-
tiply these net training costs per year and per apprentice by the Training Duration for
a specific training occupation in years (ranging from 2 to 3.5 years) to calculate the net
training costs for the whole training duration of one apprentice.
Second, walk-away costs are the costs associated with the full loss of investment if a
self-trained worker leaves to join another firm. In this context, the Retention Risk rep-
resents the expected percentage of apprentices that leave voluntarily or involuntarily,
compared to the number of stayers per firm. To account for this full loss, firms must
train more “supplementary” apprentices to begin with. We thus add the observed leav-
ing percentage to the overall investment costs in training. And third, obsolescence is the
process of skills becoming outdated over time, thus leading to a partial loss of invest-
ment. This loss would add up onto the overage costs. However, we do not account for
obsolescence in our overage costs because of the chosen time frame as well as difficulties
in measuring the actual loss. In addition, these costs are not common in reality: appren-
tices either leave the firm or are taken over to do work.
The independent variable Underage Costs derives from not having enough skilled
workers (or trained apprentices) available when needed. In the context of apprenticeship
training, underage costs (per position) include the following three components.
First, Outage Costs represent the lack of skilled employees leading to delays and defi-
ciencies, which in turn cause lost business opportunities both in the short and long run.
We estimate this loss of sales by means of the value added, i.e., sales output minus input,
per employee as an average per region (federal state) and industry and for the vacancy
time during which a skilled worker is missing. Subsequently, we multiply these outage
costs per year and per position by the Vacancy Duration in years (ranging from 0.01 to
1.13 years) to calculate the outage costs for the expected duration of the vacancy for one
skilled worker. We use the vacancy time on a regional (community) and occupational
level as collected by the Federal Employment Office.
10 For detailed compilation of the various costs and benefits see Jansen et al. (2015).11 For details and calculation methods see Muehlemann et al. (2010).

Page 8 of 17Pfeifer and Backes‑Gellner Empirical Res Voc Ed Train (2018) 10:6
Second, Hiring Costs are the costs for hiring substitute workers from the external labor
market to avoid a loss of sales. They include searching and recruiting costs as well as
adjustment costs (additional training courses and productivity loss during adaptation)
for each firm.12 Analogous to the net training costs, non-hiring firms face systematically
different hiring costs in contrast to hiring firms. Again, we estimate recruitment costs
for non-hiring firms with the help of a selection model and an exclusion restriction (the
realignment of the production13).
Third, miscast costs are the costs associated with an erroneous appointment of sub-
stitute workers. In this context, the Miscast Risk represents the expected percentage of
erroneous appointments of skilled workers leaving again within 1 year compared to all
appointments per firm. Since a miscast induces further outage costs as well as a repeated
recruitment process, we adjust the costs to this additional risk.
Lastly, the independent variable Demand Structure represents expectations of demand
for skilled workers in the future. The skills demand is a derived demand resulting from
the market demand for goods produced and services performed. We use the industry
volatility, i.e., the sales fluctuations per employee for a specific industry in either West
or East Germany, as a proxy for a firm’s production strategy and competitive situation. A
high volatility thereby shows that industry sales can continuously vary on a large scale.
To permanently meet the unpredictable demand for skills, workers need to be function-
ally flexibly employable with correspondingly high and broad qualifications.14 Because
it is difficult to replace highly specialized skills with temporary work, firms build a large
inventory of skilled workers in advance by training apprentices.15 In contrast, in case of
stable market conditions (as present e.g. in the public service sector), the risk for lost
business opportunities is lower since sales and underlying demand for skilled workers
are comparably predictable. Therefore, these firms build a smaller inventory of skills.
Methods
Data
To construct the different components of our inventory model, we use the cost–ben-
efit study from the Federal Institute for Vocational Education and Training (BIBB). This
cross-sectional survey includes detailed firm-level data on different costs and benefits
for 3000 training and 900 non-training firms of the training year of 2012/13.16 The Fed-
eral Employment Agency provided the sample of firm addresses from the administra-
tive firm register. The interviewers used the CAPI method (computer-assisted personal
interview), i.e., they visited the firms in person to collect the information. The ques-
tions about the costs and benefits of training refer to one specific occupation, which was
16 The Federal Institute for Vocational Education and Training has conducted these firm-level surveys since the 1980s (e.g., Beicht et al. 2004; Schoenfeld et al. 2010, 2016).
12 For detailed compilation of the various costs and benefits see Jansen et al. (2015).13 For details and calculation methods see Muehlemann and Pfeifer (2016).14 Backes-Gellner et al. (2016) discuss the importance of functional flexibility as key HR practice in more detail.15 Although it would in principle be possible to use temporary work agencies to hire skilled workers, this involves an additional risk (i.e. matching) and additional costs for the firm (including higher wages, lower productivity and lower flexibility). Further, in times of tight labour markets, also temporary work agencies are likely to face supply-side restric-tions and may not be able to adequately supply skilled workers.
Page 9 of 17Pfeifer and Backes‑Gellner Empirical Res Voc Ed Train (2018) 10:6
selected randomly among the trained occupations in the firm at the beginning of the
interview.
Furthermore, we merge the firm-level data with aggregated register data collected by
the Federal Employment Office. The data include vacancy durations on a regional (com-
munity) and occupational level to calculate the actual outage costs for the expected
duration of the vacancy of a skilled worker.
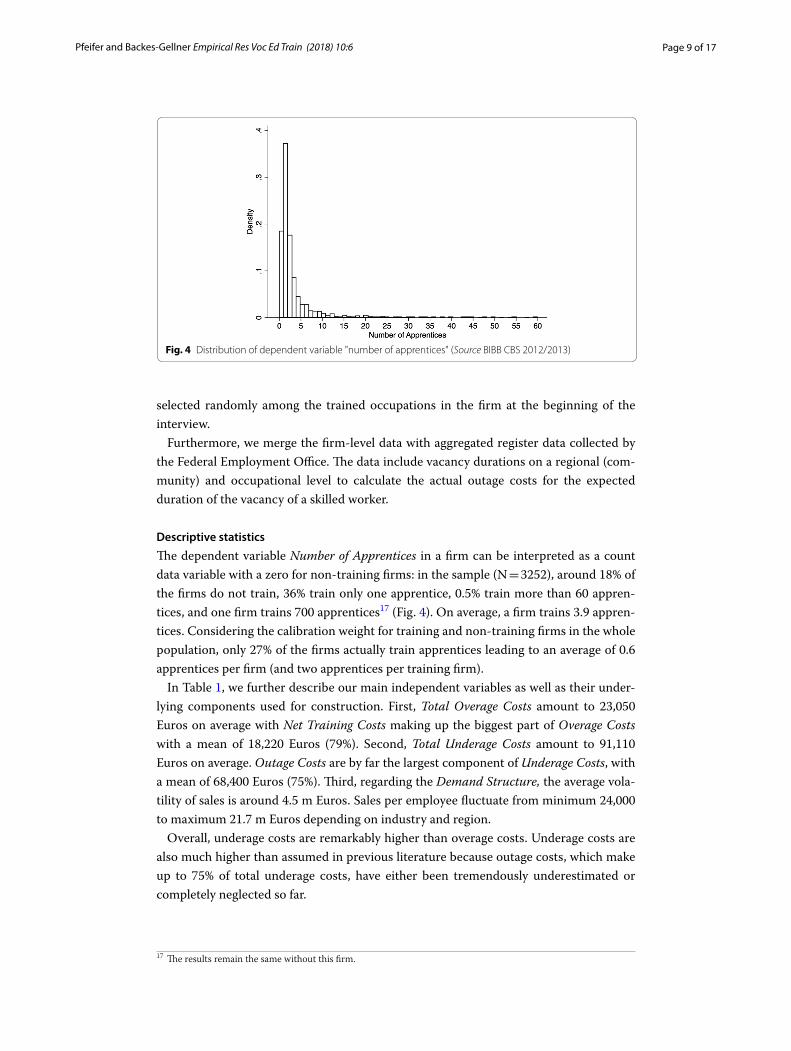
Descriptive statistics
The dependent variable Number of Apprentices in a firm can be interpreted as a count
data variable with a zero for non-training firms: in the sample (N = 3252), around 18% of
the firms do not train, 36% train only one apprentice, 0.5% train more than 60 appren-
tices, and one firm trains 700 apprentices17 (Fig. 4). On average, a firm trains 3.9 appren-
tices. Considering the calibration weight for training and non-training firms in the whole
population, only 27% of the firms actually train apprentices leading to an average of 0.6
apprentices per firm (and two apprentices per training firm).
In Table 1, we further describe our main independent variables as well as their under-
lying components used for construction. First, Total Overage Costs amount to 23,050
Euros on average with Net Training Costs making up the biggest part of Overage Costs
with a mean of 18,220 Euros (79%). Second, Total Underage Costs amount to 91,110
Euros on average. Outage Costs are by far the largest component of Underage Costs, with
a mean of 68,400 Euros (75%). Third, regarding the Demand Structure, the average vola-
tility of sales is around 4.5 m Euros. Sales per employee fluctuate from minimum 24,000
to maximum 21.7 m Euros depending on industry and region.
Overall, underage costs are remarkably higher than overage costs. Underage costs are
also much higher than assumed in previous literature because outage costs, which make
up to 75% of total underage costs, have either been tremendously underestimated or
completely neglected so far.
Fig. 4 Distribution of dependent variable "number of apprentices" (Source BIBB CBS 2012/2013)
17 The results remain the same without this firm.

Page 10 of 17Pfeifer and Backes‑Gellner Empirical Res Voc Ed Train (2018) 10:6
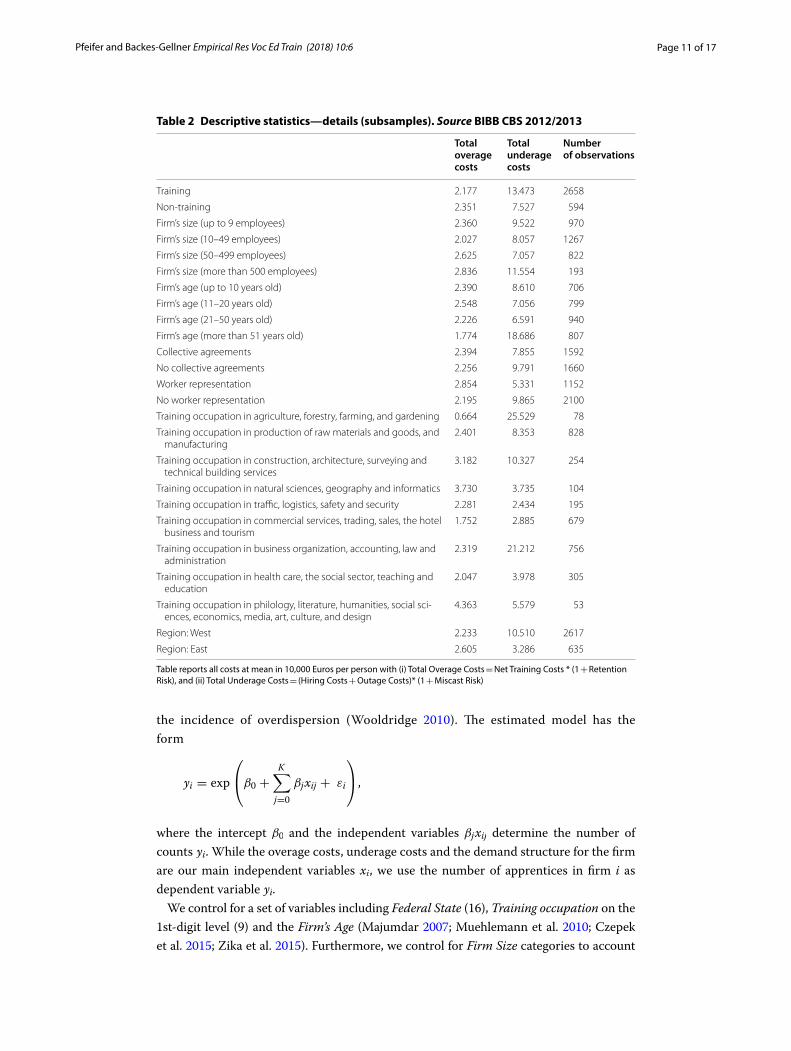
In Table 2, we report our two cost variables for different subgroups. Whereas overage
costs hardly differ for training and non-training firms,18 underage costs are much higher
for training firms. Comparatively high underage costs are a potential reason for train-
ing as firms can avoid underage costs by hiring trained apprentices as skilled workers.
Remarkably, even if underage costs are on average (much) higher than overage costs,
some firms do not train. These firms may either discount the future (especially prospec-
tive benefits) a lot or they may not consider the long-term perspective of their optimal
inventory strategy at all.
Econometric modelling
Figure 4 shows that our dependent variable, the number of apprentices, is a count
outcome with a strongly skewed distribution and a limited range of values (Cameron
and Trivedi 2013). Accordingly, we aim for an estimation procedure that accounts for
the Poisson-like distribution of the form Pr{
Y = y}
=e−µ
µy
y! , where y is the observed
number of counts and µ is the mean of the Poisson distribution, implying
E(yi|xi) = Var(yi|xi). More specifically, we use a negative binomial regression due to
Table 1 Descriptive statistics—overview (full sample). Source BIBB CBS 2012/2013
Table reports all costs in 10,000 Euros per person with a Total Overage Costs = Net Training Costs * (1 + Retention Risk), and b
Total Underage Costs = (Hiring Costs + Outage Costs)* (1 + Miscast Risk)
Variable Mean St. Dev. Min. Max.
Number of apprentices (per firm) 0.57 4.40 0 700
Overage costs
Total overage costsa 2.305 2.132 − 12.599 25.862
Net training costs 1.822 1.693 − 9.447 20.463
Retention risk 0.27 0.09 0.04 0.65
Underage costs
Total underage costsb 9.111 48.866 − 0.832 1610.237
Hiring costs 0.864 0.941 − 0.510 16.658
Outage costs 6.840 41.198 − 1.349 1371.456
Miscast risk 0.18 0.05 0.11 1.05
Demand structure
Industry volatility 4.50 7.23 0.02 21.67
Controls
Firm’s size (in #employees) 20.96 172.99 1 25,341
Firm’s age (in years) 29.70 47.37 1 919
Collective agreements (binary) 0.35 0.48 0 1
Worker representation (binary) 0.17 0.37 0 1
Training occupation 9 different groups of training occupations
Federal state 16 different federal states (regions)
Number of observations 3252 observations
18 In Switzerland, overage costs (especially net training costs) would be much higher for non-training firms as opposed to training firms. For a comprehensive comparison of cost and benefits of German vs. Swiss apprenticeship training see Dionisius et al. (2009).
Page 11 of 17Pfeifer and Backes‑Gellner Empirical Res Voc Ed Train (2018) 10:6
the incidence of overdispersion (Wooldridge 2010). The estimated model has the
form
where the intercept β0 and the independent variables βjxij determine the number of
counts yi . While the overage costs, underage costs and the demand structure for the firm
are our main independent variables xi , we use the number of apprentices in firm i as
dependent variable yi.
We control for a set of variables including Federal State (16), Training occupation on the
1st-digit level (9) and the Firm’s Age (Majumdar 2007; Muehlemann et al. 2010; Czepek
et al. 2015; Zika et al. 2015). Furthermore, we control for Firm Size categories to account
yi = exp
β0 +
K�
j=0
βjxij + εi
,
Table 2 Descriptive statistics—details (subsamples). Source BIBB CBS 2012/2013
Table reports all costs at mean in 10,000 Euros per person with (i) Total Overage Costs = Net Training Costs * (1 + Retention
Risk), and (ii) Total Underage Costs = (Hiring Costs + Outage Costs)* (1 + Miscast Risk)
Total overage costs
Total underage costs
Number of observations
Training 2.177 13.473 2658
Non-training 2.351 7.527 594
Firm’s size (up to 9 employees) 2.360 9.522 970
Firm’s size (10–49 employees) 2.027 8.057 1267
Firm’s size (50–499 employees) 2.625 7.057 822
Firm’s size (more than 500 employees) 2.836 11.554 193
Firm’s age (up to 10 years old) 2.390 8.610 706
Firm’s age (11–20 years old) 2.548 7.056 799
Firm’s age (21–50 years old) 2.226 6.591 940
Firm’s age (more than 51 years old) 1.774 18.686 807
Collective agreements 2.394 7.855 1592
No collective agreements 2.256 9.791 1660
Worker representation 2.854 5.331 1152
No worker representation 2.195 9.865 2100
Training occupation in agriculture, forestry, farming, and gardening 0.664 25.529 78
Training occupation in production of raw materials and goods, and manufacturing
2.401 8.353 828
Training occupation in construction, architecture, surveying and technical building services
3.182 10.327 254
Training occupation in natural sciences, geography and informatics 3.730 3.735 104
Training occupation in traffic, logistics, safety and security 2.281 2.434 195
Training occupation in commercial services, trading, sales, the hotel business and tourism
1.752 2.885 679
Training occupation in business organization, accounting, law and administration
2.319 21.212 756
Training occupation in health care, the social sector, teaching and education
2.047 3.978 305
Training occupation in philology, literature, humanities, social sci-ences, economics, media, art, culture, and design
4.363 5.579 53
Region: West 2.233 10.510 2617
Region: East 2.605 3.286 635

Page 12 of 17Pfeifer and Backes‑Gellner Empirical Res Voc Ed Train (2018) 10:6
for potential institutional and production technology differences between firms of differ-
ent sizes (e.g., employment protection legislation). Because in Germany, firm- and sector-
level institutions are important determinants of the training participation (Kriechel et al.
2014), we additionally control for the presence of a Worker Representation at the firm
level, e.g., works council, as well as for Collective Agreements negotiated at sector level.19
Finally, we use the number of employees in firm i as the exposure variable in the model.20
By including the exposure variable, we technically regress the number of apprentices per
employee in the firm (i.e., the apprentice rate) on the independent variables.21
Results and discussion
The tables in this section provide the original coefficients of the negative binomial
regression estimators. Because the interpretation of the coefficients is not straightfor-
ward, we further supply percentage changes that are calculated by estimating the inci-
dence-rate ratios (IRR).
Table 3 shows the negative binominal regression, with the Number of Apprentices as
our dependent variable, and Overage Costs, Underage Costs and Demand Structure as
the main explanatory variables. Column 1 provides estimates of the baseline model and
Column 2 the model including the full set of structural and institutional variables. The
estimates in Column 2 show that the overage costs are negatively related to the number
of apprentices in a firm. An increase of one unit (i.e., 10,000 €) in the overage costs leads
to a decrease in the number of trained apprentices of 4.1%. An increase in one unit of the
underage costs, on the contrary, is associated with an increase of apprentices by about
0.1%—a small but still significant value. Furthermore, our proxy for the probability that
firms have a high expected demand for highly skilled workers—the industry volatility—
is positively related to the inventory of apprentices: an industry that is more volatile by
one unit (1 m Euro) is associated with an increase in the number of apprentices of 2.2%,
which is a lot considering industry volatility reaching from 0 to 22 m Euro.
Finally, as displayed in Column 3, the demand structure in combination with the criti-
cal ratio (UC/UC+OC) is positive and significant, indicating that the relation between
the critical ratio and the number of trained apprentices in a firm is stronger if industry
volatility is higher. In contrast, the critical ratio alone is of little importance.
In consequence, we confirm the relationships among the variables as formulated in our
four hypotheses: First, the lower a firm’s overage costs, the higher is c.p. its investment in
an inventory of skilled workers, i.e., the more apprentices it trains. Second, the lower a
firm’s underage costs, the lower is c.p. its investment in an inventory of skilled workers,
i.e., the less apprentices it trains. Third, given an identical cost structure, the higher a firm’s
expected future demand for skilled workers, the higher is its investment in an inventory of
skilled workers, i.e., the more apprentices it trains. And fourth, the relation between a high
19 Due to potential endogeneity issues, we re-estimated the models also without the collective agreement control variable. However, the results remain robust and are available upon request.20 Despite careful modelling and a large set of control variables, we cannot entirely rule out potential reverse causality issues with the data at hand. The results should therefore be interpreted more in a descriptive sense then in a causal manner.21 As described in Cameron and Trivedi (2013), an exposure variable is often used to analyze counts per unit of time, if the latter is not fixed. The reasoning is that a longer period increases the number of counts. We transfer this argument to the number of apprentices in firms because larger firms usually have more apprentices than smaller firms.

Page 13 of 17Pfeifer and Backes‑Gellner Empirical Res Voc Ed Train (2018) 10:6
expected demand and the investment in an inventory of skilled workers is even larger for a
high critical ratio, i.e., for high underage costs compared to overage costs.
To understand which factors are driving the relationship between cost indicators and
inventory of skills, we provide an additional regression table including subcomponents
of Total Overage Cost and Total Underage Costs (Table 4).
With respect to the overage cost components, both Net Training Costs and the Reten-
tion Risk prove to be important drivers for the negative relationship between overage costs
and the number of apprentices shown in Table 3. Therefore, the net costs invested to train
apprentices as well as a potential loss of this investment due to a movement of skilled
workers to another firm are important determinants for a firm’s optimal inventory strategy.
Regarding the underage costs, the main driver are the Outage Costs, i.e., the costs due
to lost business opportunities. As opposed to Hiring Costs, Outage Costs are of greater
scale and may occur over a persistent period rather than only one-time for hiring of sub-
stitute workers from the external labor market. The correspondingly large loss of sales
could eventually cause a firm’s failure. Thus, considering the costs of lost sales when
deciding about the optimal inventory strategy is very important for a firm’s (financial)
survival. Finally, Miscast Costs contribute to the positive relationship between under-
age costs and the number of trained apprentices—since training apprentices and keeping
them as skilled workers circumvents these miscast costs.
As an alternative specification, we focus on the decision on the optimal number of
apprentices rather than the training decision itself (extensive margin). We thus restrict
our sample to firms with at least one apprentice, i.e., training firms (intensive margin).
The results in Table 5 look still similar except for Underage Costs, which still show the
Table 3 Main determinants of the training intensity (optimal inventory level). Source BIBB
CBS 2012/2013
Table reports marginal effects of a negative binomial regression; all costs are in 10,000 Euros per person; %‑change
calculated as (incidence‑rate ratio− 1) × 100; dependent variable: Number of apprentices; controls: Firm’s size(in
#employees), Firm’s age (in years), Collective agreements (binary), Worker representation (binary), Training occupation, and
Federal state; standard errors in parentheses; * statistically significant at the 0.10 level; ** at the 0.05 level; *** at the 0.01
level
OC UC DS Interaction CR DS
(1) (2) %change (3) %change
Overage costs
Total overage costs − 0.0564*** (0.018) − 0.0423*** (0.015) − 4.14%
Underage costs
Total underage costs 0.0008 (0.001) 0.0013* (0.001) 0.13%
Demand structure
Industry volatility 0.0267*** (0.010) 0.0222** (0.010) 2.25% 0.0255** (0.010) 2.58%
Interaction CR DS
Critical ratio − 0.0004 (0.000) − 0.04%
Critical ratio × volatility 0.0001** (0.000) 0.01%
Constant − 3.1725*** (0.083) − 4.0479*** (0.487) − 4.0355*** (0.485)
Controls Included Included Included Included
Number of observations 3252 3252 3252 3252 3252
Pseudo R2 0.009 0.040 0.040 0.038 0.038

Page 14 of 17Pfeifer and Backes‑Gellner Empirical Res Voc Ed Train (2018) 10:6
22 For Swiss firms, Muehlemann et al. (2007) find that costs have a significant impact on the training decision but no significant influence on the number of apprentices, once the firm has decided to train.
Table 4 Subdivided determinants of the training intensity. Source BIBB CBS 2012/2013
Table reports marginal effects of a negative binomial regression; all costs are in 10,000 Euros per person; %‑change
calculated as (incidence‑rate ratio− 1) × 100; dependent variable: Number of apprentices; controls: Firm’s size(in
#employees), Firm’s age (in years), Collective agreements (binary), Worker representation (binary), Training occupation, and
Federal state; standard errors in parentheses; * statistically significant at the 0.10 level; ** at the 0.05 level; *** at the 0.01
level
Euro determinant All determinants
(1) (2) %change
Overage costs
Net training costs − 0.0507*** (0.019) − 0.0501*** (0.019) − 4.88%
Retention risk − 2.5653*** (0.793) − 92.31%
Underage costs
Hiring costs 0.0098 (0.055) − 0.0238 (0.053) − 2.35%
Outage costs 0.0014* (0.001) 0.0019** (0.001) 0.19%
Miscast costs 0.7870 (0.514) 119.68%
Demand structure
Industry volatility 0.0220** (0.010) 0.0261** (0.010) 2.64%
Constant − 4.0623*** (0.490) − 2.7810*** (0.665)
Controls Included Included Included
Number of observations 3252 3252 3252
Pseudo R2 0.040 0.044 0.044
same sign but are less important.22 The reason for this finding could be that these firms
have already decided to train apprentices in the first place.
Moreover, we focus on firms with Collective Agreements because they face pre-deter-
mined wages (for apprentices, instructors, recruiters, etc.), which generally make up for
most of the costs. Thus, we assume their costs to be exogenous. The results still hold for
the subsample of firms with collective agreements (Table 6). However, the interaction of
the demand structure with the critical ratio is not significant anymore and has thus no
enhancing relation to the inventory of skills. Overall, we find that our results are rather
robust to different specifications.
Conclusion
In this paper, we investigate the conditions under which firms are willing to make long-term
investments in a skilled workforce themselves (invest in an inventory of skilled workers)
rather than relying on skilled workers produced by other companies or within the education
system. We apply inventory theory to apprenticeship training to explain how firms decide
on their optimal “inventory of skills” produced ahead of time to meet demand in the future.
Using a negative binomial regression model, we analyze detailed information on different
costs and benefits of a firm’s apprenticeship training in Germany (BIBB CBS 2012).
We find that first, the lower a firm’s overage costs, the higher is its investments in
inventory of skilled workers. Second, the higher a firm’s underage costs, the higher is its
investments in inventory of skilled workers. Third, given an identical cost structure, the

Page 15 of 17Pfeifer and Backes‑Gellner Empirical Res Voc Ed Train (2018) 10:6
higher a firm’s expected demand for skilled workers, i.e., the more volatile the industry
with continuously changing demands, the higher is its investments in an inventory of
skilled workers.
Table 5 Main determinants of the training intensity for training-firms. Source BIBB CBS
2012/2013
Table reports marginal effects of a negative binomial regression for training‑firms; all costs are in 10,000 Euros per person;
%‑change calculated as (incidence‑rate ratio− 1) × 100; dependent variable: Number of apprentices; controls: Firm’s size (in
#employees), Firm’s age (in years), Collective agreements (binary), Worker representation (binary), Training occupation, and
Federal state; standard errors in parentheses; * statistically significant at the 0.10 level; ** at the 0.05 level; *** at the 0.01
level
OC UC DS Interaction CR DS
(1) %change (2) %change
Overage costs
Total overage costs − 0.0258*** (0.005) − 2.55%
Underage costs
Total underage costs 0.0002 (0.000) 0.02%
Demand structure
Industry volatility 0.0149*** (0.003) 1.51% 0.0156*** (0.003) 1.57%
Interaction CR DS
Critical ratio 0.0003* (0.000) 0.03%
Critical ratio × volatility 0.00004*** (0.000) 0.00%
Constant − 1.9350*** (0.100) − 1.9155*** (0.096)
Controls Included Included Included Included
Number of observations 2658 2658 2658 2658
Pseudo R2 0.144 0.144 0.141 0.141
Table 6 Main determinants of the training intensity for firms with collective agreements.
Source BIBB CBS 2012/2013
Table reports marginal effects of a negative binomial regression for firms with collective agreements; all costs are in 10,000
Euros per person; %‑change calculated as (incidence‑rate ratio− 1) × 100; dependent variable: Number of apprentices;
controls: Firm’s size (in #employees), Firm’s age (in years), Collective agreements (binary), Worker representation (binary),
Training occupation, and Federal state; standard errors in parentheses; * statistically significant at the 0.10 level; ** at the
0.05 level; *** at the 0.01 level
OC UC DS Interaction CR DS
(1) %change (2) %change
Overage costs
Total overage costs − 0.0654*** (0.017) − 6.33%
Underage costs
Total underage costs 0.0012* (0.001) 0.12%
Demand structure
Industry volatility 0.0306*** (0.011) 3.11% 0.0341*** (0.010) 3.47%
Interaction CR DS
Critical ratio 0.0440 (0.029) 4.50%
Critical ratio × volatility − 0.0020 (0.001) − 0.20%
Constant − 3.5745*** (0.547) − 3.6351*** (0.539)
Controls Included Included
Number of observations 1592 1592 1592 1592
Pseudo R2 0.070 0.070 0.065 0.065

Page 16 of 17Pfeifer and Backes‑Gellner Empirical Res Voc Ed Train (2018) 10:6
Our fourth result shows that the critical ratio, i.e. the underage costs in relation to the
overage costs given the demand structure (industry volatility), is positively related to the
investment in an inventory of skills.23 That is, even if overage costs are high, firms still
decide to train if underage costs are even higher. Yet, these results only hold if a firm’s
expected demand for skilled workers is very high. Thus, firms in more volatile markets
with a potentially higher future demand for skilled workers (who are able to fulfill all
kinds of different jobs) are more likely to take the risk and invest in apprenticeship train-
ing today for a potential need of skilled workers tomorrow. This finding suggests that—
although it may be costly to train—in certain market situations it is even more costly
“not to train”.
With respect to policy implications and practical contributions, the results of this
paper clearly indicate that underage costs, i.e. problems and costs due to not having
enough skilled workers are much more important than previously discussed in the liter-
ature. Avoiding such costs by training in excess of current short-term demands is thus an
important—so far neglected—benefit of participating in apprenticeship training. Train-
ing specialists and managers responsible for training matters in companies can use these
findings in internal discussions to convince finance or operation executives regarding
the benefits and participation in apprenticeship training. Educational policy makers can
use the findings to underline the attractiveness of the dual system, especially for example
in times when demand for apprentices or apprenticeship graduates is low in the short
term, but could be higher again as soon as the economic tides turn again.
Authors’ contributions
HP and UBG carried out the analysis and wrote the article. All authors read and approved the final manuscript.
Author details1 Federal Institute for Vocational Education and Training, Robert-Schuman-Platz 3, 53175 Bonn, Germany. 2 University of Zurich, Plattenstrasse 14, 8032 Zurich, Switzerland.
Acknowledgements
We thank Franziska Burkart for valuable research assistance. We thank Bernd Fitzenberger, Edward Lazear, Eric Bettinger, Felix Wenzelmann, Jens Mohrenweiser, Samuel Muehlemann, Simon Janssen, and seminar participants at the University of Zurich for their helpful comments and suggestions. We also thank Natalie Reid for language consultation.
Competing interests
The authors declare that they have no competing interests. An earlier version of this paper was published as a Working Paper in ‘Economics of Education Working Paper Series’ by the Department of Business Administration (IBW) at the University of Zurich.
Availability of data and materials
The micro data used for the analysis is accessible for researchers at the Research Data Center of BIBB. The macro data is publicly available at the German Federal Statistical Office (DESTATIS) and the Federal Employment Agency.
Ethics approval and consent to participate
Not applicable.
Funding
This study is partly funded by the Swiss State Secretariat for Education, Research, and Innovation (SERI) through its Lead-ing House on the Economics of Education, Firm Behavior and Training Policies.
Publisher’s NoteSpringer Nature remains neutral with regard to jurisdictional claims in published maps and institutional affiliations.
Received: 16 February 2018 Accepted: 18 June 2018
23 We expect firms offering other professional skills development such as traineeship or further education of employ-ees to behave accordingly.

Page 17 of 17Pfeifer and Backes‑Gellner Empirical Res Voc Ed Train (2018) 10:6
References
Backes-Gellner U (1996) Betriebliche Bildungs- und Wettbewerbsstrategien im deutsch-britischen Vergleich: ein Beitrag der Personalökonomie zur internationalen Betriebswirtschaftslehre. Hampp, München
Backes-Gellner U, Kluike M, Pull K, Schneider MR, Teuber S (2016) Human resource management and radical innovation: a fuzzy-set QCA of US multinationals in Germany, Switzerland, and the UK. J Bus Econ 86(7):751–772
Beicht U, Walden G, Herget H (2004) Kosten und Nutzen der betrieblichen Berufsausbildung in Deutschland. W. Bertels-mann Verlag, Bielefeld, Bundesinstitut für Berufsbildung (BIBB)
BIBB (Bundesinstitut für Berufsbildung Bonn) (2016) Datenreport zum Berufsbildungsbericht 2016. W. Bertelsmann Verlag, Bielefeld
Blatter M, Muehlemann S, Schenker S (2012) The costs of hiring skilled workers. Eur Econ Rev 56(1):20–35Blatter M, Muehlemann S, Schenker S, Wolter SC (2016) Hiring costs for skilled workers and the supply of firm-provided
training. Oxf Econ Pap 68(1):238–257Cameron AC, Trivedi PK (2013) Regression analysis of count data. Cambridge University Press, CambridgeCappelli PH (2008) Talent on demand: managing talent in an uncertain age. Harvard Business School Press, BostonChikán A (ed) (1990) Inventory models. Kluwer Academic Publishers, DordrechtCzepek J, Dummert S, Kubis A, Leber U, Mueller A, Stegmaier J (2015) Betriebe im Wettbwerb um Arbeitskräfte. Bedarf,
Engpässe und Rekrutierungsprozesse in Deutschland. W. Bertelsmann Verlag, BielefeldDESTATIS (2015) Bildung und Kultur. Statistisches Bundesamt, WisebadenDionisius R, Muehlemann S, Pfeifer H, Walden G, Wenzelmann F, Wolter SC (2009) Costs and benefits of apprenticeship
training. A comparison of Germany and Switzerland. Appl Econ Q 55(1):7–37Erlenkotter D (1990) Ford Whitman Harris and the economic order quantity model. Oper Res 38(6):937–946Harris FW (1913) How many parts to make at once. Factory. Mag Manag 10(2):135–136Jansen A, Pfeifer H, Schönfeld G, Wenzelmann F (2015) Ausbildung in Deutschland weiterhin investitionsorientiert—
Ergebnisse der BIBB-Kosten-Nutzen-Erhebung 2012/13. Forschungs- und Arbeitsergebnisse aus dem Bundesinstitut für Berufsbildung (BIBB). W. Bertelsmann Verlag, Bielefeld
Kriechel B, Muehlemann S, Pfeifer H, Schuette M (2014) Works councils, collective bargaining, and apprenticeship train-ing—evidence from German firms. Ind Relat J Econ Soc 53(2):199–222
Majumdar S (2007) Market conditions and worker training: how does it affect and whom? Labour Econ 14(1):1–23Mohrenweiser J, Backes-Gellner U (2010) Apprenticeship training: for investment or substitution? Int J Manpow
31(5):545–562Muehlemann S, Pfeifer H (2016) The structure of hiring costs in Germany: evidence from firm-level data. Ind Relat J Econ
Soc 55(2):193–218Muehlemann S, Schweri J, Winkelmann R, Wolter SC (2007) An empirical analysis of the decision to train apprentices.
Labour 21(3):419–441Muehlemann S, Pfeifer H, Walden G, Wenzelmann F, Wolter SC (2010) The financing of apprenticeship training in the light
of labor market regulations. Labour Econ 17(5):799–809Schoenfeld G, Wenzelmann F, Dionisius R, Pfeifer H, Walden G (2010) Kosten und Nutzen der dualen Ausbildung aus Sicht
der Betriebe: Ergebnisse der vierten BIBB-Kosten-Nutzen-Erhebung. W. Bertelsmann Verlag, BielefeldSchoenfeld G, Jansen A, Wenzelmann F, Pfeifer H (2016) Kosten und Nutzen der dualen Ausbildung aus Sicht der
Betriebe: Ergebnisse der fünften BIBB-Kosten-Nutzen-Erhebung. W. Bertelsmann Verlag, BielefeldWenzelmann F, Muehlemann S, Pfeifer H (2017) The costs of recruiting apprentices: evidence from German establish-
ment-level data. Ger J Hum Resour Manag 31(2):108–131Winkelmann R (1996) Employment prospects and skill acquisition of apprenticeship-trained workers in Germany. ILR Rev
49(4):658–672Wolter SC (2008) Ausbildungskosten und -nutzen und die betriebliche Nachfrage nach Lehrlingen. Perspektiven der
Wirtschaftspolitik 9(s1):90–108Wolter SC, Ryan P (2011) Apprenticeship. In: Hanushek EA, Machin SJ, Woessmann L (eds) Handbook of the economics of
education, vol 3. Elsevier, Amsterdam, pp 521–576Wolter SC, Mühlemann S, Schweri J (2006) Why some firms train apprentices and many others do not. Ger Econ Rev
7(3):249–264Wooldridge JM (2010) Econometric analysis of cross section and panel data. MIT press, CambridgeZika G, Maier T, Helmrich R, Hummel M, Kalinowski M, Hänisch C, Wolter MI, Mönnig A (2015) Qualifikations- und
Berufsfeldprojektionen bis 2030: Engpässe und Überhänge regional ungleich verteilt. IAB-Kurzbericht 9/2015. W. Bertelsmann Verlag, Bielefeld