Embed Size (px)
Citation preview
Annual Results 2010Annual Results 2010China Telecom Corporation Limited22 March 2011 | www.chinatelecom-h.com

Forward-Looking Statements
Certain statements contained in this document may be viewed as “forward-
looking statements” within the meaning of Section 27A of the U.S. Securities
Act of 1933 (as amended) and Section 21E of the U.S. Securities Exchange Act
of 1934 (as amended). Such forward-looking statements are subject to known
and unknown risks, uncertainties and other factors, which may cause the
actual performance, financial condition or results of operations of China
Telecom Corporation Limited (the “Company”) to be materially different from
any future performance, financial condition or results of operations implied by
such forward-looking statements. In addition, we do not intend to update
these forward-looking statements. Further information regarding these risks,
uncertainties and other factors is included in the Company’s most recent
Annual Report on Form 20-F filed with the U.S. Securities and Exchange
Commission (the “SEC”) and in the Company’s other filings with the SEC.
2
3
Presentation by
Chairman & CEO
President & COO
Executive Vice President & CFO
Executive Vice President
4
Agenda
Overview
Business Review
Financial Performance
1
2
3

OverviewOverview

6
Highlights
Effective integrated operation driving remarkable earnings recovery
Accelerate strategic broadband deployment to enhance sustainable core competence
Rapid mobile growth with scale benefits emerging
To strengthen differentiation development leveraging “Mobile Internet” to create more value

7
Solid Results
Adjusted Results 2009 2010 Change
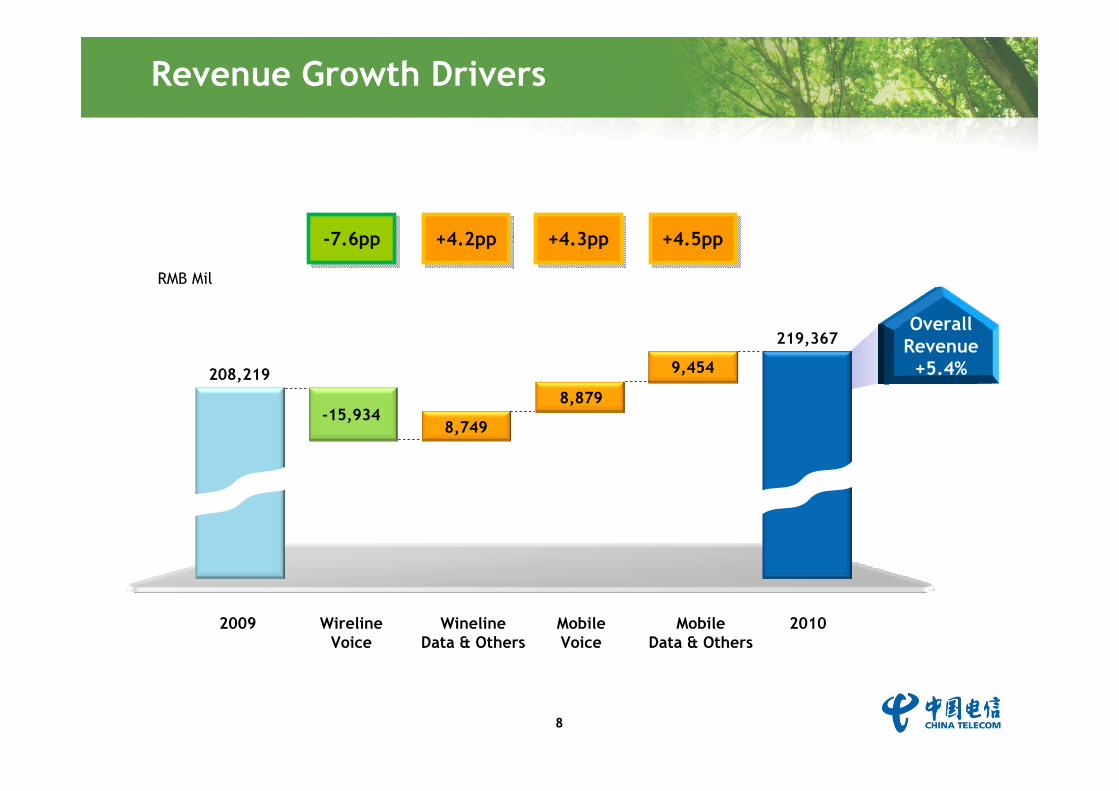
Operating Revenue (RMB Mil) 208,219 219,367 5.4%
EBITDA (RMB Mil) 82,133 88,495 7.7%
EBITDA Margin 39.4% 40.3% 0.9pp
Net Profit (RMB Mil) 13,271 15,262 15.0%
EPS (RMB) 0.164 0.189 15.0%
Free Cash Flow (RMB Mil) 31,159 27,107 -13.0%
2009.12 2010.12 Change
Access Lines in Services (Mil) 188.56 175.05 -13.51
Mobile Subs (Mil) 56.09 90.52 34.43
Including: 3G Subs (Mil) 4.07 12.29 8.22
Wireline Broadband Subs (Mil) 53.46 63.48 10.02
Notes: Unless otherwise stated in this presentation1. All financial data were adjusted to exclude Upfront Connection Fees2. EBITDA was calculated before CDMA Network Leasing Fees (2009: RMB8,383 mil; 2010: RMB13,320 mil) to enhance comparability3. Net Profit represented profit attributable to equity holders of the Company4. Free Cash Flow = EBITDA – CDMA Network Leasing Fees – CAPEX – Income Tax Expenses
8
Revenue Growth Drivers
WirelineVoice
2009 WinelineData & Others
Mobile Voice
Mobile Data & Others
2010
-7.6pp +4.2pp +4.3pp +4.5pp
208,219
-15,934
RMB Mil
8,749
8,879
9,454
Overall Revenue
+5.4%
219,367

9
Strategic Transformation OptimizingRevenue Structure
Mobile business as a key growth driver:
• Revenue 51.5% yoy
• Revenue/total revenue: 24.6% ( 7.5pp yoy)
Robust growth across strategic businesses (mobile, wireline data & others):
• Revenue 20.9% yoy
• Revenue/total revenue:71.5% ( 9.2pp yoy)
Wireline operating risk further alleviated:
• Wireline voice revenue as a % of total revenue lowered to 28.5%
• PAS revenue only 2.1% of total revenue
Revenue Structure
2009
37.7%
2010
45.2%
9.6%7.5%
28.5%
46.9%
13.2%
11.4%Mobile Data &
Others
Mobile Voice
Wireline Data & Others
Wireline Voice

10
Rapid Mobile Expansion with Robust Quality
Mobile Subs Market Share
Mobile subs base expanding rapidly
• 2010 subs net add: 34.43 mil
• Subs base >90mil & market share >10%
• 3G subs base: 12.29 mil (13.6% of subs base)
Revenue & subs base growing in tandem (mobile ARPU of RMB54.2)
Invigorated value chain
• CDMA terminals: ~800 models
3G terminals: ~300 models ( 200 yoy)
3G terminals ASP 50% yoy
• Open channel terminal sales: 61% ( 9pp yoy)
• Open channel point-of-sales: ~580k ( 40k yoy)
RMB Mil
2009
30,003
2010
Service Revenue
47,722
Subscribers
3G Subs
Mil
56.094.07
2009
27.91
2008
90.5212.29
2010
4.5%7.7%
10.8%
11
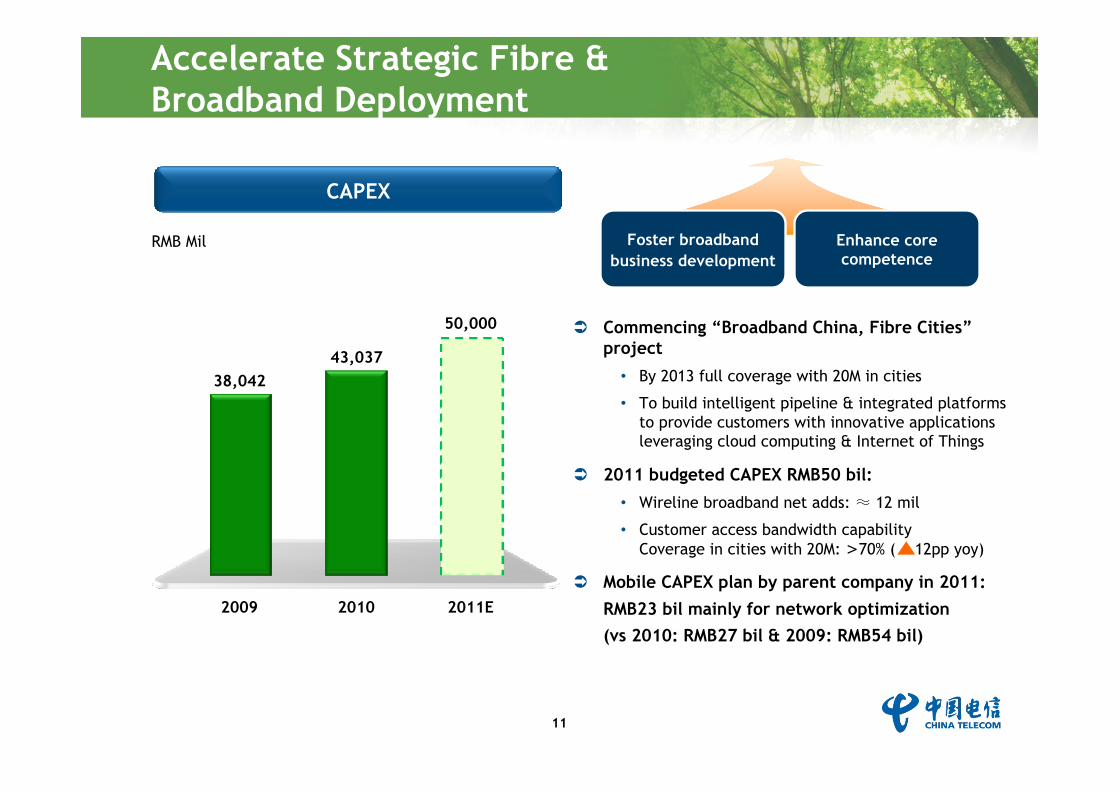
Commencing “Broadband China, Fibre Cities”project
• By 2013 full coverage with 20M in cities
• To build intelligent pipeline & integrated platforms to provide customers with innovative applications leveraging cloud computing & Internet of Things
2011 budgeted CAPEX RMB50 bil:
• Wireline broadband net adds: ≈ 12 mil
• Customer access bandwidth capabilityCoverage in cities with 20M: >70% ( 12pp yoy)
Mobile CAPEX plan by parent company in 2011:RMB23 bil mainly for network optimization(vs 2010: RMB27 bil & 2009: RMB54 bil)
Accelerate Strategic Fibre & Broadband Deployment
RMB Mil
2010 2011E2009
43,037
50,000
38,042
Foster broadband business development
Enhance core competence
CAPEX
12
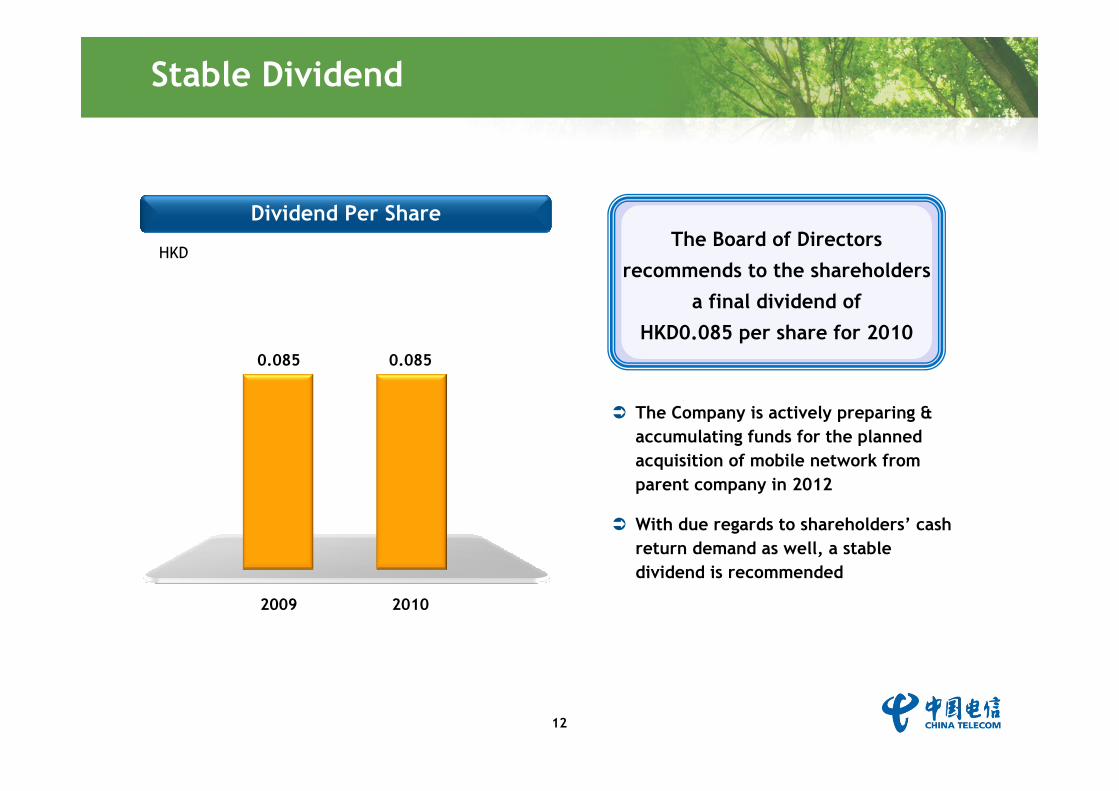
Stable Dividend
HKD
2009 2010
0.085 0.085
Dividend Per Share
The Company is actively preparing & accumulating funds for the planned acquisition of mobile network from parent company in 2012
With due regards to shareholders’ cash return demand as well, a stable dividend is recommended
The Board of Directors recommends to the shareholders
a final dividend of HKD0.085 per share for 2010
13
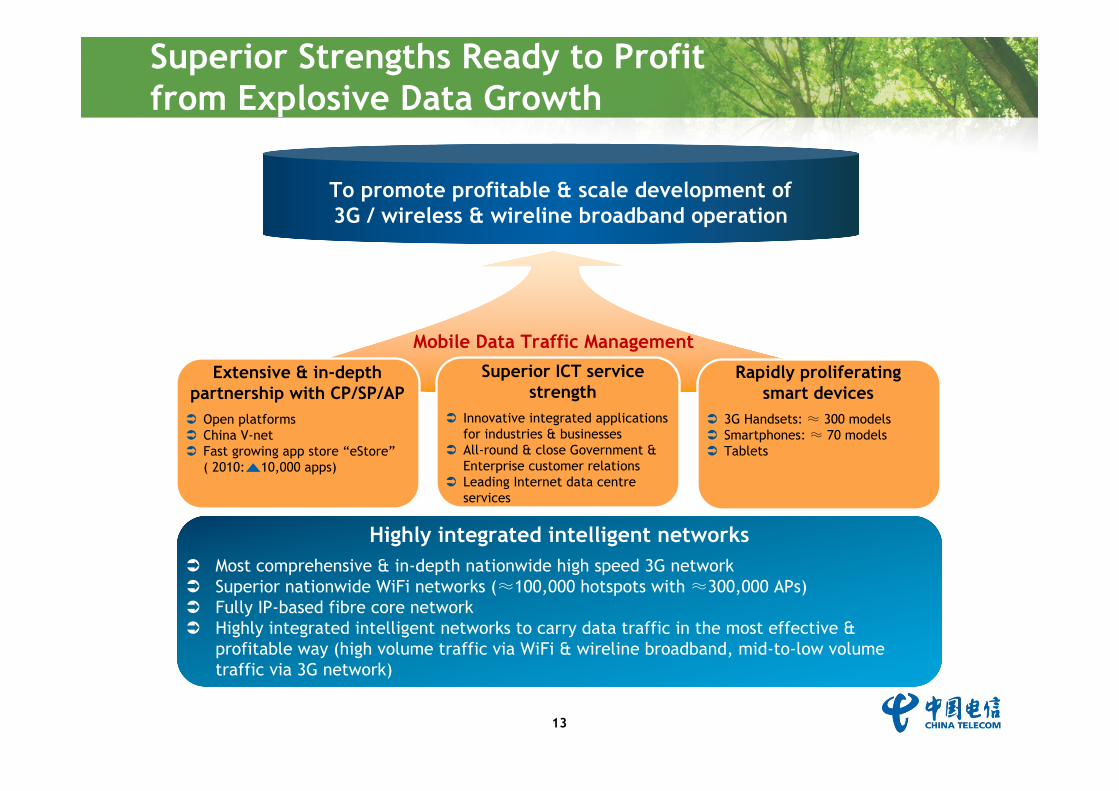
Superior Strengths Ready to Profitfrom Explosive Data Growth
Highly integrated intelligent networksMost comprehensive & in-depth nationwide high speed 3G networkSuperior nationwide WiFi networks (≈100,000 hotspots with ≈300,000 APs)Fully IP-based fibre core networkHighly integrated intelligent networks to carry data traffic in the most effective & profitable way (high volume traffic via WiFi & wireline broadband, mid-to-low volume traffic via 3G network)
Extensive & in-depth partnership with CP/SP/AP
Open platformsChina V-netFast growing app store “eStore”( 2010: 10,000 apps)
Superior ICT service strength
Innovative integrated applications for industries & businessesAll-round & close Government & Enterprise customer relationsLeading Internet data centre services
Rapidly proliferating smart devices
3G Handsets: ≈ 300 modelsSmartphones: ≈ 70 modelsTablets
To promote profitable & scale development of 3G / wireless & wireline broadband operation
Mobile Data Traffic Management
14
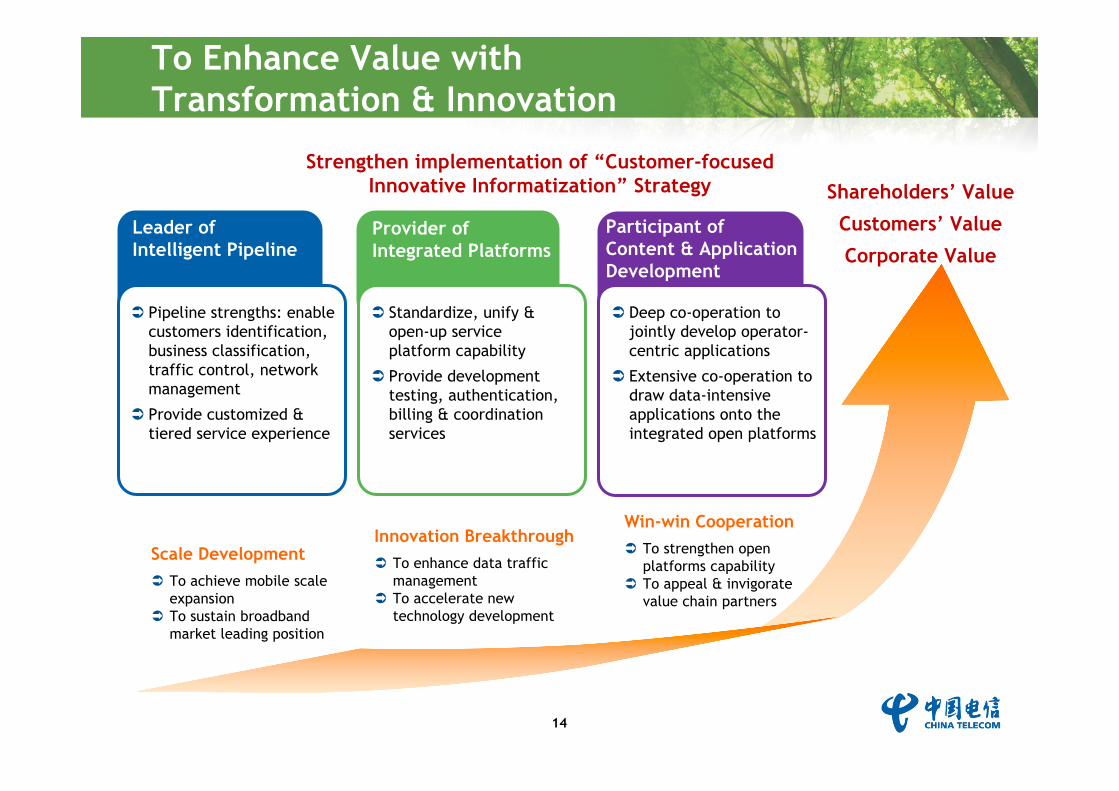
To Enhance Value withTransformation & Innovation
Pipeline strengths: enable customers identification, business classification, traffic control, network management
Provide customized & tiered service experience
Standardize, unify & open-up service platform capability
Provide development testing, authentication, billing & coordination services
Deep co-operation to jointly develop operator-centric applications
Extensive co-operation to draw data-intensive applications onto the integrated open platforms
Leader of Intelligent Pipeline
Provider of Integrated Platforms
Participant of Content & Application Development
Scale DevelopmentTo achieve mobile scale expansionTo sustain broadband market leading position
Innovation BreakthroughTo enhance data traffic managementTo accelerate new technology development
Win-win CooperationTo strengthen open platforms capabilityTo appeal & invigorate value chain partners
Shareholders’ Value
Customers’ Value
Corporate Value
Strengthen implementation of “Customer-focused Innovative Informatization” Strategy

Business Business ReviewReview
16
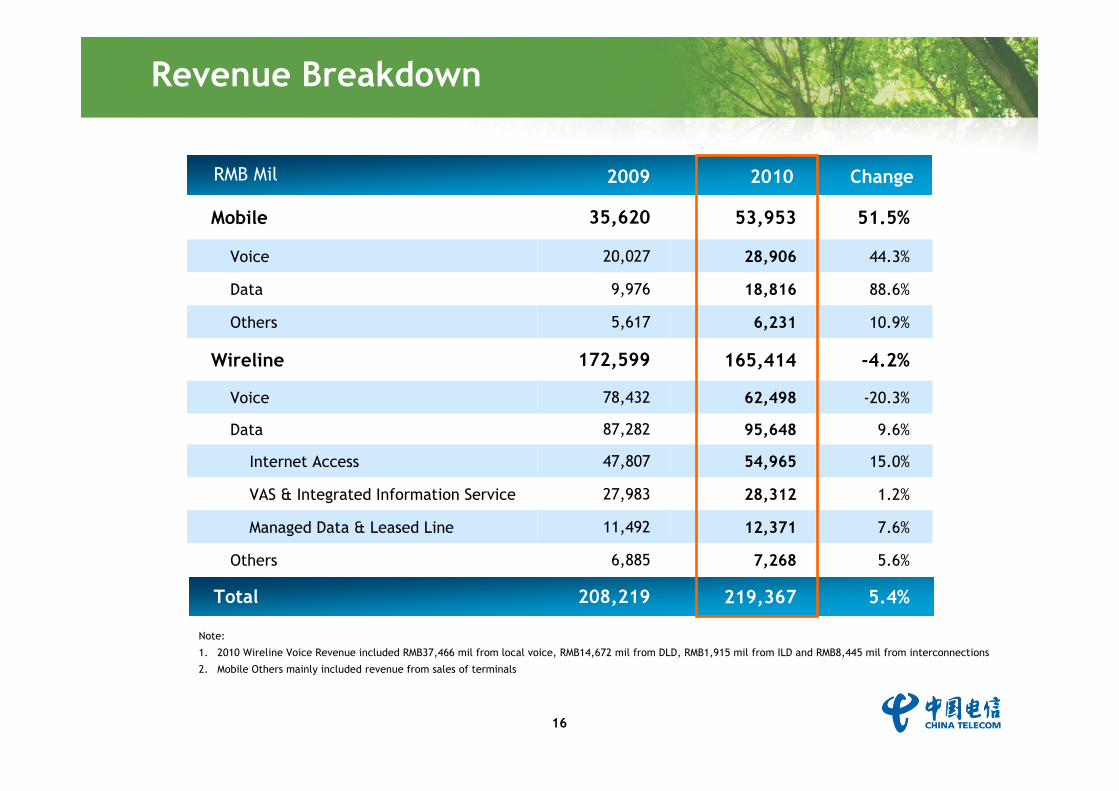
Revenue Breakdown
RMB Mil 2009 2010 Change
Mobile 35,620 53,953 51.5%
Voice 20,027 28,906 44.3%
Data 9,976 18,816 88.6%
Others 5,617 6,231 10.9%
Wireline 172,599 165,414 -4.2%
Voice 78,432 62,498 -20.3%
Data 87,282 95,648 9.6%
Internet Access 47,807 54,965 15.0%
VAS & Integrated Information Service 27,983 28,312 1.2%
Managed Data & Leased Line 11,492 12,371 7.6%
Others 6,885 7,268 5.6%
Total 208,219 219,367 5.4%
Note:
1. 2010 Wireline Voice Revenue included RMB37,466 mil from local voice, RMB14,672 mil from DLD, RMB1,915 mil from ILD and RMB8,445 mil from interconnections
2. Mobile Others mainly included revenue from sales of terminals
17
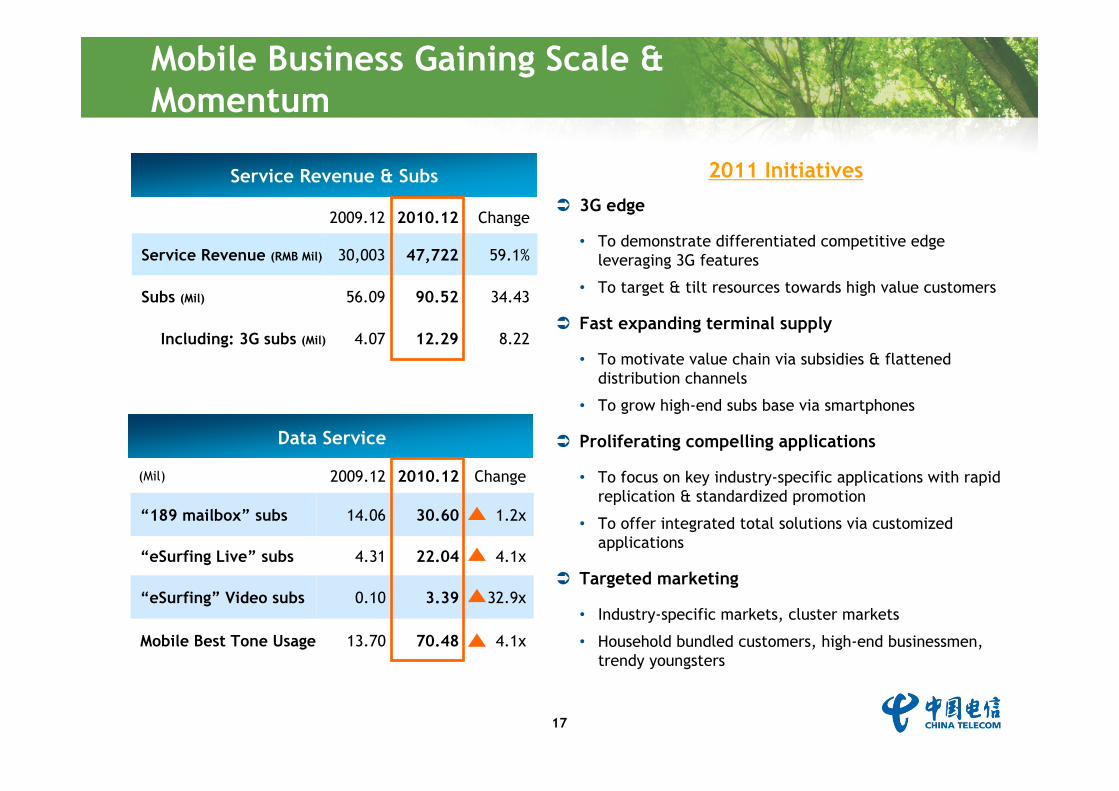
Mobile Business Gaining Scale & Momentum
2009.12 2010.12 Change
Service Revenue (RMB Mil) 30,003 47,722 59.1%
Subs (Mil) 56.09 90.52 34.43
Including: 3G subs (Mil) 4.07 12.29 8.22
Data Service
(Mil) 2009.12 2010.12 Change
“189 mailbox” subs 14.06 30.60 1.2x
“eSurfing Live” subs 4.31 22.04 4.1x
“eSurfing” Video subs 0.10 3.39 32.9x
Mobile Best Tone Usage 13.70 70.48 4.1x
3G edge
• To demonstrate differentiated competitive edge leveraging 3G features
• To target & tilt resources towards high value customers
Fast expanding terminal supply
• To motivate value chain via subsidies & flattened distribution channels
• To grow high-end subs base via smartphones
Proliferating compelling applications
• To focus on key industry-specific applications with rapid replication & standardized promotion
• To offer integrated total solutions via customized applications
Targeted marketing
• Industry-specific markets, cluster markets
• Household bundled customers, high-end businessmen, trendy youngsters
Service Revenue & Subs 2011 Initiatives
18
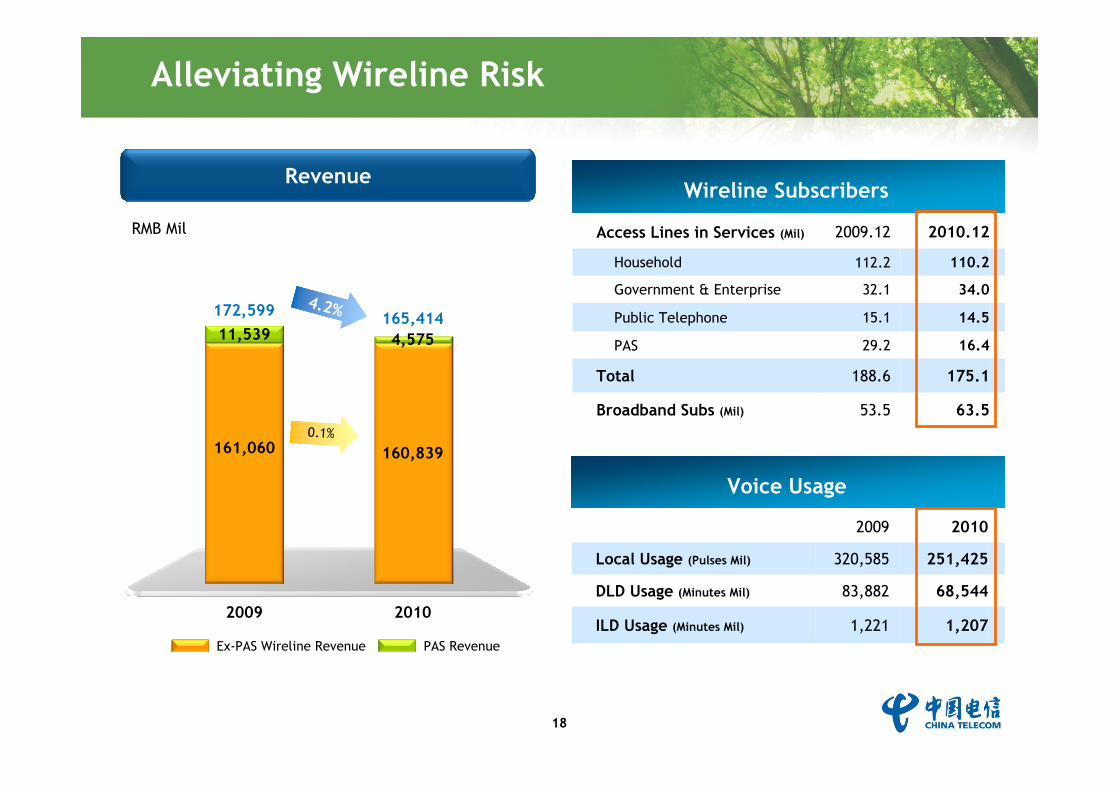
Alleviating Wireline Risk
Wireline Subscribers
2009
Revenue
RMB Mil
172,599 165,414
Ex-PAS Wireline Revenue PAS Revenue
Access Lines in Services (Mil) 2009.12 2010.12
Household 112.2 110.2
Government & Enterprise 32.1 34.0
Public Telephone 15.1 14.5
PAS 29.2 16.4
Total 188.6 175.1
Broadband Subs (Mil) 53.5 63.5
Voice Usage
2009 2010
Local Usage (Pulses Mil) 320,585 251,425
DLD Usage (Minutes Mil) 83,882 68,544
ILD Usage (Minutes Mil) 1,221 1,207
11,539
161,060
4,575
160,8390.1%
4.2%
2010
19
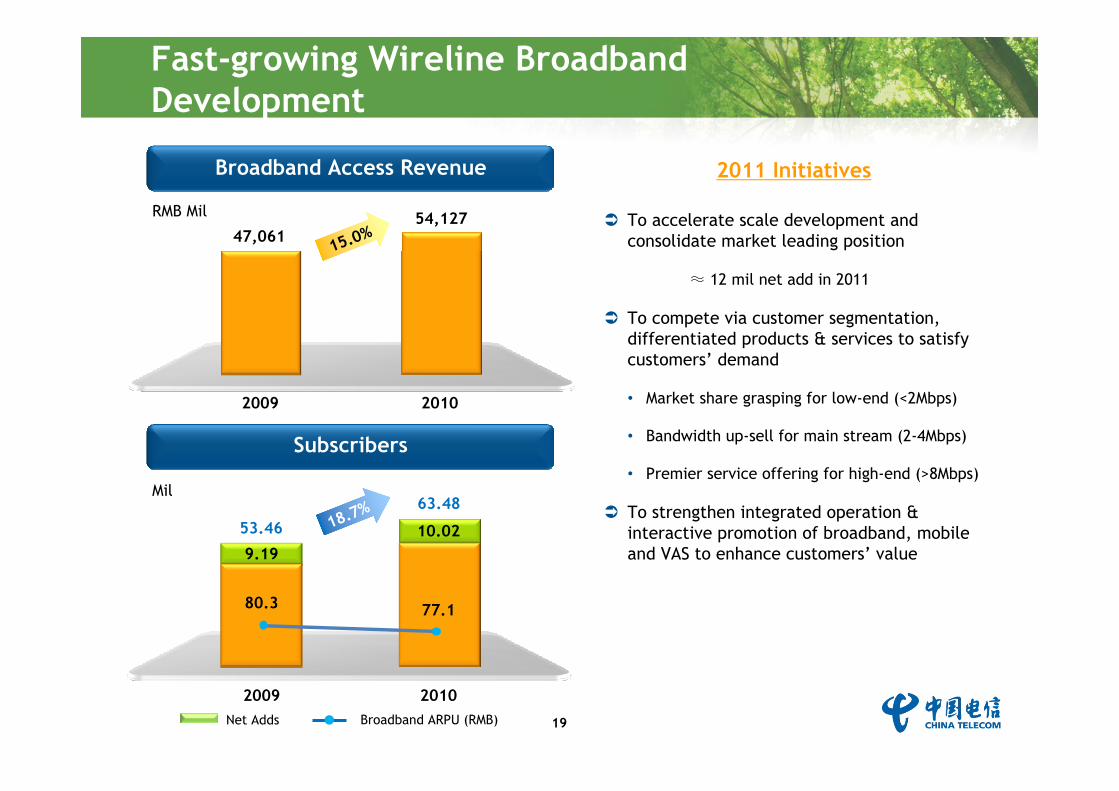
Fast-growing Wireline Broadband Development
Broadband Access Revenue
To accelerate scale development and consolidate market leading position
≈ 12 mil net add in 2011
To compete via customer segmentation, differentiated products & services to satisfy customers’ demand
• Market share grasping for low-end (<2Mbps)
• Bandwidth up-sell for main stream (2-4Mbps)
• Premier service offering for high-end (>8Mbps)
To strengthen integrated operation & interactive promotion of broadband, mobile and VAS to enhance customers’ value
RMB Mil
2009
47,06154,127
2010
Mil
2009
53.46
2010
Subscribers
63.48
9.1910.02
80.3 77.1
Broadband ARPU (RMB)Net Adds
15.0%
18.7%
2011 Initiatives
20
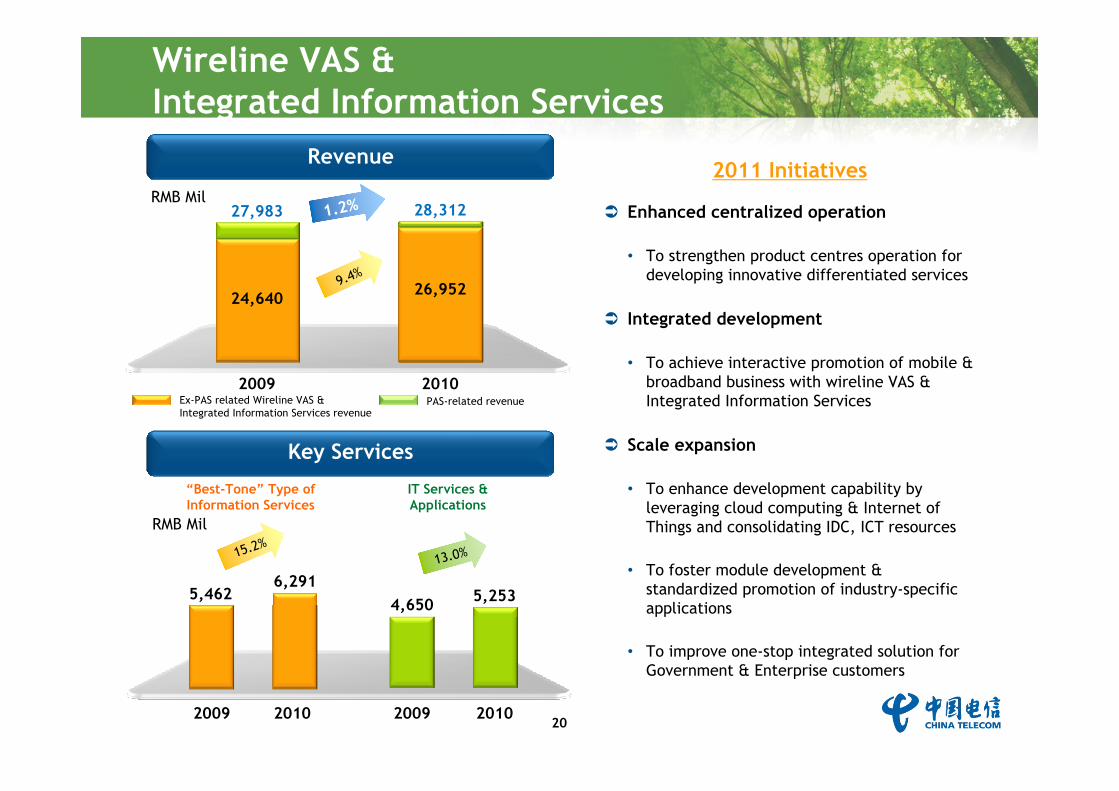
Wireline VAS & Integrated Information Services
15.2%
Revenue
Enhanced centralized operation
• To strengthen product centres operation for developing innovative differentiated services
Integrated development
• To achieve interactive promotion of mobile & broadband business with wireline VAS & Integrated Information Services
Scale expansion
• To enhance development capability by leveraging cloud computing & Internet of Things and consolidating IDC, ICT resources
• To foster module development & standardized promotion of industry-specific applications
• To improve one-stop integrated solution for Government & Enterprise customers
RMB Mil
2009 2010
Key Services
6,2915,462
RMB Mil
2009
27,983
2010
24,6409.4%
28,312
26,952
Ex-PAS related Wireline VAS & Integrated Information Services revenue
PAS-related revenue
13.0%
2009 2010
5,2534,650
IT Services & Applications
“Best-Tone” Type of Information Services
1.2%
2011 Initiatives
21
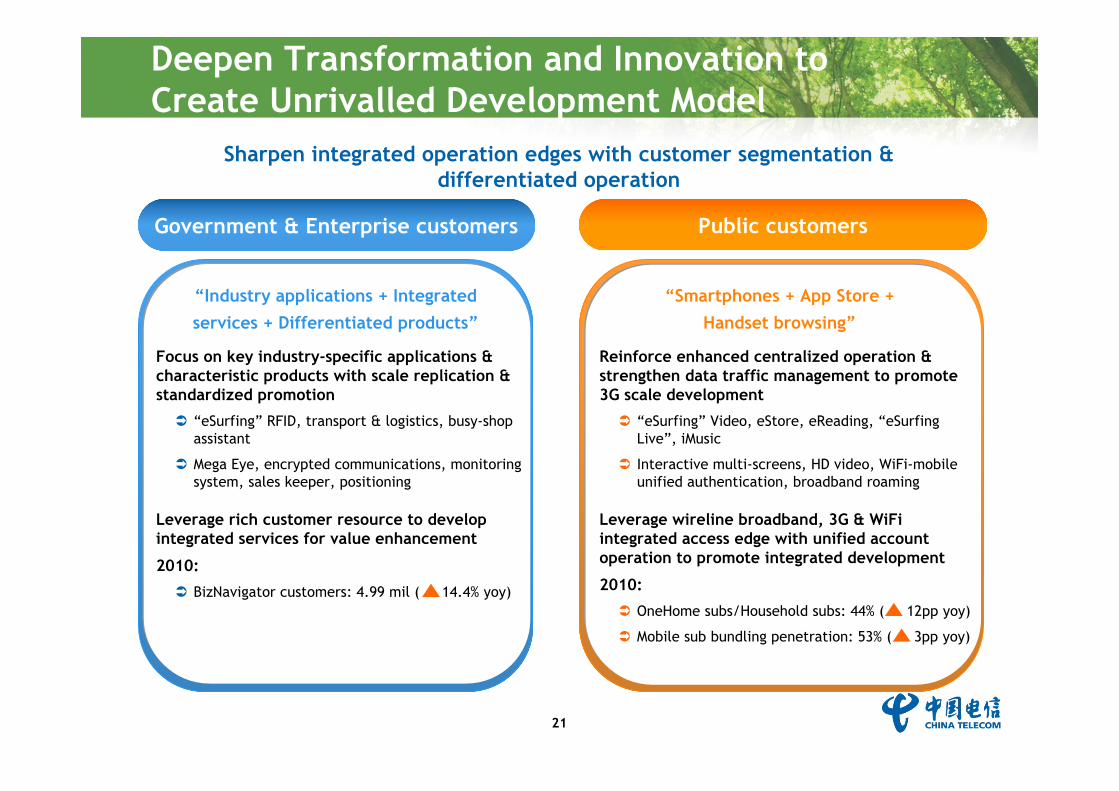
Deepen Transformation and Innovation to Create Unrivalled Development Model
Sharpen integrated operation edges with customer segmentation & differentiated operation
“Smartphones + App Store + Handset browsing”
Focus on key industry-specific applications & characteristic products with scale replication & standardized promotion
“eSurfing” RFID, transport & logistics, busy-shop assistant
Mega Eye, encrypted communications, monitoring system, sales keeper, positioning
Leverage rich customer resource to develop integrated services for value enhancement
2010:
BizNavigator customers: 4.99 mil ( 14.4% yoy)
Reinforce enhanced centralized operation & strengthen data traffic management to promote 3G scale development
“eSurfing” Video, eStore, eReading, “eSurfingLive”, iMusic
Interactive multi-screens, HD video, WiFi-mobile unified authentication, broadband roaming
Leverage wireline broadband, 3G & WiFiintegrated access edge with unified account operation to promote integrated development
2010:
OneHome subs/Household subs: 44% ( 12pp yoy)
Mobile sub bundling penetration: 53% ( 3pp yoy)
Government & Enterprise customers Public customers
“Industry applications + Integrated services + Differentiated products”
Financial Financial PerformancePerformance
23
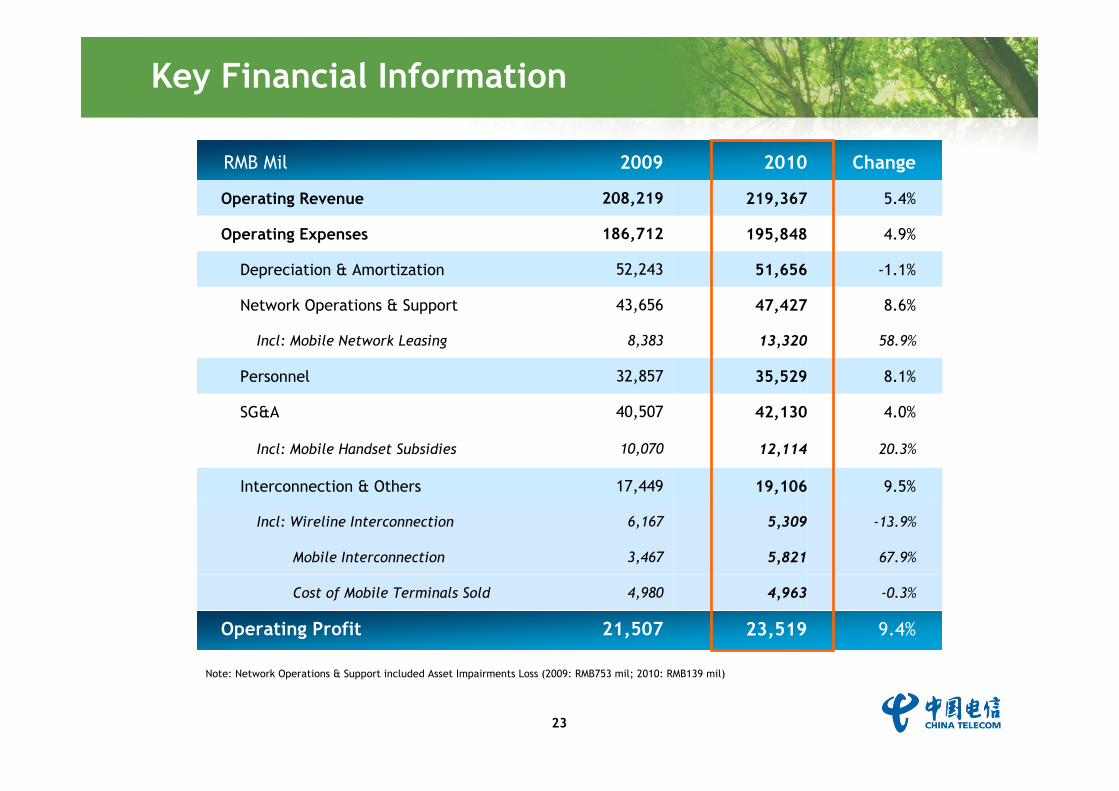
Key Financial Information
RMB Mil 2009 2010 Change
Operating Revenue 208,219 219,367 5.4%
Operating Expenses 186,712 195,848 4.9%
Depreciation & Amortization 52,243 51,656 -1.1%
Network Operations & Support 43,656 47,427 8.6%
Incl: Mobile Network Leasing 8,383 13,320 58.9%
Personnel 32,857 35,529 8.1%
SG&A 40,507 42,130 4.0%
Incl: Mobile Handset Subsidies 10,070 12,114 20.3%
Interconnection & Others 17,449 19,106 9.5%
Incl: Wireline Interconnection 6,167 5,309 -13.9%
Mobile Interconnection 3,467 5,821 67.9%
Cost of Mobile Terminals Sold 4,980 4,963 -0.3%
Operating Profit 21,507 23,519 9.4%
Note: Network Operations & Support included Asset Impairments Loss (2009: RMB753 mil; 2010: RMB139 mil)
24
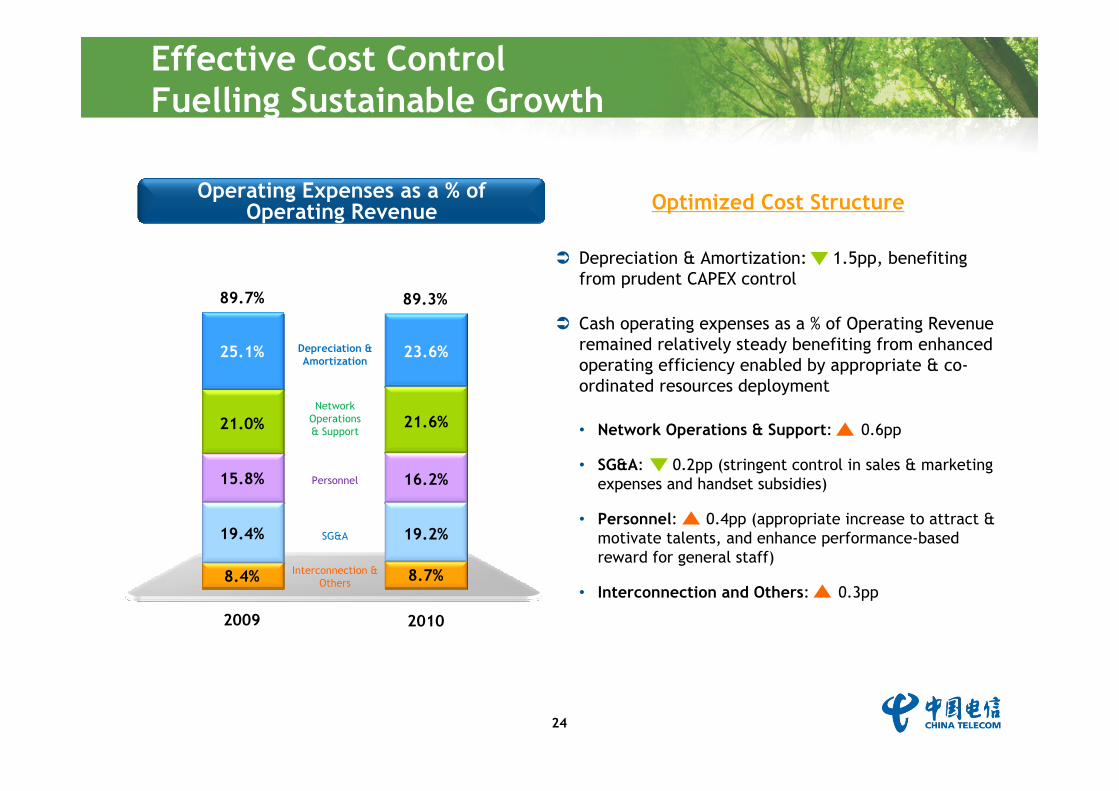
Effective Cost Control Fuelling Sustainable Growth
2009
8.4%
2010
Operating Expenses as a % of Operating Revenue
21.0%
15.8%
25.1%
89.7%
19.4%
8.7%
21.6%
16.2%
23.6%
89.3%
19.2%
Optimized Cost Structure
Network Operations & Support
Depreciation & Amortization
Interconnection & Others
SG&A
Personnel
Depreciation & Amortization: 1.5pp, benefiting from prudent CAPEX control
Cash operating expenses as a % of Operating Revenue remained relatively steady benefiting from enhanced operating efficiency enabled by appropriate & co-ordinated resources deployment
• Network Operations & Support: 0.6pp
• SG&A: 0.2pp (stringent control in sales & marketing expenses and handset subsidies)
• Personnel: 0.4pp (appropriate increase to attract & motivate talents, and enhance performance-based reward for general staff)
• Interconnection and Others: 0.3pp
25
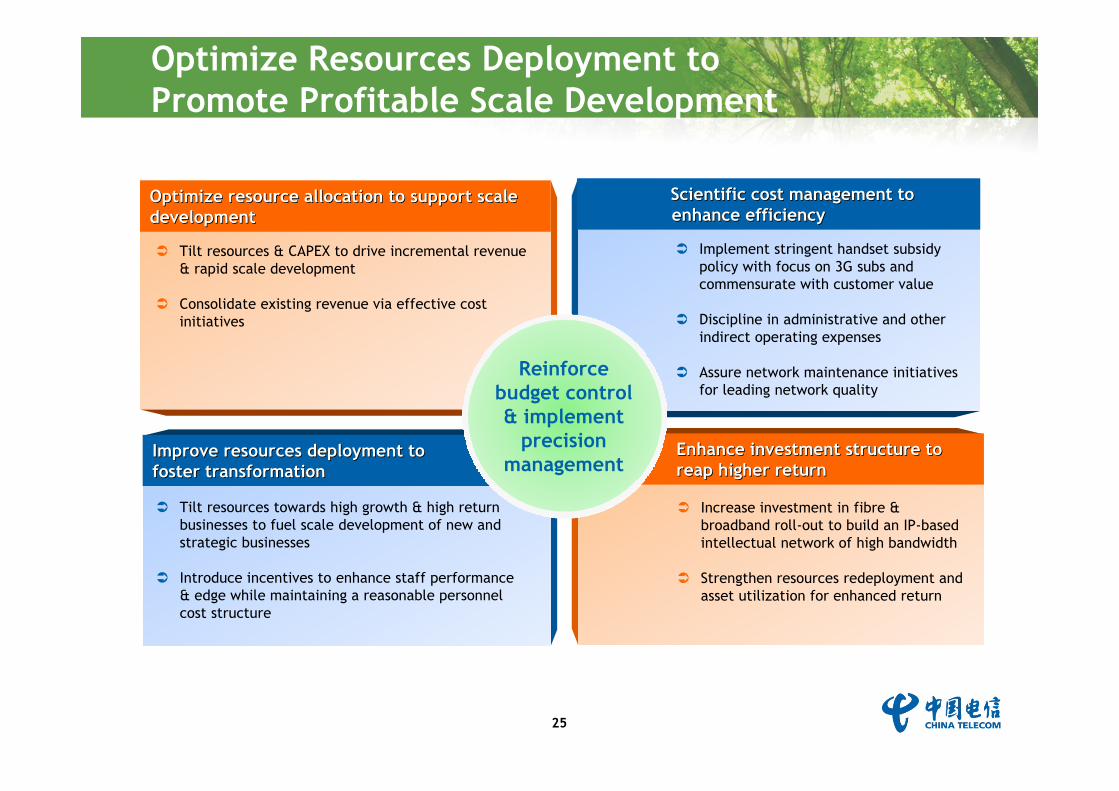
Optimize Resources Deployment to Promote Profitable Scale Development
Optimize resource allocation to support scale Optimize resource allocation to support scale developmentdevelopment
Scientific cost management to Scientific cost management to enhance efficiencyenhance efficiency
Improve resources deployment to Improve resources deployment to foster transformationfoster transformation
Enhance investment structure to Enhance investment structure to reap higher returnreap higher return
Tilt resources towards high growth & high return businesses to fuel scale development of new and strategic businesses
Introduce incentives to enhance staff performance & edge while maintaining a reasonable personnel cost structure
Tilt resources & CAPEX to drive incremental revenue & rapid scale development
Consolidate existing revenue via effective cost initiatives
Increase investment in fibre & broadband roll-out to build an IP-based intellectual network of high bandwidth
Strengthen resources redeployment and asset utilization for enhanced return
Reinforce budget control & implement
precision management
Implement stringent handset subsidy policy with focus on 3G subs and commensurate with customer value
Discipline in administrative and other indirect operating expenses
Assure network maintenance initiatives for leading network quality

26
Strictly control investment in traditional wireline business and increase investment in transformation business to enhance network servicing capability
Speed up fibre & broadband roll-out to maintain edge and enhance sustainable development:
Broadband & Internet 10.1pp yoy
VAS & Integrated Information Services 3.9pp yoy
IT & Support 0.8pp yoy
Wireline Voice 1.8pp yoy
Infrastructure & Others 3.6pp yoy
17.9m broadband access capacity in 2010
Customer access bandwidth capability:
Coverage in cities
Enhanced CAPEX Structure Supporting Strategic Transformation
CAPEX Structure
Note:1. Broadband & Internet included data network, transmission network, broadband access equipment & cable2. VAS & Integrated Information Services included VAS platform & ICT3. IT & Support included enterprise informatization services4. Wireline Voice included switches, voice access equipment & cable5. Infrastructure & Others included air-conditioning supply facilities, conduits, buildings, minor purchases, R&D, etc.
4M:
20M:
98%
58% 22pp yoy
3pp yoy
2009
54.1%
2010
20.2%
17.8%
3.7%
64.2%
16.6%
13.9%
2.9%IT & Support
VAS & Integrated Information Services
Broadband & Internet
Wireline Voice4.2% 2.4%
Infrastructure & Others
27
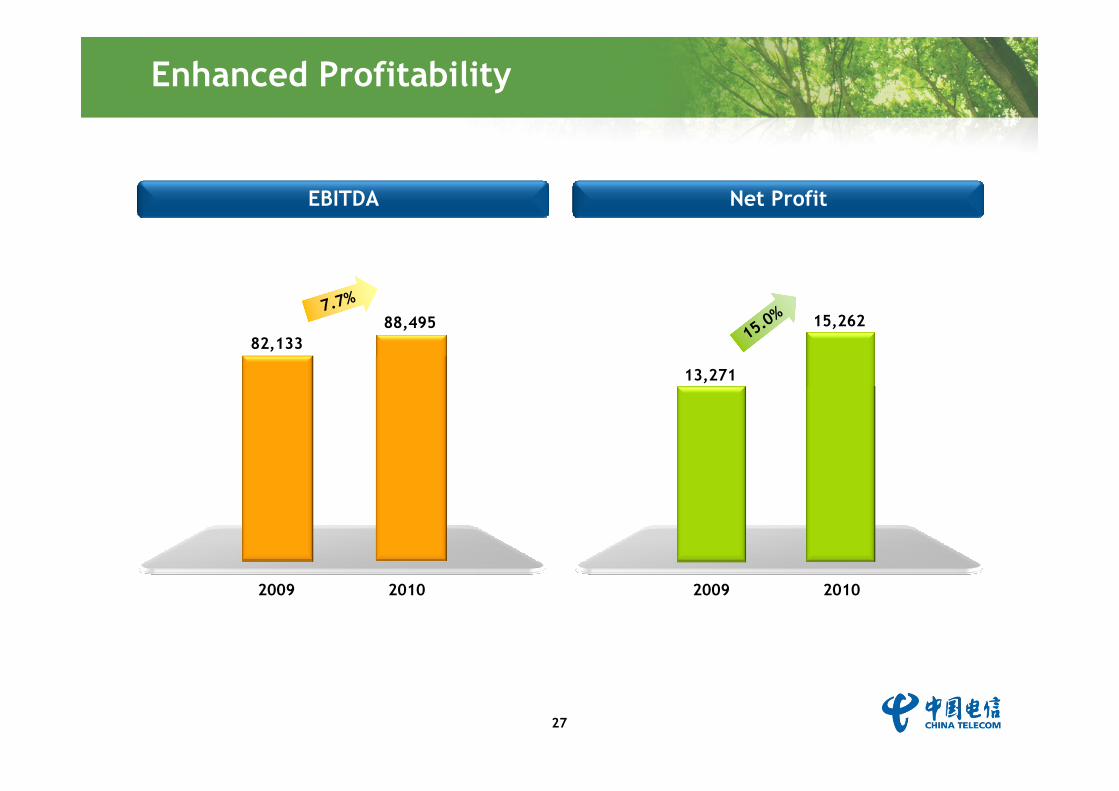
Enhanced Profitability
2009 2010
88,495
EBITDA
2009 2010
Net Profit
13,271
15,26282,133
7.7%
15.0%
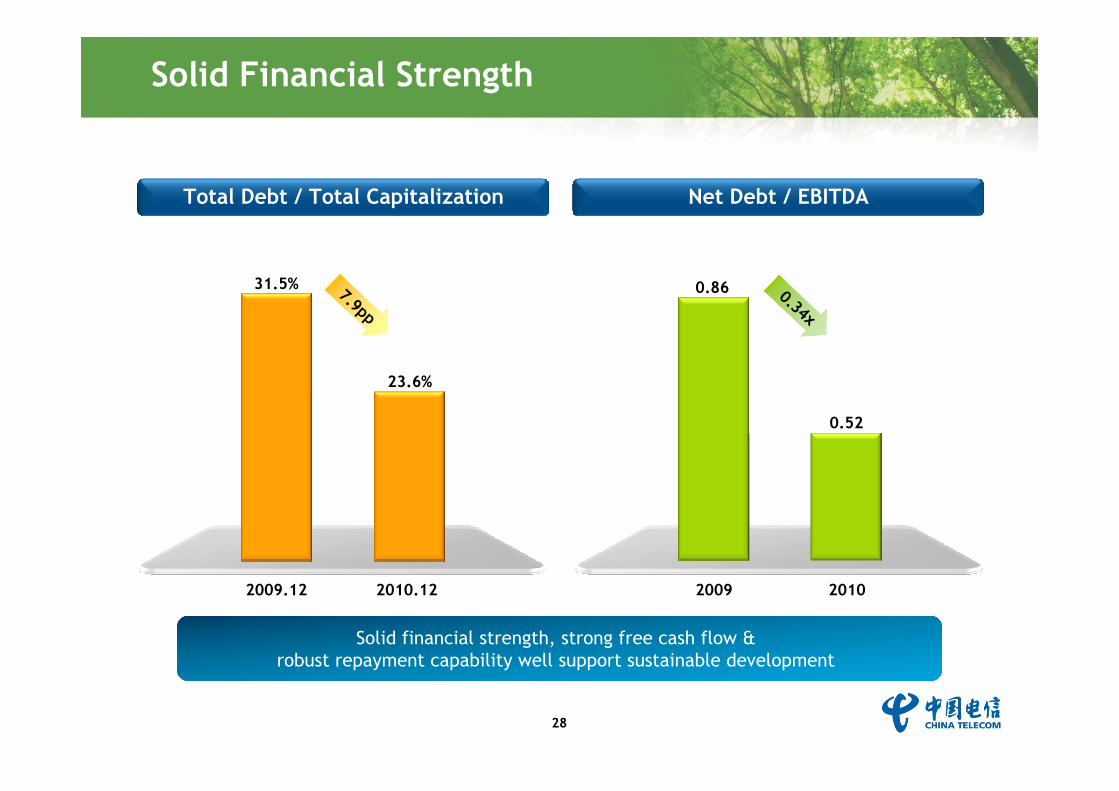
28
2009.12 2010.12 2009 2010
Solid Financial Strength
23.6%
Total Debt / Total Capitalization Net Debt / EBITDA
0.86
0.52
31.5%
Solid financial strength, strong free cash flow & robust repayment capability well support sustainable development
7.9pp0.34x
29
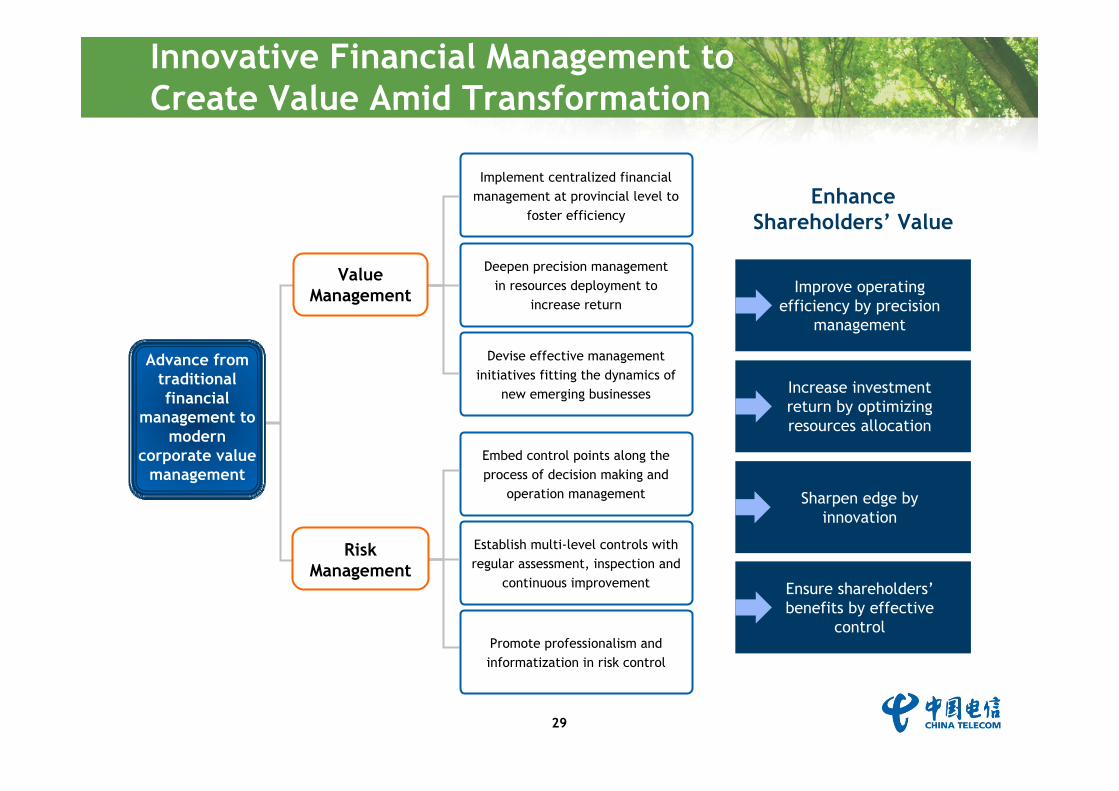
Innovative Financial Management to Create Value Amid Transformation
Advance from traditional financial
management to modern
corporate value management
Value Management
Implement centralized financial management at provincial level to
foster efficiency
Deepen precision management in resources deployment to
increase return
Devise effective management initiatives fitting the dynamics of
new emerging businesses
Risk Management
Embed control points along the process of decision making and
operation management
Establish multi-level controls with regular assessment, inspection and
continuous improvement
Promote professionalism and informatization in risk control
Enhance Shareholders’ Value
Improve operating efficiency by precision
management
Ensure shareholders’benefits by effective
control
Sharpen edge by innovation
Increase investment return by optimizing resources allocation

Thank You!Thank You!
For further information & enquiries, please contact our Investor Relations Department at [email protected]
31
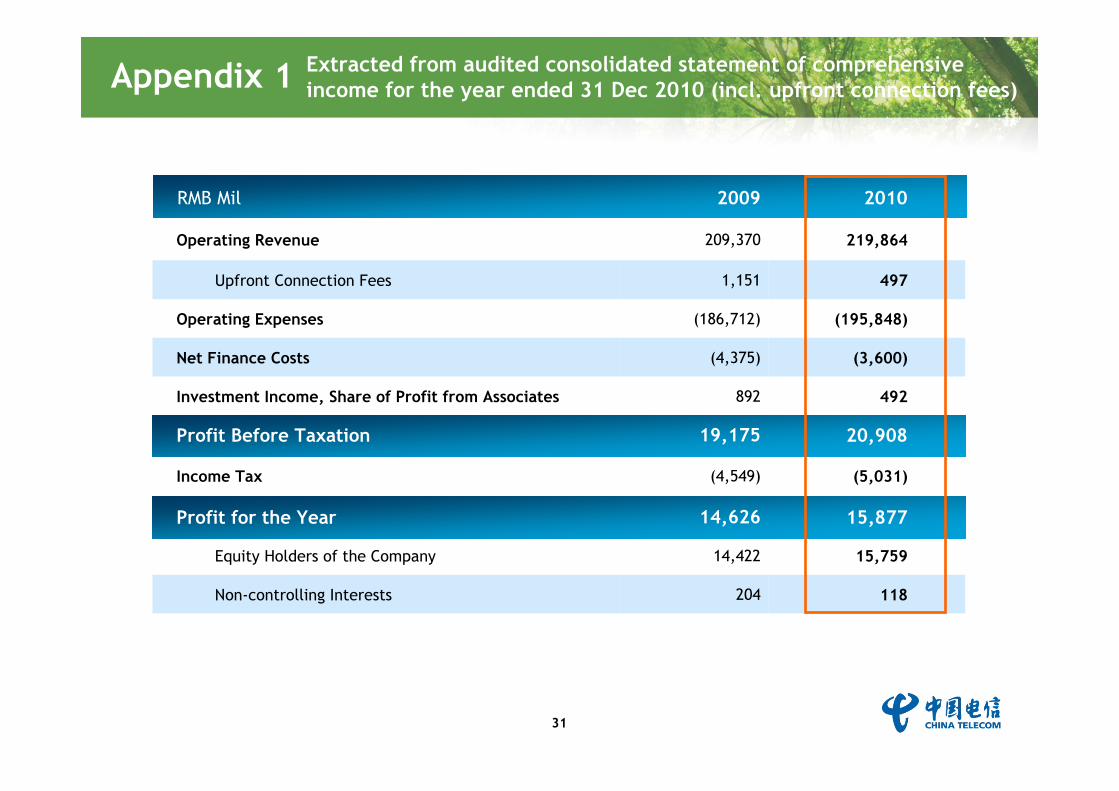
Appendix 1
RMB Mil 2009 2010
Operating Revenue 209,370 219,864
Upfront Connection Fees 1,151 497
Operating Expenses (186,712) (195,848)
Net Finance Costs (4,375) (3,600)
Investment Income, Share of Profit from Associates 892 492
Profit Before Taxation 19,175 20,908
Income Tax (4,549) (5,031)
Profit for the Year 14,626 15,877
Equity Holders of the Company 14,422 15,759
Non-controlling Interests 204 118
Extracted from audited consolidated statement of comprehensive income for the year ended 31 Dec 2010 (incl. upfront connection fees)
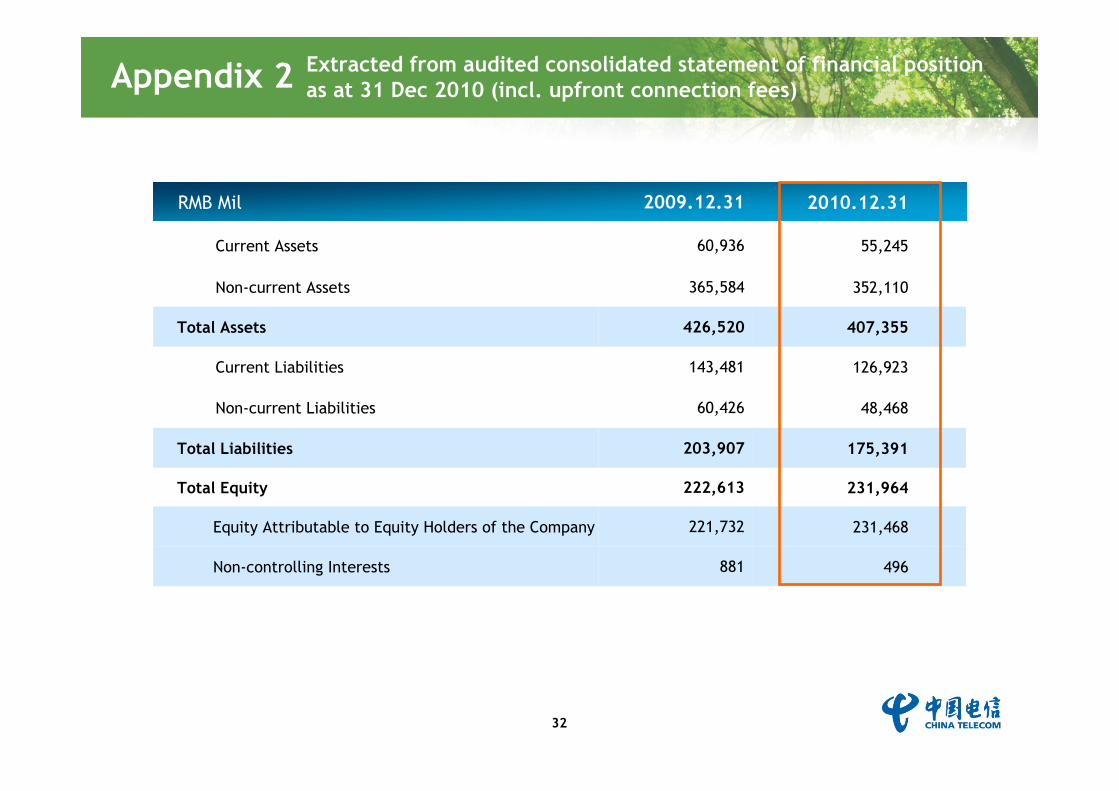
32
RMB Mil 2009.12.31 2010.12.31
Current Assets 60,936 55,245
Non-current Assets 365,584 352,110
Total Assets 426,520 407,355
Current Liabilities 143,481 126,923
Non-current Liabilities 60,426 48,468
Total Liabilities 203,907 175,391
Total Equity 222,613 231,964
Equity Attributable to Equity Holders of the Company 221,732 231,468
Non-controlling Interests 881 496
Appendix 2 Extracted from audited consolidated statement of financial position as at 31 Dec 2010 (incl. upfront connection fees)