Embed Size (px)
Citation preview
China Telecom (Hong Kong) LtdChina Telecom (Hong Kong) Ltd..
1999 1999 Annual ResultsAnnual Results
China Telecom (Hong Kong) Ltd.China Telecom (Hong Kong) Ltd.
April 13, 2000April 13, 2000
Management TeamManagement Team
Mr. Wang Mr. Wang XiaochuXiaochu
Mr. Li PingMr. Li Ping
Mr. Ding Mr. Ding DonghuaDonghua
Chairman Chairman Chief Executive OfficerChief Executive Officer
Vice ChairmanVice ChairmanChief Operating OfficerChief Operating Officer
DirectorDirectorChief Financial OfficerChief Financial Officer
AgendaAgenda
Business Achievements in 1999Business Achievements in 1999
Operational PerformanceOperational Performance
Financial HighlightsFinancial Highlights
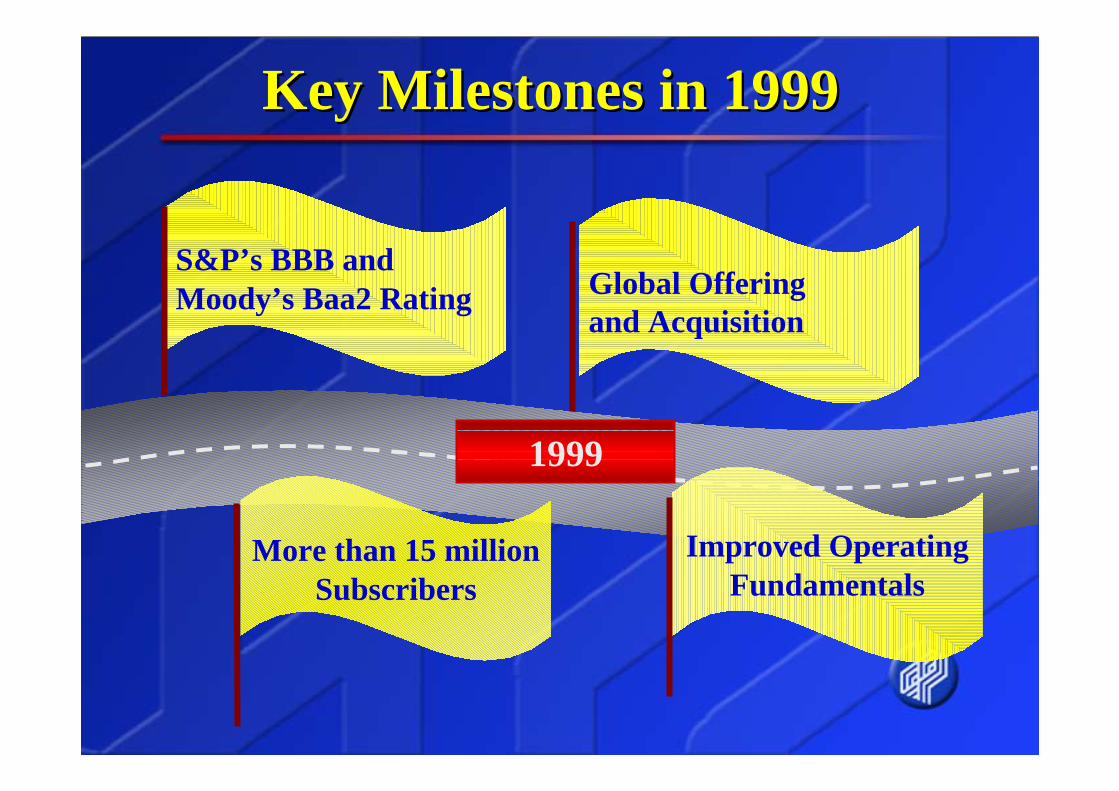
Key Milestones in 1999Key Milestones in 1999
Improved Operating Fundamentals
1999
S&P’s BBB and Moody’s Baa2 Rating
More than 15 million Subscribers
Global Offering and Acquisition
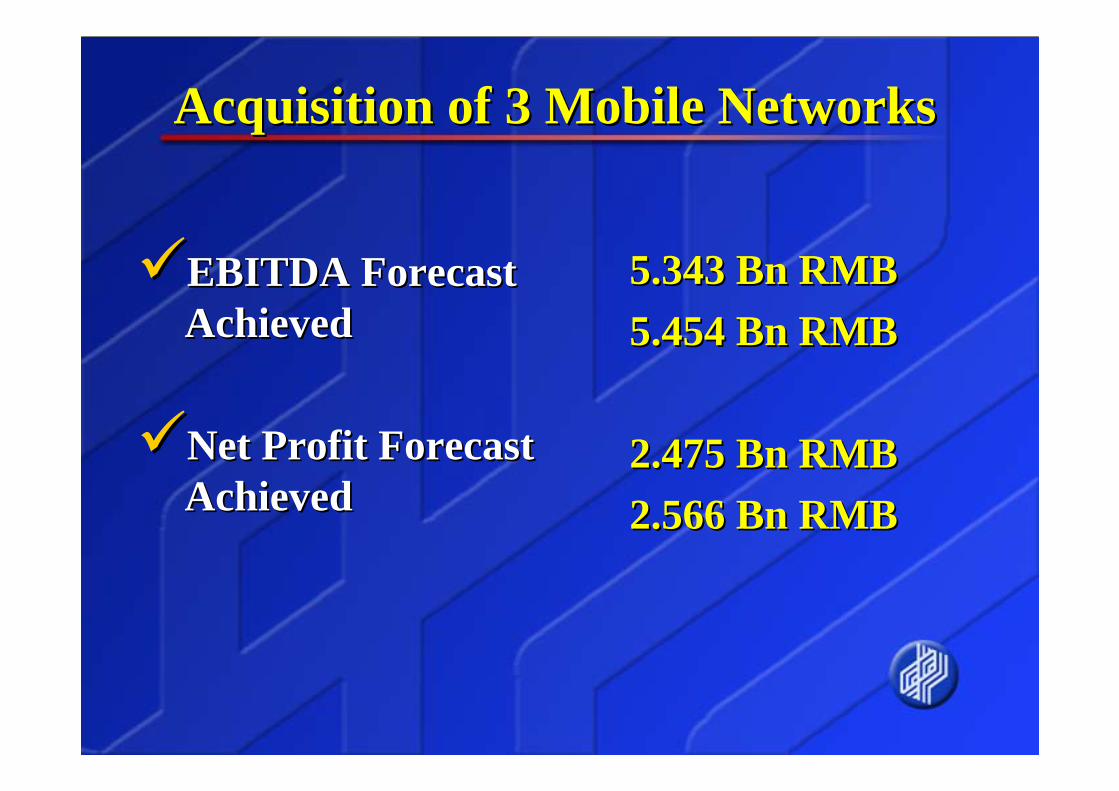
Acquisition of 3 Mobile NetworksAcquisition of 3 Mobile Networks
EBITDA Forecast EBITDA Forecast AchievedAchieved
Net Profit ForecastNet Profit ForecastAchievedAchieved
5.343 5.343 Bn RMBBn RMB5.454 Bn RMB5.454 Bn RMB
2.475 Bn RMB2.475 Bn RMB2.566 Bn RMB2.566 Bn RMB
050
100150200250300350400450500
99-1
-1
99-2
-1
99-3
-1
99-4
-1
99-5
-1
99-6
-1
99-7
-1
99-8
-1
99-9
-1
99-1
0-1
99-1
1-1
99-1
2-1
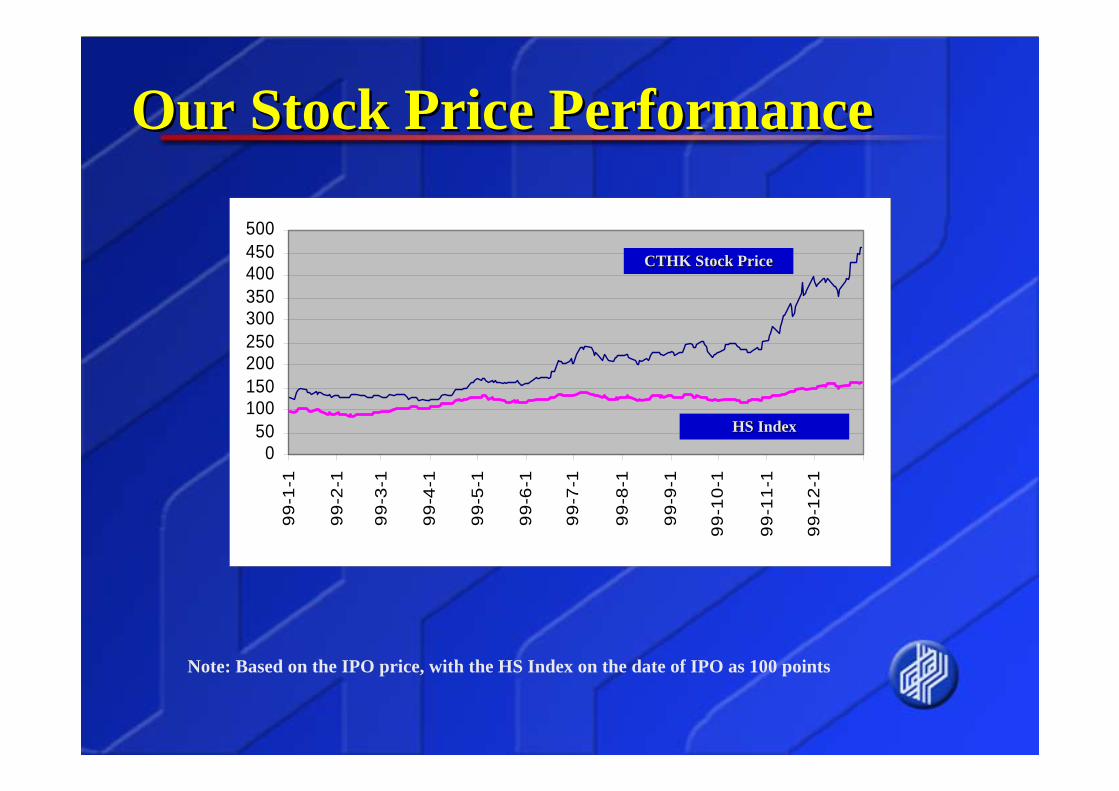
Our Stock Price PerformanceOur Stock Price Performance
Note: Based on the IPO price, with the HS Index on the date of IPO as 100 points
CTHK Stock PriceCTHK Stock Price
HS IndexHS Index
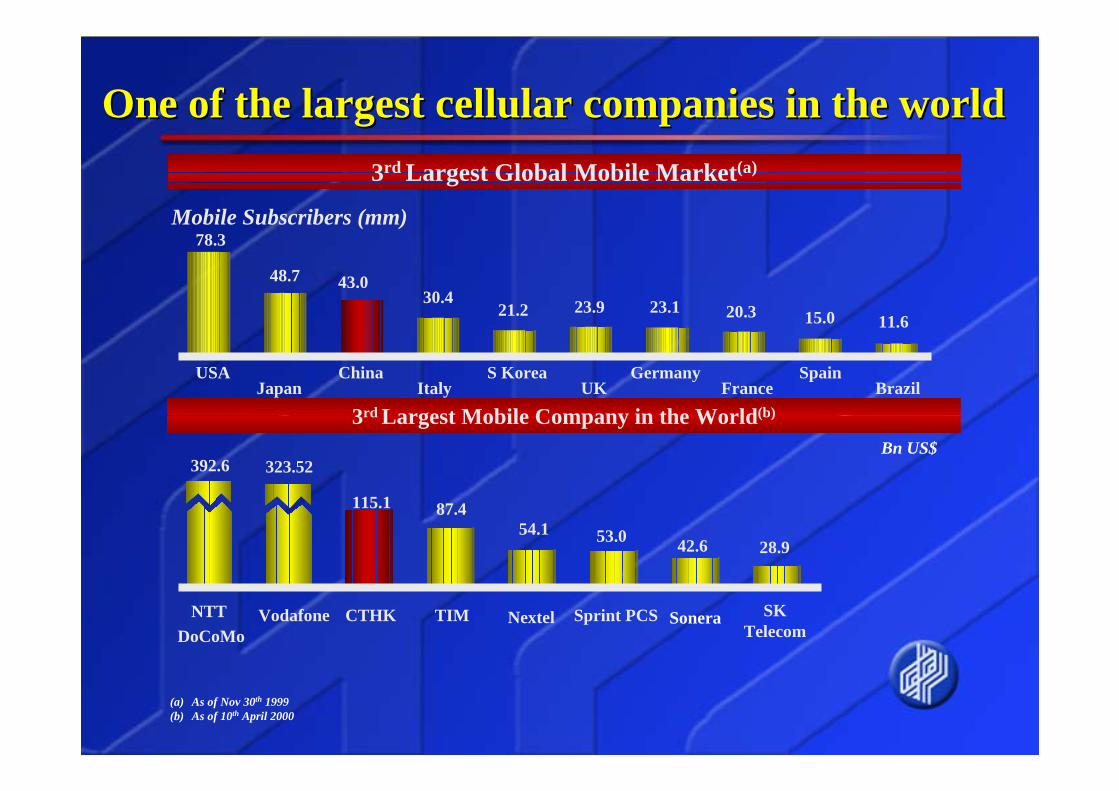
One of the largest cellular companies in the worldOne of the largest cellular companies in the world
Mobile Subscribers (mm)
3rd Largest Global Mobile Market(a)
78.3
48.7 43.030.4
21.2 23.9 23.1 20.3 15.0 11.6
USAJapan
ChinaItaly
S KoreaUK
GermanyFrance
SpainBrazil
Bn US$
3rd Largest Mobile Company in the World(b)
(a) As of Nov 30th 1999(b) As of 10th April 2000
392.6 323.52
115.1 87.453.054.1
42.6 28.9
VodafoneNTT DoCoMo
CTHK TIM Sprint PCSNextel SKTelecom
Sonera
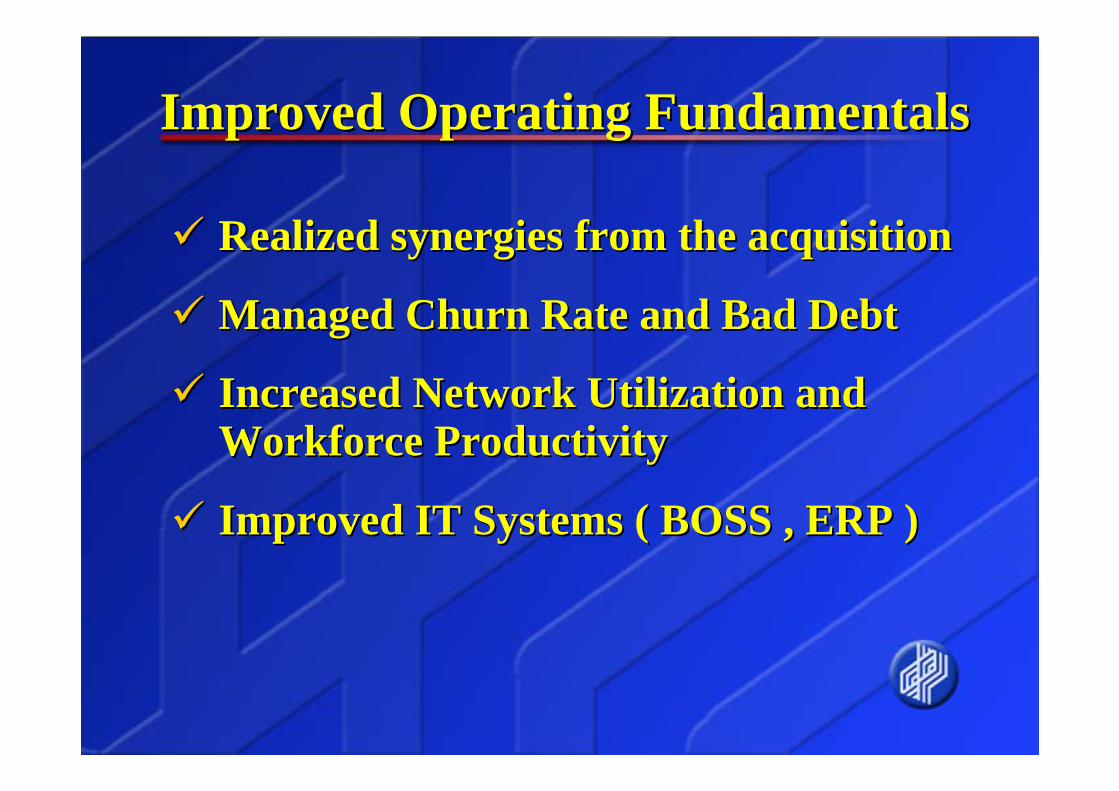
Improved Operating FundamentalsImproved Operating Fundamentals
Realized synergies from the acquisitionRealized synergies from the acquisition
Managed Churn Rate and Bad DebtManaged Churn Rate and Bad Debt
Increased Network Utilization and Increased Network Utilization and Workforce ProductivityWorkforce Productivity
Improved IT Systems ( BOSS , ERP )Improved IT Systems ( BOSS , ERP )

Corporate GovernanceCorporate GovernanceImproved Corporate Governance and Improved Corporate Governance and optimized the organizational structureoptimized the organizational structure
Enhanced Internal Controls and Risk Enhanced Internal Controls and Risk Management Management
More performanceMore performance--based employee based employee incentivesincentives
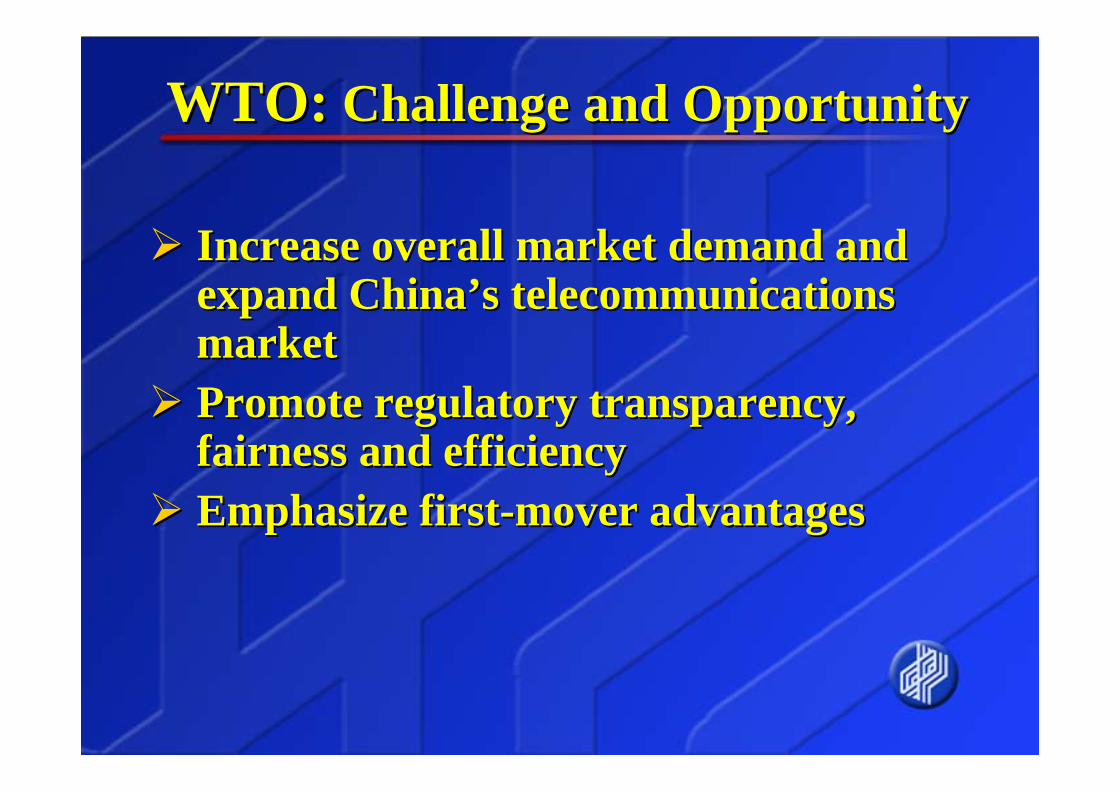
WTO:WTO: Challenge and OpportunityChallenge and Opportunity
Increase overall market demand and Increase overall market demand and expand Chinaexpand China’’s telecommunications s telecommunications marketmarketPromote regulatory transparency, Promote regulatory transparency, fairness and efficiencyfairness and efficiencyEmphasize firstEmphasize first--mover advantagesmover advantages
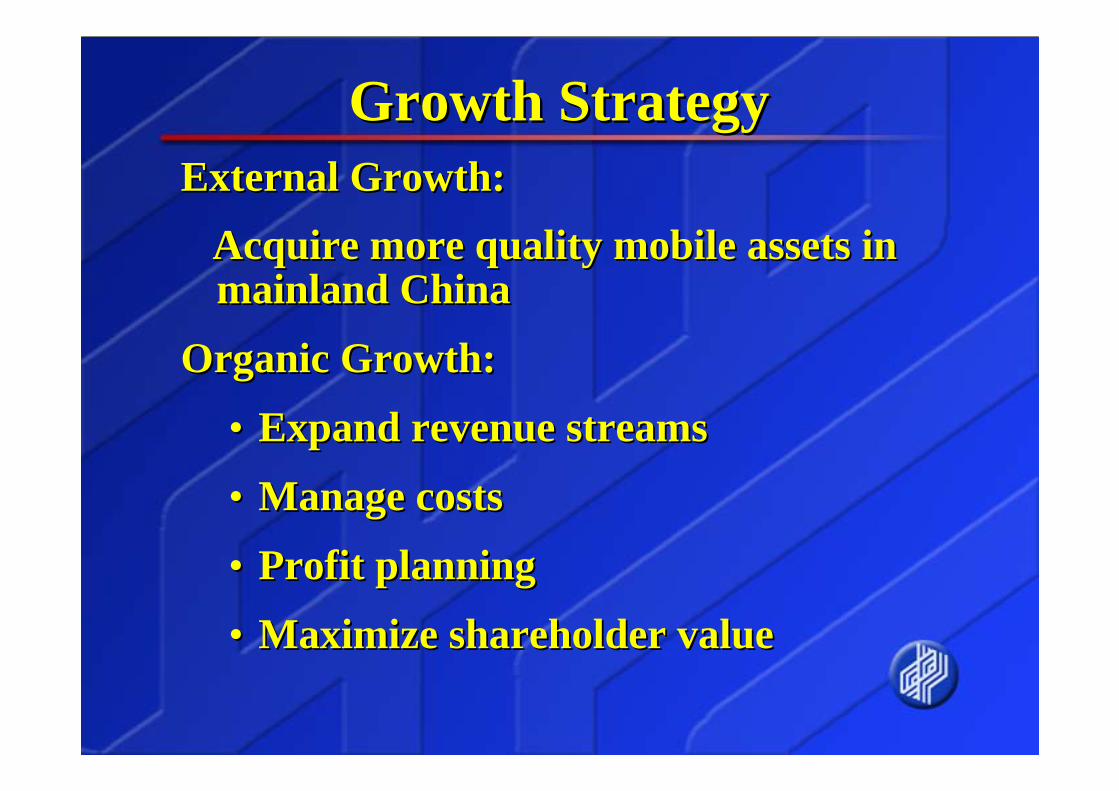
Growth StrategyGrowth StrategyExternal Growth: External Growth:
Acquire more quality mobile assets in Acquire more quality mobile assets in mainland Chinamainland China
Organic Growth:Organic Growth:
•• Expand revenue streamsExpand revenue streams
•• Manage costsManage costs
•• Profit planningProfit planning
•• Maximize shareholder valueMaximize shareholder value
OperationsOperations
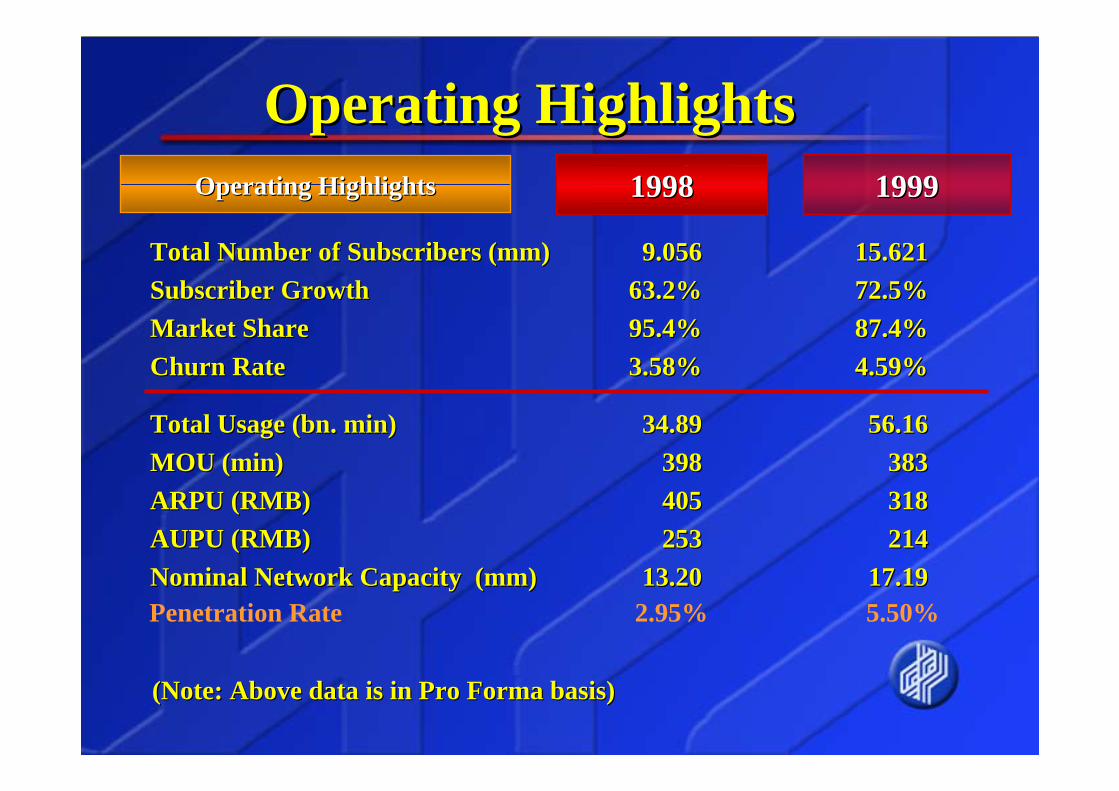
Operating HighlightsOperating Highlights
Total Number of Subscribers (mm)Total Number of Subscribers (mm) 9.0569.056 15.62115.621Subscriber GrowthSubscriber Growth 63.2%63.2% 72.5%72.5%Market ShareMarket Share 95.4%95.4% 87.4%87.4%Churn RateChurn Rate 3.58%3.58% 4.59%4.59%
Total Usage (bn. min)Total Usage (bn. min) 34.8934.89 56.1656.16MOU (min)MOU (min) 398398 383383ARPU (RMB)ARPU (RMB) 405405 318318AUPU (RMB)AUPU (RMB) 253253 214214Nominal Network Capacity (mm)Nominal Network Capacity (mm) 13.2013.20 17.1917.19
19981998Operating HighlightsOperating Highlights 19991999
Penetration Rate 2.95% 5.50%
(Note: Above data is in Pro Forma basis)(Note: Above data is in Pro Forma basis)
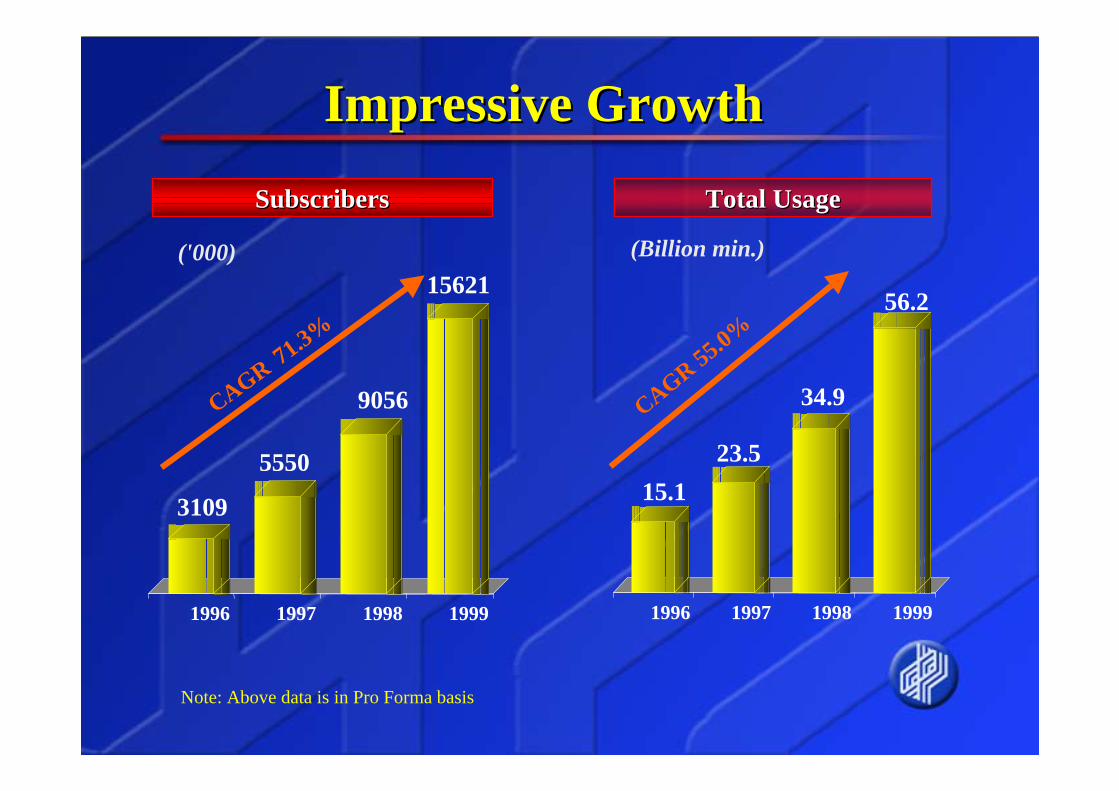
Impressive GrowthImpressive Growth
Total UsageTotal Usage
15.123.5
34.9
56.2
1996 1997 1998 1999
(Billion min.)
CAGR 55.0%
SubscribersSubscribers
('000)
3109
5550
9056
15621
1996 1997 1998 1999
CAGR 71.3%
Note: Above data is in Pro Forma basis
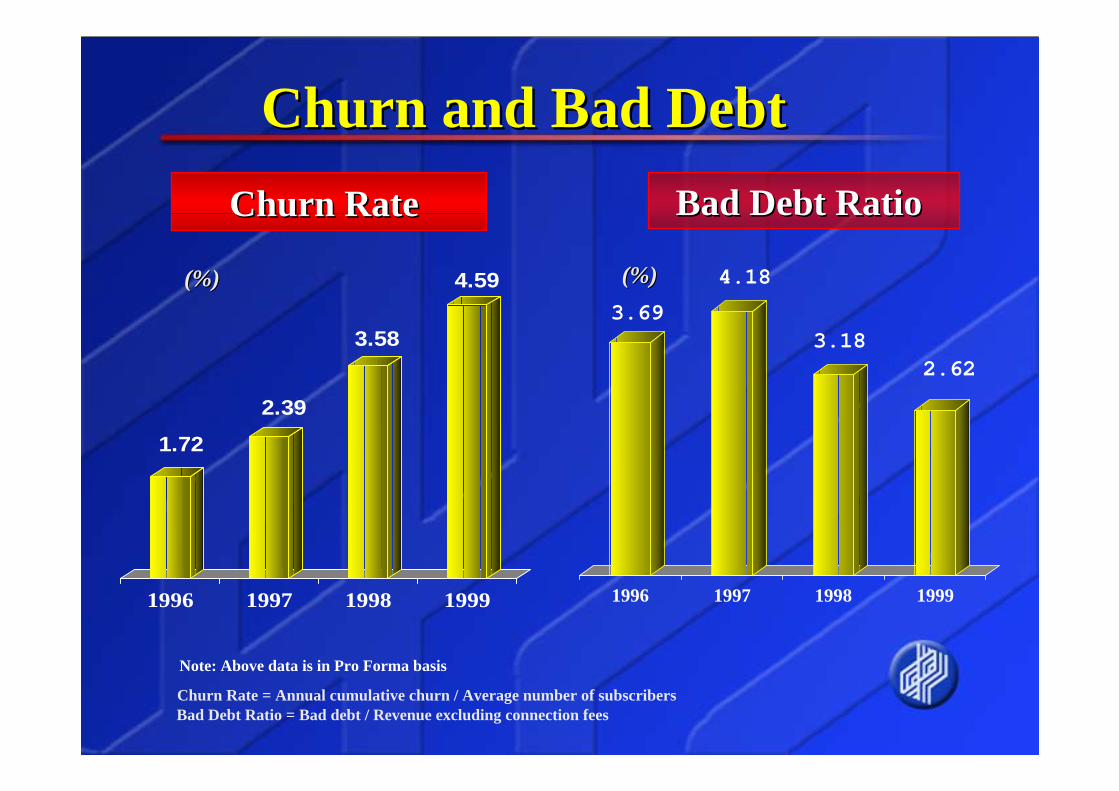
Churn and Bad DebtChurn and Bad Debt
Churn Rate = Annual cumulative churn / Average number of subscribersBad Debt Ratio = Bad debt / Revenue excluding connection fees
Churn Rate Churn Rate Bad Debt Ratio Bad Debt Ratio
1.722.39
3.58
4.59
1996 1997 1998 1999
3.694.18
3.182.62
1996 1997 1998 1999
(%)(%) (%)(%)
Note: Above data is in Pro Forma basis
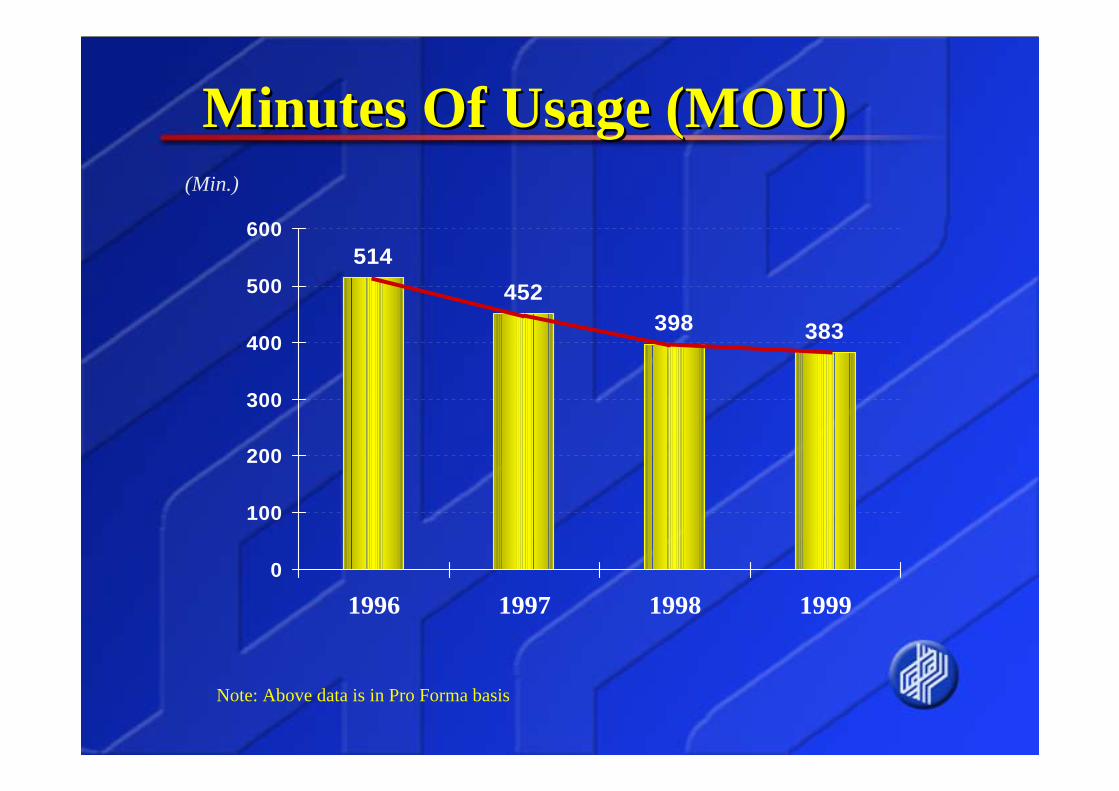
Minutes Of Usage (MOU) Minutes Of Usage (MOU)
514452
398 383
0
100
200
300
400
500
600
1996 1997 1998 1999
Note: Above data is in Pro Forma basis
(Min.)
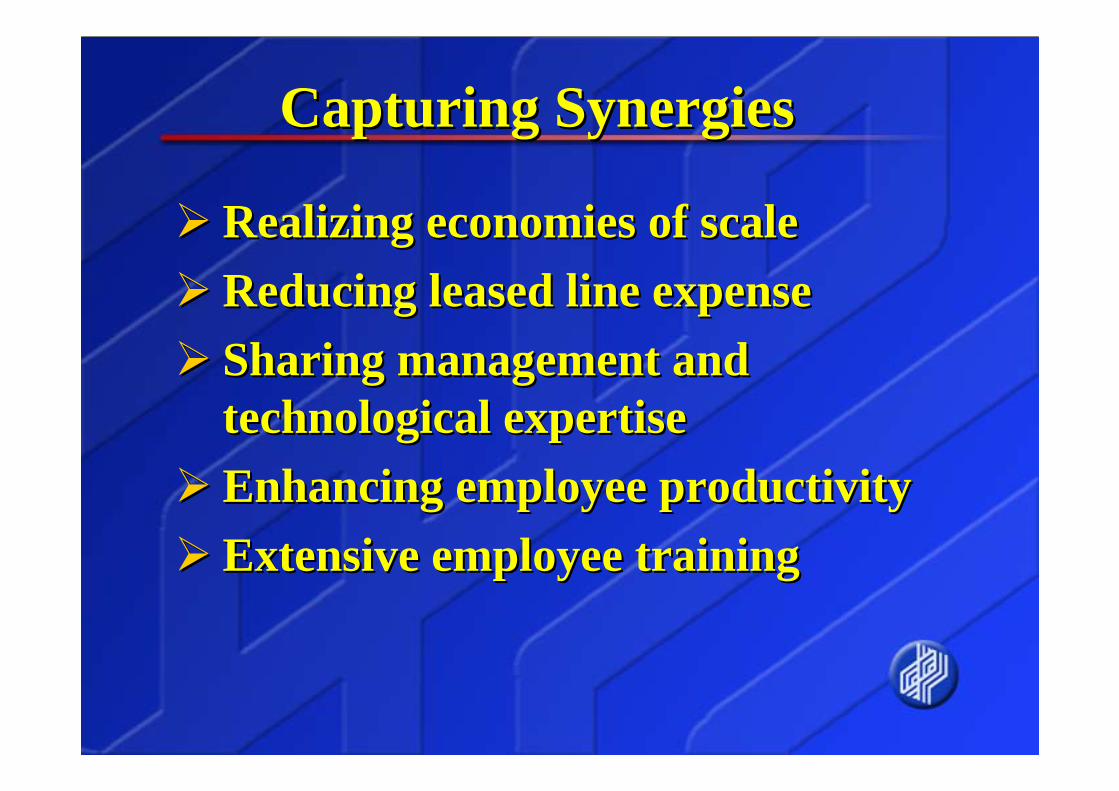
Capturing SynergiesCapturing Synergies
Realizing economies of scaleRealizing economies of scaleReducing leased line expenseReducing leased line expenseSharing management and Sharing management and technological expertisetechnological expertiseEnhancing employee productivityEnhancing employee productivityExtensive employee trainingExtensive employee training
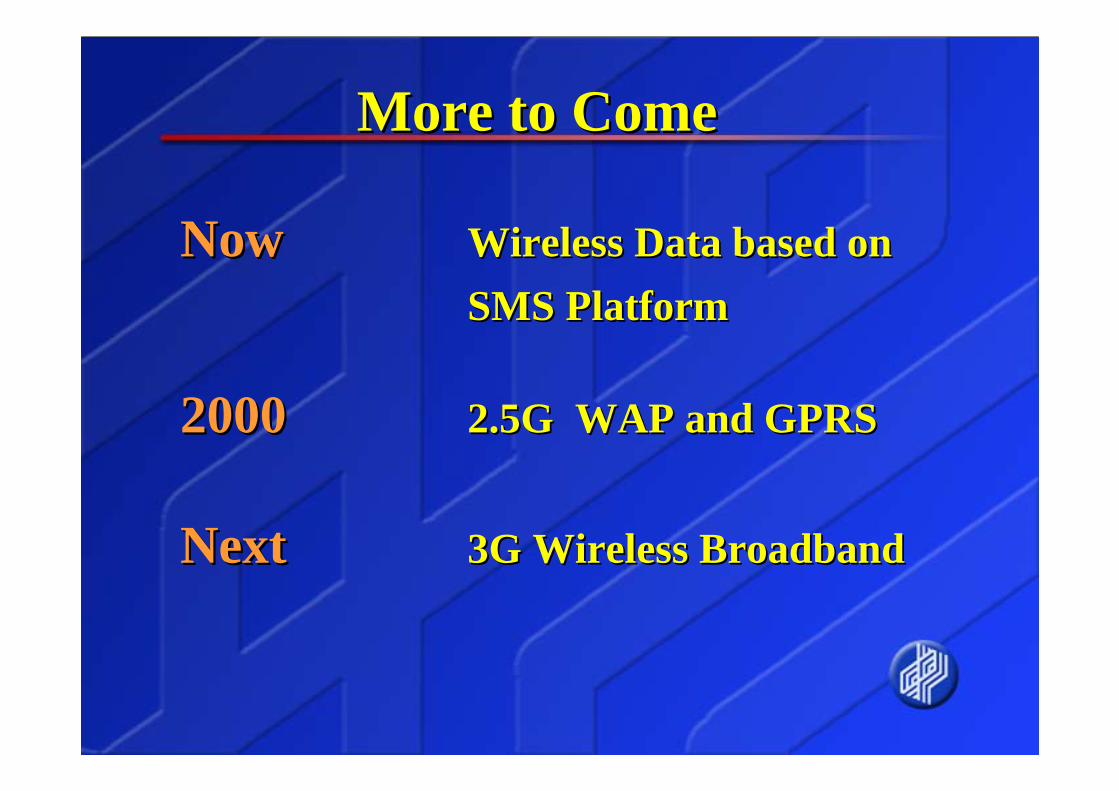
More to ComeMore to Come
NowNow Wireless Data based on Wireless Data based on SMS PlatformSMS Platform
20002000 2.5G WAP and GPRS2.5G WAP and GPRS
NextNext 3G Wireless Broadband3G Wireless Broadband
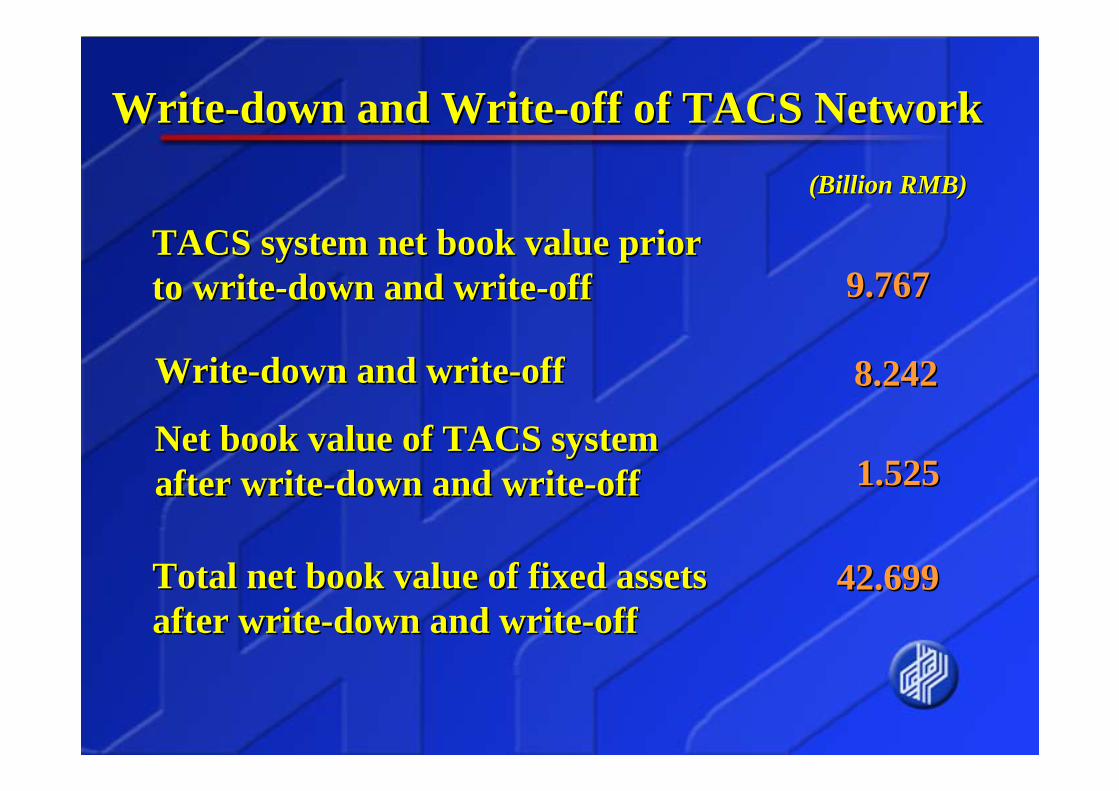
WriteWrite--down and Writedown and Write--off of TACS Networkoff of TACS Network
42.69942.699Total net book value of fixed assets Total net book value of fixed assets after writeafter write--down and writedown and write--offoff
1.5251.525Net book value of TACS system Net book value of TACS system after writeafter write--down and writedown and write--offoff
8.2428.242WriteWrite--down and writedown and write--offoff
9.7679.767TACS system net book value prior TACS system net book value prior to writeto write--down and writedown and write--off off
(Billion RMB)(Billion RMB)
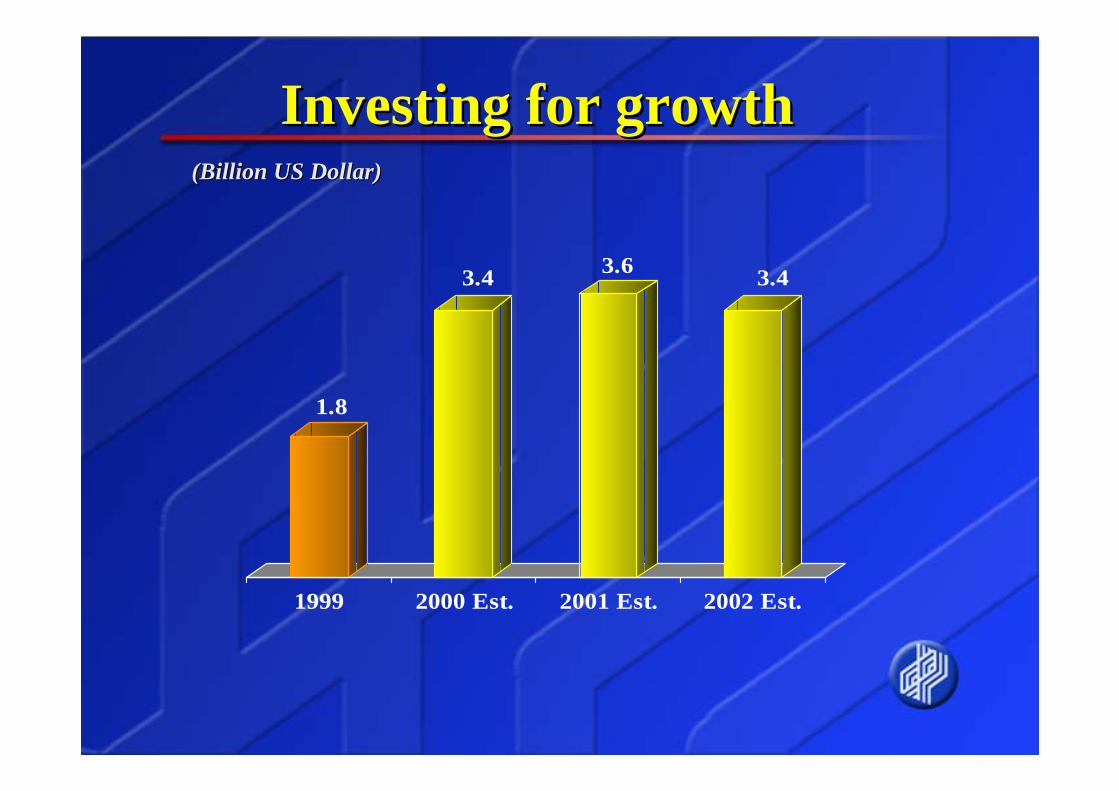
Investing for growthInvesting for growth
1.8
3.4 3.6 3.4
1999 2000 Est. 2001 Est. 2002 Est.
(Billion US Dollar)(Billion US Dollar)
Financial HighlightsFinancial Highlights
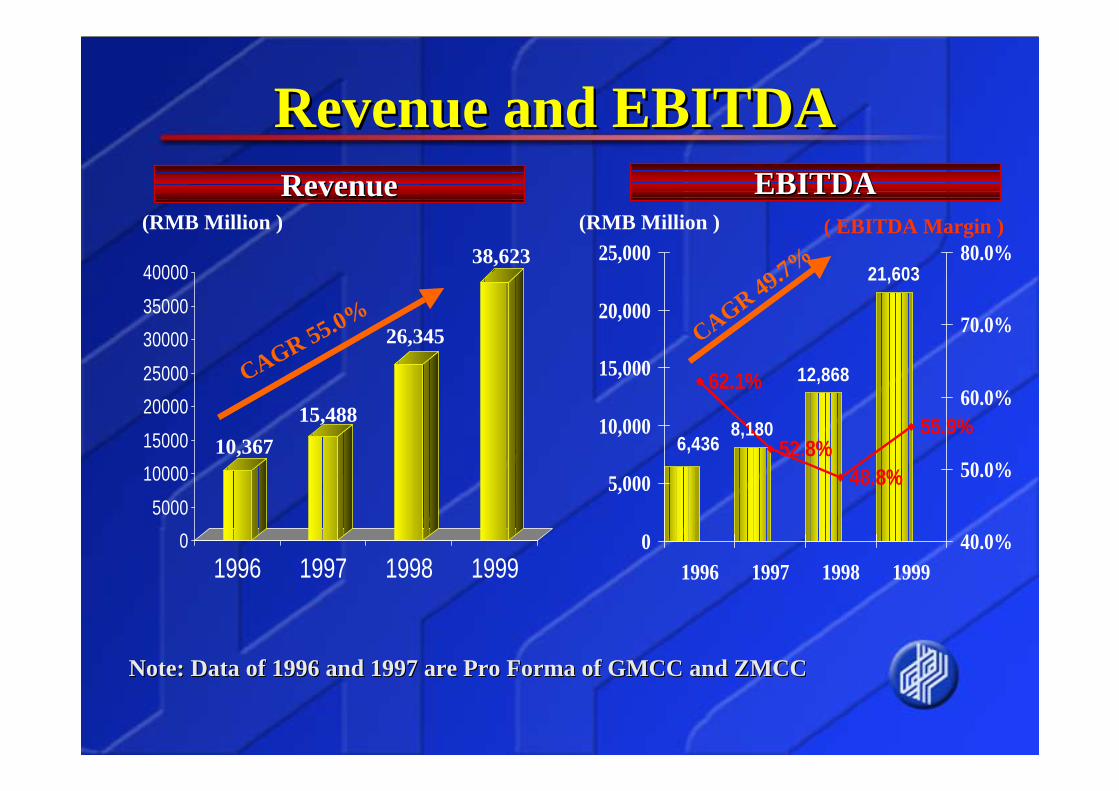
8,180
12,868
21,603
6,43648.8%
55.9%52.8%
62.1%
0
5,000
10,000
15,000
20,000
25,000
1996 1997 1998 199940.0%
50.0%
60.0%
70.0%
80.0%
RevenueRevenue EBITDAEBITDA(RMB Million )
05000
10000150002000025000300003500040000
1996 1997 1998 1999
15,488
26,345
CAGR 55.0%
38,623(RMB Million ) ( EBITDA Margin )
CAGR 49.7%
Note: Data of 1996 and 1997 are Pro Forma of GMCC and ZMCCNote: Data of 1996 and 1997 are Pro Forma of GMCC and ZMCC
Revenue and EBITDA Revenue and EBITDA
10,367
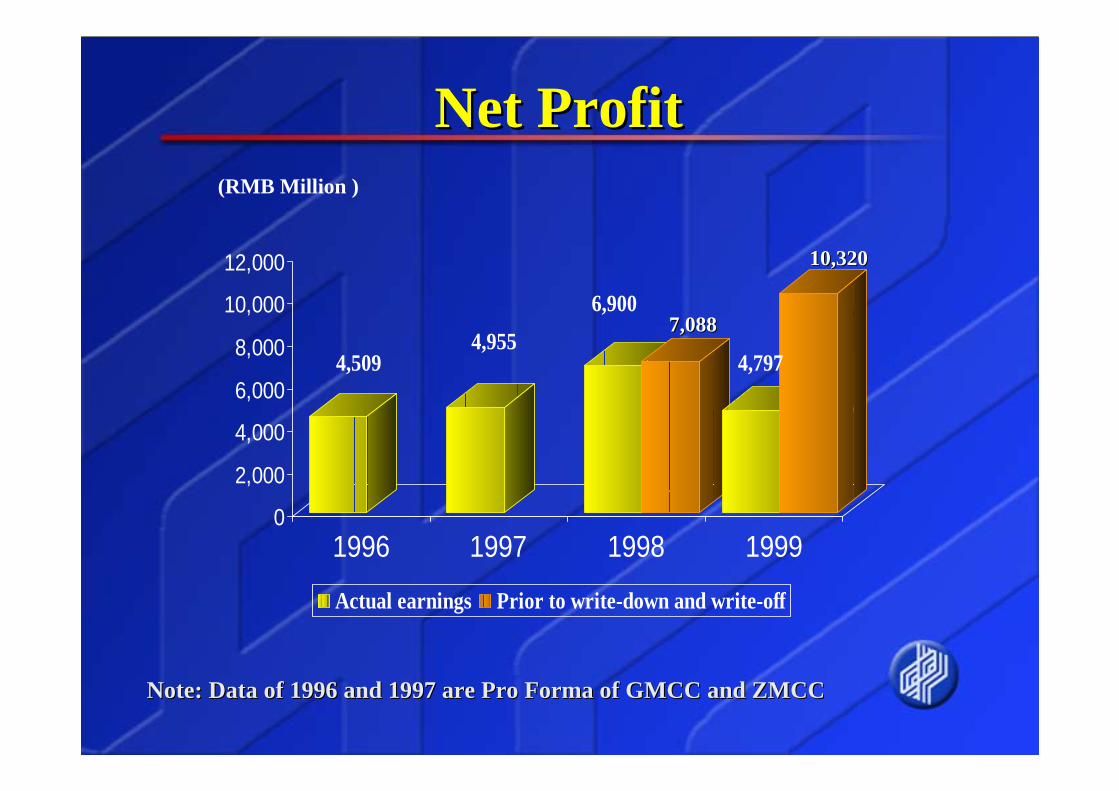
Net ProfitNet Profit
0
2,000
4,000
6,000
8,000
10,000
12,000
1996 1997 1998 1999
Actual earnings Prior to write-down and write-off
4,5094,955
6,900
4,797
(RMB Million )
Note: Data of 1996 and 1997 are Pro Forma of GMCC and ZMCCNote: Data of 1996 and 1997 are Pro Forma of GMCC and ZMCC
7,0887,088
10,32010,320
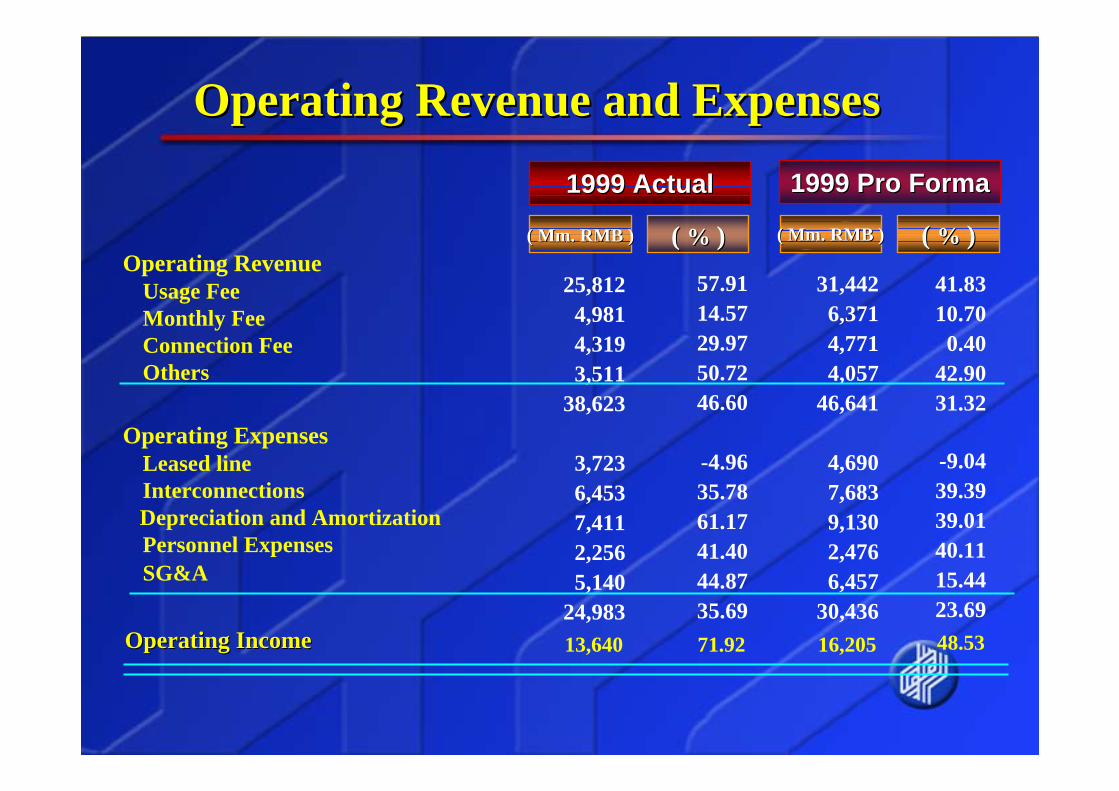
Operating Revenue and ExpensesOperating Revenue and Expenses
Operating RevenueUsage FeeMonthly FeeConnection FeeOthers
Operating ExpensesLeased lineInterconnectionsDepreciation and AmortizationPersonnel ExpensesSG&A
1999 1999 ActualActual
( ( Mm. RMB )Mm. RMB ) ( ( % % ))
57.9114.5729.9750.7246.60
-4.9635.7861.1741.4044.8735.69
25,8124,9814,3193,511
38,623
3,7236,4537,4112,2565,140
24,983
41.8310.70
0.4042.9031.32
-9.0439.3939.0140.1115.4423.69
31,4426,3714,7714,057
46,641
4,6907,6839,1302,4766,457
30,436
1999 1999 Pro FormaPro Forma
( ( Mm. RMB )Mm. RMB ) ( ( % % ))
Operating IncomeOperating Income 13,640 71.92 16,205 48.53
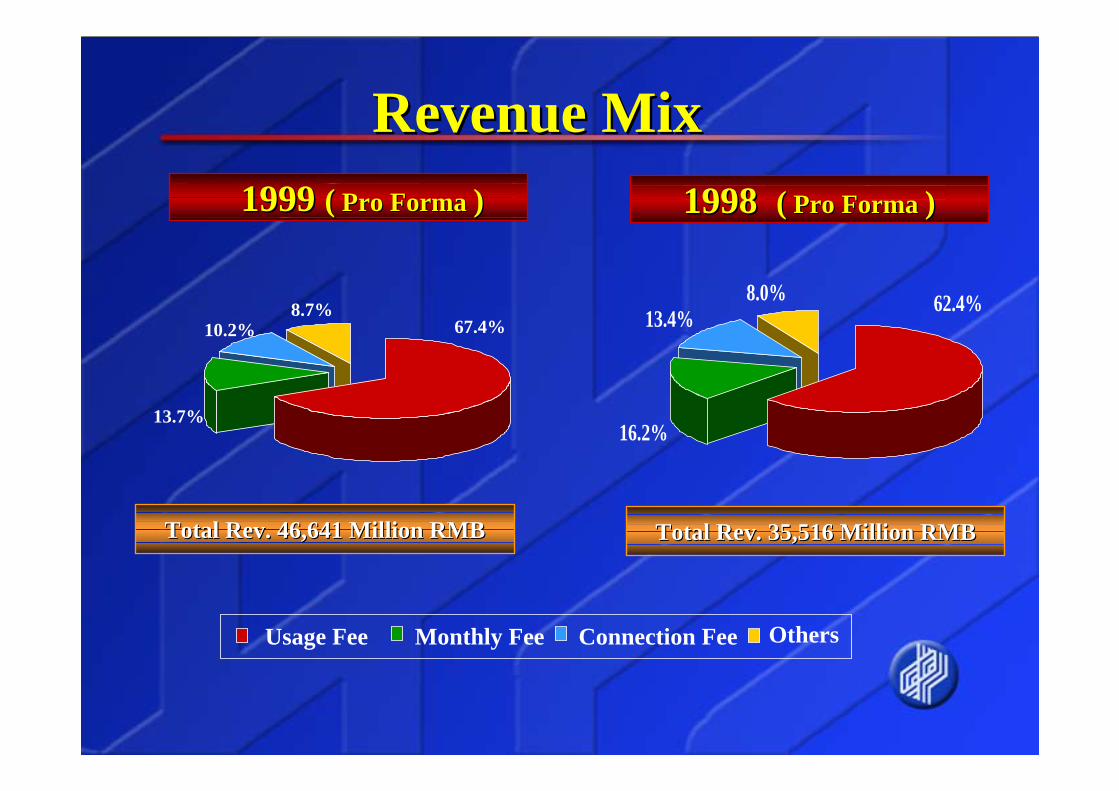
16.2%
13.4%8.0% 62.4%
Revenue MixRevenue Mix
67.4%
13.7%
10.2%8.7%
Usage Fee Monthly Fee Connection Fee Others
Total Rev. 46,641 Million RMBTotal Rev. 46,641 Million RMB Total Rev. 35,516 Million RMBTotal Rev. 35,516 Million RMB
1999 1999 (( Pro Forma Pro Forma )) 1998 1998 (( Pro Forma Pro Forma ))
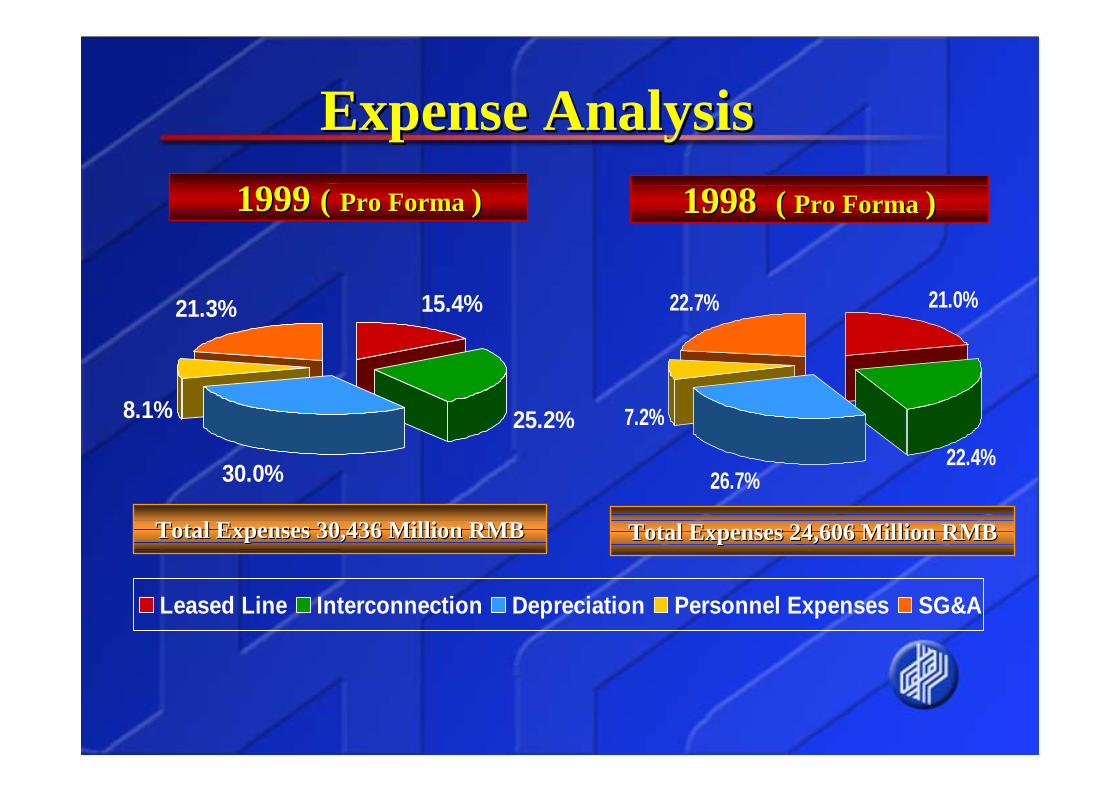
15.4%
25.2%
30.0%
8.1%
21.3%
Leased Line Interconnection Depreciation Personnel Expenses SG&A
21.0%
26.7%
7.2%
22.7%
22.4%
Expense AnalysisExpense Analysis
Total Expenses 24,606 Million RMBTotal Expenses 24,606 Million RMBTotal Expenses 30,436 Million RMBTotal Expenses 30,436 Million RMB
1999 1999 (( Pro Forma Pro Forma )) 1998 1998 ( ( Pro Forma Pro Forma ))
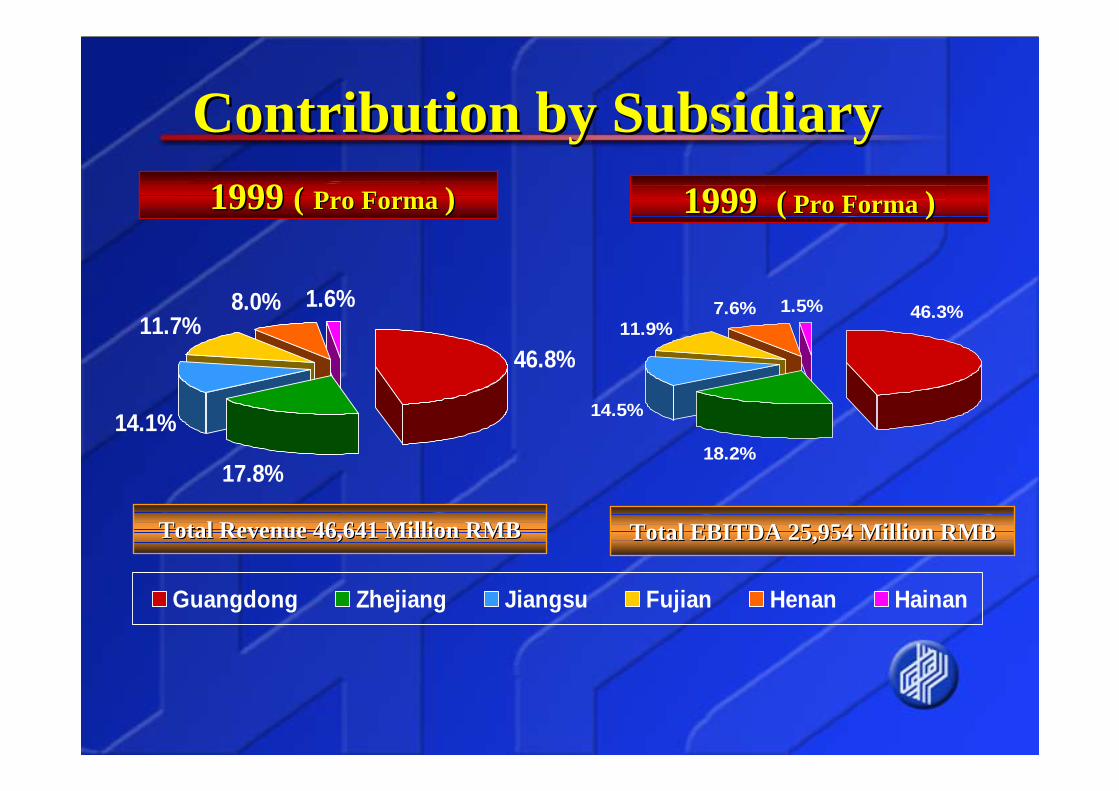
46.8%
17.8%
14.1%
8.0% 1.6%11.7%
Guangdong Zhejiang Jiangsu Fujian Henan Hainan
18.2%
14.5%
11.9%7.6% 46.3%1.5%
Contribution by SubsidiaryContribution by Subsidiary1999 1999 (( Pro Forma Pro Forma )) 1999 1999 (( Pro Forma Pro Forma ))
Total EBITDA 25,954 Million RMBTotal EBITDA 25,954 Million RMBTotal Revenue 46,641 Million RMBTotal Revenue 46,641 Million RMB
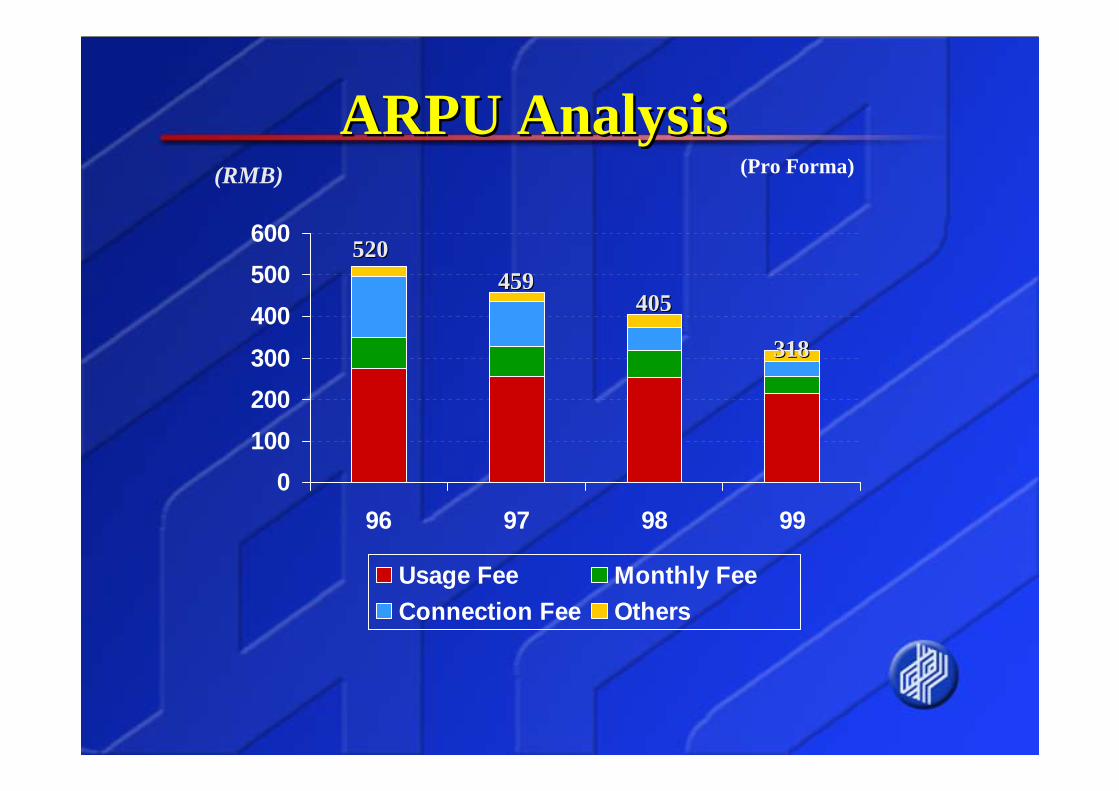
0100200300400500600
96 97 98 99
Usage Fee Monthly FeeConnection Fee Others
ARPU AnalysisARPU Analysis(RMB)
520520459459
405405
318318
(Pro Forma)
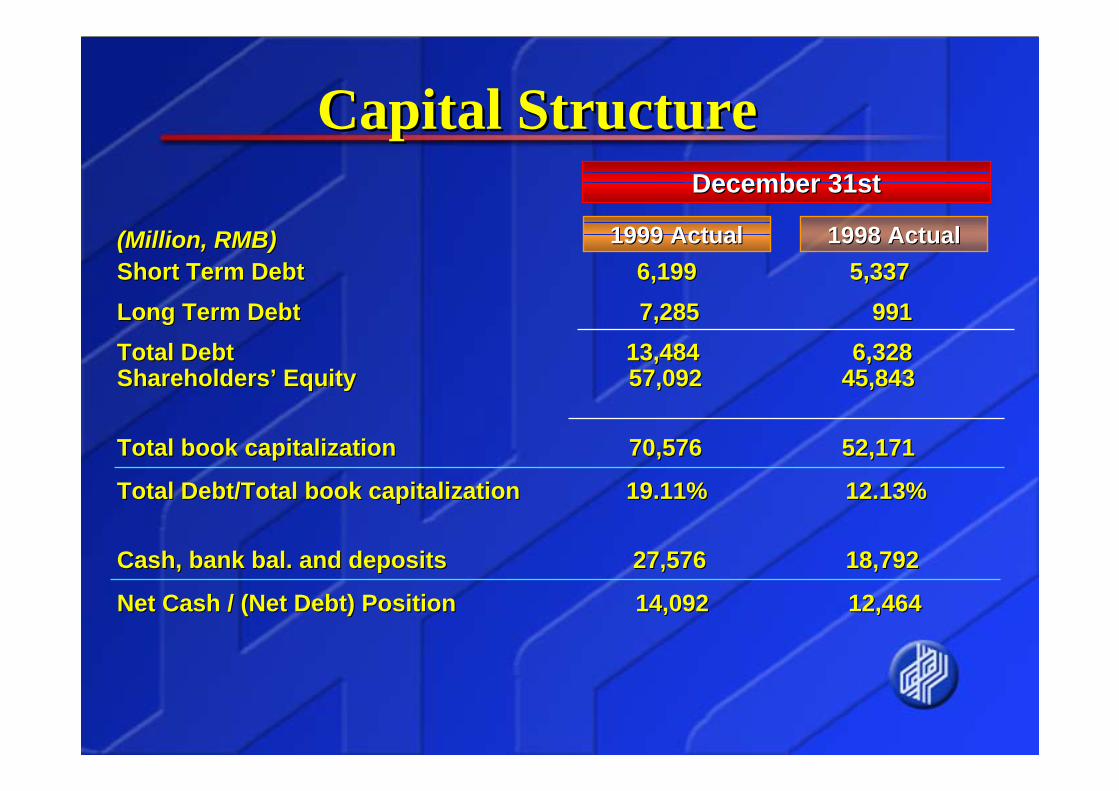
((Million, RMB)Million, RMB)Short Term Debt Short Term Debt 6,199 6,199 5,337 5,337 Long Term Debt Long Term Debt 7,285 7,285 991991Total Debt Total Debt 13,484 13,484 6,328 6,328 ShareholdersShareholders’’ Equity Equity 57,092 57,092 45,843 45,843
Total book capitalization Total book capitalization 70,576 70,576 52,17152,171
Total Debt/Total book capitalization Total Debt/Total book capitalization 19.11% 19.11% 12.13%12.13%
Cash, bank bal. and deposits 27,576 Cash, bank bal. and deposits 27,576 18,79218,792
Net Cash / (Net Debt) Position Net Cash / (Net Debt) Position 14,092 14,092 12,46412,464
Capital StructureCapital StructureDecember 31stDecember 31st
1999 1999 ActualActual 1998 1998 ActualActual
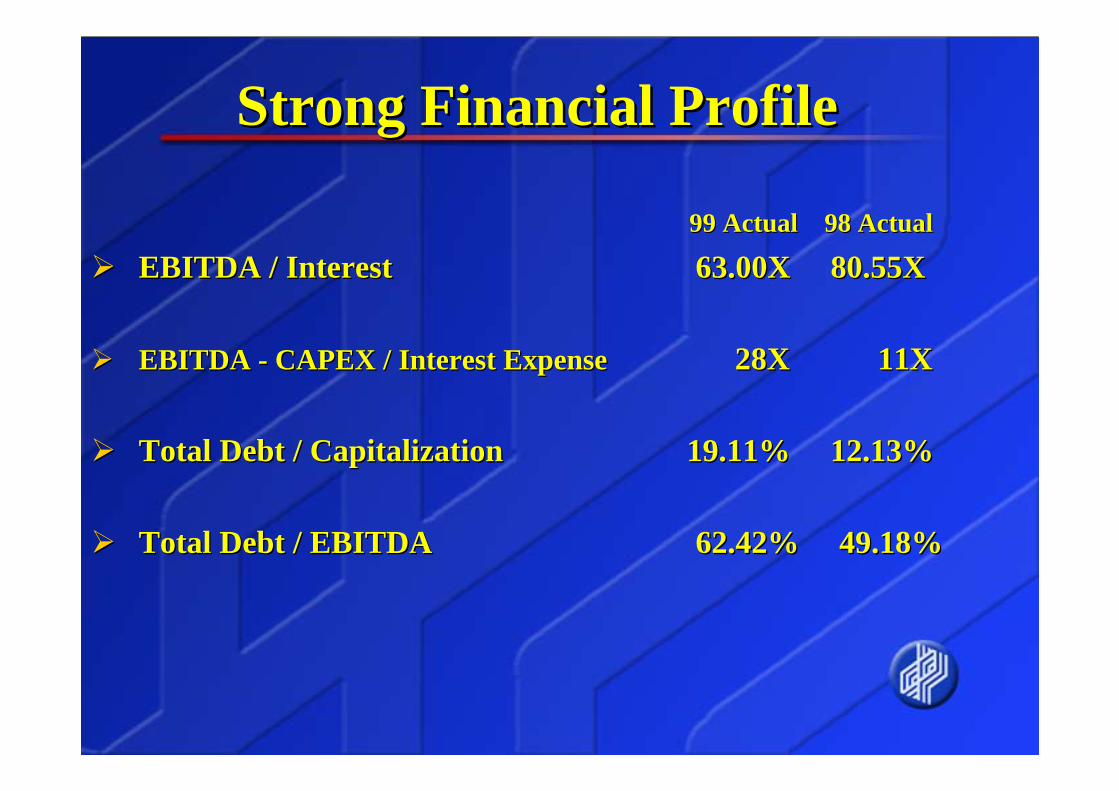
Strong Financial ProfileStrong Financial Profile
99 Actual 98 Actual99 Actual 98 Actual
EBITDA / Interest 63.00X EBITDA / Interest 63.00X 80.55X 80.55X
EBITDA EBITDA -- CAPEX / Interest ExpenseCAPEX / Interest Expense 28X 11X 28X 11X
Total Debt / Capitalization 19.11% 12.Total Debt / Capitalization 19.11% 12.13%13%
Total Debt / EBITDA 62.42% 4Total Debt / EBITDA 62.42% 49.18%9.18%
China Telecom (Hong Kong) Ltd.China Telecom (Hong Kong) Ltd.
MultiMulti--media Wirelessmedia Wireless
A World ClassA World Class
Services Provider !Services Provider !