Embed Size (px)
Citation preview

Annual report 2018

Highlights
Developed and manufactured by Velan ABV in Italy, these new generation Key-C rotary control ball valves–when combined with our unique, patent protected cable drive actuator–represent a major step forward in control valve technology.
Velan SAS manufactured these cryogenic bellows seal globe control valves for liquid helium application installed in a nuclear fusion reactor in Japan. Photo credit: P.AvavianCEA.
Velan Securaseal C-series valves installed at one of the most severe slurry pipelines in Chile. Velan valves are exceeding the performance requirements in one of the toughest slurry pipelines in the world.Cover photo:
30” Velan Securaseal isolation ball valve installed in a refinery in South America.
Velan’s marketing strategy focused on two main product campaigns this year–the R-series cast metal-seated ball valve and pressure seal valve. The initiative showcased successful teamwork across all departments involved.

2018 Financial highlights
(in thousands of U.S. dollars, except per share amounts and number of employees)
Years Ended Feb 2018 Feb 2017 Feb 2016 Feb 2015 Feb 2014
Income statement dataSales $ 337,963 $ 331,777 $ 426,895 $ 455,750 $ 489,257
Gross profit 68,585 88,528 104,283 118,283 131,146 Gross profit % 20.3% 26.7% 24.4% 26.0% 26.8%
Administration costs 85,437 75,868 77,974 88,391 87,143 Income (loss) before income taxes (18,512) 12,994 12,587 28,965 42,762 EBITDA (2) (4,376) 26,201 38,563 45,066 57,435
EBITDA (2) % (1.3)% 7.9% 9.1% 9.9% 11.7%EBITDA (2) per share (0.20) 1.21 1.76 2.05 2.62
Net earnings (loss) (1) (17,811) 7,737 3,641 18,580 29,400 Net earnings (loss) (1) % (5.3)% 2.3% 0.8% 4.1% 6.0%Net earnings (loss) (1) per share (3) (0.82) 0.36 0.17 0.85 1.34
Statement of financial position dataNet cash (2) $ 61,048 $ 72,481 $ 82,049 $ 75,612 $ 67,761 Working capital 215,639 233,262 229,959 227,793 235,318 Property, plant and equipment 89,864 91,535 95,257 91,285 96,605 Total assets 540,193 519,297 515,627 558,628 624,154 Total debt 22,129 22,433 22,449 14,827 22,087 Equity 321,617 331,911 333,119 345,093 359,119 Number of employees
Canada 732 763 787 917 917 United States 146 157 165 181 188 Europe 489 482 520 528 526 Asia 463 474 430 441 429 Total 1,830 1,876 1,902 2,067 2,060
(1) Net earnings or loss refers to net income or loss attributable to Subordinate and Multiple Voting Shares.(2)Thistermisameasureofperformanceand/orfinancialconditionthatisnotdefinedunderInternationalFinancialReportingStandardsandistherefore
unlikely to be comparable to similar measures presented by other companies. Such measures are used by management in assessing the operating results and financialconditionoftheCompany.Inaddition,theyprovidereadersoftheCompany’sconsolidatedfinancialstatementswithenhancedunderstandingofitsresultsandfinancialcondition,andincreasetransparencyandclarityintotheoperatingresultsofitscorebusiness.Refertothe“ReconciliationsofNon-IFRSMeasures”sectionintheCompany’sManagementDiscussionandAnalysisincludedinthisAnnualReportforadetailedcalculationofthismeasure.
(3)Seenote21intheNotestotheConsolidatedFinancialStatements.
ConsolidatedConsolidated
OverseasOverseas
U.S.A.
Canada
Sales (in millions of U.S. dollars)
0 40 80
120 160 200 240 280 320 360 400 440 480 520
2014 2015 2016 2017 2018 Net earnings (loss)(1) EBITDA(2)
Net earnings(1) and EBITDA(2)
(in millions of U.S. dollars)
(30)
(20) (10)
-10 20 30
40 50 60 70
2014 2015 2016 2017 2018 2018
1

A.K.andTomVelanstandinginfrontofalargevalvein2006whenA.K.was88yearsold.
ValveWorldmagazinepaidtributetoA.K.VelaninacoverstorypublishedintheMarchissue.
DearFellowShareholders,
AsChairmanoftheBoardandmemberofthemajorityshareholderfamily,Ishareallourshareholders’disappointmentwiththepoorresultsinfiscal2018.Thishasbeenaverytoughandchallengingyearforourcompanyasoursalesdeclinedandwemadealoss,ourfirstoperatinglosssince2004.Thecompany’sEquitydeclinedtoUS$321.6millionwhichisC$19.05pershare.
ThiswasayearoftransitionforboththecompanyandtheVelanfamily.InSeptember2017,AKVelan,myfatherwhowasthefounderandthelongtimeleaderofthecompany,passedawayless than 6 months from his 100thbirthday.Althoughhewasnolongerinvolvedinthecompany,everyonewhoknewhimwasaffectedbytheloss.Manyofouremployeesfeltthathewaslikeasecondfathertothem.Hewasalegendinthevalveindustry,aphilanthropist,andalovingfamilyman.Hewillbegreatlymissed.
On March 1st,2017,IretiredfrommyroleasCEOandYvesLeducbecamethefirstnon-VelanfamilyCEOofthecompanyafterservingtwoyearsasPresident.Yvesandhisexecutiveteamaredevotingalltheireffortstoreversethedownwardtrendandimprovetheresults.
Fromacorporategovernancestandpoint,wehaveestablishedaboardrenewalsuccessionplanandimplementedthefirststepwiththenominationofJamesMannebachtoreplaceKenMacKinnonwhoisretiringafter13yearsofservice.JamesMannebachisthefirstindependentdirectorwhohasextensiveexperienceinthevalveindustry.Weareplanningtomakeanotherdirectorsuccessionnextyear.Weneedtobalancetheneedforcontinuingboardrenewalwiththeneedtohaveexperienceddirectorswithknowledgeaboutourcomplexglobalbusiness.
OnbehalfoftheBoardofDirectors,Iwanttothankallshareholdersforyourcontinuingsupportandtheconfidence youhaveplacedinourcompany.
Tom Velan
ChairmanoftheBoard
2

Message to our shareholders and employees
Highlights• Sales of $338.0 million• Net loss(1) of $17.8 million• Order Backlog of $464.5 million• Order Bookings of $320.9 million• Net Cash(2) of $61.0 million
At first, the weakness in this segment, which mainly sells into the oil and gas sector, was perceived to be temporary and largely related to market conditions. However, as competition has intensified and competitors have gained market share, it is now apparent that the decline is more permanent. As such, it has become imperative for the Company to shift its focus and target discrete market segments where its engineering know-how and agile design capabilities can be a leverage for future growth.
Bookings decreased by $127.3 million or 28.4% from the prior year. The decrease for the year is due primarily to lower project orders booked by the Company’s French, German and Italian subsidiaries, all of which had recorded significant large project orders in the prior year comparative period. While the Company’s North American operations recorded higher bookings for the year, such amount remains low when compared to previous fiscal years. The current highly competitive environment in its various markets continues to put downward pressure on pricing and lead times.
As a result of sales outpacing bookings in the current fiscal year, the Company’s book-to-bill ratio was 0.95 for the year. Despite this low ratio, the total backlog increased by $26.3 million or 6.0% since the beginning of the fiscal year. This improvement in the backlog was achieved as a result of the positive impact of the strengthening of the euro spot rate against the U.S. dollar at the end of the current year when compared to the spot rate at the beginning of the year.
YvesLeduc,VelanInc’sPresidentandChiefExecutiveOfficer.
(InU.S.dollars,unlessotherwisestated.)
Fiscal year 2018 was my first year as CEO of Velan Inc. (the “Company”) and it was by far the most challenging since I joined the Company three years ago. Our results are deeply disappointing as we suffered a loss on slightly increasing revenues.
So what is happening? The poor bookings experienced by North American operations in fiscal year 2017 was not followed with the expected recovery this year. The usual strong performance of our French operations, coupled with Italy’s impressive sales recovery, could not offset our performance in North America. Meanwhile, the complexity of our project manufacturing business keeps increasing at a pace faster than our improvements. This, combined with sharply contracting margins in project valves, contributed to a notable margin decline, again mostly in our North American operations.
Let’s have a closer look at our results.
Sales, order bookings, and backlogSales increased by $6.2 million or 1.9% from the prior year. Sales were positively impacted by an increase in shipments from the Company’s Italian subsidiary, which was offset by decreased shipments from the Company’s North American operations due to various customer-related, supply chain and internal operational issues. Sales were also negatively impacted by lower shipments of non-project commodity valves, particularly in North America.
(1) Net earnings or loss refers to net income or loss attributable to Subordinate and Multiple Voting Shares.
(2)Thistermisameasureofperformanceand/orfinancialconditionthatisnotdefinedunderInternationalFinancialReportingStandardsandisthereforeunlikelytobecomparabletosimilarmeasurespresentedbyothercompanies.SuchmeasuresareusedbymanagementinassessingtheoperatingresultsandfinancialconditionoftheCompany.Inaddition,theyprovidereadersoftheCompany’sconsolidatedfinancialstatementswithenhancedunderstandingofitsresultsandfinancialcondition,andincreasetransparencyandclarityintotheoperatingresultsofitscorebusiness.Refertothe“ReconciliationsofNon-IFRSMeasures”sectionintheCompany’sManagementDiscussionandAnalysisincludedinthisAnnualReportforadetailedcalculationofthismeasure.
3

Message to our shareholders and employees
Net earnings (loss)(1) and EBITDA(2) Net loss(1) amounted to $17.8 million or $0.82 per share compared to net earnings(1) of $7.7 million or $0.36 per share last year. EBITDA(2) amounted to a negative balance of $4.4 million or $0.20 per share compared to a positive balance of $26.2 million or $1.21 per share last year. Despite an increase in sales, the $25.5 million decrease in net earnings(1) is primarily attributable to significantly weaker margins, increased administration costs and the negative effects of the U.S. tax reform legislation passed during the fourth quarter of the current fiscal year, which resulted in a one-time tax expense inclusion of $4.3 million.
Gross profit decreased by $19.9 million for the fiscal year, while the gross profit percentage decreased by 640 basis points from 26.7% to 20.3%. The decrease for the year is due primarily to the Company’s North American operations, which shipped a product mix with a greater proportion of projects with lower margins, coupled with pricing pressure brought on by fierce competition and continued weakness in certain markets. This loss of margin was only partially offset by the material cost savings achieved by the Company’s supply chain improvement initiatives. Furthermore, the Company’s North American operations were impacted by a backlog of project valves which it had difficulty delivering due to various customer-related issues. In addition, the upgrade of the Company’s enterprise resource planning (“ERP”) system, which was completed successfully and on time at the beginning of the current year, created normally expected learning pains and compounded those delivery challenges, resulting in the disruption of the critical path of several projects within the Company’s North American operations. This turbulence reached a peak in the third quarter, at a time where a significant order
from Asia was received. The issues created by the deployment of the new ERP system were addressed by the end of the current year, but these shipping delays resulted in increased provisions for late-delivery penalties as well as increased inventory ageing provisions which were a further drag on the Company’s gross profit percentage.
Progress overshadowed by business performance…Our strategic plan, Velocity 2020, launched last fiscal year, rests on a few key building blocks and aims at delivering the consistent returns that would be expected of a high performing company. We are far from that goal, but our business results overshadowed the fact that we are making progress on many fronts in transforming our Company:
• We are on track to deliver the commitment that I made last July to reduce our cost base by a cumulative $20 million over three years. To date, we have identified $5.2 million of cost savings under this initiative. We have achieved material savings through shifting sourcing to low cost countries and tightening up our procurement practices. We are only at the beginning of reaping the benefits of a new corporate function established at the end of fiscal year 2017 and expect material efficiencies to ramp up this year. The fact is however, as noted above, these savings are in large part being transferred to our customers because of the severe price competition currently affecting our current project business.
• The deployment of a new Velan Project Management process (“VPM”), kicked off in fiscal year 2017, is gaining traction, but as project manufacturing becomes increasingly complex and promised lead times increasingly shorter, we are not yet at point where victory can be claimed.
• The number of successfully closed breakthrough initiatives in our manufacturing operations has increased steadily, signaling a step forward in building a culture of continuous improvement.
A20”Class600Torqsealtriple-offsetvalvequalificationsetupforAPI641andISO-18848-1.Velanisanindustryleaderindevelopingbettertechnologiesforlowfugitiveemissionsvalvesthatarealsooperatorfriendlyinthefield.
CaststeelvalvesforNTPCTelanganasupercriticalpowerplantmanu-facturedandreadyforshipmentfromourVelanValvesIndialocation.
4

Message to our shareholders and employees
• We have successfully restructured our global sales force along vertical, rather than geographic market lines in order to focus resources on higher-margin segments where fewer competitors can match our product capabilities and potential to meet the toughest application requirements.
• This move is accompanied by a greater emphasis on a disciplined commercialization of our innovations and, as such, last year saw a number of new designs and product platforms introduced to the market.
• Our greater focus on the installed base is paying off as spare parts billings in percentage of sales reached a record level a second year in a row in our North American operations In France, we have seen service revenues grow also to record levels, a reflection of the exceptional after-market organization built up to service the installed base and delivering customer satisfaction. This is a business model we intend to expand to our North American operations, as we increase synergies and cooperation across our global organization.
• Most of our subs are doing well, with our French operations performing extremely well in the nuclear business and our Italian operations having turned their business around after a very difficult fiscal year 2017.
Unfortunately, the combined effect of these successes is not showing in the bottom line. Why? I must admit we underestimated the impact of a shifting business environment on our ability to drive quickly enough the business transformation foreseen under our strategic plan.
For example, our North American plants have had a very difficult time adapting to both the upgrade of our ERP, which created normally expected turbulence, and to the low backlog, which creates turbulence and hinders their ability to level production planning. We expect to see significant improvements in operations this year, thanks to the new systems and the deployment of modernized practices in capacity planning.
Also, we recognized last year the aggressive pricing behavior from our competitors, fighting for share in a slow-recovering global project manufacturing business. In fact, we have witnessed a surge of new competitors seeking to expand their reach in some of the Company’s traditional markets. This year, these price wars affected our margins to a degree not seen before. Our response to this challenge is two-fold: an aggressive materials management strategy, mentioned earlier, and a much more focused sales organization, aiming to inject momentum into our product portfolio by doubling down on higher margin growth segments. However, the benefits of this sales approach, because it depends on new capabilities in front-loaded business development, are not immediate and will materialize over time, as we are planting the seeds in promising segments where we have not traditionally been focused before.
…but laying the base for decisive actionLast year I stated that, “because the Company is financially healthy, we are careful not to rush”, recognizing the multi-fronted change challenge we are facing. This year I am saying, in reaction to the business performance, but with our financial health still strong, we have become far less patient. The good news is that the progresses made in fiscal year 2018 on the many fronts described above prepare us to move faster. The other good news is that employees tell me they are not accepting the results and are eager to contribute to the Company’s return to financial success.
Velan’sfirstGlobalEngineeringTeamMeetingwasheldinMontrealMarch5–9,2018whichincludedemployeesfromCanada,India,France,andItaly.
YvesLeduc,PresidentandCEO,VelanInc.,withFrédéricSegault,President,SegaultSASandVelanSAS,duringtheirvisittoCERN.Velanhas2,500bellowssealvalvescontrollingtheflowof700,000litersofliquidheliumtocooldownandoptimizetheperformanceof1,700magnetsto-271°CinstalledintheLHC(LargeHadronCollider),theworld’smostpowerfulparticleaccelerator.
5

Message to our shareholders and employees
Yves LeducPresident and Chief Executive Officer
As an example of this winning attitude, the unions and management quickly agreed in March 2018, to postpone the renewal of the collective agreement by one year, to avoid the distraction of the negotiations and keep everybody focused on one common goal: fixing our results. I am grateful to our unionized employees who accepted this exceptional arrangement, as well as to all of our employees, worldwide, who are working tirelessly with great engagement at pulling our Company through these difficult times.
PartofVelan’sproductstrategyincludedlaunchingproductcampaignssuchastheSecurasealRSeriescastvalveandthelatestinpressuresealvalvehardfacingtechnologywhichwereintroducedtoourcustomer’sattheDistributorconferenceheldinQuebecCityinSeptember.
In short, the rapidly changing business environment and the slow recovery in bookings for our North American operations require that we accelerate our transformation. Given the disappointing results, we are currently re-assessing our Velocity 2020 strategic plan to determine how it can be adapted to include ways to simplify our business and rapidly broaden our cost reduction initiatives. Simply put, we will need to make important changes to improve our operating results.
Other companies have undergone tough tests. I told Tom Velan that I believe, even more than when I joined, that the Company has what it takes to grow profitably in the valve world: one of the most reputed brand names in the industry, customers who root for us, incredibly knowledgeable and passionate employees, a global supply chain that is well established in western, as well as low-cost economies, and a strong balance sheet.
This is all we need to have strong confidence in our ability to rebound. Today we realize that more is needed to haul the Company out of its current position and we will respond. As far as our long-term perspective goes, the goal line may have moved away from us, but we are not losing sight of it. Stay tuned.
Velan16”Class2500forgedgatevalvesforhighpressureandhightemperatureHydrogenserviceinstalledonanAXENS-HYVAHLprocessatIRPCRayongfacilityinThailand.
6

Management’s discussion and analysis
May 24, 2018 The following discussion provides an analysis of the consolidated operating results and financial position of Velan Inc. (“the Company”) for the year ended February 28, 2018. This Management’s Discussion and Analysis (“MD&A”) should be read in conjunction with the Company’s audited consolidated financial statements for the years ended February 28, 2018 and 2017. The Company’s consolidated financial statements have been prepared in accordance with International Financial Reporting Standards (“IFRS”) as issued by the International Accounting Standards Board (“IASB”). The significant accounting policies upon which these consolidated financial statements have been prepared are detailed in Note 2 of the Company’s audited consolidated financial statements. All foreign currency transactions, balances and overseas operations have been converted to U.S. dollars, the Company’s reporting currency. Selected annual information for the three most recently completed reporting periods and a summary of quarterly results for each of the eight most recently completed quarters are included further in this report. Additional information relating to the Company, including the Annual Information Form and Proxy Information Circular, can be found on SEDAR at www.sedar.com.
BASIS OF PRESENTATION AND ANALYSIS In this MD&A, the Company has presented measures of performance or financial condition which are not defined under IFRS (“non-IFRS measures”) and are, therefore, unlikely to be comparable to similar measures presented by other companies. These measures are used by management in assessing the operating results and financial condition of the Company and are reconciled with the performance measures defined under IFRS. Reconciliations of these amounts can be found at the end of this report. FORWARD-LOOKING INFORMATION This MD&A may include forward-looking statements, which generally contain words like “should”, “believe”, “anticipate”, “plan”, “may”, “will”, “expect”, “intend”, “continue” or “estimate” or the negatives of these terms or variations of them or similar expressions, all of which are subject to risks and uncertainties. These risks and uncertainties are disclosed in the Company’s filings with the appropriate securities commissions and are included in this report (see Certain Risks That Could Affect Our Business section). While these statements are based on management’s assumptions regarding historical trends, current conditions and expected future developments, as well as other factors that it believes are reasonable and appropriate in the circumstances, no forward-looking statement can be guaranteed and actual future results may differ materially from those expressed herein. The Company disclaims any intention or obligation to update or revise any forward-looking statements contained herein whether as a result of new information, future events or otherwise, except as required by the applicable securities laws. The forward-looking statements contained in this report are expressly qualified by this cautionary statement. OVERVIEW The Company designs, manufactures and markets on a worldwide basis a broad range of industrial valves for use in most industry applications including power generation, oil and gas, refining and petrochemicals, chemical, LNG and cryogenics, pulp and paper, geothermal processes and shipbuilding. The Company is a world leader in steel industrial valves operating 14 manufacturing plants worldwide with 1,830 employees. The Company’s head office is located in Montreal, Canada. The Company’s business strategy is to design, manufacture, and market new and innovative valves with emphasis on quality, safety, ease of operation, and long service life. The Company’s strategic goals include, but are not limited to, customer-driven operational excellence and margin improvements, accelerated growth through increased focus on key target markets where the Company has distinctive competitive advantages and continuously improving and modernizing its systems and processes. The consolidated financial statements of the Company include the North American operations comprising three manufacturing plants and one distribution facility in Canada, as well as one manufacturing plant and two distribution facilities in the U.S. Significant overseas operations include manufacturing plants in France, Italy, Portugal, Korea, Taiwan, India, and China. The Company’s operations also include a distribution facility in Germany and a 50%-owned Korean foundry.
7

Management’s discussion and analysis
CONSOLIDATED HIGHLIGHTS1
(millions, excluding per share amounts)
Fiscal year ended
February 28, 2018
Fiscal year ended
February 28, 2017
Increase (decrease)
% Increase
(decrease) Consolidated statements of earnings Sales $338.0 $331.8 $6.2 1.9% Gross profit 68.6 88.5 (19.9) (22.5)% Gross profit % 20.3% 26.7% EBITDA2 (4.4) 26.2 (30.6) (116.8)% EBITDA2 % (1.3)% 7.9% EBITDA2 per share – basic and diluted (0.20) 1.21 (1.41) (116.5)% Net earnings (loss)3 (17.8) 7.7 (25.5) (331.2)% Net earnings (loss)3 % (5.3)% 2.3% Net earnings (loss)3 per share – basic and diluted (0.82) 0.36 (1.18) (327.8)% Weighted average shares outstanding 21.6 21.7 Consolidated statements of cash flows Cash provided by (used in) operating activities (1.9) 7.1 (9.0) (126.8)% Cash used in investing activities (6.7) (5.5) (1.2) (21.8)% Cash used by financing activities (11.1) (8.1) (3.0) (37.0)% Demand data Net new orders received 320.9 448.2 (127.3) (28.4)% Period ending backlog of orders 464.5 438.2 26.3 6.0%
1 All dollar amounts in this schedule are denominated in U.S. dollars. 2 Non-IFRS measures – see reconciliations at the end of this report. 3 Net earnings or loss refers to net income or loss attributable to Subordinate and Multiple Voting Shares.
8

Management’s discussion and analysis
Highlights of fiscal 2018 as well as factors that may impact fiscal 2019 (unless otherwise noted, all amounts are in U.S. dollars and all comparisons are to the prior fiscal year)
EBITDA1 amounted to a negative balance of $4.4 million or $0.20 per share compared to a positive balance of $26.2 million or $1.21 per share last year. Despite an increase in sales, the $30.6 million decrease in EBITDA1 is primarily attributable to significantly weaker margins and increased administration costs.
Net loss2 amounted to $17.8 million or $0.82 per share compared to net earnings2 of $7.7 million or $0.36 per share last year. The $25.5 million decrease in net earnings2 is primarily attributable to a lower EBITDA1 and the negative effects of the U.S. tax reform legislation passed during the fourth quarter of the current fiscal year, which resulted in a one-time tax expense inclusion of $4.3 million.
Sales amounted to $338.0 million, an increase of $6.2 million or 1.9% compared to last year. Sales were positively impacted by an increase in shipments from the Company’s Italian subsidiary, which were offset by decreased shipments from the Company’s North American operations. Delays in shipments of certain large project orders caused by various customer-related, supply chain and internal operational issues, and lower shipments of non-project commodity valves negatively impacted the Company’s North American operations.
Net new orders received (“bookings”) amounted to $320.9 million, a decrease of $127.3 million or 28.4% compared to last year. This decrease is due primarily to lower project orders booked by the Company’s French, German and Italian subsidiaries, all of which had recorded significant large project orders in the prior year period. This decrease was partially offset by improved bookings in the Company’s North American operations.
Despite the fact that sales outpaced bookings in the year, the Company ended the year with a backlog of $464.5 million, an increase of $26.3 million or 6.0% since the beginning of the current fiscal year. This increase in backlog was substantially due to the positive impact of the strengthening of the euro spot rate against the U.S. dollar over the course of the year.
Gross profit percentage decreased by 640 basis points from 26.7% to 20.3%. This decrease is due primarily to the Company’s North American operations, which shipped a product mix with a greater proportion of projects with lower margins, coupled with pricing pressure brought on by fierce competition and continued weakness in certain markets; this loss of margin was only partially offset by the material cost savings achieved by the Company’s supply chain improvement initiatives. Furthermore, the Company’s North American operations were impacted by a significant backlog of project valves which it was not able to deliver due to various customer-related issues and internal operational issues.
Administration costs amounted to $85.4 million, an increase of $9.5 million or 12.5%. This increase is primarily attributable to an increase in sales commissions and freight charges resulting from the higher sales volume, an increase in technology license fees paid on the sale of certain highly-engineered cryogenic valves by the Company’s French operations, and an increase in costs recognized in connection with the Company’s ongoing asbestos litigation (see Contingencies section). The fluctuation in asbestos costs for the year is due more to the timing of settlement payments in these two years rather than to changes in long-term trends.
The Company ended the year with net cash1 of $61.0 million, a decrease of $11.5 million or 15.9% since the beginning of the year. This decrease is primarily attributable to cash used in operations, investments in property, plant and equipment, long-term debt repayments as well as distributions to shareholders via dividends and share repurchases.
Foreign currency impacts:
o Based on average exchange rates, the euro strengthened 4.9% against the U.S. dollar when compared to the same period last year. This strengthening resulted in the Company’s net profits and bookings from its European subsidiaries being reported as higher U.S. dollar amounts in the current year.
o Based on average exchange rates, the Canadian dollar strengthened 1.8% against the U.S. dollar when compared to the same period last year. This strengthening resulted in the Company’s Canadian dollar expenses being reported as higher U.S. dollar amounts in the current year.
o Based on spot exchange rates, the euro strengthened 15.3% against the U.S. dollar when compared to the rate at the end of the last fiscal year. This strengthening resulted in losses of $1.8 million incurred on foreign exchange forward contracts used by the Company to hedge the net monetary position of its European subsidiaries. This strengthening
1 Non-IFRS measures – see reconciliations at the end of this report. 2 Net earnings or loss refers to net income or loss attributable to Subordinate and Multiple Voting Shares.
9

Management’s discussion and analysis
also resulted in a positive cumulative translation adjustment of $15.9 million which was recorded directly in equity through other comprehensive income (loss).
o The net impact of the above currency swings was generally unfavourable on the Company’s net loss1, although it was generally favourable on the Company’s equity.
Fiscal year 2018 was another challenging year for the Company. The year’s disappointing financial results were largely driven by the Company’s North American operations, which, over the last two years, have been struggling to increase their low order backlog as they continue to face intense competition in their key target markets, leading to increased pressure on pricing and lead times. This trend is now starting to show in the Company’s results as its gross profit percentage was adversely impacted by these pricing pressures despite a slight increase in sales. While the Company has been implementing several improvement initiatives at its North American operations under its strategic plan entitled “Velocity 2020”, it is clear that the pace of its transformation from a largely commodity valve operation to a more project manufacturing-based business will have to be accelerated. The Company is currently conducting a detailed review of its strategic plan and will be rolling out an accelerated version over the next fiscal year. In the meantime, the Company implemented several improvement initiatives this year, namely the continued rollout of its Valve Project Management process (“VPM”), the successful completion of a number of continuous improvement breakthrough initiatives in the Company’s manufacturing operations, the restructuring of the Company’s global sales force along vertical market lines rather than geographic lines, the disciplined commercialization of new designs and product platforms introduced to the market, and an increase of spare parts billings as percentage of sales for a second year in a row in the Company’s North American operations. While the Company’s North American operations continued to struggle, its wholly-owned French operations continued to outperform the rest of the Company as they maintained their strong sales and margins of the previous year. The Company also realized a turnaround at its Italian subsidiary which saw a return to profitability on significantly improved sales. Other factors that may impact fiscal year 2019 Due to its diversification in both geography and type of industry, the Company is well positioned to meet the many challenges it currently faces. While its financial position is healthy with a debt-to-equity ratio of only 13.7%, the Company will not be able to sustain results similar to those of the current year for consecutive years into the future. As such, the Company will accelerate its transformation plan, while continuing to pursue its global cost reduction and efficiency initiative, which was announced in the first quarter of the current fiscal year. The goal of this plan is to reduce annual supply chain, production and overhead costs by approximately $20 million by the end of the fiscal year ending February 29, 2020. Approximately $5.2 million in annual cost savings have been identified under this initiative to date. Through its various strategic initiatives, the Company is working to be a more agile player in the global valve market in order to better take advantage of market swings and changes in customer demands and preferences. However, there can be no assurance that outside economic and geopolitical factors will not materially adversely affect the Company’s results of operations or financial condition. Such factors include, but are not limited to foreign currency fluctuations, in particular the Canadian dollar and the euro against the U.S. dollar, commodity price fluctuations from both a procurement (price of steel) and sales (price of oil) perspective, and the potential imposition of protectionist trade measures and sanctions. See Certain Risks That Could Affect Our Business section below for more details.
1 Net earnings or loss refers to net income or loss attributable to Subordinate and Multiple Voting Shares.
10

Management’s discussion and analysis
SUMMARY OF RESULTS Summary financial data derived from the Company’s financial statements prepared in accordance with IFRS for the three most recently completed reporting periods are as follows:
For the reporting periods ended on the following dates (in thousands of U.S. dollars, excluding number of shares and per share amounts)
Fiscal year ended February 28, 2018
Fiscal year ended February 28, 2017
Fiscal year ended February 29, 2016
Operating Data Sales $337,963 $331,777 $426,895 Net Earnings (loss)1 (17,811) 7,737 3,641 Earnings (loss) per Share - Basic (0.82) 0.36 0.17 - Diluted (0.82) 0.36 0.17
Balance Sheet Data Total Assets 540,193 519,297 515,627 Total Long-Term Financial Liabilities 22,200 22,532 23,516
Shareholder Data Cash dividends per share - Multiple Voting Shares2 0.31 0.31 0.31 - Subordinate Voting Shares 0.31 0.31 0.31
Outstanding Shares at report date - Multiple Voting Shares2 15,566,567 - Subordinate Voting Shares 6,055,368
Sales for fiscal year 2018 increased by 1.9% compared to fiscal year 2017. This increase was primarily attributable to an increase in shipments from the Company’s Italian subsidiary, which were offset by decreased shipments from the Company’s North American operations. Delays in shipments of certain large project orders caused by various customer-related, supply chain and internal operational issues, and lower shipments of non-project commodity valves negatively impacted the Company’s North American operations. Sales for fiscal year 2017 decreased by 22.3% compared to fiscal year 2016. This decrease was primarily attributable to the lower level of bookings recorded over the course of fiscal year 2016 due in turn to softer demand in our core markets, which negatively impacted the sales volume in fiscal year 2017. Gross profit for fiscal year 2018 amounted to $68.6 million, a decrease of $19.9 million from fiscal year 2017, while the gross profit percentage decreased from the 26.7% reported in fiscal year 2017 to 20.3% in fiscal year 2018. This decrease was due primarily to the Company’s North American operations, which shipped a product mix with a greater proportion of projects with lower margins, coupled with pricing pressure brought on by fierce competition and continued weakness in certain markets, which was only partially offset by the material cost savings. Gross profit for fiscal year 2017 amounted to $88.5 million, a decrease of $15.8 million from fiscal year 2016. However, gross profit percentage for fiscal year 2017 increased from the 24.4% reported in fiscal year 2016 to 26.7%. While the lower sales volume negatively impacted total gross profit in the year, the increase in the gross profit percentage was mainly attributable to a product mix with a greater proportion of higher margin product sales, material cost savings, as well as labour and overhead savings stemming from the restructuring initiatives implemented in the prior fiscal year. Administration costs for fiscal year 2018 increased by $9.5 million when compared to fiscal year 2017. This increase was primarily attributable to an increase in sales commissions and freight charges due to the increased sales volume, an increase in technology license fees paid on the sale of certain highly-engineered cryogenic valves, and an increase in costs recognized in connection with the Company’s ongoing asbestos litigation (see Contingencies section). Administration costs for fiscal year 2017 decreased by $2.1 million when compared to fiscal year 2016. This decrease was achieved despite a $1.2 million increase in costs recognized in connection with the Company’s ongoing asbestos litigation (see Contingencies section). The fiscal year 2018 net loss1 was also negatively impacted by a $4.3 million one-time income tax charge due to the U.S. tax reform legislation passed in December 2017. The fiscal year 2016 net earnings1 were negatively impacted by an $11.5 million non-cash goodwill impairment loss related to the Velan ABV S.r.l. (“ABV”) cash-generating unit and restructuring costs of $2.8 million related primarily to the Company’s North American and U.K. facilities.
1 Net earnings or loss refers to net income or loss attributable to Subordinate and Multiple Voting Shares. 2 Multiple Voting Shares (five votes per share) are convertible into Subordinate Voting Shares on a 1 to 1 basis.
11

Management’s discussion and analysis
RESULTS OF OPERATIONS – for the year ended February 28, 2018 compared to the year ended February 28, 2017 (unless otherwise noted, all amounts are in U.S. dollars and all comparisons are to the prior fiscal year)
Sales
(millions)
Year ended February 28,
2018
Year ended February 28,
2017 Sales $338.0 $331.8
Sales increased by $6.2 million or 1.9% from the prior year. Sales were positively impacted by an increase in shipments from the Company’s Italian subsidiary, which was offset by decreased shipments from the Company’s North American operations. One reason for such decreased shipments was due to delays in shipments of certain large project orders caused by various customer-related, supply chain and internal operational issues. One particular project order, destined to an oil and gas project in Mexico, totalling approximately $11 million, has been ready to ship since the first quarter of the prior fiscal year but was delayed due to the customer having put the order on hold. While the customer has maintained its commitment to eventually take possession of these goods, it is currently unclear as to the timing of their shipment. Sales were also negatively impacted by lower shipments of non-project commodity valves, particularly in North America. At first, the weakness in this segment, which mainly sells into the oil and gas sector, was perceived to be temporary and largely related to market conditions. However, as competition has intensified and competitors have gained market share, it is now apparent that the decline is more permanent. As such, it has become imperative for the Company to shift its focus and target discrete market segments where its engineering know-how and agile design capabilities can be a leverage for future growth. Bookings and backlog
(millions)
Year ended February 28,
2018
Year ended February 28,
2017 Bookings $320.9 $448.2
Bookings decreased by $127.3 million or 28.4% from the prior year. The decrease for the year is due primarily to lower project orders booked by the Company’s French, German and Italian subsidiaries, all of which had recorded significant large project orders in the prior year, notably approximately $22 million in project orders won by the Company’s Italian operations to supply valves to the oil and gas sector in the Middle East, approximately $91 million in project orders won by the Company’s French operations to supply valves to the nuclear power market in China and the U.K., and approximately $21 million in project orders won by the Company’s German operations to supply valves to the power market in Vietnam. Furthermore, bookings were negatively impacted by the cancellation of a $6 million oil and gas sector order at the Company’s Italian subsidiary in the first quarter of the current year. While the Company’s North American operations recorded higher bookings for the year, such amount remains low when compared to previous fiscal years. The current highly competitive environment in its various markets continues to put downward pressure on pricing and lead times. Given these trends, the Company has accelerated the assessment of its global manufacturing footprint, supply chain and cost structure as per its Velocity 2020 strategic plan. Consequently, the Company is pursuing its global cost reduction and efficiency initiative with the goal of reducing annual supply chain, production and overhead costs by approximately $20 million by the end of the fiscal year ending February 29, 2020. Approximately $5.2 million in annual cost savings have been identified under this initiative to date.
(millions)
February 2018
February 2017
February 2016
Backlog $464.5 $438.2 $331.2 For delivery within the subsequent fiscal year $286.7 $270.5 $256.2 For delivery beyond the subsequent fiscal year $177.8 $167.7 $75.0 Percentage – beyond the subsequent fiscal year 38.3% 38.3% 22.7%
12

Management’s discussion and analysis
As a result of sales outpacing bookings in the current fiscal year, the Company’s book-to-bill ratio was 0.95 for the year. Despite this low ratio, the total backlog increased by $26.3 million or 6.0% since the beginning of the fiscal year, settling at $464.5 million. This improvement in the backlog was achieved as a result of the positive impact of the strengthening of the euro spot rate against the U.S. dollar at the end of the current year when compared to the spot rate at the beginning of the year. Gross profit
(millions)
Year ended February 28,
2018
Year ended February 28,
2017 Gross profit $68.6 $88.5 Gross profit percentage 20.3% 26.7%
Gross profit decreased by $19.9 million for the fiscal year, while the gross profit percentage decreased by 640 basis points from 26.7% to 20.3%. The decrease for the year is due primarily to the Company’s North American operations, which shipped a product mix with a greater proportion of projects with lower margins. Pricing pressure brought on by fierce competition, continued weakness in certain markets, and warranty provisions also had a negative impact on the gross profit percentage. This loss of margin was only partially offset by the material cost savings achieved by the Company’s supply chain improvement initiatives. Furthermore, the Company’s North American operations were impacted by a backlog of project valves which they had difficulty delivering due to various customer-related issues. In addition, the upgrade of the Company’s enterprise resource planning (“ERP”) system, which was completed successfully and on time at the beginning of the current year, created normally expected learning pains and compounded those delivery challenges, resulting in the disruption of the critical path of several projects within the Company’s North American operations. This turbulence reached a peak in the third quarter, at a time where a significant order from Asia was received. The issues created by the deployment of the new ERP system were addressed by the end of the current year, but these shipping delays resulted in increased provisions for inventory ageing which were a further drag on the Company’s gross profit percentage. Administration costs
(millions)
Year ended February 28,
2018
Year ended February 28,
2017 Administration costs* $85.4 $75.9 As a percentage of sales 25.3% 22.9% *Includes asbestos-related costs of: $8.2 $6.8
Administration costs increased by $9.5 million or 12.5% for the fiscal year. This increase was primarily attributable to an increase in sales commissions and freight charges resulting from the higher sales volume, an increase in technology license fees paid on the sale of certain highly-engineered cryogenic valves by the Company’s French operations, and an increase in costs recognized in connection with the Company’s ongoing asbestos litigation (see Contingencies section). The fluctuation in asbestos costs for both years is due more to the timing of settlement payments in these two periods rather than to changes in long-term trends. Like many other U.S. valve manufacturers, two of the Company’s U.S. subsidiaries have been named as defendants in a number of pending lawsuits brought on behalf of individuals seeking to recover damages for their alleged asbestos exposure. These lawsuits are related to products manufactured and sold in the past. Management believes that any asbestos was incorporated entirely within the product in such a way that it would not create a hazard during normal operation, inspection or repairs. Management strongly believes its products, which were supplied in accordance with valve industry practice and customer mandated specifications, did not contribute to any asbestos-related illness. The Company will continue to vigorously defend against these claims but given the ongoing course of asbestos litigation in the U.S. and the unpredictability of jury trials, it is not possible to make an estimate of any settlement costs and legal fees.
13

Management’s discussion and analysis
Other expense (income)
(millions)
Year ended February 28,
2018
Year ended February 28,
2017 Other expense (income) $1.5 $(0.4)
Other expense increased by $1.9 million for the fiscal year. The increase for the year is primarily attributable to mark-to-market losses of $1.8 million incurred on foreign exchange forward contracts used by the Company to hedge the net monetary position of its European subsidiaries, which is denominated in euros. On similar instruments used in the prior year, the Company incurred mark-to-market gains of $0.7 million. The euro spot rate appreciated 15.3% against the U.S. dollar since the beginning of the current fiscal year, resulting in an increase to net loss1. This euro appreciation also had a positive impact on the Company’s statement of financial position since it resulted in a positive cumulative translation adjustment of $15.9 million for the year, which was recorded directly in equity through other comprehensive income (loss). As such, the net impact of the euro appreciation was generally positive on the Company’s equity, even though the Company’s net loss1 was depressed as a result. Net finance costs
(millions)
Year ended February 28,
2018
Year ended February 28,
2017 Net finance costs $0.2 $0.1
Net finance costs increased by $0.1 million for the fiscal year. While long-term debt remained relatively stable when compared to the prior fiscal year, the Company’s overall debt load increased over the course of the current fiscal year, particularly its bank indebtedness in its North American and Italian operations, resulting in an increase in its finance costs (see Liquidity and Capital Resources section). Income taxes
(in thousands, excluding percentages)
Year ended February 28, 2018
Year ended February 28, 2017
$ % $ % Income (loss) before income taxes (18,512) 100.0 12,994 100.0 Tax calculated at domestic tax rates applicable to earnings in the respective countries
(3,562)
19.2 5,020
38.6
Tax effects of: Non-deductible (taxable) foreign exchange loss (gain) (303) 1.6 (344) (2.6) Losses not tax effected 1,151 (6.2) 1,552 11.9 Losses utilized not previously tax effected - - (444) (3.4) Benefit attributable to a financing structure (917) 5.0 (927) (7.1) Effect of U.S. Tax Reform 4,259 (23.1) - - Other (267) 1.5 (177) (1.4) Provision for income taxes 361
(2.0) 4,680 36.0
U.S. Tax Reform was substantially enacted on December 22, 2017 under its official name “An Act to Provide for Reconciliation Pursuant to Titles II and V of the Concurrent Resolution on the Budget for Fiscal Year 2018”. As a result of the enactment of this legislation, the Company’s U.S. subsidiary recorded a one-time tax expense of $4.3 million, of which $2.3 million was due to the new mandatory repatriation tax and $2.0 million was due to the effect of the tax rate reduction on its net deferred income tax assets.
1 Net earnings or loss refers to net income or loss attributable to Subordinate and Multiple Voting Shares.
14

Management’s discussion and analysis
Net earnings (loss)1
(millions)
Year ended February 28,
2018
Year ended February 28,
2017 Net earnings (loss)1 $(17.8) $7.7 As a percentage of sales (5.3)% 2.3% EBITDA2 $(4.4) $26.2 As a percentage of sales (1.3)% 7.9%
Net loss1 amounted to $17.8 million or $0.82 per share compared to net earnings1 of $7.7 million or $0.36 per share last year. EBITDA2 amounted to a negative balance of $4.4 million or $0.20 per share compared to a positive balance of $26.2 million or $1.21 per share last year. Despite an increase in sales, the $25.5 million decrease in net earnings1 is primarily attributable to significantly weaker margins, increased administration costs and the negative effects of the U.S. tax reform legislation passed during the fourth quarter of the current fiscal year, which resulted in a one-time tax expense inclusion of $4.3 million. SUMMARY OF QUARTERLY RESULTS Summary financial data derived from the Company’s unaudited financial statements from each of the eight most recently completed quarters are as follows:
For the quarters in months ended May, August, November and February (in thousands of U.S. dollars, excluding per share amounts)
QUARTERS ENDED February
2018 November
2017 August
2017 May 2017
February 2017
November 2016
August 2016
May 2016
Sales $102,607 $87,738 $76,531 $71,087 $102,835 $80,396 $71,137 $77,409 Net earnings (loss)1 (8,221) 305 (5,591) (4,304) 3,707 1,501 2,001 528 Net earnings (loss)1 per share - Basic (0.38) 0.02 (0.26) (0.20) 0.17 0.07 0.10 0.02 - Diluted (0.38) 0.02 (0.26) (0.20) 0.17 0.07 0.10 0.02
Sales can vary from one quarter to the next due to the timing of the shipment of large project orders. Sales were higher in the quarters ended in February 2017 and February 2018 due to increased shipments of such orders, while the lower sales amounts for the quarters ended in May 2016, August 2016, November 2016, May 2017, August 2017 and November 2017 were due to delayed execution on the shipments of such orders. Net earnings1 for the quarters ended in August 2016, November 2016 and February 2017 were higher due to a more efficient product mix. A net loss1 was recorded in the quarters ended in May 2017 and August 2017 due to lower sales volume and a less efficient product mix. Net earnings1 for the quarters ended May 2016 and November 2017 were lower due to a less efficient product mix. The net loss1 for the quarter ended in February 2018 was due to a less efficient product mix, shipping delays caused by internal operational issues and a $4.3 million one-time income tax charge resulting from the U.S. tax reform legislation passed in December 2017.
1 Net earnings or loss refers to net income or loss attributable to Subordinate and Multiple Voting Shares. 2 Non-IFRS measures – see reconciliations at the end of this report.
15

Management’s discussion and analysis
RESULTS OF OPERATIONS – quarter ended February 28, 2018 compared to the quarter ended February 28, 2017 (unless otherwise noted, all amounts are in U.S. dollars and all comparisons are to the fourth quarter of the prior fiscal year) Sales
(millions)
Three-month period ended February 28,
2018
Three-month period ended February 28,
2017 Sales $102.6 $102.8
Sales remained relatively stable for the quarter, decreasing by $0.2 million or 0.2%. While sales were lower in the current quarter when compared to the comparative period in the prior year, they were stronger when compared to the previous three quarters of the current fiscal year. Sales for the quarter were improved in the Company’s Italian subsidiary, while its North American operations realized lower sales due to delays in shipments of certain large project orders caused by various customer-related, supply chain and internal operational issues. Bookings
(millions)
Three-month period ended February 28,
2018
Three-month period ended February 28,
2017 Bookings $72.9 $125.9
Bookings decreased by $53.0 million or 42.1% for the quarter. The decrease in bookings is primarily attributable to the Company’s French operations which had won $55 million in large project orders in the prior year comparable quarter to supply valves towards the construction of a nuclear power plant in the U.K. While bookings remained relatively flat if these orders are not taken into account, the Company’s North American operations continue to struggle as the current highly competitive environment in many of its markets continues to put downward pressure on pricing and lead times, despite the fact that the outlook in most of these markets are beginning to show signs of improvement. Gross profit
(millions)
Three-month period ended February 28,
2018
Three-month period ended February 28,
2017 Gross profit $17.3 $28.9 Gross profit percentage 16.9% 28.1%
Gross profit decreased by $11.6 million for the quarter, while the gross profit percentage decreased by 1,120 basis points from the prior year quarter. Despite the fact that sales remained relatively stable and that the Company maintained control over its labour and overhead costs, both the gross profit and the gross profit percentage decreased significantly due primarily to shipping a product mix with a greater proportion of projects with lower margins, a decrease in production which reduced the amount of current period direct labour and production overhead costs that could be capitalized, and warranty provisions. In addition, shipping delays due to customer-related and internal operational issues resulted in an increase in provisions for inventory ageing, which had a direct negative impact on the Company’s margins. The lingering pricing pressure and the Company’s inherent fixed overhead costs due to its large global manufacturing footprint continue to have a negative impact on its gross profit percentage, particularly in its North American operations which saw a 320 basis point increase in its material cost as a percentage of sales in the quarter. The Company aims to address these latter issues through its strategic initiatives, namely materials management, targeting higher margin segments and overhead reduction.
16

Management’s discussion and analysis
Administration costs
(millions)
Three-month period ended February 28,
2018
Three-month period ended February 28,
2017 Administration costs* $22.7 $19.0 As a percentage of sales 22.1% 18.5% *Includes asbestos-related costs of: $2.0 $1.2
Administration costs for the quarter increased by $3.7 million or 19.5% for the quarter. The increase is primarily attributable to an increase in sales commissions and freight charges as well as an increase in costs associated with the Company’s ongoing asbestos litigation (see Contingencies section). The fluctuation in asbestos costs is due more to the timing of settlement payments than to changes in long-term trends. Net finance costs
(millions)
Three-month period ended February 28,
2018
Three-month period ended February 28,
2017 Net finance costs $0.1 $0.3
Net finance costs decreased by $0.2 million for the quarter. The Company did not incur any new long-term debt borrowings over the course of the quarter. Income taxes
(in thousands, excluding percentages) Three-month period ended
February 28, 2018 Three-month period ended
February 28, 2017 $ % $ % Income (loss) before income taxes (5,333) 100.0 9,067 100.0 Tax calculated at domestic tax rates applicable to earnings in the respective countries
(605)
11.3 4,241
46.8
Tax effects of: Non-deductible (taxable) foreign exchange loss (gain) (92) 1.7 (181) (2.0) Losses not tax effected 645 (12.1) 1,514 16.7 Losses utilized not previously tax effected - - (158) (1.8) Benefit attributable to a financing structure (230) 4.3 (220) (2.4) Effect of U.S. Tax Reform 4,259 (79.8) - - Other (292) 5.5 (215) (2.4) Provision for income taxes 3,685
(69.1) 4,981 54.9
U.S. Tax Reform was substantially enacted on December 22, 2017 under its official name “An Act to Provide for Reconciliation Pursuant to Titles II and V of the Concurrent Resolution on the Budget for Fiscal Year 2018”. As a result of the enactment of this legislation, the Company’s U.S. subsidiary recorded a one-time tax expense of $4.3 million, of which $2.3 million was due to the new mandatory repatriation tax and $2.0 million was due to the effect of the tax rate reduction on its net deferred income tax assets.
17

Management’s discussion and analysis
Net earnings (loss)1
(millions)
Three-month period ended February 28,
2018
Three-month period ended February 28,
2017 Net earnings (loss)1 $(8.2) $3.7 As a percentage of sales (8.0)% 3.6% EBITDA2 $(1.2) $12.6 As a percentage of sales (1.2)% 12.3%
Net loss1 amounted to $8.2 million or $0.38 per share compared to net earnings1 of $3.7 million or $0.17 per share last year. EBITDA2 amounted to a negative balance of $1.2 million or $0.05 per share compared to a positive balance of $12.6 million or $0.58 per share last year. Despite relatively stable sales in the quarter, the $11.9 million decrease in net earnings1 is primarily attributable to significantly weaker margins, increased administration costs and the negative effects of the U.S. tax reform legislation passed during the current quarter, which resulted in a one-time tax expense inclusion of $4.3 million.
1 Net earnings or loss refers to net income or loss attributable to Subordinate and Multiple Voting Shares. 2 Non-IFRS measures – see reconciliations at the end of this report.
18

Management’s discussion and analysis
LIQUIDITY AND CAPITAL RESOURCES – a discussion of liquidity risk, credit facilities, cash flows and proposed transactions (unless otherwise noted, all dollar amounts are denominated in U.S. dollars) Liquidity risk is the risk that the Company will not be able to meet its financial obligations as they come due. The Company manages its liquidity risk by continually monitoring its future cash requirements. Cash flow forecasting is performed in the operating entities and aggregated by the Company’s corporate finance team. The Company’s policy is to maintain sufficient cash and cash equivalents and available credit facilities in order to meet its present and future operational needs. The following tables present the Company’s financial liabilities identified by type and future contractual dates of payment as at:
As at February 28, 2018
Total
$
Less than1 year
$
1 to 3Years
$
4 to 5 Years
$
After5 years
$
Long-term debt 22,129 8,151 5,371 3,548 5,059Accounts payable and accrued liabilities 63,411 63,411 - - -Customer deposits 48,963 48,963 - - -Accrual for performance guarantees 32,655 32,655 - - -Bank indebtedness and short-term bank loans 21,922 21,922 - - -Derivative liabilities 1,615 1,615 - - -
On February 28, 2018, the Company’s order backlog was $464.5 million and its net cash1 plus unused credit facilities amounted to $144.0 million, which it believes, along with future cash flows generated from operations, is sufficient to meet its financial obligations, increase its capacity, satisfy its working capital requirements, and execute on its business strategy. However, there can be no assurance that the risk of another sharp downturn in the economy will not materially adversely affect the Company’s results of operations or financial condition. The Company continues to closely monitor the continued weakness of the price of oil and the euro currency, as well as recent trade protectionist measures and economic sanctions. The Company is in compliance with all covenants related to its debt and credit facilities.
As a corollary to managing its liquidity risk the Company also monitors the financial health of its key suppliers. Proposed transactions The Company has not committed to any material asset or business acquisitions or dispositions, other than those already discussed in this MD&A.
1 Non-IFRS measures – see reconciliations at the end of this report.
19

Management’s discussion and analysis
Cash flows (unless otherwise noted, all amounts are in U.S. dollars and all comparisons are to same period in the prior fiscal year) Net cash1
(millions) February
2018 November
2017 February
2017 November
2016 February
2016 Net cash1 $61.0 $73.2 $72.5 $72.6 $82.0
The Company’s net cash1 decreased by $12.2 million or 16.7% over the course of the quarter and by $11.5 million or 15.9% since the beginning of the current fiscal year. This decrease is primarily attributable to cash used in operating activities, investments in property, plant and equipment, long-term debt repayments, as well as distributions to shareholders via dividends and share repurchases. Cash provided by (used in) operating activities
(millions)
Fiscal Year ended
February 28, 2018
Fiscal Year ended
February 28, 2017
Three-month period ended February 28,
2018
Three-month period ended February 28,
2017 Cash provided by (used in) operating activities $(1.9) $7.1 $(8.9) $0.3
Cash used in operating activities amounted to $8.9 million for the current quarter compared to cash provided by operating activities of $0.3 million in the prior year. The current quarter’s negative variance consisted of negative cash net losses2 of $13.5 million and positive non-cash working capital movements of $4.6 million. Cash used in operating activities amounted to $1.9 million for the current year compared to cash provided by operating activities of $7.1 million in the prior year. The current year’s negative variance consisted of negative cash net losses2 of $12.5 million and positive non-cash working capital movements of $10.6 million. Accounts receivable
(millions)
Fiscal Year ended
February 28, 2018
Fiscal Year ended
February 28, 2017
Three-month period ended February 28,
2018
Three-month period ended February 28,
2017 Accounts receivable increase $10.3 $5.9 $23.9 $21.9
Accounts receivable balances are a function of the timing of sales and cash collections. The accounts receivable balance increased in both the current quarter and fiscal year due primarily to a greater proportion of the Company’s accounts receivable, which consist primarily of sales for large project orders that generally entail longer collection terms, being recorded closer to the end of the current quarter. Inventories
(millions)
Fiscal Year ended
February 28, 2018
Fiscal Year ended
February 28, 2017
Three-month period ended February 28,
2018
Three-month period ended February 28,
2017 Inventories decrease (increase) $2.6 $(10.6) $12.8 $6.0 Customer deposits increase $5.7 $15.8 $2.8 $5.8
Inventories typically increase in times of rising backlog and order bookings and decrease when the opposite occurs. Inventories are also a function of timing between receipts and shipments. For the current quarter and fiscal year, inventories decreased since the Company had large shipments closer to the end of the quarter without replenishing its stock. In order to help finance its investment in inventories, the Company, where possible, obtains customer deposits for large orders. Customer deposits increased for both the current quarter and fiscal year due to higher customer deposits on certain large export project orders in the Company’s North American and German operations. 1 Non-IFRS measures – see reconciliations at the end of this report. 2 Net earnings or loss refers to net income or loss attributable to Subordinate and Multiple Voting Shares.
20

Management’s discussion and analysis
Accounts payable and accrued liabilities
(millions)
Fiscal Year ended
February 28, 2018
Fiscal Year ended
February 28, 2017
Three-month period ended February 28,
2018
Three-month period ended February 28,
2017 Accounts payable and accrued liabilities (decrease) increase $3.2 $(2.3) $(0.8) $1.7
For all of the indicated periods, the fluctuations in accounts payable and accrued liabilities were primarily related to timing, particularly related to inventory.
Additions to property, plant and equipment
(millions)
Fiscal Year ended
February 28, 2018
Fiscal Year ended
February 28, 2017
Three-month period ended February 28,
2018
Three-month period ended February 28,
2017 Additions to property, plant and equipment $6.2 $7.7 $1.8 $1.7
The fluctuations in additions to property, plant and equipment for any period when compared to the prior year comparable period is due to the timing of the receipts of certain equipment.
Long-term debt
(millions)
Fiscal Year ended
February 28, 2018
Fiscal Year ended
February 28, 2017
Three-month period ended February 28,
2018
Three-month period ended February 28,
2017 Increase in long-term debt $ - $5.1 $ - $5.1 Repayment of long-term debt $3.2 $5.9 $0.9 $0.6
During the current quarter and fiscal year, the Company continued to pay down its outstanding long-term debt without undertaking any new debt issuances.
Dividends paid and repurchase of shares
(millions)
Fiscal Year ended
February 28, 2018
Fiscal Year ended
February 28, 2017
Three-month period ended February 28,
2018
Three-month period ended February 28,
2017 Dividends paid $6.7 $6.6 $1.7 $1.6 Repurchase of shares $0.6 $0.9 $ - $0.6
While, the Company maintained its current dividend policy of CA$0.10 per share per quarter in the current fiscal year, it adjusted it down to CA$0.03 per share per quarter, beginning in June 2018. Furthermore, pursuant to its Normal Course Issuer Bid, the Company repurchased for cancellation a total of 45,300 Subordinate Voting Shares for a cash consideration of $0.6 million over the course of the current fiscal year. None of these repurchases occurred in the current quarter.
21

Management’s discussion and analysis
FINANCIAL INSTRUMENTS AND FINANCIAL RISK MANAGEMENT
The Company’s activities expose it to a variety of financial risks: market risk (including currency risk, cash flow interest rate risk and fair value interest rate risk), credit risk and liquidity risk. The Company’s overall financial risk management program focuses on mitigating unpredictable financial market risks and their potential adverse effects on the Company’s financial performance.
The Company’s financial risk management is generally carried out by the corporate finance team, based on policies approved by the Board of Directors. The identification, evaluation and hedging of the financial risks are the responsibility of the corporate finance team in conjunction with the finance teams of the Company’s subsidiaries. The Company uses derivative financial instruments to hedge certain risk exposures. Use of derivative financial instruments is subject to a policy which requires that no derivative transaction be entered into for the purpose of establishing a speculative or leveraged position (the corollary being that all derivative transactions are to be entered into for risk management purposes only). Risk overview The Company’s financial instruments and the nature of risks which they may be subject to are set out in the following table:
Risks
Market
Financial instrument Currency Interest rate Credit Liquidity
Cash and cash equivalents x x x Short-term investments x x x Accounts receivable x x Derivative assets x x Bank indebtedness x x xShort-term bank loans x x xAccounts payable and accrued liabilities x xCustomer deposits x xDividend payable x xAccrual for performance guarantees x xDerivative liabilities x xLong-term debt x x x
Market risk Currency risk Currency risk on financial instruments is the risk that the fair value of future cash flows of a financial instrument will fluctuate because of changes in foreign exchange rates. The Company operates internationally and is exposed to foreign exchange risk arising from various currency exposures. Currency risk arises when future commercial transactions and recognized assets and liabilities are denominated in a currency other than a company’s functional currency. The Company has operations with different functional currencies, each of which will be exposed to currency risk based on its specific functional currency.
When possible, the Company matches cash receipts in a foreign currency with cash disbursements in that same currency. The remaining anticipated net exposure to foreign currencies is hedged. To hedge this exposure, the Company uses foreign currency derivatives, primarily foreign exchange forward contracts. These derivatives are not designated as hedges for accounting purposes.
22
Management’s discussion and analysis
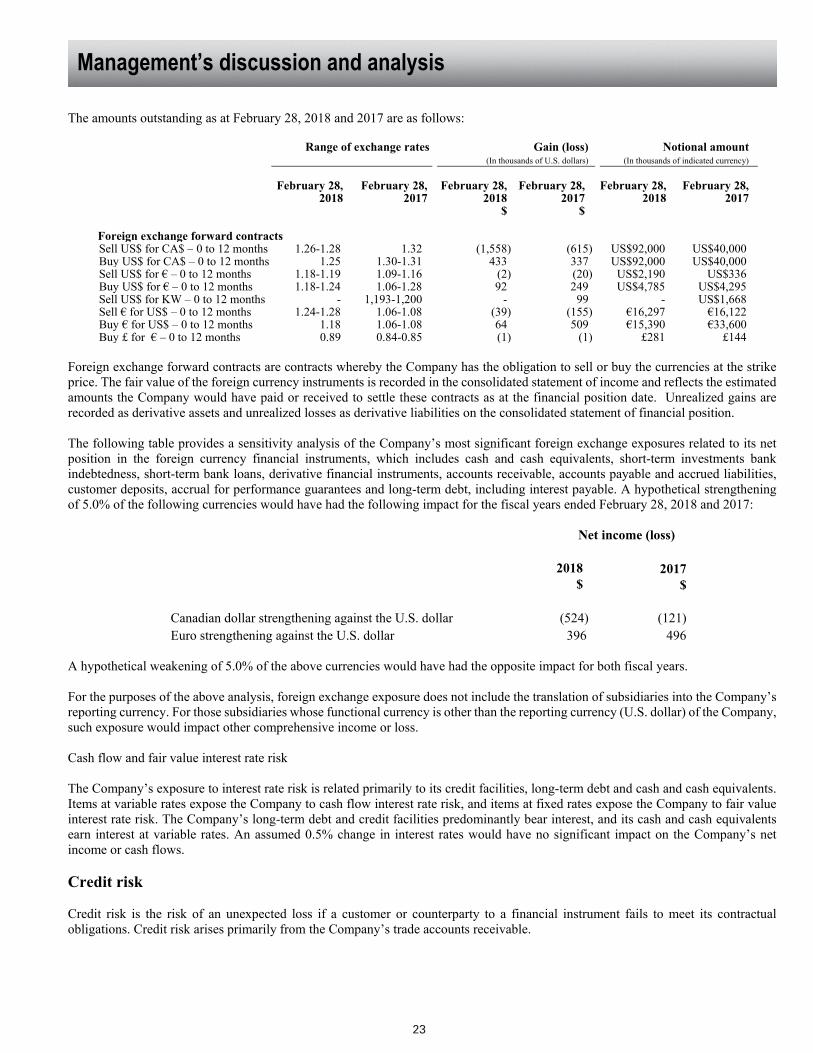
The amounts outstanding as at February 28, 2018 and 2017 are as follows:
Range of exchange rates Gain (loss)
(In thousands of U.S. dollars) Notional amount
(In thousands of indicated currency)
February 28, 2018
February 28, 2017
February 28, 2018
$
February 28, 2017
$
February 28, 2018
February 28, 2017
Foreign exchange forward contracts Sell US$ for CA$ – 0 to 12 months 1.26-1.28 1.32 (1,558) (615) US$92,000 US$40,000Buy US$ for CA$ – 0 to 12 months 1.25 1.30-1.31 433 337 US$92,000 US$40,000Sell US$ for € – 0 to 12 months 1.18-1.19 1.09-1.16 (2) (20) US$2,190 US$336Buy US$ for € – 0 to 12 months 1.18-1.24 1.06-1.28 92 249 US$4,785 US$4,295Sell US$ for KW – 0 to 12 months - 1,193-1,200 - 99 - US$1,668Sell € for US$ – 0 to 12 months 1.24-1.28 1.06-1.08 (39) (155) €16,297 €16,122Buy € for US$ – 0 to 12 months 1.18 1.06-1.08 64 509 €15,390 €33,600Buy £ for € – 0 to 12 months 0.89 0.84-0.85 (1) (1) £281 £144
Foreign exchange forward contracts are contracts whereby the Company has the obligation to sell or buy the currencies at the strike price. The fair value of the foreign currency instruments is recorded in the consolidated statement of income and reflects the estimated amounts the Company would have paid or received to settle these contracts as at the financial position date. Unrealized gains are recorded as derivative assets and unrealized losses as derivative liabilities on the consolidated statement of financial position. The following table provides a sensitivity analysis of the Company’s most significant foreign exchange exposures related to its net position in the foreign currency financial instruments, which includes cash and cash equivalents, short-term investments bank indebtedness, short-term bank loans, derivative financial instruments, accounts receivable, accounts payable and accrued liabilities, customer deposits, accrual for performance guarantees and long-term debt, including interest payable. A hypothetical strengthening of 5.0% of the following currencies would have had the following impact for the fiscal years ended February 28, 2018 and 2017:
Net income (loss) 2018 2017 $ $
Canadian dollar strengthening against the U.S. dollar (524) (121) Euro strengthening against the U.S. dollar 396 496
A hypothetical weakening of 5.0% of the above currencies would have had the opposite impact for both fiscal years. For the purposes of the above analysis, foreign exchange exposure does not include the translation of subsidiaries into the Company’s reporting currency. For those subsidiaries whose functional currency is other than the reporting currency (U.S. dollar) of the Company, such exposure would impact other comprehensive income or loss. Cash flow and fair value interest rate risk The Company’s exposure to interest rate risk is related primarily to its credit facilities, long-term debt and cash and cash equivalents. Items at variable rates expose the Company to cash flow interest rate risk, and items at fixed rates expose the Company to fair value interest rate risk. The Company’s long-term debt and credit facilities predominantly bear interest, and its cash and cash equivalents earn interest at variable rates. An assumed 0.5% change in interest rates would have no significant impact on the Company’s net income or cash flows. Credit risk Credit risk is the risk of an unexpected loss if a customer or counterparty to a financial instrument fails to meet its contractual obligations. Credit risk arises primarily from the Company’s trade accounts receivable.
23

Management’s discussion and analysis
The Company’s credit risk related to its trade accounts receivable is concentrated. As at February 28, 2018, four (2017 – four) customers accounted for more than 5% each of its trade accounts receivable, of which one customer accounted for 9.6% (2017 – 8.5%), and the Company’s ten largest customers accounted for 57.3% (2017 – 52.4%). In addition, one customer accounted for 9.86% of the Company’s sales (2017 – 13.3%). In order to mitigate its credit risk, the Company performs a continual evaluation of its customers’ credit and performs specific evaluation procedures on all its new customers. In performing its evaluation, the Company analyzes the ageing of accounts receivable, historical payment patterns, customer creditworthiness and current economic trends. A specific credit limit is established for each customer and reviewed periodically. An allowance for doubtful accounts is recorded when, based on management’s evaluation, the collection of an account receivable is not reasonably certain. The Company is also exposed to credit risk relating to derivative financial instruments, cash and cash equivalents and short-term investments, which it manages by dealing with highly rated financial institutions. The Company’s primary credit risk is limited to the carrying value of the trade accounts receivable and gains on derivative assets. The table below summarizes the ageing of trade accounts receivable as at:
As at February 28,
2018 $
As at February 28,
2017 $
Current 91,534 77,262 Past due 0 to 30 days 12,421 19,330 Past due 31 to 90 days 8,546 7,625 Past due more than 90 days 18,714 16,508 131,215 120,725 Less: Allowance for doubtful accounts 1,088 1,239 Trade accounts receivable 130,127 119,486 Other receivables 7,255 6,026 Total accounts receivable 137,382 125,512
The table below summarizes the movements in the allowance for doubtful accounts:
As at February 28,
2018 $
As at February 28,
2017 $
Balance – Beginning of year 1,239 1,653 Bad debt expense 212 414 Recoveries of trade accounts receivable (444) (598)Write-off of trade accounts receivable (122) (214)Foreign exchange 203 (16) Balance – End of year 1,088 1,239
Liquidity risk – see discussion in liquidity and capital resources section
24

Management’s discussion and analysis
CONTINGENCIES (in thousands of U.S. dollars, excluding number of cases)
Two of the Company’s U.S. subsidiaries have been named as defendants in a number of pending lawsuits that seek to recover damages for personal injury allegedly caused by exposure to asbestos-containing products manufactured and sold in the past. Management believes it has a strong defence related to certain products that may have contained an internal asbestos containing component. 1,190 claims were outstanding at the end of the reporting period (February 28, 2017 – 1,146). These claims were filed in the states of Arkansas, California, Connecticut, Delaware, Florida, Georgia, Hawaii, Illinois, Louisiana, Maine, Maryland, Massachusetts, Mississippi, Missouri, New Jersey, New York, North Carolina, Ohio, Oklahoma, Pennsylvania, Rhode Island, South Carolina, Texas, Virginia, Washington, West Virginia and Wisconsin. During the current fiscal year, the Company resolved 457 claims (February 28, 2017 – 376) and was the subject of 501 new claims (February 28, 2017 – 488). Because of the many uncertainties inherent in predicting the outcome of these proceedings, as well as the course of asbestos litigation in the United States, management believes that it is not possible to make an estimate of the Company’s asbestos liability. Accordingly, no provision has been set up in the accounts. Settlement costs and legal fees related to these asbestos claims amounted to $1,960 for the quarter (February 28, 2017 - $1,186) and $8,213 for the year (February 28, 2017 - $6,839). On December 3, 2014, San Diego Gas & Electric Company (“SDG”) filed a claim against Velan Valve Corp., a wholly- owned subsidiary of the Company, in the Superior Court of the State of California, concerning high pressure valves supplied to SDG and installed at its Palomar Energy Center (“Facility”). This lawsuit alleges damages to the Facility in excess of $9,000 related to allegedly defective valves supplied by Velan Valve Corp. The claim is for alleged strict product liability and alleged negligence. It is the Company’s position that this claim is without merit. The Company is vigorously defending its position and is undertaking all actions necessary to protect its reputation. While the Company cannot predict the final outcome of this claim, based on information currently available, the Company believes the resolution of this claim will not have a material adverse effect on its financial position, results of operations or liquidity. OFF-BALANCE SHEET ARRANGEMENTS The Company has entered into certain off-balance sheet arrangements. They are fully described in notes 10, 22 and 25 of the Company’s audited consolidated financial statements. The types of transactions entered into, all of which are in the normal course of business, are as follows:
• Performance bond guarantees related to product warranty and on-time delivery • Letters of credit issued to overseas suppliers • Operating leases
RELATED PARTY TRANSACTIONS (in thousands of U.S. dollars) The Company has entered into the following transactions with related parties, which are measured at their exchange value.
a) PDK Machine Shop Ltd. (“PDK”) is a company owned by certain relatives of the controlling shareholder. PDK is a supplier of machined material components for use in the Company’s plants.
Three months ended Twelve months ended Feb. 28,
2018 Feb. 28,
2017 Feb. 28,
2018 Feb. 28,
2017 Purchases of material components $900 $150 $1,230 $955 Sales of raw material $- $- $- $8
The Company entered into an agreement with PDK pursuant to which it has the right to purchase the shares of PDK for a consideration equal to the book value thereof in the event that they propose to sell their shares to a third party. In the event that PDK proposes to sell all or substantially all of its assets to a third party, the Company has the right to purchase inventory at cost and other assets at book value. In the event of a proposed liquidation or sale of sufficient assets such that PDK cannot fulfill its obligations to the Company under any outstanding purchase orders, the Company also has the right and the obligation to purchase PDK’s inventory at an amount equal to the cost thereof. The maximum obligation of the Company pursuant to such put right is $200.
25

Management’s discussion and analysis
b) One of the Company`s subsidiaries and certain of its executives lease, on a weekly basis, a property from Velan Holdings Co. Ltd., the controlling shareholder. Velan Holdings Co. Ltd. charges weekly rates based on usage. Note that this lease agreement was terminated over the course of the current fiscal year.
Three months ended Twelve months ended Feb. 28,
2018 Feb. 28,
2017 Feb. 28,
2018 Feb. 28,
2017 Rent $- $9 $12 $27
CONTROLS AND PROCEDURES
Disclosure controls and procedures Disclosure controls and procedures are designed to provide reasonable assurance that all relevant information is gathered and reported to senior management, including the Chief Executive Officer (“CEO”), and the Chief Financial Officer (“CFO”), in a timely manner so that appropriate decisions can be made regarding public disclosure.
The CEO and the CFO of the Company have evaluated, or caused the evaluation of, under their direct supervision, the effectiveness of the Company’s disclosure controls and procedures (as defined in National Instrument 52-109 – Certification of Disclosure in Issuer’s Annual and Interim Filings) as at February 28, 2018 and have concluded that such disclosure controls and procedures were designed and operating effectively.
Internal control over financial reporting Management is responsible for establishing and maintaining adequate internal control over financial reporting to provide reasonable assurance regarding the reliability of financial reporting and the preparation of financial statements for external purposes in accordance with IFRS.
Management has evaluated the design and effectiveness of its internal controls and procedures over financial reporting (as defined in National Instrument 52-109 – Certification of Disclosure in Issuer’s Annual and Interim Filings). The evaluation was based on the “Internal Control-Integrated Framework (2013)” issued by the Committee of Sponsoring Organizations of the Treadway Commission (“COSO”). This evaluation was performed by the CEO and the CFO of the Company with the assistance of other Company Management and staff to the extent deemed necessary. Based on this evaluation, the CEO and the CFO concluded that the internal controls and procedures over financial reporting were appropriately designed and operating effectively as at February 28, 2018.
In spite of its evaluation, Management does recognize that any controls and procedures no matter how well designed and operated, can only provide reasonable assurance and not absolute assurance of achieving the desired control objectives. In the unforeseen event that lapses in the disclosure of internal controls and procedures occur and/or mistakes happen of a material nature, the Company intends to take the steps necessary to minimize the consequences thereof.
Changes in internal control over financial reporting
The Company did not make any material changes to the design of internal control over financial reporting during the year and three-month period ended February 28, 2018 that have materially affected, or are reasonably likely to have materially affected, the Company’s internal control over financial reporting. CRITICAL ACCOUNTING ESTIMATES & ASSUMPTIONS The Company’s significant accounting policies as described above are essential to understanding the Company’s results of operations, financial positions and cash flows. Certain of these accounting policies require critical accounting estimates that involve complex and subjective judgments and the use of assumptions, some of which may be for matters that are inherently uncertain and susceptible to change. The assumptions and estimates used are based on parameters which are derived from the knowledge at the time of preparing the financial statements and believed to be reasonable under the circumstances. In particular, the circumstances prevailing at this time and assumptions as to the expected future development of the global and industry-specific environment were used to estimate the Company’s future business performance. Where these conditions develop differently than assumed and beyond the control of the Company, the actual results may differ from those anticipated. These estimates and underlying assumptions are reviewed on an
26

Management’s discussion and analysis
ongoing basis. Revisions to accounting estimates are recognized in the period in which the estimate is changed. There were no significant changes made to critical accounting estimates during the past two fiscal years. The estimates and assumptions that have a significant risk of causing a material adjustment to the carrying amounts of assets and liabilities within the next fiscal year are addressed below: Accounts receivable The Company must report its accounts receivable at their net realizable value. This involves management judgment and requires the Company to perform continuous evaluations of their collectability and to record an allowance for doubtful accounts when required. In performing its evaluation, the Company analyzes the ageing of accounts receivable, concentration of receivables by customer, customer creditworthiness and current economic trends. Any change in the assumptions used could impact the carrying value of the accounts receivable on the consolidated statement of financial position with a corresponding impact made to administration costs on the consolidated statement of income. Inventories Inventories must be valued at the lower of cost and net realizable value. A writedown of inventory will occur when its estimated market value less applicable variable selling expenses is below its carrying amount. This involves significant management judgment and is based on the Company’s assessment of market conditions for its products determined by historical usage, estimated future demand and, in some cases, the specific risk of loss on specifically identified inventory. Any change in the assumptions used in assessing this valuation or selling costs could impact the carrying amount of the inventory on the consolidated statement of financial position with a corresponding impact made to cost of sales on the consolidated statement of income. Provisions Provisions must be established for possible product warranty expenses. The Company estimates its warranty exposure by taking into account past experience as well as any known technical problems and estimates of costs to resolve these issues. The Company estimates its exposure under these obligations based on an analysis of all identified or expected claims. Any change in the assumptions used could impact the value of the provision on the consolidated statement of financial position with a corresponding impact made to cost of sales on the consolidated statement of income. Impairment of non-financial assets Assets that have an indefinite life, such as goodwill, are tested annually by the Company for impairment, or more frequently if events or circumstances indicate there may be impairment. All other assets must be reviewed by the Company at the end of each reporting period in order to determine whether there is an indication of possible impairment. Any change in the assumptions used could impact the carrying amount first of any goodwill allocated to the CGU and then to the other assets of the CGU on a pro rata basis of the carrying amount of each asset in the CGU on the consolidated statement of financial position with a corresponding impact made to the consolidated statement of income. Income taxes The Company must estimate its income taxes in each jurisdiction in which it operates. This involves assessing the probability of using net operating losses against future taxable income as well as evaluating positions taken in tax returns with respect to situations in which applicable tax regulation is subject to interpretation. In the event these assessments are changed, there would be an adjustment to income tax expense with a corresponding adjustment to income tax balances on the consolidated statement of financial position. CRITICAL JUDGEMENTS IN APPLYING THE COMPANY’S ACCOUNTING POLICIES Consolidation The Company consolidates the accounts of Juwon Special Steel Co. Ltd. in these financial statements. It was determined that the Company has substantive rights over this structured entity that are currently exercisable and for which there is no barrier, despite the fact that its percentage ownership in this entity is only 50%. These substantive rights are obtained through the shareholders’ agreement signed between the Company and the non-controlling interest which gives the Company the ultimate decision right on any decision taken for which both parties in the joint arrangement are not in agreement. As per the shareholders’ agreement, the Board of Directors, representing the interests of shareholders, has responsibility to establish operating decisions (including budgets), approve capital transactions and determine key management personnel remuneration. Consequently, the Company, through its rights set out in the shareholders’ agreement, has substantive rights that give it the ability to direct the relevant activities of Juwon Special Steel Co. Ltd. while being exposed to variable returns. As such, it was determined that this entity should be consolidated.
27

Management’s discussion and analysis
ACCOUNTING STANDARDS AND AMENDMENTS ADOPTED IN THE YEAR The Company has applied the following standards and amendments for the first time in the fiscal year, starting on March 1st, 2017.
(i) Recognition of Deferred Tax Assets for Unrealised Losses – Amendments to IAS 12; and
(ii) Disclosure initiative – amendments to IAS 7. The adoption of these amendments did not have a significant impact on the amounts recognized in prior periods. The amendments also do not affect the current or future periods significantly. The amendments to IAS 7 require disclosure of changes in liabilities arising from financing activities, which is presented in note 29. ACCOUNTING STANDARDS AND AMENDMENTS ISSUED BUT NOT YET ADOPTED
(i) In July 2014, the IASB issued IFRS 9, Financial Instruments. The IASB has previously published versions of IFRS 9 that introduced new classification and measurement requirements (in 2009 and 2010) and a new hedge accounting model (in 2013). The July 2014 publication represents the final version of the Standard, replaces earlier versions of IFRS 9 and substantially completes the IASB’s project to replace IAS 39, Financial Instruments: Recognition and Measurement.
This standard replaces the current multiple classification and measurement models for financial assets and liabilities with a single model that has only three classification categories: amortized cost and fair value through other comprehensive income and fair value through profit or loss. The basis of classification depends on the entity’s business model and the contractual cash flow characteristics of the financial asset or liability. The standard introduces a new, expected loss impairment model that will require more timely recognition of expected credit losses. Specifically, the new Standard requires entities to account for expected credit losses from when financial instruments are first recognised and it lowers the threshold for recognition of full lifetime expected losses. The new standard also introduces a substantially-reformed model for hedge accounting with enhanced disclosures about risk management activity and aligns hedge accounting more closely with risk management. The new standard is effective for annual periods beginning on or after January 1, 2018 with earlier adoption permitted. The Company is in the final stages of analyzing the impact of the adoption of this new standard. The impact is not expected to be material.
(ii) IFRS 15, Revenue from Contracts with Customers, was issued in May 2014 and specifies how and when revenue will be recognized as well as requiring the provision of more informative and relevant disclosures. Its core principle is that an entity will recognize revenue to depict the transfer of promised goods or services to customers in an amount that reflects the consideration to which the entity expects to be entitled in exchange for those goods or services. This core principle is delivered in a five-step model framework: (i) identify the contract(s) with a customer; (ii) identify the performance obligations in the contract; (iii) determine the transaction price; (iv) allocate the transaction price to the performance obligations in the contract; and (v) recognize revenue when (or as) the entity satisfies a performance obligation. IFRS 15 replaces IAS 11, Construction contracts, IAS 18, Revenue, IFRIC 13, Customer Loyalty Programmes, IFRIC 15, Agreements for the Construction of Real Estate, IFRIC 18, Transfers of Assets from Customers, and SIC-31, Revenue - Barter Transactions Involving Advertising Services. The new standard is effective for annual periods beginning on or after January 1, 2018 with earlier adoption permitted. For the Company, the standard comes into effect on March 1, 2018. As a result, IFRS 15 will be adopted in the first quarter of the fiscal year ending February 28, 2019. At that time, the Company plans to use the retrospective transition alternative whereby it will restate its comparative results for the current year, with an opening adjustment to retained earnings as at March 1, 2017, if applicable. The Company has determined that late delivery penalties, which are currently recorded as an expense in cost of sales, will be recorded as a reduction of sales when this standard comes into effect. The preliminary assessment of the effect of this change on the current year’s results is a $1,452 decrease in consolidated sales and a corresponding decrease in consolidated cost of sales. The new standard will not have a significant impact on the timing of the Company’s revenues from the sale of goods as most of such revenues will continue to be recognized upon the delivery of the said goods as per the agreed-upon shipping terms. However, if certain criteria are met, the Company has determined that separate elements in a sale of goods contract
28

Management’s discussion and analysis
may be classified as separate performance obligations. These could include, but are not limited to the delivery of drawings and documentation, the provision of services (commissioning, inspection, shipping and testing), and warranties. The preferred method of allocating revenue to multiple elements in a sale of goods contract where separate performance obligations have been identified will be the adjusted market assessment approach. While the above changes may have an impact on revenues in future fiscal years, the Company has determined that they will not have a material impact on the current and prior years’ consolidated revenues.
(iii) In January 2016, the IASB issued IFRS 16, Leases, which sets out the principles for the recognition, measurement,
presentation and disclosure of leases for both parties to a contract. It eliminates the classification of leases as either operating leases or finance leases and introduces a single lessee accounting model. It also substantially carries forward the lessor accounting requirements. Accordingly, a lessor continues to classify its leases as operating leases or finance leases, and to account for those two types of leases differently. IFRS 16 replaces IAS 17, Leases, IFRIC 4, Determining whether an Arrangement contains a Lease, SIC-15, Operating Leases – Incentives, and SIC-27, Evaluating the Substance of Transactions Involving the Legal Form of a Lease. The new standard is effective for annual periods beginning on or after January 1, 2019 with earlier adoption permitted only if IFRS 15 has been adopted. While the Company is currently assessing the impact of this new standard, it has determined that it will not early adopt it. The operating leases, as disclosed in the commitment note of the Company’s annual financial statements (note 22 (c)) are within the scope of IFRS 16.
(iv) In November 2016, the IFRS Interpretations Committee (“IFRIC”) issued IFRIC 22, Foreign Currency Transactions and
Advance Consideration. This interpretation addresses the exchange rate to use when reporting transactions that are denominated in a foreign currency in accordance with IAS 21, The Effects of Changes in Foreign Exchange Rates, in the circumstance in which a customer paid for goods or services in advance. The interpretation is effective for annual periods beginning on or after January 1, 2018 with earlier adoption permitted. For the Company, the interpretation comes into effect on March 1, 2018. As a result, IFRIC 22 will be adopted in the first quarter of the fiscal year ending February 28, 2019.
(v) In June 2017, IFRIC issued IFRIC 23, Uncertainty over Income Tax Treatments. This interpretation clarifies how the
recognition and measurement requirements of IAS 12, Income Taxes, are applied where there is uncertainty over income tax treatments that have yet to be accepted by tax authorities. The interpretation is effective for annual periods beginning on or after January 1, 2019 with earlier adoption permitted. While the Company is currently assessing the impact of this new standard, it has determined that it will not early adopt it.
CERTAIN RISKS THAT COULD AFFECT OUR BUSINESS
Cyclical nature of end user markets The demand for the Company’s products in any particular industry or market can vary significantly according to the level of economic activity in that industry or market. These potential variations may be mitigated by the fact that the Company’s sales are diversified geographically as well as by end user market. There can be no assurance that an economic recession or downturns in certain industries or geographic locations, such as the current downturn in the oil and gas industry, will not have a significant adverse effect on the Company’s sales. Competition Competitive pressures in the Company’s markets could lead to a loss of market share, which could negatively impact revenues, margins and net income. The Company also competes with manufacturers based in low wage countries that offer valves at substantially lower prices. There can be no assurance that the Company will be able to compete successfully against its current or future competitors or that competition will not have a material adverse effect on the Company's results of operations and financial condition. Backlog The Company’s order backlog consists of sales orders that are considered firm. It is also an indication of future sales revenues. However, there can be no assurance that subsequent cancellations or scope adjustments will not occur, that the order backlog will ultimately result in earnings, or when the related revenues and earnings from such order backlog will be recognized. Dependence upon key personnel The Company is dependent upon the abilities and experience of its executive officers and other key employees. There can be no assurance that the Company can retain the services of such executive officers and key employees. If several executive officers or other key employees were to leave the employ of the Company, its operations could be adversely affected.
29

Management’s discussion and analysis
Foreign currency exchange risks Due to the geographic mix of the Company’s customers and its operations, the Company is exposed to foreign currency exchange risk. The Company enters into foreign currency forward contracts in order to manage a portion of its net exposure to foreign currencies. Such forward contracts contain an inherent credit risk related to default on obligations by the counterparty, which the company mitigates by entering into contracts with sound financial institutions that it anticipates will satisfy their obligations. Risk related to currency fluctuations could have a material adverse effect on the Company's results of operations and its financial position. Interest rate risk A portion of the Company’s liabilities consist of debt instruments that bear interest at variable rates. As such, the Company is exposed to the risk of interest rate fluctuations. This risk could have an adverse effect on the Company’s results of operations. Availability and prices of raw materials The price of raw materials, principally steel, represents a substantial portion of the cost of manufacturing the Company’s products. Historically, there have been fluctuations in these raw material prices and, in some instances, price movements have been volatile. There can be no certainty that the Company will be able to pass on increases resulting from higher costs of raw materials to its customers through increases in selling prices, or otherwise absorb such cost increases without significantly affecting its margins. In addition, certain raw materials become, from time to time, in short supply for periods of time. Typically, these shortages do not last long and the Company is usually able to ensure that its needs are met. However, there can be no assurances that its sources of supply will be adequate to supply all of its needs on a timely basis. Labour relations A substantial portion of the Company’s workforce is covered by union agreements. Although the Company has been successful in the past in negotiating renewals, there can be no assurance that this will continue. Failure to renegotiate these agreements could lead to work disruptions or higher labour costs, which could negatively impact results. Reliance on key suppliers The Company has several key suppliers with whom it has invested in forging dies and casting patterns. While the Company has alternate sources for most material purchases, the loss of a key supplier could impact negatively on the Company. Reliance on distributors and sales agents The Company is directly affected by the ability of independent third party distributors and sales agents retained by the Company to sell its products in their respective markets. The Company’s continued success is thus dependent on its ability to attract and retain the distributors and sales agents it requires to support its existing business and to continue to grow. Project undertakings In competing for the sales of valves, the Company may enter into contracts that provide for the production of valves at specified prices and in accordance with time schedules. These contracts may involve greater risks as a result of unforeseen increases in the prices of raw materials and other costs due to more stringent terms and conditions. Although contract terms may vary from customer to customer, production delays and other performance issues may call for liquidated damages or other penalties in case of non-performance or warranty issues due to the more stringent terms and conditions of such contracts. Political and economic risks associated with international sales and operations Since the Company sells and manufactures its products worldwide, the business is subject to risks associated with doing business internationally. There are uncertainties with regards to the outcome of trilateral negotiations regarding the North American Free Trade Agreement (“NAFTA”) as well as of Brexit negotiations, and such processes could derail at any time. The Company’s business and operating results could be adversely impacted by trade protection measures resulting from breakdowns in NAFTA and Brexit negotiations, as well as from changes in tax laws, possibility of expropriation and embargo, foreign exchange restrictions and political, military and/or terrorist disruptions or changes in regulatory environments. NAFTA negotiations may potentially impact the price and demand of steel as well as the potential for the imposition of quotas or of a tax on the importation of goods into the United States. Canada and ten other countries recently concluded discussions and agreed on the draft text of the Comprehensive and Progressive Agreement for Trans-Pacific Partnership (“CPTPP”), which is intended to allow for preferential market access among the countries that are parties to the CPTPP. The text of CPTPP has not been finalized or published and the agreement remains subject to ratification by the governments of the countries that are parties to the CPTPP. It is uncertain what effect CPTPP will have on the Company, its customers, its suppliers and the industrial products industry.
30

Management’s discussion and analysis
Force majeure events Force majeure events are unforeseeable events or circumstances that occur beyond the control of the Company. Such events include but are not limited to political unrest, war, terrorism, strikes, riots, and crime, as well as seismic or severe weather related events such as earthquakes, hurricanes, tsunamis, tornadoes, ice storms, flooding and volcanic eruptions. The risk of occurrence of a force majeure event is unpredictable and may result in delays or cancellations of orders and deliveries to customers, delays in the receipt of materials from suppliers, damage to facilities or equipment, personal injury or fatality, and possible legal liability. Asbestos litigation Two of the Company’s U.S. subsidiaries have been named as defendants in a number of pending lawsuits that seek to recover damages for personal injury allegedly caused by exposure to asbestos-containing products manufactured and sold in the past. Management believes it has a strong defense related to certain products that may have contained an internal component containing asbestos. Although it is defending these allegations vigorously, there can be no assurance that the Company will prevail. Unfavorable rulings, judgments or settlement terms could have a material adverse impact on the Company’s business, financial condition, results of operations and cash flows. Product liability and other lawsuits The Company, like other worldwide manufacturing companies, has been, and will continue to be, subject to a variety of potential liability claims or other lawsuits connected with its business operations, including potential liabilities and expenses associated with possible product defects or failures. While the Company maintains comprehensive general liability insurance coverage which it considers to generally be in accordance with industry practice, such insurance does not cover certain categories of claims (such as ongoing asbestos claims) to which the Company is subject. Comprehensive general liability premiums have also increased significantly during the last several years. Accordingly, the Company cannot be certain that comprehensive general liability insurance coverage will continue to be available to it at a reasonable cost, or, if available, would be adequate to cover its liabilities. Health and safety risk The Company is committed to providing all employees, contractors, and visitors to its premises with a healthy and safe work environment. The Company has implemented a program throughout its operations with policies and procedures that must be followed to ensure that it meets all applicable health and safety laws, regulations, and standards. The Company recognizes that a lack of a strong health and safety program may expose it to lost production time, penalties and lawsuits, and may impact future orders as customers may take into account the Company’s health and safety record when awarding sales contracts. Environmental compliance matters The Company’s operations and properties are subject to increasingly stringent laws and regulations relating to environmental protection, including air and water discharges, waste management and disposal and employee safety. Such laws and regulations both impose substantial fines for violations and mandate cessation of operations in certain circumstances, the installation of costly pollution control equipment, or the undertaking of costly site remediation activities. Furthermore, new laws and regulations, or stricter enforcement of existing laws and regulations, the discovery of previously unknown contamination or the imposition of new clean up requirements could require the Company to incur additional costs which could be significant. Controls over disclosures and financial reporting In accordance with National Instrument 52-109, the CEO and the CFO of the Company are responsible for designing, maintaining, and evaluating the effectiveness of disclosure controls and procedures. The CEO and the CFO are also responsible for the effective design of internal controls over financial reporting to provide reasonable assurance regarding the reliability of financial reporting and the preparation of financial statements in accordance with IFRS. A system of controls is subject to certain inherent limitations and is partially based on the possibility or probability of future events. Accordingly, a system of internal controls can provide only reasonable, and not absolute, assurance of reaching the desired objectives. Control of the Company Velan Holding Co. Ltd. (the “Controlling Shareholder”) owns 15,566,567 Multiple Voting Shares representing, in the aggregate, approximately 92.8% of the voting interests in the Company. Voting control enables the Controlling Shareholder to determine all matters requiring shareholder approval. The Controlling Shareholder has advised the Company that the disposition of the shares requires the consent of certain Velan family members and controlled entities.
The Controlling Shareholder effectively has sufficient voting power to prevent a change in control of the Company, which may negatively affect the price and liquidity of the Subordinated Voting Shares. The sale of a significant number of Subordinate Voting Shares by the Controlling Shareholder pursuant to the exercise of the conversion right attached to the Multiple Voting Shares may negatively impact upon the market price and liquidity of the Subordinate Voting Shares.
31

Management’s discussion and analysis
Income and other tax risks The Company operates in a number of different tax jurisdictions and has a significant amount of cross-border purchase and sale transactions. The tax rules and regulations in various countries are becoming more complex. There is a risk that one or more tax authorities could disagree with the tax treatment adopted by the Company, resulting in defense costs and possible tax assessments. Compliance with international laws Due to the international nature of its operations, the Company is subject to differing systems of laws and regulations which are often complex and differ from one country to the next. Such laws and regulations include but are not limited to anti-bribery legislation, export and customs controls, foreign currency exchange controls, transfer pricing regulations and economic sanctions imposed by governmental authorities. Failure to comply with such laws could negatively impact earnings and may result in criminal, civil and administrative legal sanctions. The Company has implemented policies and procedures to effect compliance with these laws by its employees and representatives. Non-controlling interest The Company’s operations in China and Taiwan, and certain of its operations in France and Korea are undertaken with partners that are classified as non-controlling interest. The success of these operations depends on the satisfactory performance of such partners in their obligations. The failure of such partners to perform their obligations could impose additional financial and performance obligations on the Company that could negatively impact its earnings and financial condition. Business acquisitions The success of a business acquisition depends in part upon the integration of the acquired business through such tasks as the realization of synergies, elimination of cost duplication, information systems integration, and establishment of controls and procedures. The inability to adequately integrate an acquired business in a timely manner might result in lost business opportunities, higher than expected integration costs and departures of key personnel, all of which could have a negative impact on earnings. Cybersecurity The Company’s information technology networks are critical to the day-to-day operation of its business, and include information about its finances, employees, products, customers and suppliers. Cybersecurity risks are becoming increasingly sophisticated, varied and numerous. The potential consequences of a material cybersecurity breach could include loss of key information, reputational damage and disruption of operations, with consequential material negative financial consequences. While the Company devotes substantial resources to maintaining and securing its information technology networks, there can be no assurance that it will be able to prevent, detect or respond to a potential breach of its information technology networks because of, among other things, the evolving nature of cybersecurity threats, the difficulty in anticipating such threats and the difficulty in immediately detecting all such threats.
32

Management’s discussion and analysis
RECONCILIATIONS OF NON-IFRS MEASURES In this MD&A and other sections of the 2018 Annual Report, the Company presented measures of performance or financial condition which are not defined under IFRS (“non-IFRS measures”) and are, therefore, unlikely to be comparable to similar measures presented by other companies. These measures are used by management in assessing the operating results and financial condition of the Company and are reconciled with the performance measures defined under IFRS. Reconciliations of these amounts can be found below.
Net cashAs at As at As at As at As at As at As at
(in thousands) Feb. 28, Nov. 30, Feb. 28, Nov. 30, Feb. 29, Feb. 28, Feb. 28,2018 2017 2017 2016 2016 2015 2014
Cash and cash equivalents 85,391 88,241 84,019 81,303 89,368 99,578 106,716 Short-term investments 647 1,461 974 149 3,225 847 239 Bank indebtedness (20,848) (12,220) (7,792) (4,960) (5,028) (15,616) (31,876) Short-term bank loans (1,074) (1,086) (1,650) (1,313) (1,319) (2,134) (916) Current portion of long-term bank borrowings (3,068) (3,148) (3,070) (2,558) (4,197) (7,063) (6,402)
61,048 73,248 72,481 72,621 82,049 75,612 67,761
Net earnings (loss) before interest, taxes, depreciation and amortization ("EBITDA")
(in thousands)
For the fiscal year ended: Feb. 28, Feb. 28, Feb. 29, Feb. 28, Feb. 28,2018 2017 2016 2015 2014
Net income (loss) attributable to Subordinate Voting Shares and Multiple Voting Shares (17,811) 7,737 3,641 18,580 29,400
Adjustments for:Goodwill impairment loss - - 11,510 - - Depreciation of property, plant and equipment 11,035 11,943 13,301 13,749 12,241 Amortization of intangible assets 1,842 1,767 2,008 2,374 2,525 Finance costs (income) - net 197 74 (199) 590 1,510 Income taxes 361 4,680 8,302 9,773 11,759
(4,376) 26,201 38,563 45,066 57,435
For the quarter ended: Feb. 28, Feb. 28,2018 2017
Net income (loss) attributable to Subordinate Voting Shares and Multiple Voting Shares (8,221) 3,707
Adjustments for:Depreciation of property, plant and equipment 2,792 3,156 Amortization of intangible assets 545 467 Finance costs (income) - net 64 295 Income taxes 3,685 4,981
(1,135) 12,606
33

34

Velan Inc.
Consolidated Financial Statements For the years ended February 28, 2018 and 2017
35

36

PricewaterhouseCoopers LLP/s.r.l./s.e.n.c.r.l. 1250 René-Lévesque Boulevard West, Suite 2500, Montréal, Quebec, Canada H3B 4Y1 T: +1 514 205 5000, F: +1 514 875 1502
“PwC” refers to PricewaterhouseCoopers LLP, an Ontario limited liability partnership.
May 24, 2018
Independent Auditor’s Report
To the Shareholders of Velan Inc.
We have audited the accompanying consolidated financial statements of Velan Inc., which comprise the consolidated statements of financial position as at February 28, 2018 and 2017 and the consolidated statements of income (loss), comprehensive income (loss), changes in equity and cash flows for the years then ended, and the related notes, which comprise a summary of significant accounting policies and other explanatory information.
Management’s responsibility for the consolidated financial statements Management is responsible for the preparation and fair presentation of these consolidated financial statements in accordance with International Financial Reporting Standards, and for such internal control as management determines is necessary to enable the preparation of consolidated financial statements that are free from material misstatement, whether due to fraud or error.
Auditor’s responsibility Our responsibility is to express an opinion on these consolidated financial statements based on our audits. We conducted our audits in accordance with Canadian generally accepted auditing standards. Those standards require that we comply with ethical requirements and plan and perform the audit to obtain reasonable assurance about whether the consolidated financial statements are free from material misstatement.
An audit involves performing procedures to obtain audit evidence about the amounts and disclosures in the consolidated financial statements. The procedures selected depend on the auditor’s judgment, including the assessment of the risks of material misstatement of the consolidated financial statements, whether due to fraud or error. In making those risk assessments, the auditor considers internal control relevant to the entity’s preparation and fair presentation of the consolidated financial statements in order to design audit procedures that are appropriate in the circumstances, but not for the purpose of expressing an opinion on the effectiveness of the entity’s internal control. An audit also includes evaluating the appropriateness of accounting policies used and the reasonableness of accounting estimates made by management, as well as evaluating the overall presentation of the consolidated financial statements.
37

We believe that the audit evidence we have obtained in our audits is sufficient and appropriate to provide a basis for our audit opinion.
Opinion In our opinion, the consolidated financial statements present fairly, in all material respects, the financial position of Velan Inc. as at February 28, 2018 and 2017 and its financial performance and its cash flows for the years then ended in accordance with International Financial Reporting Standards.1
1 CPA auditor, CA, public accountancy permit No. A123642
38

Velan Inc. Consolidated Statements of Financial Position As at February 28, 2018 and 2017 (in thousands of U.S. dollars)
February 28,2018
$
February 28,2017
$
85,391 84,019647 974
137,382 125,5128,012 7,145
170,790 173,0894,222 3,391
604 1,202407,048 395,332
89,864 91,53520,210 19,02322,034 12,951
1,037 456
133,145 123,965
540,193 519,297
20,848 7,7921,074 1,650
63,441 60,6412,186 9461,678 1,631
48,963 43,95310,798 10,60032,655 26,943
1,615 7998,151 7,115
191,409 162,070
13,978 15,3182,078 -2,889 2,7848,222 7,214
27,167 25,316
218,576 187,386
73,090 73,5846,057 6,017
256,668 281,343(19,790) (35,550)316,025 325,394
5,592 6,517
321,617 331,911
540,193 519,297
Assets
Current assets Cash and cash equivalents Short-term investments Accounts receivable Income taxes recoverable Inventories (not e 5) Deposits and prepaid expenses Derivative assets
Non-current assets Property, plant and equipment (notes 7 and 12) Intangible assets and goodwill (notes 4 and 8) Deferred income taxes (note 20) Other assets
Total assets
Liabilities
Current liabilities Bank indebtedness (note 10) Short-term bank loans Accounts payable and accrued liabilities (note 9) Income taxes payable Dividend payable Customer deposits Provisions (note 11) Accrual for performance guarantees Derivative liabilities Current portion of long-term debt (note 12)
Non-current liabilities Long-term debt (note 12) Income taxes payable Deferred income taxes (note 20) Other liabilities
Total liabilities
Equity
Equity attributable to Subordinate and Multiple Voting shareholdersShare capital (note 13) Contributed surplus Retained earnings Accumulated other comprehensive loss
Non-controlling interests (note 6)
Total equity
Total liabilities and equity
Commitments and contingencies (note 22)
The accompanying notes are an integral part of these consolidated financial statements.
Approved by the Board of Directors
T.C. Velan, Director Yves Leduc, Director
39

Velan Inc. Consolidated Statements of Income (Loss) For the years ended February 28, 2018 and 2017 (in thousands of U.S. dollars, excluding per share amounts)
2018 $
2017 $
Sales (notes 14 and 24) 337,963 331,777 Cost of sales (notes 5, 14, 15 and 19) 269,378 243,249 Gross profit 68,585 88,528 Administration costs (notes 16 and 19) 85,437 75,868 Other expense (income) 1,463 (408) Operating profit (loss) (18,315) 13,068 Finance income 1,102 992 Finance costs (1,299) (1,066) Finance costs – net (197) (74) Income (loss) before income taxes (18,512) 12,994 Income taxes (note 20) 361 4,680 Net income (loss) for the year (18,873) 8,314 Net income (loss) attributable to: Subordinate Voting Shares and Multiple Voting Shares (17,811) 7,737 Non-controlling interests (1,062) 577 (18,873) 8,314 Earnings (loss) per share (note 21) Basic (0.82) 0.36 Diluted (0.82) 0.36 Dividends declared per Subordinate and Multiple Voting Share 0.31 (CA$0.40) 0.31 (CA$0.40) The accompanying notes are an integral part of these consolidated financial statements.
40

Velan Inc. Consolidated Statements of Comprehensive Income (Loss) For the years ended February 28, 2018 and 2017 (in thousands of U.S. dollars)
2018 $
2017 $
Comprehensive income (loss) Net income (loss) for the year (18,873) 8,314 Other comprehensive income (loss) Foreign currency translation adjustment on foreign operations whose functional currency is other
than the reporting currency (U.S. dollar) 15,938 (2,014) Comprehensive income (loss) (2,935) 6,300 Comprehensive income (loss) attributable to: Subordinate Voting Shares and Multiple Voting Shares (2,051) 5,276 Non-controlling interests (884) 1,024 (2,935) 6,300
Other comprehensive income (loss) is composed solely of items that may be reclassified subsequently to the consolidated statement of income.
The accompanying notes are an integral part of these consolidated financial statements.
41

Velan Inc. Consolidated Statements of Changes in Equity For the years ended February 28, 2018 and 2017 (in thousands of U.S. dollars)
The accompanying notes are an integral part of these consolidated financial statements.
Equity attributable to Subordinate and Multiple Voting shareholders
Share capitalContributed
surplus
Accumulated other
comprehensive income (loss)
Retained earnings Total
Non-controlling interests Total equity
Balance - February 29, 2016 74,345 5,941 (33,089) 280,380 327,577 5,542 333,119
Net income for the year - - - 7,737 7,737 577 8,314 Other comprehensive income (loss) - - (2,461) - (2,461) 447 (2,014)
74,345 5,941 (35,550) 288,117 332,853 6,566 339,419
Effect of share-based compensation (note 13(d)) - 76 - - 76 - 76 Dividends Multiple Voting Shares - - - (4,745) (4,745) - (4,745) Subordinate Voting Shares - - - (1,864) (1,864) - (1,864) Non-controlling interests - - - - - (49) (49) Share repurchase (note 13(c)) (761) - - (165) (926) - (926)
Balance - February 28, 2017 73,584 6,017 (35,550) 281,343 325,394 6,517 331,911
Net loss for the year - - - (17,811) (17,811) (1,062) (18,873) Other comprehensive income - - 15,760 - 15,760 178 15,938
73,584 6,017 (19,790) 263,532 323,343 5,633 328,976
Effect of share-based compensation (note 13(d)) - 40 - - 40 - 40 Dividends Multiple Voting Shares - - - (4,824) (4,824) - (4,824) Subordinate Voting Shares - - - (1,904) (1,904) - (1,904) Non-controlling interests - - - - - (41) (41) Share repurchase (note 13(c)) (494) - - (136) (630) - (630)
Balance - February 28, 2018 73,090 6,057 (19,790) 256,668 316,025 5,592 321,617
42

Velan Inc. Consolidated Statements of Cash Flows For the years ended February 28, 2018 and 2017 (in thousands of U.S. dollars)
The accompanying notes are an integral part of these consolidated financial statements.
2018 2017Cash flows from $ $
Operating activitiesNet income (loss) for the year (18,873) 8,314 Adjustments to reconcile net income (loss) to cash provided by (used in) operating activities (note 27) 6,994 10,267 Changes in non-cash working capital items (note 28) 9,986 (11,434)Cash provided by (used in) operating activities (1,893) 7,147
Investing activitiesShort-term investments 327 2,251 Additions to property, plant and equipment (6,202) (7,721)Additions to intangible assets (437) (910)Proceeds on disposal of property, plant and equipment, and intangible assets 141 399 Net change in other assets (507) 482 Cash used in investing activities (6,678) (5,499)
Financing activitiesDividends paid to Subordinate and Multiple Voting shareholders (6,681) (6,584)Dividends paid to non-controlling interests (41) (49)Repurchase of shares (note 13(c)) (630) (926)Short-term bank loans (note 29) (576) 331 Increase in long-term debt (note 29) - 5,079 Repayment of long-term debt (note 29) (3,206) (5,904)Cash used in financing activities (11,134) (8,053)
Effect of exchange rate differences on cash 8,021 (1,708)
Net change in cash during the year (11,684) (8,113)Net cash – Beginning of the year 76,227 84,340
Net cash – End of the year 64,543 76,227
Net cash is composed of:Cash and cash equivalents 85,391 84,019 Bank indebtedness (20,848) (7,792)
64,543 76,227
Supplementary informationInterest received 532 641 Income taxes paid (3,752) (7,722)
43

Velan Inc. Notes to the Consolidated Financial Statements For the years ended February 28, 2018 and 2017 (in thousands of U.S. dollars, excluding number of shares and per share amounts)
1 General information and basis of preparation
These consolidated financial statements represent the consolidation of the accounts of Velan Inc. (the “Company”) and its subsidiaries. The Company is an international manufacturer of industrial valves. The Company is a public company listed on the Toronto Stock Exchange under the symbol “VLN”. It was incorporated under the name Velan Engineering Ltd. on December 12, 1952 and continued under the Canada Business Corporations Act on February 11, 1977. It changed its name to Velan Inc. on February 20, 1981. Velan Inc. maintains its registered head office at 7007 Côte de Liesse, Montreal, Quebec, Canada, H4T 1G2. The Company’s ultimate parent company is Velan Holdings Co. Ltd. The Company’s consolidated financial statements have been prepared in accordance with International Financial Reporting Standards (“IFRS”) as issued by the International Accounting Standards Board (“IASB”). These consolidated financial statements were approved by the Company’s Board of Directors on May 24, 2018.
2 Summary of significant accounting policies
Functional and presentation currency Functional currency is defined as the currency of the primary economic environment in which an entity operates. Indicators for determining an entity’s functional currency are broken down into primary and secondary indicators. Primary indicators include:
• the currency of sales and cash inflows; • the currency of the country having primary influence over sales prices; and • the currency of expenses and cash outflows.
Primary indicators receive more weight than secondary indicators. If a functional currency can be determined based on the primary indicators, the secondary indicators are not considered. The functional and presentation currency of the Company is the U.S. dollar (note 6). Consolidation These financial statements represent the consolidation of the accounts of the Company and its subsidiaries. Control exists when the Company is exposed to, or has rights to, variable returns from its involvement with an investee, including a structured entity, and has the ability to affect those returns through its power to direct the activities of an investee. Subsidiaries are fully consolidated from the date control has been transferred to the Company and deconsolidated from the date control ceases. All subsidiaries prepare their financial statements at the same reporting date as the Company except for Velan Valvac Manufacturing Co. Ltd., which has a December 31 fiscal year-end. Consolidated earnings include the Company’s share of the results of its operations to that date. Intercompany transactions, balances and unrealized gains or losses on transactions between companies are eliminated.
44

Velan Inc. Notes to the Consolidated Financial Statements For the years ended February 28, 2018 and 2017 (in thousands of U.S. dollars, excluding number of shares and per share amounts)
Foreign currency transactions and balances The Company and its subsidiaries translate foreign currency transactions and balances into their functional currencies. Foreign currency is defined as any currency that is different from an individual entity’s functional currency. Monetary assets and liabilities in foreign currencies are translated at year-end exchange rates. Non-monetary assets are translated at rates prevailing at the transaction dates. Revenue and expenses in foreign currencies are translated at weekly average rates throughout the year. Gains and losses arising on translation are included in the consolidated statement of income (loss) for the year. Translation of accounts of foreign subsidiaries The financial statements of the Company’s foreign subsidiaries whose functional currency is not the U.S. dollar are translated into U.S. dollars for reporting purposes. All assets and liabilities are translated at year-end rates, and revenue and expenses at the average rate for the period. Resulting gains and losses are included in other comprehensive income (loss) for the period. Financial instruments A financial instrument is any contract that gives rise to a financial asset of one entity and a financial liability or equity instrument of another entity. The Company’s financial assets comprise mainly cash and cash equivalents, short-term investments, accounts receivable and derivative assets. The Company’s financial liabilities comprise mainly bank indebtedness, short-term bank loans, accounts payable and accrued liabilities, customer deposits, dividend payable, accrual for performance guarantees, long-term debt and derivative liabilities. The Company recognizes a financial instrument on its consolidated statement of financial position when the Company becomes party to the contractual provisions of the financial instrument or non-financial derivative contract (see Embedded derivatives). Financial assets are derecognized when the rights to receive cash flows from the assets have expired or been transferred and the Company has transferred substantially all risks and rewards of ownership. All financial instruments are initially recognized at fair value and are classified into one of these five categories: held for trading, available-for-sale assets, held-to-maturity investments, loans and receivables and other financial liabilities. The classification depends on the purpose for which the financial instruments were acquired and their characteristics. Except in very limited circumstances, the classification is not changed subsequent to initial recognition. Held for trading Financial instruments classified as held for trading are carried at fair value at each statement of financial position date with the changes in fair value recorded in the consolidated statement of income (loss) in the period in which these changes arise. The Company has classified its derivative financial instruments as held for trading. Loans and receivables, held-to-maturity investments and other financial liabilities Financial instruments classified as loans and receivables, held-to-maturity investments and other financial liabilities are carried at amortized cost using the effective interest rate method. The interest income or expense is included in the consolidated statement of income (loss) over the expected life of the instrument. Cash and cash equivalents, short-term investments and accounts receivable are classified as loans and receivables. Bank indebtedness, short-term bank loans, accounts payable and accrued liabilities, customer deposits, dividend payable, accrual for performance
45
Velan Inc. Notes to the Consolidated Financial Statements For the years ended February 28, 2018 and 2017 (in thousands of U.S. dollars, excluding number of shares and per share amounts)
guarantees and long-term debt, including interest payable, are classified as other financial liabilities, all of which are measured at amortized cost. Embedded derivatives Derivatives may be embedded in other financial instruments (the “host instrument”). Embedded derivatives are treated as separate derivatives if their economic characteristics and risks are not closely related to those of the host instrument, the terms of the embedded derivative are the same as those of a stand-alone derivative, and the combined contract is not held for trading or designated at fair value through profit or loss. These embedded derivatives are classified as held for trading. The Company and its subsidiaries enter into certain contracts for the purchase and sale of non-financial items that are denominated in currencies other than their respective functional currencies. In cases where the foreign exchange component is not leveraged and does not contain an option feature, the contract is denominated in the functional currency of the counterparty or the non-financial item is routinely denominated in the currency of the contract or the currency of the contract is commonly used in the economic environment in which the transaction takes place, the embedded derivative is considered to be closely related and is not accounted for separately. The fair value of the embedded derivatives related to sales contracts is recorded in sales; purchase contracts are recorded in cost of sales. On the consolidated statement of financial position, gains are recorded as derivative assets and losses are recorded as derivative liabilities. Transaction costs are expensed when incurred. Fair value Estimated fair values for financial instruments are designed to approximate amounts at which the instruments could be exchanged in a current arm’s-length transaction between knowledgeable willing parties. The fair value of derivative instruments is determined using valuation techniques. The Company has evaluated the fair values of its financial instruments based on the current interest rate environment, related market values and current pricing of financial instruments with comparable terms. Revenue recognition Revenue comprises the fair value of the consideration received or receivable for the sale of goods and services in the ordinary course of the Company’s activities. Revenue is shown net of sales and value-added taxes, returns, rebates and discounts. Revenue is recognized when the amount of revenue and associated costs can be reliably measured, it is probable that future economic benefits will flow to the Company and when specific criteria have been met for each of the Company’s activities as described below. Sales of goods Sales of goods are recognized when the Company has delivered products to the customer and there is no unfulfilled obligation that could affect the customer’s acceptance of the products. Delivery of the products does not occur until the products have been shipped to a specified location in accordance with the agreed-upon shipping terms, the risk of obsolescence and loss have been transferred to the customer, and either the customer has accepted the products in accordance with the sales contract, the acceptance provisions have lapsed, or the Company has objective evidence
46

Velan Inc. Notes to the Consolidated Financial Statements For the years ended February 28, 2018 and 2017 (in thousands of U.S. dollars, excluding number of shares and per share amounts)
that all criteria for acceptance have been satisfied. Customers have a right to return faulty products, and some products are sold with volume discounts. Sales are recorded based on the price specified in the sales contract, net of the estimated volume discounts and returns at the time of sale. Accumulated experience is used to estimate and provide for the discounts and returns. The volume discounts are assessed based on anticipated annual purchases. Sales of services Sales of services are recognized when the Company renders services. Interest income Interest income is recognized using the effective interest rate method. Cash and cash equivalents Cash and cash equivalents include cash on hand, cash in banks, other short-term highly liquid investments with original maturities of three months or less, and bank indebtedness. Bank indebtedness is shown in current liabilities on the consolidated statement of financial position. Interest is earned on cash and cash equivalents at rates ranging from 0% to 4.3% on an annual basis. Interest is paid on bank indebtedness at rates ranging from 1.2% to 3.5%. Short-term investments Short-term investments include all highly liquid investments with original maturities greater than three months but less than one year. Interest is earned on short-term investments at rates ranging from 1.0% to 8.8%. Inventories Inventories are valued at the lower of cost and net realizable value. Net realizable value is the estimated selling price in the ordinary course of business, less applicable variable selling expenses. Cost of inventories is determined as follows:
a) raw materials principally using the weighted average method except for items that are not ordinarily interchangeable, in which case specific identification of their individual costs is used; and
b) work in process, finished parts and finished goods using the raw material cost described in (a) plus applicable direct labour and manufacturing overhead.
The value of obsolete or unmarketable inventory is based on the Company’s assessment of market conditions for its products determined by historical usage, estimated future demand and, in some cases, the specific risk of loss on specifically identified inventory. The writedown may be reversed if the circumstances which caused it no longer exist. Property, plant and equipment Property, plant and equipment are valued at acquisition or manufacturing costs less any related government assistance, accumulated depreciation and any accumulated impairment losses. Acquisition costs include any expenditure that is directly related to the acquisition of the item. Manufacturing costs include direct material and labour costs plus applicable manufacturing overheads. Borrowing costs directly attributable to the acquisition, construction or production of assets that necessarily take a substantial period of time to be ready for their intended use are added to the cost of those assets, until such time as those assets are ready for their intended use.
47

Velan Inc. Notes to the Consolidated Financial Statements For the years ended February 28, 2018 and 2017 (in thousands of U.S. dollars, excluding number of shares and per share amounts)
Subsequent costs are included in the asset’s carrying amount or recognized as a separate asset, as appropriate, only when it is probable that future economic benefits associated with the item will flow to the Company and the cost of the item can be reliably measured. The carrying amount of a replaced part is expensed as the parts are used. All other repairs and maintenance are charged to the consolidated statement of income (loss) during the period in which they are incurred. Depreciation of assets commences when the assets are ready for their intended use. The assets’ residual values and useful lives are reviewed, and adjusted if appropriate, at the end of each reporting period. Changes in expected useful life or the expected pattern of consumption of future economic benefits embodied in the asset are accounted for by changing the depreciation period or method, as appropriate, and treated on a prospective basis as a change in estimate. Depreciation on the property, plant and equipment is determined principally using the following methods and annual rates or terms:
Method Rate/Term
Buildings Declining balance 4% to 5%Machinery and equipment and
furniture and fixtures Declining balance 10% to 31% Data processing equipment Straight-line 3 yearsRolling stock Declining balance 30%Leasehold improvements Straight-line Over lease terms
Goodwill
Goodwill represents the excess of the purchase price over the fair value of the Company’s share of the net identifiable assets of the acquired subsidiary at the date of acquisition. Goodwill is carried at cost less accumulated impairment losses. Intangible assets Purchased intangible assets relate primarily to patents, products, designs, customer lists, non-compete agreements and computer software. Internally generated intangible assets relate to development costs. Research and development costs are expensed as incurred unless the development costs meet the criteria for deferral.
Amortization expense is recognized in the consolidated statement of income (loss) in the expense category consistent with the function of the intangible asset. The assets’ useful lives are reviewed, and adjusted if appropriate, at the end of each reporting period or more frequently if events or circumstances occur that would indicate a change in useful life. Changes in expected useful life or the expected pattern of consumption of future economic benefits embodied in the asset are accounted for by changing the amortization period or method, as appropriate, and treated on a prospective basis as a change in estimate. Amortization is determined principally using the following methods and terms:
Method Term
Patents, products and designs Straight-line 5 to 15 yearsCustomer lists Straight-line 10 yearsNon-compete agreements Straight-line 5 yearsComputer software Straight-line 1 to 3 years
48

Velan Inc. Notes to the Consolidated Financial Statements For the years ended February 28, 2018 and 2017 (in thousands of U.S. dollars, excluding number of shares and per share amounts)
Government assistance The Company receives assistance in the form of investment tax credits (“ITCs”). ITCs are accounted for using the cost reduction method. Under this method, assistance relating to eligible expenditures is deducted from the cost of the related assets or related expenses in the period in which the expenditures are incurred, provided there is reasonable assurance of realization. Impairment of non-financial assets Assets that have an indefinite life (e.g. goodwill or indefinite life intangible assets) are not subject to amortization and are tested annually for impairment, or more frequently if events or circumstances indicate there may be impairment. All other long-lived assets must be reviewed at the end of each reporting period in order to determine whether there is an indication of possible impairment. For the purposes of impairment testing, assets are grouped at the lowest levels for which there are separately identifiable cash flows. A cash-generating unit (“CGU”) is the smallest group of assets that generates cash inflows that are largely independent of the cash inflows from other assets or groups of assets. If an indication of impairment exists, the recoverable amount of the CGU is estimated in order to determine the extent of the impairment loss, if any. An impairment loss is recognized for the amount by which the asset’s carrying amount exceeds its recoverable amount. If the recoverable amount of the CGU is less than the carrying amount, the impairment loss is allocated first to reduce the carrying amount of any goodwill allocated to the CGU and then to the other assets of the CGU on a pro rata basis of the carrying amount of each asset in the CGU. The recoverable amount is the greater of an asset’s or CGU’s fair value less costs of disposal and its value in use. In assessing value in use, the estimated future cash flows are discounted to their present value using a pre-tax discount rate that reflects current market assessments of the time value of money and the risks specific to the asset. Goodwill is allocated to CGUs for the purpose of impairment testing based on the level at which it is monitored by management. The allocation is made to those CGUs that are expected to benefit from the business combination in which the goodwill arose. Non-current and non-financial assets, other than goodwill, that have previously suffered an impairment loss are reviewed for possible reversal of the impairment at each reporting date.
Income taxes The provision for income taxes for the year comprises current and deferred taxes. Taxes are recognized in the consolidated statement of income (loss), except to the extent that it relates to items recognized in other comprehensive income (loss) or directly in equity, in which case the taxes are recognized in other comprehensive income (loss) or equity, respectively. Current income taxes The current income taxes charge is calculated on the basis of the tax laws enacted or substantively enacted at the statement of financial position date in the countries where the Company generates taxable income. When an asset is transferred between entities within the consolidated group, the difference between the tax rates of the two entities is recognized as a tax expense in the period in which the transfer occurs. Current taxes payable is recognized for any
49

Velan Inc. Notes to the Consolidated Financial Statements For the years ended February 28, 2018 and 2017 (in thousands of U.S. dollars, excluding number of shares and per share amounts)
taxes payable in the current period. Current tax liabilities are recognized for current taxes to the extent that they remain unpaid for current and prior periods. Management periodically evaluates positions taken in tax returns with respect to situations in which applicable tax regulation is subject to interpretation and establishes provisions where appropriate. Uncertain income tax provisions are recorded when probable and are recorded at the Company’s best estimate of the amount. Deferred income taxes Deferred income taxes are recognized using the liability method on temporary differences arising between the tax bases of assets and liabilities and their carrying amount in the consolidated financial statements. However, the deferred income taxes are not accounted for if they arise from initial recognition of an asset or liability in a transaction other than a business combination that at the time of the transaction affects neither accounting nor taxable profit or loss. Deferred income taxes are determined using tax rates and laws that have been enacted or substantively enacted by the statement of financial position date and are expected to apply when the related deferred income tax asset is realized or the deferred income tax liability is settled. Deferred income tax assets are recognized only to the extent that it is probable that future taxable profit will be available against which the temporary differences can be used. Deferred income tax assets are reviewed at each statement of financial position date and amended to the extent that it is no longer probable that the related tax benefit will be realized. Deferred income taxes are provided on temporary differences arising on investments in subsidiaries, except where the timing of the reversal of the temporary difference is controlled by the Company and it is probable that the temporary difference will not reverse in the foreseeable future. Current income tax assets and liabilities are offset when the Company has a legally enforceable right to offset the recognized amounts and intends either to settle on a net basis or to realize the asset and settle the liability simultaneously. Normally, the Company would only have a legally enforceable right to set off a current tax asset against a current tax liability when they relate to income taxes levied by the same taxation authority and the taxation authority permits the Company to make or receive a single net payment. Deferred income tax assets and liabilities are offset when the Company has a legally enforceable right to set off current income tax assets against current income tax liabilities and deferred income tax assets and liabilities related to income taxes levied by the same taxation authority on either: (1) the same taxable entity; or (2) different taxable entities which intend either to settle current tax liabilities and assets on a net basis, or to realize assets and settle the liabilities simultaneously, in each future period in which significant amounts of deferred income tax liabilities or assets are expected to be settled or recovered. Provisions Provisions are recognized when the Company has a present legal or constructive obligation as a result of a past event, it is probable that an outflow of resources will be required to settle the obligation, and the amount has been reliably estimated. Provisions are not recognized for costs that need to be incurred to operate in the future or expected future operating losses. Provisions are measured at the present value of the expenditures required to settle the obligation using a pre-tax discount rate that reflects current market assessments of the time value of money and the risks specific to the obligation. Accrual for performance guarantees Accrual for performance guarantees arise for possible late delivery and other contractual non-compliance penalties or liquidated damages. It is recognized when the Company has a present legal or constructive obligation as a result of a
50

Velan Inc. Notes to the Consolidated Financial Statements For the years ended February 28, 2018 and 2017 (in thousands of U.S. dollars, excluding number of shares and per share amounts)
past event, and the amount has been reliably estimated. Accrual for performance guarantees is not recognized for costs that need to be incurred to operate in the future or expected future operating losses. Accrual for performance guarantees is measured at the present value of the expenditures required to settle the obligation using a pre-tax discount rate that reflects current market assessments of the time value of money and the risks specific to the obligation. Leases Leases are classified as either finance or operating leases. Leases that transfer substantially all of the risks and rewards of ownership of the asset to the Company are accounted for as finance leases. Finance leases are capitalized at the commencement of the lease at the lower of the fair value of the leased asset and the present value of the minimum lease payments. Assets acquired under a finance lease are depreciated over the shorter of the period of expected use on the same basis as other similar assets and the lease term. Leases in which a significant portion of the risks and rewards of ownership are retained by the lessor are classified as operating leases. Rental payments under operating leases are expensed in the consolidated statement of income (loss) on a straight-line basis over the term of the lease. Share-based compensation plans Grants under the Company’s share-based compensation plans are accounted for in accordance with the fair value based method of accounting. The Company operates a share-based compensation plan under which it receives services from employees as consideration for share options, performance share units (“PSUs”) and deferred share units (“DSUs”). Share options The fair value of the employee services received in exchange for the grant of the options is amortized over the vesting period as compensation expense, with a corresponding increase to contributed surplus. The total amount to be expensed is determined by multiplying the number of options expected to vest with the fair value of one option as of the grant date as determined by the Black-Scholes option pricing model. Remaining an employee of the Company for a specified period of time is the only condition for vesting. Vesting typically occurs one-quarter per year over four years from the grant date. This non-market performance condition is factored into the estimate of the number of options expected to vest. If the number of options expected to vest differs from that originally expected, the expense is adjusted accordingly. When options are exercised, the Company issues new shares. The proceeds received, together with the amount recorded in contributed surplus, net of any directly attributable transaction costs, are recorded in share capital. PSUs and DSUs PSUs and DSUs may be granted to certain of its independent directors and full-time employees as part of their long-term compensation package entitling them to receive payout in cash based on the Company’s share price at the relevant time. A liability for PSUs and DSUs is measured at fair value on the grant date and is subsequently adjusted at each balance sheet date for changes in fair value according to the estimation made by management of the number of PSUs and DSUs that will eventually vest. The liability is recognized to accounts payable and accrued liabilities over the vesting period, with a corresponding charge to compensation expense.
51

Velan Inc. Notes to the Consolidated Financial Statements For the years ended February 28, 2018 and 2017 (in thousands of U.S. dollars, excluding number of shares and per share amounts)
Critical accounting estimates and assumptions The Company’s significant accounting policies as described above are essential to understanding the Company’s results of operations, financial positions and cash flows. Certain of these accounting policies require critical accounting estimates that involve complex and subjective judgments and the use of assumptions, some of which may be for matters that are inherently uncertain and susceptible to change. The assumptions and estimates used are based on parameters which are derived from the knowledge at the time of preparing the financial statements and believed to be reasonable under the circumstances. In particular, the circumstances prevailing at this time and assumptions as to the expected future development of the global and industry-specific environment were used to estimate the Company’s future business performance. Where these conditions develop differently than assumed and beyond the control of the Company, the actual results may differ from those anticipated. These estimates and underlying assumptions are reviewed on an ongoing basis. Revisions to accounting estimates are recognized in the period in which the estimate is changed. There were no significant changes made to critical accounting estimates during the past two fiscal years. The estimates and assumptions that have a significant risk of causing a material adjustment to the carrying amounts of assets and liabilities within the next fiscal year are addressed below. Accounts receivable The Company must report its accounts receivable at their net realizable value. This involves management judgment and requires the Company to perform continuous evaluations of their collectability and to record an allowance for doubtful accounts when required. In performing its evaluation, the Company analyzes the ageing of accounts receivable, concentration of receivables by customer, customer creditworthiness and current economic trends. Any change in the assumptions used could impact the carrying value of the accounts receivable on the consolidated statement of financial position with a corresponding impact made to administration costs on the consolidated statement of income. Inventories Inventories must be valued at the lower of cost and net realizable value. A writedown of inventory will occur when its estimated market value less applicable variable selling expenses is below its carrying amount. This involves significant management judgment and is based on the Company’s assessment of market conditions for its products determined by historical usage, estimated future demand and, in some cases, the specific risk of loss on specifically identified inventory. Any change in the assumptions used in assessing this valuation or selling costs could impact the carrying amount of the inventory on the consolidated statement of financial position with a corresponding impact made to cost of sales on the consolidated statement of income. Provisions Provisions must be established for possible product warranty expenses. The Company estimates its warranty exposure by taking into account past experience as well as any known technical problems and estimates of costs to resolve these issues. The Company estimates its exposure under these obligations based on an analysis of all identified or expected claims. Any change in the assumptions used could impact the value of the provision on the consolidated
52

Velan Inc. Notes to the Consolidated Financial Statements For the years ended February 28, 2018 and 2017 (in thousands of U.S. dollars, excluding number of shares and per share amounts)
statement of financial position with a corresponding impact made to cost of sales on the consolidated statement of income. Impairment of non-financial assets Assets that have an indefinite life, such as goodwill, are tested annually by the Company for impairment, or more frequently if events or circumstances indicate there may be impairment. All other assets must be reviewed by the Company at the end of each reporting period in order to determine whether there is an indication of possible impairment. Any change in the assumptions used could impact the carrying amount first of any goodwill allocated to the CGU and then to the other assets of the CGU on a pro rata basis of the carrying amount of each asset in the CGU on the consolidated statement of financial position with a corresponding impact made to the consolidated statement of income. Income taxes The Company must estimate its income taxes in each jurisdiction in which it operates. This involves assessing the probability of using net operating losses against future taxable income as well as evaluating positions taken in tax returns with respect to situations in which applicable tax regulation is subject to interpretation. In the event these assessments are changed, there would be an adjustment to income tax expense with a corresponding adjustment to income tax balances on the consolidated statement of financial position. Critical judgements in applying the Company’s accounting policies
Consolidation The Company consolidates the accounts of Juwon Special Steel Co. Ltd. in these financial statements. It was determined that the Company has substantive rights over this structured entity that are currently exercisable and for which there is no barrier, despite the fact that its percentage ownership in this entity is only 50%. These substantive rights are obtained through the shareholders’ agreement signed between the Company and the non-controlling interest which gives the Company the ultimate decision right on any decision taken for which both parties in the joint arrangement are not in agreement. As per the shareholders’ agreement, the Board of Directors, representing the interests of shareholders, has responsibility to establish operating decisions (including budgets), approve capital transactions and determine key management personnel remuneration. Consequently, the Company, through its rights set out in the shareholders’ agreement, has substantive rights that give it the ability to direct the relevant activities of Juwon Special Steel Co. Ltd. while being exposed to variable returns. As such, it was determined that this entity should be consolidated.
3 New accounting standards and amendments
New accounting standards and amendments adopted in the year
The Company has applied the following standards and amendments for the first time in the fiscal year, starting on March 1st, 2017.
(i) Recognition of Deferred Tax Assets for Unrealised Losses – Amendments to IAS 12; and
(ii) Disclosure initiative – amendments to IAS 7.
53

Velan Inc. Notes to the Consolidated Financial Statements For the years ended February 28, 2018 and 2017 (in thousands of U.S. dollars, excluding number of shares and per share amounts)
The adoption of these amendments did not have a significant impact on the amounts recognized in prior periods. The amendments also do not affect the current or future periods significantly. The amendments to IAS 7 require disclosure of changes in liabilities arising from financing activities, which is presented in note 29.
New accounting standards and amendments issued but not yet adopted
(i) In July 2014, the IASB issued IFRS 9, Financial Instruments. The IASB has previously published versions of IFRS 9 that introduced new classification and measurement requirements (in 2009 and 2010) and a new hedge accounting model (in 2013). The July 2014 publication represents the final version of the Standard, replaces earlier versions of IFRS 9 and substantially completes the IASB’s project to replace IAS 39, Financial Instruments: Recognition and Measurement.
This standard replaces the current multiple classification and measurement models for financial assets and liabilities with a single model that has only three classification categories: amortized cost and fair value through other comprehensive income and fair value through profit or loss. The basis of classification depends on the entity’s business model and the contractual cash flow characteristics of the financial asset or liability. The standard introduces a new, expected loss impairment model that will require more timely recognition of expected credit losses. Specifically, the new Standard requires entities to account for expected credit losses from when financial instruments are first recognised and it lowers the threshold for recognition of full lifetime expected losses. The new standard also introduces a substantially-reformed model for hedge accounting with enhanced disclosures about risk management activity and aligns hedge accounting more closely with risk management. The new standard is effective for annual periods beginning on or after January 1, 2018 with earlier adoption permitted. The Company is in the final stages of analyzing the impact of the adoption of this new standard. The impact is not expected to be material.
(ii) IFRS 15, Revenue from Contracts with Customers, was issued in May 2014 and specifies how and when revenue will be recognized as well as requiring the provision of more informative and relevant disclosures. Its core principle is that an entity will recognize revenue to depict the transfer of promised goods or services to customers in an amount that reflects the consideration to which the entity expects to be entitled in exchange for those goods or services. This core principle is delivered in a five-step model framework: (i) identify the contract(s) with a customer; (ii) identify the performance obligations in the contract; (iii) determine the transaction price; (iv) allocate the transaction price to the performance obligations in the contract; and (v) recognize revenue when (or as) the entity satisfies a performance obligation. IFRS 15 replaces IAS 11, Construction contracts, IAS 18, Revenue, IFRIC 13, Customer Loyalty Programmes, IFRIC 15, Agreements for the Construction of Real Estate, IFRIC 18, Transfers of Assets from Customers, and SIC-31, Revenue - Barter Transactions Involving Advertising Services. The new standard is effective for annual periods beginning on or after January 1, 2018 with earlier adoption permitted. For the Company, the standard comes into effect on March 1, 2018. As a result, IFRS 15 will be adopted in the first quarter of the fiscal year ending February 28, 2019. At that time, the Company plans to use the retrospective transition alternative whereby it will restate its comparative results for the current year, with an opening adjustment to retained earnings as at March 1, 2017, if applicable. The Company has determined that late delivery penalties, which are currently recorded as an expense in cost of sales, will be recorded as a reduction of sales when this standard comes into effect. The preliminary assessment of the effect of this change on the current year’s results is a $1,452 decrease in consolidated sales and a corresponding decrease in consolidated cost of sales.
54

Velan Inc. Notes to the Consolidated Financial Statements For the years ended February 28, 2018 and 2017 (in thousands of U.S. dollars, excluding number of shares and per share amounts)
The new standard will not have a significant impact on the timing of the Company’s revenues from the sale of goods as most of such revenues will continue to be recognized upon the delivery of the said goods as per the agreed-upon shipping terms. However, if certain criteria are met, the Company has determined that separate elements in a sale of goods contract may be classified as separate performance obligations. These could include, but are not limited to the delivery of drawings and documentation, the provision of services (commissioning, inspection, shipping and testing), and warranties. The preferred method of allocating revenue to multiple elements in a sale of goods contract where separate performance obligations have been identified will be the adjusted market assessment approach. While the above changes may have an impact on revenues in future fiscal years, the Company has determined that they will not have a material impact on the current and prior years’ consolidated revenues.
(iii) In January 2016, the IASB issued IFRS 16, Leases, which sets out the principles for the recognition,
measurement, presentation and disclosure of leases for both parties to a contract. It eliminates the classification of leases as either operating leases or finance leases and introduces a single lessee accounting model. It also substantially carries forward the lessor accounting requirements. Accordingly, a lessor continues to classify its leases as operating leases or finance leases, and to account for those two types of leases differently. IFRS 16 replaces IAS 17, Leases, IFRIC 4, Determining whether an Arrangement contains a Lease, SIC-15, Operating Leases – Incentives, and SIC-27, Evaluating the Substance of Transactions Involving the Legal Form of a Lease. The new standard is effective for annual periods beginning on or after January 1, 2019 with earlier adoption permitted only if IFRS 15 has been adopted. While the Company is currently assessing the impact of this new standard, it has determined that it will not early adopt it. The operating leases, as disclosed in the commitment note (note 22 (c)) are within the scope of IFRS 16.
(iv) In November 2016, the IFRS Interpretations Committee (“IFRIC”) issued IFRIC 22, Foreign Currency
Transactions and Advance Consideration. This interpretation addresses the exchange rate to use when reporting transactions that are denominated in a foreign currency in accordance with IAS 21, The Effects of Changes in Foreign Exchange Rates, in the circumstance in which a customer paid for goods or services in advance. The interpretation is effective for annual periods beginning on or after January 1, 2018 with earlier adoption permitted. For the Company, the interpretation comes into effect on March 1, 2018. As a result, IFRIC 22 will be adopted in the first quarter of the fiscal year ending February 28, 2019.
(v) In June 2017, IFRIC issued IFRIC 23, Uncertainty over Income Tax Treatments. This interpretation clarifies how the recognition and measurement requirements of IAS 12, Income Taxes, are applied where there is uncertainty over income tax treatments that have yet to be accepted by tax authorities. The interpretation is effective for annual periods beginning on or after January 1, 2019 with earlier adoption permitted. While the Company is currently assessing the impact of this new standard, it has determined that it will not early adopt it.
4 Intangible asset and goodwill impairment analysis
Intangible asset impairment test at February 28, 2017 As a result of losses incurred by the Company’s Italian subsidiary, ABV, the Company determined that there was an indication that the amortizable intangible assets associated with this CGU may be impaired at February 28, 2017. As
55

Velan Inc. Notes to the Consolidated Financial Statements For the years ended February 28, 2018 and 2017 (in thousands of U.S. dollars, excluding number of shares and per share amounts)
such, the Company tested for impairment the carrying amount of such intangible assets, which consists primarily of patents, products and designs, as well as customer lists. Based on this test, the Company determined that the recoverable amount of such assets exceeded the carrying amount of $15,578 by $4,898. Accordingly, no intangible asset impairment loss was recorded for this CGU at February 28, 2017. The recoverable amount was determined based on the fair value less costs of disposal approach using a discounted cash flow model. The significant key assumptions included forecasted cash flows based on updated financial plans prepared by management covering a four-year period taking into consideration the following assumptions and trends: - Expected Earnings before interest, taxes, depreciation and amortization (“EBITDA”) as a percentage of sales for
the CGU of 6.8% in 2018, 7.9% in 2019, 10.1% in 2020, and 14.7% in 2021. - Expected working capital cash absorption ratio for the CGU of 19% of annual incremental sales increases. - Expected annual capital expenditure needs for the CGU of $530 in 2018, 2019 and 2020, and $1,060 for 2021.
The discounted cash flow model was established using a discount rate of 18.0% and a terminal growth rate of 2%. After three successive years of positive earnings, ABV incurred a significant loss in the current fiscal year. This loss was primarily due to a large project order, which was expected to ship in 2017, but is now expected to ship in 2018. As a result, management revised its assumptions related to sales and expected EBITDA that were used in the prior year to test the goodwill related to this CGU in order to account for this delay. All other assumptions remained relatively consistent with the prior year. The following table provides a sensitivity analysis of the Company’s recoverable amount of the intangible assets associated with the CGU related to its ABV subsidiary for the period assuming a one percentage point increase of the selected variables below. Note that this sensitivity analysis assumes that all other assumptions and trends remain constant for each independent variable.
Decrease (Increase) in recoverable
amount $
Increase in expected EBITDA as a percentage of sales (2,577)Increase in discount rate 1,354Increase in terminal growth rate (1,106) A one percentage point decrease of the selected variables below, assuming all other assumptions and trends remain constant for each independent variable, would have the following impact on the recoverable amount of the intangible assets associated with the CGU related to its ABV subsidiary:
56

Velan Inc. Notes to the Consolidated Financial Statements For the years ended February 28, 2018 and 2017 (in thousands of U.S. dollars, excluding number of shares and per share amounts)
Decrease (Increase) in recoverable
amount $
Decrease in expected EBITDA as a percentage of sales 2,550Decrease in discount rate (1,541)Decrease in terminal growth rate 976 Summarized below is the amount by which each key assumption must change, after incorporating consequential effects of the change on the other variables used to measure the recoverable amount, in order for the CGU’s recoverable amount to be equal to its carrying amount: - Decrease of 1.25% in the expected EBITDA as a percentage of sales for the CGU for each referenced year. - Increase in working capital cash absorption ratio for the CGU from 19% to 24.3% of annual incremental sales
increases. - Increase in expected discount rate from 18.0% to 22.4%. - Decrease of expected terminal growth rate from 2% to -4.7%. Goodwill impairment test at February 28, 2018 In the context of its annual impairment testing, the Company completed its impairment analysis and assessed the recoverability of the assets allocated to its various CGUs. The Company calculated the recoverable amounts of its CGUs using valuation methods which were consistent with those used in prior years. The Company tested for impairment the carrying amount of the goodwill associated with the CGU related to its French subsidiary, Velan S.A.S., and determined that the recoverable amount significantly exceeded the carrying amount of $9,493 by $69,309. Accordingly, no goodwill impairment loss was recorded for this CGU at February 28, 2018. The recoverable amount was determined based on the fair value less costs of disposal approach using a discounted cash flow model. The significant key assumptions included forecasted cash flows based on updated financial plans prepared by management covering a three-year period taking into consideration the following assumptions and trends: - Expected EBITDA as a percentage of sales for the CGU of 21.8% in 2019, 20.7% in 2020, and 18.9% in 2021. - Expected working capital cash absorption ratio for the CGU of 19% of annual incremental sales increases. - Expected annual capital expenditure needs for the CGU of $1,880 in 2019, 2020 and 2021. The discounted cash flow model was established using a discount rate of 15.0% and a terminal growth rate of 2%. Management based its selection of assumptions upon its assessment of the ability of the CGU to deliver on its past levels of growth and profitability based on its current backlog of orders, as well as its evaluation of the longer term potential of its key end-user markets, particularly nuclear power and cryogenics. The margin assumptions used were in line with actual margins generated by the CGU in prior years.
57

Velan Inc. Notes to the Consolidated Financial Statements For the years ended February 28, 2018 and 2017 (in thousands of U.S. dollars, excluding number of shares and per share amounts)
Goodwill impairment test at February 28, 2017 In the context of its annual impairment testing, the Company completed its impairment analysis and assessed the recoverability of the assets allocated to its various CGUs. The Company calculated the recoverable amounts of its CGUs using valuation methods which were consistent with those used in prior years. The Company tested for impairment the carrying amount of the goodwill associated with the CGU related to its French subsidiary, Velan S.A.S., and determined that the recoverable amount significantly exceeded the carrying amount of $8,236 by $52,039. Accordingly, no goodwill impairment loss was recorded for this CGU at February 28, 2017. The recoverable amount was determined based on the fair value less costs of disposal approach using a discounted cash flow model. The significant key assumptions included forecasted cash flows based on updated financial plans prepared by management covering a three-year period taking into consideration the following assumptions and trends: - Expected EBITDA as a percentage of sales for the CGU of 22.1% in 2018, 20.8% in 2019, and 17.8% in 2020. - Expected working capital cash absorption ratio for the CGU of 19% of annual incremental sales increases. - Expected annual capital expenditure needs for the CGU of $2,119 in 2018, 2019 and 2020. The discounted cash flow model was established using a discount rate of 15.0% and a terminal growth rate of 2%. Management based its selection of assumptions upon its assessment of the ability of the CGU to deliver on its past levels of growth and profitability based on its current backlog of orders, as well as its evaluation of the longer term potential of its key end-user markets, particularly nuclear power and cryogenics. The margin assumptions used were in line with actual margins generated by the CGU in prior years.
5 Inventories
As at February 28,
2018 $
As at February 28,
2017 $
Raw materials 32,381 33,621Work in process and finished parts 101,629 94,562Finished goods 36,780 44,906
170,790 173,089
As a result of variations in the ageing of its inventories, the Company recognized a net additional inventory provision for the year of $828 (2017 – $2,146), including reversals of $5,476 (2017 – $6,555).
58

Velan Inc. Notes to the Consolidated Financial Statements For the years ended February 28, 2018 and 2017 (in thousands of U.S. dollars, excluding number of shares and per share amounts)
6 Subsidiaries and transactions with non-controlling interests
a) Interest in subsidiaries
Set out below are the Company’s principal subsidiaries at February 28, 2018. Unless otherwise stated, the subsidiaries have share capital consisting solely of ordinary shares, which are held directly by the Company, and the proportion of ownership interests held equals the voting rights held by the Company. The country of incorporation or registration is also their principal place of business.
Name of entity Functional
Currency Country of
incorporation
% of ownership interest held by
the Company
% of ownership interest held by
the non-controlling
interests Principal Activities 2018 2017 2018 2017
Velan Valve Corp. U.S. Dollar U.S.A. 100 100 - - Valve Manufacture
Velan Ltd. U.S. Dollar Korea 100 100 - - Valve Manufacture
Juwon Special Steel Co. Ltd. Korean Won Korea 50 50 50 50 Foundry
Velan Valvulas Industrias, Lda. Euro Portugal 100 100 - - Valve Manufacture
Velan S.A.S. Euro France 100 100 - - Valve Manufacture
Segault S.A.S. Euro France 75 75 25 25 Valve Manufacture
Velan GmbH Euro Germany 100 100 - - Valve Distribution
Velan ABV S.r.l. Euro Italy 100 100 - - Valve Manufacture
Velan Valvac Manufacturing Co. Ltd. U.S. Dollar Taiwan 90 90 10 10 Valve
Manufacture
Velan Valve (Suzhou) Co. Ltd. U.S. Dollar China 85 85 15 15 Valve Manufacture
Velan Valves India Private Limited
Indian Rupee India 100 100 - - Valve
Manufacture
b) Significant restrictions
Cash and short-term investments held in certain Asian countries are subject to local exchange control regulations. These regulations provide for restrictions on exporting capital from those countries, other than through normal dividends. However, such restrictions do not have a significant impact on the Company’s operations and treasury management as less than 7% of the Company’s cash and short-term investments are subject to such restrictions. The total amount of cash and short-term investments subject to such restrictions as at February 28, 2018 was $5,424 (2017 – $1,785).
59

Velan Inc. Notes to the Consolidated Financial Statements For the years ended February 28, 2018 and 2017 (in thousands of U.S. dollars, excluding number of shares and per share amounts)
c) Non-controlling interests
Set out below is summarized financial information for each subsidiary company and structured entity that has non-controlling interests that are material to the Company and for which the non-controlling interest is recognized as equity rather than as a liability (see note 12(o)). The amounts disclosed for each subsidiary are before intercompany eliminations.
Summarized statement of financial position Juwon Special Steel Co. Ltd.
Velan Valvac Manufacturing Co. Ltd.
As at
February 28, 2018
As at February 28,
2017
As at February 28,
2018
As at February 28,
2017 $ $ $ $ Current assets 6,521 8,440 4,903 5,293 Current liabilities 3,344 3,318 1,355 1,367 Current net assets 3,177 5,122 3,548 3,926 Non-current assets 13,452 13,206 1,873 1,857 Non-current liabilities 8,948 8,544 79 68 Non-current net assets 4,504 4,662 1,794 1,789 Net assets 7,681 9,784 5,342 5,715 Accumulated non-controlling interest 4,932 5,844 660 673
Summarized statement of comprehensive income (loss) Juwon Special Steel Co. Ltd.
Velan Valvac Manufacturing Co. Ltd.
2018 2017 2018 2017 $ $ $ $ Sales 12,298 12,531 6,192 7,518 Net income (loss) for the year (2,460) (471) 44 992 Other comprehensive income 357 895 - - Total comprehensive income (loss) for the year (2,103) 424 44 992 Net income (loss) allocated to non-controlling interest (1,090) 461 28 116 Dividends paid to non-controlling interest - - 41 49
60

Velan Inc. Notes to the Consolidated Financial Statements For the years ended February 28, 2018 and 2017 (in thousands of U.S. dollars, excluding number of shares and per share amounts)
Summarized statement of cash flows Juwon Special Steel Co. Ltd.
Velan Valvac Manufacturing Co. Ltd.
2018 2017 2018 2017 $ $ $ $ Cash flows from operating activities (1,188) (580) (102) 245 Cash flows from investing activities (662) 100 (14) (45) Cash flows from financing activities (4) (4) (404) (487) Net decrease in cash and cash equivalents (1,854) (484) (520) (287)
7 Property, plant and equipment
Depreciation expense of $11,035 (2017 – $11,943) is included in the consolidated statement of income (loss): $9,950 (2017 – $10,703) in ‘cost of sales’ and $1,085 (2017 – $1,240) in ‘administration costs’.
Land BuildingsMachinery &
equipmentFurniture &
fixturesData processing
equipmentRolling
stockLeasehold
improvements Total
$ $ $ $ $ $ $ $At February 29, 2016Cost 19,866 53,175 148,597 7,984 6,737 3,128 3,581 243,068 Accumulated depreciation - (24,445) (107,225) (6,194) (5,643) (2,241) (2,063) (147,811)
19,866 28,730 41,372 1,790 1,094 887 1,518 95,257
Year ended February 28, 2017Beginning balance 19,866 28,730 41,372 1,790 1,094 887 1,518 95,257 Additions - 1,353 5,293 254 532 149 140 7,721 Disposals - - (10) (1) (1) (267) (11) (290) Depreciation - (1,813) (8,431) (332) (829) (316) (222) (11,943) Exchange differences 925 (11) (90) (15) (1) 15 (33) 790
20,791 28,259 38,134 1,696 795 468 1,392 91,535
At February 28, 2017Cost 20,791 54,389 149,077 8,079 7,077 2,948 3,318 245,679 Accumulated depreciation - (26,130) (110,943) (6,383) (6,282) (2,480) (1,926) (154,144)
20,791 28,259 38,134 1,696 795 468 1,392 91,535
Year ended February 28, 2018Beginning balance 20,791 28,259 38,134 1,696 795 468 1,392 91,535 Additions 44 1,396 3,632 258 406 399 67 6,202 Disposals - - (48) (3) - (3) - (54) Depreciation - (1,830) (7,527) (555) (524) (303) (296) (11,035) Exchange differences 780 763 1,337 132 15 8 181 3,216
21,615 28,588 35,528 1,528 692 569 1,344 89,864
At February 28, 2018Cost 21,615 57,775 155,632 8,705 6,782 3,081 3,848 257,438 Accumulated depreciation - (29,187) (120,104) (7,177) (6,090) (2,512) (2,504) (167,574)
21,615 28,588 35,528 1,528 692 569 1,344 89,864
61

Velan Inc. Notes to the Consolidated Financial Statements For the years ended February 28, 2018 and 2017 (in thousands of U.S. dollars, excluding number of shares and per share amounts)
8 Intangible assets and goodwill
Amortization expense of $1,842 (2017 – $1,767) is included in the consolidated statement of income (loss): $1,397 (2017 – $1,354) in ‘cost of sales’ and $445 (2017 – $413) in ‘administration costs’. As at February 28, 2018, the Company capitalized $275 (2017 – $723) of development costs, net of research and development tax credits of $142 (2017 – $211), as patents, products and designs.
GoodwillComputer
software
Patents, products &
designsCustomer
lists Other Total
At February 29, 2016Cost 8,529 7,552 12,461 5,881 1,526 35,949 Accumulated amortization - (7,089) (4,159) (2,844) (1,505) (15,597)
8,529 463 8,302 3,037 21 20,352
Year ended February 28, 2017Beginning balance 8,529 463 8,302 3,037 21 20,352 Additions - 168 723 - 19 910 Disposals and transfers - - - - - - Amortization - (155) (994) (594) (24) (1,767) Impairment loss - - - - - - Exchange differences (228) (13) (169) (61) (1) (472)
8,301 463 7,862 2,382 15 19,023
At February 28, 2017Cost 8,301 7,574 12,872 5,723 649 35,119 Accumulated amortization - (7,111) (5,010) (3,341) (634) (16,096)
8,301 463 7,862 2,382 15 19,023
Year ended February 28, 2018Beginning balance 8,301 463 7,862 2,382 15 19,023 Additions - 67 275 - 80 422 Disposals and transfers - - - - - - Amortization - (139) (1,082) (621) - (1,842) Impairment loss - - - - - - Exchange differences 1,267 55 954 324 7 2,607
9,568 446 8,009 2,085 102 20,210
At February 28, 2018Cost 9,568 8,063 14,845 6,596 832 39,904 Accumulated amortization - (7,617) (6,836) (4,511) (730) (19,694)
9,568 446 8,009 2,085 102 20,210
62

Velan Inc. Notes to the Consolidated Financial Statements For the years ended February 28, 2018 and 2017 (in thousands of U.S. dollars, excluding number of shares and per share amounts)
9 Accounts payable and accrued liabilities
As at February 28,
2018 $
As at February 28,
2017 $
Trade accounts payable 23,635 25,969Accrued liabilities 35,597 30,668Other 4,209 4,004
63,441 60,641
10 Credit facilities
a) The Company and its U.S. subsidiary company, Velan Valve Corp., have the following credit facilities available as at February 28, 2018:
Unsecured Credit facilities available Borrowing rates
$66,360 (CA$85,000) (2017 – $64,005 (CA$85,000))
(note 25) Prime to prime + 0.75%
(2017 – Prime to prime + 0.75%)
The above unsecured facilities are available by way of demand operating lines of credit, bank loans, letters of credit, bankers’ acceptances, LIBOR loans, letters of guarantee and bank overdrafts. These facilities are subject to annual renewal. As at February 28, 2018, an amount of nil (2017 – nil) was drawn against these unsecured credit facilities in the form of demand operating lines of credit and bank overdrafts. An additional $25,227 (2017 – $9,765) was drawn against these unsecured credit facilities in the form of letters of credit and letters of guarantee. In addition to the unsecured credit facilities above, the Company maintains a facility with Export Development Canada of $40,000 for letters of credit and letters of guarantee. As at February 28, 2018, $6,794 (2017 – $8,162) was drawn against this facility.
63

Velan Inc. Notes to the Consolidated Financial Statements For the years ended February 28, 2018 and 2017 (in thousands of U.S. dollars, excluding number of shares and per share amounts)
b) Foreign subsidiaries and structured entities have the following credit facilities available as at February 28, 2018:
Secured by corporate guarantees Credit facilities available Borrowing rates
Foreign subsidiaries 0.20% to 8.84%
$56,497 (€40,057; KW3,712,300; INR270,000) (2017 – $50,066 (€41,672; KW3,791,730; INR170,000)) (note 25)
(2017 – 0.30% to 9.25%)
Foreign structured entities 1.50% to 4.29%
$3,938 (KW4,262,000) (2017 – $4,746 (KW5,363,200)) (note 25)
(2017 – 1.50% to 3.09%)
The above credit facilities are available by way of demand operating lines of credit, bank loans, guarantees, letters of credit and foreign exchange forward contracts. The majority of these credit facilities have variable borrowing rates based on LIBOR, EURIBOR, KORIBOR, EONIA or prime rate. The borrowing rates listed above are the rates in effect as at February 28, 2018 and February 28, 2017. The terms of the above facilities range from annual renewal to an indefinite term. The aggregate net book value of the assets pledged under the above credit facilities amounted to $2,530 (2017 – $2,842). As at February 28, 2018, an amount of $13,066 (2017 – $7,792) was drawn against these secured credit facilities in the form of demand operating lines of credit and bank overdrafts. An additional $5,548 (2017 – $1,824) was drawn against these secured credit facilities in the form of letters of credit and letters of guarantee.
11 Provisions As at
February 28, 2018
$
As at February 28,
2017 $
Balance – Beginning of year 10,600 9,333Additional provisions 2,328 4,322Used during the year (3,563) (2,754)Exchange differences 1,433 (301) Balance – End of year 10,798 10,600
The Company’s provisions consist entirely of warranties. The Company offers various warranties to the purchasers of its valves. Management estimates the related provision for future warranty claims based on historical warranty claim information, as well as recent trends that might suggest that past cost information may differ from future claims. Factors that could impact the estimated claim information include the success of the Company’s productivity and quality initiatives, as well as parts and labour costs.
64

Velan Inc. Notes to the Consolidated Financial Statements For the years ended February 28, 2018 and 2017 (in thousands of U.S. dollars, excluding number of shares and per share amounts)
12 Long-term debt
As at February 28,
2018 $
As at February 28,
2017 $
French subsidiaries
Unsecured bank loan (€2,402; February 28, 2017 – €3,000) (note 12(a)) 2,934 3,179Unsecured bank loan (€228; February 28, 2017 – €327) (note 12(b)) 278 347
Italian subsidiary Unsecured bank loan (€359; February 28, 2017 – €464) (note 12(c)) 438 492 Unsecured bank loan (€355; February 28, 2017– €462) (note 12(d)) 434 490Unsecured state bank loan (€168; February 28, 2017 – €236) (note 12(e)) 206 250Unsecured bank loan (€153; February 28, 2017 – €253) (note 12(f)) 187 268Unsecured bank loan (€182; February 28, 2017 – €545) (note 12(g)) 222 578Unsecured bank loan (€400; February 28, 2017 – €667) (note 12(h)) 489 706Unsecured bank loan (€170; February 28, 2017 – €505) (note 12(i)) 207 535Unsecured bank loan (€563; February 28, 2017 – €938) (note 12(j)) 687 993Unsecured bank loan (€198; February 28, 2017 – €533) (note 12(k)) 241 565Unsecured state bank loan (€1,610; February 28, 2017 – €1,610) (note 12(l)) 1,967 1,706
Korean structured entitySecured bank loan (KW8,400; February 28, 2017 – KW13,200) (note 12(m)) 8 12Secured bank loan (KW8,000,000; February 28, 2017 – KW8,000,000)
(note 12(n)) 7,392 7,080 Other (note 12(o)) 6,439 5,232
22,129 22,433
Less: Current portion 8,151 7,115 13,978 15,318
a) The unsecured bank loan of $2,934 (€2,402) bears interest at 0.20% and is repayable in variable monthly instalments of $61, expiring in 2022.
b) The unsecured bank loan of $278 (€228) bears interest at 0.89% and is repayable in monthly instalments of
$12, expiring in 2020.
c) The unsecured bank loan of $438 (€359) bears interest at 2.91% and is repayable in monthly instalments, expiring in 2021.
65

Velan Inc. Notes to the Consolidated Financial Statements For the years ended February 28, 2018 and 2017 (in thousands of U.S. dollars, excluding number of shares and per share amounts)
d) The unsecured bank loan of $434 (€355) bears interest at 4.90% and is repayable in variable monthly instalments, expiring in 2021.
e) The unsecured state bank loan of $206 (€168) is non-interest bearing and is repayable in variable semi-annual instalments, expiring in 2020.
f) The unsecured bank loan of $187 (€153) bears interest at the 3-month Euribor rate plus 1.7% and is repayable in quarterly instalments of $33, expiring in 2019.
g) The unsecured bank loan of $222 (€182) bears interest at the 6-month Euribor rate plus 1.25% and is repayable in quarterly instalments of $118, expiring in 2018.
h) The unsecured bank loan of $489 (€400) bears interest at the 3-month Euribor rate plus 1.8% and is repayable in quarterly instalments of $86, expiring in 2019.
i) The unsecured bank loan of $207 (€170) bears interest at the 3-month Euribor rate plus 1.6% and is repayable in quarterly instalments of $111, expiring in 2018.
j) The unsecured bank loan of $687 (€563) bears interest the 3-month Euribor rate plus 1.6% and is repayable in quarterly instalments of $121, expiring in 2019.
k) The unsecured bank loan of $241 (€198) bears interest at 1.37% and is repayable in monthly instalments of $35, expiring in 2018.
l) The unsecured state bank loan of $1,967 (€1,610) bears interest at 3% and is repayable in variable semi-annual instalments, expiring in 2024.
m) The secured bank loan of $8 (KW8,400) bears interest at 1.50% and is repayable in 2020. Certain land, a building, and certain machinery and equipment are pledged as collateral for this loan.
n) The secured bank loan of $7,392 (KW8,000,000) bears interest at 2.21% and is repayable in quarterly instalments of $241, expiring in 2025.
o) Included in Other is an amount of $5,083 (€4,162) (February 28, 2015 – $4,045 (€3,817)) related to an unconditional put option held by a minority shareholder in one of the Company’s subsidiary companies. This is recognized as a liability instead of non-controlling interest. The liability is initially recognized as the non-controlling interest’s share of the net identifiable assets of the subsidiary or structured entity. Subsequently, the liability is carried at the amount of the present value of estimated future cash flows discounted at the original effective rate. Adjustments to the carrying value are recorded as interest expense in the consolidated statement of income (loss).
66

Velan Inc. Notes to the Consolidated Financial Statements For the years ended February 28, 2018 and 2017 (in thousands of U.S. dollars, excluding number of shares and per share amounts)
p) The following is a schedule of future debt payments:
$
February 28, 2019 8,151 February 29, 2020 2,970 February 28, 2021 2,401 February 28, 2022 2,212 February 28, 2023 1,336 Subsequent years 5,059
22,129
The aggregate net book value of the assets pledged as collateral under long-term debt agreements amounted to $12,411 (2017 – $12,519).
q) The carrying value of long-term debt approximates its fair value.
13 Share capital
a) Authorized – in unlimited number Preferred Shares, issuable in series Subordinate Voting Shares Multiple Voting Shares (five votes per share), convertible into Subordinate Voting Shares
b) Issued
As at February 28,
2018 $
As at February 28,
2017 $
6,055,368 Subordinate Voting Shares (February 28, 2017 –
6,100,668) (notes 13(c) and (d)) 65,964 66,45815,566,567 Multiple Voting Shares 7,126 7,126
73,090 73,584
c) Pursuant to its Normal Course Issuer Bid, the Company is entitled to repurchase for cancellation a maximum of 151,549 of the issued Subordinate Voting Shares of the Company, representing approximately 2.5% of the issued shares of such class as at October 18, 2017, during the ensuing 12-month period ending October 30, 2018. During the year ended February 28, 2018, 45,300 (2017 – 69,900) Subordinate Voting Shares were purchased for a cash consideration of $630 (2017 – $926) and cancelled. The amount by which the repurchase amount is above the stated capital of the shares has been debited to retained earnings.
d) The Company established a fixed share option plan (the “Share Option Plan”) in 1996, amended in fiscal 2007, to allow for the purchase of Subordinate Voting Shares by certain of its full-time employees, directors, officers and consultants.
67
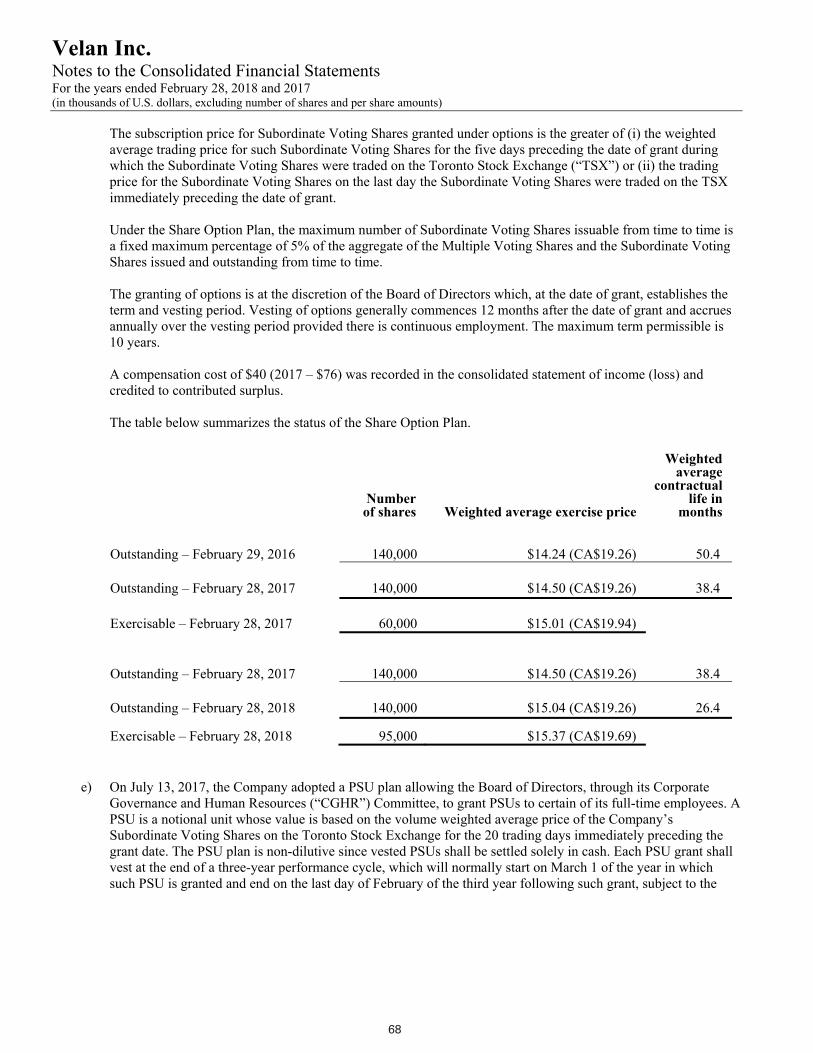
Velan Inc. Notes to the Consolidated Financial Statements For the years ended February 28, 2018 and 2017 (in thousands of U.S. dollars, excluding number of shares and per share amounts)
The subscription price for Subordinate Voting Shares granted under options is the greater of (i) the weighted average trading price for such Subordinate Voting Shares for the five days preceding the date of grant during which the Subordinate Voting Shares were traded on the Toronto Stock Exchange (“TSX”) or (ii) the trading price for the Subordinate Voting Shares on the last day the Subordinate Voting Shares were traded on the TSX immediately preceding the date of grant. Under the Share Option Plan, the maximum number of Subordinate Voting Shares issuable from time to time is a fixed maximum percentage of 5% of the aggregate of the Multiple Voting Shares and the Subordinate Voting Shares issued and outstanding from time to time. The granting of options is at the discretion of the Board of Directors which, at the date of grant, establishes the term and vesting period. Vesting of options generally commences 12 months after the date of grant and accrues annually over the vesting period provided there is continuous employment. The maximum term permissible is 10 years. A compensation cost of $40 (2017 – $76) was recorded in the consolidated statement of income (loss) and credited to contributed surplus. The table below summarizes the status of the Share Option Plan.
Number of shares Weighted average exercise price
Weighted average
contractual life in
months
Outstanding – February 29, 2016 140,000 $14.24 (CA$19.26) 50.4 Outstanding – February 28, 2017 140,000 $14.50 (CA$19.26) 38.4
Exercisable – February 28, 2017
60,000 $15.01 (CA$19.94) Outstanding – February 28, 2017 140,000 $14.50 (CA$19.26) 38.4 Outstanding – February 28, 2018 140,000 $15.04 (CA$19.26) 26.4
Exercisable – February 28, 2018 95,000 $15.37 (CA$19.69)
e) On July 13, 2017, the Company adopted a PSU plan allowing the Board of Directors, through its Corporate Governance and Human Resources (“CGHR”) Committee, to grant PSUs to certain of its full-time employees. A PSU is a notional unit whose value is based on the volume weighted average price of the Company’s Subordinate Voting Shares on the Toronto Stock Exchange for the 20 trading days immediately preceding the grant date. The PSU plan is non-dilutive since vested PSUs shall be settled solely in cash. Each PSU grant shall vest at the end of a three-year performance cycle, which will normally start on March 1 of the year in which such PSU is granted and end on the last day of February of the third year following such grant, subject to the
68

Velan Inc. Notes to the Consolidated Financial Statements For the years ended February 28, 2018 and 2017 (in thousands of U.S. dollars, excluding number of shares and per share amounts)
achievement of certain performance objectives over such cycle, as determined by the Company’s CGHR Committee. As at February 28, 2018, the Company had a total of 25,250 (2017 – nil) PSUs outstanding. A compensation cost of $82 (2017 – nil) was recorded in the consolidated statement of income (loss) and credited to accounts payable and accrued liabilities. No payments have been made in relation to PSUs since the inception of the plan and no PSUs have vested as at February 28, 2018.
f) On July 13, 2017, the Company adopted a DSU plan allowing the Board of Directors, through its CGHR Committee, to grant DSUs to certain of its independent directors and full-time employees. A DSU is a notional unit whose value is based on the volume weighted average price of the Company’s Subordinate Voting Shares on the Toronto Stock Exchange for the 20 trading days immediately preceding the grant date. The DSU plan is non-dilutive since vested DSUs shall be settled solely in cash. Each DSU grant shall vest at the earlier of:
the sixth anniversary of its grant date; or
the day the holder of the DSU attains the retirement age, which, unless otherwise determined by the CGHR Committee, is the earliest of age 65, or the age at which the combination of years of service at the Company plus his or her age is equal to 75, being understood that the retirement age shall not be less than 55 years old.
For more certainty, a grant made to an independent director or full-time employee who has reached the retirement age will be deemed immediately vested, unless otherwise determined by the CGHR Committee at or after the time of grant. Notwithstanding the foregoing, grants of DSUs made to non-employee directors of the Company shall vest on their grant date. As at February 28, 2018, the Company had a total of 12,464 (2017 – nil) DSUs outstanding. A compensation cost of $78 (2017 – nil) was recorded in the consolidated statement of income (loss) and credited to accounts payable and accrued liabilities. No payments have been made in relation to DSUs since the inception of the plan and 4,918 (2017 – nil) DSUs have vested as at February 28, 2018.
69

Velan Inc. Notes to the Consolidated Financial Statements For the years ended February 28, 2018 and 2017 (in thousands of U.S. dollars, excluding number of shares and per share amounts)
14 Foreign exchange Foreign exchange gains (losses) realized on the translation of foreign currency balances, transactions and the fair value of foreign currency financial derivatives and embedded derivatives during the fiscal year are included in sales, cost of sales, and other income (loss) and amounted to:
2018
$ 2017
$
Sales (1,212) 56Cost of sales (1,215) 949Other income (loss) (1,823) 496
15 Cost of sales
2018
$ 2017
$
Change in inventories of finished goods and work in progress 10,868 (17,467)Raw materials and consumables used 133,498 141,335Employee expenses, excluding scientific research investment tax credits
(note 17) 75,072 73,657 Depreciation and amortization (notes 7, 8 and 19) 11,347 12,057Movement in inventory provision – net (note 5) 828 2,146Foreign exchange loss (gain) (note 14) 1,215 (949)Other production overhead costs 36,550 32,470
269,378 243,249
16 Administration costs 2018
$ 2017
$
Employee expenses, excluding scientific research investment tax credits (note 17) 42,757 39,467
Scientific research investment tax credits (notes 17 and 18) (2,978) (2,999)Commissions 7,619 5,293Freight to customers 4,344 4,120Professional fees 13,509 13,087Movement in allowance for doubtful accounts (note 25) (354) (398)Depreciation and amortization (notes 7, 8 and 19) 1,530 1,653Other 19,010 15,645
85,437 75,868
Velan Inc. Notes to the Consolidated Financial Statements For the years ended February 28, 2018 and 2017 (in thousands of U.S. dollars, excluding number of shares and per share amounts)
17 Employee expenses
2018
$ 2017
$ Wages and salaries 84,259 80,538 Social security costs 27,732 26,271Scientific research investment tax credits (note 18) (2,978) (2,999)Share-based compensation (note 13(d), (e) and (f)) 200 76Other 5,638 6,239
114,851 110,125
18 Research and development expenses
Research and development expenses are included in cost of sales and administration costs and consist of the following:
2018 $
2017$
Research and development expenditures 9,608 7,969Less: Scientific research and development investment tax credits (2,978) (2,999)
6,630 4,970
19 Depreciation and amortization costs
Depreciation and amortization costs are included in cost of sales and administration costs and consist of the following:
2018
$ 2017
$
Depreciation of property, plant and equipment 11,035 11,943Amortization of intangible assets 1,842 1,767
12,877 13,710
70

Velan Inc. Notes to the Consolidated Financial Statements For the years ended February 28, 2018 and 2017 (in thousands of U.S. dollars, excluding number of shares and per share amounts)
17 Employee expenses
2018
$ 2017
$ Wages and salaries 84,259 80,538 Social security costs 27,732 26,271Scientific research investment tax credits (note 18) (2,978) (2,999)Share-based compensation (note 13(d), (e) and (f)) 200 76Other 5,638 6,239
114,851 110,125
18 Research and development expenses
Research and development expenses are included in cost of sales and administration costs and consist of the following:
2018 $
2017$
Research and development expenditures 9,608 7,969Less: Scientific research and development investment tax credits (2,978) (2,999)
6,630 4,970
19 Depreciation and amortization costs
Depreciation and amortization costs are included in cost of sales and administration costs and consist of the following:
2018
$ 2017
$
Depreciation of property, plant and equipment 11,035 11,943Amortization of intangible assets 1,842 1,767
12,877 13,710
71

Velan Inc. Notes to the Consolidated Financial Statements For the years ended February 28, 2018 and 2017 (in thousands of U.S. dollars, excluding number of shares and per share amounts)
20 Income taxes
2018 $
2017$
Current taxes: Current tax on profits for the year 8,929 4,533 Adjustments in respect of prior years - (26)
8,929 4,507
Deferred taxes:
Origination and reversal of temporary differences (8,568) 314 Adjustments in respect of prior years - (141) (8,568) 173
Income tax expense 361 4,680 The taxes on the Company’s income before taxes differ from the amount that would arise using the statutory tax rates applicable to income of the consolidated entities as follows:
2018 $
2017$
Income tax at statutory rate of 26.78% (2017 – 26.88%) (4,958) 3,493
Tax effects of:
Difference in statutory tax rates in foreign jurisdictions 1,396 1,527 Effect of U.S. Tax Reform* 4,259 - Taxable foreign exchange gain (303) (344)Losses not tax effected 1,151 1,552 Losses utilized not previously tax effected - (444)Benefit attributable to a financing structure (917) (927)Other (267) (177)
Income tax expense 361 4,680 * U.S. Tax Reform was substantially enacted on December 22, 2017 under its official name “An Act to Provide for Reconciliation Pursuant to Titles II and V of the Concurrent Resolution on the Budget for Fiscal Year 2018”. As a result of the enactment of this legislation, the Company’s U.S. subsidiary recorded a one-time tax expense of $4,259, of which $2,258 is due to the new mandatory repatriation tax and $2,001 is due to the effect of the tax rate reduction on its net deferred income tax assets.
72

Velan Inc. Notes to the Consolidated Financial Statements For the years ended February 28, 2018 and 2017 (in thousands of U.S. dollars, excluding number of shares and per share amounts)
The analysis of deferred tax assets and deferred tax liabilities is as follows:
2018 $
2017$
Deferred income tax assets: To be realized after more than 12 months 17,479 8,631To be realized within 12 months 4,555 4,320
Deferred income tax liabilities: To be realized after more than 12 months (2,272) (2,279)To be realized within 12 months (617) (505)
Net deferred income tax asset 19,145 10,167 The movement of the net deferred income tax asset account is as follows:
2018 $
2017$
Balance – Beginning of year 10,167 10,129Recovery to consolidated statement of income 8,568 173Exchange differences 410 (135)
Balance – End of year 19,145 10,167 The significant components of the net deferred income tax asset are as follows:
2018 $
2017$
Property, plant and equipment (2,917) (4,897)Intangible assets (3,180) (3,141)Non-deductible provisions and reserves 8,034 7,538 Investment tax credits (1,505) (1,184)Inventories 8,836 10,107 Non-capital loss carryforwards 9,505 2,920Other 372 (1,176)
19,145 10,167 The Company did not recognize deferred income tax assets of $3,287 (2017 – $2,779) in respect of non-capital losses amounting to $14,086 (2017 – $11,646) that can be carried forward to reduce taxable income in future years. These losses expire between 2021 and indefinitely.
73

Velan Inc. Notes to the Consolidated Financial Statements For the years ended February 28, 2018 and 2017 (in thousands of U.S. dollars, excluding number of shares and per share amounts)
The Company did not recognize deferred income tax assets of $368 (2017 – $369) in respect of capital losses amounting to $2,745 (2017 – $2,745) that can be carried forward indefinitely against future taxable capital gains. Deferred tax liabilities of $6,594 (2017 – $7,475) have not been recognized for the withholding tax and other taxes that would be payable on the unremitted earnings of certain subsidiaries. Such amounts are not expected to reverse in the foreseeable future. Unremitted earnings as at February 28, 2018 totalled $295,379 (2017 – $317,598).
21 Earnings (loss) per share
a) Basic
Basic earnings per share is calculated by dividing the net income (loss) attributable to the Subordinate and Multiple Voting shareholders by the weighted average number of Subordinate and Multiple Voting Shares outstanding during the year.
2018
2017
Net income (loss) attributable to Subordinate and Multiple Voting
shareholders $(17,811) $7,737 Weighted average number of Subordinate and Multiple Voting Shares
outstanding 21,640,632 21,722,089
Basic earnings (loss) per share $(0.82) $0.36
b) Diluted
Diluted earnings per share is calculated by adjusting the weighted average number of Subordinate and Multiple Voting Shares outstanding to assume conversion of all dilutive potential Subordinate and Multiple Voting Shares. The Company has one category of dilutive potential Subordinate and Multiple Voting Shares: stock options. For the stock options, a calculation is done to determine the number of Subordinate and Multiple Voting Shares that could have been acquired at fair value (determined as the average market share price of the Company’s outstanding Subordinate and Multiple Voting Shares for the period), based on the exercise prices attached to the stock options. The number of Subordinate and Multiple Voting Shares calculated above is compared with the number of Subordinate and Multiple Voting Shares that would have been issued assuming exercise of the stock options.
74

Velan Inc. Notes to the Consolidated Financial Statements For the years ended February 28, 2018 and 2017 (in thousands of U.S. dollars, excluding number of shares and per share amounts)
2018
2017
Net income (loss) attributable to Subordinate and Multiple Voting shareholders $(17,811) $7,737
Weighted average number of Subordinate and Multiple Voting Shares
outstanding 21,640,632 21,722,089 Adjustments for stock options - 5,608 Weighted average number of Subordinate and Multiple Voting Shares for
diluted earnings (loss) per share 21,640,632 21,727,697
Diluted earnings (loss) per share $(0.82) $0.36
As at February 28, 2018, 140,000 stock options have an antidilutive effect (2017 – nil).
22 Commitments and contingencies
a) In the normal course of business, the Company issues performance bond guarantees related to product warranty and on-time delivery as well as advance payment guarantees and bid bonds. As at February 28, 2017, the aggregate maximum value of these guarantees, if exercised, amounted to $80,437 (2017 –$79,145). The guarantees expire as follows:
$ February 28, 2019 29,037February 29, 2020 13,434February 28, 2021 15,948February 28, 2022 4,654February 28, 2023 443Subsequent years 16,921
80,437
b) The Company has outstanding purchase commitments with foreign suppliers, due within one year, amounting to
$3,430 (2017 – $3,356), which are covered by letters of credit.
c) Future minimum payments under operating leases (related mainly to premises and machinery) are as follows:
75

Velan Inc. Notes to the Consolidated Financial Statements For the years ended February 28, 2018 and 2017 (in thousands of U.S. dollars, excluding number of shares and per share amounts)
$ February 28, 2019 1,628February 29, 2020 1,584February 28, 2021 853February 28, 2022 272February 28, 2023 8
4,345
d) Two of the Company’s U.S. subsidiaries have been named as defendants in a number of asbestos-related legal
proceedings pertaining to products they formerly sold. Management believes it has a strong defence, and the subsidiaries have previously been dismissed from a number of similar cases. Because of the many uncertainties inherent in predicting the outcome of these proceedings, as well as the course of asbestos litigation in the United States, management believes that it is not possible to make an estimate of the subsidiaries’ asbestos liability. Accordingly, no provision has been set up in the accounts.
During the year ended February 28, 2018, legal and related costs for these matters amounted to $8,213 (2017 – $6,839).
e) Lawsuits and proceedings or claims arising from the normal course of operations are pending or threatened against the Company. Although at this time it is not possible to determine the outcome based on the facts currently known, the Company does not believe that the ultimate outcome will have a material adverse effect on its financial position, results of operations or liquidity. No provision has been set up in the accounts. On December 3, 2014, San Diego Gas & Electric Company (“SDG”) filed a claim against Velan Valve Corp., a wholly-owned subsidiary of the Company, in the Superior Court of the State of California, concerning high pressure valves supplied to SDG and installed at its Palomar Energy Center (“Facility”). This lawsuit alleges damages to the Facility in excess of $9,000 related to allegedly defective valves supplied by Velan Valve Corp. The claim is for alleged strict product liability and alleged negligence. It is the Company’s position that this claim is without merit. The Company is vigorously defending its position and is undertaking all actions necessary to protect its reputation. While the Company cannot predict the final outcome of this claim, based on information currently available, the Company believes the resolution of this claim will not have a material adverse effect on its financial position, results of operations or liquidity.
76

Velan Inc. Notes to the Consolidated Financial Statements For the years ended February 28, 2018 and 2017 (in thousands of U.S. dollars, excluding number of shares and per share amounts)
23 Related party transactions
Transactions and balances with related parties occur in the normal course of business. Related party transactions and balances not otherwise disclosed separately in these consolidated financial statements are as follows:
2018 $
2017$
Affiliated company owned by certain relatives of controlling shareholder Purchases – Material components 1,230 955Sales – Material components - 8
Amount charged by the controlling shareholder to one of the Company’s subsidiaries and certain of its executives Rent based on weekly usage 12 27
Accounts payable and accrued liabilities Affiliated companies 342 72Controlling shareholder - 8
Key management1 compensation Salaries and other short-term benefits 4,291 4,177 Share-based compensation – Options 40 76Share-based compensation – PSUs & DSUs 160 -
1 Key management includes directors (executive and non-executive) and certain members of senior management.
77

Velan Inc. Notes to the Consolidated Financial Statements For the years ended February 28, 2018 and 2017 (in thousands of U.S. dollars, excluding number of shares and per share amounts)
24 Segment reporting
The Company reflects its results under a single reportable operating segment. The geographic distribution of its sales and assets is as follows:
February 28, 2018
February 28, 2017
United ConsolidationCanada States France Italy Other Adjustment Consolidated
$ $ $ $ $ $ $
SalesCustomers -
Domestic 18,176 81,026 39,095 20,134 24,936 - 183,367 Export 58,033 - 60,485 14,993 21,085 - 154,596
Intercompany (export) 28,461 7,331 445 1,426 32,685 (70,348) -
Total 104,670 88,357 100,025 36,553 78,706 (70,348) 337,963
Property, plant and equipment 33,441 6,688 13,322 2,548 33,865 - 89,864 Intangible assets and goodwill 1,403 - 392 124 67 18,224 20,210 Other identifiable assets 213,553 20,531 169,190 40,953 114,796 (128,904) 430,119
Total identifiable assets 248,397 27,219 182,904 43,625 148,728 (110,680) 540,193
United ConsolidationCanada States France Italy Other Adjustment Consolidated
$ $ $ $ $ $ $
SalesCustomers -
Domestic 15,885 113,640 38,861 1,815 14,270 - 184,471 Export 62,691 - 50,688 13,896 20,031 - 147,306
Intercompany (export) 50,660 17,851 1,522 1,494 64,421 (135,948) -
Total 129,236 131,491 91,071 17,205 98,722 (135,948) 331,777
Property, plant and equipment 34,963 7,577 12,119 2,862 34,014 - 91,535 Intangible assets and goodwill 1,429 - 8,612 8,967 16 - 19,023 Other identifiable assets 213,167 30,581 149,310 40,104 112,976 (137,406) 408,739
Total identifiable assets 249,559 38,158 170,041 51,933 147,006 (137,406) 519,297
Velan Inc. Notes to the Consolidated Financial Statements For the years ended February 28, 2018 and 2017 (in thousands of U.S. dollars, excluding number of shares and per share amounts)
25 Financial risk management
The Company’s activities expose it to a variety of financial risks: market risk (including currency risk, cash flow interest rate risk and fair value interest rate risk), credit risk and liquidity risk. The Company’s overall financial risk management program focuses on mitigating unpredictable financial market risks and their potential adverse effects on the Company’s financial performance. The Company’s financial risk management is generally carried out by the corporate finance team, based on policies approved by the Board of Directors. The identification, evaluation and hedging of the financial risks are the responsibility of the corporate finance team in conjunction with the finance teams of the Company’s subsidiaries. The Company uses derivative financial instruments to hedge certain risk exposures. Use of derivative financial instruments is subject to a policy which requires that no derivative transaction be entered into for the purpose of establishing a speculative or leveraged position (the corollary being that all derivative transactions are to be entered into for risk management purposes only). Overview The Company’s financial instruments and the nature of risks which they may be subject to are set out in the following table:
Risks
Market
Financial instrument Currency Interest rate Credit Liquidity
Cash and cash equivalents x x x Short-term investments x x x Accounts receivable x x Derivative assets x x Bank indebtedness x x xShort-term bank loans x x xAccounts payable and accrued liabilities x xCustomer deposits x xDividend payable x xAccrual for performance guarantees x xDerivative liabilities x xLong-term debt x x x
Market risk Currency risk Currency risk on financial instruments is the risk that the fair value of future cash flows of a financial instrument will fluctuate because of changes in foreign exchange rates. The Company operates internationally and is exposed to foreign exchange risk arising from various currency exposures. Currency risk arises when future commercial transactions and recognized assets and liabilities are denominated in a currency other than a company’s functional currency. The Company has operations with different functional currencies, each of which will be exposed to currency risk based on its specific functional currency.
78

Velan Inc. Notes to the Consolidated Financial Statements For the years ended February 28, 2018 and 2017 (in thousands of U.S. dollars, excluding number of shares and per share amounts)
25 Financial risk management
The Company’s activities expose it to a variety of financial risks: market risk (including currency risk, cash flow interest rate risk and fair value interest rate risk), credit risk and liquidity risk. The Company’s overall financial risk management program focuses on mitigating unpredictable financial market risks and their potential adverse effects on the Company’s financial performance. The Company’s financial risk management is generally carried out by the corporate finance team, based on policies approved by the Board of Directors. The identification, evaluation and hedging of the financial risks are the responsibility of the corporate finance team in conjunction with the finance teams of the Company’s subsidiaries. The Company uses derivative financial instruments to hedge certain risk exposures. Use of derivative financial instruments is subject to a policy which requires that no derivative transaction be entered into for the purpose of establishing a speculative or leveraged position (the corollary being that all derivative transactions are to be entered into for risk management purposes only). Overview The Company’s financial instruments and the nature of risks which they may be subject to are set out in the following table:
Risks
Market
Financial instrument Currency Interest rate Credit Liquidity
Cash and cash equivalents x x x Short-term investments x x x Accounts receivable x x Derivative assets x x Bank indebtedness x x xShort-term bank loans x x xAccounts payable and accrued liabilities x xCustomer deposits x xDividend payable x xAccrual for performance guarantees x xDerivative liabilities x xLong-term debt x x x
Market risk Currency risk Currency risk on financial instruments is the risk that the fair value of future cash flows of a financial instrument will fluctuate because of changes in foreign exchange rates. The Company operates internationally and is exposed to foreign exchange risk arising from various currency exposures. Currency risk arises when future commercial transactions and recognized assets and liabilities are denominated in a currency other than a company’s functional currency. The Company has operations with different functional currencies, each of which will be exposed to currency risk based on its specific functional currency.
79

Velan Inc. Notes to the Consolidated Financial Statements For the years ended February 28, 2018 and 2017 (in thousands of U.S. dollars, excluding number of shares and per share amounts)
When possible, the Company matches cash receipts in a foreign currency with cash disbursements in that same currency. The remaining anticipated net exposure to foreign currencies is hedged. To hedge this exposure, the Company uses foreign currency derivatives, primarily foreign exchange forward contracts. These derivatives are not designated as hedges for accounting purposes. The amounts outstanding as at February 28, 2018 and February 28, 2017 are as follows:
Range of exchange rates Gain (loss)
(In thousands of U.S. dollars) Notional amount
(In thousands of indicated currency)
February 28, 2018
February 28, 2017
February 28, 2018
$
February 28, 2017
$
February 28, 2018
February 28, 2017
Foreign exchange forward contracts Sell US$ for CA$ – 0 to 12 months 1.26-1.28 1.32 (1,558) (615) US$92,000 US$40,000Buy US$ for CA$ – 0 to 12 months 1.25 1.30-1.31 433 337 US$92,000 US$40,000Sell US$ for € – 0 to 12 months 1.18-1.19 1.09-1.16 (2) (20) US$2,190 US$336Buy US$ for € – 0 to 12 months 1.18-1.24 1.06-1.28 92 249 US$4,785 US$4,295Sell US$ for KW – 0 to 12 months - 1,193-1,200 - 99 - US$1,668Sell € for US$ – 0 to 12 months 1.24-1.28 1.06-1.08 (39) (155) €16,297 €16,122Buy € for US$ – 0 to 12 months 1.18 1.06-1.08 64 509 €15,390 €33,600Buy £ for € – 0 to 12 months 0.89 0.84-0.85 (1) (1) £281 £144 Foreign exchange forward contracts are contracts whereby the Company has the obligation to sell or buy the currencies at the strike price. The fair value of the foreign currency instruments is recorded in the consolidated statement of income and reflects the estimated amounts the Company would have paid or received to settle these contracts as at the financial position date. Unrealized gains are recorded as derivative assets and unrealized losses as derivative liabilities on the consolidated statement of financial position. The following table provides a sensitivity analysis of the Company’s most significant foreign exchange exposures related to its net position in the foreign currency financial instruments, which includes cash and cash equivalents, short-term investments bank indebtedness, short-term bank loans, derivative financial instruments, accounts receivable, accounts payable and accrued liabilities, customer deposits, accrual for performance guarantees and long-term debt, including interest payable. A hypothetical strengthening of 5.0% of the following currencies would have had the following impact for the fiscal years ended February 28, 2018 and February 28, 2017:
Net income (loss)
2018 2017$ $
Canadian dollar strengthening against the U.S. dollar (524) (121) Euro strengthening against the U.S. dollar 396 496
A hypothetical weakening of 5.0% of the above currencies would have had the opposite impact for both fiscal years.
80

Velan Inc. Notes to the Consolidated Financial Statements For the years ended February 28, 2018 and 2017 (in thousands of U.S. dollars, excluding number of shares and per share amounts)
For the purposes of the above analysis, foreign exchange exposure does not include the translation of subsidiaries into the Company’s reporting currency. For those subsidiaries whose functional currency is other than the reporting currency (U.S. dollar) of the Company, such exposure would impact other comprehensive income or loss. Cash flow and fair value interest rate risk The Company’s exposure to interest rate risk is related primarily to its credit facilities, long-term debt and cash and cash equivalents. Items at variable rates expose the Company to cash flow interest rate risk, and items at fixed rates expose the Company to fair value interest rate risk. The Company’s long-term debt and credit facilities predominantly bear interest, and its cash and cash equivalents earn interest at variable rates. An assumed 0.5% change in interest rates would have no significant impact on the Company’s net income or cash flows. Credit risk Credit risk is the risk of an unexpected loss if a customer or counterparty to a financial instrument fails to meet its contractual obligations. Credit risk arises primarily from the Company’s trade accounts receivable. The Company’s credit risk related to its trade accounts receivable is concentrated. As at February 28, 2018, four (2017 – four) customers accounted for more than 5% each of its trade accounts receivable, of which one customer accounted for 9.6% (2017 – 8.5%), and the Company’s ten largest customers accounted for 57.3% (2017 – 52.4%). In addition, one customer accounted for 9.86% of the Company’s sales (2017 – 13.3%). In order to mitigate its credit risk, the Company performs a continual evaluation of its customers’ credit and performs specific evaluation procedures on all its new customers. In performing its evaluation, the Company analyzes the ageing of accounts receivable, historical payment patterns, customer creditworthiness and current economic trends. A specific credit limit is established for each customer and reviewed periodically. An allowance for doubtful accounts is recorded when, based on management’s evaluation, the collection of an account receivable is not reasonably certain. The Company is also exposed to credit risk relating to derivative financial instruments, cash and cash equivalents and short-term investments, which it manages by dealing with highly rated financial institutions. The Company’s primary credit risk is limited to the carrying value of the trade accounts receivable and gains on derivative assets.
81

Velan Inc. Notes to the Consolidated Financial Statements For the years ended February 28, 2018 and 2017 (in thousands of U.S. dollars, excluding number of shares and per share amounts)
The table below summarizes the ageing of trade accounts receivable as at:
As at February 28,
2018 $
As at February 28,
2017 $
Current 91,534 77,262Past due 0 to 30 days 12,421 19,330Past due 31 to 90 days 8,546 7,625Past due more than 90 days 18,714 16,508 131,215 120,725Less: Allowance for doubtful accounts 1,088 1,239 Trade accounts receivable 130,127 119,486Other receivables 7,255 6,026 Total accounts receivable 137,382 125,512
The table below summarizes the movements in the allowance for doubtful accounts:
As at February 28,
2018 $
As at February 28,
2017 $
Balance – Beginning of year 1,239 1,653Bad debt expense 212 414Recoveries of trade accounts receivable (444) (598)Write-off of trade accounts receivable (122) (214)Foreign exchange 203 (16) Balance – End of year 1,088 1,239
Liquidity risk
Liquidity risk is the risk that the Company will not be able to meet its financial obligations as they come due. The Company manages its liquidity risk by continually monitoring its future cash requirements. Cash flow forecasting is performed in the operating entities and aggregated by the Company’s corporate finance team. The Company’s policy is to maintain sufficient cash and cash equivalents and available credit facilities in order to meet its present and future operational needs.
82

Velan Inc. Notes to the Consolidated Financial Statements For the years ended February 28, 2018 and 2017 (in thousands of U.S. dollars, excluding number of shares and per share amounts)
The following tables present the Company’s financial liabilities identified by type and future contractual dates of payment as at:
As at February 28, 2018
Total
$
Less than1 year
$
1 to 3 Years
$
4 to 5Years
$
After5 years
$
Long-term debt 22,129 8,151 5,371 3,548 5,059Accounts payable and accrued liabilities 63,411 63,411 - - -Customer deposits 48,963 48,963 - - -Accrual for performance guarantees 32,655 32,655 - - -Bank indebtedness and short-term bank loans 21,922 21,922 - - -Derivative liabilities 1,615 1,615 - - -
As at February 28, 2017
Total
$
Less than1 year
$
1 to 3 Years
$
4 to 5Years
$
After5 years
$
Long-term debt 22,433 7,115 6,214 4,194 4,910Accounts payable and accrued liabilities 60,641 60,641 - - -Customer deposits 43,953 43,953 - - -Accrual for performance guarantees 26,943 26,943 - - -Bank indebtedness and short-term bank loans 9,442 9,442 - - -Derivative liabilities 799 799 - - -
Fair value of financial instruments
The fair value hierarchy has the following levels:
Level 1 – quoted market prices in active markets for identical assets or liabilities;
Level 2 – inputs other than quoted market prices included in Level 1 that are observable for the asset or liability, either directly (as prices) or indirectly (derived from prices); and
Level 3 – unobservable inputs such as inputs for the asset or liability that are not based on observable market data. The level in the fair value hierarchy within which the fair value measurement is categorized in its entirety is determined on the basis of the lowest level input that is significant to the fair value measurement in its entirety.
83

Velan Inc. Notes to the Consolidated Financial Statements For the years ended February 28, 2018 and 2017 (in thousands of U.S. dollars, excluding number of shares and per share amounts)
The fair value of financial assets and financial liabilities measured on the consolidated statements of financial position are as follows:
As at February 28, 2018 Financial position classification and nature
Total$
Level 1$
Level 2 $
Level 3$
Assets Derivative assets 604 - 604 - Liabilities Derivative liabilities 1,615 - 1,615 -
As at February 28, 2017 Financial position classification and nature
Total$
Level 1$
Level 2 $
Level 3$
Assets Derivative assets 1,202 - 1,202 - Liabilities Derivative liabilities 799 - 799 -
Fair value measurements of the Company’s derivative assets and liabilities are classified under Level 2 because such measurements are determined using published market prices or estimates based on observable inputs such as interest rates, yield curves, and spot and future exchange rates. The carrying value of the Company’s financial instruments is considered to approximate fair value, unless otherwise indicated.
26 Capital management
The Company’s capital management strategy is designed to maintain strong liquidity in order to pursue its organic growth strategy, undertake selective acquisitions and provide an appropriate investment return to its shareholders while taking a conservative approach to financial leveraging. The Company’s financial strategy is designed to meet the objectives stated above and to respond to changes in economic conditions and the risk characteristics of underlying assets. In order to maintain or adjust its capital structure, the Company may issue or repurchase shares, raise or repay debt, vary the amount of dividends paid to shareholders or undertake any other activities it considers appropriate under the circumstances. The Company monitors capital on the basis of its total debt-to-equity ratio. Total debt consists of all interest-bearing debt, and equity is defined as total equity.
84

Velan Inc. Notes to the Consolidated Financial Statements For the years ended February 28, 2018 and 2017 (in thousands of U.S. dollars, excluding number of shares and per share amounts)
The total debt-to-equity ratio was as follows:
As at February 28,
2018 $
As at February 28,
2017 $
Bank indebtedness 20,848 7,792 Short-term bank loans 1,074 1,650 Current portion of long-term debt 8,151 7,115 Long-term debt 13,978 15,318 Total debt 44,051 31,875 Equity 321,617 331,911 Total debt-to-equity ratio 13.7% 9.6%
The Company’s objective is to conservatively manage the total debt-to-equity ratio and to maintain funding capacity for potential opportunities. The Company’s financial objectives and strategy as described above have remained unchanged since the last reporting period. These objectives and strategies are reviewed annually or more frequently if the need arises. The Company is in compliance with all covenants related to its debt and credit facilities, and is not subject to any capital requirements imposed by a regulator.
27 Adjustments to reconcile net income (loss) to cash provided by (used in) operating activities
2018$
2017$
Depreciation of property, plant and equipment 11,035 11,943 Amortization of intangible assets 1,842 1,767 Deferred income taxes (8,568) 173Share-based compensation expense 40 76 Gain on disposal of property, plant and equipment (87) (109)Net change in derivative assets and liabilities 1,595 (1,751)Net change in other liabilities 1,137 (1,832)
6,994 10,267
85

Velan Inc. Notes to the Consolidated Financial Statements For the years ended February 28, 2018 and 2017 (in thousands of U.S. dollars, excluding number of shares and per share amounts)
28 Changes in non-cash working capital items
2018$
2017$
Accounts receivable (10,349) (5,946)Inventories 2,594 (10,572)Income taxes recoverable (756) (1,472)Deposits and prepaid expenses (724) 195Accounts payable and accrued liabilities 3,159 (2,303)Income tax payable 3,743 (4,802)Customer deposits 5,652 15,822Provisions 223 1,266Accrual for performance guarantees 6,444 (3,622) 9,986 (11,434)
29 Net debt reconciliation
2018 2017$ $
Cash and cash equivalents 85,391 84,019 Long-term debt - repayable within one year (including Bank indebtedness and Short-term bank loans)
(30,073) (16,557)
Long-term debt - repayable after one year (13,978) (15,318)Net debt 41,340 52,144
Cash and cash equivalents 85,391 84,019 Gross debt - fixed interest rates (21,411) (21,003)Gross debt - variable interest rates (22,640) (10,872)Net debt 41,340 52,144
O ther Assets
Cash and cash equivalents /
Bank indebtedness
Short-term bank loans and current portion
of long-term debt
Long-term debt Total
Net debt as at March 1st, 2017 76,227 (8,766) (15,318) 52,144
Cash flows (19,705) 2,578 1,204 (15,923)
Foreign exchange adjustments 8,021 (443) (1,238) 6,340
Other non-cash movements - (2,595) 1,374 (1,221)
Net debt as at February 28th, 2018 64,543 (9,226) (13,978) 41,340
O ther Liabilities
86

Directors and officers
Corporate directors
T. Velan Chairman of the Board
W. Sheffield Lead Director
P. Velan Director
R. Velan Director
C. Hooper Director
J. Latendresse Director
Y. Leduc Director
K. MacKinnon Director
Corporate officers
Y. Leduc President and Chief Executive Officer
I. Velan Special Advisor to the President
M. Allen Executive Vice-President, Manufacturing Operations and Global Supply Chain
W. Maar Executive Vice-President, Global Sales and Overseas Operations
J. Ball Chief Financial Officer
V. Apostolescu Vice-President, Quality Assurance
S. Bruckert Vice-President, Human Resources and General Counsel, Corporate Secretary
J. Calabrese Vice-President, Technical Sales, Multi-Turn Products
J. Del Buey Vice-President, Technical Sales, Quarter-Turn Products
P. Dion Vice-President, Sales, Process Industries
P. Lee Vice-President, Commercial Sales (Eastern Division)
G. Perez Vice-President, Product Technology and Strategic Initiatives
C. Pogue Vice-President, Commercial Sales (Western Division)
R. Sossoyan Vice-President, Global Financial Reporting
D. Tran Vice-President, Engineering
D. Velan Vice-President, Marketing
R. Velan Vice-President, Customer Service
S. Velan Vice-President, Information Technology and Strategic Planning
87

Shareholder information
Head office7007 Côte-de-LiesseMontreal, Quebec, Canada H4T 1G2
Websitewww.velan.com
Investor relationsJohn D. BallChief Financial Officer7007 Côte-de-Liesse, Montreal, Quebec, Canada H4T 1G2 Tel.: (514) 748-7743, Ext. 5537Fax: (514) 748-8635
AuditorsPricewaterhouseCoopers LLP
Transfer agentCST Trust Company
Shares outstanding as at February 28, 20176,055,368 Subordinate Voting Shares 15,566,567 Multiple Voting Shares
ListingSymbol: VLN
Price rangeHigh CA $20.49Low CA $17.00
Closing on February 28, 2017: CA $17.55
Annual meeting The Annual Meeting of Shareholders will be held July 12, 2018, at 3:00 p.m. in the Salle Saint-Denis of the:Club Saint James 1145 Union AvenueMontreal, Quebec, Canada H3B 3C2
88
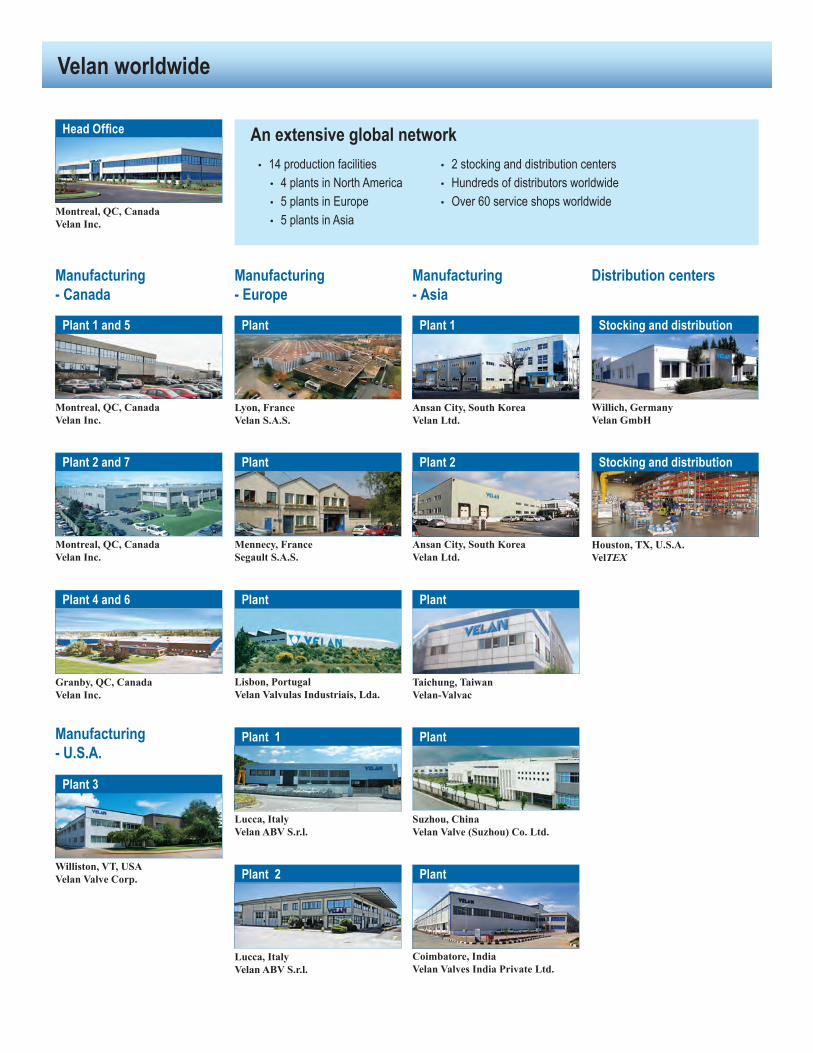
Velan worldwide
Montreal, QC, Canada Velan Inc.
Head Office An extensive global network • 14 production facilities
• 4 plants in North America • 5 plants in Europe • 5 plants in Asia
• 2 stocking and distribution centers • Hundreds of distributors worldwide • Over 60 service shops worldwide
Ansan City, South Korea Velan Ltd.
Manufacturing - Canada
Manufacturing - U.S.A.
Manufacturing - Europe
Manufacturing - Asia
Distribution centers
Willich, Germany Velan GmbH
Lyon, France Velan S.A.S.
Plant Plant 1 Stocking and distribution
Montreal, QC, Canada Velan Inc.
Plant 2 and 7
Mennecy, France Segault S.A.S.
Plant
Ansan City, South Korea Velan Ltd.
Plant 2
Granby, QC, Canada Velan Inc.
Plant 4 and 6
Taichung, Taiwan Velan-Valvac
Plant
Montreal, QC, Canada Velan Inc.
Plant 1 and 5
Suzhou, China Velan Valve (Suzhou) Co. Ltd.
Plant
Williston, VT, USA Velan Valve Corp.
Plant 3
Lucca, Italy Velan ABV S.r.l.
Plant 2
Lisbon, Portugal Velan Valvulas Industriais, Lda.
Plant
Lucca, Italy Velan ABV S.r.l.
Plant 1
Coimbatore, India Velan Valves India Private Ltd.
Plant
Houston, TX, U.S.A. VelTEX
Stocking and distribution

A world leader in industrial valve design and manufacturing supplying to:
• Fossil, nuclear, and cogeneration power
• Oil and gas
• Refining and petrochemicals
• Chemicals
• Pulp and paper
• Subsea
• LNG and cryogenics
• Marine
• Mining
• HVAC
• Water and wastewater
Pour une version française de ce rapport annuel, adressez-vous à:
Velan inc. 7007, chemin de la Côte-de-Liesse, Montréal (Québec) H4T 1G2 Canada
Tél. : +1 514-748-7743 Téléc. : +1 514-748-8635
www.velan.com