Embed Size (px)
Citation preview
Annual Report of the Sri Lanka Labour Force Survey
2004
(With Provincial and District Level Data)
Department of Census and Statistics
Contents
Page No. Preface Table of contents List of tables List of figures 1.0 Introduction 1 2.0 Economically Active Population 1- 3 2.1 District level distribution of labour force 3 3.0 Employed Population 4 -12
3.1 Distribution of employed population by industrial groups 4 - 7 3.2 Employment by employment status 8 - 9 3.3 Employment by Occupation 9 - 11 3.4 Employed distribution by Sector a nd by hours of work 11 - 12
4.0 Unemployed population 12 - 16 4.1 Distribution of unemployed population by sex 12 - 13 4.2 Unemployment by level of education 14 - 15 4.3 Unemployment by province 15 4.4 Unemployment by province by level of education 16
Appendix -1 Technical notes Appendix -2 Survey Questionnaire
Preface Sri Lanka Labour Force Survey was designed to measure the levels and trends of employment, unemployment and labour force in Sri Lanka. This survey is being conducted quarterly, since the first quarter of 1990. Accordingly a sample of about 20,000 housing units were covered in the four quarters of the survey in the year 2004. This annual report for the year 2004 with district and provincial level data based on the total annual sample of the 2004.Even though survey covers all districts in the island, in the year 2004, due to some defects observed in the sampling frame, absolute estimates for Mullativu and Kilinochchi districts are not published in this report. Total estimate also excludes these two districts. However, some rates and percentages pertaining to Mullativu and Kilinochchi districts are published separately. Planning and the execution of the survey was done by the staff of the Sample Surveys Division under the direction of Mr. G.Y.L. Fernando, Director (Sample Surveys) and under the supervision of Mr. J.A.P.Balasuriya, Deputy Director and Mrs. E.A.G. Perera, Senior Statistician. The computer data processing was done by Mrs. W.A.S.M.P. Gunasekara and Mr. H.T. Fonseka, Statistical Officers, of Sample Surveys Division, under the direction of Mrs. Dharma Dissanayaka, Senior Statistician and under the supervision of Mr. P.A. Subawickrama, Statistician using Microcomputers. This publication was organized and prepared by Mrs. Anoma Jayasekara, Senior Statistician under the direction of Mr. G.Y.L. Fernando, Director (Sample Surveys). The Data Processing Division under the direction of Mrs. S.V. Nanayakkara, Director (Data Processing) and under the supervision of Mr. Migara Fernando, Systems Analyst/Programmer, was responsible for the survey data entry and preparation of computer edit and final tabulation programmes. District field staff of the Department who worked on the survey deserve a special word of thanks. They include District Senior Statisticians/ Statisticians and field Statistical Officers, who worked hard at the data collection stage, to make this survey a success. Printing of the report was done at the Printing Division, under the supervision of Mr. S.Hettiarachchie, Senior Statistician. Finally, I wish to express my appreciation to all the respondents of the survey for their co-operation.
A.G.W.Nanayakkara Director General of Census and Statistics
Department of Census and Statistics, 15/12, Maitland Crescent, Colombo 7. 09.01.2006.
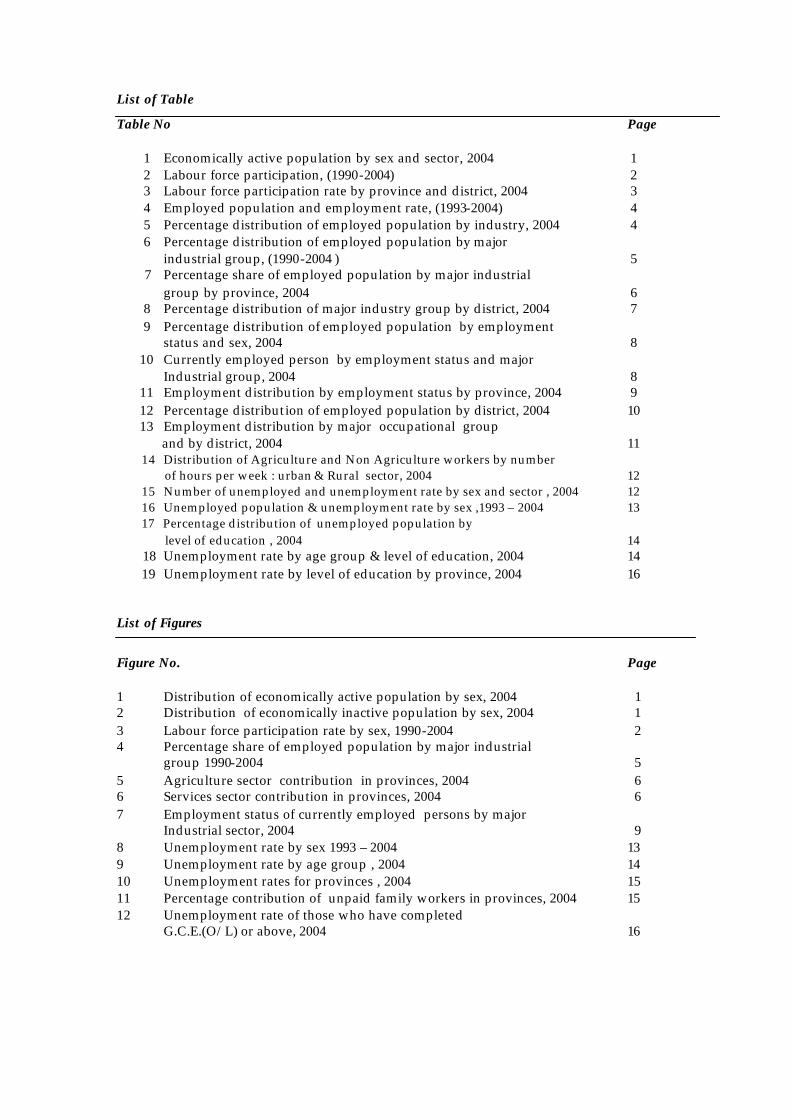
List of Table
Table No Page
1 Economically active population by sex and sector, 2004 1 2 Labour force participation, (1990-2004) 2 3 Labour force participation rate by province and district, 2004 3 4 Employed population and employment rate, (1993-2004) 4 5 Percentage distribution of employed population by industry, 2004 4 6 Percentage distribution of employed population by major
industrial group, (1990-2004 ) 5 7 Percentage share of employed population by major industrial group by province, 2004 6
8 Percentage distribution of major industry group by district, 2004 7 9 Percentage distribution of employed population by employment
status and sex, 2004 8 10 Currently employed person by employment status and major
Industrial group, 2004 8 11 Employment distribution by employment status by province, 2004 9 12 Percentage distribution of employed population by district, 2004 10 13 Employment distribution by major occupational group
and by district, 2004 11 14 Distribution of Agriculture and Non Agriculture workers by number of hours per week : urban & Rural sector, 2004 12 15 Number of unemployed and unemployment rate by sex and sector , 2004 12 16 Unemployed population & unemployment rate by sex ,1993 – 2004 13 17 Percentage distribution of unemployed population by
level of education , 2004 14 18 Unemployment rate by age group & level of education, 2004 14 19 Unemployment rate by level of education by province, 2004 16 List of Figures
Figure No. Page 1 Distribution of economically active population by sex, 2004 1 2 Distribution of economically inactive population by sex, 2004 1 3 Labour force participation rate by sex, 1990-2004 2 4 Percentage share of employed population by major industrial group 1990-2004 5 5 Agriculture sector contribution in provinces, 2004 6 6 Services sector contribution in provinces, 2004 6 7 Employment status of currently employed persons by major Industrial sector, 2004 9 8 Unemployment rate by sex 1993 – 2004 13 9 Unemployment rate by age group , 2004 14 10 Unemployment rates for provinces , 2004 15 11 Percentage contribution of unpaid family workers in provinces, 2004 15 12 Unemployment rate of those who have completed
G.C.E.(O/L) or above, 2004 16
1. Introduction The quarterly Labour Force Survey which is being conducted on a quarterly basis and this sample is adequate to provide estimates of the labour force characteristics quarterly at national level. This annual publication is based on the total sample of about 20,000 housing units covered in the all four quarters of 2004, and covering all island with the intention of providing reasonably accurate estimates of few selected labour force characteristics at provincial and district level. However, due to the limitations of sample size, the district level estimates also may not be obtained with further dissaggregation by demographic variables such as (i) age (ii) level of education etc. Even though survey covers all districts in the island, in the year 2004, due to some defects observed in the sampling frame, absolute estimates for Mullaitivu and Kilinochchi districts are not published in this report. Total estimate also excludes these two districts. However, some rates and percentages pertaining to M ullaitivu and Kilinochchi districts are published separately. 2. Economically Active Population
Table 1 : Economically active population by sex and sector, 2004
Economically Active Population Sector Household population (10 years & over) Total % Male % Female %
Total 16,593,431 8,061,354 100.0 5,372,897 66.7 2,688,457 33.3 Urban 2,425,113 1,087,715 100.0 755,232 69.4 332,483 30.6 Rural 14,168,317 6,973,639 100.0 4,617,665 66.2 2,355,974 33.8
Not in the labour force Sector Household population (10 years & over) Total % Male % Female %
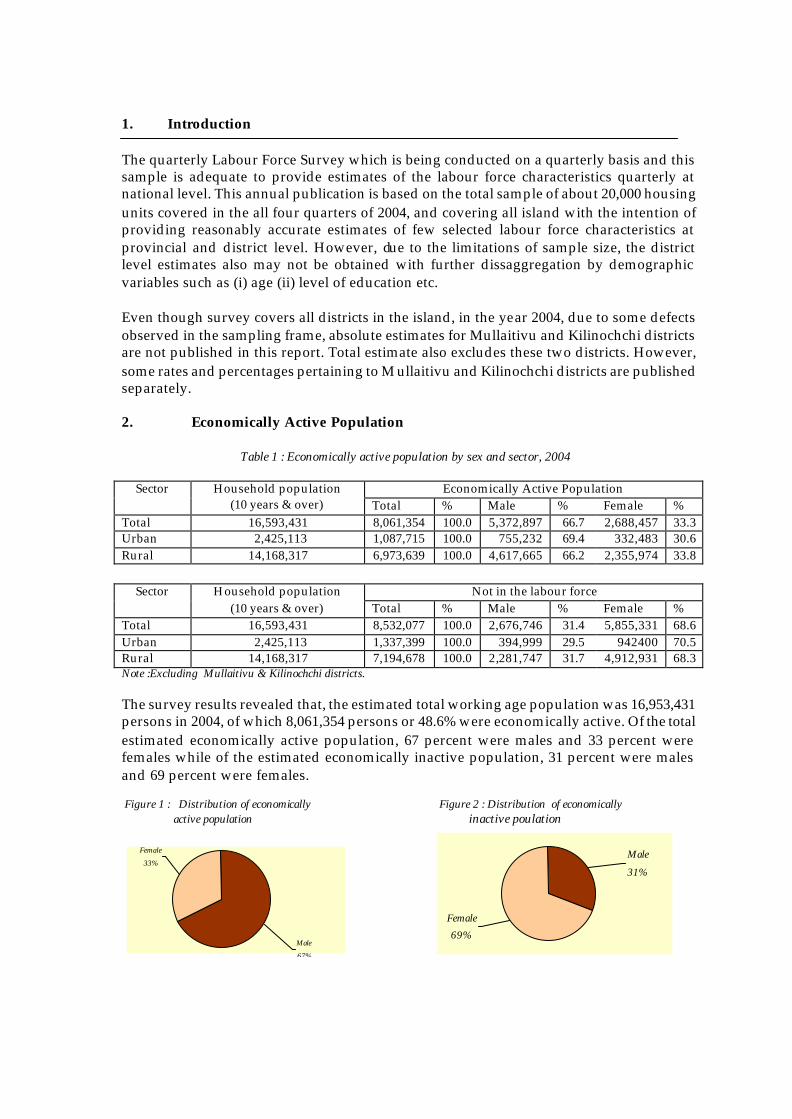
Total 16,593,431 8,532,077 100.0 2,676,746 31.4 5,855,331 68.6 Urban 2,425,113 1,337,399 100.0 394,999 29.5 942400 70.5 Rural 14,168,317 7,194,678 100.0 2,281,747 31.7 4,912,931 68.3 Note :Excluding Mullaitivu & Kilinochchi districts. The survey results revealed that, the estimated total working age population was 16,953,431 persons in 2004, of which 8,061,354 persons or 48.6% were economically active. Of the total estimated economically active population, 67 percent were males and 33 percent were females while of the estimated economically inactive population, 31 percent were males and 69 percent were females. Figure 1 : Distribution of economically Figure 2 : Distribution of economically active population inactive poulation
Male
67%
Female
33%
Female
69%
Male
31%
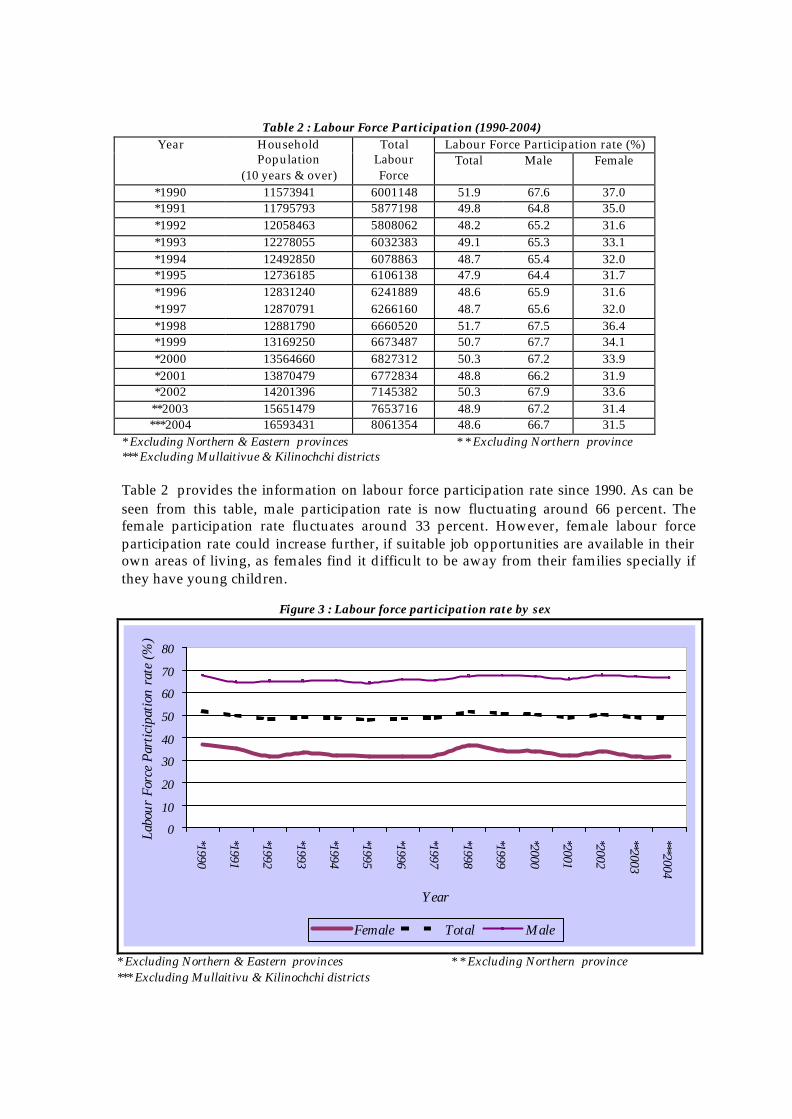
Table 2 : Labour Force Participation (1990-2004)
Labour Force Participation rate (%) Year Household Population
(10 years & over)
Total Labour Force
Total Male Female
*1990 11573941 6001148 51.9 67.6 37.0 *1991 11795793 5877198 49.8 64.8 35.0 *1992 12058463 5808062 48.2 65.2 31.6 *1993 12278055 6032383 49.1 65.3 33.1 *1994 12492850 6078863 48.7 65.4 32.0 *1995 12736185 6106138 47.9 64.4 31.7 *1996 12831240 6241889 48.6 65.9 31.6 *1997 12870791 6266160 48.7 65.6 32.0 *1998 12881790 6660520 51.7 67.5 36.4 *1999 13169250 6673487 50.7 67.7 34.1 *2000 13564660 6827312 50.3 67.2 33.9 *2001 13870479 6772834 48.8 66.2 31.9 *2002 14201396 7145382 50.3 67.9 33.6 **2003 15651479 7653716 48.9 67.2 31.4 ***2004 16593431 8061354 48.6 66.7 31.5
* Excluding Northern & Eastern provinces * * Excluding Northern province *** Excluding Mullaitivue & Kilinochchi districts Table 2 provides the information on labour force participation rate since 1990. As can be seen from this table, male participation rate is now fluctuating around 66 percent. The female participation rate fluctuates around 33 percent. However, female labour force participation rate could increase further, if suitable job opportunities are available in their own areas of living, as females find it difficult to be away from their families specially if they have young children.
Figure 3 : Labour force participation rate by sex
0
10
20
30
40
50
60
70
80
*1990
*1991
*1992
*1993
*1994
*1995
*1996
*1997
*1998
*1999
*2000
*2001
*2002
**2003
***2004
Year
Labo
ur F
orce
Par
ticip
atio
n ra
te (%
)
Female Total Male
* Excluding Northern & Eastern provinces * * Excluding Northern province *** Excluding Mullaitivu & Kilinochchi districts
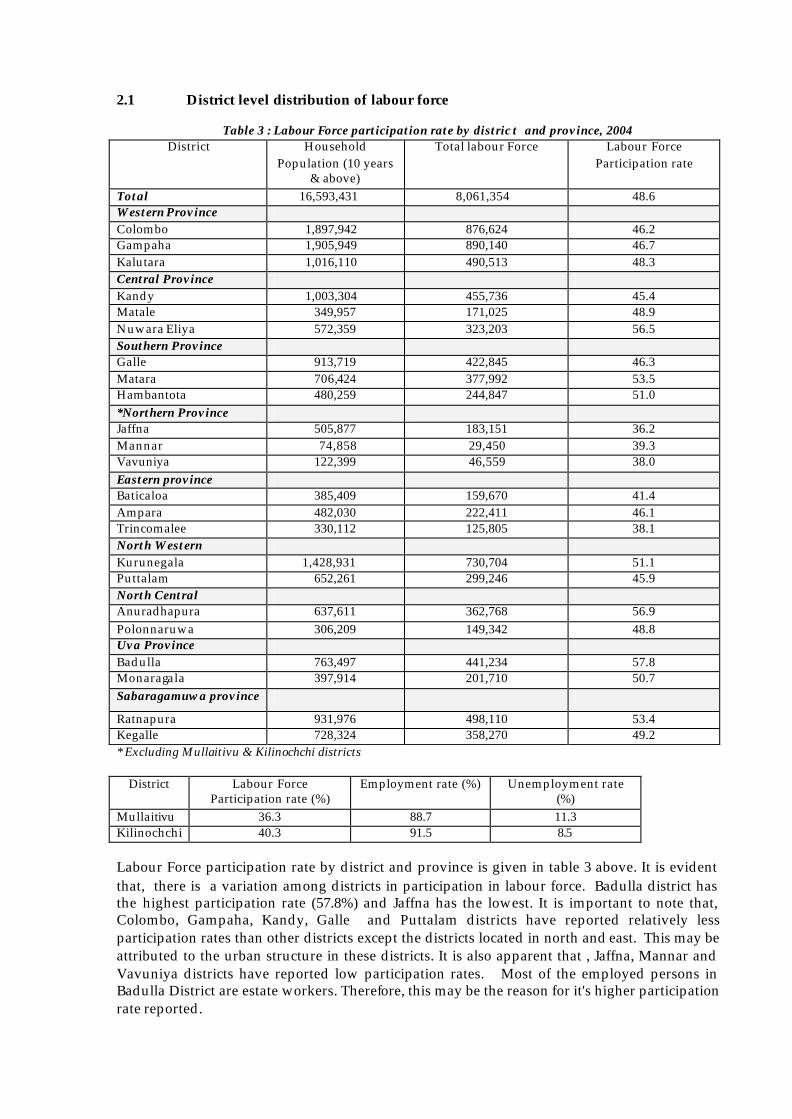
2.1 District level distribution of labour force Table 3 : Labour Force participation rate by distric t and province, 2004
District Household Population (10 years
& above)
Total labour Force Labour Force Participation rate
Total 16,593,431 8,061,354 48.6 Western Province Colombo 1,897,942 876,624 46.2 Gampaha 1,905,949 890,140 46.7 Kalutara 1,016,110 490,513 48.3 Central Province Kandy 1,003,304 455,736 45.4 Matale 349,957 171,025 48.9 Nuwara Eliya 572,359 323,203 56.5 Southern Province Galle 913,719 422,845 46.3 Matara 706,424 377,992 53.5 Hambantota 480,259 244,847 51.0 *Northern Province Jaffna 505,877 183,151 36.2 Mannar 74,858 29,450 39.3 Vavuniya 122,399 46,559 38.0 Eastern province Baticaloa 385,409 159,670 41.4 Ampara 482,030 222,411 46.1 Trincomalee 330,112 125,805 38.1 North Western Kurunegala 1,428,931 730,704 51.1 Puttalam 652,261 299,246 45.9 North Central Anuradhapura 637,611 362,768 56.9 Polonnaruwa 306,209 149,342 48.8 Uva Province Badulla 763,497 441,234 57.8 Monaragala 397,914 201,710 50.7 Sabaragamuwa province
Ratnapura 931,976 498,110 53.4 Kegalle 728,324 358,270 49.2 * Excluding Mullaitivu & Kilinochchi districts
District Labour Force Participation rate (%)
Employment rate (%) Unemployment rate (%)
Mullaitivu 36.3 88.7 11.3 Kilinochchi 40.3 91.5 8.5 Labour Force participation rate by district and province is given in table 3 above. It is evident that, there is a variation among districts in participation in labour force. Badulla district has the highest participation rate (57.8%) and Jaffna has the lowest. It is important to note that, Colombo, Gampaha, Kandy, Galle and Puttalam districts have reported relatively less participation rates than other districts except the districts located in north and east. This may be attributed to the urban structure in these districts. It is also apparent that , Jaffna, Mannar and Vavuniya districts have reported low participation rates. Most of the employed persons in Badulla District are estate workers. Therefore, this may be the reason for it's higher participation rate reported.
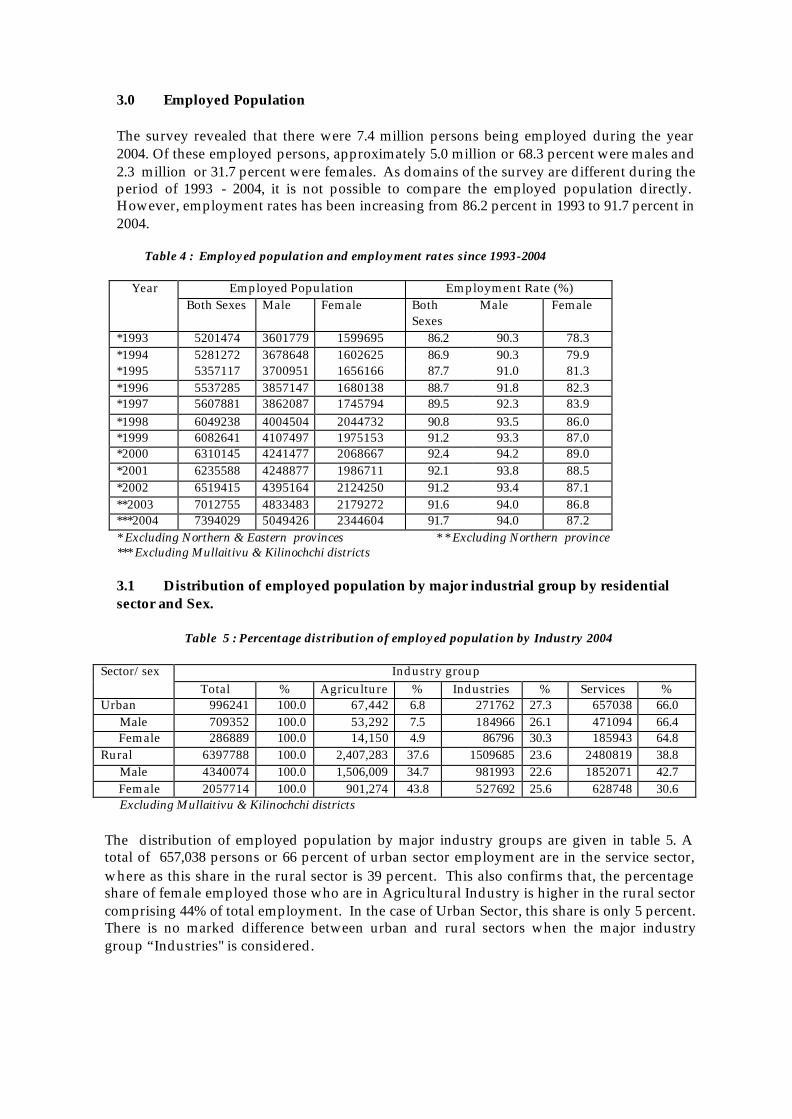
3.0 Employed Population The survey revealed that there were 7.4 million persons being employed during the year 2004. Of these employed persons, approximately 5.0 million or 68.3 percent were males and 2.3 million or 31.7 percent were females. As domains of the survey are different during the period of 1993 - 2004, it is not possible to compare the employed population directly. However, employment rates has been increasing from 86.2 percent in 1993 to 91.7 percent in 2004. Table 4 : Employed population and employment rates since 1993-2004
Employed Population Employment Rate (%) Year Both Sexes Male Female Both
Sexes Male Female
*1993 5201474 3601779 1599695 86.2 90.3 78.3 *1994 5281272 3678648 1602625 86.9 90.3 79.9 *1995 5357117 3700951 1656166 87.7 91.0 81.3 *1996 5537285 3857147 1680138 88.7 91.8 82.3 *1997 5607881 3862087 1745794 89.5 92.3 83.9 *1998 6049238 4004504 2044732 90.8 93.5 86.0 *1999 6082641 4107497 1975153 91.2 93.3 87.0 *2000 6310145 4241477 2068667 92.4 94.2 89.0 *2001 6235588 4248877 1986711 92.1 93.8 88.5 *2002 6519415 4395164 2124250 91.2 93.4 87.1 **2003 7012755 4833483 2179272 91.6 94.0 86.8 ***2004 7394029 5049426 2344604 91.7 94.0 87.2 * Excluding Northern & Eastern provinces * * Excluding Northern province *** Excluding Mullaitivu & Kilinochchi districts 3.1 Distribution of employed population by major industrial group by residential sector and Sex. Table 5 : Percentage distribution of employed population by Industry 2004
Industry group Sector/sex Total % Agriculture % Industries % Services %
Urban 996241 100.0 67,442 6.8 271762 27.3 657038 66.0 Male 709352 100.0 53,292 7.5 184966 26.1 471094 66.4 Female 286889 100.0 14,150 4.9 86796 30.3 185943 64.8 Rural 6397788 100.0 2,407,283 37.6 1509685 23.6 2480819 38.8 Male 4340074 100.0 1,506,009 34.7 981993 22.6 1852071 42.7 Female 2057714 100.0 901,274 43.8 527692 25.6 628748 30.6
Excluding Mullaitivu & Kilinochchi districts
The distribution of employed population by major industry groups are given in table 5. A total of 657,038 persons or 66 percent of urban sector employment are in the service sector, where as this share in the rural sector is 39 percent. This also confirms that, the percentage share of female employed those who are in Agricultural Industry is higher in the rural sector comprising 44% of total employment. In the case of Urban Sector, this share is only 5 percent. There is no marked difference between urban and rural sectors when the major industry group “Industries" is considered.
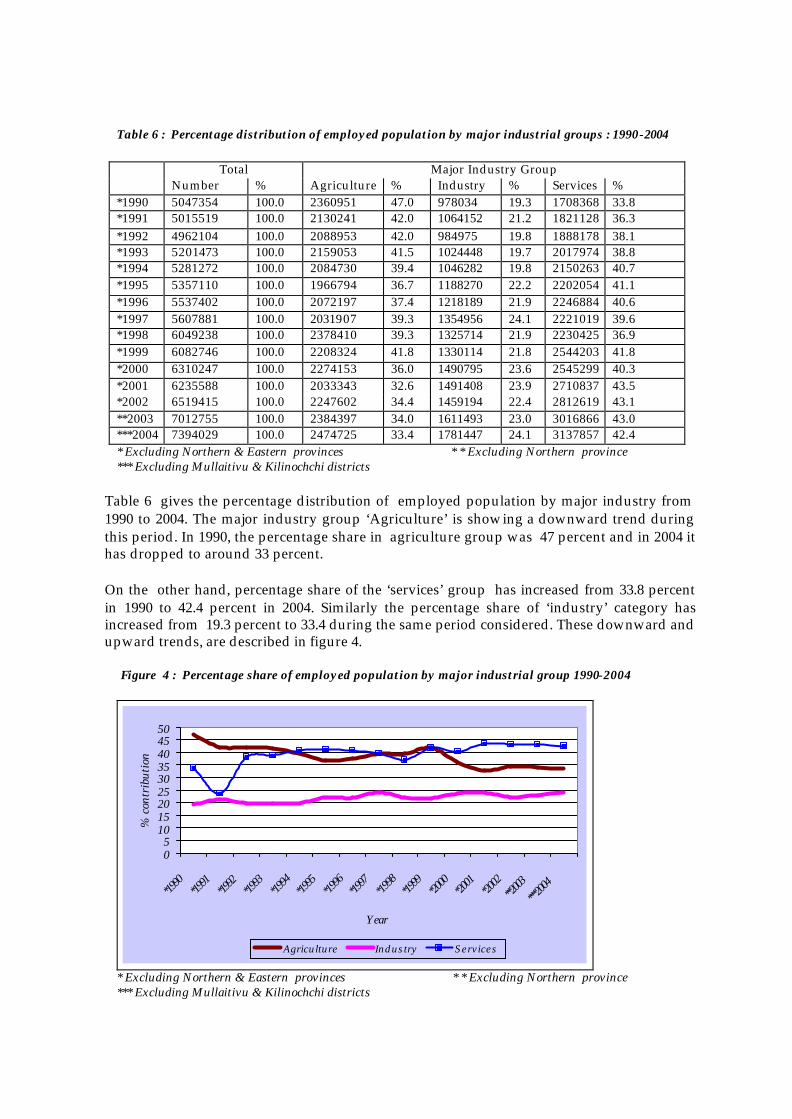
Table 6 : Percentage distribution of employed population by major industrial groups : 1990-2004
Total Major Industry Group Number % Agriculture % Industry % Services % *1990 5047354 100.0 2360951 47.0 978034 19.3 1708368 33.8 *1991 5015519 100.0 2130241 42.0 1064152 21.2 1821128 36.3 *1992 4962104 100.0 2088953 42.0 984975 19.8 1888178 38.1 *1993 5201473 100.0 2159053 41.5 1024448 19.7 2017974 38.8 *1994 5281272 100.0 2084730 39.4 1046282 19.8 2150263 40.7 *1995 5357110 100.0 1966794 36.7 1188270 22.2 2202054 41.1 *1996 5537402 100.0 2072197 37.4 1218189 21.9 2246884 40.6 *1997 5607881 100.0 2031907 39.3 1354956 24.1 2221019 39.6 *1998 6049238 100.0 2378410 39.3 1325714 21.9 2230425 36.9 *1999 6082746 100.0 2208324 41.8 1330114 21.8 2544203 41.8 *2000 6310247 100.0 2274153 36.0 1490795 23.6 2545299 40.3 *2001 6235588 100.0 2033343 32.6 1491408 23.9 2710837 43.5 *2002 6519415 100.0 2247602 34.4 1459194 22.4 2812619 43.1 **2003 7012755 100.0 2384397 34.0 1611493 23.0 3016866 43.0 ***2004 7394029 100.0 2474725 33.4 1781447 24.1 3137857 42.4 * Excluding Northern & Eastern provinces * * Excluding Northern province *** Excluding Mullaitivu & Kilinochchi districts
Table 6 gives the percentage distribution of employed population by major industry from 1990 to 2004. The major industry group ‘Agriculture’ is showing a downward trend during this period. In 1990, the percentage share in agriculture group was 47 percent and in 2004 it has dropped to around 33 percent. On the other hand, percentage share of the ‘services’ group has increased from 33.8 percent in 1990 to 42.4 percent in 2004. Similarly the percentage share of ‘industry’ category has increased from 19.3 percent to 33.4 during the same period considered. These downward and upward trends, are described in figure 4.
Figure 4 : Percentage share of employed population by major industrial group 1990-2004
05
101520253035404550
*1990
*1991
*1992
*1993
*1994
*1995
*1996
*1997
*1998
*1999
*2000
*2001
*2002
**2003
***2004
Year
% c
ontr
ibut
ion
Agriculture Industry Services
* Excluding Northern & Eastern provinces * * Excluding Northern province *** Excluding Mullaitivu & Kilinochchi districts
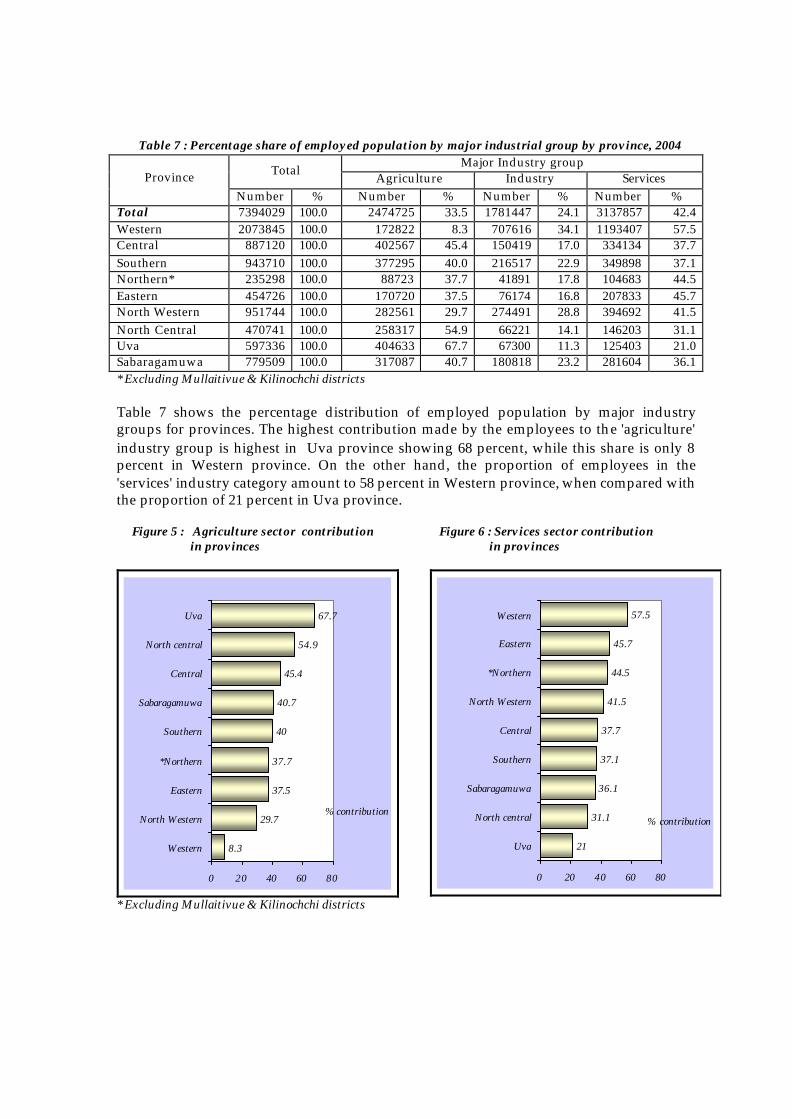
Table 7 : Percentage share of employed population by major industrial group by province, 2004
Major Industry group Total Agriculture Industry Services Province Number % Number % Number % Number %
Total 7394029 100.0 2474725 33.5 1781447 24.1 3137857 42.4 Western 2073845 100.0 172822 8.3 707616 34.1 1193407 57.5 Central 887120 100.0 402567 45.4 150419 17.0 334134 37.7 Southern 943710 100.0 377295 40.0 216517 22.9 349898 37.1 Northern* 235298 100.0 88723 37.7 41891 17.8 104683 44.5 Eastern 454726 100.0 170720 37.5 76174 16.8 207833 45.7 North Western 951744 100.0 282561 29.7 274491 28.8 394692 41.5 North Central 470741 100.0 258317 54.9 66221 14.1 146203 31.1 Uva 597336 100.0 404633 67.7 67300 11.3 125403 21.0 Sabaragamuwa 779509 100.0 317087 40.7 180818 23.2 281604 36.1 * Excluding Mullaitivue & Kilinochchi districts Table 7 shows the percentage distribution of employed population by major industry groups for provinces. The highest contribution made by the employees to the 'agriculture' industry group is highest in Uva province showing 68 percent, while this share is only 8 percent in Western province. On the other hand, the proportion of employees in the 'services' industry category amount to 58 percent in Western province, when compared with the proportion of 21 percent in Uva province. Figure 5 : Agriculture sector contribution in provinces
Figure 6 : Services sector contribution in provinces
8.3
29.7
37.5
37.7
40
40.7
45.4
54.9
67.7
0 20 40 60 80
Western
North Western
Eastern
*Northern
Southern
Sabaragamuwa
Central
North central
Uva
% contribution
* Excluding Mullaitivue & Kilinochchi districts
21
31.1
36.1
37.1
37.7
41.5
44.5
45.7
57.5
0 20 40 60 80
Uva
North central
Sabaragamuwa
Southern
Central
North Western
*Northern
Eastern
Western
% contribution
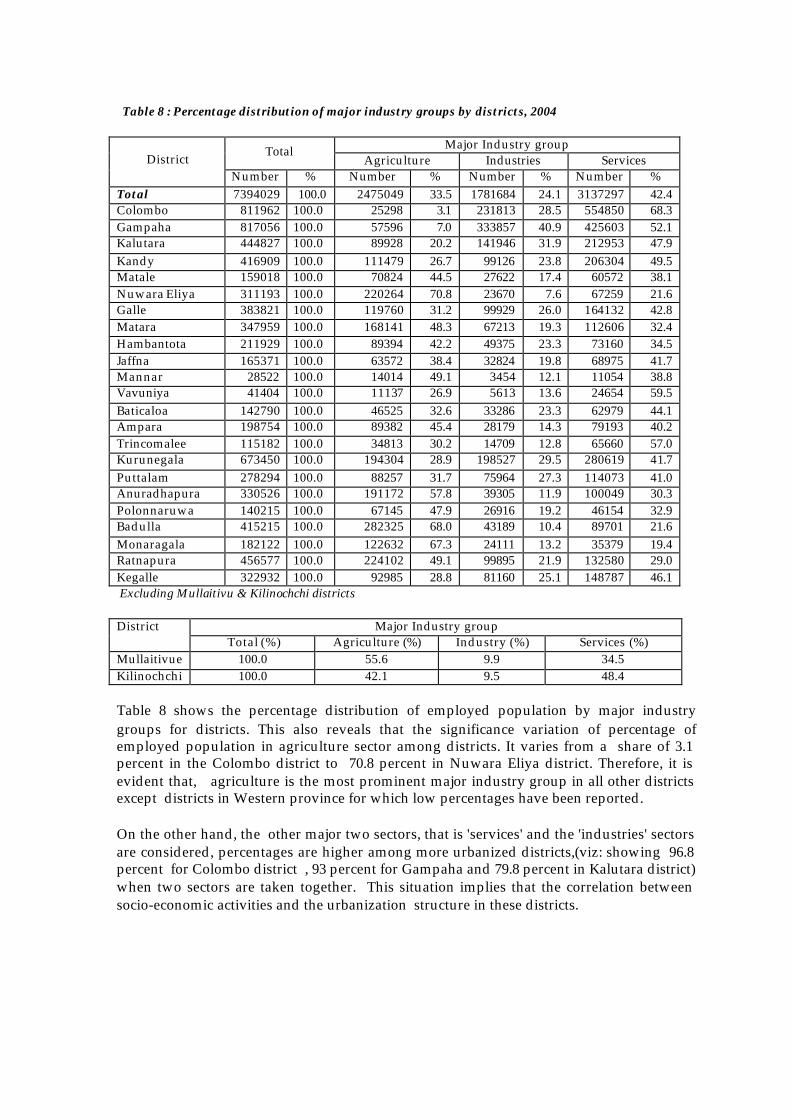
Table 8 : Percentage distribution of major industry groups by districts, 2004
Major Industry group Total Agriculture Industries Services District
Number % Number % Number % Number % Total 7394029 100.0 2475049 33.5 1781684 24.1 3137297 42.4 Colombo 811962 100.0 25298 3.1 231813 28.5 554850 68.3 Gampaha 817056 100.0 57596 7.0 333857 40.9 425603 52.1 Kalutara 444827 100.0 89928 20.2 141946 31.9 212953 47.9 Kandy 416909 100.0 111479 26.7 99126 23.8 206304 49.5 Matale 159018 100.0 70824 44.5 27622 17.4 60572 38.1 Nuwara Eliya 311193 100.0 220264 70.8 23670 7.6 67259 21.6 Galle 383821 100.0 119760 31.2 99929 26.0 164132 42.8 Matara 347959 100.0 168141 48.3 67213 19.3 112606 32.4 Hambantota 211929 100.0 89394 42.2 49375 23.3 73160 34.5 Jaffna 165371 100.0 63572 38.4 32824 19.8 68975 41.7 Mannar 28522 100.0 14014 49.1 3454 12.1 11054 38.8 Vavuniya 41404 100.0 11137 26.9 5613 13.6 24654 59.5 Baticaloa 142790 100.0 46525 32.6 33286 23.3 62979 44.1 Ampara 198754 100.0 89382 45.4 28179 14.3 79193 40.2 Trincomalee 115182 100.0 34813 30.2 14709 12.8 65660 57.0 Kurunegala 673450 100.0 194304 28.9 198527 29.5 280619 41.7 Puttalam 278294 100.0 88257 31.7 75964 27.3 114073 41.0 Anuradhapura 330526 100.0 191172 57.8 39305 11.9 100049 30.3 Polonnaruwa 140215 100.0 67145 47.9 26916 19.2 46154 32.9 Badulla 415215 100.0 282325 68.0 43189 10.4 89701 21.6 Monaragala 182122 100.0 122632 67.3 24111 13.2 35379 19.4 Ratnapura 456577 100.0 224102 49.1 99895 21.9 132580 29.0 Kegalle 322932 100.0 92985 28.8 81160 25.1 148787 46.1 Excluding Mullaitivu & Kilinochchi districts
Major Industry group District Total (%) Agriculture (%) Industry (%) Services (%)
Mullaitivue 100.0 55.6 9.9 34.5 Kilinochchi 100.0 42.1 9.5 48.4 Table 8 shows the percentage distribution of employed population by major industry groups for districts. This also reveals that the significance variation of percentage of employed population in agriculture sector among districts. It varies from a share of 3.1 percent in the Colombo district to 70.8 percent in Nuwara Eliya district. Therefore, it is evident that, agriculture is the most prominent major industry group in all other districts except districts in Western province for which low percentages have been reported. On the other hand, the other major two sectors, that is 'services' and the 'industries' sectors are considered, percentages are higher among more urbanized districts,(viz: showing 96.8 percent for Colombo district , 93 percent for Gampaha and 79.8 percent in Kalutara district) when two sectors are taken together. This situation implies that the correlation between socio-economic activities and the urbanization structure in these districts.
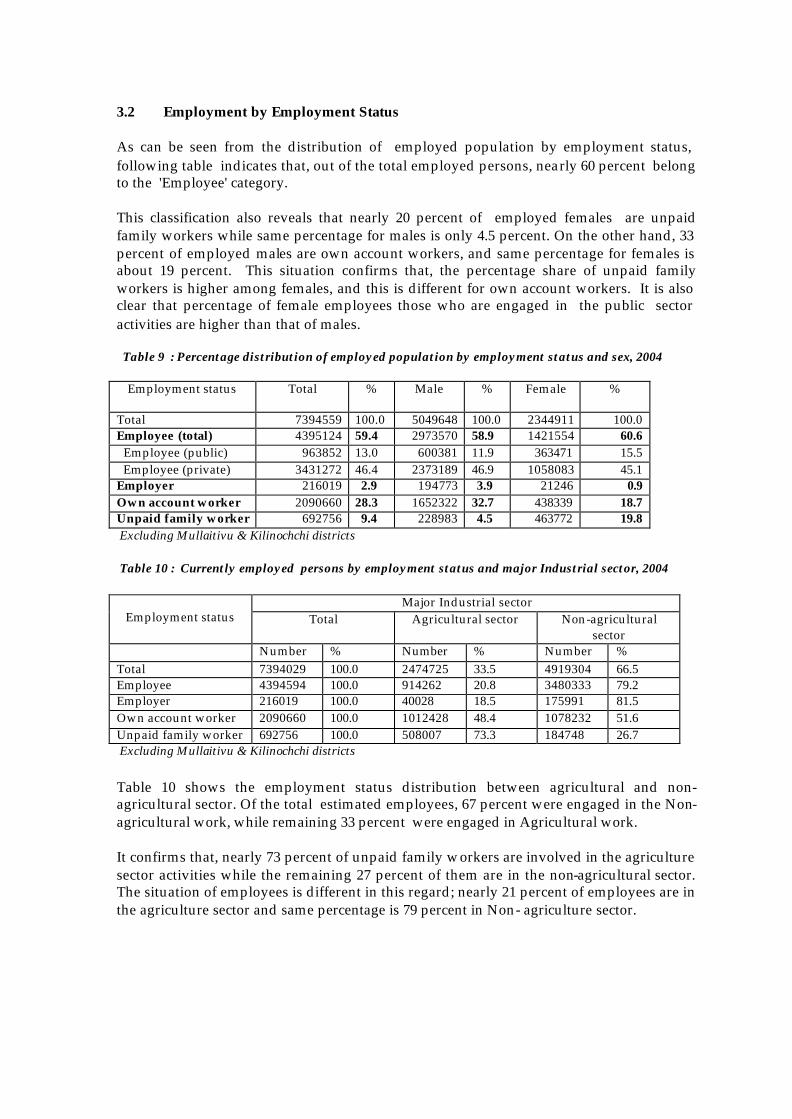
3.2 Employment by Employment Status As can be seen from the distribution of employed population by employment status, following table indicates that, out of the total employed persons, nearly 60 percent belong to the 'Employee' category. This classification also reveals that nearly 20 percent of employed females are unpaid family workers while same percentage for males is only 4.5 percent. On the other hand, 33 percent of employed males are own account workers, and same percentage for females is about 19 percent. This situation confirms that, the percentage share of unpaid family workers is higher among females, and this is different for own account workers. It is also clear that percentage of female employees those who are engaged in the public sector activities are higher than that of males. Table 9 : Percentage distribution of employed population by employment status and sex, 2004
Employment status Total % Male % Female %
Total 7394559 100.0 5049648 100.0 2344911 100.0 Employee (total) 4395124 59.4 2973570 58.9 1421554 60.6 Employee (public) 963852 13.0 600381 11.9 363471 15.5 Employee (private) 3431272 46.4 2373189 46.9 1058083 45.1 Employer 216019 2.9 194773 3.9 21246 0.9 Own account worker 2090660 28.3 1652322 32.7 438339 18.7 Unpaid family worker 692756 9.4 228983 4.5 463772 19.8 Excluding Mullaitivu & Kilinochchi districts Table 10 : Currently employed persons by employment status and major Industrial sector, 2004
Major Industrial sector Employment status Total Agricultural sector Non-agricultural
sector Number % Number % Number % Total 7394029 100.0 2474725 33.5 4919304 66.5 Employee 4394594 100.0 914262 20.8 3480333 79.2 Employer 216019 100.0 40028 18.5 175991 81.5 Own account worker 2090660 100.0 1012428 48.4 1078232 51.6 Unpaid family worker 692756 100.0 508007 73.3 184748 26.7 Excluding Mullaitivu & Kilinochchi districts Table 10 shows the employment status distribution between agricultural and non- agricultural sector. Of the total estimated employees, 67 percent were engaged in the Non-agricultural work, while remaining 33 percent were engaged in Agricultural work. It confirms that, nearly 73 percent of unpaid family workers are involved in the agriculture sector activities while the remaining 27 percent of them are in the non-agricultural sector. The situation of employees is different in this regard; nearly 21 percent of employees are in the agriculture sector and same percentage is 79 percent in Non- agriculture sector.
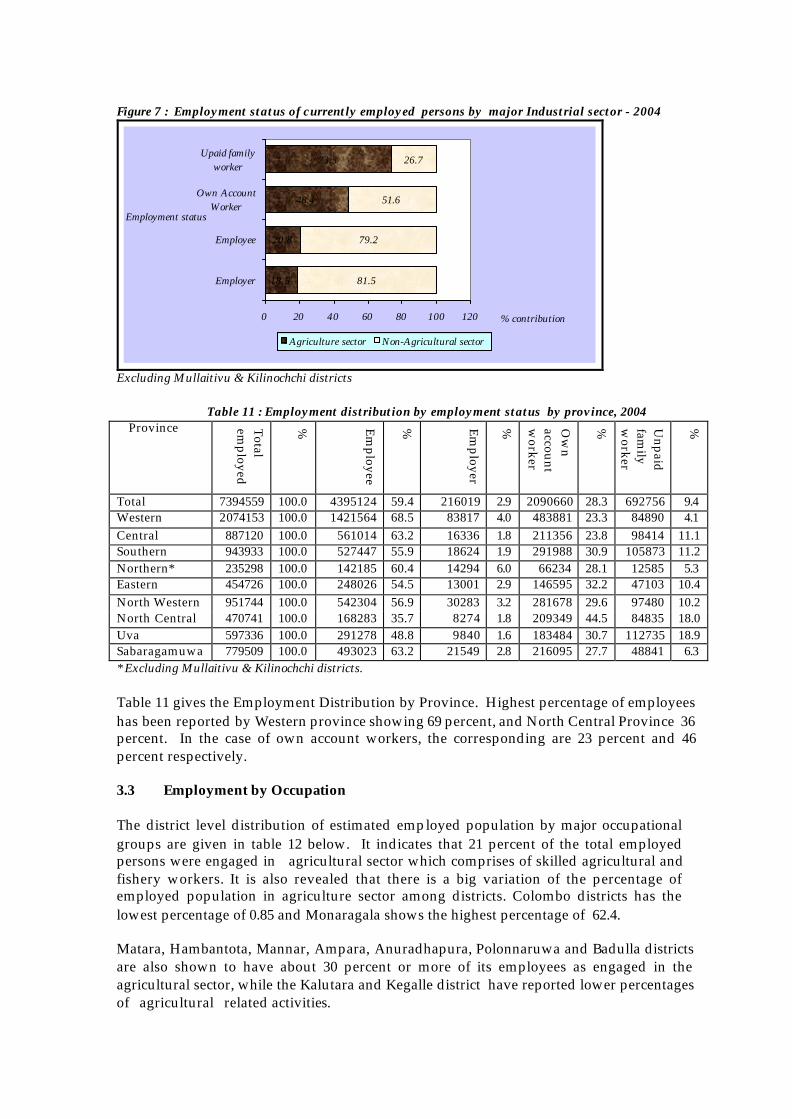
Figure 7 : Employment status of currently employed persons by major Industrial sector - 2004
18.5
48.4
73.3
81.5
79.2
51.6
26.7
20.8
0 20 40 60 80 100 120
Employer
Employee
Own AccountWorker
Upaid familyworker
% contribution
Employment status
Agriculture sector Non-Agricultural sector
Excluding Mullaitivu & Kilinochchi districts Table 11 : Employment distribution by employment status by province, 2004 Province Total
employed
%
Employee
%
Employer
%
Ow
n account w
orker
%
Unpaid
family
worker
%
Total 7394559 100.0 4395124 59.4 216019 2.9 2090660 28.3 692756 9.4 Western 2074153 100.0 1421564 68.5 83817 4.0 483881 23.3 84890 4.1 Central 887120 100.0 561014 63.2 16336 1.8 211356 23.8 98414 11.1 Southern 943933 100.0 527447 55.9 18624 1.9 291988 30.9 105873 11.2 Northern* 235298 100.0 142185 60.4 14294 6.0 66234 28.1 12585 5.3 Eastern 454726 100.0 248026 54.5 13001 2.9 146595 32.2 47103 10.4 North Western 951744 100.0 542304 56.9 30283 3.2 281678 29.6 97480 10.2 North Central 470741 100.0 168283 35.7 8274 1.8 209349 44.5 84835 18.0 Uva 597336 100.0 291278 48.8 9840 1.6 183484 30.7 112735 18.9 Sabaragamuwa 779509 100.0 493023 63.2 21549 2.8 216095 27.7 48841 6.3 * Excluding Mullaitivu & Kilinochchi districts.
Table 11 gives the Employment Distribution by Province. Highest percentage of employees has been reported by Western province showing 69 percent, and North Central Province 36 percent. In the case of own account workers, the corresponding are 23 percent and 46 percent respectively. 3.3 Employment by Occupation The district level distribution of estimated employed population by major occupational groups are given in table 12 below. It indicates that 21 percent of the total employed persons were engaged in agricultural sector which comprises of skilled agricultural and fishery workers. It is also revealed that there is a big variation of the percentage of employed population in agriculture sector among districts. Colombo districts has the lowest percentage of 0.85 and Monaragala shows the highest percentage of 62.4. Matara, Hambantota, Mannar, Ampara, Anuradhapura, Polonnaruwa and Badulla districts are also shown to have about 30 percent or more of its employees as engaged in the agricultural sector, while the Kalutara and Kegalle district have reported lower percentages of agricultural related activities.
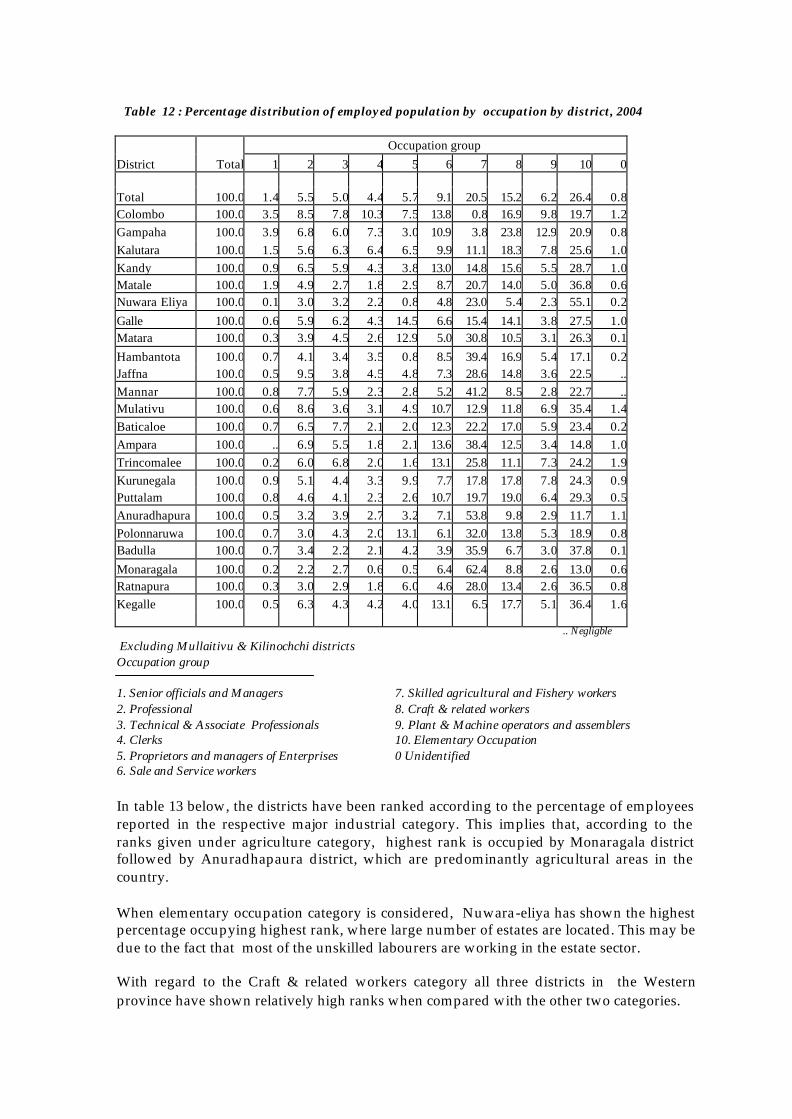
Table 12 : Percentage distribution of employed population by occupation by district, 2004 Occupation group District Total 1 2 3 4 5 6 7 8 9 10 0 Total 100.0 1.4 5.5 5.0 4.4 5.7 9.1 20.5 15.2 6.2 26.4 0.8Colombo 100.0 3.5 8.5 7.8 10.3 7.5 13.8 0.8 16.9 9.8 19.7 1.2Gampaha 100.0 3.9 6.8 6.0 7.3 3.0 10.9 3.8 23.8 12.9 20.9 0.8Kalutara 100.0 1.5 5.6 6.3 6.4 6.5 9.9 11.1 18.3 7.8 25.6 1.0Kandy 100.0 0.9 6.5 5.9 4.3 3.8 13.0 14.8 15.6 5.5 28.7 1.0Matale 100.0 1.9 4.9 2.7 1.8 2.9 8.7 20.7 14.0 5.0 36.8 0.6Nuwara Eliya 100.0 0.1 3.0 3.2 2.2 0.8 4.8 23.0 5.4 2.3 55.1 0.2Galle 100.0 0.6 5.9 6.2 4.3 14.5 6.6 15.4 14.1 3.8 27.5 1.0Matara 100.0 0.3 3.9 4.5 2.6 12.9 5.0 30.8 10.5 3.1 26.3 0.1Hambantota 100.0 0.7 4.1 3.4 3.5 0.8 8.5 39.4 16.9 5.4 17.1 0.2Jaffna 100.0 0.5 9.5 3.8 4.5 4.8 7.3 28.6 14.8 3.6 22.5 ..Mannar 100.0 0.8 7.7 5.9 2.3 2.8 5.2 41.2 8.5 2.8 22.7 ..Mulativu 100.0 0.6 8.6 3.6 3.1 4.9 10.7 12.9 11.8 6.9 35.4 1.4Baticaloe 100.0 0.7 6.5 7.7 2.1 2.0 12.3 22.2 17.0 5.9 23.4 0.2Ampara 100.0 .. 6.9 5.5 1.8 2.1 13.6 38.4 12.5 3.4 14.8 1.0Trincomalee 100.0 0.2 6.0 6.8 2.0 1.6 13.1 25.8 11.1 7.3 24.2 1.9Kurunegala 100.0 0.9 5.1 4.4 3.3 9.9 7.7 17.8 17.8 7.8 24.3 0.9Puttalam 100.0 0.8 4.6 4.1 2.3 2.6 10.7 19.7 19.0 6.4 29.3 0.5Anuradhapura 100.0 0.5 3.2 3.9 2.7 3.2 7.1 53.8 9.8 2.9 11.7 1.1Polonnaruwa 100.0 0.7 3.0 4.3 2.0 13.1 6.1 32.0 13.8 5.3 18.9 0.8Badulla 100.0 0.7 3.4 2.2 2.1 4.2 3.9 35.9 6.7 3.0 37.8 0.1Monaragala 100.0 0.2 2.2 2.7 0.6 0.5 6.4 62.4 8.8 2.6 13.0 0.6Ratnapura 100.0 0.3 3.0 2.9 1.8 6.0 4.6 28.0 13.4 2.6 36.5 0.8Kegalle 100.0 0.5 6.3 4.3 4.2 4.0 13.1 6.5 17.7 5.1 36.4 1.6 .. Negligble Excluding Mullaitivu & Kilinochchi districts Occupation group 1. Senior officials and Managers 7. Skilled agricultural and Fishery workers 2. Professional 8. Craft & related workers 3. Technical & Associate Professionals 9. Plant & Machine operators and assemblers 4. Clerks 10. Elementary Occupation 5. Proprietors and managers of Enterprises 0 Unidentified 6. Sale and Service workers In table 13 below, the districts have been ranked according to the percentage of employees reported in the respective major industrial category. This implies that, according to the ranks given under agriculture category, highest rank is occupied by Monaragala district followed by Anuradhapaura district, which are predominantly agricultural areas in the country. When elementary occupation category is considered, Nuwara-eliya has shown the highest percentage occupying highest rank, where large number of estates are located. This may be due to the fact that most of the unskilled labourers are working in the estate sector. With regard to the Craft & related workers category all three districts in the Western province have shown relatively high ranks when compared with the other two categories.
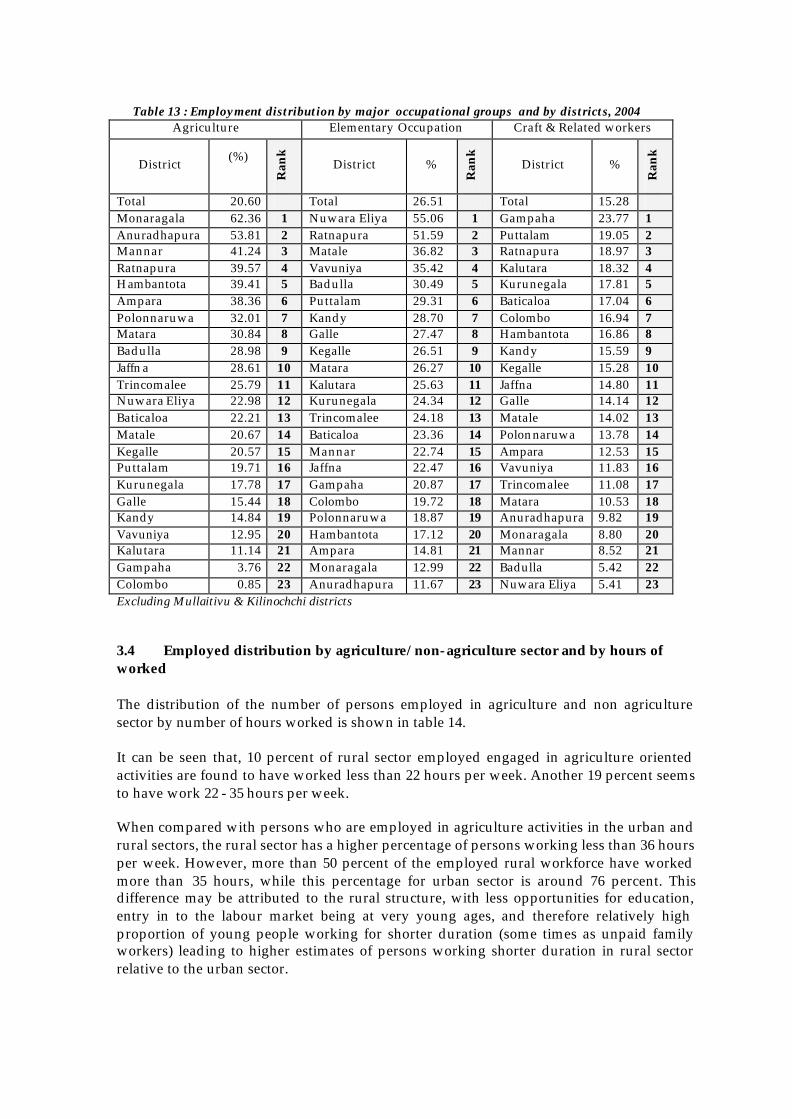
Table 13 : Employment distribution by major occupational groups and by districts, 2004 Agriculture Elementary Occupation Craft & Related workers
District (%) R
ank
District %
Ran
k
District %
Ran
k
Total 20.60 Total 26.51 Total 15.28 Monaragala 62.36 1 Nuwara Eliya 55.06 1 Gampaha 23.77 1 Anuradhapura 53.81 2 Ratnapura 51.59 2 Puttalam 19.05 2 Mannar 41.24 3 Matale 36.82 3 Ratnapura 18.97 3 Ratnapura 39.57 4 Vavuniya 35.42 4 Kalutara 18.32 4 Hambantota 39.41 5 Badulla 30.49 5 Kurunegala 17.81 5 Ampara 38.36 6 Puttalam 29.31 6 Baticaloa 17.04 6 Polonnaruwa 32.01 7 Kandy 28.70 7 Colombo 16.94 7 Matara 30.84 8 Galle 27.47 8 Hambantota 16.86 8 Badulla 28.98 9 Kegalle 26.51 9 Kandy 15.59 9 Jaffna 28.61 10 Matara 26.27 10 Kegalle 15.28 10 Trincomalee 25.79 11 Kalutara 25.63 11 Jaffna 14.80 11 Nuwara Eliya 22.98 12 Kurunegala 24.34 12 Galle 14.14 12 Baticaloa 22.21 13 Trincomalee 24.18 13 Matale 14.02 13 Matale 20.67 14 Baticaloa 23.36 14 Polonnaruwa 13.78 14 Kegalle 20.57 15 Mannar 22.74 15 Ampara 12.53 15 Puttalam 19.71 16 Jaffna 22.47 16 Vavuniya 11.83 16 Kurunegala 17.78 17 Gampaha 20.87 17 Trincomalee 11.08 17 Galle 15.44 18 Colombo 19.72 18 Matara 10.53 18 Kandy 14.84 19 Polonnaruwa 18.87 19 Anuradhapura 9.82 19 Vavuniya 12.95 20 Hambantota 17.12 20 Monaragala 8.80 20 Kalutara 11.14 21 Ampara 14.81 21 Mannar 8.52 21 Gampaha 3.76 22 Monaragala 12.99 22 Badulla 5.42 22 Colombo 0.85 23 Anuradhapura 11.67 23 Nuwara Eliya 5.41 23 Excluding Mullaitivu & Kilinochchi districts 3.4 Employed distribution by agriculture/ non- agriculture sector and by hours of worked The distribution of the number of persons employed in agriculture and non agriculture sector by number of hours worked is shown in table 14. It can be seen that, 10 percent of rural sector employed engaged in agriculture oriented activities are found to have worked less than 22 hours per week. Another 19 percent seems to have work 22 - 35 hours per week. When compared with persons who are employed in agriculture activities in the urban and rural sectors, the rural sector has a higher percentage of persons working less than 36 hours per week. However, more than 50 percent of the employed rural workforce have worked more than 35 hours, while this percentage for urban sector is around 76 percent. This difference may be attributed to the rural structure, with less opportunities for education, entry in to the labour market being at very young ages, and therefore relatively high proportion of young people working for shorter duration (some times as unpaid family workers) leading to higher estimates of persons working shorter duration in rural sector relative to the urban sector.
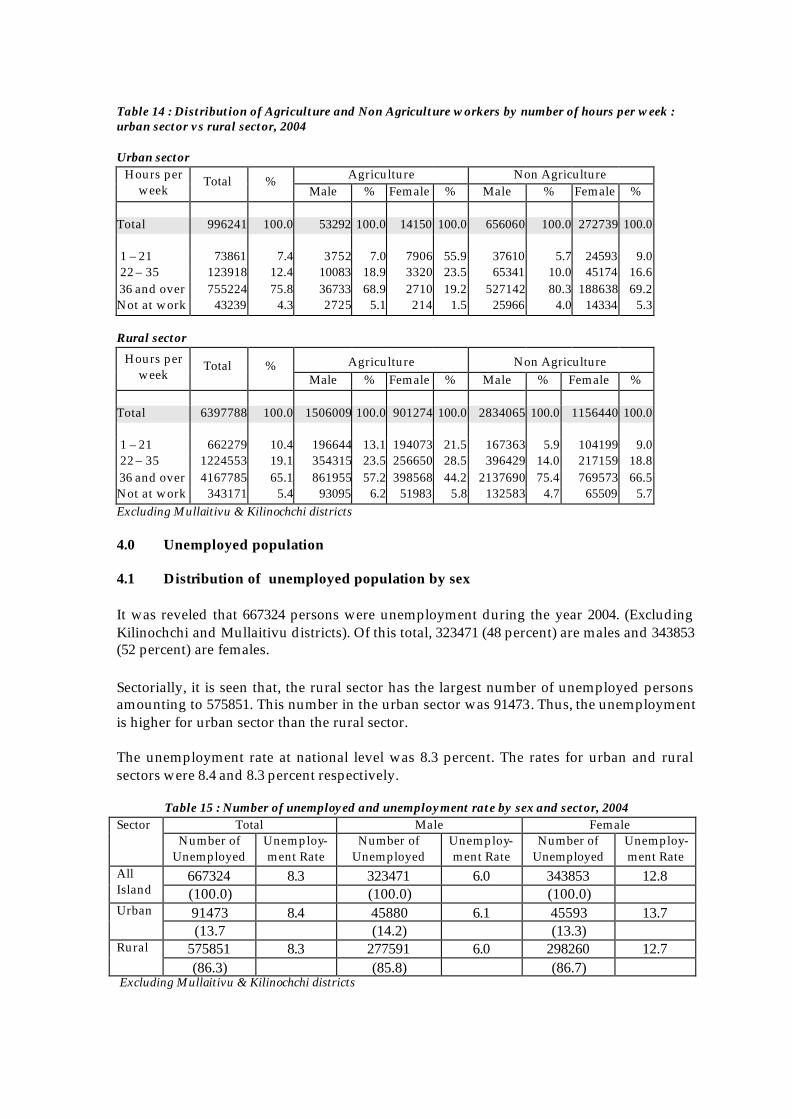
Table 14 : Distribution of Agriculture and Non Agriculture workers by number of hours per week : urban sector vs rural sector, 2004 Urban sector
Agriculture Non Agriculture Hours per week
Total % Male % Female % Male % Female %
Total 996241 100.0 53292 100.0 14150 100.0 656060 100.0 272739 100.0 1 – 21 73861 7.4 3752 7.0 7906 55.9 37610 5.7 24593 9.0 22 – 35 123918 12.4 10083 18.9 3320 23.5 65341 10.0 45174 16.6 36 and over 755224 75.8 36733 68.9 2710 19.2 527142 80.3 188638 69.2Not at work 43239 4.3 2725 5.1 214 1.5 25966 4.0 14334 5.3 Rural sector
Agriculture Non Agriculture Hours per week
Total % Male % Female % Male % Female %
Total 6397788 100.0 1506009 100.0 901274 100.0 2834065 100.0 1156440 100.0 1 – 21 662279 10.4 196644 13.1 194073 21.5 167363 5.9 104199 9.0 22 – 35 1224553 19.1 354315 23.5 256650 28.5 396429 14.0 217159 18.8 36 and over 4167785 65.1 861955 57.2 398568 44.2 2137690 75.4 769573 66.5Not at work 343171 5.4 93095 6.2 51983 5.8 132583 4.7 65509 5.7Excluding Mullaitivu & Kilinochchi districts 4.0 Unemployed population 4.1 Distribution of unemployed population by sex It was reveled that 667324 persons were unemployment during the year 2004. (Excluding Kilinochchi and Mullaitivu districts). Of this total, 323471 (48 percent) are males and 343853 (52 percent) are females. Sectorially, it is seen that, the rural sector has the largest number of unemployed persons amounting to 575851. This number in the urban sector was 91473. Thus, the unemployment is higher for urban sector than the rural sector. The unemployment rate at national level was 8.3 percent. The rates for urban and rural sectors were 8.4 and 8.3 percent respectively. Table 15 : Number of unemployed and unemployment rate by sex and sector, 2004
Total Male Female Sector Number of
Unemployed Unemploy-ment Rate
Number of Unemployed
Unemploy-ment Rate
Number of Unemployed
Unemploy- ment Rate
667324 8.3 323471 6.0 343853 12.8 All Island (100.0) (100.0) (100.0)
91473 8.4 45880 6.1 45593 13.7 Urban
(13.7 (14.2) (13.3) 575851 8.3 277591 6.0 298260 12.7 Rural
(86.3) (85.8) (86.7) Excluding Mullaitivu & Kilinochchi districts
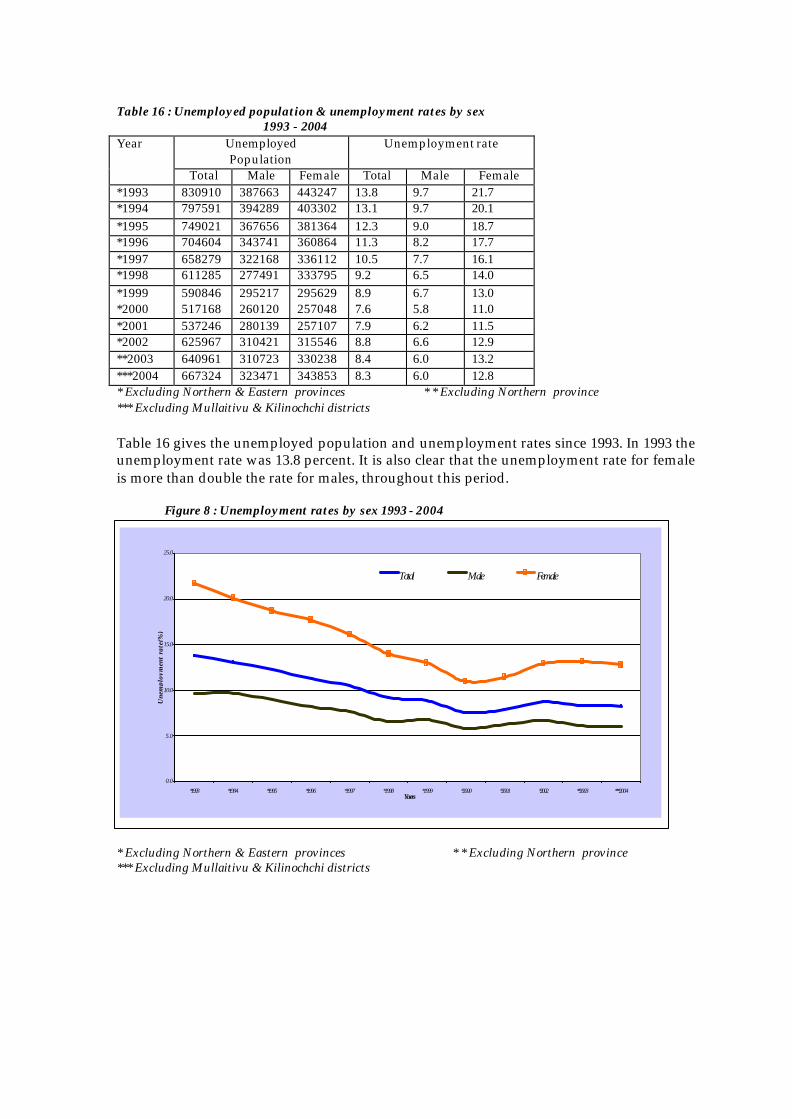
Table 16 : Unemployed population & unemployment rates by sex 1993 - 2004
Unemployed Population
Unemployment rate Year
Total Male Female Total Male Female *1993 830910 387663 443247 13.8 9.7 21.7 *1994 797591 394289 403302 13.1 9.7 20.1 *1995 749021 367656 381364 12.3 9.0 18.7 *1996 704604 343741 360864 11.3 8.2 17.7 *1997 658279 322168 336112 10.5 7.7 16.1 *1998 611285 277491 333795 9.2 6.5 14.0 *1999 590846 295217 295629 8.9 6.7 13.0 *2000 517168 260120 257048 7.6 5.8 11.0 *2001 537246 280139 257107 7.9 6.2 11.5 *2002 625967 310421 315546 8.8 6.6 12.9 **2003 640961 310723 330238 8.4 6.0 13.2 ***2004 667324 323471 343853 8.3 6.0 12.8 * Excluding Northern & Eastern provinces * * Excluding Northern province *** Excluding Mullaitivu & Kilinochchi districts Table 16 gives the unemployed population and unemployment rates since 1993. In 1993 the unemployment rate was 13.8 percent. It is also clear that the unemployment rate for female is more than double the rate for males, throughout this period. Figure 8 : Unemployment rates by sex 1993 - 2004
* Excluding Northern & Eastern provinces * * Excluding Northern province *** Excluding Mullaitivu & Kilinochchi districts
0.0
5.0
10.0
15.0
20.0
25.0
*1993 *1994 *1995 *1996 *1997 *1998 *1999 *2000 *2001 *2002 **2003 ***2004Yaers
Une
mpl
oym
ent
rate
(%)
Total Male Female
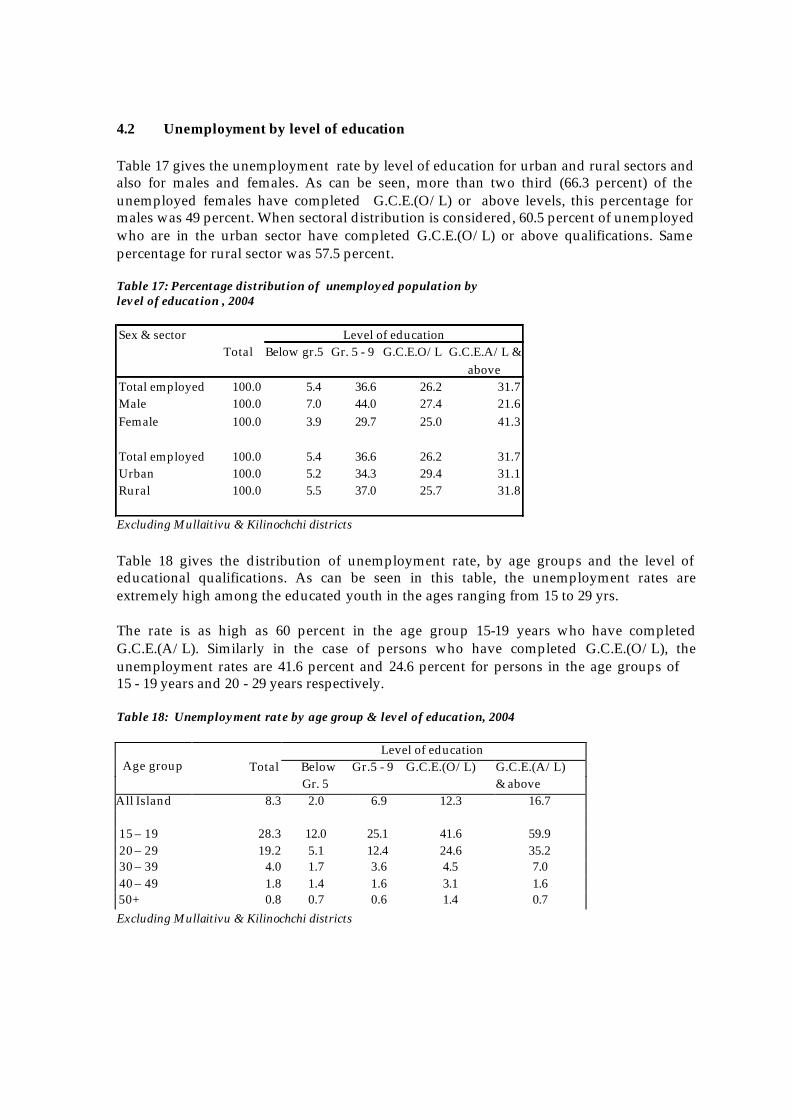
4.2 Unemployment by level of education Table 17 gives the unemployment rate by level of education for urban and rural sectors and also for males and females. As can be seen, more than two third (66.3 percent) of the unemployed females have completed G.C.E.(O/L) or above levels, this percentage for males was 49 percent. When sectoral distribution is considered, 60.5 percent of unemployed who are in the urban sector have completed G.C.E.(O/L) or above qualifications. Same percentage for rural sector was 57.5 percent. Table 17: Percentage distribution of unemployed population by level of education , 2004
Excluding Mullaitivu & Kilinochchi districts Table 18 gives the distribution of unemployment rate, by age groups and the level of educational qualifications. As can be seen in this table, the unemployment rates are extremely high among the educated youth in the ages ranging from 15 to 29 yrs. The rate is as high as 60 percent in the age group 15-19 years who have completed G.C.E.(A/L). Similarly in the case of persons who have completed G.C.E.(O/L), the unemployment rates are 41.6 percent and 24.6 percent for persons in the age groups of 15 - 19 years and 20 - 29 years respectively. Table 18: Unemployment rate by age group & level of education, 2004
Excluding Mullaitivu & Kilinochchi districts
Level of education Total Below Gr.5 - 9 G.C.E.(O/L) G.C.E.(A/L) Age group Gr. 5 & above
All Island 8.3 2.0 6.9 12.3 16.7 15 – 19 28.3 12.0 25.1 41.6 59.9 20 – 29 19.2 5.1 12.4 24.6 35.2 30 – 39 4.0 1.7 3.6 4.5 7.0 40 – 49 1.8 1.4 1.6 3.1 1.6 50+ 0.8 0.7 0.6 1.4 0.7
Sex & sectorTotal Below gr.5 Gr. 5 - 9 G.C.E.O/L G.C.E.A/L &
aboveTotal employed 100.0 5.4 36.6 26.2 31.7Male 100.0 7.0 44.0 27.4 21.6Female 100.0 3.9 29.7 25.0 41.3
Total employed 100.0 5.4 36.6 26.2 31.7Urban 100.0 5.2 34.3 29.4 31.1Rural 100.0 5.5 37.0 25.7 31.8
Level of education
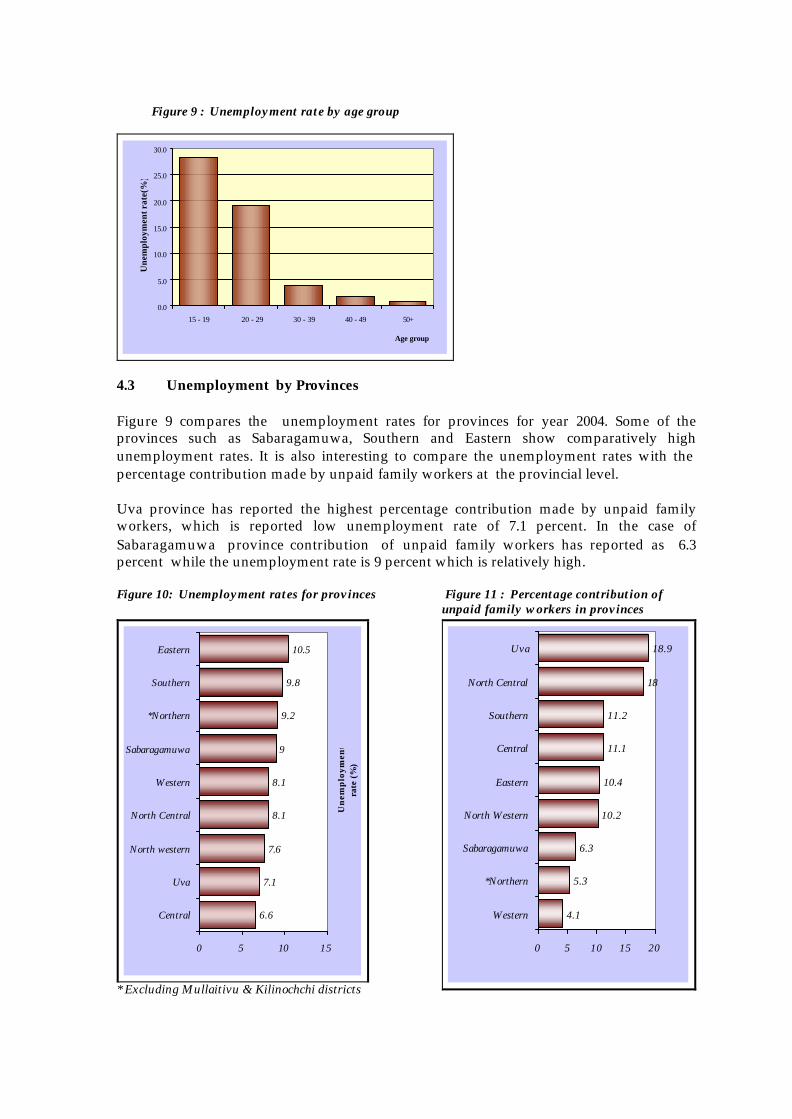
Figure 9 : Unemployment rate by age group
0.0
5.0
10.0
15.0
20.0
25.0
30.0
15 - 19 20 - 29 30 - 39 40 - 49 50+
Age group
Une
mpl
oym
ent r
ate(
%)
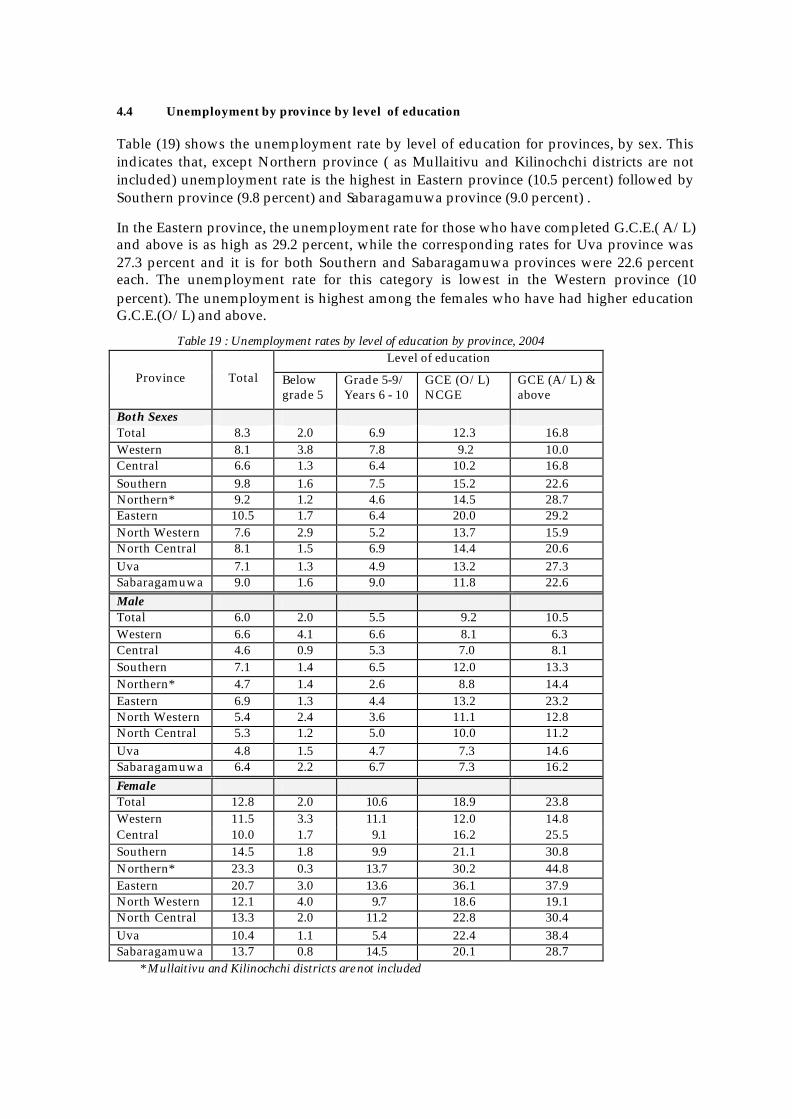
4.3 Unemployment by Provinces Figure 9 compares the unemployment rates for provinces for year 2004. Some of the provinces such as Sabaragamuwa, Southern and Eastern show comparatively high unemployment rates. It is also interesting to compare the unemployment rates with the percentage contribution made by unpaid family workers at the provincial level. Uva province has reported the highest percentage contribution made by unpaid family workers, which is reported low unemployment rate of 7.1 percent. In the case of Sabaragamuwa province contribution of unpaid family workers has reported as 6.3 percent while the unemployment rate is 9 percent which is relatively high. Figure 10: Unemployment rates for provinces Figure 11 : Percentage contribution of
unpaid family workers in provinces
6.6
7.1
7.6
8.1
8.1
9
9.2
9.8
10.5
0 5 10 15
Central
Uva
North western
North Central
Western
Sabaragamuwa
*Northern
Southern
Eastern
Un
emp
loym
ent
rate
(%)
* Excluding Mullaitivu & Kilinochchi districts
4.1
5.3
6.3
10.2
10.4
11.1
11.2
18
18.9
0 5 10 15 20
Western
*Northern
Sabaragamuwa
North Western
Eastern
Central
Southern
North Central
Uva
4.4 Unemployment by province by level of education Table (19) shows the unemployment rate by level of education for provinces, by sex. This indicates that, except Northern province ( as Mullaitivu and Kilinochchi districts are not included) unemployment rate is the highest in Eastern province (10.5 percent) followed by Southern province (9.8 percent) and Sabaragamuwa province (9.0 percent) . In the Eastern province, the unemployment rate for those who have completed G.C.E.( A/L) and above is as high as 29.2 percent, while the corresponding rates for Uva province was 27.3 percent and it is for both Southern and Sabaragamuwa provinces were 22.6 percent each. The unemployment rate for this category is lowest in the Western province (10 percent). The unemployment is highest among the females who have had higher education G.C.E.(O/L) and above. Table 19 : Unemployment rates by level of education by province, 2004
Level of education Province Total Below
grade 5 Grade 5-9/ Years 6 - 10
GCE (O/L) NCGE
GCE (A/L) & above
Both Sexes Total 8.3 2.0 6.9 12.3 16.8 Western 8.1 3.8 7.8 9.2 10.0 Central 6.6 1.3 6.4 10.2 16.8 Southern 9.8 1.6 7.5 15.2 22.6 Northern* 9.2 1.2 4.6 14.5 28.7 Eastern 10.5 1.7 6.4 20.0 29.2 North Western 7.6 2.9 5.2 13.7 15.9 North Central 8.1 1.5 6.9 14.4 20.6 Uva 7.1 1.3 4.9 13.2 27.3 Sabaragamuwa 9.0 1.6 9.0 11.8 22.6 Male Total 6.0 2.0 5.5 9.2 10.5 Western 6.6 4.1 6.6 8.1 6.3 Central 4.6 0.9 5.3 7.0 8.1 Southern 7.1 1.4 6.5 12.0 13.3 Northern* 4.7 1.4 2.6 8.8 14.4 Eastern 6.9 1.3 4.4 13.2 23.2 North Western 5.4 2.4 3.6 11.1 12.8 North Central 5.3 1.2 5.0 10.0 11.2 Uva 4.8 1.5 4.7 7.3 14.6 Sabaragamuwa 6.4 2.2 6.7 7.3 16.2 Female Total 12.8 2.0 10.6 18.9 23.8 Western 11.5 3.3 11.1 12.0 14.8 Central 10.0 1.7 9.1 16.2 25.5 Southern 14.5 1.8 9.9 21.1 30.8 Northern* 23.3 0.3 13.7 30.2 44.8 Eastern 20.7 3.0 13.6 36.1 37.9 North Western 12.1 4.0 9.7 18.6 19.1 North Central 13.3 2.0 11.2 22.8 30.4 Uva 10.4 1.1 5.4 22.4 38.4 Sabaragamuwa 13.7 0.8 14.5 20.1 28.7
* Mullaitivu and Kilinochchi districts are not included
Appendix - 1
A. Introduction The data is derived from household interviews obtained from a sample of the population 10 years of age and older. The survey is conducted quarterly by the Department of Census & Statistics and provides comprehensive data on the Labour Force, the Employed, the Unemployed and includes such characteristics as age, sex, occupation, and industry attachment. The survey also provides information on hours worked, and reasons for unemployment and nonparticipation in the labour force. The surveys conducted by trained interviewers form a total annual sample of about 16000 household. The data collected are based on the respondent's activity or status during the preceding week and previous 12 months period. B. Collection and Coverage Data are collected quarterly during a similar time period in each quarter through a scientifically selected sample designed to represent the non-institutional household population. About 4000 households are visited each quarter. Respondents are interviewed to obtain information about each member of the household 10 years age or older. The inquiry relates to the previous calendar week of the interview to obtain "current" information, and to the previous 12 calendar months to obtain "usual" activity information. Inmates of institutions, military camps, and are not surveyed. C. Concepts and Definitions: The concepts and definitions underlying the labour force data from this survey differ somewhat from those in previous labour force surveys. Therefore, comparisons of data should be made carefully taking into account the concepts and definitions that follow: Labour Force: The Labour Force is composed of the economically active population aged 10 years and over. Economically Active Population: The economically active population is defined as those persons who are/were employed or unemployed during the reference period of the survey. Employed: Employed persons are all household members who during the reference period worked as paid employees, employers, own account workers (self-employed) or unpaid family workers, in family enterprises. Also, included are persons who had a job but were temporarily absent from work because of such things as vacation, illness, bad weather, and labour management dis putes etc. It should be noted that if a person has one or more jobs, that person is counted only once. Unemployed: Persons who were available and/or looking for work, and had no employment during the reference period, are considered to be unemployed. Reference Period: In this survey there are two reference periods, "current" and "usual". The "current" reference period is the week preceding the week of data collection, i.e. last week. The "usual" reference period is the preceding 12 months, i.e. the past 12 months. Currently Economically Active : A person who was employed or unemployed is considered to be currently economically active. Usually Economically Active : A person whose major activity during the past 12 months was employment and/or unemployed is considered to have been usually economically active. Twenty-six weeks or more is the measure that determines the major activity of the respondent for the year. Currently Employed : A person who works for pay, profit, or unpaid family gain for one (1) hour or more during the past week is considered to have been employed during the period. This includes persons whether paid or not, with a job but not at work for the various cited above. Usually Employed: A person whose major economic activity during the past 12 months was employment is considered to have been usually employed.
Currently Unemployed: A person who did no work but who was looking or available for work during the past week is considered to have been currently unemployed. Not in Labour Force (Not Economically Active): Persons who were neither working not available/looking for work are classified as not in the labour force. This group includes persons engaged in own house work, going to school, unable to work because of along term infirmities, retired, and others. Others include person voluntarily idle. MEASURES OF THE LABOUR FORCE: The working age population is the total non-institutional household population aged 10 years or over. The participation rate is the proportion of the labour force that is in the working age population. The labour force is the number of persons classified as employed or unemployed according to the criterion described above. The unemployed rate represents the number of unemployed persons as a percent of the labour force. These measures can be computed for age, sex, educational attainment and other personal or economic characteristics. Occupation, Industry and Employment Status: These apply to the job held by the currently employed during the survey week. For persons with more than one job, it is usually the main job that is described. However, classifications are also made for the secondary job. Occupations are classified according to the International Standard Classification of Occupation (ISCO), ILO, 1988. Industry is classified according to ILO's International Standard Industrial Classification. The employment - status classification specifies employment in the public or private sectors, and further breaks down into employees (wage and salary workers), employers, own account workers (self-employed), and unpaid family workers. Hours of Work refer to hours actually worked during the week. It the hours actually worked are less than the hours usually worked, respondents are asked the reasons for working fewer hours, which include the following; illness or injury, strike, vacation, reduction in economic activity, off season inactivity, bad weather, mechanical or electrical failure, and shortage of raw materials. A Household consists of all persons, related or not, who occupy a housing unit, which covers a house, an apartment, a group of rooms when occupied as separate living quarters. Domestic servants, Boarders, and lodgers who live and have their meals or share other essentials of living with the family are also related as members of the household. Persons, who usually live here but are temporary away are includes as members of household, but persons who have usual residence elsewhere, but are present at the time of the interview, are excluded. Geographic Data : Data is available at national and provincial levels, and further broken down by urban and rural categories. URBAN areas are those that have an administrative structure of a Municipal Council, an Urban Council. Rural areas are those not classified as urban. D. SAMPLE DESIGN The Survey is conducted quarterly to produce estimates of employment, unemployment, labour force participation and basic demographic characteristics. The scope of coverage includes all households in Sri Lanka. The list of housing units created for Population Census - 2001 were taken as sample frame. Sample lists were selected from the above frame taken as Primary Sampling Unit (PSU). A systematic Sample of 10 housing units per PSU was selected on final sampling units. The total annual sample size is 16,000 housing units, distributed as 400 PSUs per each quarter and 10 housing units (SSUs) per PSU. The allocation to the domains aims at ensuring approximately equal of reliability from doma in to domain. The 1600 Census Block were selected by PPS systematic Sampling. A listing operation was conducted in each selected PSU to provide a frame for the second stage of selection. The selection of housing units within PSU was systematic with random start.