Embed Size (px)
Citation preview

Annual report KBC Bank
2 0 0 7
Volume 1
p. 1

Table of contents Volume 1
KBC Bank profile p. 3 Discussion of the consolidated annual accounts p. 5 Main events p. 10 Value and risk management p. 17 The Board of Directors p.36 Consolidated annual accounts p.37 Volume 2
Company annual accounts Volume 2
TO THE READER
Name of the company Everywhere where mention is made of KBC, the group or KBC Bank in volume 1 of this annual report, the consolidated bank entity is meant, i.e. KBC Bank NV, including all its subsidiaries and sub-subsidiaries. Where KBC Bank NV is used, this refers solely to the non-consolidated entity. KBC Group or the KBC group refers to the parent company of KBC Bank. Forward-looking statements The expectations, forecasts and statements regarding future developments that are contained in this annual report are, of course, based on assumptions and are contingent on a number of factors that will come into play in the future. Consequently, the actual situation may turn out to be (substantially) different. Glossary of ratios used
CAD ratio [consolidated regulatory capital, KBC Bank] / [total risk-weighted volume, KBC Bank]. For detailed calculations, see the ‘Value and risk management’ section.
Cover ratio [individual impairment on non-performing loans] / [outstanding non-performing loans]. For a definition of ‘non-performing’, see ‘Non-performing ratio’. The numerator may also include individual impairment on performing loans and portfolio-based impairment.
Cost/income ratio [operating expenses] / [total income] Loan loss ratio [net changes in individual and portfolio-based impairment for credit risks] / [average outstanding loan
portfolio]. For a definition of the loan portfolio, see the ‘Value and risk management’ section. Non-performing ratio [amount outstanding of non-performing loans (loans for which principal repayments or interest payments
are more than ninety days in arrears or overdrawn)] / [total outstanding loan portfolio]. Return on equity [profit after tax, attributable to equity holders of the parent] / [average parent shareholders’ equity,
excluding the revaluation reserve for available-for-sale assets]. Tier-1 ratio [consolidated Tier-1 capital, KBC Bank] / [total risk-weighted volume, KBC Bank]. For detailed
calculations, see the ‘Value and risk management’ section. -------- Publisher: KBC Group NV, 2 Havenlaan, 1080 Brussels, Belgium. RLP 0403 227 515, bank account No. 734-0051374-70. KBC Bank NV, CBFA Registration No. 26256
p. 2

KBC Bank profile
Area of operation and activities KBC Bank is a multi-channel bank catering mainly for retail customers, small and medium-sized enterprises and private banking clientele. Geographically, KBC focuses on Belgium and Central and Eastern Europe for its retail bancassurance and asset management activities, as well as for the provision of services to business customers, and occupies significant, even leading positions in these two home markets. Elsewhere around the globe, the group has established a presence in selected countries and regions.
Shareholders
Shareholders, 31-12-2007 Number of shares
KBC Group
412 331 793
KBC Insurance 1
Total 412 331 794All shares carry voting rights. The shares are not listed.
Network and personnel
Network and personnel, 31-12-2007
Bank branches
Belgium 923
Central & Eastern Europe and Russia 1 223
Number of staff (in FTEs) Belgium 12 879 Central & Eastern Europe and Russia 26 479 Rest of the world 2 882 Total 42 240
Financial calendar
Financial communication is organised at KBC group level. The General Meeting of Shareholders of KBC Bank is held on 23 April 2008. KBC Bank’s annual report will be available on 9 April 2008.
Financial calendar, KBC group 2007 financial year Earnings release: 14 February 2008
2007 Annual Report available: 9 April 2008
2007 Corporate Social Responsibility Report available: 18 April 2008
AGM: 24 April 2008
Ex-coupon date: 6 May 2008
Dividend payment: 9 May 2008
1Q 2008 Earnings release: 15 May 2008
2Q 2008 Earnings release: 7 August 2008
3Q 2008 Earnings release: 6 November 2008
4Q 2008 Earnings release: 12 February 2009
For the most up-to-date version of the financial calendar, see the KBC website (www.kbc.com).
p. 3

Long-term credit ratings
Long-term credit ratings, 29-02-2008 Fitch AA- Moody’s* Aa2 Standard & Poor’s AA- * Negative outlook.
Key financial figures at group level
Key financial figures at group level, IFRS 2006 2007
Balance sheet, end of period (in millions of EUR)
Total assets 275 738 309 476
Loans and advances to customers 119 188 146 710
Securities 88 366 80 437
Deposits from customers and debt securities 169 638 182 5670
Parent shareholders' equity 10 603 12 342
Income statement (in millions of EUR)
Total income 7 158 7 576
Operating expenses -3 872 -4 140
Impairment -169 -212
Profit after tax, group share 2 083 2 261
Solvency Tier-1 ratio, KBC Bank (Basel I / Basel II) 8.5% / na 7,8% / 8,5%
CAD ratio, KBC Bank (Basel I / Basel II) 11.1% / na 10,5% / 12,2%na: not available.
Contact details
Contact details Investors and analysts Investor Relations Luc Cool (Director of Investor Relations), Lucas Albrecht (Financial Communications Officer)
Sandor Szabó (Investor Relations Manager), Christel Decorte (Investor Relations Assistant) Ida Markvartova (Investor Relations Analyst), Marina Kanamori (CSR Communications Officer)
E-mail [email protected]
Website www.kbc.com
Address KBC Group NV, Investor Relations Office – IRO, 2 Havenlaan, 1080 Brussels, Belgium Press
Press Office Viviane Huybrecht (Head of Group Communication and the Press Office, Company Spokeswoman) Tel. 02 429 85 45 – 32 2 429 85 45 E-mail [email protected]
Website www.kbc.com
Address KBC Group NV, Group Communication – GCM, 2 Havenlaan, 1080 Brussels, Belgium ----------------------------------- * For definitions and comments, see the detailed tables and analyses in this annual report.
p. 4

Discussion of the consolidated annual accounts
Overview of the consolidated income statement for financial year 2007
Income statement, KBC Bank (consolidated, IFRS-compliant, in millions of EUR) 2006 2007
Net interest income 3 271 3 179
Dividend income 139 126
Net (un)realised gains from financial instruments at fair value through profit or loss 1 468 1 768
Net realised gains from available-for-sale assets 181 189
Net fee and commission income 1 648 1 897
Other net income 451 416
Total income 7 158 7 576
Operating expenses -3 872 -4 140
Impairment -169 -212
on loans and receivables -176 -148
on available-for-sale assets -2 -50
Share in the result of associated companies 43 59
Profit before tax 3 160 3 283
Income tax expense -759 -750
Net post-tax income from discontinued operations 0 0
Profit after tax 2 401 2 534
attributable to minority interests 318 273
attributable to equity holders of the parent 2 083 2 261
Analysis of the income statement Preliminary remarks The consolidated financial statements have been prepared in accordance with the International Financial Reporting Standards (IFRS) as adopted for use in the European Union. As of 2007, IFRS 7 on financial instruments disclosures has been applied. This standard affects mainly the balance sheet presentation. It requires financial instruments to be classified per book (held-for-trading, at fair value through profit or loss, available-for-sale, etc.) instead of per product (loans and advances to banks, securities). The reference figures have been restated accordingly. There were no changes in the valuation rules that had a significant effect on net profit or equity. Compared to financial year 2006, the net impact on net profit of changes in the scope of consolidation is limited. The main changes relate to the inclusion of Absolut Bank and Economic and Investment Bank in the scope of consolidation.
p. 5

The non-euro currencies most relevant for KBC fluctuated significantly in 2007. Overall, the Central and Eastern European currencies appreciated in value, while the US dollar and pound sterling depreciated in value relative to the euro.
Exchange rate at 31-12-2007 Exchange rate average in 2007
1 EUR = … currency Change from 31-12-2006 (positive: appreciation relative to EUR) (negative: depreciation relative to EUR)
1 EUR = … currency
Change relative to average in 2006 (positive: appreciation relative to EUR) (negative: depreciation relative to EUR)
CZK 26,63 3,2% 27,77 2,0% GBP 0,733 -8,4% 0,685 -0,3% HUF 253,7 -0,8% 251,3 5,1% PLN 3,594 6,6% 3,785 3,1% SKK 33,58 2,5% 33,78 10,1% USD 1,472 -10,5% 1,373 -8,4%
The net impact on net profit of fluctuations in non-euro currencies was negligible, as macrohedging instruments were used to offset the effect of such fluctuations.
Financial highlights – 2007: • The group's share of net profit went up by 178 million euros to 2 261 million euros (+9%). • Total income and operating expenses went up in tandem by 6% and 7%, respectively. • Impairment remained at a relatively low 212 million euros. Total income includes net interest income, dividend income, net gains on financial instruments at fair value through profit or loss, net realised gains from available-for-sale assets, net fee and commission income and other net income. There was a 3% decrease in net interest income, which accounts for 42% of gross income. This decrease was accounted for entirely by the higher cost of financing market activities. Disregarding this interest expense, net interest income went up, partly thanks to the higher volume of loans and deposits within the group. In 2007, loans and deposits grew even on an organic basis (i.e. excluding acquisitions and exchange differences). The increase in Central and Eastern Europe was particularly striking (organic growth of 23% in loans and 11% in deposits). On the other hand, Belgium was negatively affected by the shift from savings accounts to other products such as investment funds (income from which appears under other income statement items) and time deposits (which result in a lower margin for the group).
About two-thirds of dividend income was accounted for by dividends on held-for-trading securities, and came to a total of 126 million euros. Net gains from financial instruments at fair value through profit or loss came to 1 768 million euros in 2007, a 20% increase on 2006. This growth is, however, fully explained by the results of the dealing room activities that are recognised under other income statement items (financing costs under net interest income, for instance, fees and commission paid under net fee and commission income) and by fair value adjustments of ALM hedging instruments whose underlying is not measured at fair value under IFRS. If these elements are not taken into account, the trading result was down year-on-year, partly due to the turbulence on the financial markets in the latter half of the year - which put pressure on the results of certain of the group’s capital market activities - including the lower market value of the CDOs in the group’s portfolios consequent on the mortgage crisis in the US (-103 million euros before tax and -67 million euros after tax) and value adjustments made for counterparty exposure to credit reinsurers (-39 million euros before tax and -23 million euros after tax). Net realised gains from available-for-sale assets edged up to 189 million euros. Net realised gains on shares went up in 2007 to 335 million euros from the 147 million euros recorded for 2006. In 2007, a gain of 207 million euros was realised on the sale of the holding in Intesa Sanpaolo. On fixed-income securities, a net loss of 145 million euros was realised in 2007, whereas a net realised gain had been recognised in 2006 of 34 million euros.
p. 6

Net fee and commission income went up in 2007 by 15% to 1 897 million euros. The increase is due largely to the securities trading and asset management businesses. Other income fell from 451 million euros to 416 million euros. In 2006, this heading had included 36 million euros from the sale of buildings in the Czech Republic and 60 million euros on the sale of the stake in BCC/Banksys; in 2007, it had been accounted for by, among other things, the 35-million-euro gain on the sale of a Hungarian bank card clearing house and a refund of 43 million euros from the Belgian deposit protection scheme. Operating expenses include both staff expenses and depreciation and amortisation charges for fixed assets, other operating expenses and provisions for liabilities and charges. Expenses remained under control in 2007, and went up more or less in tandem with gross income. Accordingly, the cost/income ratio remained virtually unchanged at 55% (54% in 2006). Impairment losses on loans and receivables went down from 176 million euros to 148 million euros. Of this amount, 83 million euros were set aside at the Central European and Russian subsidiaries. Impairment on available-for-sale financial assets came to 50 million euros, compared with a mere 2 million euros a year earlier, mainly on account of the deteriorating stock market climate in the latter part of 2007. In both 2006 and 2007, impairment on goodwill and other assets was limited (14 million euros in 2007, as against a net reversal of 9 million euros in 2006). The share in the results of associated companies came to 59 million euros in 2007, and related (just as in 2006) primarily to the contribution (via the equity method) of the 34% minority interest in Nova Ljubljanska banka (NLB) in Slovenia. Income tax expense amounted to 750 million euros. Profit after tax attributable to minority interests totalled 273 million euros, less than the previous year, mainly because of the buy-out of minority interests in ČSOB (Czech Republic).
Analysis of the balance sheet and solvency The consolidated balance sheet total at year-end 2007 came to 309.5 billion euros, 12% more year-on-year. As in 2006, loans and advances to customers (146.7 billion euros at the end of 2007) and securities (80.4 billion euros) were the main products on the asset side of the balance sheet. The increase in loans and advances was most marked in Central & Eastern Europe and Russia (+23%). At group level, the main credit products were term loans (73.2 billion euros) and home loans (46.8 billion euros, organic growth of 16% year-on-year). The securities portfolio (80.4 billion euros) contains both held-for-trading instruments and securities held in the bank’s investment portfolio. The main product on the liabilities side of the balance sheet was again deposits from customers and debt securities, which amounted to 182.6 billion euros at the end of 2007. Time deposits (59.6 billion euros), demand deposits (37.8 billion euros) and savings deposits (27.1 billion euros, down 9% on 2006) were the main deposit products. On 31 December 2007, parent shareholders’ equity came to 12.3 billion euros (10.6 billion euros at year-end 2006). The main changes in equity compared with year-end 2006 relate to the inclusion of profit for the financial year (+2.3 billion euros), the dividends for 2006 paid out in 2007 and the interim dividend paid in 2007 (-1.4 billion euros), the change in the revaluation reserve for available-for-sale assets (-0.6 billion euros) and the 1.5-billion-euro capital increase that was subscribed in full by KBC Group NV. Reported according to Basel II since 2007, KBC Bank’s solvency ratios (at the consolidated level) of 8.5% and 12.2% were well above the legal requirements for the tier-1 and CAD ratios, respectively.
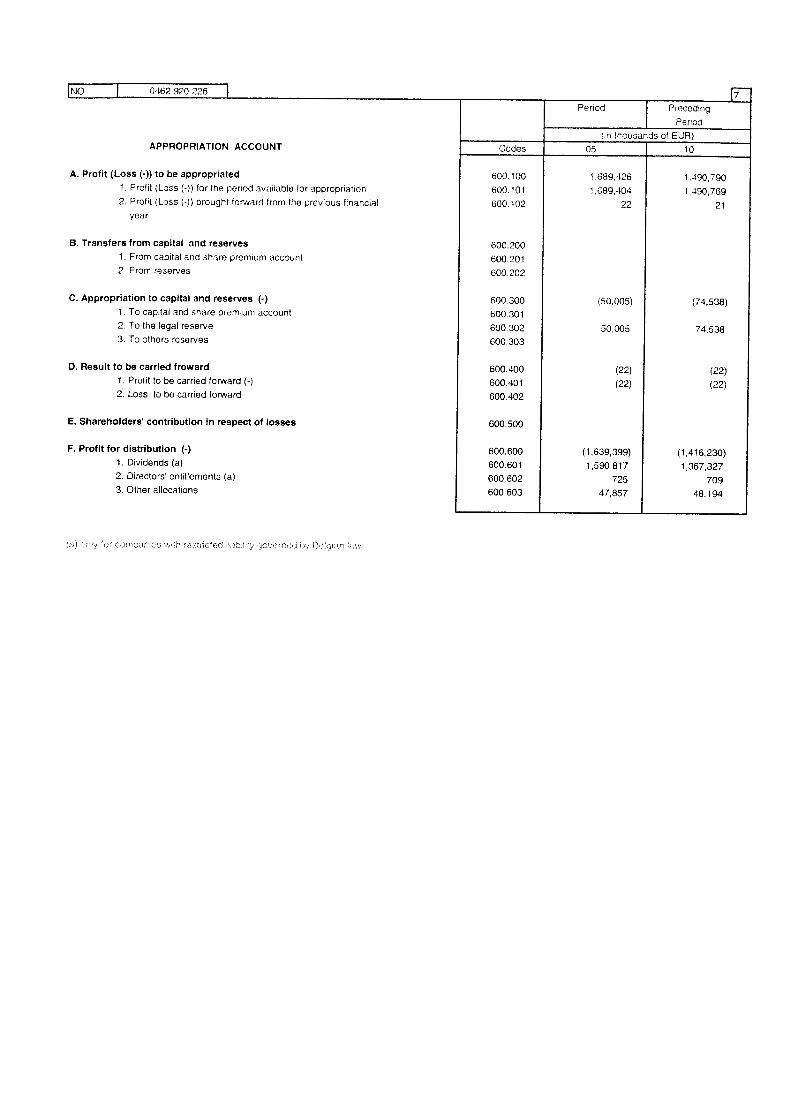
Appropriation of 2007 profit by KBC Bank
The Board of Directors will propose to the General Meeting of Shareholders that 1 591 million euros be paid out in dividends (715 million euros of which was paid out in mid-November 2007 as an interim dividend) and 0.7 million euros in directors’ emoluments.
p. 7
Post-balance-sheet events
The main non-adjusting events after balance sheet date were:
• The reaching of a compromise settlement by the group with a number of insurance companies regarding a legal dispute. No additional information can be provided on this matter, as it might prejudice the group's position.
Additional information • Repurchase of own shares: Neither KBC Bank nor its subsidiaries hold any treasury stock. •
such conflicts of interest in 2007. Discharge of the directors and the auditor:
Conflicts of interest that fall within the scope of Article 523 or 524 of the Belgian Companies Code: there were no
• In compliance with the law and the articles of association, the General
• Meeting on 23 April 2008, Mr Lode Morlion will step down as director. It will be proposed to the General Meeting that Mr Walter Nonneman be appointed to replace him. Walter Nonneman
• , with the
Meeting of Shareholders is requested to grant discharge to the directors and the auditor for the performance of their mandate in the 2007 financial year. Appointments: Effective from the General
(°1948) is a professor at the Faculty of Law and the Faculty of Applied Economics at the University of Antwerp (Universiteit Antwerpen), where he currently teaches general and public economics, along with other subjects. He studied applied economics and management at the UFSIA and the Harvard Business School. Mr Nonneman has also worked for the cabinet of various ministers and was head of the cabinet office of the Belgian Prime Minister, Jean-Luc Dehaene (1997-1999). He is managing director of various non-profit organisations (including the Universitair Centrum Sint Ignatius Antwerpen), and sits on the Board of NV Cera Beheersmaatschappij. In compliance with the laws on the incompatibility of offices held by managers of credit institutions, listed in annex 1 are the external offices held by the executive managers and directors of KBC Bank in other companiesexception of those functions performed in companies within the meaning of Article 27, §3, para. three of the Act of 22 March 1993.
p. 8

Annex 1
Company nameRegistered
office Sector Position ListedShare of
capital held(N= not) (N= none)
Luc Philips, DirectorGemma Frisiusfonds K.U. Leuven Belgium financial sector Director N 36,00%Gemma Frisiusfonds K.U. Leuven II Belgium financial sector Director N 36,00%Norkom Technologies Ltd UK technology software Director N NNorkom Alchemist Ltd Ireland technology software Director N NNorkom Group Ltd Ireland holding company Director ISE; AIM NZinner NV Belgium real estate Director N 13,11%Elbion NV Belgium biotechnology Director N NThromboGenics NV Belgium biopharmaceuticals Director Euronext N
Frans Florquin, executive DirectorConcert Noble NV Belgium conference venues Chairman of the Board N 100,00%VTB-VAB Belgium road breakdown assistance Director N NVTB-VAB Group Belgium road breakdown assistance Director N N
Jan Huyghebaert, ChairmanAlcatel Bell n.v. Belgium technology hardware Director N N
Franky Depickere, DirectorAlmancora Beheersmaatschappij Belgium management Executive Director N NCera Beheersmaatschappij Belgium management Executive Director N NMiko NV Belgium food/plastics Independent Director NYSE Euronext N
Germain Vantieghem, DirectorAlmancora Beheersmaatschappij Belgium management Executive Director N NCera Beheersmaatschappij Belgium management Executive Director N NVTB-VAB Belgium road breakdown assistance Director N NVTB-VAB Group Belgium road breakdown assistance Director N NGuyro Belgium real estate Director N N
Marc Wittemans, DirectorAgro - Services cvba Belgium temporary employment Director N NAktiefinvest cvba Belgium real estate Director N NArdo Immo Belgium real estate Director N NMaatschappij voor Grondbezit n.v. Belgium real estate Director N NSBB Accountants en Belastingconsulenten cvba Belgium Accountancy & consulting Director N NSBB Bedrijfsdiensten cvba Belgium Accountancy & consulting Director N N
Guido Segers, Executive DirectorGemma Frisiusfonds K.U. Leuven Belgium financial sector Director N 36,00%Gemma Frisiusfonds K.U. Leuven II Belgium financial sector Director N NNovoli Immobiliare Italy real estate Director N 32,78%Novoli Investors Netherlands real estate Director N 60,98%KBC Real Estate NV Belgium real estate Chairman of the Board N 100,00%KBC Vastgoedportefeuille België NV Belgium real estate Director N 100,00%KBC Verzekeringen Vastgoed Nederland I BV Netherlands real estate Member of the Supervisory Board N 100,00%KBC Real Estate Luxembourg Luxemburg real estate Chairman of the Board N 100,00%KBC Internationale Financieringsmaatschappij NV Netherlands issuing company Member of the Supervisory Board N 100,00%KBC International Finance NV Curaçao issuing company Member of the Supervisory Board N 100,00%Gebema NV Belgium investment company Chairman of the Board N 100,00%KBC Credit Investments NV Belgium investment company Director N 100,00%
Luc Gijsens, Senior General ManagerReal Estate Participation n.v. Belgium property development Director N 50,00%KBC Vastgoedportefeuille n.v. Belgium real estate Director N 100,00%Immo-Basilix n.v. Belgium real estate Director N 95,00%Immo-Marcel Thiry n.v. Belgium real estate Director N 95,00%Immo-Regentschap n.v. Belgium real estate Chairman of the Board of Directors N 75,00%Immo-Zenobe Gramme n.v. Belgium real estate Director N 100,00%Immo-Plejaden Belgium real estate Director N 100,00%Immo-Kolonel Bourgstraat n.v. Belgium real estate Director N 50,00%Vastgoed Ruimte Noord Belgium real estate Director N 100,00%KBC Real Estate Luxembourg Luxemburg real estate Director N 99,99%Prague Real Estate Belgium real estate Director N 36,59%Wetenschap Real Estate Belgium real estate Director N 86,59%Apitri Belgium real estate Chairman of the Board of Directors N 100,00%Brussels North Distribution Belgium real estate Chairman of the Board of Directors N 100,00%Covent Garden Real Estate Belgium real estate Director N 50,00%FM-A Invest Belgium real estate Director N 50,00%Immo North-Plaza Belgium real estate Chairman of the Board of Directors N 100,00%Immo Antares Belgium real estate Director N 100,00%KBC Vastgoedinvesteringen Belgium real estate Chairman of the Board of Directors N 100,00%Luxembourg North Distribution Luxemburg real estate Chairman of the Board of Directors N 100,00%Luxembourg Offices Securitisations Luxemburg real estate Chairman of the Board of Directors N 100,00%Mechelen City Center Belgium real estate Chairman of the Board N 73,17%Immo Lux-Airport NV Luxemburg real estate Chairman of the Board N 48,76%
Sonja De Becker, DirectorAktiefinvest cvba Belgium real estate Executive Director N NSBB Accountants en Belastingconsulenten cvba Belgium Accountancy & consulting Chairman of the Board N NSBB Bedrijfsdiensten cvba Belgium Accountancy & consulting Executive Director N NMaatschappij voor Roerend Bezit van de Belgische Boerenbond Belgium holding company Director N NAcerta cvba Belgium holding company Director N NAcerta Consult cvba Belgium services sector Director N NAcerta Middelenbeheer Belgium services Director N NAgriflora cvba Belgium organisation of fairs Director N NStabo cvba Belgium products and services Director N NAgro - Services cvba Belgium temp Director N NBB-patrim Belgium holding company Director N N
Julien De wilde, Independent DirectorAgfa Gevaert Belgium industry Independent Director Euronext NBank J. Van Breda & Co Belgium financial sector Independent Director N NBekaert Belgium industry Director Euronext NCTO Mobility Belgium orthopaedic products Independent Director N NMetris Belgium ICT Chairman of the Board of Directors Euronext NNyrstar Belgium industry Chairman of the Board of Directors Euronext NTelenet Group Holding Belgium holding company Independent Director Euronext N
Pierre Konings, DirectorBD-World SA Belgium distribution Director N NE-Capital II Belgium private equity fund Chairman of the Board of Directors N N
Lode Morlion, DirectorAlmond&Co NV Belgium food Executive Director N NCera Beheersmaatschappij Belgium management Chairman N N
Paul Peeters, Director Almancora Beheersmaatschappij Belgium management Director N NCera Beheersmaatschappij Belgium management Director N N
Gustaaf Sap, DirectorCecan NV Belgium holding company Chairman of the Board N NCecan Invest NV Belgium financial sector Director N N
Patrick Vanden Avenne, DirectorCalibra Poultry NV Belgium poultry processing Chairman of the Board N NBiopower cvba Belgium industry Vice-Chairman of the Board of Directors N NBens NV Belgium food Executive Director N NSininvest NV Belgium poultry Director N NVanden Avenne Vrieshuis NV Belgium holding company + refrigeration Executive Director N NVanden Avenne - Ooigem Belgium compound feed Executive Director N NLacotrans NV Belgium transport Executive Director N NEuro-Silo NV Belgium transfer and storage of grain Director N NActa NV Belgium transport Director N NIsarick NV Belgium management Director N NHarpaca NV Belgium management Director N NLarinvest NV Belgium holding company Director N NIspahan NV Belgium management Director N NBavarco bvba Belgium stockbreeding business manager N NFidex NV Belgium transport Director N N
Dirk Wauters, DirectorVRT Belgium audio-visual media Executive Director N NVlaamse Audiovisuele Regie Belgium advertising Chairman of the Board of Directors N N
p. 9

Main events
Introduction
A description is provided below of the main developments at KBC Bank over the past financial year. In view of the far-reaching co-operation between KBC Bank and its sister companies, KBC Insurance, Kredietbank SA Luxembourgeoise (KBL European Private Bankers, below, abbreviated to KBL EPB) and the holding company, KBC Group NV, developments at these companies cannot in certain cases be viewed separately from those occurring at KBC Bank, with the result that additional information may be provided on these companies in this text from time to time.
. Description of the network and the main events in 2007
Retail & private bancassurance in Belgium Facts and figures, retail & private bancassurance in Belgium 2006 2007
Customers (estimate)
Bank customers (in millions) 3,4 3,4
Network
Retail bank branches, KBC Bank and CBC Banque* 869 865
Private banking branches, KBC Bank and CBC Banque 25 25
Bank agencies, Centea 708 712
Assets under management (in millions of EUR)
Investment funds for private individuals 71 481 78 940
Assets managed for private individuals 36 135 40 833
Assets managed for institutional investors 19 830 24 742
Group assets managed by KBC Asset Management 15 420 17 165
Total 142 866 161 680
Market share (estimates)
Loans 22% 22%
Deposits 19% 18%
Investment funds 34% 35%
Cross-selling indicators
Life insurance sold via the bank channel 82% 77%
Non-life insurance sold via the bank channel 12% 15%
E-payments indicators – Belgium
Percentage of payment transactions via electronic channels 91% 93%
Number of KBC- and CBC-Matic ATMs 1 240 1 277
Number of cash withdrawals at KBC- and CBC-Matic ATMs per month 3.2 million 3.9 million
Active subscribers to KBC Internet and PC banking facilities 510 000 580 000
Customer satisfaction
Percentage of customers surveyed who gave their KBC Bank branch a score of ‘good’ or ‘very good’ (min. 8/10) 69% 72%
Loan portfolio
Amount granted (in billions of EUR) 53,9 58,1* Excluding CBC's main branches (succursales), which offer services to both retail and corporate customers and which are covered in the section
on merchant banking.
p. 10

Network KBC serves its retail and private banking customers in Belgium through 890 bank branches (KBC Bank in the Dutch-speaking part of the country and CBC Banque in the French-speaking part), 712 independent bank agents of the savings bank Centea, 552 tied insurance agencies of KBC Insurance, and independent insurance brokers (for Fidea products). Additionally, the group offers its services and products through various electronic networks (see below for more information), as well as through call and contact centres. These centres will soon be regrouped and reintegrated, thus enabling them to be developed into true competency centres and fully fledged distribution and service channels. The group serves some 3.4 million bank customers (and, together with KBC Insurance, around 1.4 million insurance customers) in Belgium through its networks. Bancassurance co-operation A notable feature of KBC's network in Belgium is the unique bancassurance co-operation that exists between the bank branches of KBC Bank and the tied insurance agents of KBC Insurance within a well-defined area of operation, i.e. the 'micro market’. While the insurance agents focus on selling all insurance products in this micro market, the bank branches offer retail customers standard insurance products in addition to the traditional banking products. The bank branches refer customers to the insurance agents in the same micro market for other insurance products (non-standard insurance and insurance for non-retail customers). The insurance agents handle the claims for all insurance policies, including those sold through the bank branches. There are well-defined rules in place between the bank branches and insurance agents regarding referrals and fees. As an alternative to deposits or investment funds, life insurance is, by its nature, extremely suited to the product mix offered by bank branches. KBC Bank’s branches in Belgium have therefore traditionally accounted for the vast majority (around 77% in 2007) of the life insurance premium volume of the KBC group in Belgium. Needless to say, for non-life insurance, the KBC Insurance agents and the brokers are still the main distribution channels, accounting for 64% and 21% of premium volume, although KBC Bank’s network was already generating 15% of non-life insurance premium volume in Belgium in 2007. Market position 2007 saw further volume growth in most deposit and credit products. In total, lending by the group went up by around 14% in Belgium and deposit-taking by 9%. However, there was a shift in deposit products from traditional savings accounts (where the volume outstanding fell by 9% in one year) to other deposit products (mainly time deposits) and off-balance-sheet products (mainly investment funds), although this trend was reversed to some extent in the last quarter. Since the trend affected the whole Belgian market, KBC's market share remained broadly unchanged overall compared with the previous year (a slight increase in loans, a slight decrease in deposits). The group estimated its market share for the main products at year-end 2007 at 23% for mortgage loans, 12% for instalment loans, 22% for corporate lending (see the Merchant Banking section), 18% for savings deposits and 17% for customer savings certificates. KBC Bank’s share of the market in investment funds has risen virtually without interruption in the past few years, climbing to no less than 35% in 2007, so that the group remains the leader in Belgium for this type of product. Elements contributing to KBC’s extremely strong position in investment funds are its rapid response time (the group’s product factories are very quick to respond to the changing needs of customers in the area of investment products), the knowledge and expertise of the savings and investment advisers who are present in all points of sale, and the highly innovative approach. To give but one example of its innovativeness: in 2007, KBC launched two new unit-linked funds with capital protection whose return in each case is linked to a single share (the KBC and the Fortis share). The group’s range of funds also testifies to its particularly active involvement in socially responsible investment (SRI). For instance, figures from the Belgian Asset Managers Association show that, at the end of 2006, KBC Asset Management – with 23 SRI funds, 2.8 billion euros in managed assets and a market share of 51% – held the lead in the Belgian market. The group continued to innovate in its private banking services, too, adding KBC PortfolioScanner® to its range of portfolio management products in 2007, for example. Thanks to the detailed PortfolioScan report, clients gain a clearer view of the risk and return potential of their portfolio, and can make the most of investment opportunities within the limits of their personal risk budget. KBC Private Banking was named best private bank for entrepreneurs in Belgium by Euromoney at the start of 2008. Electronic channels KBC Bank makes its products and services available not only via an extensive network of branches, but also through high-performance electronic channels, which are continuously enhanced and upgraded. For example, in 2007, the range of electronic banking and insurance services provided through KBC-Online (KBC’s main system in Belgium for online banking and insurance) was expanded to offer customers more detailed account records, a ‘remittance folder’ facility for sending more than one transfer order to the bank at a time, and new, improved security in the form of a card reader.
p. 11

The success of KBC’s online bancassurance systems is reflected in a number of ways, such as in the continuously rising number of users. KBC-Online, CBC-Online and Centea-Online, combined, had more than 580 000 active customers at the end of 2007, 14% more than in the previous year. The KBC website was improved in numerous ways, too. In 2007, it was for instance expanded to include a new, personalised site for private banking and a new site for young people. In addition, the website is becoming a fully fledged sales channel through which more and more products (e.g., instalment loans) can be sold. In 2007, the KBC website had around 10 million visits from some 900 000 unique visitors every month. Customer satisfaction
Since KBC attaches a good deal of importance to customers’ experience, it conducts a customer satisfaction survey annually. The results of this survey are very encouraging. In 2007, customer satisfaction with the bank branches improved again: no less than 72% of customers were very satisfied with the service (i.e. they gave the branch a score of 8 or more out of 10), an increase of three percentage points on the previous year and as much as ten percentage points on 2004. Despite these excellent results, KBC is not planning to rest on its laurels. In 2007, for instance, initiatives were devised regarding the client approach with the aim of further improving the way customers are received in the bank branches, and various resources were developed to support relationship management.
Activities in Central & Eastern Europe and Russia Facts and figures, Central & Eastern Europe and Russia, 31-12-2007
Czech Republic Slovakia Hungary Poland Bulgaria Romania Serbia3 Russia
Customers (estimate)
Bank customers (in millions) 3,0 0,2 0,9 1,0 0,2 - 0,1 0,2
Network
Bank branches1 251 114 223 393 126 – 45 71
Assets under management
Total (in billions of EUR) 6,0 0,8 2,6 2,8 - - - -
Market share (estimate)
Traditional bank products (loans and deposits) 21% 8% 10% 4% 3% - 0,7% 0,5%
Investment funds 28% 12% 17% 4% – - – –
E-payment indicators
Number of proprietary ATMs 637 131 370 382 107 - 14 64
Active subscribers to Internet and PC banking facilities 400 000 50 000 70 000 200 000 2 000 - 1 000 10 000
Loan portfolio
Amount granted (in billions of EUR) 26,0 See Czech Republic 8,4 6,5 0,6 - 0,1 3,0
Population and expected GDP growth
Population, 2007 (in millions) 10,2 5,4 10,0 38,5 7,3 22,3 10,2 141,4Expected annual real GDP growth, 2008-2010 5,1% 6,5% 3,8% 5,5% 6,0% 5,9% 5,5% 5,7%
1 Corporate branches are counted separately, even if located in a retail branch. 2 Excluding acquisition of ČSOB (recognised in full under the Czech Republic). 3 Presence via sister company, KBC Insurance. Network At the end of 2007, KBC had a bank network in Central and Eastern Europe and Russia comprising more than 1 200 branches. Besides selling products through its bank branches in all of these countries, the group also uses other channels, such as the more than 3 000 Czech post offices, the points of sale of Kredyt Bank’s Polish consumer finance subsidiary, and of course various electronic channels.
p. 12

KBC Insurance, the sister company of KBC Bank, is also a prominent player in the insurance market in this region, which is enabling the KBC group to develop its bancassurance model in its Central and East European home markets as well. At the end of 2007, the group’s insurance companies had a combined network of over 14 000 tied insurance agents in the region. In most of its Central and Eastern European home markets, the group has a considerable share of the markets in traditional bank products (see table). The increasing sophistication of this region means that off-balance-sheet products, such as investment funds, are being seen more and more as alternatives to the more traditional products such as deposits. Moreover, as is the case in Belgium, the KBC group has a share of the market in investment funds that is even greater than its share of the market for traditional bank and insurance products (see below). Overall, the KBC group figures among the leading financial groups in Central and Eastern Europe, catering for around 5.5 million bank customers in the region.
Developments in the Czech Republic, Slovakia, Poland, Hungary and Slovenia KBC embarked upon its policy of expansion in Central and Eastern Europe by building up a strong presence in countries included in the first wave of accession to the EU: ČSOB in the Czech Republic and Slovakia, K&H Bank in Hungary, Kredyt Bank in Poland and Nova Ljubljanska banka (minority interest) in Slovenia. In 2007, KBC completed the process of buying out minority shareholders in these companies, a process started over the past few years. The main development in 2007 was the buy-out of the remaining 2.5% in ČSOB Bank. Excluding NLB (KBC considers its 34% holding in this bank as a purely financial participation) and Kredyt Bank (in accordance with the wishes of the Polish central bank, 20% of the shares in this company must be free float), the group now has a 100% stake in all its subsidiaries in the region. In line with the policy of having a differentiated bancassurance strategy per country, ČSOB was split into a separate Czech and a separate Slovak entity with effect from 1 January 2008.
At the end of 2006, the group also started to expand the bank branch network considerably in these countries, with the aim of increasing the number of branches by around one-third. The first step in this process was taken in 2007 with the opening of some 100 new branches. At the same time, the networks of insurance agents are being optimised and expanded, which should help intensify bancassurance co-operation. The results of this co-operation are becoming apparent: in the Czech Republic, for instance, almost seven out of every ten mortgage loans granted by ČSOB Bank in 2007 were sold along with home insurance from a group company and, for the region as a whole, more than half the life insurance premiums and some 8% of the non-life insurance premiums were sold through the bank sales networks. With market shares of 21% and 8% (the weighted average of the market share in lending and deposits), respectively, KBC is one of the top two banks in the Czech Republic and the fourth largest bank in Slovakia. In Hungary, the group is the second biggest, with a market share of 10%, and in Poland it is in the top ten, with a market share of 4%. KBC’s position in the investment fund market is even stronger, with a share of over 28% in the Czech Republic, 12% in Slovakia, 17% in Hungary and 4% in Poland. All market share data is based on estimates to some extent. The intention is to achieve a market share of at least 10% for traditional bank products in all countries, with even higher targets for investment funds. As in previous years, several KBC group companies in the region again won international awards in 2007. To point out but a few: The Banker named ČSOB ‘Bank of the Year 2007’ in the Czech Republic, while Global Finance awarded ČSOB 'Best Bank’ in the Czech Republic in 2007 and bestowed the equivalent title on NLB in Slovenia. Expansion into new Central and Eastern European countries and Russia In 2007, the group also embarked upon expansion into countries included in the second wave of accession to the EU (Bulgaria and Romania) and into Serbia (this last via KBC Insurance). To safeguard long-term growth, the decision was also taken to invest in a bank in Russia. The main acquisitions carried out in 2007 are commented on below. In December 2007, KBC Bank took an important step onto the Bulgarian banking market when it purchased a 75% stake in Economic and Investment Bank (EIB) for 0.3 billion euros. EIB has a network in Bulgaria of 126 branches – set to be extended in the years ahead – and a market share of some 3% in deposits and loans. Combined, DZI Insurance (a Bulgarian insurance company acquired by KBC Insurance in 2007) and EIB form one of the largest financial groups in Bulgaria, with an unrivalled distribution network that stretches across the entire country. Needless to say, establishing co-operation between the two companies in the field of bancassurance is one of the KBC group’s top priorities in Bulgaria. The companies are already co-operating at a commercial level by, for example, jointly selling a capital-guaranteed unit-linked life insurance product. In March 2007, KBC took over the Romanian company, Romstal Leasing, for around 70 million euros. Romstal has a share of some 4% of the Romanian leasing market and focuses on leasing cars and other rolling stock. At the same time, KBC acquired a shareholding in INK Insurance Broker in Romania and, in April, completed the acquisition of the broking house, Swiss Capital (now KBC Securities Romania). These acquisitions have provided the group with a foothold in the fast-growing Romanian market. The aim is to develop this position in the coming years through greenfield operations, organic growth or additional acquisitions.
p. 13

In Serbia, KBC acquired a number of smaller securities brokers (Hipobroker and Senzal), and took a 60% shareholding in a corporate finance specialist (Bastion). KBC Insurance also acquired A Banka in Serbia for 0.1 billion euros. A Banka has a network of 45 branches, and is present in all big and mid-sized cities in Serbia. In August 2007, KBC Bank acquired a 51% stake in Baltic Investment Company, a Latvian corporate finance boutique with offices in the Baltic states, Russia and Ukraine. This company – now called KBC Securities Baltic Investment Company – complements KBC Securities’ network in Central and Eastern Europe, which has been expanded considerably in recent years. The stock brokers and corporate finance companies are incorporated in full into the results of the Merchant Banking Business Unit.
In July 2007, KBC Bank completed the acquisition of 95% of Absolut Bank in Russia for around 0.7 billion euros. IFC has retained ownership of the remaining 5%. With this acquisition, KBC is entering an emerging European market, which, as already mentioned, should open up additional growth prospects in the years ahead. Indeed, with a population of 141 million people, expected annual real GDP growth of 5 to 6% in the coming years, and proportionately very low market penetration of bank and insurance products, Russia offers considerable potential for growth. KBC believes that through Absolut Bank (one of the fastest growing banks in Russia), it will be able to capitalise on the expected growth in financial products. Accordingly, extra attention will be given to the further development of the retail and SME segment, which should account for around 45% of the total activity mix by 2010 (around 30% today). To this end, the number of branches will be increased significantly in the years ahead.
Merchant banking activities (outside Central & Eastern Europe and Russia) Facts and figures, Merchant Banking 2006 2007
Customers (estimate)
Corporate banking (Belgium) 19 000 19 000
Network
KBC Bank corporate branches in Belgium, including branches catering for the social profit segment and CBC Banque succursales 33 33
KBC Bank branches in the rest of the world*, including representative offices 36 36
Assets under management
Total (in billions of EUR) 0,7 2,2
Market share (estimate)
Corporate lending (Belgium) 21% 22%
Loan portfolio
Amount granted (in billions of EUR) 94,0 101,6
* Excluding Central and Eastern Europe, solely corporate branches of KBC Bank or its subsidiaries, KBC Bank Nederland, KBC Bank Deutschland and IIB Bank.
Corporate banking
In Belgium, the group provides services to businesses – especially larger SMEs – through its network of sixteen KBC Bank corporate branches and thirteen CBC Banque main branches (succursales). The group also has four branches that focus solely on public sector and social profit institutions (in the social services, health care, education and similar sectors) and a central multinationals branch that caters for around sixty multinational companies. Through this network, KBC has become one of the top three players on the Belgian corporate banking market. Outside Belgium, the group has a select corporate banking presence through thirty-six branches, offices and subsidiaries of KBC Bank located primarily in Western Europe, but also in Southeast Asia and the US, that concentrate mainly on local midcap customers and customers that already do business with KBC’s Belgian or Central and Eastern European network. Additionally, these establishments operate in certain niches, which may include government finance, health care, real estate, financial institutions, trade finance or acquisition finance. In recent years, there have been few changes to the network abroad. In 2007, only one new branch was opened, in Spain (previously, there was only a representative office there), and in 2008 a new branch in Italy (Milan) is being considered. Despite the fact that, outside Belgium, the group’s position in most Western European countries is relatively limited, the corporate banking network outside Belgium and Central and Eastern Europe accounts for some 50% of the group’s loan portfolio.
p. 14

Besides providing general bank services, KBC Bank also operates in certain niche banking markets, such as acquisition finance, structured finance, real estate services and factoring, as well as finance for the diamond trade. Like the other business units, it collaborates with the Shared Services & Operations Business Unit (one of the five business units of the KBC group) in the area of payments, leasing, asset management, trade finance, etc. Market activities The market activities include all dealing room activities in Western Europe, the United States and the Far East, with the dealing room in Brussels accounting for the bulk of these activities. The group offers an extensive range of products to cope with interest rate and forex risks, ranging from simple products (deposits, forex spot transactions, forex and interest rate options, bonds, repos, etc.) to more exotic products, such as options, structured issues and Collateralised Debt Obligations (CDOs). The group is also a prominent player on the primary Eurobond market, and in 2007 participated in more than 200 syndicated deals as lead, co-lead or co-manager, including deals in a number of Central and Eastern European currencies. The group is also a major issuer on the international capital markets. For instance, in 2007, KBC raised almost 11 billion euros in cash under IFIMA’s Euro Medium Term Note programme, guaranteed by KBC Bank. Moreover, the solvency of KBC Bank was strengthened by a tier-1 issue in the amount of 150 million pounds sterling. In addition, KBC Bank engages in a variety of specialised market activities through a number of subsidiaries, viz. KBC Financial Products (trading in such instruments as convertible bonds, equities and their derivatives and credit derivatives), KBC Securities (equity trading and corporate finance), KBC Peel Hunt (a British securities house for institutional investors and one of the UK’s biggest market makers in small-cap shares), KBC Clearing in Amsterdam (clearing services for professional market players), and KBC Private Equity (the group’s investment company, specialising in financing buyouts and providing smaller local companies in the home markets with growth capital). Specific acquisitions and the expansion of activities Where opportune, KBC intends to expand its existing range of merchant banking activities by means of targeted acquisitions. In 2007, for example, KBC Securities consolidated its position as market leader in Central and Eastern Europe by acquiring a number of brokers in the region: Swiss Capital (now KBC Securities Romania), Equitas (now KBC Securities Hungary), DZI Invest (Bulgaria), Baltic Investment Company (now KBC Securities Baltic Investment Company, with activities in the Baltic states and Russia), Indigo Capital (now KBC Securities Ukraine), Bastion (a Serbian corporate finance specialist; now KBC Securities Corporate Finance LLC), Senzal (now KBC Securities Beograd) and Hipobroker (now KBC Broker). As a result of this considerable expansion, KBC Securities was already generating around 45% of its 2007 net profit in the Central and Eastern Europe region. In 2007, KBC also took over ING’s 50% stake in International Factors Belgium, leaving the group with full ownership of this factoring company – now called KBC Commercial Finance. KBC is also starting to provide factoring services in Central and Eastern Europe, beginning with Hungary. KBC Financial Products – which added to its range of activities in 2006 by entering the life insurance settlement business (a typically American phenomenon, where life insurance policies are bought from policyholders) – entered other new markets in 2007, including the reverse mortgage market (where loans are provided mainly to older home owners, who receive an amount or periodic payments against the value of their house and where repayment starts only when the owner of the house no longer resides there (e.g., if the house is sold or the owner dies)). Moreover, aside from the above acquisitions, 2007 was also an exceptionally busy year for several of the existing specialised merchant banking businesses, as attested to by the following examples. The acquisition finance teams in Brussels, London, Paris, Frankfurt, Madrid, Dublin, New York and Hong Kong again had a very good year, with new deals spread evenly across regions and sectors. KBC Private Equity continued to grow its business: at the end of 2007, the private equity portfolio contained no fewer than sixty-five direct active investments, with a combined market value of almost 500 million euros. The project finance and structured trade finance units also stepped up their activities considerably. Some notable project finance deals relate to the airport in Budapest, the new Central Criminal Courts Complex in Dublin and Alco Bio Fuel in Belgium, an interesting renewable energy project. Lastly, the real estate activities yielded significant gains on the sale of buildings in Brussels and Luxembourg, achieved growth in the real estate finance portfolios in Belgium and Central and Eastern Europe, and financed a number of large logistics parks and shopping centres in Romania.
p. 15
E-services As it does for its retail customers, KBC likewise provides e-banking and e-insurance services specifically for companies, including KBC-Online for Business, an online application for the SME market that, in addition to the facilities in KBC-Online for private individuals, also offers facilities specially designed for the self-employed and businesses. Two years after its launch, KBC-Online for Business already has almost 40 000 active subscribers. Other e-services for companies include KBC@Isabel, an offline application developed by KBC and integrated into Isabel (a multi-bank network facilitating communication among banks and companies); KBC-Flexims, an Internet channel for sending and receiving applications for, or making changes to or payments under documentary credit, documentary collections and bank guarantees; w1se Corporate e-Banking®, an Internet-based program for companies operating internationally; KBC Deal, Internet software that enables spot, forward and swap transactions to be carried out online in a user-friendly way; and the KBC Payment Button, which guarantees safe and swift payment via the Internet.
Corporate social responsibility Corporate social responsibility (CSR) is a long-term process which requires ongoing adaptation of and improvement in the way a company conducts its business, not only for the purpose of making a financial profit, but in response to the increasing demands for transparency and accountability placed on the company by its stakeholders (employees, customers, shareholders, suppliers, etc.) and by society as a whole. KBC’s vision on CSR is embedded in its mission statement, and more specific commitments are set out in its Principles for Socially Responsible Business. As a member of local CSR organisations and signatory to national and international CSR principles (including the United Nations Global Compact and the Luxembourg Charte d’entreprise pour la responsabilité sociale et le développement durable), KBC intends to enter into a proactive commitment vis-à-vis its stakeholders. Since 2005, the group has also been publishing an annual Corporate Social Responsibility Report, which deals with its vision and achievements in this area. This report provides group-wide information on CSR, including quantitative data on KBC staff and the group’s ecological footprint. It is compiled in accordance with the reporting requirements set out in the Global Reporting Initiative G3 Guidelines and the United Nations Global Compact principles. Also in 2007, KBC’s subsidiaries, K&H Bank in Hungary and ČSOB in the Czech Republic, published their own separate CSR reports for the first time. More information can be found at www.kbc.com/social_responsibility and in the annual KBC Corporate Social Responsibility Report.
p. 16

Value and risk management
Introduction
At KBC Group, a group-wide approach is taken to value and risk management, implying that the value and risk management of KBC Bank, as a subsidiary of KBC Group, is encompassed by this approach and inextricably linked to the value and risk management of other subsidiaries (such as KBC Insurance and KBP EPB). The section below focuses on the risk management of the banking activities.
Vision and principles (KBC Group)
At KBC, the essential characteristics of value and risk management are as follows:
• Value, risk and capital management are inextricably linked to one another. Every company’s aim is to create value. To achieve this aim, decisions are taken and activities developed, even though there is no certainty as to where they will lead. To ensure its own continuity, a company must have adequate capital to be able to deal with any unforeseen consequences of adverse developments.
• Risk management is approached from a comprehensive, group-wide angle, taking into account all the risks a company is exposed to and all the activities it engages in.
• Primary responsibility for value and risk management lies with line management, while a separate Group Value and Risk Management Directorate (WRB), operating independently of line management, performs an advisory, supporting and supervisory role.
• The group’s risk governance model is also, where relevant, duplicated at the level of the business units and subsidiaries.
The information in this section has been audited by the statutory auditor only where required under IFRS, viz.: o The entire ‘Vision and principles’ section; • The entire ‘Risk governance model’ section; • The following parts of the ‘Credit risk management’ section:
o Description o Managing credit risk, banking o The ‘Loan portfolio’ table and the ‘Other credit exposure’ table (audited parts are indicated in the footnote to the tables)
• The following parts of the ‘Asset/Liability management’ section: o Description o
‘ALM in 2007: Interest rate risk’ (first three paragraphs) ‘Managing ALM risk’
oo ‘ALM in 2007: Foreign exchange risk’
• The entire ‘Liquidity risk management’ section; • The entire ‘Market risk management’ section (unless otherwise indicated) • The following parts of the ‘Solvency’ section:
o Description ‘Managing solvency’ o
o ‘Solvency in 2007’ (first two paragraphs and the parts of the table indicated in the footnotes)
p. 17

Risk governance model (KBC Group)
KBC’s risk governance model defines the responsibilities and tasks required to manage value creation and all the associated risks. The governance model is organised in different tiers:
• The Board of Directors (assisted by the Audit Committee), the Group Executive Committee and the Group Asset/Liability Management Committee (ALCO). These committees concentrate on global risk management and on monitoring value creation and capital adequacy for the entire group. Regular reporting to the Audit Committee ensures that there is an ample flow of information to the relevant members of the Board of Directors. Each year, the full board sets the risk tolerance limits. The Group Executive Committee is responsible for the implementation of the value, risk and capital management strategy defined by the Board of Directors and outlines the structure of such management. The Chief Financial and Risk Officer (CFRO), a member of the Group Executive Committee, supervises risk management. The Group ALCO takes the investment and funding decisions and also monitors the relevant risk exposure.
• Specialised group risk committees. These committees concentrate on developing a group-wide framework for one particular type of risk or cluster of activities and monitor the associated risk management process. Chaired by the CFRO, the risk committees are composed of representatives from line management and the Group Value and Risk Management Directorate. The various group committees are: • the Group Trading Risk Committee, which monitors all risk associated with trading activities; • the Group Credit Risk Committee, which supervises the composition and quality of the loan portfolio (including
credit risk in respect of (re)insurance); • the Group Operational Risk Committee, which oversees operational risk management; • the Group Insurance Risk Committee, which monitors specific insurance risks.
Depending on the materiality of specific risk types, local risk committees and local value and risk management units have been put in place at a lower level (e.g., business unit, country and subsidiary), to roll out the risk management framework.
• The Group Model Committee (GMC) uses reports drawn up by independent validation units to decide on the validity of quantitative and operational risk aspects (such as model usage, monitoring activities, etc.) of all the risk models developed and/or used within the group.
• The Group Internal Audit division is responsible for audit planning and thus audits the compliance of the risk management framework with legal and regulatory requirements, the efficiency and the effectiveness of the risk management system and its compliance with the risk management framework, as well as the way in which line management handles risks outside this formal framework.
• Line management has primary responsibility for value and risk management. It ensures that the risk management framework relating to the business is embedded in the business through policies and procedures. It is also entrusted with the task of developing transactional models.
• The Group Value and Risk Management Directorate measures risks, economic capital and value creation for all business entities and reports its findings to line management. It is also responsible for developing portfolio models, as well as for validating all models (both transactional and portfolio models). In this respect, there is a clear segregation of responsibilities within this directorate, as validating staff is different from modelling staff.
Board of Directors
Audit Committee
Group Executive Committee
(Chief Risk Officer)
Group ALCO Group Value and Risk Management Directorate
Group Trading Risk Committee Group Insurance Risk Committee
Group Operational Risk Committee
Group Credit Risk Committee
p. 18

Credit risk management
Description Credit risk is the potential shortfall relative to the value expected consequent on non-payment or non-performance by an obligor (a borrower, guarantor, counterparty to an inter-professional transaction or issuer of a debt instrument), due to that party’s insolvency or lack of willingness to pay, or to events or measures taken by the political or monetary authorities of a particular country. The latter risk is also referred to as ‘country risk’. Managing credit risk, banking
Credit risk is managed at both transactional and portfolio level. Managing credit risk at the transactional level means that there are sound procedures, processes and applications in place to estimate the risks before and after accepting individual credit exposures. Managing the risk at portfolio level encompasses periodic reporting on (parts of) the consolidated loan portfolio, monitoring limit discipline and the specific portfolio management function.
Credit risk management at transactional level
Acceptance. Credit proposals are submitted in writing by a commercial entity. Unless a small amount or a low risk is involved, a loan adviser screens the proposals and makes a recommendation. In principle, significant loan decisions are taken jointly by two or more managers. Matrices that take account of such parameters as the group risk total, the risk class and the type of counterparty (private individuals, companies, etc.) determine at what level decisions should be taken. The ‘group risk total’ is the sum of all credit and limits that all companies in the borrower or counterparty’s group already have or have applied for from all KBC group entities (including the investment portfolios and guarantees received for exposure to other groups). The ‘risk class’ reflects the assessment of the risk and is determined primarily on the basis of internally developed rating models. Supervision and monitoring. How the credit is monitored is determined primarily by the risk class, with a distinction being made based on the Probability of Default (PD) and the Expected Loss (EL). The latter takes account not only of the PD, but also of the amount expected to be left outstanding on default and the non-recoverable loss in that event. The ‘normal’ loan portfolio is split up into internal rating classes ranging from 1 (lowest risk) to 9 (highest risk), and this for both the EL and the PD. Loans to large corporations in this portfolio are reviewed periodically, at least once a year. Reviews of loans to small and medium-sized enterprises are based primarily on risk signals (such as a significant change in the risk class). It is not only credit that is monitored, credit decisions are too, i.e. a member of a credit committee will supervise decisions taken at the decision level immediately below, by checking whether the decision is consistent with lending policy. Defaulting obligors are put into PD classes 10, 11 or 12. PD class 10 is for ‘still performing’ borrowers, i.e. borrowers with loans for which interest payments and principal repayments are not more than 90 days in arrears or overdrawn. Classes 11 and 12 are for ‘non-performing’ borrowers. Class 11 groups borrowers that are more than 90 days in arrears or overdrawn, while class 12 comprises borrowers whose credit has been cancelled or which are in danger of going bankrupt. For the larger loans, an overview of all borrowers in default is submitted to the Group Executive Committee every quarter. Credit to individuals is generally granted in the local currency, except in some Central and Eastern European countries and Russia, where credit in foreign currency is very popular on account of the significant gap between interest rates in the local currency and interest rates in other currencies (mainly euros or Swiss francs). In view of the currency risk inherent in such credit, an additional buffer is required (in terms of the loan-to-value ratio, net disposable income thresholds and shorter maturities) and therefore it is closely monitored (by means of stress tests). If the remaining currency risk is still too high, it is hedged at group level. Impairment. For credit granted to borrowers in PD classes 10, 11 and 12 (impaired loans), KBC records impairment losses based on an estimate of the net present value of the recoverable amount. In addition, for credit in PD classes 1 to 9, impairment losses are recorded on a ‘portfolio basis’, using a formula based on the IRB Advanced models used internally (or an alternative method if an IRB Advanced model is not yet available). This formula was introduced in the fourth quarter of 2007 in order to better comply with IFRS requirements for Incurred But Not Reported provisions. Previously, a formula based solely on credit provided to borrowers in PD classes 8 or 9 was used.
p. 19

Loans can be renegotiated in order to eliminate arrears or impairment. Only marginal amounts and a limited number of loans are renegotiated. In 2007, renegotiations occurred mostly at K&H Bank (corporate and SME segment) and Kredyt Bank, where an estimated 17 million euros and 114 million euros (0.4% and 2% of their respective credit exposure) was restructured to avoid further impairment or arrears. Credit risk management at portfolio level Monitoring is also conducted on a portfolio basis, inter alia by means of quarterly reports on the consolidated loan portfolio. The largest risk concentrations are, in addition, monitored via periodic and ad hoc reports. Limits are in place at borrower or counterparty level, at sector level and for specific activities (such as acquisition finance) or geographic areas. Whereas some limits are still in notional terms, more advanced concepts (such as 'expected loss' and 'loss given default') are increasingly being used. Moreover, stress tests are performed on certain types of credit. For commercial real estate credit, caps are defined in terms of stressed expected loss exposure. As part of the credit function, the portfolio management desk actively manages and monitors the loan portfolio. Using a model, this unit pinpoints risk concentrations and enhances the diversification of the loan portfolio using such instruments as credit derivatives. The portfolio management desk also co-ordinates credit securitisation operations. At the end of 2007, there were two securitisation operations outstanding involving own loans, namely Phoenix Funding, a securitisation operation set up in 2001 and involving IIB Homeloans' mortgage loans, for an amount outstanding of 0.2 billion euros, and Home Loan Invest III, set up in 2007 for liquidity reasons and involving KBC Bank mortgage loans, for an amount outstanding of 3.5 billion euros. The underlying assets of both operations, however, continue to be included in the overview of the loan portfolio (see below).
Overview of the loan portfolio, banking
The loan portfolio (see table) includes all (committed and uncommitted) working capital credit lines, investment credit, guarantee credit, credit derivatives (protection sold) and non-government securities in the investment books of the group's banking entities. It excludes government bonds, trading book securities, interprofessional transactions (deposits with financial institutions, exchange transactions, etc.), short-term commercial transactions (e.g., documentary credit) and intragroup transactions. The loan portfolio therefore differs significantly from ‘Loans and advances to customers’ in the ‘Consolidated annual accounts’ section, Note 18 (this item, for instance, does not include loans and advances to banks, guarantee credit and credit derivatives, the undrawn portion of credit or corporate and bank bonds in the investment portfolio, but does include repurchase transactions with non-banks). At the end of 2007, the total portfolio of credit granted came to 204 billion euros, 14% more than a year earlier. The loan portfolio is broken down according to different criteria (see table). As regards the sector breakdown, only five sectors account for more than 5% of the portfolio of credit granted, viz.: the financial sector, private individuals (where exposure, by definition, is spread over many relatively small loans), the non-financial services and the retail and wholesale sectors (both of which group a variety of subsectors) and the commercial real estate sector (which has a broad geographic spread). Loan portfolio 31-12-2006 31-12-2007
Total loan portfolio (in billions of EUR)
Amount granted 182,0 204,3
Amount outstanding 135,3 159,9
Loan portfolio breakdown by area of activity (as a % of the portfolio of credit granted)
Belgium (retail and private banking) 30% 29%
Central & Eastern Europe and Russia 19% 22%
Merchant Banking (excluding Central & Eastern Europe and Russia) 52% 50%
Total 100% 100%
Loan portfolio breakdown by credit type (as a % of the portfolio of credit granted)1
Loans 88% 88%
Working capital credit lines 1 39%
Investment credit 1 49%
Mixed lines 1 0%
Guarantee credit 6% 5%
Corporate bonds 3% 4%
Bank bonds 4% 3%
Total 100% 100%
Loan portfolio breakdown by counterparty sector (as a % of the portfolio of credit granted)5
Private individuals 27% 28%
p. 20

Financial and insurance services 15% 14%
Governments 3% 4%
Corporates 55% 55% Non-financial services 9% 10% Retail and w esale trade hol Real estate
8% 8%6% 7%
Construction 4% 4% Automobile indust ry Chemical try
3% 3% indus
Electricity 2% 2%3% 2%
Agriculture, stock farming and fishing 2% 2% Food i ustry nd Meta
2% 2%ls
Other 2% 2%
14% 12%
Total 100% 100%
Loan portfolio breakdown by risk class (part of the portfolio2, as a % of Exposure at Default)6
PD 1 (lowest risk, default probability ranging from 0.00% to 0.10%) 24% 25%
PD 2 (0.10% – 0.20%) 15% 15%
PD 3 (0.20% – 0.40%) 21% 14%
PD 4 (0.40% – 0.80%) 14% 17%
PD 5 (0.80% – 1.60%) 13% 17%
PD 6 (1.60% – 3.20%) 6% 7%
PD 7 (3.20% – 6.40%) 5% 4%
PD 8 (6.40% – 12.80%) 1% 2%
PD 9 (highest risk, 12.80% – 100.00%) 1% 1%
Total 100% 100%
Impaired loans3 (PD 10 + 11 + 12; in millions of EUR or %)
Impaired loans 3 257 3 310
Specific impairment 1 933 1 943
Portfolio-based impairment 222 185
Loan loss ratio, negative figures indicate a positive impact on profit Belgium (retail and private banking) 0.07% 0.13%
Central & Eastern Europe and Russia 0.58% 0.26%
Merchant Banking (excluding Central & Eastern Europe and Russia) -0.01% 0.02% Total 0.14% 0.11%
Non-performing (NP) loans (PD 11 + 12; in millions of EUR or %)
Amount outstanding 2 157 2 329
Specific impairment for non-performing loans 1 488 1 456
Non-performing ratio Belgium (retail and private banking) 1.5% 1.6%
Central & Eastern Europe and Russia 2.4% 2.1%
Merchant Banking (excluding Central & Eastern Europe and Russia) 1.3% 1.0% Total 1.6% 1.5%
Cover ratio
Specific impairment for non-performing loans/outstanding non-performing loans 69% 63%Specific and portfolio-based impairment for performing and non-performing loans/outstanding non-performing loans 100% 91%
1 The breakdown has been refined since mid-2007. Working capital credit lines include overdraft facilities and revolving facilities for working capital purposes. Investment credit incorporates term loans, mortgage loans and other non-revolving facilities and revolving facilities for investment purposes. Other credit is reported under mixed lines. 2 Since some parts of the portfolio have not yet been broken down by risk class (in particular, the loan portfolio of Absolut Bank), they have been excluded. Due to the change in the scope of consolidation, the 2006 figures have been restated. The significant shift from PD class 3 to PD classes 4 and 5 in 2007 is largely attributable to an improved PD model for the IIB Homeloans portfolio, which resulted in the majority of its loans being put into a higher PD class. Due to the fact that the loss given default for this portfolio is very low, this shift has had a negligible negative impact on the overall quality of the loan portfolio. 3 Figures differ from the figures appearing in the ‘Consolidated financial accounts’ section, Note 20, due to differences in scope. 4 For the Czech Republic and Slovakia, the loan loss ratio at 31 December 2007 came to 0.27%, for Hungary to 0.62%, for Poland to -0.34% and for Russia to 0.21%. 5 Audited figures. 6 Audited figures (except for the range or probability of default).
p. 21

Other credit exposure Besides the credit risks in the loan portfolio, there are other credit risks that arise in other bank activities. The main ones are shown in the table. Short-term commercial transactions. This type of credit involves export or import finance and only entails exposure to financial institutions. It includes documentary credit, pre-export and post-import finance and related transactions with a term to maturity of no more than two years. At the end of 2007, commercial exposure came to 1.8 billion euros (outstanding amount). Despite the high proportion of non-investment-grade banks in this exposure (roughly 45%), losses are very low in historical terms, particularly for documentary credit. Risks associated with this activity are managed by setting limits per financial institution and per country or group of countries. Trading book securities. Issuer risk (potential loss on default by the issuer) in trading exposure came to 3.7 billion euros at the end of 2007. KBC Financial Products (KBC FP) accounted for 0.8 billion euros of this total. At KBC FP, issuer risk is measured on the basis of the estimated loss given default by the issuer, based on the prevailing market value less the amount expected to be recovered depending on the type of issue (guaranteed or not). Moreover, only counterparty risk arising with long positions is taken into account at KBC FP, meaning that issuers in respect of which a short position exists on balance are not accounted for in credit risk reporting. The issuer risk exposure of other entities (aside from KBC FP) measured on the basis of the market value of the securities came to 2.9 billion euros. Issuer risk is curtailed through the use of limits both per issuer and per rating category. The exposures shown in the table concern the issuer risk measured in the way described in this paragraph. The exposure to asset-backed securities in the trading book is not included in this figure (see 'Credit-linked investments and subprime exposure'). Counterparty risk in interprofessional transactions (deposits with professional counterparties and derivatives trading). This reflects the potential loss on transactions should the counterparty default on its obligations. The amounts shown in the table are the group’s pre-settlement risks, measured as the sum of the (positive) current replacement value (‘mark-to-market’ value) of a transaction and the applicable add-on, determined according to the current exposure method under Basel II. At the end of 2007, the group’s total pre-settlement risk came to some 31 billion euros. Deposits account for slightly less than 40% of this amount. The bulk of the deposits are due from banks with an investment-grade rating. Risks are curtailed by setting limits (separate limits for both pre-settlement and settlement risk) per counterparty. Moreover, close-out netting and collateral techniques are used wherever possible. For netting to apply, derivatives transactions need to be documented under ISDA-92 or ISDA-2002 Master Agreements. Repo transactions can only be netted if a GMRA has been concluded. In addition, nettability rules have been established for all relevant jurisdictions and all relevant products, based on legal opinions published by ISDA. Financial collateral is only taken into account if the assets concerned are considered eligible risk-mitigants for regulatory capital calculations (Basel II). This implies, among other things, that legal comfort must have been obtained regarding the ownership of the collateral for all relevant jurisdictions. Government securities in the investment portfolio. Exposure to governments came to 32.1 billion euros at the end of 2007 (measured in terms of book value) and is accounted for mainly by EU states (particularly Belgium), which pose a minimal credit risk. Local or regional governments account for only a fraction of the exposure (0.2 billion euros). The considerable exposure to governments is consistent with reinvestment policy (see ALM). However, there are limits for this type of credit exposure, as well, certainly for governments with a lower than ‘AA’ internal rating. Other credit exposure1 31-12-2006 31-12-2007
Short-term commercial transactions Amount (in billions of EUR)4 1.3 1.8By area of activity, %
Belgium (retail and private banking) 3% 3%Central & Eastern Europe and Russia 7% 6%Merchant Banking (excluding Central & Eastern Europe and Russia) 90% 91%Total 100% 100%
Issuer risk2 Amount (in billions of EUR)4 2.3 3.7By area of activity, %
Belgium (retail and private banking) 0% 0%Central & Eastern Europe and Russia 6% 5%Merchant Banking (excluding Central & Eastern Europe and Russia) 94% 95%Total 100% 100%
Counterparty risk in interprofessional transactions3 Amount (in billions of EUR)4 22.3 31.0By area of activity, %
Belgium (retail and private banking) 5% 0%Central & Eastern Europe and Russia 16% 18%Merchant Banking (excluding Central & Eastern Europe and Russia) 79% 82%Total 100% 100%
p. 22

Government bonds in the investment portfolio Amount (in billions of EUR)4 36.6 32.1By area of activity, %
Belgium (retail and private banking) 8% 8%Central & Eastern Europe and Russia 21% 28%Merchant Banking (excluding Central & Eastern Europe and Russia) 71% 64%Total 100% 100%
1 Figures do not include Absolut Bank nd Economic and Investment Bank (except those for 'Government bonds in the investment portfolio'). a2 Excluding OECD government bonds. 3 After deduction collateral and netting benefits. The breakdown by area of activity is an approximation. of4 Audited figures. Country risk Country risk is managed by setting limits per country and per maturity. It is calculated for each country separately according to a conservative method (see below). Proposals for setting or changing country limits are handled centrally at head office and, after independent credit advice is taken, submitted for approval at the relevant level of decision authority. Before any new transactions are entered into, availability under the country limits and, where relevant, the sublimits concerned has to be checked.
Method used to calculate country risk The following risks are included: • credit (including so-called medium- and long-term export credit, IFC ‘B’ loans and performance risks); • bonds and shares in the investment portfolio; • placements and (the weighted risk for) other interprofessional transactions (such as exchange transactions and swaps); • short-term commercial transactions (such as documentary credit and pre-export finance). In principle, individual transactions are charged against country limits according to the following rules: • fully fledged guarantees transfer the country risk to the guarantor’s country; • if a transaction is carried out with the office/branch of a company which has its head office in another country, the transaction will be assigned to
the country where the office/branch is located, unless the rating of the country where the head office is located is lower, in which case the transaction will be assigned to this last country;
• exposure in the counterparty’s national currency and risks in respect of countries in the euro area are not included, but are reported separately.
Country risk (excluding local-currency transactions)* In millions of EUR (31-12-2007)
Total
Western Europe
(excl. euro
area)
Central and
Eastern Europe
Asia North America
Middle East
Latin America Africa Oceania
International
institutions
By transaction type
IFC ‘B’ loans 41 2 1 26 0 0 5 1 0 6
Performance risks 1063 84 507 31 11 54 223 153 2 0
Other loans 18 708 4 976 7 791 2 271 2 566 516 287 139 135 27
Bonds and shares 8 929 3 930 2 329 531 1 473 106 322 0 76 161
Interprofessional transactions (weighted) 5 028 2 389 1 014 947 273 141 243 1 12 8
Medium- and long-term export finance 164 4 39 6 0 5 8 102 0 0
Short-term commercial transactions 1 484 42 283 415 11 529 108 95 1 0
Total 35 418 11 428 11 964 4 227 4 333 1 350 1 196 490 227 203
Breakdown by remaining tenor
Not more than 1 year 11 918 3 074 3 959 2 661 860 683 477 112 56 35
More than 1 year 23 500 8 353 8 005 1 566 3 474 667 719 378 171 168
Total 35 418 11 428 11 964 4 227 4 333 1 350 1 196 490 227 203* Excluding Economic and Investment Bank (Bulgaria). Internal credit risk models and Basel II
In order to quantify credit risks, the group has developed various rating models, both for the purpose of determining how creditworthy borrowers are and to estimate the expected loss of various types of transactions. These models support credit risk management in such areas as pricing, the credit process (acceptance and monitoring) and determining portfolio-based impairment. A number of models are uniform throughout the group (for instance, the
p. 23

models for governments, banks, large companies and project finance), while others have been designed for specific geographic markets (SMEs, private individuals, etc.). The same internal rating scale is used throughout the group. Starting in 2007, these models have also formed the building blocks for calculating the regulatory capital requirements for credit risk. KBC has in other words opted to use the Internal Rating Based (IRB) Approach. Initially, KBC will use the IRB ‘Foundation’ Approach, but a switch to the ‘Advanced’ approach is envisaged in 2011. The switch to the Basel II IRB Foundation approach is taking place in stages, with KBC Bank NV and most of its main subsidiaries having already switched over in 2007. A number of other material group companies (K&H Bank, Kredyt Bank, Absolut Bank, Centea and the Antwerp Diamond Bank) will switch to the standardised Basel II approach in 2008 and adopt the IRB Foundation approach in 2009-2010 (subject to regulatory approval). From 2008 on, the other (non-material) entities of the KBC group will follow the standardised approach. The far-reaching introduction of rating models in the network has not only stimulated risk-awareness, it has also resulted in the models themselves being constantly tested against the market. Indeed, keeping the rating models up to date is just as important as developing them. An appropriate framework for the governance of the life cycle of risk models is thus in place, with model ownership (the credit function) being separate from responsibility for model validation (the Group Value and Risk Management Directorate). A Model Committee at group level is responsible for the final validation of all models. Credit-linked investments and subprime exposure KBC’s credit-linked investment exposure is shown in the table and consists of: • the ‘main CDO portfolio’, which contains collateralised debt obligations (CDOs) with some asset-backed securities
(ABS) as the underlying in the group’s books; • the ‘Atomium’ portfolio, which consists of credit-linked securities of the former conduit Atomium, taken onto KBC’s
own balance sheet; • ‘other portfolios’, containing other credit-linked instruments whose underlying assets are primarily European
assets. The subprime-related credit risk attached to the main CDO portfolio is minor, because: • the share of US subprime mortgages in the pool of underlying assets is very limited (see table), with the bulk of the
CDOs' underlying assets relating to corporate debt; • the CDO notes held are only high-rated tranches (63% of which are super senior and 25% AAA) and have high
attachment points (allowing substantial losses on subprime assets before being impacted); moreover, provisions were set aside for equity and junior notes at the time of issue;
• all CDOs in the portfolio have been originated and are actively managed by KBC Financial Products, allowing effective asset substitution when necessary.
The subprime-related credit risk attached to the ‘Atomium portfolio’ is also minor, as only a limited percentage of the securities relates to subprime RMBS (see table) and all securities are AAA-rated. The ’other portfolios’ have no subprime exposure. At year-end 2007, the group had not incurred any credit losses on these portfolios. There was, however, a negative impact on net profit due to the marking to market of the 'main CDO portfolio', which contains CDOs with some ABS as the underlying (see table; since synthetic CDOs and hence embedded derivatives are involved, market valuation changes are recognised in profit and loss), and a negative impact on equity due to the marking to market of the ‘Atomium portfolio’ and ‘other portfolios’ (see table).
p. 24

Credit-linked investments*, KBC group (31 December 2007) Description Amount (in
billions of EUR)
Rating of securities held
Of which subprime RMBS
Credit losses incurred
Value adjustments due to marking-to-market of the instruments (in millions of EUR)
Main CDO portfolio 4.2 100% investment-grade
13% subprime RMBS underlying
None In P/L: 103 (pre-tax) or 67 (after tax)
Atomium portfolio 2.0 100% investment-grade (100% AAA)
33% subprime RMBS
None
Other portfolios 6.0 100% investment-grade
No subprime exposure
None
In equity: 107 (pre-tax) or 72 (after tax) **
* Excluding the notes held by KBC in its in-house securitisation vehicle, Home Loan Invest (set up primarily for treasury purposes). ** There was also a limited impact on the income statement (13 million euros (before tax) or 8 million euros (after tax)) where the trading book is concerned.
Exposure to credit insurers The group has no direct counterparty exposure (i.e. straightforward credit facilities) to credit insurers (MBIA, Ambac, FSA, etc.). The indirect exposure relates to reinsurance cover written by those companies related to the CDOs, underlying exposure to those companies in the CDOs, and credit enhancement received from those companies for liquidity facilities granted by KBC to public finance and health care sector counterparties (as well as some very limited support facilities for these companies, related to the municipal business). Provisions to the tune of 39 million euros (15% of the positive replacement value of the outstanding credit derivatives) have been set aside for the exposure related to reinsurance cover for the CDOs. Since the underlying public finance counterparties of the liquidity facilities carry high ratings (32% AA and 68% A), their expected default frequency is very low, hence the probability of KBC having to call the guarantee provided by the credit insurers is very low.
Asset/Liability management Description Asset/Liability Management (ALM) is the process of managing KBC’s structural exposure to macroeconomic risks. These risks include: • interest rate risk, • equity risk, • real estate risk, • foreign exchange risk, • inflation risk, • credit risk (limited to the investment portfolios). ‘Structural exposure’ encompasses all exposure inherent in the commercial activity of KBC or the long-term positions held by the group (banking). Trading activities are consequently not included. Structural exposure can also be described as a combination of: mismatches in the banking activities linked to the branch network’s acquisition of working funds and the use of
those funds (via lending, among other things); the risks associated with holding an investment portfolio for the purpose of reinvesting shareholders’ equity; the structural currency exposure stemming from the activities abroad (investments in foreign currency, results
posted at branches or subsidiaries abroad).
Managing ALM risk The main purpose of ALM is to optimise the risk/return profile of the group, subject to the risk tolerance limits set by the Board of Directors. ALM risks are managed and monitored by the Group ALCO, which is responsible for establishing a group-wide framework for identifying, measuring and overseeing ALM activities and for taking strategic investment decisions for the entire group. At the subsidiaries outside the euro area, local ALCOs have been set up.
p. 25

A team in the Group Value and Risk Management Directorate provides support to the Group ALCO and helps to develop ALM risk management; similar teams exist at the subsidiaries outside the euro area. The ALM strategy is implemented locally by front-office units, co-ordinated by a central investment function which is responsible for co-ordinating the various ALM strategies. The main building blocks of KBC’s ALM framework are:
• a focus on ‘economic value’ as the cornerstone of ALM policy, with attention also being paid to criteria such as income, solvency and liquidity;
• the use of a uniform ALM measurement methodology for banking activities based on ‘fair value models’ that forecast the behaviour of the value of a product group under different market scenarios and that are translated into replicating portfolios (combinations of market instruments that allow the relevant product groups to be hedged with the lowest risk);
• the use of a Value-at-Risk (VAR) measurement method for the various categories of risk throughout the group for risk budgeting and limit-setting purposes. This VAR measures the maximum loss that might be sustained over a one-year time horizon with a 99% confidence level as a result of movements in interest rates and other fluctuations in market risk factors. Some risk parameters (i.e. inflation estimates and real-estate estimates, correlations linked to these risk categories) are based on expert opinion;
• the definition of an ALM VAR limit at group level and the breakdown of this limit into various types of risk and entities;
• the use of VAR, which is calculated using fair value models for non-maturing products, taking into account different embedded options and guarantees in the portfolio. However, not all these options are valued on a stochastic basis at this point in time (e.g., pre-payments in the mortgage business). The VAR is based on a variance-covariance technique and a normal distribution of risk parameters.
The group VAR limit framework is translated into pragmatic risk limits for the various group companies and individual ALM positions (see below). KBC Bank ALM risk, by risk category (VAR 99%, 1-year time horizon, marginal contribution of various risk types to VAR)* In billions of EUR
31-12-2006 31-12-2007
Interest rate risk 1.02 0.65
Equity risk 0.14 0.20
Real estate risk 0.02 0.03
Other risks** 0.01 0.01
Total diversified VAR (group) 1.19 0.91
* Excluding Absolut Bank and a number of small group companies. ** Foreign exchange risk, inflation risk, counterparty risk and interest rate volatility risk. ALM in 2007: Interest rate risk The bank’s ALM interest rate positions are managed via a system of market-oriented internal pricing for products with a fixed maturity date, and via a replicating portfolio technique – reviewed on a dynamic basis – for products without a fixed maturity date (e.g., demand and savings accounts). The bank’s capital and reserves are invested in fixed assets, strategic shareholdings and government bonds. The bank may also take interest rate positions with a view to acquiring interest income, both in a bond portfolio used for reinvesting equity and in a bond portfolio financed with short-term funds. Two main techniques are used to measure interest rate risks: Basis-Point-Value (BPV) and Value-at-Risk (VAR, see above). The BPV measures the extent to which the value of the portfolio would change if interest rates were to fall by ten basis points across the entire curve (positive figures indicate an increase in the value of the portfolio). BPV limits are set in such a way that interest rate positions combined with the other ALM positions remain within the overall VAR limits. Other techniques such as gap analysis, the duration approach, scenario analysis and stress-testing (both from an economic value perspective and from an income perspective) are also used. The table shows how the bank’s exposure to interest rate risk developed over the course of 2006 and 2007. Interest rate exposure was further reduced from the second quarter of 2007 onwards on account of changes in interest rate expectations.
p. 26
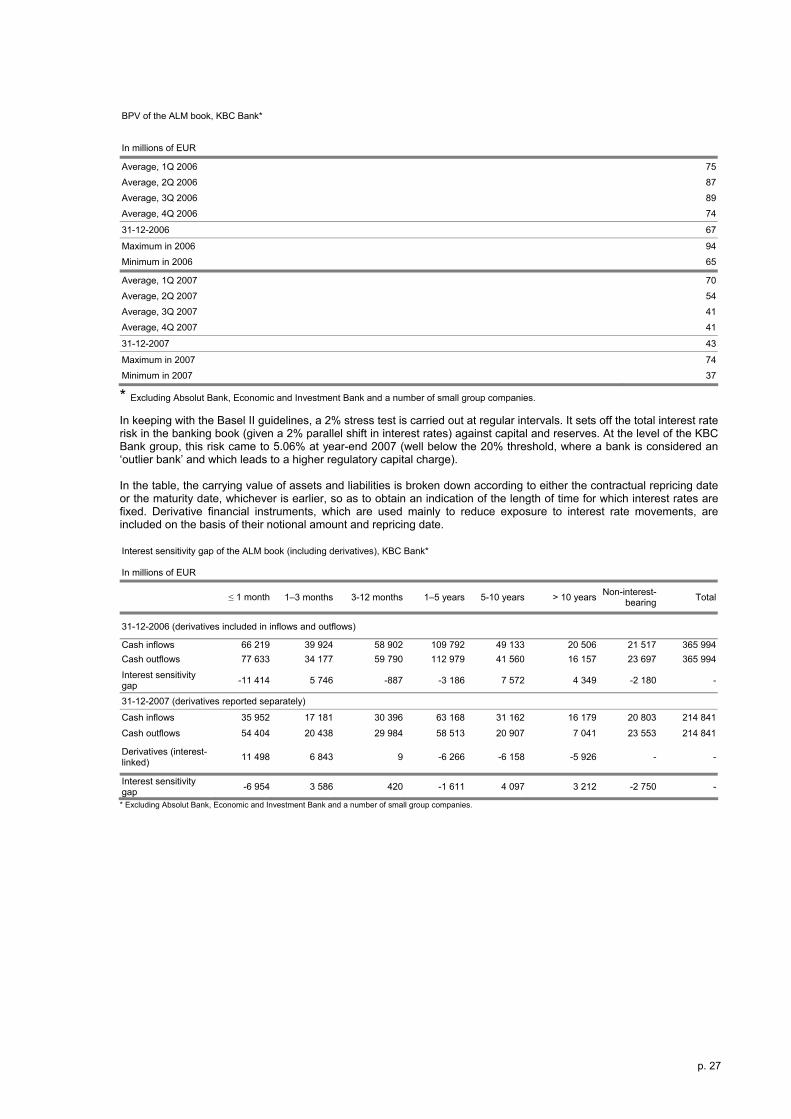
BPV of the ALM book, KBC Bank* In millions of EUR Average, 1Q 2006 75
Average, 2Q 2006 87
Average, 3Q 2006 89
Average, 4Q 2006 74
31-12-2006 67
Maximum in 2006 94
Minimum in 2006 65
Average, 1Q 2007 70
Average, 2Q 2007 54
Average, 3Q 2007 41
Average, 4Q 2007 41
31-12-2007 43
Maximum in 2007 74
Minimum in 2007 37
* Excluding Absolut Bank, Economic and Investment Bank and a number of small group companies. In keeping with the Basel II guidelines, a 2% stress test is carried out at regular intervals. It sets off the total interest rate risk in the banking book (given a 2% parallel shift in interest rates) against capital and reserves. At the level of the KBC Bank group, this risk came to 5.06% at year-end 2007 (well below the 20% threshold, where a bank is considered an ‘outlier bank’ and which leads to a higher regulatory capital charge). In the table, the carrying value of assets and liabilities is broken down according to either the contractual repricing date or the maturity date, whichever is earlier, so as to obtain an indication of the length of time for which interest rates are fixed. Derivative financial instruments, which are used mainly to reduce exposure to interest rate movements, are included on the basis of their notional amount and repricing date. Interest sensitivity gap of the ALM book (including derivatives), KBC Bank* In millions of EUR ≤ 1 month 1–3 months 3-12 months 1–5 years 5-10 years > 10 years Non-interest-
bearing Total
31-12-2006 (derivatives included in inflows and outflows) Cash inflows 66 219 39 924 58 902 109 792 49 133 20 506 21 517 365 994Cash outflows 77 633 34 177 59 790 112 979 41 560 16 157 23 697 365 994
Interest sensitivity gap -11 414 5 746 -887 -3 186 7 572 4 349 -2 180 -
31-12-2007 (derivatives reported separately) Cash inflows 35 952 17 181 30 396 63 168 31 162 16 179 20 803 214 841
Cash outflows 54 404 20 438 29 984 58 513 20 907 7 041 23 553 214 841
Derivatives (interest-linked) 11 498 6 843 9 -6 266 -6 158 -5 926 - -
Interest sensitivity gap -6 954 3 586 420 -1 611 4 097 3 212 -2 750 -
* Excluding Absolut Bank, Economic and Investment Bank and a number of small group companies.
p. 27

The table illustrates the impact of a 1% increase in the yield curve, given the positions at the reporting date. Impact of a parallel 1% increase in the yield curve for KBC Bank* In millions of EUR
Impact on net profit (IFRS) Impact on economic value 2006 2007 2006 2007
Total 53 60 -728 -459
* Excluding Absolut Bank and a number of small group companies. ALM in 2007: Equity risk Equity risk is monitored using a VAR technique (99% one-sided confidence interval, one-year time horizon), with a limit being set for the total equity exposure of the group’s ALM activities. The table provides an overview of the sensitivity of income and economic value to fluctuations in the equity markets. This total exposure includes the sensitivity of unlisted equity in the different portfolios.
Impact of a 10% drop in the equity markets* In millions of EUR
Impact on net profit (IFRS) Impact on economic value 2006 2007 2006 2007
Total -37 -45 -46 -84
* Excluding Absolut Bank and a number of small group companies. The figures for 2006 have been restated. ALM in 2007: Real estate risk A limited real estate investment portfolio is held by the group’s real estate businesses with a view to realising capital gains over the long term. The table provides an overview of the sensitivity of economic value to fluctuations in the property markets. Impact of a 10% drop in real estate prices* In millions of EUR
Impact on economic value 2006 2007
Total -70 -73
* Excluding Absolut Bank and a number of small group companies.
ALM in 2007: Foreign exchange risk KBC pursues a prudent policy as regards its structural currency exposure, essentially seeking to avoid currency risk. FX exposures in the ALM books of banking entities with a trading book are transferred to the trading book where they are managed within the allocated trading limits. The FX exposure of banking entities without a trading book and of other entities has to be hedged, if material. Participating interests in foreign currency are in principle funded by borrowing an amount in the relevant currency equal to the value of the net assets excluding goodwill.
p. 28

Liquidity risk management Description Liquidity risk is the risk that an organisation may not be able to fund increases in assets or meet obligations as they fall due, unless at an unreasonable cost. The principal objective of KBC’s liquidity management is to be able to fund the group and to enable the core business activities of the group to continue to generate revenue, even under adverse circumstances. Managing liquidity risk The liquidity management framework and liquidity limits are set by the Group ALCO. Operational liquidity management is organised within the Group Treasury unit, which centralises collateral management and the acquisition of long-term funding. Primary responsibility for operational liquidity management lies with the respective group companies, since they know best the specific features of their local products and markets and deal directly with local regulators and other officials. However, the liquidity contingency plan requires local liquidity problems above a certain threshold to be escalated to group level. The liquidity risks are also aggregated and monitored centrally on a daily basis and are reported periodically to the Group ALCO and the Audit Committee. During the first half of 2007, a more refined liquidity framework was set up, founded on the following pillars:
• Contingency liquidity risk:
Contingency liquidity risk is assessed on the basis of several liquidity stress tests, which measure how the liquidity buffer of KBC group banks changes under stressed scenarios. The liquidity buffer is based on assumptions regarding liquidity outflows (e.g., retail customer behaviour, professional client behaviour, drawing of committed credit lines, etc.), as well as on assumptions regarding inflows resulting from actions to increase liquidity (e.g., ‘repoing’ the bond portfolio, reducing unsecured interbank lending, etc.). The liquidity buffer should be sufficient to cover liquidity needs (net cash and collateral outflows) over (a) a period that is required to restore market confidence in the group following a KBC-specific event and (b) a period that is required for markets to stabilise after a general market event. The overall aim of the liquidity framework is to remain sufficiently liquid in stress situations, without resorting to liquidity-enhancing actions which would entail significant costs or which would interfere with the core business of the banking group.
• Structural liquidity risk
The group’s funding structure is managed so as to maintain substantial diversification, to minimise funding concentrations, and to limit the level of reliance on wholesale funding (gross and net of repos). Therefore, the forecast structure of the balance sheet is reviewed regularly and the appropriate funding strategies and options developed and implemented. KBC's liquidity framework ensures that net funding collected from non-core sources is at all times limited by the liquidity buffer of government bonds and other ECB-eligible collateral. The table illustrates the funding mix of the KBC group. KBC Bank: funding sources 31-12-2006 31-12-2007
Deposits from credit institutions and investment firms* 24% 28%
Deposits from customers 53% 51%
Non-subordinated debt securities 21% 19%
Subordinated debt 2% 3%
Total 100% 100%
In millions of EUR 223 327 252 304
* If repo transactions are excluded, deposits from credit institutions and investment firms constitute only 22% of the funding mix in 2007.
• Operational liquidity risk Operational liquidity management is conducted in the treasury departments, based on estimated funding requirements. Maturities and expected savings and current account withdrawals are taken into account, as are additional funding needs due to unused credit lines, etc. Operational liquidity management is monitored per entity and on a group-wide basis by the Group Value and Risk Management Directorate.
The table below illustrates liquidity risk by grouping the cash inflows and cash outflows on the balance sheet date according to the remaining term to maturity (contractual maturity date). The difference between the cash inflows and outflows is referred to as the ‘net liquidity gap’. The ‘not defined’ bucket comprises mainly deposits that are
p. 29

payable on demand, as well as the undrawn margin on confirmed credit lines. The 2006 figures were restated in order to comply with the new IFRS 7 requirements. Liquidity risk, KBC Bank* In millions of EUR
≤ 1 month 1-3 months 3-12 months 1-5 years 5-10 years > 10 years Not defined Total
31-12-2006
Cash inflows 86 359 28 437 33 512 66 452 34 817 25 091 35 507 310 175
Cash outflows 105 884 32 982 30 196 25 048 8 592 7 722 140 132 350 556
Net liquidity gap -19 524 -4 545 3 316 41 404 26 225 17 370 -104 625 -40 381
31-12-2007
Cash inflows 90 441 41 584 42 241 64 361 32 852 26 091 45 514 343 085
Cash outflows 107 598 44 357 32 034 34 401 10 986 9 390 150 734 389 500
Net liquidity gap -17 157 -2 772 10 207 29 960 21 866 16 701 -105 220 -46 415
* Excluding Absolut Bank and Economic and Investment Bank. The figures for 2006 have been restated.
Market risk management Description
Market risk is defined as the potential negative deviation from the expected economic value of a financial instrument caused by fluctuations in market prices, i.e. interest rates, exchange rates and equity or commodity prices. Market risk also covers the risk of price fluctuations in negotiable securities as a result of credit risk, country risk and liquidity risk. The interest rate, foreign exchange and equity risks of the non-trading positions in the banking book are all included in ALM exposure. The objective of market risk management is to measure and report the market risk of the aggregate trading position at group level, taking into account the main risk factors and specific risk. KBC is exposed to market risk via the trading books of the dealing rooms in Western Europe, Central and Eastern Europe, the United States and Asia. The traditional dealing rooms, with the dealing room in Brussels accounting for the lion’s share of the limits and risks, focus on trading in interest rate instruments, and activity on the forex markets has traditionally been very limited. The dealing rooms abroad focus primarily on providing customer service in money and capital market products, on funding local bank activities and engage in limited trading for own account in local niches. Through its specialised subsidiaries (KBC Financial Products (KBC FP), KBC Securities and KBC Peel Hunt), the group also engages in trading in equities and their derivatives. KBC FP also sells and deals in structured credit derivatives (services for hedge funds and the launch and management of collateralised debt obligations) and is involved to a minor extent in the seeding and management of Alternative Investment Management (AIM) hedge funds.
Risk governance
Market risk tolerance is determined by the Board of Directors through an annual limit review. The Group Value and Risk Management Directorate and the Group Trading Risk Committee advise on limits before they are submitted to the Board. The Group Value and Risk Management Directorate develops, implements and manages the risk control system and evaluates the risk benchmarks and limit usage. It reports directly to group senior management through the Group Trading Risk Committee, which is chaired by the Group CFRO and includes representatives from line management, risk management and top management. Operational and counterparty risks in the dealing rooms are managed as an integral part of market risk management. This enables the group to take decisions relating to trading risk on the basis of accurate information. In the Group Value and Risk Management Directorate, risk co-ordinators are the first contact point for the group’s local trading entities when they have questions relating to market risk. The responsibilities of the risk co-ordinators are clearly set out in risk protocols. Local risk management policy and procedures are described in the risk management framework document.
p. 30

Managing market risk
The principal tool for measuring and monitoring market risk exposures in the trading book is the Value-at-Risk (VAR) method. VAR is defined as an estimate of the amount of economic value that might be lost on a given portfolio due to market risk over a defined holding period, with a given confidence level. The measurement only takes account of the market risk of the current portfolio and does not attempt to capture possible losses due to further trading or hedging, counterparty default or operational losses.
KBC uses the historical simulation method (HVAR), observing the relevant Basel II standards (99% one-sided confidence interval, ten-day holding period, historical data going back at least 250 working days). In 2007, KBC switched from a data window of 250 to 500 scenario dates, thereby increasing stability without disregarding changing market conditions. The VAR method does not rely on assumptions regarding the distribution of price fluctuations or correlations, but is based on patterns of experience over the previous two years. The VAR model is subject to limitations as well, given the fact that it cannot encompass all potential extreme events. Therefore, VAR calculations are supplemented by extensive stress-tests, the results of which are communicated to the Group Trading Risk Committee. Whereas the VAR model captures potential losses under normal market conditions, stress-tests show the impact of exceptional circumstances and events with a low degree of probability that are not always reflected in the ordinary risk indicators. The historical and hypothetical stress-test scenarios incorporate both market risk and the liquidity aspects of disruptions in the market. Besides the VAR calculations and stress-tests, risk concentrations are also monitored via a series of secondary limits, the most important being a three-dimensional scenario limit (based on movements in spot prices, volatilities and credit spreads). Other secondary limits include equity concentration limits, FX concentration limits and basis-point-value limits for interest rate risk. In addition, risks inherent in options (the so-called ‘greeks’) or the specific risk associated with a particular issuer or country are also subject to concentration limits. One of the building blocks of sound risk management is prudent valuation. A daily independent middle-office valuation of front-office positions is performed. Whenever the independent nature of the valuation process is not guaranteed (for instance, when no reliable independent data are available), a parameter review is performed. Where necessary, adjustments to the fair value (market value adjustments) are made to reflect close-out costs, settlement expenses, less liquid positions and valuations made via complex models (model risk). In addition to the parameter review, periodic risk controls are performed, including all checks that do not entail parameter or P&L testing as carried out in the parameter review, but that are necessary for sound risk management. Moreover, a business case is set up for every new product or activity in order to analyse the material risks and the way in which they will be managed (measured, mitigated, monitored and reported). Every new product business case must be accompanied by written advice from the group or local value and risk management function before being submitted to the New Product Committee. Risk analysis and quantification
An overall VAR is calculated for each specialised subsidiary (e.g., KBC Financial Products, KBC Securities and KBC Peel Hunt) and for all trading entities. The VAR for the latter (see 'KBC Bank’ in the table) includes both the linear and non-linear exposure of the traditional dealing rooms, including those at KBL EPB. KBC Financial Products’ VAR is also shown in the table. At the end of 2007, the VAR of KBC Securities amounted to 0.5 million euros (not audited; not shown in the table). The calculation is based on a one-day holding period. Both KBC Bank and KBC Financial Products have been authorised by the Belgian regulator to use their respective VAR models to calculate regulatory capital requirements for trading activities. ČSOB has received approval from the local regulator to use its VAR model for capital requirement purposes. The reliability of the VAR model is tested daily via a back-test, which compares the one-day VAR figure with the ‘no-action P&L’ (i.e. the result calculated for a position that is the same as the previous day’s). This is done both at the top level and at the level of the different entities and desks. An overview of the derivative products is given in the ‘Consolidated annual accounts’ section, Note 21.
p. 31

Market risk (VAR, 1-day holding period)* In millions of EUR
KBC Bank1 KBC Financial Products2
Average, 1Q 2006 4 9
Average, 2Q 2006 4 12
Average, 3Q 2006 3 8
Average, 4Q 2006 3 7
31-12-2006 3 5
Maximum in 2006 6 20
Minimum in 2006 2 4
Average, 1Q 2007 4 10
Average, 2Q 2007 4 10
Average, 3Q 2007 4 13
Average, 4Q 2007 5 15
31-12-2007 5 13
Maximum in 2007 7 19
Minimum in 2007 3 4
* Including KBL EPB. 1 Excluding the specific interest rate risk measured using other techniques. 2 Excluding 'Atomium' and the fund derivatives and insurance derivatives businesses. Estimates have been used for some parameters. Although they were higher in 2007 compared to the second half of 2006, average quarterly VAR figures for KBC Bank and KBC FP remained quite low. The higher levels in the third and fourth quarter were due mainly to increased volatility in the financial markets, resulting from the US subprime mortgage crisis. Following the increase in interest rates, the number of subprime delinquencies in the US housing market escalated, as subprime borrowers were unable to refinance their mortgages. This generated a snowball effect, driving house prices down further and forcing mortgage lenders to file for bankruptcy. Moreover, these mortgage lenders had sold the subprime loans to investment banks, which restructured them into collateralised debt obligations (CDOs) and other mortgage-backed securities (MBS) in order to sell them in the secondary market. As a result, investors and hedge funds were affected as well, because investors shifted money away from CDOs and other MBS to short-term ‘safe-haven’ Treasury bills (T-Bills). As a result of this ‘flight to quality’, credit spreads widened and liquidity dried up. In addition, price volatilities rose considerably, leading to higher VAR outcomes for KBC Bank and KBC FP (see table). Risk infrastructure Transaction, market and static data are input into the risk calculation engine on a daily basis. To calculate its risks, the group relies on a number of internally and externally developed models and systems and uses Basel II-compliant parameters. Every model – whether it is used for pricing, processing market data for use in pricing models or for calculating risk associated with a particular portfolio – is validated by a separate, independent validating entity. In addition, independent reviews of the risk control and measurement systems are conducted routinely as part of internal and external audit assignments, both at group level and at the level of the trading subsidiaries and their local risk entities.
Operational risk management
Description Operational risk is the risk of loss resulting from inadequate or failed internal procedures, people and systems or from external events. Operational risks include the risk of fraud, and legal, compliance and tax risks. Managing operational risk KBC has a single, global framework for managing operational risk across the entire group. It consists of: • a uniform operational risk language, • one methodology, • ns, and one set of centrally developed applicatio centralised and decentralised reporting. •
The development and implementation of this framework is supported by an extensive operational risk governance model. The framework covers all banking and insurance entities of the group, as well as all supporting activities and
p. 32

services that are fully or proportionally consolidated or that are controlled by the parent company. This framework is gradually being implemented in all the new entities of the KBC group. The main precept of operational risk management is that ultimate responsibility for managing operational risk lies with line management, which receives support from local operational risk managers, and is supervised by the operational risk committees. A Group Operational Risk Committee (ORC) advises the Group Executive Committee on the group-wide framework for managing operational risks and monitors the implementation of this framework throughout the group – including in the new group entities – and oversees the main operational risks. The Group CFRO chairs the ORC. Besides the ORC, there are a variety of operational risk committees at business-unit level and at various group companies. They keep close track of the practical implementation of the operational risk management framework and also take concrete measures either directly or via line management. All departments that are involved in one way or another in managing operational risks can gain access to the risk committees whenever they feel it is necessary. In addition, representatives from the internal audit, legal and compliance divisions sit on the operational risk committees as observers. The Group Value and Risk Management Directorate is primarily responsible for defining the operational risk management framework for the entire group. This framework is submitted to the Group Operational Risk Committee and the Executive Committee for approval. The directorate is also responsible for overseeing the practical implementation by line management of this framework. In addition, it supervises the quality of the risk management process, analyses the main risk data and reports to the ORC. The Group Value and Risk Management Directorate creates an environment where risk specialists (ICT Security, Compliance, Human Resources, Legal, Tax, etc.) can work together (setting priorities, using the same language and tools, uniform reporting, etc). Assisting this directorate are the local value and risk management units – which are likewise independent of the business – in the main bank and insurance subsidiaries. The building blocks for managing operational risks KBC uses a number of building blocks for managing operational risks, which cover all aspects of operational risk management. These are: • The Loss Event Database: KBC has been uniformly recording all operational losses of 1 000 euros or more in a
central database since 2004. This database includes all legal claims filed against group companies. Twice a year, a consolidated loss report is submitted to the ORC, the Executive Committee and the Audit Committee.
• Risk Self-Assessments: These assessments focus on actual (= residual) key operational risks at critical points in the process/organisation that are not yet properly mitigated.
• Group Standards: KBC has defined some 40 Group Standards to ensure that important operational risks are managed uniformly. These standards are applied and enforced throughout the group. Each group entity has to translate these group standards into specific procedures. The various operational risk committees monitor the proper implementation of group standards and may allow exceptions to be made (subject to the observance of a strict waiver procedure). Adherence to group standards is subject to internal audit reviews.
• Recommended Practices: These help sharpen the internal controls against key risks that (i) were identified during Risk Self-Assessments, (ii) are inherent in new activities started by a group entity, (iii) have manifested themselves through a significant loss event, or (iv) were identified by Internal Audit during an audit assignment.
• Case-Study Assessments: These are used to test the effectiveness of the protection afforded by existing controls against major operational risks that have actually occurred in the financial sector.
• Key Risk Indicators: These indicators help monitor the exposure to certain operational risks. Operational risk and Basel II KBC uses the Standard Approach to calculate operational risk capital under pillar 1 of Basel II. The operational risk capital for KBC Bank totalled 0.99 billion euros at the end of 2007.
p. 33
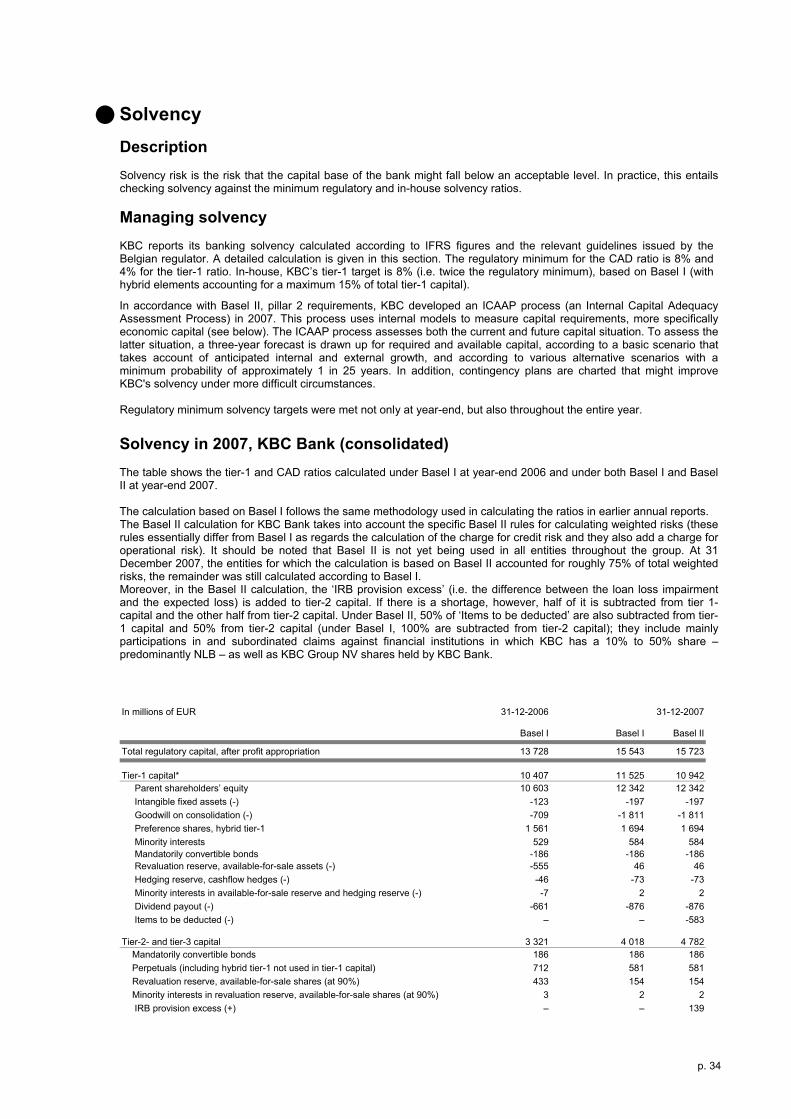
Solvency Description Solvency risk is the risk that the capital base of the bank might fall below an acceptable level. In practice, this entails checking solvency against the minimum regulatory and in-house solvency ratios. Managing solvency KBC reports its banking solvency calculated according to IFRS figures and the relevant guidelines issued by the Belgian regulator. A detailed calculation is given in this section. The regulatory minimum for the CAD ratio is 8% and 4% for the tier-1 ratio. In-house, KBC’s tier-1 target is 8% (i.e. twice the regulatory minimum), based on Basel I (with hybrid elements accounting for a maximum 15% of total tier-1 capital). In accordance with Basel II, pillar 2 requirements, KBC developed an ICAAP process (an Internal Capital Adequacy Assessment Process) in 2007. This process uses internal models to measure capital requirements, more specifically economic capital (see below). The ICAAP process assesses both the current and future capital situation. To assess the latter situation, a three-year forecast is drawn up for required and available capital, according to a basic scenario that takes account of anticipated internal and external growth, and according to various alternative scenarios with a minimum probability of approximately 1 in 25 years. In addition, contingency plans are charted that might improve KBC's solvency under more difficult circumstances. Regulatory minimum solvency targets were met not only at year-end, but also throughout the entire year. Solvency in 2007, KBC Bank (consolidated) The table shows the tier-1 and CAD ratios calculated under Basel I at year-end 2006 and under both Basel I and Basel II at year-end 2007. The calculation based on Basel I follows the same methodology used in calculating the ratios in earlier annual reports. The Basel II calculation for KBC Bank takes into account the specific Basel II rules for calculating weighted risks (these rules essentially differ from Basel I as regards the calculation of the charge for credit risk and they also add a charge for operational risk). It should be noted that Basel II is not yet being used in all entities throughout the group. At 31 December 2007, the entities for which the calculation is based on Basel II accounted for roughly 75% of total weighted risks, the remainder was still calculated according to Basel I. Moreover, in the Basel II calculation, the ‘IRB provision excess’ (i.e. the difference between the loan loss impairment and the expected loss) is added to tier-2 capital. If there is a shortage, however, half of it is subtracted from tier 1-capital and the other half from tier-2 capital. Under Basel II, 50% of ‘Items to be deducted’ are also subtracted from tier-1 capital and 50% from tier-2 capital (under Basel I, 100% are subtracted from tier-2 capital); they include mainly participations in and subordinated claims against financial institutions in which KBC has a 10% to 50% share – predominantly NLB – as well as KBC Group NV shares held by KBC Bank.
In millions of EUR 31-12-2006 31-12-2007
Basel I Basel I Basel II
Total regulatory capital, after profit appropriation 13 728 15 543 15 723
Tier-1 capital* 10 407 11 525 10 942 Parent shareholders’ equ ity 10 603 12 342 12 342 Intangible fixed assets (-) -123 -197 -197 Goodwill on consolidation (-) -709 -1 811 -1 811 Preference shares, hybrid tier-1 1 561 1 694 1 694 Minority interests 529 584 584 Mandatorily convertible bonds -186 -186 -186 Revaluation reserve, available-for-sale assets (-) -555 46 46 Hedging reserve, cashflow hedges (-) -46 -73 -73 Minority interests in available-for-sale reserve and hedging reserve (-) -7 2 2 Dividend payout (-) -661 -876 -876 Items to be deducted (-) – – -583
Tier-2- and tier-3 capital 3 321 4 018 4 782 Mandatorily convertible bonds 186 186 186 Perpetuals (including hybrid tier-1 not used in tier-1 capital) 712 581 581 Revaluation reserve, available-for-sale shares (at 90%) 433 154 154 Minority interests in revaluation reserve, available-for-sale shares (at 90%) 3 2 2 IRB provision excess (+) – – 139
p. 34

Subordinated liabilities 3 311 4 285 4 285 Tier-3 capital 14 18 18 Items to be deducted (-) -1 339 -1 208 -583
Total weighted risks 123 127 147 444 128 536
Credit risk 113 264 136 677 107 461 Market risk 9 863 10 767 12 329 Operational risk – – 8 747
Solvency ratios
Tier-1 rati o 8,5% 7,8% 8,5% CAD ratio 11,1% 10,5% 12,2%
* Audited figures.
p. 35

The Board of Directors
Composition of the Board of Directors on 31 December 2007
Name Position Period on the Board in 2007 End, current term of office
HUYGHEBAERT Jan Chairman full year 2010PHILIPS Luc Deputy Chairman full year 2010BERGEN André Executive Director, President of the Executive Committee full year 2010AGNEESSENS Herman Executive Director full year 2010DEFRANCQ Chris Executive Director full year 2010FLORQUIN Frans Executive Director full year 2010SEGERS Guido Executive Director full year 2009VANHEVEL Jan Executive Director full year 2010VERWILGHEN Etienne Executive Director full year 2010DE WILDE Julien Independent Director full year 2010DE BECKER Sonja Non-Executive Director full year 2009DEPICKERE Franky Non-Executive Director full year 2011KONINGS Pierre Non-Executive Director full year 2009MORLION Lode Non-Executive Director full year 2009ORLENT-HEYVAERT Marita Non-Executive Director full year 2009PEETERS Paul Non-Executive Director full year 2009SAP Gustaaf Non-Executive Director full year 2009VANDEN AVENNE Patrick Non-Executive Director full year 2009VANTIEGHEM Germain Non-Executive Director full year 2010WAUTERS Dirk Non-Executive Director full year 2009WITTEMANS Marc Non-Executive Director full year 2010
Auditor: Ernst & Young, Bedrijfsrevisoren bcvba, represented by Daniëlle Vermaelen and/or Jean-Pierre Romont
Composition of the Board of Directors on 31 December 2007
p. 36
Consolidated annual accounts
STATUTORY AUDITOR’S REPORT TO THE GENERAL MEETING OF SHAREHOLDERS OF KBC BANK NV ON THE CONSOLIDATED FINANCIAL STATEMENTS FOR THE YEAR
ENDED 31 DECEMBER 2007 In accordance with the legal requirements, we report to you on the performance of our mandate of statutory auditor. This report contains our opinion on the consolidated financial statements as well as the required additional comments. Unqualified opinion on the consolidated financial statements We have audited the consolidated financial statements of KBC Bank NV and its subsidiaries (collectively referred to as ‘the Group’) for the year ended 31 december 2007, prepared in accordance with International Financial Reporting Standards (IFRS) as adopted by the European Union, and with the legal and regulatory requirements applicable in Belgium. These consolidated financial statements comprise the consolidated balance sheet as at 31 december 2007, and the consolidated income statement, the consolidated statement of changes in equity and the consolidated cash flow statement for the year then ended, as well as the summary of significant accounting policies and other explanatory notes. The consolidated balance sheet shows total assets of € 309.476 million and the consolidated statement of income shows a profit for the year, share of the Group, of € 2.261 million. Responsibility of the board of directors for the preparation and fair presentation of the consolidated financial statements The board of directors is responsible for the preparation and fair presentation of the consolidated financial statements. This responsibility includes: designing, implementing and maintaining internal control relevant to the preparation and fair presentation of consolidated financial statements that are free from material misstatement, whether due to fraud or error; selecting and applying appropriate accounting policies; and making accounting estimates that are reasonable in the circumstances. Responsibility of the statutory auditor Our responsibility is to express an opinion on these consolidated financial statements based on our audit. We conducted our audit in accordance with the legal requirements and the auditing standards applicable in Belgium, as issued by the Institute of Registered Auditors (Institut des Réviseurs d’Entreprises/Instituut van de Bedrijfsrevisoren). Those standards require that we plan and perform the audit to obtain reasonable assurance whether the financial statements are free from material misstatement.
p. 37

In accordance with these standards, we have performed procedures to obtain audit evidence about the amounts and disclosures in the consolidated financial statements. The procedures selected depend on our judgment, including the assessment of the risks of material misstatement of the consolidated financial statements, whether due to fraud or error. In making those risk assessments, we have considered internal control relevant to the Group’s preparation and fair presentation of the consolidated financial statements in order to design audit procedures that are appropriate in the circumstances, but not for the purpose of expressing an opinion on the effectiveness of the Group's internal control. We have evaluated the appropriateness of accounting policies used, the reasonableness of significant accounting estimates made by the Group and the presentation of the consolidated financial statements, taken as a whole. Finally, we have obtained from the board of directors and the Group’s officials the explanations and information necessary for executing our audit procedures. We believe that the audit evidence we have obtained is sufficient and appropriate to provide a basis for our opinion. Opinion In our opinion, the consolidated financial statements for the year ended 31 december 2007 give a true and fair view of the Group’s financial position as at 31 december 2007 and of the results of its operations and its cash flows in accordance with IFRS as adopted by the European Union, and with the legal and regulatory requirements applicable in Belgium. Additional comments The preparation and the assessment of the information that should be included in the directors’ report on the consolidated financial statements are the responsibility of the board of directors. Our responsibility is to include in our report the following additional comments, which do not modify the scope of our opinion on the consolidated financial statements: The directors’ report on the consolidated financial statements deals with the information required by
law and is consistent with the consolidated financial statements. We are, however, unable to comment on the description of the principal risks and uncertainties which the entities included in the consolidation are facing, and on their financial situation, their foreseeable evolution or the significant influence of certain facts on their future development. We can nevertheless confirm that the matters disclosed do not present any obvious inconsistencies with the information that we became aware of during the performance of our mandate.
Brussels, 20 March 2008 Ernst & Young Réviseurs d’Entreprises SCCRL Statutory auditor represented by Jean-Pierre Romont Danielle Vermaelen Partner Partner 08JPR0067
p. 38
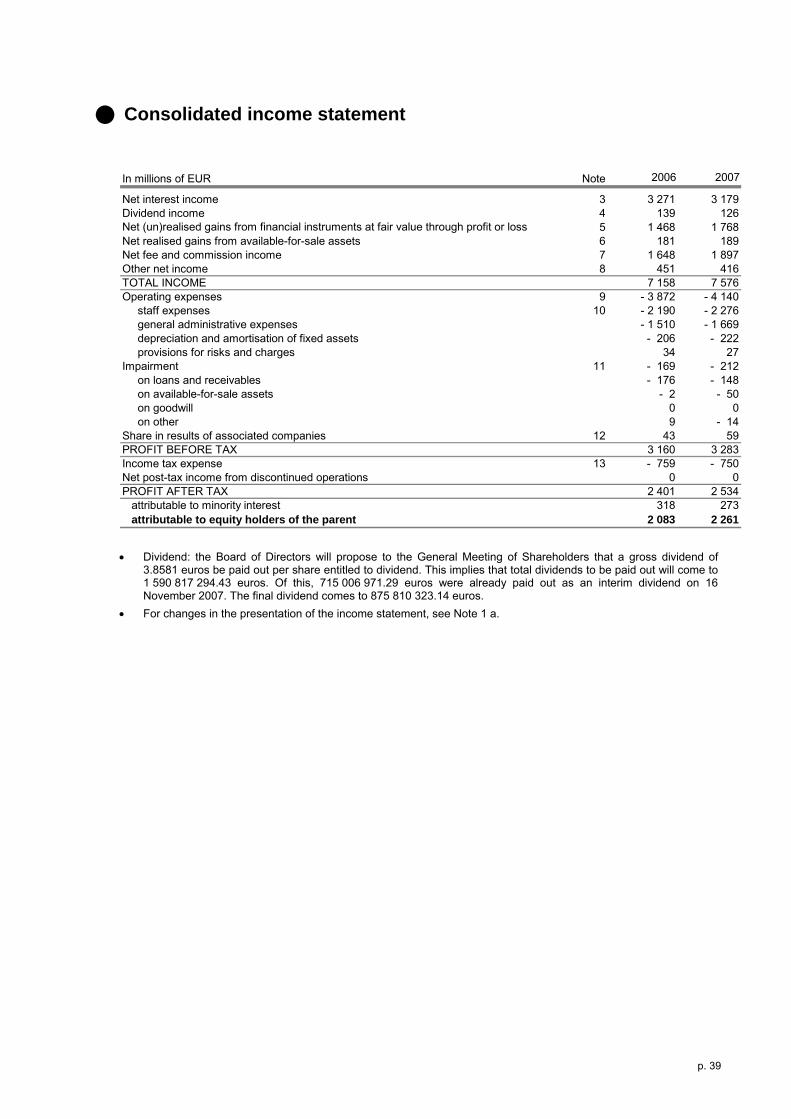
Consolidated income statement
In millions of EUR Note 2006 2007
Net interest income 3 3 271 3 179Dividend income 4 139 1Net (un)realised gains from financial instruments at fair value through profit or loss 5 1 468 1 768Net realised gains from available-for-sale assets 6 181 189Net fee and commission income 7 1 648 1 897Other net income 8 451 4TOTAL INCOME 7 158 7 576Operating expenses 9 - 3 872 - 4 140
staff expenses 10 - 2 190 - 2 276 general administrative expenses - 1 510 - 1 669 depreciation and amortisation of fixed assets - 206 - 222 provisions for risks and charges 34 27
Impairment 11 - 169 - 212 on loans and receivables - 176 - 148 on available-for-sale assets - 2 - 50 on goodwill 0 0 on other 9 - Share in results of associated companies 12 43 59PROFIT BEFORE TAX 3 160 3 283Income tax expense 13 - 759 - 750Net post-tax income from discontinued operations 0 0PROFIT AFTER TAX 2 401 2 534
attributable to minority interest 318 273attributable to equity holders of the parent 2 083 2 261
26
16
14
• Dividend: the Board of Directors will propose to the General Meeting of Shareholders that a gross dividend of
3.8581 euros be paid out per share entitled to dividend. This implies that total dividends to be paid out will come to 1 590 817 294.43 euros. Of this, 715 006 971.29 euros were already paid out as an interim dividend on 16 November 2007. The final dividend comes to 875 810 323.14 euros.
• For changes in the presentation of the income statement, see Note 1 a.
p. 39

Consolidated balance sheet ASSETS (in millions of EUR) Note 31-12-2006 31-12-2007Cash and cash balances with central banks 2 386 2 898Financial assets 14-21 265 766 296 702
Held for trading 67 024 73 051Designated at fair value through profit or loss 46 258 35 985Available for sale 29 095 26 543Loans and receivables 113 751 151 304Held to maturity 9 313 9 296Hedging derivatives 325 524
Fair value adjustments of hedged items in portfolio hedge of interest rate risk 5 - 175 - 223Accrued interest income 14 2 299 2 918Tax assets 23 638 659
Current tax assets 117 102Deferred tax assets 521 556
Non-current assets held for sale and disposal groups 53 41Investments in associated companies 24 535 646Investment property 25 225 448Property and equipment 25 1 544 1 760Goodwill and other intangible assets 26 833 2 008Other assets 22 1 634 1 618
TOTAL ASSETS 275 738 309 476
LIABILITIES AND EQUITY (in millions of EUR) 31-12-2006 31-12-2007Financial liabilities 14,15,17,21 256 608 287 170
Held for trading 36 880 41 542Designated at fair value through profit or loss 47 567 37 082Measured at amortised cost 172 112 208 427Hedging derivatives 49 118
Fair value adjustments of hedged items in portfolio hedge of interest rate risk 5 0 0Accrued interest expense 14 1 572 2 006Tax liabilities 23 451 467
Current tax liabilities 381 388Deferred tax liabilies 70 79
Non-current liabilities held for sale and liabilities associated with disposal groups 0 0Provisions for risks and charges 27 407 401Other liabilities 28, 29 4 534 5 519TOTAL LIABILITIES 263 570 295 562Total equity 12 168 13 914
Parent shareholders' equity 30 10 603 12 342Minority interests 1 565 1 572
TOTAL LIABILITIES AND EQUITY 275 738 309 476
• For changes in the presentation of the balance sheet, see Note 1 a.
p. 40

Consolidated statement of changes in equity
In millions of EUR
Issued and paid up share capital
Share premium
Other equity
(Manda-torily
convertible bonds)
Treasury shares
Revalua-tion reserve
(AFS assets)
Hedging reserve
(cashflow hedges) Reserves
Transla-tion
differen-ces
Parent share-
holders' equity
Minority interests Total equity
31-12-2006Balance at the beginning of the period 3 763 490 436 0 837 3 4 757 89 10 375 1 740 12 115
Fair value adjustments before tax 0 0 0 0 - 362 68 0 0 - 294 0 - 294Deferred tax on fair value changes 0 0 0 0 185 - 25 0 0 160 0 160Transfer from reserve to net profit
Impairment losses 0 0 0 0 0 0 0 0 0 0 Net gains/losses on disposal 0 0 0 0 - 112 0 0 0 - 112 0 - 112Deferred income tax 0 0 0 0 7 0 0 0 7 0
Transfer from hedging reserve to net profit*Gross amount 0 0 0 0 0 0 0 0 0 0 0Deferred income taxes 0 0 0 0 0 0 0 0 0 0
Effect of changes in accounting policies 0 0 0 0 0 0 0 0 0 0 0Corrections of errors 0 0 0 0 0 0 0 0 0 0 0Currency translation differences 0 0 0 0 0 0 0 - 18 - 18 0 - 18
Subtotal, recognised directly in equity 0 0 0 0 - 282 43 0 - 18 - 257 0 - 257Net profit for the period 0 0 0 0 0 0 2 083 0 2 083 318 2 401
Total income and expense for the period 0 0 0 0 - 282 43 2 083 - 18 1 826 318 2 144
Dividends 0 0 0 0 0 0 - 1 357 0 - 1 357 0 - 1 357Capital increase 0 0 2 0 0 0 - 2 0 0 0 Purchases of treasury shares 0 0 0 0 0 0 0 0 0 0 0Sales of treasury shares 0 0 0 0 0 0 0 0 0 0 Results on (derivatives on) treasury shares 0 0 0 0 0 0 0 0 0 0 0Cancellation of own shares 0 0 0 0 0 0 0 0 0 - 493 - 494Change in minority interests 0 0 - 250 0 0 0 0 0 - 250 0 - 250Other 0 0 0 0 0 0 9 0 9 0 9
Total change 0 0 - 248 0 - 282 43 734 - 18 228 - 175 53
Balance at the end of the period 3 763 490 188 0 555 46 5 491 71 10 603 1 565 12 168
of which revaluation reserve for shares 482of which revaluation reserve for bonds 73of which revaluation reserve for other assets than bonds and shares 0of which relating to non-current assets held for sale and disposal groups 0 0 0 0 0 0 0 0 0 0
0
7
0
0
0
0 * Net (un)realised gains from financial instruments at fair value through profit or loss. 31-12-2007Balance at the beginning of the period 3 763 490 188 0 555 46 5 491 71 10 603 1 565 12 168
Fair value adjustments before tax 0 0 0 0 - 288 82 0 0 - 206 0 - 206Deferred tax on fair value changes 0 0 0 0 60 - 42 0 0 18 0 18Transfer from reserve to net profit*
Impairment losses 0 0 0 0 0 0 0 0 0 0 0Net gains/losses on disposal 0 0 0 0 - 435 0 0 0 - 435 0 - 435Deferred income tax 0 0 0 0 61 0 0 0 61 0 61
Transfer from hedging reserve to net profitGross amount 0 0 0 0 0 - 16 0 0 - 16 0 - 16Deferred income taxes 0 0 0 0 0 4 0 0 4 0
Effect of changes in accounting policies 0 0 0 0 0 0 0 0 0 0 0Corrections of errors 0 0 0 0 0 0 0 0 0 0 0Currency translation differences 0 0 0 0 1 0 0 0 1 0 1Other 0 0 - 2 0 0 0 2 - 60 - 60 0 0
Subtotal, recognised directly in equity 0 0 - 2 0 - 601 28 2 - 60 - 634 0 - 634Net profit for the period 0 0 0 0 0 0 2 261 0 2 261 273 2 534
Total income and expense for the period 0 0 - 2 0 - 601 28 2 263 - 60 1 627 273 1 900
Dividends 0 0 0 0 0 0 - 1 389 0 - 1 389 0 - 1 389Capital increase 267 1 233 0 0 0 0 0 0 1 500 0 1 500Purchases of treasury shares 0 0 0 0 0 0 0 0 0 0 0Sales of treasury shares 0 0 0 0 0 0 0 0 0 0 0(Results / Derivatives on) treasury shares 0 0 0 0 0 0 0 0 0 0 0Cancellation of treasury shares 0 0 0 0 0 0 0 0 0 0 0Change in minority interests 0 0 0 0 0 0 0 0 0 - 266 - 266
Total change 267 1 233 - 2 0 - 601 28 874 - 60 1 738 7 1 745
Balance at the end of the period 4 030 1 723 186 0 - 46 73 6 365 11 12 342 1 572 13 914
of which revaluation reserve for shares 171of which revaluation reserve for bonds - 216
of which revaluation reserve for other assets than bonds and shares - 1of which relating to non-current assets held for sale and disposal groups 0 0 0 0 0 0 0 0 0 0 0
4
* Net (un)realised gains from financial instruments at fair value through profit or loss.
• For information on the total number of shares (both ordinary shares and other equity instruments), see Note 30.
p. 41
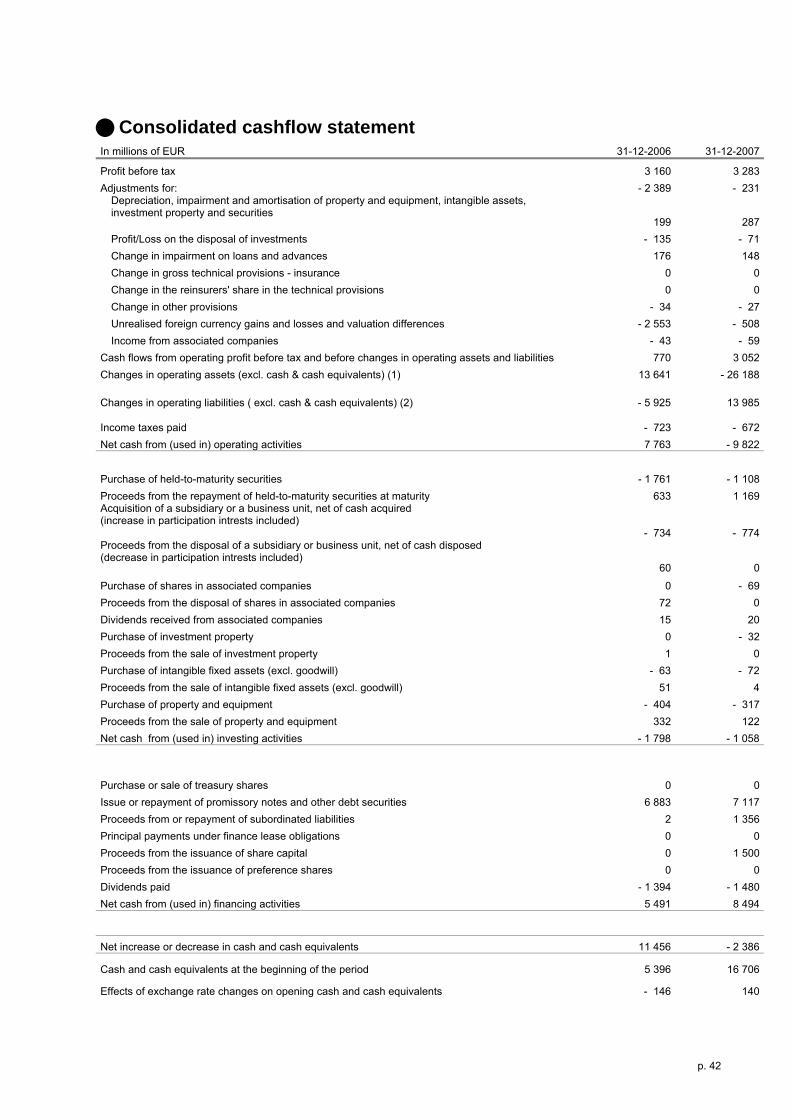
Consolidated cashflow statement In millions of EUR 31-12-2006 31-12-2007
Profit before tax 3 160 3 283Adjustments for: - 2 389 - 231
Depreciation, impairment and amortisation of property and equipment, intangible assets, investment property and securities
199 287 Profit/Loss on the disposal of investments - 135 - 71 Change in impairment on loans and advances 176 148 Change in gross technical provisions - insurance 0 0 Change in the reinsurers' share in the technical provisions 0 0 Change in other provisions - 34 - 27 Unrealised foreign currency gains and losses and valuation differences - 2 553 - 508 Income from associated companies - 43 - 59Cash flows from operating profit before tax and before changes in operating assets and liabilities 770 3 052Changes in operating assets (excl. cash & cash equivalents) (1) 13 641 - 26 188
Changes in operating liabilities ( excl. cash & cash equivalents) (2) - 5 925 13 985
Income taxes paid - 723 - 672Net cash from (used in) operating activities 7 763 - 9 822 Purchase of held-to-maturity securities - 1 761 - 1 108Proceeds from the repayment of held-to-maturity securities at maturity 633 1 169Acquisition of a subsidiary or a business unit, net of cash acquired (increase in participation intrests included)
- 734 - 774Proceeds from the disposal of a subsidiary or business unit, net of cash disposed (decrease in participation intrests included)
60 0
Purchase of shares in associated companies 0 - 69Proceeds from the disposal of shares in associated companies 72 0Dividends received from associated companies 15 20Purchase of investment property 0 - 32Proceeds from the sale of investment property 1 0Purchase of intangible fixed assets (excl. goodwill) - 63 - 72Proceeds from the sale of intangible fixed assets (excl. goodwill) 51 4Purchase of property and equipment - 404 - 317Proceeds from the sale of property and equipment 332 122Net cash from (used in) investing activities - 1 798 - 1 058 Purchase or sale of treasury shares 0 0Issue or repayment of promissory notes and other debt securities 6 883 7 117Proceeds from or repayment of subordinated liabilities 2 1 356Principal payments under finance lease obligations 0 0Proceeds from the issuance of share capital 0 1 500Proceeds from the issuance of preference shares 0 0Dividends paid - 1 394 - 1 480Net cash from (used in) financing activities 5 491 8 494
Net increase or decrease in cash and cash equivalents 11 456 - 2 386
Cash and cash equivalents at the beginning of the period 5 396 16 706
Effects of exchange rate changes on opening cash and cash equivalents - 146 140
p. 42

Cash and cash equivalents at the end of the period 16 706 14 459
Additional information (3) Interest paid - 7 697 - 10 703 Interest received 10 968 13 882 Dividends received (including equity method) 154 146 Components of cash and cash equivalents (4) 16 706 14 459Cash and cash balances with central banks 1 348 2 898Loans and advances to banks repayable on demand and term loans to banks < 3 months 23 439 24 729
Deposits from banks repayable on demand and redeemable at notice - 8 081 - 13 168 (1) Including loans and receivables, available-for-sale assets, held-for-trading assets, financial assets designated at fair value through profit or loss, derivative hedging assets, non-current assets held for sale and disposal groups, and accrued interest income(2) Including deposits from banks, debts represented by securities, financial liabilities held for trading, financial liabilities designated at fair value through profit or loss, derivative hedging liabilities and accrued interest expense. (3) The 2006 figures for 'Interest paid' and 'Interest received' have been adjusted retroactively, because the amount of interest relating to hedging derivatives (all of which was allocated to interest expense in 2006) is now allocated to interest income and interest expense, respectively.
(4) The definition of 'Cash and cash equivalents' differs from the definition for 2006 (i.e. treasury bills and other bills eligible for rediscounting with central banks have been omitted, while term loans to banks at not more than three months and deposits from banks repayable on demand have been included), because the presentation of the financial statements was adjusted in 2007 to make it correspond more closely with the Belgian prudential reporting presentation for banks and to comply with IFRS 7 requirements.
• KBC uses the indirect method to report on cashflows from operating activities. • The main acquisitions and disinvestments of consolidated subsidiaries in 2006 and 2007 are set out below. • For a more detailed list (including all major changes in ownership percentages), see Note 36. • All (material) acquisitions and divestments of group companies in 2007 were paid for in cash.
Main acquisitions and divestments 31-12-2006
In millions of EURKBC Asset
ManagementAKB "Absolut Bank" (ZAO) EI Bank
International Factors NV
Acquistion (A) / Disposal (D) A A A APercentage of shares bought or sold 7,11% 95,00% 75,58% 50%Segment Banking Banking Banking BankingAssets & liabilities bought or sold
Cash and cash balances with central banks 210 74 130 0Financial assets
Held for trading 226 34Designated at fair value through profit or loss 0 0Available for sale 504 25 5 0Loans and receivables 83 2 024 668 355Held-to-maturity investments 0 0Hedging derivatives 0 0
of which: cash and cash equivalents 74 424 0Financial liabilities
Held for trading 1 0 0Designated at fair value through profit or loss 0 0 0Measured at amortised cost 0 1 623 835 315Hedging derivatives 0 0 0
of which: cash and cash equivalents - 12 - 3 0Gross technical provisions 0 0
Purchase price or sale price - 162 698 297 36
Cashflow for acquiring or selling companies less cash and cash equivalents acquired or sold 48 - 636 123 - 36
31-12-2007
p. 43

Notes on the accounting policies Note 1 a: Statement of compliance
The consolidated annual accounts were authorised for issue on 20 March 2008 by the Board of Directors of KBC Bank NV. The consolidated financial statements have been prepared in accordance with the International Financial Reporting Standards as adopted for use in the European Union (‘endorsed IFRS’) and present one year of comparative information. All amounts are shown in millions of euros and rounded to the million.
The following IFRS standards and IFRICs were issued but not yet effective at year-end 2007. KBC will apply these standards as of their effective date: • IFRS 8 (Operating segments): the group will apply this standard from 1 January 2009, its effective date. It
replaces IAS 14 (Segment Reporting) and will have an impact on the current segment reporting in Note 2. • IFRIC 11 (Group and Treasury Share Transactions)
In 2007, KBC adjusted the presentation of the financial statements to make them correspond more closely with the Belgian prudential reporting presentation for banks and to comply with IFRS 7 requirements. The main changes concern the balance sheet, which will be presented on a portfolio basis from 2007 (i.e. according to the IAS 39 classification system) instead of on a product basis. In order to retain information per product, financial assets and liabilities have been broken down on a portfolio and product basis in Note 14. Changes in the way the income statement has been presented are limited, and include a further breakdown of operating expenses (into staff expenses, general administrative expenses, depreciation and amortisation of fixed assets and provisions for risks and charges). In addition, the 'Net post-tax income from discontinued operations' heading has been moved from the components of 'Total income' to just before 'Profit after tax' and the presentation of minority interests in net profit after tax adjusted. Changes have also been made to a number of notes, with – among other things – breakdowns being given on a portfolio basis instead of a product basis, to correspond with the changes made to the way in which the balance sheet and income statement are presented. The requisite information relating to the nature and amount of risk exposure (according to IFRS 7) and the information relating to capital (according to IAS 1) has been included in the audited parts of the 'Value and risk management' section.
Note 1 b: Summary of significant accounting policies a Criteria for consolidation and for inclusion in the consolidated accounts according to the equity method All material entities (including Special Purpose Entities) over which the consolidating entity exercises, directly or indirectly, exclusive control are consolidated according to the method of full consolidation. Material companies over which joint control is exercised, directly or indirectly, are consolidated according to the method of proportionate consolidation. Material investments in associates, i.e. companies over which KBC has significant influence, are accounted for using the equity method. As allowed under IAS 28, investments in associates held by venture capital organisations are classified as ‘held for trading’ (measured at fair value through profit or loss). b Effects of changes in foreign exchange rates Monetary assets and liabilities denominated in foreign currency are translated into the functional currency at the spot rate at balance sheet date. Negative and positive valuation differences, except for those relating to the funding of shares and investments of consolidated companies in foreign currency, are recognised in profit or loss. Non-monetary items measured at historical cost are translated into the functional currency at the historical exchange rate that existed on the transaction date. Non-monetary items carried at fair value are translated at the spot rate of the date the fair value was determined. Translation differences are reported together with changes in fair value. Income and expense items in foreign currency are taken to profit or loss at the exchange rate prevailing when they were recognised. The balance sheets of foreign subsidiaries are translated into the reporting currency (euros) at the spot rate at balance sheet date (with the exception of the capital and reserves, which are translated at the historical rate). The income statement is translated at the average rate for the financial year. Differences arising from the use of one exchange rate for assets and liabilities, and another for net assets (together with the exchange rate differences – net of deferred taxes – on loans concluded to finance participating interests in foreign currency) are recognised in equity, commensurate with KBC’s share.
p. 44

c Financial assets and liabilities (IAS 39) Financial assets and liabilities are recognised in the balance sheet when KBC becomes a party to the contractual provisions of the instruments. Regular-way purchases or sales of financial assets are recognised using settlement date accounting. All financial assets and liabilities – including derivatives – must be recognised in the balance sheet according to the IAS 39 classification system. Each classification is subject to specific measurement rules. The IAS 39 classifications are as follows: • Loans and receivables (L&R). These include all non-derivative financial assets with fixed or determinable
payments that are not quoted in an active market.
• Held-to-maturity assets (HTM). These are all non-derivative financial assets with a fixed maturity and fixed or determinable payments that KBC intends and is able to hold to maturity.
• Financial assets at fair value through profit or loss. This category includes held-for-trading (HFT) assets and any
other financial assets designated at fair value through profit or loss (FIFV). Held-for-trading assets are assets held for the purpose of selling them in the short term or assets that are part of a portfolio of assets held for trading purposes. All derivatives with a positive replacement value are considered to be held for trading unless they are designated and effective hedging instruments. Other assets initially recognised at fair value through profit or loss are measured in the same way as held-for-trading assets. KBC may use this fair value option when doing so results in more relevant information, because it eliminates or significantly reduces a measurement or recognition inconsistency (sometimes referred to as ‘an accounting mismatch’) that would otherwise arise from measuring assets or liabilities or recognising the gains and losses on them on different bases. The fair value option may also be used for financial assets with embedded derivatives.
• Available-for-sale assets (AFS). These are all non-derivative financial assets that do not come under one of the
above classifications. These assets are measured at fair value, with all fair value changes being recognised in equity until the assets are sold or until there is an impairment in value. In this case, the cumulative revaluation gain or loss will be recognised in income for the financial year.
• Financial liabilities:
- Held-for-trading liabilities. These are liabilities held with the intention of repurchasing them in the short term. All derivatives with a negative replacement value are also considered to be held for trading unless they are designated and effective hedging instruments. These liabilities are measured at fair value, with any fair value changes reported in profit or loss.
- Financial liabilities designated at fair value through profit or loss (FIFV). These are measured in the same way as held-for-trading liabilities. This fair value option may be used under the same conditions as for FIFV assets.
- Other financial liabilities. These are all other non-derivative financial liabilities that are not classified under one of the two liability classifications above. They are measured at amortised cost.
• Hedging derivatives. These are derivatives used for hedging purposes.
Financial instruments (with the exception of trading derivatives) are reported according to the clean price convention. Accrued interest income from financial instruments is presented separately in the balance sheet. KBC applies the following general rules: • Amounts receivable. These are classified under ‘Loans and receivables’. They are measured on acquisition at
fair value, including transaction costs. Loans with a fixed maturity are subsequently measured at amortised cost using the effective interest method, i.e. an interest rate is applied that exactly discounts all estimated future cashflows from the loans to the net carrying amount. This interest rate takes account of all related fees and transaction costs. Loans with no fixed maturity date are measured at amortised cost.
Impairment losses are recognised for loans and advances for which there is evidence – either on an individual or portfolio basis – of impairment at balance sheet date. Whether or not evidence exists is determined on the basis of the probability of default (PD). The characteristics of the loan, such as the type of loan, the borrower's line of business, the geographical location of the borrower and other characteristics key to a borrower's risk profile, are used to determine the PD. Loans with the same PD therefore have a similar credit risk profile. • Loans and advances with a PD of 12 (individual problem loans with the highest probability of default) are
individually tested for impairment (and written down on an individual basis if necessary). The impairment amount is calculated as the difference between the loans' carrying amount and their present value.
• Loans and advances with a PD of 10 or 11 are also considered to be individual problem loans. Significant loans (of more than 1.25 million euros) are tested individually. The impairment amount is calculated as the difference between the loans' carrying amount and their present value. Non-significant loans (of less than 1.25 million euros) are tested on a statistical basis. The impairment amount calculated according to the statistical
p. 45

method is based on three components: the amount outstanding of loans, a reclassification percentage reflecting the movement of loans between the various PD classes, and a loss percentage reflecting the average loss for each product.
• Loans and advances with a PD lower than 10 are considered normal loans. Incurred-but-not-reported (IBNR) losses are recognised for loans with a PD of 1 through 9. IBNR losses are based on the IRB Advanced models (PD X LGD X EAD), with all parameters being adjusted to reflect the point-in-time nature of these losses. The main adjustment relates to the PD: the time horizon of the PD has been shortened based on the emergence period. This is the period between the time an event occurs that will lead to an impairment and the time KBC identifies this event, and is dependent on the review frequency, the location and degree of involvement with the counterparties. When impairment is identified, the carrying amount of the loan is reduced via an impairment account and the loss recognised in the income statement. If, in a subsequent period, the estimated impairment amount increases or decreases due to an event that occurs after the impairment loss was recognised, the previously recognised impairment will be increased or reduced accordingly through adjustment of the impairment account. Loans and the related amounts included in the impairment accounts are written off when there is no realistic prospect of recovery in future or if the loan is forgiven. A renegotiated loan will continue to be tested for impairment, calculated on the basis of the original effective interest rate applying to the loan. For off-balance-sheet commitments (commitment credit) classified as uncertain or irrecoverable and doubtful, provisions are recognised if the general IAS 37 criteria are satisfied and the more-likely-than-not criterion met. These provisions are recognised at their present value. Interest on loans written down as a result of impairment is recognised using the rate of interest used to measure the impairment loss.
• Securities. Depending on whether or not securities are traded on an active market and depending on what the
intention is when they are acquired, securities are classified as loans and receivables, held-to-maturity assets, held-for-trading assets, financial assets at fair value through profit or loss, or available-for-sale assets. Securities classified as loans and receivables or held-to-maturity assets are initially measured at fair value, including transaction costs. They are subsequently measured at amortised cost. The difference between the acquisition cost and the redemption value is recognised as interest and recorded in the income statement on an accruals basis over the remaining term to maturity. It is taken to the income statement on an actuarial basis, based on the effective rate of return on acquisition. Individual impairment losses for securities classified as loans and receivables or held-to-maturity are recognised – according to the same method as is used for amounts receivable as described above – if there is evidence of impairment at balance sheet date. Held-for-trading securities are initially measured at fair value (excluding transaction costs) and subsequently at fair value, with all fair value changes being recognised in profit or loss for the financial year. Securities classified initially as ‘Financial assets at fair value through profit or loss’ that are not held for trading are measured in the same way as held-for-trading assets. Available-for-sale securities are initially measured at fair value (including transaction costs) and subsequently at fair value, with changes in fair value being recorded separately in equity until the sale or impairment of the securities. In this case, the cumulative fair value changes are transferred from equity to profit or loss for the financial year. Impairment losses are recognised if evidence of impairment exists on the balance sheet date. For listed equity and other variable-yield securities, evidence of impairment is determined on the basis of a set of coherent indicators and the impairment is calculated based on an assessment of the recoverable amount of the acquisition cost of the packages of shares in portfolio. For fixed-income securities, impairment is measured on the basis of the recoverable amount of the acquisition cost. Impairment losses are taken to the income statement for the financial year. For equity and other variable-yield securities, impairment is reversed through a separate equity heading. Reversals of impairment on fixed-income securities occur through profit or loss for the financial year.
• Derivatives. All derivatives are classified as held-for-trading assets or held-for-trading liabilities unless they are designated and effective hedging instruments. Held-for-trading derivatives are measured at fair value, with fair value changes being recognised in profit or loss for the financial year. Held-for-trading derivatives with a positive replacement value are recorded on the asset side of the balance sheet; those with a negative replacement value on the liabilities side.
• Amounts owed. Liabilities arising from advances or cash deposits received are recorded in the balance sheet at
amortised cost. The difference between the amount made available and the nominal value is reflected on an accruals basis in the income statement. It is recorded on a discounted basis, based on the effective rate of interest.
• Embedded derivatives. Derivatives embedded in contracts that are measured on an accruals basis (held-to-
maturity assets, loans and receivables, other financial liabilities) or at fair value, with fair value changes being recorded in equity (available-for-sale assets), are separated from the contract and measured at fair value (with fair value adjustments being taken to the income statement for the financial year), if, when KBC obtains the contract, the risk relating to the embedded derivative is considered not to be closely related to the risk on the host contract. The risk may not be reassessed subsequently, unless the terms of the contract are changed and this has a substantial impact on the contract’s cashflows. Contracts with embedded derivatives are however primarily classified as financial instruments at fair value through profit or loss, making it unnecessary to separate the embedded derivative, since the entire financial instrument is measured at fair value, with fair value changes being taken to the income statement.
p. 46
• Hedge accounting. KBC applies hedge accounting when all the requisite conditions (according to the hedge
accounting requirements that have not been carved out in the IAS 39 version as approved by the EU) are fulfilled. The relevant conditions are as follows: the hedge relationship must be formally designated and documented on the inception of the hedge, the hedge must be expected to be highly effective and this effectiveness must be able to be measured reliably, and the measurement of hedge effectiveness must take place on a continuous basis during the reporting period in which the hedge can be considered to be effective.
For fair value hedges, both the derivatives hedging the risks and the hedged positions are measured at fair value, with all fair value changes being taken to the income statement. Accrued interest income from interest rate swaps is included in net interest income. Hedge accounting is discontinued once the hedge accounting requirements are no longer met or if the hedging instrument expires or is sold. In this case, the gain or loss recorded in equity on the hedged position (for fixed-income financial instruments) will be taken to profit or loss on an accruals basis until maturity. Fair value hedges for a portfolio of interest rate risk (portfolio hedge of interest rate risk) are applied by KBC to hedge the interest rate risk for a portfolio of loans with interest rate swaps. The interest rate swaps are measured at fair value, with fair value changes reported in profit or loss. Accrued interest income from these swaps is included in net interest income. The hedged amount of loans is measured at fair value as well, with fair value changes reported in profit or loss. The fair value of the hedged amount is presented as a separate line item of the assets on the balance sheet. KBC makes use of the ‘carved-out’ version of IAS 39, so that no ineffectiveness results from anticipated repayments, as long as underhedging exists. In case of hedge ineffectiveness, the cumulative change in the fair value of the hedged amount will be amortised through profit or loss over the remaining lifetime of the hedged assets or immediately removed from the balance sheet if the ineffectiveness is due to the fact that the corresponding loans have been derecognised. For cashflow hedges, derivatives hedging the risks are measured at fair value, with those fair value gains or losses determined to be an effective hedge being recognised separately in equity. Accrued interest income from rate swaps is included in net interest income. The ineffective portion of the hedge is recognised in income for the financial year. Hedge accounting will be discontinued if the hedge accounting criteria are no longer met. In this case, the derivatives will be treated as held-for-trading derivatives and measured accordingly. Foreign currency funding of a net investment in a foreign entity is accounted for as a hedge of that net investment. This form of hedge accounting is used for investments not denominated in euros. Translation differences (account taken of deferred taxes) on the funding are recorded in equity, along with translation differences on the net investment.
• Financial guarantee contracts. These are contracts that require the issuer to make specified payments to reimburse the holder for a loss it incurs because a specified debtor fails to make payment when due under the initial or revised terms of a debt instrument. A financial guarantee contract is initially recognised at fair value and subsequently measured at the greater of the following: 1 the amount determined in accordance with IAS 37: Provisions, Contingent Liabilities and Contingent Assets;
and 2 the amount initially recognised less, where appropriate, cumulative amortisation recognised in accordance with
IAS 18: Revenue.
• Fair value adjustments (‘market value adjustments’). Fair value adjustments are recognised on all financial instruments measured at fair value, with fair value changes being taken to profit or loss or recognised in equity. These fair value adjustments include all close-out costs, adjustments for less liquid instruments or markets, adjustments relating to ‘mark-to-model’ measurements and counterparty exposures.
• Day 1 profits. When the transaction price in a non-active market differs from the fair value of other observable
market transactions in the same instrument or the fair value based on a valuation technique whose variables include only data from observable markets, the difference between the transaction price and the fair value (day 1 profit) is taken to profit or loss. Day 1 profit is recognised for structuring CDOs. However, a portion is reserved and is released in profit or loss over the life and at maturity of the CDOs.
d Goodwill and other intangible assets Goodwill is defined as any excess of the cost of the acquisition over the acquirer’s interest in the fair value of the identifiable assets acquired and liabilities and contingent liabilities assumed at the date of acquisition. It is recognised as an intangible asset and is carried at cost less impairment losses. Goodwill is not amortised, but is tested at least once a year for impairment. An impairment loss is recognised if the carrying amount of the cash-generating unit to which the goodwill belongs exceeds its recoverable amount. Impairment losses on goodwill cannot be reversed. If the capitalisation criteria are met, software is recognised as an intangible asset. System software is capitalised and amortised at the same rate as hardware, i.e. over three years, from the moment the software is available for use. Standard software and customised software developed by a third party is capitalised and amortised over five years according to the straight-line method from the moment the software is available for use. Internal and external development expenses for internally-generated software for investment projects are capitalised and written off according to the straight-line method over five years. Investment projects are large-scale projects that introduce or replace an important business objective or model. Internal and external research expenses for these projects and
p. 47

all expenses for other ICT projects concerning internally-generated software (other than investment projects) are taken to the income statement directly. e Property and equipment (including investment property) All property and equipment is recognised at cost (including directly allocable acquisition costs), less accumulated depreciation and impairment. The rates of depreciation are determined on the basis of the anticipated useful life of the assets and are applied according to the straight-line method from the moment the assets are available for use. Impairment is recognised if the carrying value of the asset exceeds its recoverable value (i.e. the higher of the asset’s value in use and net selling price). Amounts written down can be reversed through the income statement. When property or equipment is sold, the realised gains or losses are taken directly to the income statement. If property or equipment is destroyed, the remaining amount to be written off is taken directly to the income statement. The accounting policy outlined for property and equipment also applies to investment property. External borrowing costs that are directly attributable to the acquisition of an asset are capitalised as part of the cost of that asset. All other borrowing costs are recognised as an expense in the period in which they are incurred. Capitalisation commences when expenses are incurred for the asset, when the borrowing costs are incurred and when activities that are necessary to prepare the asset for its intended use or sale are in progress. When development is interrupted, the capitalisation of borrowing costs is suspended. The capitalisation of borrowing costs ceases when substantially all the activities necessary to prepare the asset for its intended use or sale are complete. f Pension liabilities
Pension liabilities are included under the ‘Other liabilities’ item and relate to obligations for retirement and survivor’s pensions, early retirement benefits and similar pensions or annuities. Defined benefit plans are those under which KBC has a legal or constructive obligation to pay extra contributions to the pension fund if this last has insufficient assets to settle all the obligations to employees resulting from employee service in current and prior periods. The pension obligations under these plans for employees are calculated according to IAS 19, based on the projected-unit-credit method, with each period of service granting additional entitlement to pension benefits. Actuarial gains and losses are recognised according to the ‘corridor approach’. The portion of actuarial gains and losses exceeding 10% of the greater of the fair value of plan assets or the gross pension obligation will be recognised as income or expense, spread over a period of five years. g Tax liabilities This heading includes current and deferred tax liabilities. Current tax for the period is measured at the amount expected to be paid, using the rates of tax in effect for the balance sheet date. Deferred tax liabilities are recognised for all taxable temporary differences between the carrying amount of an asset or liability and its tax base. They are measured using the tax rates in effect on realisation of the assets or settlement of the liabilities to which they relate. Deferred tax assets are recognised for all deductible temporary differences between the carrying value of assets and liabilities and their tax base, to the extent that it is probable that taxable profit will be available against which the deductible temporary differences can be utilised. h Provisions Provisions are recognised in the balance sheet: • if an obligation (legal or constructive) exists on the balance sheet date that stems from a past event, and • it is probable that an outflow of resources embodying economic benefits will be required to settle the obligation,
and • a reliable estimate can be made of the amount of the obligation. i Equity Equity is the residual interest in the net assets after all liabilities have been deducted. Equity instruments have been differentiated from financial instruments in accordance with the IAS 32 rules: • Bonds mandatorily redeemable in KBC Group NV shares (1998-2008 MCB) are classified as equity. • Written stock options on treasury shares subject to IFRS 2 are measured at fair value on the grant date. This fair
value is recognised in the income statement as a staff expense over the period of service, against a separate entry under equity. The 2000-2002 stock option plans are not covered by the scope of IFRS 2.
• The revaluation reserve for available-for-sale assets is included in equity until disposal or impairment of the assets. At that time, the cumulative gain or loss is transferred to profit or loss for the period.
Put options on minority interests (and, where applicable, combinations of put and call options resulting in forward contracts) are recognised as financial liabilities at the present value of the exercise prices. The corresponding
p. 48

minority interests are deducted from equity. The difference is recognised either as an asset (goodwill) or in the income statement (negative goodwill). l Exchange rates used
Exchange rate at 31-12-2007 Exchange rate average in 2007
1 EUR = … currency Change from 31-12-2006 (positive: appreciation relative to EUR) (negative: depreciation relative to EUR)
1 EUR = … currency
Change relative to average in 2006 (positive: appreciation relative to EUR) (negative: depreciation relative to EUR)
CZK 26,63 3,2% 27,77 2,0% GBP 0,733 -8,4% 0,685 -0,3% HUF 253,7 -0,8% 251,3 5,1% PLN 3,594 6,6% 3,785 3,1% SKK 33,58 2,5% 33,78 10,1% USD 1,472 -10,5% 1,373 -8,4%
k Changes made to accounting policies in 2007
No material changes were made to the accounting policies compared with 2006.
p. 49

Notes on segment reporting
Note 2: Reporting based on the legal structure and by geographic segment Under IFRS, the primary segment reporting format used by KBC Bank is based on the bank’s legal structure. KBC Bank distinguishes between the following primary segments: • Banking: KBC Bank and its subsidiaries (subsidiary banks); • Asset management: KBC Asset Management and its subsidiaries; • Leasing: KBC Lease and its subsidiaries; • Equity business: KBC Financial Products, KBC Securities and KBC Private Equity; • Other: Mainly smaller subsidiaries that do not belong to the above segments; • Intersegment eliminations : Intersegment transactions are transactions conducted between the different
primary segments at arm’s length. As a number of items are reported on a net basis (e.g., Net interest income), the balance of the intragroup transactions for these items is limited. Intersegment transfers are measured on the basis actually used to price the transfers.
The IFRS secondary segment reporting format is based on geographic areas, and reflects KBC’s focus on its two home markets – Belgium and Central and Eastern Europe (including Russia) – and its selective presence in other countries (‘rest of the world’, i.e. mainly the US, Southeast Asia and Western Europe excluding Belgium). The geographic segmentation is based on the location where the services are rendered. Since at least 95% of the customers are local customers, the location of the branch or subsidiary determines the geographic breakdown of both the balance sheet and income statement. More detailed geographic segmentation figures for balance sheet items are provided in the various Notes to the balance sheet. The breakdown here is made based on the geographic location of the counterparty.
p. 50

In millions of EURBanking activities
Asset Manage-
ment Leasing
activities Equity
activities Other
Interseg-ment
elimina-tions
KBC Bank Consolida-
tedINCOME STATEMENT FY 2006Net interest income 3 218 15 102 - 251 189 - 3 3 271Dividend income 52 7 0 80 1 0 139
377 10 1 1 082 - 2 0 1 468Net realised gains from available-for-sale assets 174 7 0 0 0 0 Net fee and commission income 1 143 408 - 13 78 34 - 1 1 648Other net income 417 6 25 6 29 - 32 451TOTAL INCOME 5 380 453 116 995 251 - 37 7 158Operating expenses* - 3 063 - 73 - 70 - 625 - 78 37 - 3 872
Staff expenses - 1 566 - 40 - 31 - 527 - 26 0 - 2 190General administrative expenses - 1 346 - 33 - 35 - 89 - 43 37 - 1 510Depreciation and amortisation of fixed assets - 183 - 1 - 2 - 11 - 9 0 - 206Provisions for risks and charges 33 0 - 1 2 0 0 34
Impairment - 141 0 - 9 - 7 - 11 0 - 169on loans and receivables - 149 0 - 9 - 6 - 11 0 - 176on available-for-sale assets - 2 0 0 - 1 0 0 - 2on goodwill 0 0 0 0 0 0 0on other 9 0 0 0 0 0 9
Share in results of associated companies 41 0 0 1 1 0 43PROFIT BEFORE TAX 2 217 380 37 364 162 0 3 160Income tax expense - 537 - 94 - 12 - 103 - 12 0 - 759Net post-tax income from discontinued operations 0 0 0 0 0 0 0PROFIT AFTER TAX 1 680 286 25 261 149 0 2 401
attributable to minority interest 53 138 0 35 92 0 318attributable to equity holders of the parent 1 627 148 25 226 57 0 2 083
*of which non-cash expenses : - 150 - 1 - 3 - 9 - 9 - 172depreciation and amortisation of fixed assets - 183 - 1 - 2 - 11 - 9 - 206other 33 0 - 1 2 0 34
INCOME STATEMENT FY 2007Net interest income 3 335 23 116 - 473 180 - 2 3 179Dividend income 40 7 0 76 3 0 126
537 1 - 1 1 228 3 0 1 768Net realised gains from available-for-sale assets 183 4 0 0 1 0 Net fee and commission income 1 249 469 - 10 151 44 - 6 1 897Other net income 319 5 30 34 81 - 54 416TOTAL INCOME 5 663 510 136 1 017 313 - 62 7 576Operating expenses* - 3 279 - 99 - 81 - 645 - 99 62 - 4 140
Staff expenses - 1 656 - 54 - 37 - 499 - 31 0 - 2 276General administrative expenses - 1 458 - 44 - 42 - 131 - 56 62 - 1 669Depreciation and amortisation of fixed assets - 191 - 1 - 2 - 15 - 12 0 - 222Provisions for risks and charges 26 0 1 0 0 0 27
Impairment - 189 0 - 1 - 2 - 19 0 - 212on loans and receivables - 135 0 - 1 - 2 - 9 0 - 148on available-for-sale assets - 50 0 0 0 0 0 - 50on goodwill 0 0 0 0 0 0 0on other - 4 0 0 0 - 10 0 - 14
Share in results of associated companies 57 0 0 2 0 0 59PROFIT BEFORE TAX 2 253 411 54 371 195 0 3 283Income tax expense - 533 - 94 - 18 - 99 - 6 0 - 750Net post-tax income from discontinued operations 0 0 0 0 0 0 0PROFIT AFTER TAX 1 720 317 36 272 189 0 2 534
attributable to minority interest 28 153 0 2 90 0 273attributable to equity holders of the parent 1 692 164 36 269 99 0 2 261
*of which non-cash expenses : - 165 - 1 - 1 - 16 - 13 0 - 195depreciation and amortisation of fixed assets - 191 - 1 - 2 - 15 - 12 0 - 222other 26 0 1 0 0 0 27
Net (un)realised gains from financial instruments at fair value through profit or loss
Net (un)realised gains from financial instruments at fair value through profit or loss
181
189
p. 51

In millions of EUR Banking activities
Asset Manage-
ment Leasing activities
Equity activities Other
KBC Bank Consolida-
tedBALANCE SHEET 31-12-2006Cash and cash balances with central banks 2 386 0 0 0 0 2 386Financial assets 218 837 581 3 528 36 502 6 318 265 766
Held for trading 34 853 8 0 32 111 53 67 024Designated at fair value through profit and loss 42 376 0 0 0 3 882 46 258Available for sale 28 543 455 2 26 69 29 095Loans and receivables 103 436 117 3 526 4 366 2 306 113 751Held-to-maturity investments 9 308 0 0 0 4 9 313Hedging derivatives 321 0 0 0 4 325
- 175 0 0 0 0 - 175Accrued interest income 2 183 0 9 62 45 2 299Tax assets 485 1 12 131 10 638
Current tax assets 65 0 7 42 4 117Deferred tax assets 420 1 5 89 6 521
Non-current assets held for sale and disposal groups 53 0 0 0 0 53Investments in associated companies 528 0 0 3 4 535Investment property 0 0 0 0 225 225Property and equipment 1 477 4 4 55 4 1 544Goodwill and other intangible fixed assets 784 1 5 26 17 833Other assets 756 111 183 395 190 1 634TOTAL ASSETS 227 314 697 3 741 37 174 6 813 275 738
Financial liabilities 205 408 2 22 27 540 23 636 256 608Held for trading 17 454 0 0 19 328 98 36 880Designated at fair value through profit and loss 38 401 0 0 0 9 166 47 567Measured at amortized cost 149 504 2 22 8 212 14 372 172 112Hedging derivatives 49 0 0 0 0 49
0 0 0 0 0 0Accrued interest expenses 1 282 0 16 81 194 1 572Tax liabilities 342 31 23 50 5 450
Current tax liabilities 301 31 7 37 4 380Deferred tax liabilies 40 0 16 13 1 70
Liabilities included in disposal groups classified as held for sale 0 0 0 0 0 0Provisions for risks and charges 398 0 3 4 1 407Other liabilities 3 079 106 108 1 070 170 4 534TOTAL LIABILITIES 210 508 140 171 28 746 24 005 263 570
805 2 4 34 7 851
BALANCE SHEET 31-12-2007Cash and cash balances with central banks 2 873 0 0 25 0 2 898Financial assets 241 147 680 4 238 42 951 7 686 296 702
Held for trading 38 327 0 0 34 406 317 73 051Designated at fair value through profit and loss 35 073 3 0 329 579 35 985Available for sale 24 020 547 1 1 844 131 26 543Loans and receivables 133 912 130 4 237 6 372 6 652 151 304Held-to-maturity investments 9 291 0 0 0 5 9 296Hedging derivatives 522 0 0 0 1 524
- 223 0 0 0 0 - 223Accrued interest income 2 843 0 6 48 21 2 918Tax assets 493 1 13 126 25 659
Current tax assets 50 0 11 33 8 102Deferred tax assets 443 1 2 94 17 556
Non-current assets held for sale and disposal groups 1 0 0 40 0 41Investments in associated companies 603 0 0 40 3 646Investment property 94 0 0 0 354 448Property and equipment 1 681 4 4 64 7 1 760Goodwill and other intangible fixed assets 1 733 1 59 197 18 2 008Other assets 758 41 221 573 25 1 618TOTAL ASSETS 252 004 727 4 542 44 065 8 139 309 476
Financial liabilities 231 678 11 9 30 452 25 020 287 170Held for trading 19 988 0 0 21 302 251 41 542
Designated at fair value through profit and loss 32 040 0 0 1 825 3 218 37 082Measured at amortized cost 179 531 11 9 7 325 21 551 208 427Hedging derivatives 118 0 0 0 0 118
0 0 0 0 0 0Accrued interest expenses 1 659 0 16 86 245 2 006Tax liabilities 377 16 18 45 12 467
Current tax liabilities 323 16 5 34 11 388Deferred tax liabilies 54 0 13 11 1 79
Liabilities included in disposal groups classified as held for sale 0 0 0 0 0 0Provisions for risks and charges 390 0 3 6 1 401Other liabilities 4 272 45 125 982 95 5 519TOTAL LIABILITIES 238 375 72 171 31 571 25 373 295 562
1 217 0 60 158 32 1 467
Fair value adjustments of the hedged items in portfolio hedge of interest rate risk
Fair value adjustments of the hedged items in portfolio hedge of interest rate risk
Fair value adjustments of the hedged items in portfolio hedge of interest rate risk
Fair value adjustments of the hedged items in portfolio hedge of interest rate risk
Acquisitions of tangible and intangible assets (including goodwill)
Acquisitions of tangible and intangible assets (including goodwill)
p. 52
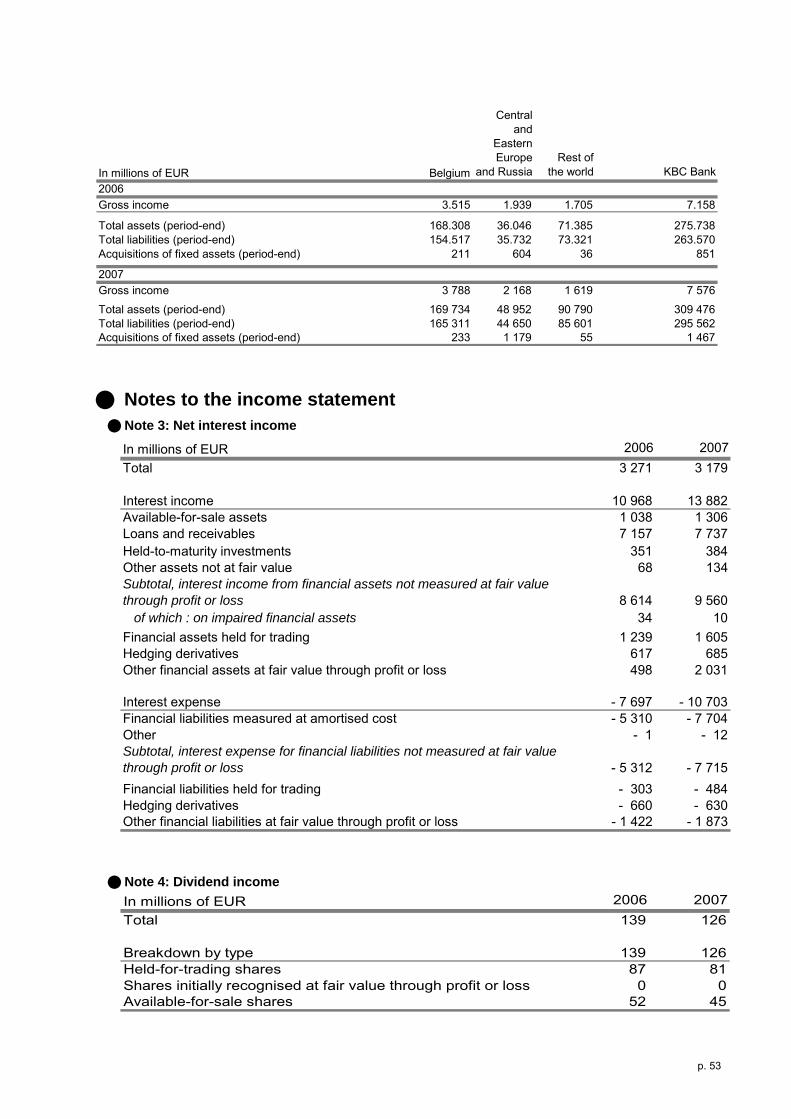
In millions of EUR Belgium
Central and
Eastern Europe
and RussiaRest of
the world KBC Bank2006Gross income 3.515 1.939 1.705 7.158
Total assets (period-end) 168.308 36.046 71.385 275.738154.517 35.732 73.321 263.570
Acquisitions of fixed assets (period-end) 211 604 36 851
2007Gross income 3 788 2 168 1 619 7 576
Total assets (period-end) 169 734 48 952 90 790 309 476 165 311 44 650 85 601 295 562
Acquisitions of fixed assets (period-end) 233 1 179 55 1 467
Total liabilities (period-end)
Total liabilities (period-end)
Notes to the income statement Note 3: Net interest income In millions of EUR 2006 2007Total 3 271 3 179
Interest income 10 968 13 882Available-for-sale assets 1 038 1 306Loans and receivables 7 157 7 737Held-to-maturity investments 351 384Other assets not at fair value 68 134Subtotal, interest income from financial assets not measured at fair valuethrough profit or loss 8 614 9 560
of which : on impaired financial assets 34 10Financial assets held for trading 1 239 1 605Hedging derivatives 617 685Other financial assets at fair value through profit or loss 498 2 031
Interest expense - 7 697 - 10 703Financial liabilities measured at amortised cost - 5 310 - 7 704Other - 1 - 12Subtotal, interest expense for financial liabilities not measured at fair valuethrough profit or loss - 5 312 - 7 715Financial liabilities held for trading - 303 - 484Hedging derivatives - 660 - 630Other financial liabilities at fair value through profit or loss - 1 422 - 1 873
Note 4: Dividend income In millions of EUR 2006 2007Total 139 126
Breakdown by type 139 126Held-for-trading shares 87 81Shares initially recognised at fair value through profit or loss 0 0Available-for-sale shares 52 45
p. 53

Note 5: Net (un)realised gains from financial instruments at fair value through profit or loss In millions of EUR 2006 2007Total 1 468 1 768
Breakdown by type Trading instruments (including interest and fair value changes in trading derivatives) 1 252 1 549Other financial instruments initially recognised at fair value through profit or loss - 252 59Foreign exchange trading 468 154Fair value adjustments in hedge accounting 0 6
Microhedge 0 2Fair value hedges 0 2
Changes in the fair value of the hedged item - 12 - 15Changes in the fair value of the hedging derivatives (including discontinuation) 12 17
Cashflow hedges - 1 0Changes in the fair value of the hedging derivatives - ineffective portion - 1 0
Hedges of net investments in foreign operation - ineffective portion 0 0Portfolio hedge of interest rate risk 0 4
Fair value hedges of interest rate risk 0 0Changes in the fair value of the hedged item - 234 - 48Changes in the fair value of the hedging derivatives (including discontinuation) 234 48
Cashflow hedges of interest rate risk 0 4Changes in the fair value of the hedging instrument - ineffective portion 0 4
• With regard to the ALM derivatives (except for micro-hedging derivatives, which are used to only a limited extent in
the group), the following applies: o For ALM derivatives classified under ‘Portfolio hedge of interest rate risk’, the interest concerned is recognised
under ‘Net interest income’. Changes in the fair value of these derivatives are recognised under ‘Net (un)realised gains from financial instruments at fair value through profit or loss’, but due to the fact that changes in the fair value of the hedged assets are also recognised under this heading – and the hedge is effective – the balance of ‘Net (un)realised gains from financial instruments at fair value through profit or loss’ is zero.
o For other ALM derivatives, the interest in question is recognised under ‘Net (un)realised gains from financial instruments at fair value through profit or loss' (a negative 146 and a positive 35 million euros in 2006 and 2007, respectively). The fair value changes are also recognised under this heading, most (but not all) of which are offset by changes in the fair value of a bond portfolio that is classified as 'financial instruments designated at fair value through profit or loss' (see accounting policies).
• The effectiveness of the hedge is determined according to the following methods: o For fair value micro-hedging, the dollar offset method is used on a quarterly basis, which requires changes in the
fair value of the hedged item to offset changes in the fair value of the hedging instrument within a range of 80%–125%, which is currently the case.
o For cashflow micro-hedges, the designated hedging instrument is compared with a perfect hedge of the hedged cashflows on a prospective (by BPV measurement) and retrospective basis (by comparing the fair value of the designated hedging instrument with the perfect hedge). The effectiveness of both tests must fall within a range of 80%–125%, which is currently the case.
o For fair value hedges for a portfolio of interest rate risk, effectiveness is assessed on the basis of the rules set out in the European version of IAS 39 (carve-out). IFRS does not permit net positions to be reported as hedged items, but does allow hedging instruments to be designated as a hedge of a gross asset position (or a gross liabilities position, as the case may be). Specifically, care is taken to ensure that the volume of assets (or liabilities) in each maturity bucket is greater than the volume of hedging instruments allocated to the same bucket.
• Total exchange differences, excluding those recognised on financial instruments at fair value through profit or loss came to a positive 10 million euros for 2006 and to 154 million euros for 2007. These are included in the 468 and 154 million euros shown in the table.
• The total change in fair value taken to the income statement in 2007, where the fair value was estimated using techniques based on unobservable parameters, was almost entirely accounted for by CDOs in the group's portfolios. The changes in the fair value of these instruments came to 103 million euros in 2007 (insignificant in 2006). Reasonable changes in the assumptions would lead to an additional negative fair value impact of 110 million euros before taxes.
• When the transaction price in a non-active market differs from the fair value of other observable market transactions in the same instrument or the fair value based on a valuation technique whose variables include only data from observable markets, the difference between the transaction price and the fair value (day 1 profit) is taken to profit or loss. If this is not the case, day 1 profit is reserved and is released in profit or loss during the life and until the maturity of the financial instrument. Day 1 profit is recognised for structuring CDOs. Movements in deferred day 1 profit can be summarised as follows (in millions of euros):
p. 54

o Deferred day 1 profits, opening balance on 1 January 2006 40 o New deferred day 1 profits 55 o Day 1 profits recognised in profit or loss during the period
Amortisation of day 1 profits -1 Financial instruments no longer recognised -24 Exchange differences 2
o Deferred day 1 profits, closing balance on 31 December 2006/opening balance on 1 January 2007: 72 o New deferred day 1 profits 134 o Day 1 profits recognised in profit or loss during the period
Amortisation of day 1 profits -32 Financial instruments no longer recognised -63 Exchange differences -7
o Deferred day 1 profits, closing balance on 31 December 2007 104
Note 6: Net realised gains from available-for-sale assets
In millions of EUR 2006 2007Total 181 189
Breakdown by portfolioFixed-income assets 34 - 145Shares 147 335
Note 7: Net fee and commission income In millions of EUR 2006 2007Total 1 648 1 897
Breakdown by type
Fee and commission income 2 398 2 666Securities and asset management 1 464 1 646Commitment credit 149 181Payments 412 419Other 374 420
Fee and commission expense - 750 - 769Commission paid to intermediaries - 74 - 81Other - 676 - 688
• The lion's share of the fees and commissions related to lending is recognised under 'Net interest income' (effective interest rate calculations).
p. 55

Note 8: Other net income In millions of EUR 2006 2007Total 451 416
Net realised gain on loans and receivables 58 18of which: impact of sale of bad loans - Kredyt Bank 2006 37 0
Net realised gain on held-to-maturity investments 1 1Net realised gain on financial liabilities measured at amortised cost 0 0Other 392 397
of which: realised gain on sale of buildings in Prague - ČSOB 36 2of which: realised gain on sale of BCC and Banksys shareholdings - KBC Bank 2006 60 0of which: Belgian Deposit Guarantee Agency - KBC Bank 0 44of which: impact of sale GBC - K&H Bank 0 35
• The amount reported under 'Other net income' includes income from operating leases, amounts recovered under guarantees, rental income, realised gains or losses on property and equipment and investment property, and amounts recovered on loans that have been written off in full and realised gains or losses on the sale of held-to-maturity investments, loans and receivables and financial liabilities measured at amortised cost.
Note 9: Operating expenses In millions of EUR 2006 2007Total - 3 872 - 4 140
Breakdown by typeStaff expenses - 2 190 - 2 276
of which share based payment: equity settled - 2 - 1of which share based payment: cash settled - 61 - 25
General administrative expenses - 1 510 - 1 669Depreciation and amortisation of fixed assets - 206 - 222Provisions for risks and charges 34 27 • General administrative expenses (see table) include repair and maintenance expenses, advertising costs, rent,
professional fees, various (non-income) taxes and utilities. • Share-based payments are included under staff expenses, and can be broken down as follows:
A. Main cash-settled share-based payment arrangements KBC Financial Products established a phantom equity plan in 1999 as a means of keeping its senior executives. One million phantom shares were issued between 1999 and 2002. Since only one million shares can be issued under the plan, all new participants must acquire shares from existing members of the plan. The shares are valued based on the profit before tax of the KBC Financial Products group. The plan was terminated in 2005 and all employees will be paid out over a four-year period ending in March 2009. At the end of 2007, KBC Financial Products recognised an outstanding liability of 88 million euros in this regard (129 million euros at year-end 2006). B. Main equity-settled share-based payments Since 2000, the KBC Bank and Insurance Holding Company NV (now KBC Group NV) has launched a number of share option plans. The share options have been granted to members of staff of the company and various subsidiaries. There were share option plans for all members of staff and plans reserved for particular members of staff. The share options were granted free to the members of staff, who only had to pay the relevant tax on the benefit when the options were allocated. The share options have a life of seven to ten years from the date of issue and can be exercised in specific years in the months of June, September or December. Not all the options need be exercised at once. When exercising options, members of staff can either deposit the resulting shares on their custody accounts or sell them immediately on Euronext Brussels. The KBC Bank and Insurance Holding Company NV (now KBC Group NV) took over three share option plans of KBC Peel Hunt Ltd. dating from 1999 and 2000. Eligible KBC Peel Hunt staff members have obtained options on KBC Group NV shares instead of KBC Peel Hunt Ltd. shares. KBC has repurchased treasury shares in order to be able to deliver shares to staff when they exercise their options.
• IFRS 2 has not been applied to equity-settled option plans that predate 7 November 2002, since they are not covered by the scope of IFRS 2. The option plans postdating 7 November 2002 are limited in size.
• In 2007, KBC Bank employees again had the opportunity to subscribe to the group’s capital increase on attractive terms. This employee benefit of 1.3 million euros was recognised as a staff expense against an entry under equity (in 2006, this employee benefit came to 1.7 million euros).
p. 56
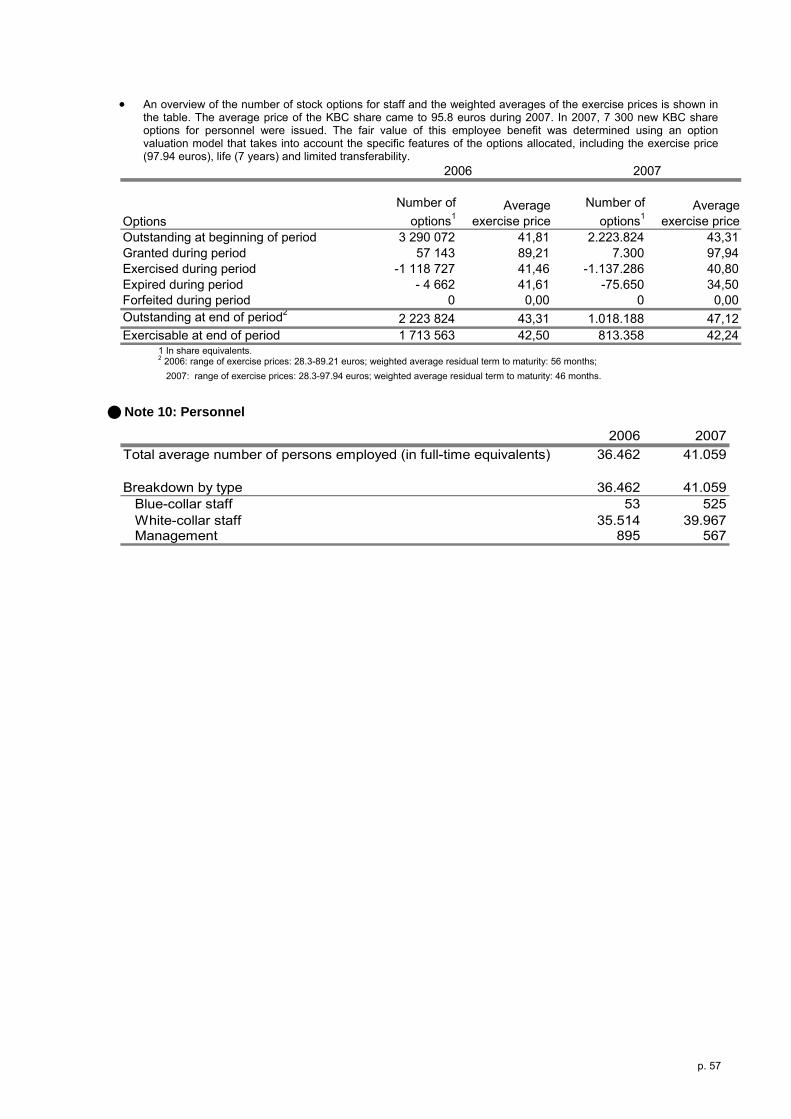
• An overview of the number of stock options for staff and the weighted averages of the exercise prices is shown in the table. The average price of the KBC share came to 95.8 euros during 2007. In 2007, 7 300 new KBC share options for personnel were issued. The fair value of this employee benefit was determined using an option valuation model that takes into account the specific features of the options allocated, including the exercise price (97.94 euros), life (7 years) and limited transferability.
OptionsNumber of
options1Average
exercise priceNumber of
options1Average
exercise priceOutstanding at beginning of period 3 290 072 41,81 2.223.824 43,31Granted during period 57 143 89,21 7.300 97,94Exercised during period -1 118 727 41,46 -1.137.286 40,80Expired during period - 4 662 41,61 -75.650 34,50Forfeited during period 0 0,00 0 0,00Outstanding at end of period2 2 223 824 43,31 1.018.188 47,12Exercisable at end of period 1 713 563 42,50 813.358 42,24
20072006
1 In share equivalents. 2 2006: range of exercise prices: 28.3-89.21 euros; weighted average residual term to maturity: 56 months; 2007: range of exercise prices: 28.3-97.94 euros; weighted average residual term to maturity: 46 months.
Note 10: Personnel 2006 2007
Total average number of persons employed (in full-time equivalents) 36.462 41.059
Breakdown by type 36.462 41.059Blue-collar staff 53 525White-collar staff 35.514 39.967Management 895 567
p. 57

Note 11: Impairment (income statement) In millions of EUR 2006 2007Total - 169 - 212
Impairment on loans and receivables - 176 - 148Breakdown by type
Specific impairments for on-balance-sheet lending - 177 - 168Specific impairments for off-balance-sheet credit commitments - 8 - 18Portfolio-based impairments 9 39
Impairment on available-for-sale assets - 2 - 50Breakdown by type
Shares - 2 - 42Other 0 - 8
Impairment on goodwill 0 0
Impairment on other 9 - 14 Intangible assets, other than goodwill - 1 - 2
Property and equipment 11 - 9 Held-to-maturity assets 0 1 Associated companies (goodwill) 0 0 Other 0 - 4
• Impairment on loans and receivables relate primarily to loans and advances to customers (chiefly term loans).
• Impairment on other. In 2007, this heading included primarily a 2-million-euro allocation for impairment on various intangible assets and a 9–million-euro allocation for impairment on real estate. In 2006, this heading had included mainly a 7-million-euro reversal of impairment on property in Poland.
Note 12: Share in results of associated companies In millions of EUR 2006 2007Total 43 59
of which NLB 33 48
• Impairment on (goodwill on) associated companies is included in ‘Impairment’. The share in results of associated companies does not therefore take this impairment into account.
p. 58

Note 13: Income tax expense In millions of EUR 2006 2007Total - 759 - 750
Breakdown by type - 759 - 750Current taxes on income - 723 - 672Deferred taxes on income - 35 - 78
Tax componentsProfit before tax 3 160 3 283Income tax at the Belgian statutory rate 33,99% 33,99%Income tax calculated - 1 074 - 1 116
Plus/minus tax effects attributable to 316 366Differences in tax rates, Belgium - abroad 127 160Tax-free income 204 361Adjustments related to prior years 1 0Adjustments, opening balance of deffered taxes due to change in tax rate 0 - 3Unused tax losses and unused tax credits to reduce current tax expense 1 4Unused tax losses and unused tax credits to reduce deferred tax expense 0 0Other (mainly non-deductible expenses) - 17 - 157
442 4621 Primarily gains realised on the sale of shares.
Aggregate amount of temporary differences associated with investments in subsidiaries, branches and associated companies and interests in joint ventures, for which deferred tax liabilities have not been recognized
2 Reserves of joint or other subsidiaries, associated companies and branches that, at certain entities, will be taxed in full on distribution (recorded in full). For a significant number of entities, the foreign tax credit applies (5% is recorded, since 95% is definitively taxed). • For information on tax assets and tax liabilities, see Note 23.
p. 59

Notes to the balance sheet
Note 14: Financial assets and liabilities, breakdown by portfolio and product
FINANCIAL ASSETS (In millions of EUR)Held for trading
Designated at fair value through profit or loss1 Available
for saleLoans and
receivablesHeld to
maturityHedging
derivatives
Measured at
amortised cost Total
31-12-2006
11 463 19 619 0 9 948 - - - 41 030Loans and advances to customersb 3 442 11 943 0 103 803 - - - 119 188
Discount and acceptance credit 0 0 0 224 - - - 224Consumer credit 0 0 0 3 226 - - - 3 226Mortgage loans 0 11 089 0 28 500 - - - 39 589Term loans 3 442 854 0 50 913 - - - 55 208Finance leasing 0 0 0 6 031 - - - 6 031Current account advances 0 0 0 6 885 - - - 6 885Securitised loans 0 0 0 302 - - - 302Other 0 0 0 7 722 - - - 7 722
Equity instruments 16 265 0 1 417 - - - - 17 682Debt instruments issued by 19 004 14 697 27 678 - 9 313 - - 70 684
Public bodies 12 327 9 073 19 254 - 8 505 - - 49 152Credit institutions and investment firms 4 170 847 2 569 - 441 - - 8 026Corporates 2 507 4 778 5 855 - 366 - - 13 506
Derivatives 16 851 - - - - 325 - 17 176Total carrying value excluding accrued interest income 67 024 46 258 29 095 113 751 9 313 325 0 265 766Accrued interest income2 141 249 420 816 221 408 - 2 256Total carrying value including accrued interest income 67 165 46 507 29 515 114 567 9 534 733 - 268 022Total fair value 67 165 46 507 29 515 115 725 9 515 733 269 161a Of which reverse repos 23 107b Of which reverse repos 7 006
23 4391 Designated at fair value through profit or loss.2 Excluding accrued interest income related to cash balances with central banks for an amount of 43 million EUR; including accrued interest income the cash and cash balances with central banks amount to 2 429 million EUR
31-12-2007
16 098 16 014 0 15 417 - - - 47 529Loans and advances to customersb 2 067 8 756 0 135 887 - - - 146 710
Discount and acceptance credit 0 0 0 717 - - - 717Consumer credit 0 0 0 3 885 - - - 3 885Mortgage loans 0 3 254 0 43 513 - - - 46 767Term loans 2 067 5 322 0 65 796 - - - 73 185Finance leasing 0 0 0 6 883 - - - 6 883Current account advances 0 0 0 7 162 - - - 7 162Securitised loans 0 0 0 264 - - - 264Other 0 181 0 7 667 - - - 7 848
Equity instruments 16 992 15 939 - - - - 17 947Debt instruments issued by 16 391 11 199 25 604 - 9 296 - - 62 491
Public bodies 5 218 8 581 13 889 - 8 737 - - 36 425Credit institutions and investment firms 4 059 741 3 575 - 279 - - 8 654Corporates 7 114 1 878 8 140 - 280 - - 17 412
Derivatives 21 503 - - - - 524 - 22 026Total carrying value excluding accrued interest income 73 051 35 985 26 543 151 304 9 296 524 0 296 702
Loans and advances to credit institutions and investment firmsa / c
Loans and advances to credit institutions and investment firmsa / c
c Of which loans and advances to banks repayable on demand and term loans at not more than three months
p. 60

Accrued interest income 2 344 299 390 1 475 229 175 0 2 910Total carrying value including accrued interest income 73 394 36 284 26 933 152 778 9 525 698 0 299 613Total fair value 73 394 36 284 26 933 151 955 9 404 698 298 668a Of which reverse repos 29 919b Of which reverse repos 7 298
24 7291 Designated at fair value through profit or loss.2 Excluding accrued interest income related to cash balances with central banks for an amount of 8 million EUR;including accrued interest income the cash and cash balances with central banks amount to 2 906 million EUR
FINANCIAL LIABILITIES (In millions of EUR)Held for trading
Designated at fair value
through profit or loss
1Available
for sale
Loans and
receiva-bles
Held to maturity
Hedging derivatives
Measured at
amortised cost Total
5 426 15 942 - - - - 32 321 53 689Deposits from customers and debt certificatesd 1 399 31 625 - - - - 136 615 169 638
Deposits from customers 270 16 242 - - - - 101 167 117 679 Demand deposits 0 0 - - - - 31 827 31 827 Time deposits 270 16 242 - - - - 35 778 52 289 Savings deposits 0 0 - - - - 29 628 29 628 Special deposits 0 0 - - - - 2 736 2 736 Other deposits 0 0 - - - - 1 199 1 199
Debt certificates 1 129 15 383 - - - - 35 447 51 960 Certificates of deposit 0 9 239 - - - - 15 652 24 891 Customer savings certificates 0 0 - - - - 2 704 2 704 Convertible bonds 0 0 - - - - 0 0 Non-convertible bonds 1 129 5 199 - - - - 12 540 18 869 Convertible subordinated liabilities 0 0 - - - - 0 0 Non-convertible subordinated liabilities 0 945 - - - - 4 551 5 496
Liabilities under investment contracts - 0 - - - - - 0Derivatives 23 558 - - - - 49 - 23 608Short positions 5 718 - - - - - - 5 718
in equity instruments 1 417 - - - - - - 1 417in debt instruments 4 301 - - - - - - 4 301
Other 779 0 - - - - 3 176 3 954
Total carrying value excluding accrued interest expense 36 880 47 567 - - - 49 172 112 256 608Accrued interest expense 208 184 - - - 436 744 1 572Total carrying value including accrued interest expense 37 087 47 751 - - - 485 172 856 258 180Total fair value 37 087 47 751 0 0 0 485 172 680 258 003
c Of which repos 18 333d Of which repos 9 071
8 081
8 210 15 156 - - - - 46 373 69 738Deposits from customers and debt certificates d 2 452 21 927 - - - - 158 188 182 567
Deposits from customers 0 14 139 - - - - 114 698 128 837 Demand deposits 0 1 415 - - - - 36 343 37 758 Time deposits 0 12 723 - - - - 46 913 59 636 Savings deposits 0 0 - - - - 27 079 27 079 Special deposits 0 0 - - - - 3 444 3 444 Other deposits 0 0 - - - - 919 919
Debt certificates 2 452 7 788 - - - - 43 490 53 730 Certificates of deposit 0 2 245 - - - - 15 697 17 942 Customer savings certificates 0 0 - - - - 2 950 2 950 Convertible bonds 0 0 - - - - 0 0 Non-convertible bonds 2 452 4 497 - - - - 19 037 25 986 Convertible subordinated liabilities 0 0 - - - - 0 0 Non-convertible subordinated liabilities 0 1 046 - - - - 5 806 6 852
Liabilities under investment contracts - 0 - - - - - 0Derivatives 25 828 - - - - 118 - 25 946Short positions 4 809 - - - - - - 4 809
in equity instruments 3 723 - - - - - - 3 723in debt instruments 1 085 - - - - - - 1 085
Deposits from credit institutions and investment firmsc / e
c Of which loans and advances to banks repayable on demand and term loans at not more than three months
Deposits from credit institutions and investment firmsc / e
31-12-2006
31-12-2007
e Of which deposits from banks repayable on demand
p. 61

Other 243 0 - - - - 3 867 4 110Total carrying value excluding accrued interest expense 41 542 37 082 - - - 118 208 427 287 170Accrued interest expense 311 420 - - - 320 954 2 006Total carrying value including accrued interest expense 41 853 37 503 - - - 438 209 382 289 175Total fair value 41 853 37 503 - - - 438 208 948 288 741
c Of which repos 21 006d Of which repos 8 489
13 168e Of which deposits from banks repayable on demand • Financial assets and liabilities are grouped into categories (portfolios). These categories are defined and the
relevant valuation rules provided in ‘Financial assets and liabilities (IAS 39)’, Note 1b. • As stated in Note 1a, the balance sheet presentation now reflects a portfolio instead of a product-based
approach. However, in Note 14, the financial assets and liabilities are presented in a table with both a portfolio and a product breakdown. The reference figures for 31 December 2006 have been restated to allow comparison with the information presented in the new breakdown. The following changes were made:
o A number of non-interest-bearing assets and liabilities (classified in the 2006 annual report as ‘loans and advances to customers’) are now recognised under ‘other assets’ and ‘other liabilities’.
o Short positions (classified in the 2006 annual report as ‘other liabilities’) have been reclassified as ‘financial liabilities held for trading’).
o Derivatives (classified in the 2006 annual report entirely under ‘held for trading’) have now been broken down into the ‘held for trading’ and ‘hedging derivatives’ categories.
o The breakdown by counterparty type - such as credit institutions, customers, etc. - (based on the regulatory definition in the 2006 annual report) is now based on Basel II definitions. The main change relates to reclassification of investment firms as credit institutions.
o Warrants (classified in the 2006 annual report as ‘equity instruments’) have been reclassified as ‘derivatives’).
o In order to bring the classification into line with the measurement method used, a portion of the mortgage loans with variable yield (11 089 million euros on 31 December 2006) - classified in the 2006 annual report as ‘loans and receivables’ - have, together with part of the funding, now come under ‘designated at fair value through profit or loss’.
o A portion of the ‘term loans’ (i.e. for certain Central and Eastern European group companies) have been reclassified as ‘consumer credit’.
o Impairment (in Note 20 of the 2006 annual report under ‘other’) is now broken down per relevant product type.
o Part of the ‘other deposits’ heading has been reclassified as ‘time deposits’. • Financial assets and liabilities at fair value (available for sale, held for trading, designated at fair value through
profit or loss) are valued as follows: o When readily and regularly available, published price quotations in active markets (from dealers, brokers,
regulatory agencies, etc.) accessible to KBC are used to determine the fair value of financial assets or financial liabilities. Revaluation is obtained by comparing prices; no model is involved. Financial instruments are initially valued at mid- or closing prices. Market value adjustments are applied to cover close-out costs, which means that financial assets are measured at bid prices and financial liabilities at ask prices. Financial instruments valued using the above methodology include spot foreign exchange contracts, futures, listed equity and share options and government bonds.
o If there is no active market, fair value will be obtained using a valuation technique (e.g., discounted cash flow analysis and option pricing techniques) based on the prices from observable current market transactions in the same instruments, or based on available observable market data obtained from independent sources and based on models commonly used by market participants. Financial instruments valued using the above methodology include forward foreign exchange contracts, currency swaps, forward rate agreements and interest rate swaps.
o When valuation parameters are not observable, fair value is based on the best information available in the circumstances, which may include KBC’s own data. Such parameters reflect KBC’s own assumptions about what information is relevant for the pricing of a financial asset or liability. Financial instruments for which the parameters are not observable include illiquid bonds, illiquid credit default swaps and illiquid structured notes.
p. 62

• Fair value adjustments (market value adjustments) are recognised on all positions that are measured at fair value with fair value changes being reported in net profit or loss or in equity to cover close-out costs, adjustments for less liquid positions or markets, mark-to-model-linked valuation adjustments, counterparty risk, liquidity risk and operations-related costs.
• The following also applies to financial assets: o Most of the changes in the market value of loans and advances initially designated at fair value through
profit or loss are accounted for by changes in interest rates. The effect of changes in credit exposure is negligible.
o Most of the loans and advances designated at fair value through profit or loss are accounted for by reverse repo transactions and a limited portfolio of home loans. In each case, the carrying value comes close to the maximum credit exposure.
o Only home loans are securitised. Related financial liabilities came to 0.3 billion euros at year-end 2007 (excluding Home Loan Invest, as the risk is borne for the most part by KBC), the same as the previous year.
• In addition, the following applies to financial liabilities: o The impact of KBC’s own credit exposure on the fair value of financial liabilities is negligible. o The fair value of demand and savings deposits (which both are repayable on demand) is presumed to be
equal to their carrying value. o The difference between the carrying value and the repayment price of financial liabilities designated at fair
value through profit or loss is minor. o A ‘repo’ transaction is a transaction where one party (the buyer) sells securities to another party and
undertakes to repurchase these securities at a designated future date at a set price. In most cases, repo transactions are governed by bilateral framework agreements (generally Global Master Repo Agreements) which include a description of the periodic exchanges of collateral. The repo transactions shown in the table are related mainly to the temporary lending of bonds. In this type of lending, the risk and the income from the bonds is for KBC. The amount of the repos is virtually identical to the amount of the underlying assets (that have been lent out).
p. 63
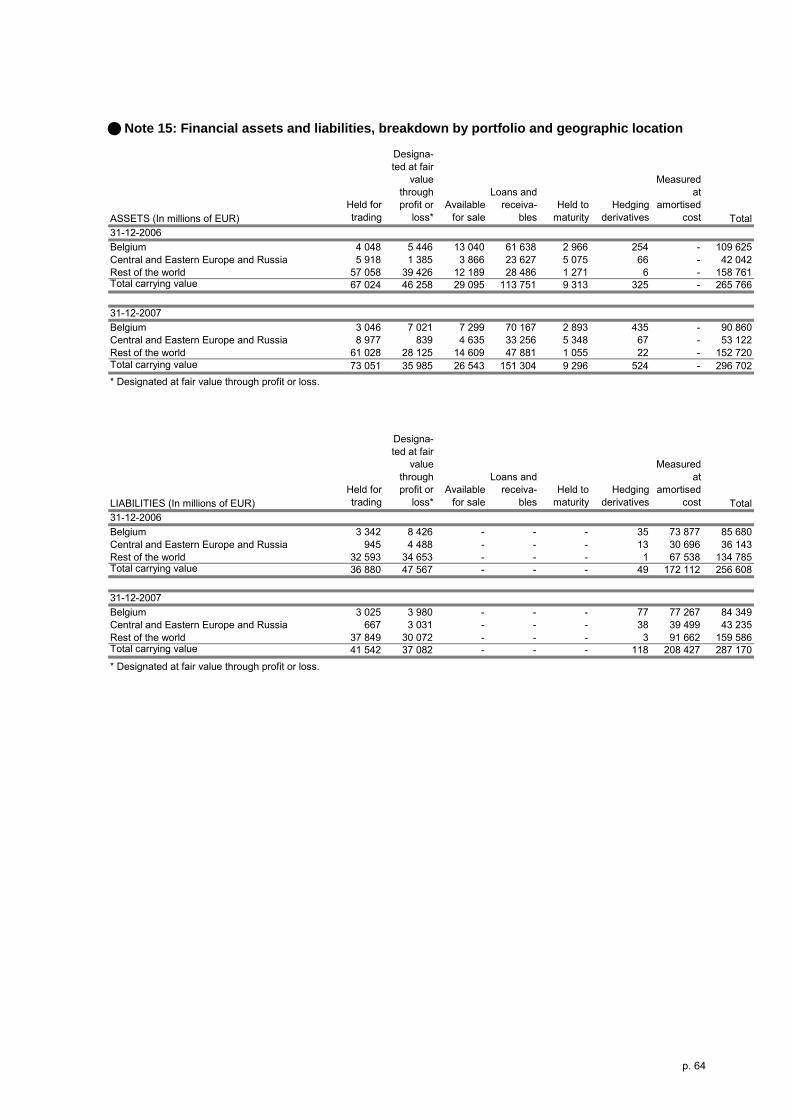
Note 15: Financial assets and liabilities, breakdown by portfolio and geographic location
ASSETS (In millions of EUR)Held for trading
Designa-ted at fair
value through profit or
loss*Available
for sale
Loans and receiva-
blesHeld to
maturityHedging
derivatives
Measured at
amortised cost Total
Belgium 4 048 5 446 13 040 61 638 2 966 254 - 109 625Central and Eastern Europe and Russia 5 918 1 385 3 866 23 627 5 075 66 - 42 042Rest of the world 57 058 39 426 12 189 28 486 1 271 6 - 158 761Total carrying value 67 024 46 258 29 095 113 751 9 313 325 - 265 766
Belgium 3 046 7 021 7 299 70 167 2 893 435 - 90 860Central and Eastern Europe and Russia 8 977 839 4 635 33 256 5 348 67 - 53 122Rest of the world 61 028 28 125 14 609 47 881 1 055 22 - 152 720Total carrying value 73 051 35 985 26 543 151 304 9 296 524 - 296 702
LIABILITIES (In millions of EUR)Held for trading
Designa-ted at fair
value through profit or
loss*Available
for sale
Loans and receiva-
blesHeld to
maturityHedging
derivatives
Measured at
amortised cost Total
Belgium 3 342 8 426 - - - 35 73 877 85 680Central and Eastern Europe and Russia 945 4 488 - - - 13 30 696 36 143Rest of the world 32 593 34 653 - - - 1 67 538 134 785Total carrying value 36 880 47 567 - - - 49 172 112 256 608
Belgium 3 025 3 980 - - - 77 77 267 84 349Central and Eastern Europe and Russia 667 3 031 - - - 38 39 499 43 235Rest of the world 37 849 30 072 - - - 3 91 662 159 586Total carrying value 41 542 37 082 - - - 118 208 427 287 170
* Designated at fair value through profit or loss.
31-12-2006
31-12-2007
31-12-2007
31-12-2006
* Designated at fair value through profit or loss.
p. 64

Note 16: Financial assets, breakdown by portfolio and quality
In millions of EURHeld for trading
Designated at fair value
through profit or
loss*Available for
saleLoans and
receivablesHeld to
maturityHedging
derivatives TOTAL
Unimpaired assets 67 024 46 258 29 075 112 747 9 311 325 264 741Impaired assets - - 81 3 079 3 - 3 163Impairment - - - 62 - 2 075 - 1 - - 2 138Total carrying value 67 024 46 258 29 095 113 751 9 313 325 265 766
Unimpaired assets 73 051 35 985 26 397 149 898 9 296 524 295 150Impaired assets - - 284 3 427 0 - 3 711Impairment - - - 138 - 2 020 0 - - 2 158Total carrying value 73 051 35 985 26 543 151 304 9 296 524 296 702
31-12-2006
31-12-2007
* Designated at fair value through profit or loss.
less then 30 days past
due
30 days or more, but
less then 90 days past
due
Loans & advances 3 011 543Debt instruments 0 0Derivatives 0 0Total 3 011 543
Loans & advances 3 642 573Debt instruments 0 0Derivatives 18 0Total 3 659 573
31-12-2006
31-12-2007
Past due, but not impaired assets*(In millions of EUR)
* Financial assets that are 90 days or more past due are always considered ‘impaired. • Definitions:
o Financial assets are past due if a counterparty fails to make a payment at the time agreed in the contract. The concept of ‘past due’ applies to a contract, not to a counterparty. For example, if a counterparty fails to make a monthly repayment, the entire loan is considered past due, but that does not mean that other loans to this counterparty are considered past due.
o Fixed-income financial assets are impaired when impairment is identified on an individual basis. The concept of ‘impairment’ is relevant for all financial assets that are not measured at fair value through profit or loss. For loans, impairment is identified on an individual basis if the loan has a probability of default (PD) rating of 10, 11 or 12. Since PD ratings relate to counterparties, so too does the concept of impaired.
p. 65

• Information on ‘maximum credit exposure’ is provided in the table. The maximum credit exposure relating to a financial asset is generally the gross carrying value, net of impairment in accordance with IAS 39.
31-12-2006 31-12-2007
Equity 17 682 17 947Debt instruments 70 684 62 491Loans & advances 160 217 194 239
31 561 24 770Derivatives 17 176 22 026Other 41 602 48 443Total 307 362 345 145Carrying value of financial assets pledged as collateral for
Liabilities 27 829 40 383Contingent liabilities 2 815 1 534
Of which designated at fair value through profit or loss
Maximum credit exposure (In millions of EUR)
• Information on collateral held is provided in the table. Collateral can be called in if loans are terminated for various
reasons such as default or bankruptcy. In the event of bankruptcy, the collateral will be sold by the trustee in bankruptcy. In other cases, the bank will itself sell up the collateral. Possession of collateral is only taken in exceptional cases (which accounts for the limited amounts shown in the table).
• Collateral held that relates to OTC derivatives is primarily cash, which is recognised by KBC on the balance sheet (and is not included in the table).
• There is an obligation to return collateral held (which may be sold or repledged in the absence of default by the owners) in its original form, or, where necessary, in cash
Collateral held (which may be sold or repledged in the absence of default by the owner)
31-12-2006 31-12-2007 31-12-2006 31-12-2007Financial assets 31 077 41 830 8 108 15 472
Equity instruments 174 245 0 0Debt instruments 30 747 41 207 8 108 15 472Loans & advances 14 197 0 0Cash 142 182 0 0
Non-financial assets 0 0 0 0Property and equipment 0 0 0 0Investment property 0 0 0 0Other 0 0 0
Fair value of collateral sold/repledged
Fair value of collateral held
0 Collateral obtained by taking possession is not material. •
p. 66
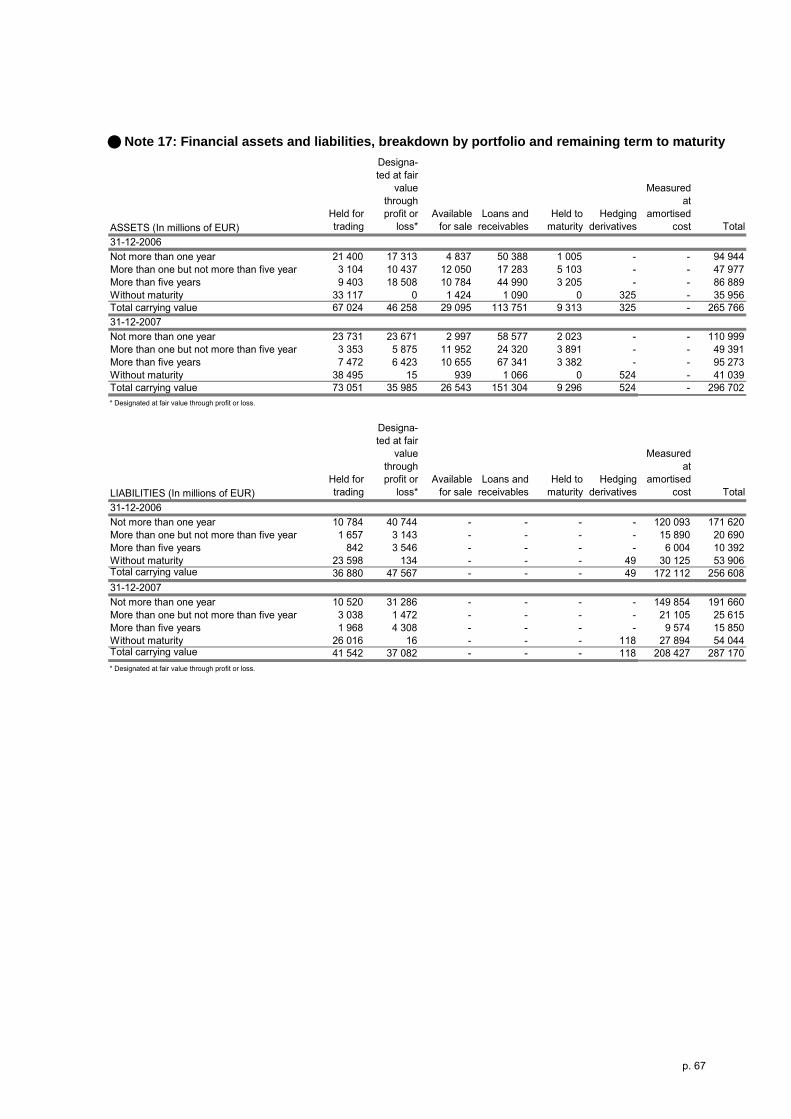
Note 17: Financial assets and liabilities, breakdown by portfolio and remaining term to maturity
ASSETS (In millions of EUR)Held for trading
Designa-ted at fair
value through profit or
loss*Available
for saleLoans and
receivablesHeld to
maturityHedging
derivatives
Measured at
amortised cost Total
Not more than one year 21 400 17 313 4 837 50 388 1 005 - - 94 944More than one but not more than five year 3 104 10 437 12 050 17 283 5 103 - - 47 977More than five years 9 403 18 508 10 784 44 990 3 205 - - 86 889Without maturity 33 117 0 1 424 1 090 0 325 - 35 956Total carrying value 67 024 46 258 29 095 113 751 9 313 325 - 265 766
Not more than one year 23 731 23 671 2 997 58 577 2 023 - - 110 999More than one but not more than five year 3 353 5 875 11 952 24 320 3 891 - - 49 391More than five years 7 472 6 423 10 655 67 341 3 382 - - 95 273Without maturity 38 495 15 939 1 066 0 524 - 41 039Total carrying value 73 051 35 985 26 543 151 304 9 296 524 - 296 702
LIABILITIES (In millions of EUR)Held for trading
Designa-ted at fair
value through profit or
loss*Available
for saleLoans and
receivablesHeld to
maturityHedging
derivatives
Measured at
amortised cost Total
Not more than one year 10 784 40 744 - - - - 120 093 171 620More than one but not more than five year 1 657 3 143 - - - - 15 890 20 690More than five years 842 3 546 - - - - 6 004 10 392Without maturity 23 598 134 - - - 49 30 125 53 906Total carrying value 36 880 47 567 - - - 49 172 112 256 608
Not more than one year 10 520 31 286 - - - - 149 854 191 660More than one but not more than five year 3 038 1 472 - - - - 21 105 25 615More than five years 1 968 4 308 - - - - 9 574 15 850Without maturity 26 016 16 - - - 118 27 894 54 044Total carrying value 41 542 37 082 - - - 118 208 427 287 170* Designated at fair value through profit or loss.
* Designated at fair value through profit or loss.
31-12-2006
31-12-2007
31-12-2006
31-12-2007
p. 67

Note 18: Impairment on financial assets that are available for sale
Fixed-income Fixed-incomeIn millions of EUR securities Shares securities SharesOpening balance 6 90 7 55
Movements with an impact on resultsImpairment recognised 0 3 8 43
0 0 0 Movements without an impact on results
Write-offs 0 0 0 Change in the scope of consolidation 0 0 0 6Other 0 - 38 - 1 21
Closing balance 7 55 13 124
2006 2007
Impairment reversed 0
0
Note 19: Impairment on financial assets held to maturity
2006 2007Fixed- Fixed-income income
securities securitiesIn millions of EUROpening balance 0 1
Movements with an impact on resultsImpairment recognised 0 0
0 - 1Movements without an impact on results
Write-offs 0 0Changes in the scope of consolidation 0 0Other 1 0
Closing balance 1 0
Impairment reversed
p. 68

p. 69
In millions of EUR 31-12-2006 31-12-2007Total 2 155 2 128
Breakdown by typeSpecific impairment, on-balance-sheet lending 1 866 1 859Specific impairment, off-balance-sheet credit commitments 67 84Portfolio-based impairment 222 185
Breakdown by counterpartyImpairment for loans and advances to banks 0 6Impairment for loans and advances to customers 2 075 2 015Specific and portfolio based impairment, off-balance-sheet credit commitments 80 108
MO
Specific impairment, on-
balance-sheet
Specific impairment, off-
balance-sheet credit Portfolio-based
Total
Opening 2 665 886 710 524 - 1 161Closin 2 155
Opening 2 155
878 730
235 59 2Closin 2 128
Note 20: Impairment on loans and receivables (balance sheet)
VEMENTS lending commitments impairments
balance 1-1-2006 2 361 60 245 Movements with an impact on result
Loan loss expenses 721 49 117 Loan loss recoveries - 544 - 41 - 126 -
Movements without an impact on resultWrite-offs - 523 0 - 1 - Changes in the scope of consolidation 3 0 - 4Other 152 - 1 - 8 -
g balance 31-12-2006 1 866 67 222
balance 1-1-2007 1 866 67 222 Movements with an impact on result
Loan loss expenses 643 62 173 Loan loss recoveries - 475 - 44 - 211 -
Movements without an impact on resultWrite-offs - 235 - 1 0 - Changes in the scope of consolidation 59 0 0 Other 1 0 2
g balance 31-12-2007 1 859 84 185

Note 21: Derivative financial instruments
In millions of EUR Assets Liabilities Assets Liabilities Assets Liabilities Assets Liabilities Assets Liabilities Assets Liabilities Assets Liabilities Assets Liabilities31-12-2006Total 16 851 23 558 891 337 912 127 4 11 222 217 133 26 5 426 5 363 188 13 12 733 12 785
Breakdown by typeInterest rate contracts 5 388 8 623 553 040 560 990 4 2 82 75 65 23 4 083 4 132 188 13 12 733 12 785
Interest rate swaps 4 790 8 052 480 359 476 610 4 2 82 75 65 23 4 083 4 132 188 13 12 733 12 785Forward rate agreements 20 21 21 817 20 030 0 0 0 0 0 0 0 0 0 0 0 0Futures 31 0 11 361 20 144 0 0 0 0 0 0 0 0 0 0 0 0Options 482 340 38 688 42 099 0 0 0 0 0 0 0 0 0 0 0 0Forwards 65 210 815 2 106 0 0 0 0 0 0 0 0 0 0 0 0
Foreign exchange contracts 1 252 1 240 179 537 180 171 0 8 140 142 68 3 1 343 1 231 0 0 0 0
505 431 100 786 101 442 0 0 0 0 1 0 14 14 0 0 0 0Currency and interest rate swaps 564 578 54 727 54 678 0 8 140 142 62 3 1 166 1 075 0 0 0 0Futures 0 0 0 0 0 0 0 0 0 0 0 0 0 0 0 0Options 182 231 24 023 24 051 0 0 0 0 6 1 163 143 0 0 0 0
Equity contracts 9 008 13 298 60 074 70 818 0 0 0 0 0 0 0 0 0 0 0 0Equity swaps 2 363 676 53 922 53 922 0 0 0 0 0 0 0 0 0 0 0 0Forwards 2 4 81 116 0 0 0 0 0 0 0 0 0 0 0 0Futures 64 25 1 378 1 118 0 0 0 0 0 0 0 0 0 0 0 0Options 5 468 12 019 37 417 47 856 0 0 0 0 0 0 0 0 0 0 0 0Warrants 1 111 575 693 1 224 0 0 0 0 0 0 0 0 0 0 0 0
Credit contracts 1 147 359 65 173 66 645 0 0 0 0 0 0 0 0 0 0 0 0Credit default swaps 1 147 359 65 173 66 645 0 0 0 0 0 0 0 0 0 0 0 0Credit spread options 0 0 0 0 0 0 0 0 0 0 0 0 0 0 0 0Total return swaps 0 0 0 0 0 0 0 0 0 0 0 0 0 0 0 0Other 0 0 0 0 0 0 0 0 0 0 0 0 0 0 0 0
Commodity and other contracts 57 38 95 85 0 0 0 0 0 0 0 0 0 0 0 0* Including hedges of a net investment in a foreign operation
Portfolio hedgeCarrying value Notional amount
Held for trading Fair value hedge Cash flow hedge*Notional amount Notional amount
Forward foreign exchange operations/Currency forwards
Carrying value Notional amount Carrying value Carrying value
p. 70

In millions o
p. 71
Liabilities31-12-2007Total 11 862
BreakdownInterest rate 11 862
Intere 11 862Forwar 0Futures 0Option 0Forwa 0
Foreign exc 0
0Currenc 0Future 0Option 0
Equity cont 0Equity 0Forwa 0Futures 0Option 0Warra 0
Credit contr 0Credit 0Credit 0Total r 0Other 0
Commodity 0* Including hed
amount
Forwaopera
f EUR Assets Liabilities Assets Liabilities Assets Liabilities Assets Liabilities Assets Liabilities Assets Liabilities Assets Liabilities Assets
21 503 25 828 1 051 666 1 039 677 32 20 1 933 1 927 269 89 11 912 11 749 223 9 11 862
by type contracts 5 403 7 467 648 680 643 737 31 15 1 804 1 804 197 81 10 451 10 451 223 9 11 862
st rate swaps 4 815 6 943 554 908 554 314 31 15 1 804 1 804 197 81 10 451 10 451 223 9 11 862d rate agreements 49 43 33 957 29 042 0 0 0 0 0 0 0 0 0 0 0
25 2 9 722 9 626 0 0 0 0 0 0 0 0 0 0 0s 514 471 47 538 50 371 0 0 0 0 0 0 0 0 0 0 0rds 0 9 2 555 384 0 0 0 0 0 0 0 0 0 0 0
hange contracts 1 360 1 356 209 568 211 222 0 5 129 122 73 8 1 461 1 299 0 0 0
443 445 116 667 118 195 0 0 7 0 0 0 20 20 0 0 0y and interest rate swaps 659 656 64 890 65 239 0 5 122 122 66 8 1 276 1 134 0 0 0
s 0 0 14 14 0 0 0 0 0 0 0 0 0 0 0s 259 255 27 998 27 774 0 0 0 0 6 1 166 145 0 0 0
racts 9 452 13 826 60 965 58 375 0 0 0 0 0 0 0 0 0 0 0 swaps 1 911 290 32 363 32 368 0 0 0 0 0 0 0 0 0 0 0rds 8 1 10 184 0 0 0 0 0 0 0 0 0 0 0
21 31 1 098 338 0 0 0 0 0 0 0 0 0 0 0s 7 277 12 909 26 628 25 028 0 0 0 0 0 0 0 0 0 0 0nts 234 594 867 457 0 0 0 0 0 0 0 0 0 0 0
acts 5 060 3 165 132 287 126 148 0 0 0 0 0 0 0 0 0 0 0 default swaps 5 060 3 165 132 287 126 148 0 0 0 0 0 0 0 0 0 0 0 spread options 0 0 0 0 0 0 0 0 0 0 0 0 0 0 0eturn swaps 0 0 0 0 0 0 0 0 0 0 0 0 0 0 0
0 0 0 0 0 0 0 0 0 0 0 0 0 0 0
and other contracts 228 15 166 195 0 0 0 0 0 0 0 0 0 0 0ges of a net investment in a foreign operation
Carrying value Notional
rd foreign exchange tions/Currency forwards
Carrying value Notional amount Carrying value Notional amountCarrying value Notional amountHeld for trading Fair value hedge Cash flow hedge* Portfolio hedge

• Compared with the presentation in the previous annual report, a number of items have been reclassified. The main reclassification relates to the separation of credit derivatives from interest rate contracts.
• One way in which the group’s ALM department manages the interest rate risk is to conclude derivatives contracts. The accounting mismatches attributable to these hedging activities (derivatives as opposed to assets or liabilities) are dealt with in two ways:
• Portfolio hedges of interest rate risk: KBC uses this technique to hedge the interest rate risk on a particular loan portfolio (term loans, home loans, instalment loans and straight loans) with interest rate swaps. The hedge is set up in accordance with the requirements of the carved-out version of IAS 39.
• Financial assets and liabilities designated at fair value through profit or loss (the so-called ‘fair value’ option): KBC uses this option to eliminate or significantly reduce a measurement or recognition inconsistency (‘an accounting mismatch’ that would otherwise arise from measuring assets or liabilities or recognising the gains and losses on them on different bases). This method is used specifically to avoid other accounting mismatches relating to the loan portfolio (measured at amortised cost) and the interest rate swaps (measured at fair value) in ALM. For this purpose, a (government) bond portfolio has been classified as a financial asset at fair value through profit or loss. The fair value option is also used for CDOs with embedded derivatives.
Moreover, the fair value option is used for certain financial liabilities with embedded derivatives whose economic risk and characteristics are closely related to those of the host contract (some IFIMA issues), which would otherwise give rise to an accounting mismatch with the hedging instruments.
• In addition, KBC uses micro-hedge accounting permitted under IAS 39 to limit the volatility of results in the following cases:
• Fair value hedges. This type of hedge accounting is used in certain asset-swap constructions, where KBC buys a bond because of the credit spread. The interest rate risk of the bond is hedged by means of an interest rate swap. This technique is also applied to certain fixed-term debt instruments issued by KBC Bank.
• Cashflow hedges. This technique is used to swap floating-rate notes for a fixed rate.
• Hedges of net investments in foreign operations. The exchange risk attached to foreign-currency investments is hedged by attracting funding in the currency concerned at the level of the investing entity.
• As regards choosing between one or other of the above hedge accounting techniques, generally one of the micro-hedging techniques that must be documented individually is used for large individual transactions that can clearly be separated out. For the purposes of ALM, which by definition is macro-management, the decision was taken to make use of the possibilities specifically provided for under IAS 39, namely the ‘fair value option and the portfolio hedge of interest rate risk’ according to ‘the carved-out version’.
• As regards the relationship between risk management and hedge accounting policy, ‘economic’ management is given priority and the risks have to be hedged in accordance with the general ALM framework. It is then decided what the most efficient option is for limiting (any) resulting accounting mismatch using one of the above hedging techniques.
• The breakdown of the estimated future cashflows from cashflow hedging derivatives by time bucket was as follows at year-end 2007 (in millions of EUR, positive numbers represent a cash-inflow, negative numbers represent a cash-outflow):
o not more than three months: 65 o more than three but not more than six months: -10 o more than six but not more than twelve months: 12 o more than one but not more than two years: -18 o more than two but not more than five years: -23 o more than five years: 110
p. 72
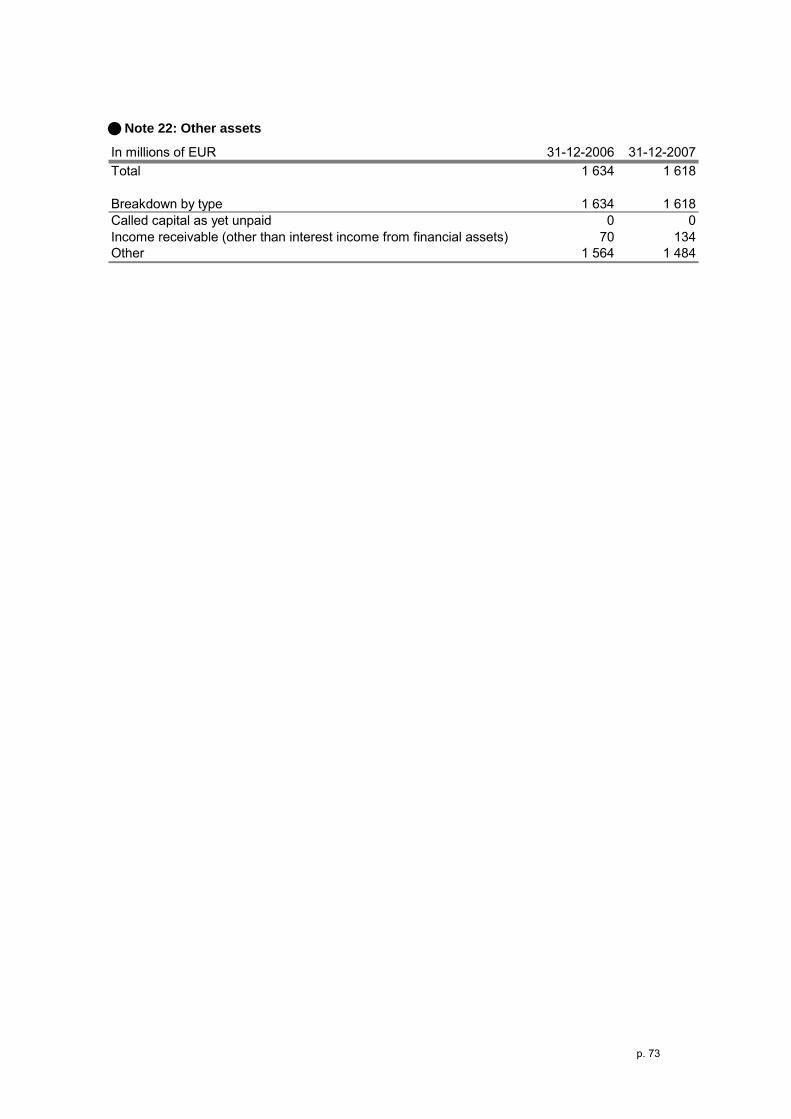
Note 22: Other assets
In millions of EUR 31-12-2006 31-12-2007Total 1 634 1 618
Breakdown by type 1 634 1 618Called capital as yet unpaid 0 0Income receivable (other than interest income from financial assets) 70 134Other 1 564 1 484
p. 73

Note 23: Tax assets and tax liabilities In millions of EUR 31-12-2006 31-12-2007CURRENT TAXESCurrent tax assets 117 102Current tax liabilities 381 388
DEFERRED TAXES 451 477Tax assets by type of temporary difference 1 068 1 341
Employee benefits 247 237Losses carried forward 15 17Tangible and intangible fixed assets 46 61Provisions for risks and charges 35 42Impairment for losses on loans and advances 208 218
Financial instruments at fair value through profit or loss and fair value hedges 202 275
244 397Technical provisions 0 0Other 72 94
Unused tax losses and unused tax credits 0 0
Deferred tax liabilities by type of temporary difference 617 864Employee benefits 3 5Losses carried forward 3 2Tangible and intangible fixed assets 58 78Provisions for risks and charges 1 19Impairment for losses on loans and advances 82 105Financial instruments at fair value through profit or loss and fair value hedges 95 174
292 373Technical provisions 0 0Other 81 107
Recognised in the balance sheet as follows:Deferred tax assets 521 556Deferred tax liabilities 70 79
Fair value adjustments, available-for-sale assets, cash flow hedges and hedges of net investments in foreign entities
Fair value adjustments, available-for-sale assets, cash flow hedges and hedges of net investments in foreign entities
• The total net increase in deferred taxes came to 26 million euros, which can be broken down as follows:
o a 273-million-euro increase in deferred tax assets o a 247-million-euro increase in deferred tax liabilities
• The 273-million-euro increase in deferred tax assets is accounted for mainly by: o the increase via the income statement: + 81 million euros, due primarily to:
losses carried forward: +10 million euros. tangible and intangible fixed assets: +14 million euros. impairment for losses on loans and advances: -7 million euros. financial instruments at fair value through profit or loss and fair value hedges: +68 million
euros. o the increase in deferred tax assets consequent on the drop in the market value of available-for-sale
securities. +123 million euros. o the remaining 69-million-euro increase is accounted for primarily by changes in the scope of
consolidation, translation differences and other items.
• The 247-million-euro increase in deferred tax liabilities is made up primarily of the following: o the increase via the income statement: + 159 million euros, due primarily to:
tangible and intangible fixed assets: +23 million euros. provisions for risks and charges: +18 million euros. impairment for losses on loans and advances: +27 million euros. financial instruments at fair value through profit or loss and fair value hedges: +80 million
euros. o the increase in positive fair value changes in cashflow hedges: +37 million euros;
p. 74

o the remaining 49-million-euro increase is accounted for mainly by changes in the scope of consolidation, translation differences and other items.
Note 24: Investments in associated companies
In millions of EUR 31-12-2006 31-12-2007Total 535 646
Overview of investments including goodwill NLB 496 568
Other 39 78
Goodwilll on associated companiesGross amount 210 210Accumulated impairment 0 0
Breakdown by typeUnlisted 535 646Listed 0 0
Fair value of investments in listed associated companies 0 0
MOVEMENTS 31-12-2006 31-12-2007Opening balance (January, 1) 839 535
Acquisitions 0 69 Carrying value, transfers - 13 0 Share in the result for the period 43 59 Dividends paid - 15 - 20 Share of gains and losses not recognized in the income statement 1 1 Translation differences - 3 1 Changes in goodwill 0 0 Transfer to non-current assets held for sale 0 0
Changes in scope - 328 0 Other movements 10 0
Closing balance (December, 31) 535 646 • Associated companies are companies on whose management KBC exerts significant influence, without
having direct or indirect, full or joint, control. In general, KBC has a 20% to 50% shareholding in such companies.
• For an overview of financial information on associated companies, see Note 35.
• Goodwill paid on associated companies is included in the nominal value of investments in associated companies shown on the balance sheet. An impairment test has been performed and the necessary impairment losses on goodwill have been recognised (see table).
p. 75

Note 25: Property and equipment and investment property
In millions of EUR 31-12-2006 31-12-2007Property and equipment 1 544 1 760
Investment property 225 448
Rental income 17 29Direct operating expenses from investments generating rental income 2 3Direct operating expenses from investments not generating rental income 0 14
MOVEMENTS TABLELand and buildings IT equipment
Other equipment
Total property and
equipmentInvestment
property
2006Opening balance 1 063 38 348 1 449 158
Acquisitions 56 15 333 404 0Disposals - 54 0 - 95 - 149 - 1Depreciation - 52 - 27 - 78 - 157 - 5Impairment
Recognised - 5 0 0 - 5 0reversed 15 0 0 15 0
0 0 0 0 0Translation differences 13 1 7 21 0Changes in the scope of consolidation 2 4 31 37 48Other movements - 21 6 - 57 - 72 26
Closing balance 1 017 37 490 1 544 225
689 218 513 1 420 25 0 0 131 131 -
Of which finance lease as a lessee 0 0 22 22 -Fair value 31-12-2006 - - - - 2582007Opening balance 1 017 37 490 1 544 225
Acquisitions 116 45 156 317 32Disposals - 29 - 2 - 86 - 118 0Depreciation - 60 - 30 - 75 - 166 - 10Impairment
Recognised 0 0 0 0 - 9Reversed 0 0 0 0 0
0 0 0 0 59Translation differences 10 0 5 15 4Changes in scope of consolidation 85 5 8 98 55Other movements 144 6 - 82 69 91
Closing balance 1 283 62 415 1 760 448 774 246 174 1 194 21 25 0 17 42 -
Of which finance lease as a lessee 4 0 0 4 -Fair value 31-12-2007 - - - - 449
Of which: accumulated depreciation and impairmentOf which expenditure on items in the course of construction
Transfer to or from non-current assets held for sale and disposal groups
Transfer to or from non-current assets held for sale and disposal groups
Of which expenditure on items in the course of constructionOf which: accumulated depreciation and impairment
• KBC applies the following annual rates of depreciation to property, equipment and investment property: between 3%
and 10% for land and buildings, between 30% and 33% for IT equipment, between 10% and 33% for other equipment, and between 3% and 5% for investment property.
• There are no material obligations to acquire property or equipment. Nor are there any material restrictions on title, and property and equipment pledged as security for liabilities.
• The investment property is valued by an independent expert, based primarily on: • the capitalisation of the estimated rental value; • unit prices of similar real property, with account being taken of all the market parameters available on the date
of the assessment (including location and market situation, type of building and construction, state of repair, use, etc.).
p. 76
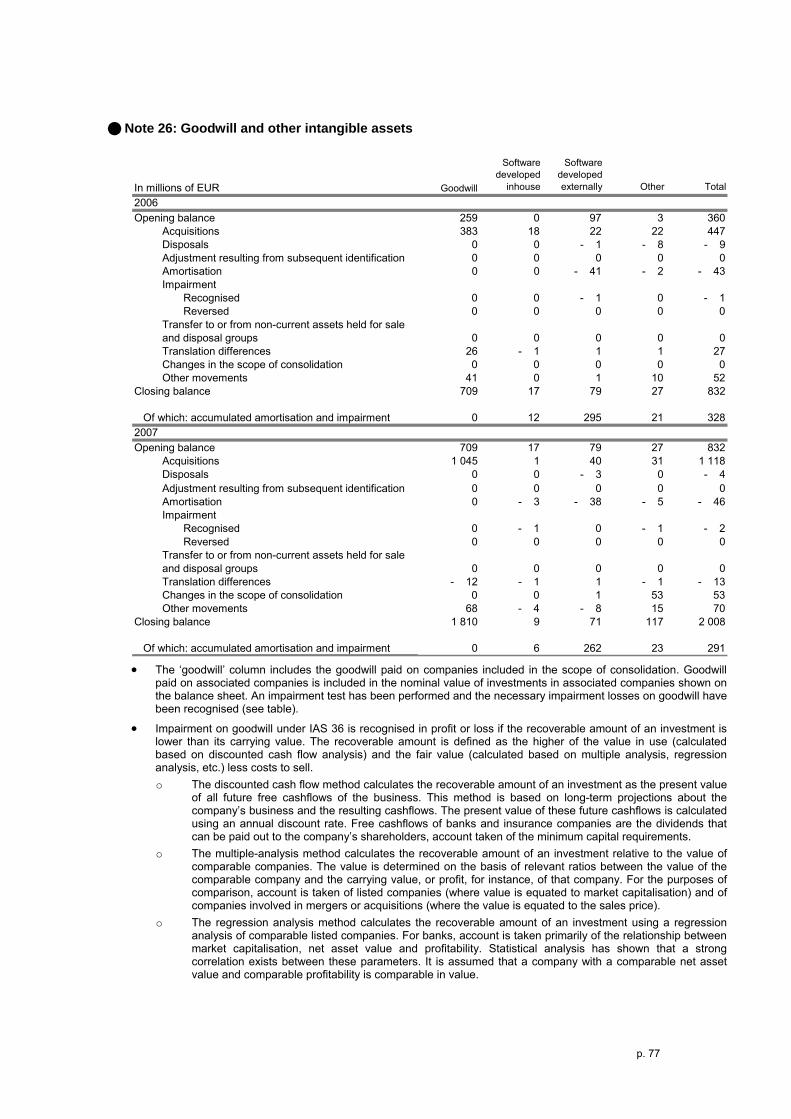
Note 26: Goodwill and other intangible assets
In millions of EUR Goodwill
Software developed
inhouse
Software developed externally Other Total
2006Opening balance 259 0 97 3 360
Acquisitions 383 18 22 22 447Disposals 0 0 - 1 - 8 - 9
0 0 0 0 0Amortisation 0 0 - 41 - 2 - 43Impairment
Recognised 0 0 - 1 0 - 1Reversed 0 0 0 0 0
0 0 0 0 0Translation differences 26 - 1 1 1 27Changes in the scope of consolidation 0 0 0 0 0Other movements 41 0 1 10 52
Closing balance 709 17 79 27 832
0 12 295 21 3282007Opening balance 709 17 79 27 832
Acquisitions 1 045 1 40 31 1 118Disposals 0 0 - 3 0 - 4
0 0 0 0 Amortisation 0 - 3 - 38 - 5 - 46Impairment
Recognised 0 - 1 0 - 1 - 2Reversed 0 0 0 0
0 0 0 0 Translation differences - 12 - 1 1 - 1 - 13Changes in the scope of consolidation 0 0 1 53 53Other movements 68 - 4 - 8 15 70
Closing balance 1 810 9 71 117 2 008
0 6 262 23 291
Transfer to or from non-current assets held for sale and disposal groups
Of which: accumulated amortisation and impairment
Adjustment resulting from subsequent identification
Transfer to or from non-current assets held for sale and disposal groups
Of which: accumulated amortisation and impairment
Adjustment resulting from subsequent identification 0
0
0
• The ‘goodwill’ column includes the goodwill paid on companies included in the scope of consolidation. Goodwill
paid on associated companies is included in the nominal value of investments in associated companies shown on the balance sheet. An impairment test has been performed and the necessary impairment losses on goodwill have been recognised (see table).
• Impairment on goodwill under IAS 36 is recognised in profit or loss if the recoverable amount of an investment is lower than its carrying value. The recoverable amount is defined as the higher of the value in use (calculated based on discounted cash flow analysis) and the fair value (calculated based on multiple analysis, regression analysis, etc.) less costs to sell. o The discounted cash flow method calculates the recoverable amount of an investment as the present value
of all future free cashflows of the business. This method is based on long-term projections about the company’s business and the resulting cashflows. The present value of these future cashflows is calculated using an annual discount rate. Free cashflows of banks and insurance companies are the dividends that can be paid out to the company’s shareholders, account taken of the minimum capital requirements.
o The multiple-analysis method calculates the recoverable amount of an investment relative to the value of comparable companies. The value is determined on the basis of relevant ratios between the value of the comparable company and the carrying value, or profit, for instance, of that company. For the purposes of comparison, account is taken of listed companies (where value is equated to market capitalisation) and of companies involved in mergers or acquisitions (where the value is equated to the sales price).
o The regression analysis method calculates the recoverable amount of an investment using a regression analysis of comparable listed companies. For banks, account is taken primarily of the relationship between market capitalisation, net asset value and profitability. Statistical analysis has shown that a strong correlation exists between these parameters. It is assumed that a company with a comparable net asset value and comparable profitability is comparable in value.
p. 77

• At year-end 2007, goodwill related primarily to Absolut Bank and its subsidiaries (516 million euros), CSOB and its subsidiaries (308 million euros), EIBank (281 million euros), K&H Bank (271 million euros), KBC Asset Management NV (115 million euros) and Kredyt Bank and its subsidiaries (94 million euros). At year-end 2006, goodwill had been accounted for primarily by K&H Bank (273 million euros), CSOB and its subsidiaries (178 million euros), KBC Asset Management NV (115 million euros), and Kredyt Bank and its subsidiaries (101 million euros).
p. 78

Note 27: Provisions for liabilities and charges
In millions of EUR
Provision for restructu-
ring
Provision for taxes and
pending legal
disputes Other Subtotal
Impairment, off-balance-sheet credit
commit-ments Total
2006Opening balance 14 221 92 326 70 396
Movements with an impact on resultAmounts allocated 4 20 20 45 67 111Amounts used 0 - 21 - 6 - 27 0 - 27Unused amounts reversed - 3 - 46 - 1 - 50 - 57 - 107
Other movements - 2 42 - 6 34 - 1 33Closing balance 12 215 99 327 80 4072007Opening balance 12 215 99 327 80 407
Movements with an impact on resultAmounts allocated 1 64 13 78 79 157Amounts used - 2 - 18 - 64 - 85 0 - 85Unused amounts reversed 0 - 18 - 2 - 21 - 53 - 74
Other movements - 3 10 - 14 - 6 2 - 5Closing balance 7 253 32 293 108 401 • Restructuring provisions were set aside mainly in a number of Central and Eastern European subsidiaries of
KBC Bank.
• The provisions for legal disputes are discussed below.
• ‘Other provisions’ include those set aside for miscellaneous risks and future expenditure.
• Specific impairment for off-balance-sheet credit commitments include impairment for guarantees, etc.
• For most of the provisions recorded, no reasonable estimate can be made of when they will be used.
• The most significant legal disputes pending are discussed below. Claims filed against KBC group companies are – in keeping with IFRS rules – treated on the basis of their risk assessment (‘probable’, ‘possible’, ‘remote’). Provisions are set aside for ‘probable outflow’ cases (see ‘Notes on the accounting policies’). No provisions are constituted for ‘possible outflow’ cases, but information is provided in the annual accounts if such cases might have a material impact on the balance sheet (i.e. when the claim could lead to a possible outflow of more than 25 million euros). All other claims (‘remote outflow’), of whatever magnitude, that represent a minor or no risk at all do not have to be reported. Nonetheless, for reasons of transparency, KBC has also provided information on the current status of the most important cases in this category. The main cases are as follows: The information provided is limited in order not to prejudice the position of the group in ongoing litigation. • Probable outflow:
o In 2003, a major case of fraud at K&H Equities Hungary was uncovered. Numerous customers suffered substantial losses on their securities portfolios as a result of unauthorised speculative transactions and possible misappropriations of funds. Instructions and portfolio overviews were forged or tampered with. A criminal investigation is currently being carried out. A number of claims have already been settled either amicably or following an arbitral decision. On balance, 51 million euros’ worth of provisions have been set aside for the claims still outstanding.
o From the end of 1995 until the beginning of 1997, KBC Bank and KB Consult were involved in the transfer of cash companies. KBC Bank and/or KB Consult were joined to proceedings in nineteen cases. In addition, KB Consult has been placed under suspicion by an investigating magistrate. A provision of 40 million euros has been constituted to deal with the potential impact of claims for damages in this respect. The transfer of a cash company is in principle completely legitimate. Nevertheless, it later transpired that certain purchasers were acting in bad faith since they did not make any investments at all and did not file tax returns for the cash companies they had purchased. KBC Bank and KB Consult immediately took the necessary measures to preclude any further involvement with these parties.
p. 79

• Possible outflow: o In 2002, a 100-million-euro claim was filed against KBC Bank by the shareholders of a holding
company that had wholly owned NV Transport Coulier, a major transport firm in the petrochemical sector declared bankrupt in 1992. According to the claimants, the bank made various errors that led to the bankruptcy of the firm. On 14 October 2005, the court issued a decision, declaring the claims inadmissible. This decision was appealed on 30 June 2006, but no ruling can be expected before 2009.
• Remote outflow: o On 11 January 2008, the Brussels court sitting in chambers rendered its decision on the inquiry
instituted in mid-1996 relating to the alleged co-operation by (former) directors and members of staff of KBC Bank and Kredietbank SA Luxembourgeoise (KBL) in tax evasion committed by customers of KBC Bank and KBL, ultimately deciding to refer only eleven of the people who had previously been placed under suspicion in the case to the criminal court for trial. All the other persons placed under suspicion have had charges dismissed against them because the evidence was insufficient or the period of prescription had expired. The court sitting in chambers dismissed nearly all of the original allegations of money laundering by (former) KBC/KBL employees. Of the (former) KBC/KBL employees, one person appealed his referral for trial, and the Public Prosecutor appealed the discontinuation of criminal proceedings against three persons. After the legal proceedings before the Indictment Division have been completed, in the end, it is only the criminal court which can decide, based on the merits of the case, whether these persons are guilty or whether they should be acquitted.
o ČSOB (and KBC Bank in one case) is involved in a number of court cases relating to the Agreement on Sale of Enterprise concluded on 19 June 2000 between Investiční a Poštovní banka (IPB) and ČSOB and to the guarantees provided in this respect by the Czech Republic and the Czech National Bank. In one of these cases, ČSOB initiated arbitration proceedings in respect of the above guarantees at the International Chamber of Commerce on 13 June 2007 against the Czech Republic concerning payment of 62 million euros plus interest. The Czech government has filed a counterclaim, provisionally estimated at 1 billion euros plus interest. Having examined the matter, internationally renowned law firms have, in formal legal opinions, come to the conclusion that the counterclaim is unfounded.
Note 28: Other liabilities
In millions of EUR 31-12-2006 31-12-2007Total 4 534 5 519
Breakdown by type 4 534 5 519Retirement benefit plans or other employee benefits 1 224 1 420Accrued charges (other than from interest expenses on financial liabilities) 756 1 969Other 2 554 2 130 • For more information on retirement benefit plans or other employee benefits, see Note 29.
p. 80
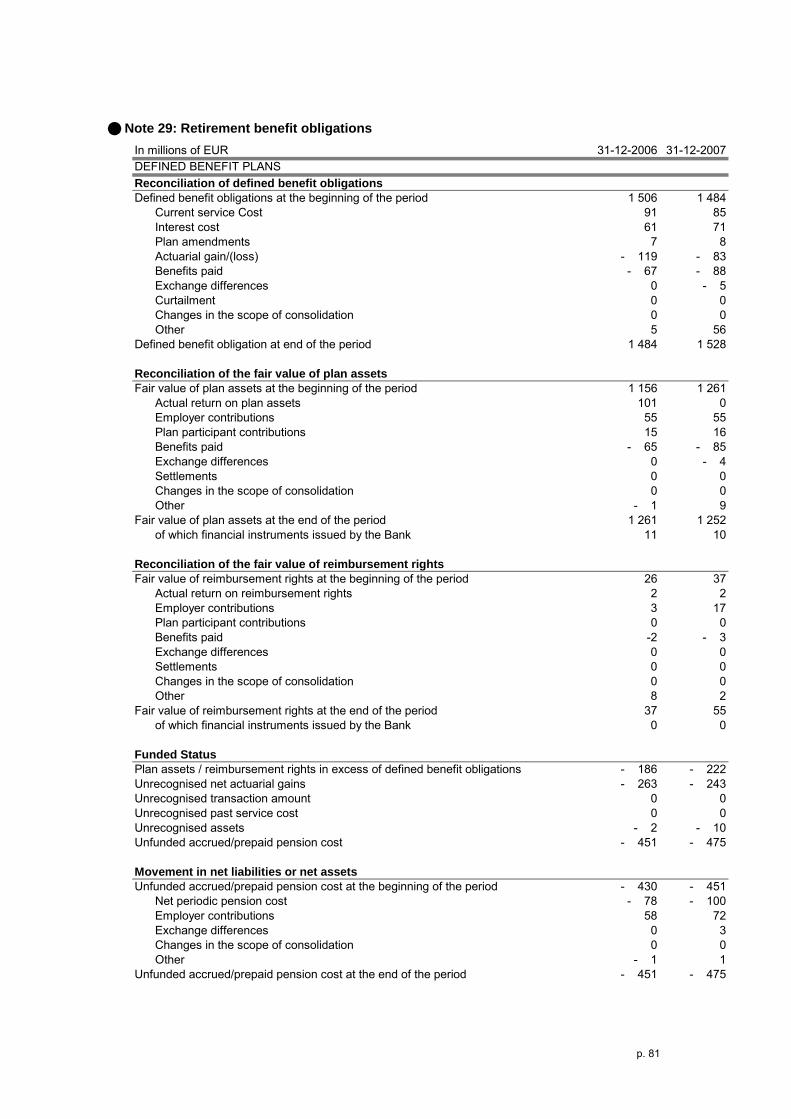
Note 29: Retirement benefit obligations
In millions of EUR 31-12-2006 31-12-2007DEFINED BENEFIT PLANSReconciliation of defined benefit obligationsDefined benefit obligations at the beginning of the period 1 506 1 484
Current service Cost 91 85Interest cost 61 71Plan amendments 7 8Actuarial gain/(loss) - 119 - 83Benefits paid - 67 - 88Exchange differences 0 - 5Curtailment 0 0Changes in the scope of consolidation 0 0Other 5 56
Defined benefit obligation at end of the period 1 484 1 528
Reconciliation of the fair value of plan assetsFair value of plan assets at the beginning of the period 1 156 1 261
Actual return on plan assets 101 0Employer contributions 55 55Plan participant contributions 15 16Benefits paid - 65 - 85Exchange differences 0 - 4Settlements 0 0Changes in the scope of consolidation 0 0Other - 1 9
Fair value of plan assets at the end of the period 1 261 1 252of which financial instruments issued by the Bank 11 10
Reconciliation of the fair value of reimbursement rightsFair value of reimbursement rights at the beginning of the period 26 37
Actual return on reimbursement rights 2 2Employer contributions 3 17Plan participant contributions 0 0Benefits paid -2 - 3Exchange differences 0 0Settlements 0 0Changes in the scope of consolidation 0 0Other 8 2
Fair value of reimbursement rights at the end of the period 37 55of which financial instruments issued by the Bank 0 0
Funded StatusPlan assets / reimbursement rights in excess of defined benefit obligations - 186 - 222Unrecognised net actuarial gains - 263 - 243Unrecognised transaction amount 0 0Unrecognised past service cost 0 0Unrecognised assets - 2 - 10Unfunded accrued/prepaid pension cost - 451 - 475
Movement in net liabilities or net assetsUnfunded accrued/prepaid pension cost at the beginning of the period - 430 - 451
Net periodic pension cost - 78 - 100Employer contributions 58 72Exchange differences 0 3Changes in the scope of consolidation 0 0Other - 1 1
Unfunded accrued/prepaid pension cost at the end of the period - 451 - 475
p. 81

Amounts recognised in the balance sheetPrepaid pension cost 6 9Reimbursement right - 22 - 7Accrued pension liabilities - 435 - 477Unfunded accrued/prepaid pension cost - 451 - 475
Amounts recognised in the income statementCurrent service cost 91 85Interest cost 61 71Expected return on plan assets - 60 - 72Expected return on reimbursement rights - 1 - 2Adjustments to limit prepaid pension cost 1 2Amortisation of unrecognized prior service costs 7 64Amortisation of unrecognized net (gains)/losses - 2 - 32Employee contributions - 14 - 17Other - 5 1Curtailments 0 0Settlements 0 0Changes in the scope of consolidation 0 0Actuarially determined net periodic pension cost* 78 100
Actual return on plan assets (in %) 9% 0%Actual return on reimbursement rights (in %) 6% 5%
Principal actuarial assumptions used (based on weighted averages)Discount rate 4,0% 4,6%Expected rate of return on plan assets 5,3% 5,3%Expected rate of return on reimbursement rights 4,4% 4,6%Expected rate of salary increase 3,4% 3,3%Rate of pension increase 0,3% 0,4%
DEFINED CONTRIBUTION PLANS
Expenses for defined contribution plans 1 2* Included under 'staff expenses' (see 'Note 9 Operating expenses) • The pension claims of the staff of various KBC group companies are covered by pension funds and group
insurance schemes, most of which are defined benefit plans. More specifically, retirement benefit obligations include a defined benefit plan in the form of a pension fund for KBC Bank (and a large number of subsidiaries). The assets are managed by KBC Asset Management. The benefits are dependent on, among other things, the employee’s years of service, as well as on his/her remuneration in the years before retirement. The annual funding requirements for these plans are determined based on actuarial cost methods.
• Past figures for the main items shown in the table (figures for year-end 2005, 2006 and 2007, in millions of EUR): o Defined benefit obligations: 1 506, 1 484, 1 528; o Fair value of plan assets: 1 182, 1 298, 1 307; o Unfunded accrued or prepaid pension cost: -430, -451, -475.
• The actual return on plan assets (ROA) is calculated on the basis of the OLO rate, account taken of the plan’s investment mix.
ROA = (X x rate on OLO T years) + (Y x (rate on OLO T years + 3%)) + (Z x (rate on OLO T years + 1%)), where: T = term of the OLO used for the discount rate; X = percentage of fixed-income securities; Y = percentage of shares; Z = percentage of real estate. The risk premiums of 3% and 1%, respectively, are based on the long-term returns from shares and real estate.
• At year-end 2007, the plan assets of KBC Bank’s pension fund were as follows: 51% shares, 39% bonds, 8% real estate and 2% cash (in 2006: 53%, 36%, 10% and 1%, respectively);
• For the KBC pension fund, a contribution of 49 million euros is expected for 2008.
p. 82

• Changes in the assumptions used in the actuarial calculation of plan assets and gross liabilities from defined benefit plans had the following impact on plan assets (a plus sign indicates a positive impact, a minus sign a negative impact): -23 million euros in 2006, 0 million euros in 2007. The impact on pension liabilities came to +9 million euros, +16 million euros, -40 million euros and -5 million euros, respectively.
• There is no contractual agreement or fixed base for taxing individual KBC entities that have signed up for the KBC pension fund for the net expense arising from the overall defined-benefit scheme.
Note 30: Parent shareholders' equity
In number of shares 31-12-2006 31-12-2007Total number of shares issued and fully paid up 389 955 122 417 232 809
Breakdown by typeOrdinary shares 385 054 107 412 331 794Other equity instruments 4 901 015 4 901 015
of which ordinary shares that entitle the holder to a dividend payment 389 955 122 417 232 809of which treasury shares 0 0
Other informationPar value per share (in euros) 9,77 9,77Number of shares issued but not fully paid up 0 0
MOVEMENTS, in number of shares Ordinary sharesOther equity instruments Total
2006Opening balance 385 054 107 12 787 451 397 841 558
Issue of shares 0 0 0Conversion of convertible bonds into shares 0 0 0Other movements 0 - 7 886 436 - 7 886 436
Closing balance 385 054 107 4 901 015 389 955 1222007Opening balance 385 054 107 4 901 015 389 955 122
Issue of shares 27 277 687 0 27 277 687Conversion of convertible bonds into shares 0 0 0Other movements 0 0 0
Closing balance 412 331 794 4 901 015 417 232 809 • The share capital of KBC Bank NV consists of ordinary shares of no nominal value and mandatorily
convertible bonds (MCBs – see ‘Other equity instruments’ in the table). All ordinary shares carry voting rights and each share represents one vote. No participation certificates or non-voting shares have been issued.
• At 31 December 2007, there were 412 331 794 ordinary shares in circulation. Of these, KBC Group NV and KBC Insurance NV respectively hold 412 331 793 shares and 1 share.
• At 31 December 2007, there were no freely convertible bonds outstanding.
• Preference shares are not included in ‘Parent shareholders’ equity’, but in ‘Minority interests’. • For information on stock option plans, see Note 9.
p. 83

Other notes
Note 31: Commitments and contingent liabilities In millions of EUR 31-12-2006 31-12-2007
CREDIT COMMITMENTS - undrawn amount– given 39 313 41 403
1) irrevocable 29 893 34 6342) revocable 9 420 6 769
– received 6 273FINANCIAL GUARANTEES
– given 11 639 13 734– guarantees received / collateral 127 511 166 160
1) for impaired and past due assets 3 180 4 617non-financial assets 3 039 4 304financial assets 141 313
2) for assets that are not impaired or past due assets 124 331 161 543non-financial assets 83 312 100 967financial assets 41 019 60 577
OTHER COMMITMENTS – given 87 93
1) irrevocable 71 752) revocable 16 18
– received 0 0 • The fair value of financial guarantees is based on the available market value, while the fair value of non-financial
guarantees is based on the value when the loan is taken out (for example, the mortgage registration amount) or when the personal guarantee is established.
• KBC Bank irrevocably guarantees all sums, indebtedness, obligations and liabilities outstanding on 31 December 2007 listed in Section 5c of the Irish Companies Amendment Act of the following Irish companies, which are consequently eligible for exemption from certain disclosure requirements, pursuant to Section 17 of the Irish Companies Amendment Act 1986.
o KBC Asset Management International Limited o KBC Asset Management Limited o KBC Financial Services (Ireland) Limited o KBC Fund Managers Limited
p. 84

p. 85
In millions of EUR 31-12-2006 31-12-2007Finance lease receivablesGross investment in finance leases, receivable 6 772 7 873
At not more than one year 2 097 2 385At more than one but not more than five years 2 893 4 087At more than five years 1 782 1 401
Unearned future finance income on finance leases 690 988
Net investment in finance leases 6 031 6 883At not more than one year 1 929 2 101At more than one but not more than five years 2 568 3 726At more than five years 1 534 1 055
Of which: unguaranteed residual values accruing to the benefit of the lessor 10 9
Accumulated impairment for uncollectable lease payments receivable 60 35
Con 15 17
Op
Fu 50 91 13 26 29 55 8 9
Con 0 0
Note 32: Leasing
tingent rents recognised in income
erating lease receivables
ture aggregate minimum rentals receivable under non-cancellable leases :Not more than one yearMore than one but not more than five yearsMore than five years
tingent rentals recognised in income • There are no significant cases in which KBC is the lessee in operating leases. • Pursuant to IFRIC 4, no operating or finance leases contained in other contracts were identified. • Finance leasing: most finance leasing is carried out via separate companies operating mainly in Western and
Central and Eastern Europe. KBC offers finance lease products ranging from equipment leasing, to real estate leasing and vendor finance to car leasing. While equipment leasing is typically commercialised in Belgium through KBC group’s branch network, vendor finance is designed for producers and suppliers, and car leasing is sold both through the branch networks of KBC Bank and CBC Banque and by an in-house sales team. Typical vendor finance transactions involve EDP hardware, EDP software, medical equipment, containers, trailers and other capital goods. Transactions with non-European customers are also concluded from time to time.

Note 33: Related-party transactions
In millions of EUR
Parent Subsidiaries AssociatesJoint
Ventures
Other related parties Total Parent Subsidiaries Associates
Other related parties Total
TRANSACTIONS WITH RELATED PARTIES, EXCLUDING DIRECTORSAssets 99 45 500 45 1 373 2 063 88 815 733 2 186 3 822Loans and advances 98 21 500 45 1 364 2 029 77 40 679 1 176 1 972
Current accounts 1 4 416 5 217 643 0 0 0 122 122Term loans 97 17 84 41 1 146 1 386 77 40 678 1 054 1 850Finance leases 0 0 0 0 0 0 0 0 0 0 0Consumer credit 0 0 0 0 0 0 0 0 0 0 0Mortgage loans 0 0 0 0 0 0 0 0 0 0 0
Equity instruments 1 24 0 0 9 34 9 114 6 145 274Trading securities 1 13 0 0 9 23 7 0 6 133 145Investment securities 0 11 0 0 0 11 3 114 0 12 129
Other Receivables 0 0 0 0 0 0 2 661 48 865 1 576
Liabilities 1 156 34 21 2 1 879 3 091 178 548 7 5 284 6 017Deposits 906 34 21 2 1 879 2 841 146 532 7 4 663 5 347
deposits 906 34 21 2 1 879 2 841 146 531 4 4 516 5 197other borrowings 0 0 0 0 0 0 0 0 3 147 150
Other financial liabilities 250 0 0 0 0 250 0 2 0 347 349Debt certificates 0 0 0 0 0 0 0 2 0 347 349Subordinated liabilities 250 0 0 0 0 250 0 0 0 0 0Share based payments 0 0 0 0 0 0 0 0 0 0 0
Granted 0 0 0 0 0 0 0 0 0 0 0Exercised 0 0 0 0 0 0 0 0 0 0 0
Other liabilities 0 0 0 0 0 0 32 14 0 274 321
Income statement 11 - 27 21 1 51 57 - 4 - 33 32 36 30Net interest income - 7 - 47 14 1 - 34 - 73 - 40 - 30 31 - 130 - 170Gross earned premiums 0 0 0 0 0 0 0 0 0 0 0Dividend income 0 1 4 0 0 5 17 4 2 0 23Net fee and commission income 2 18 0 0 66 87 2 - 8 0 147 141Other income 16 0 3 0 18 38 17 0 0 18 36
GuaranteesGuarantees issued by the group 0 0 0 0 0 0 0 0 0 0 0Guarantees received by the group 0 0 0 0 0 0 0 0 0 0 0
31-12-200731-12-2006
p. 86

31-12-2006 31-12-2007TRANSACTIONS WITH DIRECTORS
9 10Short-term employee benefits 6 6Post-employment benefits 2 4
defined benefit plans 2 4defined contribution plans 0 0
Other long-term employee benefits 0 0Termination benefits 0 0Share-based payments 1 0
Share options, in unitsAt the beginning of the period 94 400 128 200
Granted 39 600 4 600Exercised - 25 800 - 8 100Change in composition of directors 20 000 0
At the end of the period 128 200 124 700
2 3
Amount of remuneration to directors or partners of the consolidating company on the basis of their activity in that company, its subsidiaries and associated companies, including the amount in respect of retirement pensions granted to former directors or partners on that basis
Advances and loans granted to the directors and partners
p. 87

• Related-party transactions are transactions with KBC Group NV (the parent company), with subsidiaries (transactions with non-consolidated special purpose vehicles), with associated companies (chiefly NLB) and with other related parties, including the sister companies KBL EPB and KBC Insurance and transactions with KBC Ancora, Cera cvba, MRBB, the pension funds and the directors of the group.
• All related-party transactions occur ‘at arm’s length’. • Transactions with KBC Ancora, Cera cvba, MRBB and the group’s pension funds are limited in scope. • There were no material transactions with associated companies other than shown in the table.
Note 34: Auditor’s remuneration
In 2007, KBC Bank NV (consolidated) paid Ernst & Young Bedrijfsrevisoren BCVBA fees of 8 373 968 euros for standard audit services. Remuneration paid for non-audit services came to 2 533 122 euros, viz: o other certifications: 751 245 euros; o tax advice: 535 474 euros; o other non-audit assignments: 1 246 403 euros.
p. 88

Note 35: List of subsidiaries and associated companies KBC BANK : LIST OF CONSOLIDATED AND NON-CONSOLIDATED COMPANIES
December 31, 2007
LIST OF SUBSIDIARIES FULLY CONSOLIDATEDshare of
name of the company registered office identification number capital held(in %)
KBC Bank NV Brussels - BE 0462.920.226 100 AKB "Absolut Bank" (ZAO) Moscow - RU -- 95
Absolut Capital (Luxembourg) SA Luxembourg - LU -- 95 Absolut Capital Trust Limited Limasol - CY -- 95 Absolut Finance SA Luxembourg - LU -- 95
Antwerpse Diamantbank NV Antwerp - BE 0404.465.551 100 Banque Diamantaire (Suisse) SA Geneva - CH -- 100
CBC BANQUE SA Brussels - BE 0403.211.380 100 CENTEA NV Antwerp - BE 0404.477.528 99,56 Ceskoslovenska Obchodni Banka a.s. Prague - CZ -- 100
Auxilium a.s. Prague - CZ -- 100 Bankovni Informacni Technologie s.r.o. Prague - CZ -- 100 Business Center s.r.o. Bratislava - SK -- 100 Centrum Radlická a.s. Prague - CZ -- 100 CSOB Asset Management a.s. Prague - CZ -- 100
CSOB Property Fund a.s. Prague - CZ -- 100 Merrion Properties a.s. Prague - CZ -- 100
CSOB Asset Management a.s. Bratislava - SK -- 100 CSOB Distribution a.s. Prague - CZ -- 100 CSOB d.s.s. a.s. Bratislava - SK -- 100 CSOB Factoring a.s. Prague - CZ -- 100
CSOB Factoring a.s. Bratislava - SK -- 100 CSOB Investicni Spolecnost a.s. Prague - CZ -- 90,81 CSOB Investment Banking Service a.s. Prague - CZ -- 100 CSOB Korporatni OPF CSOB Investicni Spolecnosti a.s. Prague - CZ -- 100 CSOB Leasing a.s. Prague - CZ -- 100
CSOB Leasing Pojist'ovaci Maklér s.r.o. Prague - CZ -- 100 CSOB Leasing a.s. Bratislava - SK -- 100
CSOB Leasing Poist'ovaci Maklér s.r.o. Bratislava - SK -- 100 CSOB Penzijní fond Progres a.s. Prague - CZ -- 100 CSOB Penzijní fond Stabilita a.s. Prague - CZ -- 100 CSOB Stavebni Sporitelna a.s. Bratislava - SK -- 100 Hypotecni Banka a.s. Prague - CZ -- 99,87 Zemsky Penzijni fond a.s. Prague - CZ -- 100
Economic and Investment Bank AD Sofia - BG -- 75,58 Fin-Force NV Brussels - BE 0472.725.639 90 IIB Bank Public Limited Company Dublin - IE -- 100
Bencrest Properties Limited Dublin - IE -- 100 Boar Lane Nominee (Number 1) Limited Dublin - IE -- 100 Boar Lane Nominee (Number 2) Limited Dublin - IE -- 100 Boar Lane Nominee (Number 3) Limited Dublin - IE -- 100 Danube Holdings Limited Dublin - IE -- 100 Dunroamin Properties Limited Dublin - IE -- 100 Glare Nominee Limited Dublin - IE -- 100 Homeloans and Finance Limited Dublin - IE -- 100 IIB Capital Plc. Dublin - IE -- 100 IIB Finance Limited Dublin - IE -- 100 IIB Asset Finance Limited Dublin - IE -- 100 IIB Commercial Finance Limited Dublin - IE -- 100 IIB Leasing Limited Dublin - IE -- 100 Khans Holdings Limited Dublin - IE -- 100 Lease Services Limited Dublin - IE -- 100
p. 89

IIB Homeloans and Finance Limited Dublin - IE -- 100 Cluster Properties Company Dublin - IE -- 100 Demilune Limited Dublin - IE -- 100 IIB Homeloans Limited Dublin - IE -- 100 KBC Homeloans and Finance Limited Dublin - IE -- 100 Premier Homeloans Limited Surrey - GB -- 100 Staple Properties Limited Dublin - IE -- 100
IIB Nominees Limited Dublin - IE -- 100 Stepstone Mortgage Services Limited Dublin - IE -- 100
Intercontinental Finance Dublin - IE -- 100 Irish Homeloans and Finance Limited Dublin - IE -- 100 Kalzari Limited Dublin - IE -- 100 Linkway Developments Limited Dublin - IE -- 100 Maurevel Investment Company Limited Dublin - IE -- 100 Meridian Properties Limited Dublin - IE -- 100 Merrion Commercial Leasing Limited Surrey - GB -- 100 Merrion Equipment Finance Limited Surrey - GB -- 100 Merrion Leasing Assets Limited Surrey - GB -- 100 Merrion Leasing Finance Limited Surrey - GB -- 100 Merrion Leasing Industrial Limited Surrey - GB -- 100 Merrion Leasing Limited Surrey - GB -- 100 Merrion Leasing Services Limited Surrey - GB -- 100 Monastersky Limited Dublin - IE -- 100 Needwood Properties Limited Dublin - IE -- 100 Perisda Limited Dublin - IE -- 100 Phoenix Funding Plc. Dublin - IE -- 100 Quintor Limited Dublin - IE -- 100 Rolata Limited Douglas - IM -- 100 Wardbury Properties Limited Dublin - IE -- 100
IIB Finance Ireland Dublin - IE -- 100 KBC Finance Ireland Dublin - IE -- 100
KBC Asset Management NV Brussels - BE 0469.444.267 51,86 Bemab NV Brussels - BE 0403.202.670 51,86 KBC Access Fund Conseil Holding SA Luxembourg - LU -- 51,86 KBC Asset Management Limited Dublin - IE -- 51,86
KBC Asset Management International Limited Dublin - IE -- 51,86 KBC Asset Management (UK) Limited London - GB -- 51,86 KBC Fund Managers Limited Dublin - IE -- 51,86
KBC Asset Management SA Luxembourg - LU -- 51,86 KBC Bonds Conseil Holding SA Luxembourg - LU -- 51,86 KBC Cash Conseil Holding SA Luxembourg - LU -- 51,86 KBC Conseil Service SA Luxembourg - LU -- 51,86 KBC Districlick Conseil Holding SA Luxembourg - LU -- 51,86 KBC Equity Fund Conseil Holding SA Luxembourg - LU -- 51,86 KBC Fund Partners Conseil Holding SA Luxembourg - LU -- 51,86 KBC Invest Conseil Holding SA Luxembourg - LU -- 51,86 KBC Life Invest Fund Conseil Holding SA Luxembourg - LU -- 51,86 KBC Money Conseil Holding SA Luxembourg - LU -- 51,86 KBC Renta Conseil Holding SA Luxembourg - LU -- 51,86 KBC Towarzystwo Funduszy Inwestycyjnych a.s. Warsawa - PL -- 44,74
KBC Bank Deutschland AG Bremen - DE -- 99,76 KBC Bank Funding LLC II New York - US -- 100 KBC Bank Funding LLC III New York - US -- 100 KBC Bank Funding LLC IV New York - US -- 100 KBC Bank Funding Trust II New York - US -- 100 KBC Bank Funding Trust III New York - US -- 100 KBC Bank Funding Trust IV New York - US -- 100 KBC Bank Nederland NV Rotterdam - NL -- 100
Westersingel Holding BV Rotterdam - NL -- 100 KBC Bank (Singapore) Limited Singapore - SG -- 100 KBC Clearing NV Amsterdam - NL -- 100 KBC Commercial Finance NV Brussels - BE 0403.278.488 100 KBC Consumer Finance IFN sa Bucarest - RO -- 99,95 KBC Credit Invesments NV Brussels - BE 0887.849.512 100 KBC Dublin Capital Plc. Dublin - IE -- 100
p. 90
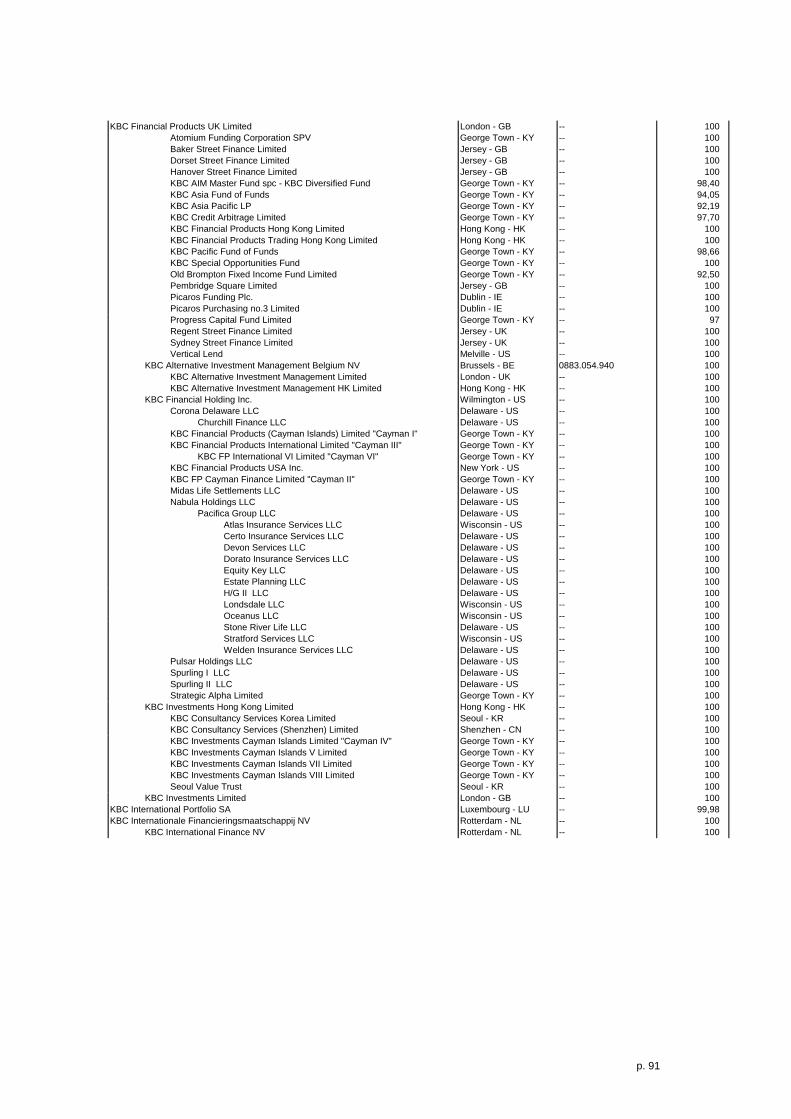
KBC Financial Products UK Limited London - GB -- 100 Atomium Funding Corporation SPV George Town - KY -- 100 Baker Street Finance Limited Jersey - GB -- 100 Dorset Street Finance Limited Jersey - GB -- 100 Hanover Street Finance Limited Jersey - GB -- 100 KBC AIM Master Fund spc - KBC Diversified Fund George Town - KY -- 98,40 KBC Asia Fund of Funds George Town - KY -- 94,05 KBC Asia Pacific LP George Town - KY -- 92,19 KBC Credit Arbitrage Limited George Town - KY -- 97,70 KBC Financial Products Hong Kong Limited Hong Kong - HK -- 100 KBC Financial Products Trading Hong Kong Limited Hong Kong - HK -- 100 KBC Pacific Fund of Funds George Town - KY -- 98,66 KBC Special Opportunities Fund George Town - KY -- 100 Old Brompton Fixed Income Fund Limited George Town - KY -- 92,50 Pembridge Square Limited Jersey - GB -- 100 Picaros Funding Plc. Dublin - IE -- 100 Picaros Purchasing no.3 Limited Dublin - IE -- 100 Progress Capital Fund Limited George Town - KY -- 97 Regent Street Finance Limited Jersey - UK -- 100 Sydney Street Finance Limited Jersey - UK -- 100 Vertical Lend Melville - US -- 100
KBC Alternative Investment Management Belgium NV Brussels - BE 0883.054.940 100 KBC Alternative Investment Management Limited London - UK -- 100 KBC Alternative Investment Management HK Limited Hong Kong - HK -- 100
KBC Financial Holding Inc. Wilmington - US -- 100 Corona Delaware LLC Delaware - US -- 100
Churchill Finance LLC Delaware - US -- 100 KBC Financial Products (Cayman Islands) Limited "Cayman I" George Town - KY -- 100 KBC Financial Products International Limited "Cayman III" George Town - KY -- 100
KBC FP International VI Limited "Cayman VI" George Town - KY -- 100 KBC Financial Products USA Inc. New York - US -- 100 KBC FP Cayman Finance Limited "Cayman II" George Town - KY -- 100 Midas Life Settlements LLC Delaware - US -- 100 Nabula Holdings LLC Delaware - US -- 100
Pacifica Group LLC Delaware - US -- 100 Atlas Insurance Services LLC Wisconsin - US -- 100 Certo Insurance Services LLC Delaware - US -- 100 Devon Services LLC Delaware - US -- 100 Dorato Insurance Services LLC Delaware - US -- 100 Equity Key LLC Delaware - US -- 100 Estate Planning LLC Delaware - US -- 100 H/G II LLC Delaware - US -- 100 Londsdale LLC Wisconsin - US -- 100 Oceanus LLC Wisconsin - US -- 100 Stone River Life LLC Delaware - US -- 100 Stratford Services LLC Wisconsin - US -- 100 Welden Insurance Services LLC Delaware - US -- 100
Pulsar Holdings LLC Delaware - US -- 100 Spurling I LLC Delaware - US -- 100 Spurling II LLC Delaware - US -- 100 Strategic Alpha Limited George Town - KY -- 100
KBC Investments Hong Kong Limited Hong Kong - HK -- 100 KBC Consultancy Services Korea Limited Seoul - KR -- 100 KBC Consultancy Services (Shenzhen) Limited Shenzhen - CN -- 100 KBC Investments Cayman Islands Limited "Cayman IV" George Town - KY -- 100 KBC Investments Cayman Islands V Limited George Town - KY -- 100 KBC Investments Cayman Islands VII Limited George Town - KY -- 100 KBC Investments Cayman Islands VIII Limited George Town - KY -- 100 Seoul Value Trust Seoul - KR -- 100
KBC Investments Limited London - GB -- 100 KBC International Portfolio SA Luxembourg - LU -- 99,98 KBC Internationale Financieringsmaatschappij NV Rotterdam - NL -- 100
KBC International Finance NV Rotterdam - NL -- 100
p. 91

KBC Lease Holding NV Diegem - BE 0403.272.253 100 Dala Property Holding III BV Amsterdam - NL -- 100
Sicalis NV Amsterdam - NL -- 100 Fitraco NV Antwerp - BE 0425.012.626 100 INK Consultanta - Broker de Asigurare SRL Bucharest - RO -- 100 KBC Autolease NV Diegem - BE 0422.562.385 100 KBC Bail Immobilier France sas Paris - FR -- 100 KBC Lease Belgium NV Leuven - BE 0426.403.684 100
KBC Lease France SA Lyon - FR -- 100 KBC Bail France sas Lyon - FR -- 100 KBC Lease (Nederland) BV Bussum - Nl -- 100 Cathar BV Bussum - Nl -- 100 Gooieen BV Bussum - Nl -- 100 Hospiveen BV Bussum - Nl -- 100 Mercala 1 BV Bussum - Nl -- 100 Mercala 2 BV Bussum - Nl -- 100 KBC Lease Polska Sp z.o.o. Warsawa - PL -- 100 KBC Lease (UK) Limited Surrey - GB -- 100
KBC Lease (Deutschland) GmbH & Co. KG Kronberg - DE -- 91,94 KBC Autolease (Deutschland) GmbH Kronberg - DE -- 91,94 KBC Immobilienlease (Deutschland) GmbH Kronberg - DE -- 91,94 KBC Lease (Deutschland) Vermietungs GmbH Kronberg - DE -- 91,94 KBC Vendor Lease (Deutschland) Service GmbH Kronberg - DE -- 91,94 KBC Vendor Finance (Deutschland) GmbH Kronberg - DE -- 91,94 KBC Vendor Lease (Deutschland) GmbH Kronberg - DE -- 91,94 Protection One Service GmbH Kronberg - DE -- 91,94 SCS Finanzdienstleistungs- GmbH Kronberg - DE -- 91,94
KBC Lease (Deutschland) Verwaltungs GmbH Kronberg - DE -- 75,94 KBC Lease España SA Madrid - ES -- 100 KBC Lease Italia S.p.A. Verona - IT -- 100 KBC Lease (Luxembourg) SA Strassen - LU -- 100 KBC Lizing Magyarország Kereskedelmi és Szolgátató Kft. Budapest - HU -- 100 KBC Vendor Lease NV Diegem - BE 0444.058.872 100 Romstal Leasing IFN SA Bucharest - RO -- 99,34 Securitas sam Nandrin - MC -- 100
KBC Peel Hunt Limited London - GB -- 99,99 KBC Peel Hunt CFD Limited London - GB -- 99,99 KBC Peel Hunt Incorporated London - GB -- 99,99 Peel Hunt Nominees Limited London - GB -- 99,99 P.H. Nominees Limited London - GB -- 99,99 P.H. Trustees Limited London - GB -- 99,99
KBC Pinto Systems NV Brussels - BE 0473.404.540 60,01 KBC Private Equity NV Brussels - BE 0403,226,228 100
Dynaco Group NV Moorsel - BE 0893.428.495 89,54 Dynaco Europe NV Moorsel - BE 0439.752.567 89,54
Dynaco International NV Moorsel - BE 0444.223.079 89,54 Dynaco USA Inc. Northbrook - US -- 89,54
KBC ARKIV NV Brussels - BE 0878.498.316 52 Mezzafinance NV Brussels - BE 0453.042.260 100 Novaservis a.s. Brno - CZ -- 94,57 Wever & Ducré Lighting Group NV Roeselare - BE 0891.731.886 50,01
Wever & Ducré NV Roeselare - BE 0412.881.191 50,01 Wever & Ducré GmbH Herzogenrath - DE -- 50,01 Wever & Ducré BV Den Haag - NL -- 50,01 Wever & Ducré Iluminacion SL Madrid - ES -- 50,01 Wever & Ducré Asia Pacific Limited Hong Kong - HK -- 50,01
KBC Real Estate Luxembourg SA Luxembourg - LU -- 100 KBC Real Estate NV Zaventem - BE 0404.040.632 73,18
Almafin Real Estate NV Brussels - BE 0403.355.494 73,18 Immo Arenberg NV Brussels - BE 0471.901.337 73,18 KBC Vastgoedinvesteringen NV Brussels - BE 0455.916.925 72,44 KBC Vastgoedportefeuille België NV Brussels - BE 0438.007.854 64,32 Novoli Investors BV Amstelveen - NL -- 60,98 Poelaert Invest NV Zaventem - BE 0478.381.531 73,17 Vastgoed Ruimte Noord NV Brussels - BE 0863.201.515 73,18
p. 92

KBC Securities NV Brussels - BE 0437.060.521 100 KBC Equitas LLC Budapest - HU -- 100 KBC Securitas a.d. Beograd Belgrade - RS -- 100 KBC Securities Baltic Investment Company sia Riga - LV -- 51,05
KBC Securities Ukraine LLC Kiev - UA -- 51,05 KBC Securities Romania SA Bucarest - RO -- 100
SAI Swiss Capital Asset Management SA Bucarest - RO -- 100 Ligeva NV Mortsel - BE 0437.002.519 100 Patria Finance a.s. Prague - CZ -- 100
Patria Finance CF a.s. Prague - CZ -- 100 Patria Finance Slovakia a.s. Bratislava - SK -- 100 Patria Online a.s. Prague - CZ -- 100 Patria Direct a.s. Prague - CZ -- 100
Kereskedelmi és Hitelbank Rt. Budapest - HU -- 100 K & H Alkusz Kft. Budapest - HU -- 100 K & H Csoportszolgáltató Központ Kft. Budapest - HU -- 100 K & H Equities Rt. Budapest - HU -- 100 K & H Ertékpapir Befektetési Alapkezelö Rt. Budapest - HU -- 100 K & H Lízingadminisztrációs Rt. Budapest - HU -- 100
K & H Eszközfinanszirozó Rt. Budapest - HU -- 100 K & H Eszközlizing Gép-és Thrgj. Bérleti Kft. Budapest - HU -- 100 K & H Lizingház Rt. Budapest - HU -- 100
K & H Pannonlizing Rt. Budapest - HU -- 100 K & H Autófinanszirozó Pénzügyl Szolgátató Rt. Budapest - HU -- 100 K & H Autópark Bérleti és Szolg Kft. Budapest - HU -- 100 K & H Ingatlanlizing Kft. Budapest - HU -- 100 K & H Lizing Rt.. Budapest - HU -- 100
Kvantum Követeléskezelõ és Befektetési Rt. Budapest - HU -- 100 Kredyt Bank SA Warsawa - PL -- 80
Kredyt International Finance BV Rotterdam - Nl -- 80 Kredyt Lease SA Warsawa - PL -- 80 Kredyt Trade Sp z.o.o. Warsawa - PL -- 80 Reliz SA Katowice - PL -- 80 Zagiel SA Warsawa - PL -- 80
Loan Invest NV "Institutionele VBS naar Belgisch recht" Brussels - BE 0889.054.884 100 Quasar Securitisation Company NV Brussels - BE 0475.526.860 100
LIST OF SUBSIDIARIES NOT FULLY CONSOLIDATEDshare of
name of the company registered office identification number capital held(in %)
ADB Private Equity Limited (1) Jersey - GB -- 80 Aldersgate Finance Limited (1) Jersey - GB -- 100 Almafin Real Estate Services NV (1) Zaventem - B 0416.030.525 73,18 Almaloisir & Immobilier sas (1) Nice - FR -- 73,18 Apitri NV (1) Diegem - BE 0469.889.873 73,18 Atomium Funding LLC (1) Delaware - US -- 100 Avebury Limited (1) Dublin - IE -- 100 Baker Street USD Finance Limited (1) Jersey - GB -- 100 Bankowa Polana Sp z.o.o. (1) Warsawa - PL -- 53,60 Bankowy Fundusz Inwestycyjny Serwis Sp z.o.o. (1) Warsawa - PL -- 80,00 Brussels North Distribution NV (1) Brussels - BE 0476.212.887 73,18 Chiswell Street Finance Limited (1) Jersey - GB -- 100 City Hotels NV (1) Zaventem - BE 0416.712.394 62,57 City Hotels International NV (1) Zaventem - BE 0449.746.735 62,57 CH Corp (1) Rockville - US -- 62,57 Clifton Finance Street Limited (1) Jersey - GB -- 100 Dala Beheer BV (1) Amsterdam - NL -- 73,18 Dala Property Holding XV BV (1) Amsterdam - NL -- 73,18
p. 93

Distienen NV (1) Zaventem - BE 0452.312.285 73,18 Dorlick Vastgoedmaatschappij NV (1) Zaventem - BE 0434.885.345 73,18 Eurincasso s.r.o. (1) Prague - CZ -- 100 Fidabel NV (1) Brussels - BE 0417.309.044 0,80 Fulham Road Finance Limited (1) Jersey - GB -- 100 Gie Groupe KBC Paris (1) Paris - FR -- 100 Immo-Accent NV (2) Brussels - BE 0465.538.335 73,17 Immo-Antares NV (2) Brussels - BE 0456.398.361 69,52 Immo-Basilix NV (2) Brussels - BE 0453.348.801 69,52 Immo-Beaulieu NV (2) Brussels - BE 0450.193.133 36,59 Immobilière Distri-Land NV (2) Brussels - BE 0436.440.909 64,04 Immo-Duo NV (1) Zaventem - BE 0435.573.154 73,18 Immo Genk-Zuid NV (1) Zaventem - BE 0464.358.497 73,18 Immo Kolonel Bourgstraat NV (2) Brussels - BE 0461.139.879 36,59 Immolease-Trust NV (1) Zaventem - BE 0406.403.076 73,18 Immo-Llan NV (2) Brussels - BE 0448.079.820 99,56 Immo Lux-Airport SA (2) Luxembourg - LU -- 48,76 Immo Marcel Thiry NV (2) Brussels - BE 0450.997.441 69,52 Immo-North Plaza NV (2) Brussels - BE 0462.118.688 73,17 IMMO PARIJSSTRAAT NV (1) Leuven - BE 0439.655.765 100 Immo-Plejaden NV (2) Brussels - BE 0461.434.344 73,17 Immo-Quinto NV (1) Zaventem - BE 0466.000.470 73,18 Immo-Regentschap NV (2) Brussels - BE 0452.532.714 54,88 Immo-Tres NV (1) Zaventem - BE 0465.755.990 73,18 Immo Zenobe Gramme NV (2) Brussels - BE 0456.572.664 73,18 KB-Consult NV (1) Brussels - BE 0437.623.220 100 KBC Alternative Investment Management (USA) Inc. (1) Delaware - US -- 100 KBC Broker a.d. (1) Belgrade - RS -- 100 KBC Financial Services (Ireland) Limited (1) Dublin - IE -- 100 KBC Group NV (1) Brussels - BE 0403.227.515 1,08 KBC North American Finance Corporation (1) Delaware - US -- 100 KBC Private Equity Advisory Services Limited Liability Company (1) Budapest - HU -- 100 KBC Private Equity Advisory Services s.r.o. (1) Prague - CZ -- 100 KBC Private Equity Advisory Services Sp.z.o.o. (1) Warsawa - PL -- 100 KBC Private Equity Consulting S.R.L. (1) Bucarest - RO -- 100 KBC Securities B-H a.d. Banja Luka (1) Banjaluka - BA -- 100 KBC Securities Corporate Finance LLC (1) Belgrade - RS -- 60 KBC Securities Montenegro a.d. Potgorica (1) Montenegro - CS -- 100 KBC Securities Skopje a.d. Skopje (1) Skopje - MK -- 100 KBC Structured Finance Limited (1) Sydney - AU -- 100 KBC Vastgoed Portefeuille Nederland (1) Rotterdam - NL -- 73,18 KBC Verzekeringen NV (1) Leuven - BE 0403.552.563 0,00 Kredietfinance Corporation (June) Limited (1) Surrey - GB -- 100 Kredietfinance Corporation (September) Limited (1) Surrey - GB -- 100 Kredietlease (UK) Limited (1) Surrey - GB -- 100 Kredyt Bank SA i TUiR WARTA SA (1) Warsawa - PL -- 100 Liontamer Investment Management Pty Limited (1) Sydney - AU -- 26,45 Liontamer Investment Services Limited (1) Auckland - NZ -- 26,45 LIZAR Sp z.o.o. (1) Warsawa - PL -- 80 Lombard Street Limited (1) Dublin - IE -- 100 Luxembourg North Distribution SA (1) Luxembourg - LU -- 73,18 Luxembourg Offices Securitisations SA (1) Luxembourg - LU -- 73,17 Mechelen City Center NV (1) Heffen - BE 0471.562.332 73,18 Motokov a.s. (1) Prague - CZ -- 69,10 Net Banking Sp z.o.o. (1) Warsawa - PL -- 80 Newcourt Street Finance Limited (1) Jersey - GB -- 100 Omnia cvba Leuven - BE 0413.646.305 0,01 OOO "Absolut Lizing" (1) Moscow - RU -- 95 OOO Lizingovaya Kompaniya "Absolut" (1) Moscow - RU -- 95 Oxford Street Finance Limited (1) Jersey - GB -- 100 Parkeergarage De Panne NV (1) Brussels - BE 0881.909.548 65,86 Pericles Invest NV (1) Zaventem - BE 0871.593.005 43,30 Picaros Funding LLC (1) Wilmington - US -- 100 Picaros Purchasing No.1 Limited (1) Dublin - IE -- 100 Picaros Purchasing No.2 Limited (1) Dublin - IE -- 100 Renthotel Utah LC (1) Rockville - US -- 62,57 Renthotel Singer LLC (1) Rockville - US -- 62,57
p. 94

Risk Kft. (1) Budapest - HU -- 99,96 Servipolis Management Company NV (1) Zaventem - BE 0442.552.206 51,22 SM Vilvoorde NV (1) Zaventem - BE 0425.859.197 73,18 Sunrise Asset Manangement Co Limited (1) Tapei - TW -- 28 TEE Square Limited (1) Road Town - VG -- 100 Threadneedle Finance Limited (1) Jersey - GB -- 100 Trustimmo NV (1) Zaventem - BE 0413.954.626 73,18 Valuesource NV (1) Brussels - BE 0472.685.453 0,01 Vastgoedmaatschappij Manhattan-Kruisvaarten NV (1) Zaventem - BE 0419.336.938 73,18 Vermögensverwaltungsgesellschaft Merkur mbH (1) Bremen - DE -- 99,76 Wetenschap Real Estate NV (1) Zaventem - BE 0871.247.565 99,76 Weyveld Vastgoedmaatschappij NV (1) Zaventem - BE 0425.517.818 86,59 Willowvale Company (1) Dublin - IE -- 100
reason for exclusion : (1) exclusion based on limited importance(2) real estate companies and certificates where the result is not allocated to the Group
LIST OF THE JOINT SUBSIDIARIES PROPORTIONAL CONSOLIDATEDshare of
name of the company registered office identification number capital held(in %)
Ceskomaravská Stavebni Sporitelna a.s. Prague - CZ -- 55 Covent Garden Real Estate NV Zaventem - BE 0872.941.897 50 CSOB Pojist'ovna a.s. Pardubice - CZ -- 25 Immobiliare Novoli S.p.A. Firenze - IT -- 32,78 KBC Goldstate Fund Management Co. Limited Sjanghai - CN -- 25,41 Real Estate Participation NV Zaventem - BE 0473.018.817 50
Société Agricole des Grands Lacs SA Luxembourg - LU -- 50 Romarin Real Estate sas Lille - FR -- 50
LIST OF THE JOINT SUBSIDIARIES NOT PROPORTIONAL CONSOLIDATED (1)share of
name of the company registered office identification number capital held(in %)
Atrium Development SA Luxembourg - LU -- 25 Barbarahof NV Zaventem - BE 0880.789.197 21,95 Consorzio Sandonato Est Firenze - IT -- 16,68 Covent Garden Development NV Brussels - BE 0892.236.187 25 FM-A Invest NV Diegem - BE 0460.902.725 36,59 Immocert t'Serclaes NV Zaventem - BE 0433.037.989 36,59 Jesmond Amsterdam NV Amsterdam - NL -- 50
Miedziana Sp z.o.o. Warsawa - PL -- 47,75 Panton Kortenberg Vastgoed NV "Pako Vastgoed" St Niklaas - BE 0437.938.766 36,59
Amdale Holdings Limited NV Diegem - BE 0452.146.563 36,59 Pakobo NV Diegem - BE 0474.569.526 36,59 Rumst Logistics NV Machelen - BE 0862.457.583 36,59
Perifund NV Brussels - BE 0465.369.673 36,59 Prague Real Estate NV Zaventem - B 0876.309.678 36,59 Real Estate Administration a.s. Prague - CZ -- 21,99 Resiterra NV Zaventem - BE 0460.925.588 36,59 Rumst Logistics II NV Machelen - BE 0880.830.076 36,59 Rumst Logistics III NV Machelen - BE 0860.829.383 36,59
p. 95

Sandonato Parcheggi Srl Firenze - IT -- 32,71 Sandonato Srl Firenze - IT -- 32,71
(1) exclusion based on limited importance
LIST OF COMPANIES ACCOUNTED FOR USING THE EQUITY METHODshare of
name of the company registered office identification number capital held(in %)
Budatrend III. Ingatlanhasznositó Rt. Budapest - HU -- 34,33 Foxhill Opportunity Offshore Fund Princeton - GB -- 43 Giro Elszámolásforgáltátó Rt. Budapest - HU -- 20,99 HAGE Hajdúsági Agráripari Résvényatársaság Budapest - HU -- 25 Isabel NV Brussels - BE 0455.530.509 25,33 K & H International Treasury Service Szolg. Kft. Budapest - HU -- 100 Nova Ljubljanska Banka d.d. Ljubljana - SI -- 34 Prague Stock Exchange a.s. Prague - CZ -- 24,39
LIST OF COMPANIES NOT ACCOUNTED FOR USING THE EQUITY METHOD (1)share of
name of the company registered office identification number capital held(in %)
Banking Funding Company NV Brussels - BE 0884.525.182 22,90 BCC Corporate NV Brussels - BE 0883.523.807 23,95 Bedrijvencentrum Noordoost-Antwerpen NV Antwerp - BE 0455.474.485 21,28 Bedrijvencentrum Rupelstreek NV Aartselaar - BE 0427.329.936 33,33 Brand and Licence Company NV Brussels - BE 0884.499.250 20 Czech Banking Credit Bureau a.s. Prague - CZ -- 20 Etoiles d'Europe sas Paris - FR -- 32,93 Justinvest Antwerpen NV Antwerp - BE 0476.658.097 24,39 Kattendijkdok NV Antwerp - BE 0863.854.482 28,54 Prvni Certifikacni Autorita a.s. Prague - CZ -- 23,25 Rabot Invest NV Antwerp - BE 0479.758.733 18,29 Sea Gate Logistics NV Aalst - BE 0480.040.627 18,29 Transportbeton GmbH Delmenhorst - DE -- 25,88
(1) exclusion based on limited importance
• The companies accounted for using the equity method (see table) have combined total assets, equity and a net result of 14.4 billion euros, 0.8 billion euros and 105 million euros, respectively.
p. 96
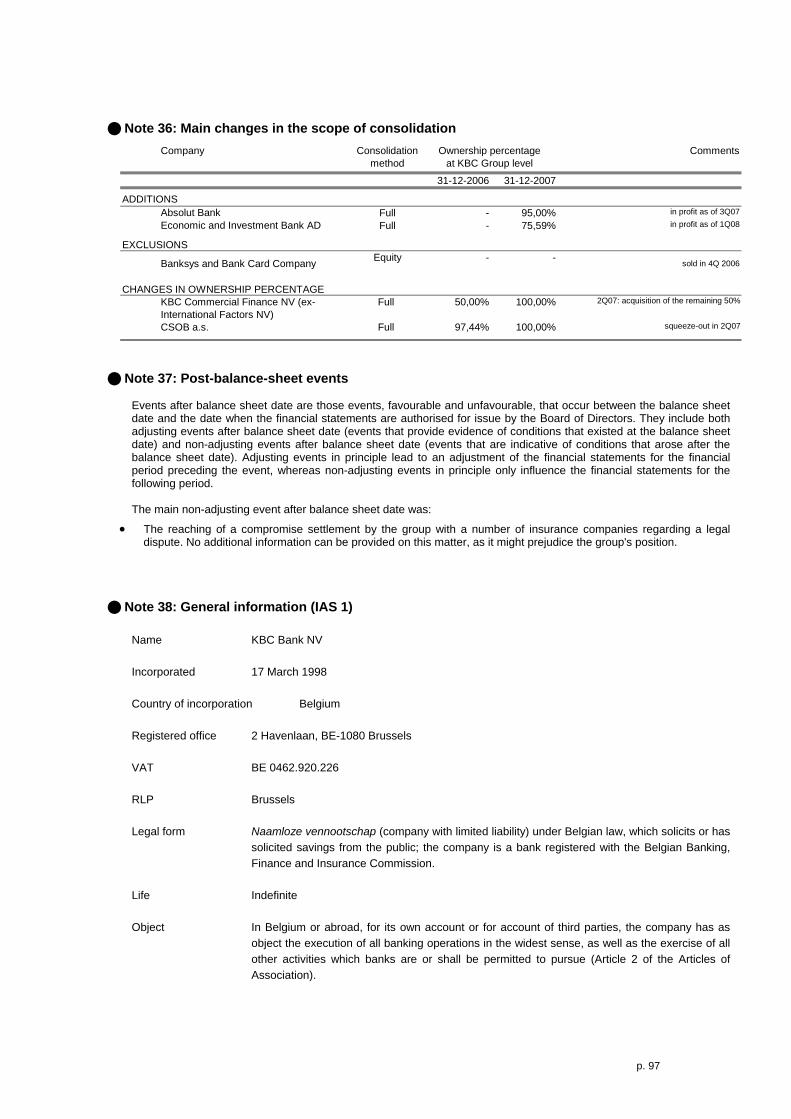
Note 36: Main changes in the scope of consolidation Company Consolidation
methodComments
31-12-2006 31-12-2007
ADDITIONSAbsolut Bank Full - 95,00% in profit as of 3Q07
Economic and Investment Bank AD Full - 75,59% in profit as of 1Q08
EXCLUSIONS
Banksys and Bank Card Company Equity - - sold in 4Q 2006
CHANGES IN OWNERSHIP PERCENTAGEKBC Commercial Finance NV (ex-International Factors NV)
Full 50,00% 100,00% 2Q07: acquisition of the remaining 50%
CSOB a.s. Full 97,44% 100,00% squeeze-out in 2Q07
Ownership percentage at KBC Group level
Note 37: Post-balance-sheet events
Events after balance sheet date are those events, favourable and unfavourable, that occur between the balance sheet date and the date when the financial statements are authorised for issue by the Board of Directors. They include both adjusting events after balance sheet date (events that provide evidence of conditions that existed at the balance sheet date) and non-adjusting events after balance sheet date (events that are indicative of conditions that arose after the balance sheet date). Adjusting events in principle lead to an adjustment of the financial statements for the financial period preceding the event, whereas non-adjusting events in principle only influence the financial statements for the following period. The main non-adjusting event after balance sheet date was:
• The reaching of a compromise settlement by the group with a number of insurance companies regarding a legal dispute. No additional information can be provided on this matter, as it might prejudice the group's position.
Note 38: General information (IAS 1) Name KBC Bank NV Incorporated 17 March 1998 Country of incorporation Belgium Registered office 2 Havenlaan, BE-1080 Brussels VAT BE 0462.920.226 RLP Brussels
Legal form Naamloze vennootschap (company with limited liability) under Belgian law, which solicits or has
solicited savings from the public; the company is a bank registered with the Belgian Banking, Finance and Insurance Commission.
Life Indefinite
Object In Belgium or abroad, for its own account or for account of third parties, the company has as
object the execution of all banking operations in the widest sense, as well as the exercise of all other activities which banks are or shall be permitted to pursue (Article 2 of the Articles of Association).
p. 97

Documents open to public inspection
The Articles of Association of the company are open to public inspection at the Registry of the Brussels Commercial Court. The annual accounts have been filed with the National Bank of Belgium. Decisions on the appointment, resignation and dismissal of members of the Executive Committee and the Board of Directors are published in the Appendices to the Belgian Official Gazette. Financial reports about the company and convening notices of general meetings of shareholders are also published in the financial press. Copies of the company’s annual reports are available at its registered office. They are sent annually to the holders of registered shares and to those who have applied for a copy.
General Meeting of Shareholders
Each year, at the registered office of the company or elsewhere, as indicated in the convening notice, a general meeting is held on the Wednesday immediately preceding the last Thursday in April or, if that day is a legal holiday, on the last business day immediately preceding it, at 11 a.m. In order to be admitted to the General Meeting, the holders of bearer bonds or bearer warrants, and the holders of bearer certificates issued in co-operation with the company, must deposit these securities at least four business days prior to the meeting at the registered office or at another place designated in the convening notice. The owners of registered bonds, warrants or certificates issued in co-operation with the company must also notify the registered office in writing, at least four business days prior to the meeting, of their intention to attend the General Meeting. Holders of bonds and warrants are entitled to attend the General Meeting, but they have only advisory voting capacity. Holders of book-entry bonds, warrants or certificates issued in co-operation with the company, who wish to be admitted to the General Meeting must, at least four business days prior to the meeting, deposit at the registered office or at another place designated in the convening notice, a certificate drawn up by the recognised account holder or by the clearing house, attesting to the non-availability of the bonds, warrants or certificates until the date of the General Meeting.
p. 98

Annual report KBC Bank
2 0 0 7
V o l u m e 2
p. 99

Table of contents
KBC Bank Profile Volume 1 Discussion of the consolidated annual accounts Volume 1 Main events Volume 1 Value and risk management Volume 1 The Board of Directors Volume 1 Consolidated annual accounts Volume 1
Company annual accounts Volume 2
This volume contains the company annual accounts of KBC Bank, as filed with the National Bank of Belgium.
-------- Publisher: KBC Group NV, 2 Havenlaan, 1080 Brussels, Belgium. RLP 0403 227 515, bank account No. 734-0051 74-70. 3KBC Bank NV, CBFA registration No. 26 256.
p. 100