Embed Size (px)
Citation preview

ANNUAL REPORT 2016/17
WESTERN WATER ANNUAL REPORT 2016/17
CONTENTS
INTRODUCTION 1
Service area map 3
YEAR IN REVIEW 4
Highlights 4
Financial summary 4
Foreword from the Chair and Managing Director 5
Business at a glance 6
Capital projects 7
GOVERNANCE AND ORGANISATIONAL STRUCTURE 8
Organisational structure and corporate governance arrangements 8
Board and committees 10
Human resource management 14
Occupational health and safety 16
OPERATIONS REPORT 18
Water consumption and drought response 18
Water quality 21
Water efficiency 21
Environmental sustainability 22
• Sustainable water use 22
• Sustainable and resilient water services systems 24
• Environmental statutory obligations 27
Social sustainability 32
• Service delivery 32
• Customer service 34
• Community service obligations 34
PERFORMANCE REPORT 35
OTHER DISCLOSURES 42
FINANCIAL REPORT 46
APPENDICES 114
Disclosure index 114
Bulk entitlements report 116
Annual Report index 120

1 INTRODUCTION
INTRODUCTION
MANNER OF ESTABLISHMENT AND RESPONSIBLE MINISTEREstablished under the Water Act 1989, Western Region Water Corporation (trading as Western Water) is one of Victoria’s 13 regional urban water corporations.
The responsible Minister for the reporting period, 1 July 2016 to 30 June 2017, was the Hon Lisa Neville MP, Minister for Water.
Western Water is responsible to the current Minister for Water via the Department of Environment, Land, Water and Planning (DELWP).
The Department of Treasury and Finance (DTF) also has a shareholder governance role.
The Department of Health and Human Services (DHHS) sets and supervises water quality standards, while the Environment Protection Authority (EPA) governs environmental standards, particularly for wastewater discharge, recycled water and biosolids management.
The Essential Services Commission (ESC), the Victorian Government’s economic regulator for essential utility services, regulates Western Water’s prices, service standards and market conduct.
The Energy and Water Ombudsman Victoria (EWOV) receives, investigates and resolves enquiries and complaints against electricity and water suppliers across Victoria.
OBJECTIVES, FUNCTIONS, POWERS AND DUTIESUnder section 93 of the Water Act 1989, Western Water must have regard to the following principles:
• the need to ensure that water resources are conserved and properly managed for sustainable use and for the benefit of present and future generations
• the need to encourage and facilitate community involvement in the making and implementation of arrangements relating to the use, conservation and management of water resources
• the need to integrate both long term and short term economic, environmental, social and equitable considerations
• the need for the conservation of biological diversity and ecological integrity to be a fundamental consideration, and
• ensure that a lack of full scientific certainty is not used as a reason for postponing measures to address threats of serious or irreversible environmental damage.
In addition, under section 94 of the Water Act 1989, Western Water – in carrying out its duties – must act as efficiently as possible, consistent with commercial practice. The Corporation must also undertake research into its functions and educate the community.
This Annual Report provides a detailed review of how Western Water has met these objectives, functions, powers and duties during the 2016/17 financial year.

2 WESTERN WATER ANNUAL REPORT 2016/17
STRATEGIC INTENTEngaging with our community on the provision of water services to enable regional economic growth and resilience in a climate-changing environment.
STRATEGIC THEMESWestern Water has identified four strategic themes:
1. Customers: delivering value for customers
2. Liveability: contributing to a highly liveable, viable region
3. Environment: caring for the environment, people and places
4. Innovation: developing sustainable services
VALUESAt Western Water, our values are:
• People
• Integrity
• Respect
• Teamwork
• Excellence
NATURE AND RANGE OF SERVICES PROVIDED In 2016/17, Western Water provided water, sewerage and recycled water services to 65,776 properties across a region of 3,000 square kilometres to the north-west of Melbourne.
Serviced properties grew by 4.0% this year – particularly within new residential estates in and around Melton and Sunbury. Average property growth rates of 4.1% per annum are expected over the next decade.
The service area population was recently recalibrated following the release of Australian Bureau of Statistics Census 2016 data. With an average of 2.6 persons per household the population is now calculated at 153,358, down from about 163,400 reported the previous year.

3
SERVICE AREA MAP
INTRODUCTION

4 WESTERN WATER ANNUAL REPORT 2016/17
YEAR IN REVIEW
HIGHLIGHTS• Provided water, sewerage and recycled water
services to 65,776 properties
• Safely delivered 13,775 million litres of drinking water to a population of 153,358
• Supplied 4,979 million litres of recycled water for reuse by 1,858 customers with another 3,386 reused operationally
• Invested $65.1 million in capital works, including $19.6 million on upgrading the Sunbury Recycled Water Plant
• Joined a joint Melbourne metropolitan water industry working group on Indigenous engagement
• Completed an Urban Water Strategy outlining potable and alternative water supply and sewerage management strategies for the next 50 years
• High rainfall during the year resulted in the volumes in Rosslynne Reservoir, Merrimu Reservoir and other local reservoirs increasing from a combined total of 12% to 47%
• Adopted a Greenhouse Gas Reduction and Energy Management Strategy and Greenhouse Gas Reduction Pledge of 10% below baseline levels by 2025
• Commenced assessment of an alternate water grid, the Western Irrigation Network
• Conducted extensive community consultation as a key input into planning processes and the development of the 2018-2023 Price Submission
• Developed a Diversity and Inclusion Plan to underpin the People and Culture Strategy
• Launched the Easy Pay program and a Webchat facility to facilitate customer interactions.
FINANCIAL SUMMARY Net pre-tax profit of $15.0 million was delivered for the financial year. This financial result remains strong despite the profit being $3.5 million lower than the 2015/16 financial year. Particularly given:
• service and usage operating revenues decreased by $7.4 million from the prior year as a result of lower customer tariffs that reflect the pass through of reduced bulk water expenses from Melbourne Water; and
• depreciation and amortisation expenses increased by $2.9 million as a result of increased property, plant and equipment asset fair values.
Developer revenue increased by $5.7 million to $30.9 million reflecting continued strong residential development activity in the region.
Capital works expenditure was $65.1 million for the year, of which $32 million was funded with additional debt taking the total debt balance to $213 million.
TABLE 1: FINANCIAL SUMMARY ($'000)
2012/13 2013/14 2014/15 2015/16 2016/17
Revenue 82,261 77,090 81,735 101,916 100,758
Expenses 78,132 75,444 70,058 83,378 85,767
Net profit before tax 4,129 1,646 11,677 18,538 14,991
Subsequent eventsNo matters or circumstances have arisen since the end of the reporting period which significantly affected or may significantly affect the operations of the Corporation, the results of those operations, or the state of affairs of the Corporation in future.

5 YEAR IN REVIEW
FOREWORD FROM THE CHAIR AND MANAGING DIRECTOR Western Water is building on its 22-years' experience managing water resources by developing new, smarter ways of delivering services to a population that has almost doubled over this period.
Population growth and climate change causing increasingly dry conditions, have meant the region's precious, limited local water sources have not always met demand, forcing the Corporation to source further supplies from the Melbourne system.
We are proud of how the business addressed these challenges with innovative and sustainable solutions during the reporting period.
In 2016/17, Western Water provided water, sewer and recycled water services to a population of 153,358.
Existing communities and future generations will have a secure water supply through interconnection with external sources, reuse of recycled water and use of other alternate water sources.
The 2016/17 Annual Report describes how our corporate objectives were met and exceeded in the past year, as well as how the business will continue to do so in the future.
Western Water must deal with dramatic weather events - more severe dry periods, more extreme downpours - and increasing demand created by the unprecedented growth in Melbourne's north-western corridor, in the future.
Western Water will continue to meet these ongoing challenges directly by working with all stakeholders - particularly state and local government, developers and the community - to do more with less water while continuing to support a prosperous community and healthy environment.
In line with the State Government's innovative Water for Victoria plan, Western Water recognises the value the Indigenous Traditional Owners place on water and welcomes their participation in the management of the region's valuable water resources.
The Corporation publicly acknowledged its region's Traditional Owners through a plaque at the entrance to its head office and by commissioning an indigenous artwork for its head office foyer in 2016/17. To foster indigenous engagement, Western Water is a member of a joint Melbourne metropolitan water industry work group focusing
on this issue. Staff attended cultural immersion training with the Wurundjeri Tribe and will share this knowledge across the business.
A key strategy taking Western Water forward is making optimal use of local water, capital systems, processes and people to balance the needs of customers and stakeholders. At the same time, the Corporation must contain prices for customers delivering value-for-money services while remaining financially and environmentally sustainable.
Western Water will ensure its actions are aligned with the objectives set out in the Water for Victoria plan and the Minister's Letter of Expectations while continuing to seek innovative and collaborative ways to invest in and deliver efficient, timely infrastructure across the service region.
We would like to thank the Board, Executive and staff at Western Water for their support and effort during the reporting period.
Accountable officers’ declarationIn accordance with the Financial Management Act 1994, we are pleased to present Western Water’s Annual Report for the year ending 30 June 2017. It is compliant with all statutory reporting requirements.
Terry Larkins Neil Brennan, Chair Managing Director
7 September 2017

6 WESTERN WATER ANNUAL REPORT 2016/17
BUSINESS AT A GLANCETABLE 2: BUSINESS AT A GLANCE
Properties 2015/16 2016/17
Serviced assessments (including vacant land) 63,229 65,776
Serviced assessments (vacant land) 3,071 3,542
Water supply
Connected water customers 60,158 62,234
• Residential 57,062 59,118
• Non-residential 3,096 3,116
Water consumption (ML) 14,357 13,775
• Residential consumption (ML) 11,022 10,584
• Non-residential consumption (ML) 2,032 1,971
• Non-revenue water (ML) 1,303 1,220
Water mains (km) * 1,960 2,020
Water filtration plants 7 7
Chlorination plants 14 16
Sewer service
Serviced sewer customers 56,987 59,525
Connected sewer customers 54,197 56,264
Sewage treated (ML) 9,142 10,185
Sewer mains (km) 1,257 1,285
Recycled water supply
Recycled water customers 1,613 1,858
• Residential customers (Class A) 1,510 1,739
• Non-residential customers (Classes A, B or C) 103 119
Recycled water produced (ML) 10,848 12,170
Percentage reused 83% 72%
Recycled water mains – Classes A, B and C (km) 185 195
Recycled water plants 7 7
* Total includes recycled water mains

7
CAPITAL PROJECTSWestern Water’s capital works program ensures water, sewerage and recycled water services are in place to meet the needs of existing and future customers.
The business invested substantially in capital works during 2016/17 spending $65.1 million, compared to $35.5 million the previous year.
This investment ensures the service region has efficient, modern and innovative water, sewerage and recycled water services to meet customers’ present and future requirements.
Major capital works projects undertaken during the reporting period include the $19.6 million upgrade of the Sunbury Recycled Water Plant, undertaken by Downer through a design, build and operate contract. Downer took over operation of the plant in April 2016.
Major capital works during 2016/17 include:
• $19.6 million on the Sunbury Recycled Water Plant upgrade
• $3.1 million on the Leakes Road water main for Rockbank
• $2.7 million on the Rockbank sewer pump station
• $1.8 million on the Outer Eynesbury recycled water storage, and
• $1.5 million on the Melton Recycled Water Plant upgrade.
TABLE 3: CAPITAL WORKS INVESTMENT ($M)
2012/13 2013/14 2014/15 2015/16 2016/17
Capital works investment 22.5 19.9 19.5 35.5 65.1
With a rapidly growing population in the service region, Western Water will need to invest almost $80 million annually in significant capital works over the next decade.
Major capital investment planned for 2017/18 include:
• $9.2 million on the Sunbury Recycled Water Plant upgrade
• $6.9 million on the Melton Recycled Water Plant upgrade
• $2 million on the Rockbank North sewage pump station
• $1.7 million on the Diggers Rest outfall sewer
• $1.5 million on the Rockbank North sewer rising main, and
• $1.5 million on the Gisborne Recycled Water Plant upgrade.
Major contractsWestern Water did not award any major contracts (valued at $10 million or more) during 2016/17.
YEAR IN REVIEW

8 WESTERN WATER ANNUAL REPORT 2016/17
GOVERNANCE AND ORGANISATIONAL STRUCTURE
ORGANISATIONAL STRUCTURE AND CORPORATE GOVERNANCE ARRANGEMENTSWestern Water’s executive management team is comprised of experienced professionals committed to achieving our corporate and strategic objectives. Led by Managing Director, Neil Brennan, the team is accountable to the Board and consists of General Managers in five areas:
• Customer and Community Relations
• Strategy and Planning
• Capital Program Delivery
• Business Services, and
• People and Culture.
Neil Brennan, Managing Director – July 2012Neil commenced as Managing Director of Western Water in July 2012. Prior to his appointment, Neil was Managing Director of Central Highlands Water for 15 years. He previously held CEO positions at Western Water and Macedon Region Water Authority. Neil has been employed in the Victorian water industry for 34 years and has had various Ministerial appointments to industry committees.
Neil is currently a Director of the Board of the Energy and Water Ombudsman Scheme Victoria, Executive Council Member of the Institute of Water Administration, and Chair of the Victorian Water Industry’s Intelligent Water Networks Executive. Neil’s academic achievements include a Graduate Diploma in Management, a Master’s degree in Business Leadership, and completion of the Oxford Advanced Management Programme.

9 GOVERNANCE AND ORGANISATIONAL STRUCTURE
CHART 1: ORGANISATIONAL CHART AS AT 30 JUNE 2017
Melissa Jeal Company Secretary
Libby Hasler General Manager People & Culture
Julie Williams General Manager Business Services
FinanceRegulation & Governance
Risk
Robert Murphy General Manager Capital Program
Delivery
Capital DeliveryLand Development
Commercial Services
Planning Renewable Resources
Information Technology
Business Performance Asset Integrity
Livia Bonazzi General Manager
Strategy & Planning
Graham Holt General Manager
Customer & Community
Relations
Customer Relations Communications
Field ServicesKey Accounts
Water Systems
Employee Relations
Leadership & Development
OH&S
Neil Brennan Managing Director
Board
Board CommitteesAudit & Risk Committee
Investment Review Committee People & Culture Committee
Community Engagement Committee

10 WESTERN WATER ANNUAL REPORT 2016/17
BOARD, COMMITTEE MEMBERSHIP AND ROLES
Board of DirectorsA Board of Directors, supported and advised by the Executive, is appointed by the Minister to set Western Water’s strategic direction and policies.
Board Directors are appointed with an appropriate mix of skills, experience and expertise, and a range of backgrounds, to meet our objectives.
One Board Director resigned during the reporting period to take up the position of Chair at another Corporation – Joanne Anderson (Deputy Chair October 2015–August 2016).
We acknowledge Joanne’s contribution to Western Water and its customers.
The current Directors of the Western Water Board are:
Terence (Terry) Larkins DipBus, PSM, JP, Chair – October 2015Terry has extensive experience as a CEO in the local government and health sectors, including the Macedon Ranges. His experience also extends to the water sector where he was a past Chair of Western Water, and a Board member of Melbourne Water and the Victorian Water Industry Association (including Chair for two years).
Terry is currently a Board member of Doutta Galla Aged Services, Victorian Local Government Association (currently Vice Chair), and Northern Melbourne Regional Development Australia and Chair of Metropolitan Partnerships - Northern Partnership. Locally, he is on the Board of Macedon Ranges Further Education Centre and the Mount Macedon Memorial Cross Reserve. He has a long-standing involvement in the local community.
Russell Anderson BComm, ACA, GIA (Cert), MAICD – October 2007Russell has extensive experience in financial management, governance, risk management and auditing gained from senior governance roles at Air New Zealand, the CSIRO, PricewaterhouseCoopers and the Qantas Group.
Russell is actively involved in ensuring sustainability principles are adopted in corporate governance frameworks in the public and private sectors. He has provided independent governance reporting to listed public companies and government authorities incorporating financial and strategic risk analysis, and is currently a director of public sector and not-for-profit bodies in the sustainability sector.
Dr Jane Doolan, BSc (Hons), PhD, MAICD, Deputy Chair – October 2013Jane is currently the Environment Commissioner at the Australian Productivity Commission. Previous positions she has held include Professorial Fellow in Natural Resource Governance at the University of Canberra, Chair of the Murray-Darling Freshwater Research Centre and Deputy Secretary for Water in the Victorian Department of Environment and Primary Industries. She has more than 27 years’ experience in the sustainable management of catchments and water resources. She was also a Commissioner with the National Water Commission and was a Director with eWater Ltd.

11
Llewellyn Prain BA (Hons), LLB (Hons), GAICD – October 2015Llewellyn has worked as a commercial litigation lawyer and in senior roles at a number of government agencies. Through her firm, PrainWriting, she helped develop public policy in a range of areas, including health, public transport and equal opportunity. She is currently a Director of the Royal Victorian Eye and Ear Hospital, the Public Transport Ombudsman of Victoria and the Disability Services board. She was an inaugural Director of cohealth, one of the largest community health organisations in Australia, and is a past Chairperson of the Western Region Health Centre. Llewellyn is currently completing the Williamson Community Leadership Program.
Michael McGarvie BA, LLB, GAICD – October 2015Michael is currently Victorian Legal Services Commissioner and Chief Executive Officer of the Legal Services Board, the regulator of the Victorian legal profession. During his private sector legal career, he was a solicitor, then partner at the law firm, Holding Redlich for 23 years.
Michael was then appointed the Chief Executive Officer of the Supreme Court of Victoria from 2006–2009. Michael is also a Graduate in Strategic Management of Regulatory and Enforcement Agencies from the John Kennedy School of Government, Harvard, and a graduate of the Australian Institute of Company Directors.
Russell Walker DipBus (Acc), GradDip (Govt Acc), FCPA, MAICD – October 2015Russell has extensive experience in both the not-for-profit and public sectors. He was Assistant Auditor-General of Victoria (a position he held for 20 years), a Commissioner on the Victorian Commission of Audit, and has undertaken a number of consultancies, including for the Victorian Parliament’s Public Accounts and Estimates Committee.
Russell is currently Board Member and Audit and Risk Committee Chair of Macedon Ranges Health. Russell has also been a past President of Guide Dogs Victoria, Board Member of the Royal Guide Dogs of Australia, Board Member of Coliban Region Water Corporation from 2010 to 2015, serving as Deputy Chair of the Board and Audit and Risk Committee Chair, and Chair of a Western Bulldogs Football Club major fundraising group. Russell is an active member in the local community and is currently Vice President of the Gisborne and District Lions Club and board member of the Gisborne and District Bowling Club.
Rosa McQuilten DipT, BEd – December 2015Rosa is a mathematics and literacy consultant with a long and distinguished career in education. With family, she established and developed a central Victorian vineyard which produced high quality red wines. Rosa has extensive experience in small business management, workplace risk management, community aged care including resident advocacy.
Rosa has a Diploma of Teaching and a Bachelor of Education.
GOVERNANCE AND ORGANISATIONAL STRUCTURE

12 WESTERN WATER ANNUAL REPORT 2016/17
Board committeesWestern Water has four Board committees to assist in carrying out its corporate governance functions:
• Audit and Risk
• People and Culture
• Investment Review, and
• Community Engagement.
Each Board committee is chaired by a Board Director and operates under approved terms of reference. Committee members are chosen for their skills, experience and other relevant qualities. Board committees are entitled to resources and information required to fulfil their responsibilities.
This includes access to Western Water staff and the Managing Director, members of the Executive and other staff, who attend committee meetings as required. All Board Directors receive committee agendas and can attend all meetings, subject to reviewing any conflict of interest requirements.
A verbal report by the Chair of each committee is presented at each Board meeting and all committee minutes are circulated to Board Directors.
Audit and Risk CommitteeThe Audit and Risk Committee assists the Board in fulfilling its responsibilities by reviewing all matters related to corporate finance, auditing functions, review of financial statements and accounting policies. The committee also considers compliance with legislation and other activities and procedures, including insurance and risk management.
Its independent members are:
• Russell Walker (Chair)
• Russell Anderson, and
• Terry Larkins.
The Audit and Risk Committee met six times during the year.
People and Culture CommitteeThis committee reviews remuneration and performance arrangements of executives and terms of employment for all employees.
Its members are:
• Terry Larkins (Chair)
• Jane Doolan
• Llewellyn Prain, and
• Russell Walker.
The People and Culture Committee met three times during the year.
Investment Review CommitteeThe Investment Review Committee provides strategic input into Western Water’s Capital Works Plan and monitors implementation of the plan in accordance with timeframes and budgets.
Its members are:
• Russell Anderson (Chair)
• Terry Larkins
• Jane Doolan, and
• Russell Walker.
The Investment Review Committee met twice during the year.
Community Engagement CommitteeThe Community Engagement Committee supports the Board with effective, open and transparent processes under which Western Water engages customers and the community in its planning processes to ensure the services it provides reflect the needs and expectations of customers and the community.
Its members are:
• Llewellyn Prain (Chair)
• Terry Larkins, and
• Rosa McQuilten.
The Community Engagement Committee met three times during the year.

13
Board and committee meeting attendanceThe Board has eleven scheduled meetings each year, with additional meetings convened as required.
TABLE 4: BOARD MEETING AND COMMITTEE MEETING ATTENDANCE
Board Director BoardAudit and Risk
Committee
People and Culture
Committee
Community Engagement
Committee
Investment Review
Committee
Terry Larkins (Chair from Oct 2015) 11/11 5/6 3/3 3/3 2/2
Joanne Anderson (Deputy Chair from Jul 2016 to Aug 2016) 2/2 2/2 - 1/1 -
Russell Anderson 11/11 6/6 - - 2/2
Jane Doolan (Deputy Chair from Oct 2016) 10/11 - 2/3 - 1/2
Llewellyn Prain 10/11 - 2/3 3/3 -
Michael McGarvie 10/11 - - - -
Russell Walker 11/11 6/6 3/3 - 1/2
Rosa McQuilten 11/11 - - 2/3 -
Neil Brennan (Managing Director) 9/11 5/6 * 3/3 * 1/3 * 2/2 *
* The Managing Director attended but is not a member of the Committee.
GOVERNANCE AND ORGANISATIONAL STRUCTURE

14 WESTERN WATER ANNUAL REPORT 2016/17
HUMAN RESOURCE MANAGEMENT
WorkforceWestern Water is committed to using merit and equity principles in its staff appointments. Its selection processes guarantee applicants are assessed and evaluated fairly and equitably on selection criteria and other accountabilities, without discrimination.
Western Water’s values of People, Integrity, Respect, Teamwork and Excellence are combined with the Corporation's employment principles which are critical to maintaining and improving the performance of the workforce. Policies and practices are in place to ensure the business constantly strives to uphold the principles of equal opportunity, employee diversity and work-life balance and flexibility. These include the People & Culture Policy, Recruitment and Selection, Procedure, Occupational Health and Safety Policy, and Equal Opportunity, Anti-Discrimination, Harassment and Bullying Policy.
Western Water has been very successful at achieving gender balance in the workforce.
Diversity and inclusionThe Western Water People and Culture Strategy has laid the foundation for diversity and inclusion. Western Water also has a Diversity and Inclusion Action Plan in place. We are committed to an environment of fair and equitable practices, with leaders that enable and actively support diversity and inclusion.
Western Water is a leader in relation to gender equity, and achievements during 2016/17 as well as further projections through to 2020 include:
• gender balance on the Board of Directors and the Executive Management team
• improved support for those with a disability, improved gender balance throughout our workforce, improved cultural awareness, and increased employment of Aboriginal or Torres Strait Islander people
• participation in the Women in Water Leadership Program, and
• further engagement of staff and a positive response to the Diversity and Inclusion Action Plan.
Training and career developmentEmployees at Western Water are supported through training and development, performance management and recognition programs to fully develop their potential and deliver leading services to customers.
In 2016/17, the training budget represented 2.5% of its payroll.
Identified as a key strategic driver, the Corporation is making a considerable commitment to building a culture of excellence and strengthening leadership capability across the business.
Comparative workforce dataWestern Water aims to attract, engage, develop and retain talented and committed employees.
At 30 June 2017, 161 full-time equivalent staff were employed in a variety of roles including professional, technical, trade and administration. The employee base includes all permanent, casual and temporary employees, excluding Board Directors.
Not taking vacancies into account, the total employee base increased by 10 from the prior year. Of total employees, 42% are female.
TABLE 5: WORKFORCE COMPOSITION BY FUNCTION
2015/16 2016/17Male Female Male Female
Board Directors 4 4 4 3
Managing Director/ General Managers 3 3 3 3
Managers 11 7 12 7
Operational, administration and field staff 76 60 82 62
Total * 94 74 101 75
Full time equivalent employees 90 61 97 64
* Total includes Board Directors.

15
TABLE 6: WORKFORCE DEMOGRAPHIC DATA
All employees Ongoing Fixed term and casual
June 2017 Number
(Headcount) FTEFull-time
(Headcount)Part-time
(Headcount) FTENumber
(Headcount) FTE
DEMOGRAPHIC DATA
Gender
Male 97.00 97.00 84.00 0.00 84.00 13.00 13.00
Female 72.00 64.38 39.00 25.00 57.34 8.00 7.04
Age
15-24 6.00 6.00 4.00 0.00 4.00 2.00 2.00
25-34 30.00 29.10 25.00 2.00 26.47 3.00 2.63
35-44 39.00 37.00 31.00 7.00 36.00 1.00 1.00
45-54 58.00 54.87 39.00 10.00 46.46 9.00 8.41
55-64 30.00 28.73 21.00 4.00 23.73 5.00 5.00
65+ 6.00 5.68 3.00 2.00 4.68 1.00 1.00
CLASSIFICATION DATA
Western Water Bands 2-8
Band 2 0.00 0.00 0.00 0.00 0.00 0.00 0.00
Band 3 11.00 10.53 10.00 0.00 10.00 1.00 0.53
Band 4 49.00 45.56 37.00 11.00 44.56 1.00 1.00
Band 5 28.00 27.19 22.00 4.00 25.19 2.00 2.00
Band 6 28.00 26.72 21.00 6.00 25.72 1.00 1.00
Band 7 17.00 16.47 15.00 1.00 15.84 1.00 0.63
Band 8 8.00 8.00 8.00 0.00 8.00 0.00 0.00
Senior employees
SEO 19.00 18.03 10.00 3.00 12.03 6.00 6.00
GSERP 9.00 8.88 0.00 0.00 0.00 9.00 8.88
Total employees 169.00 161.38 123.00 25.00 141.34 21.00 20.04
GOVERNANCE AND ORGANISATIONAL STRUCTURE

16 WESTERN WATER ANNUAL REPORT 2016/17
Executive officer disclosuresAt 30 June 2017, Western Water’s executive officers comprised:
• seven Board Directors
• Managing Director
• five General Managers
• three Senior Managers, and
• Company Secretary.
The number of executive officers remained the same as the prior year. There were no positions vacant at 30 June 2017. Remuneration received, or due and receivable from Western Water in connection with the management of Western Water, by executive officers totalled $2,075,000. Full executive officer disclosures including retirement benefits, other related party transactions and payments to other personnel can be found in Note 9 of the financial statements.
OCCUPATIONAL HEALTH AND SAFETYConsultation is a significant feature of Western Water's commitment to providing a healthy and safe workplace for employees, contractors and the broader community. The Corporation holds monthly Occupational Health and Safety (OH&S) committee meetings, as well as pre-start toolbox meetings to improve and maintain a safe work environment.
Western Water’s OH&S training program is aligned with its safety strategy and has a strong emphasis on prevention and early intervention, while aiming to return injured workers to work as soon as possible.
Key safety messages are reinforced across the business through safety alerts, the intranet, policies and procedures and onsite toolbox meetings.
To support this, details of Western Water’s OH&S policy, its OH&S committee members and OH&S meeting minutes are displayed on worksite noticeboards and the intranet as well as being shared at monthly team meetings.
An independent survey by RSM, auditors of Western Water's field based teams was conducted in February 2016 and found 73% of staff believed
management “mostly” and “always” consulted staff on safety issues and initiatives. No respondents indicated Western Water “never” consulted staff.
Positive OH&S outcomes during 2016/17 include:
• Western Water's safety program was audited twice in this period. It achieved a strong result for its current OH&S system through an AS4801 surveillance audit which found no non-conformance events. At the direction of Western Water's Audit and Risk Committee, RSM Auditors conducted an audit to verify OH&S data provided to management and its chemical handling, storage, training and management program. Recommendations were made and there were no non-conformances identified
• implementation of a new contractor management compliance database which halved the number of contractors while improving their compliance
• Western Water adopted three lead and three lag indicators from the Water Services Association of Australia's (WSAA) health and safety benchmarking project. Lead indicators flag potential future occurrences that might require action and/or monitoring, while lag indicators track events after the fact. Western Water will report these indicators into the WSAA national benchmarking tool for future comparisons, and
• the Western Water OH&S team attended Return to Work coordinator training.
Workplace OH&S reporting There were 31 reported incidents in 2016/17. During the reporting period, Western Water applied the WSAA Health and Safety Benchmarking definitions for workplace incidents. This national framework approach will allow Western Water to better benchmark its safety performance against its peers. It is expected the application of the new definitions will have minimal impact on data. Of the 31 incidents:
• 4 were lost time injuries - two trips and/or falls, one vehicle incident and one manual exertion incident
• 18 were minor injuries requiring first aid or medical treatment, and
• 9 were near misses.

17 GOVERNANCE AND ORGANISATIONAL STRUCTURE
TABLE 7: WORKPLACE INCIDENTS
2012/13 2013/14 2014/15 2015/16 2016/17
Workplace incidents 29 15 30 18 31
There were 40 hazards associated with the incidents identified. To reduce manual exertion injuries Western Water continually provides staff with dedicated training by qualified physiotherapists in correct lifting techniques. This is scheduled to occur again in September 2017. Western Water reduced its manual handling risk profile with the introduction of two purpose built hydro excavation trucks in the previous financial year, which continue to be used.
WorkCover claimsStandard WorkCover claims increased by three to five this year while the number of minor claims decreased by one to five. The total number of new standard claims for 2016/17 is one more than the five-year average.
TABLE 8: WORKCOVER CLAIMS
2012/13 2013/14 2014/15 2015/16 2016/17
New standard* claims 6 5 5 2 5
New minor claims 13 5 2 6 5
Total 19 10 7 8 10
* For a claim to be classified as a standard claim it must exceed a threshold of $692 of medical payments or ten days’ lost time. Any claim that falls below these thresholds is classified as a minor claim.
WorkCover lost daysDuring the reporting period, the number of WorkCover lost days decreased to 75 compared to 81 the previous year. Of lost days in the reporting period, 33 related to an injury that occurred in the previous year.
The 2016/17 figure compares favourably to a five-year average of 85 lost days but is still higher than the lowest number of 32 lost days achieved in 2014/15.
The average number of lost days per injury over the five-year period was 26 days. In 2016/17, the average lost days per injury was 18 days. Western Water is proactive in returning injured employees back into the workforce and key staff attended Return to Work training.
Programs addressing risks include:
• one-on-one training on lifting technique reviewed through filming and focusing on lift avoidance and assessment
• design and procurement programs focused on manual exertion assessment and reduction, and
• improved focus and reporting of hazards and near misses allowing for proactive improvements and targeted alignment of programs.
TABLE 9: WORKCOVER LOST DAYS
2012/13 2013/14 2014/15 2015/16 2016/17
Lost time injuries 2 2 3 5 4
Lost time injury days 135 118 33 81 75
WorkCover premiumsWorkCover premiums increased by $34,516 or 36% in 2016/17 from the previous financial year. Premiums are calculated from the application of industry rates and claims made between 1 January 2014 and 30 June 2017, reflecting the claim history within that period.
Claims reported after 30 June 2017 are not used in this year’s premium, but form part of the claims history and will affect future premiums. To further reduce the WorkCover premium, Western Water is working to reduce injuries and return injured workers to meaningful work as quickly as possible.
TABLE 10: WORKCOVER PREMIUMS ($)
2012/13 2013/14 2014/15 2015/16 2016/17
Premiums 228,984* 199,509* 172,395* 95,404* 129,920*
* This figure excludes GST and is the certified premium.
** Excludes GST and is the WorkSafe generated estimate.
*

18 WESTERN WATER ANNUAL REPORT 2016/17
OPERATIONS REPORT
WATER CONSUMPTION AND DROUGHT RESPONSE
Reservoir levelsMost of Western Water’s service region is supplied by three major supply sources - Rosslynne Reservoir near Gisborne, Merrimu Reservoir near Bacchus Marsh and the Melbourne system.
During 2016/17, 24% of all drinking water supplied was sourced from local reservoirs compared to 60% the year before. The balance was sourced from the Melbourne system. This allowed water levels in local reservoirs to recover.
High rainfall during the year resulted in the storage levels in Rosslynne, Merrimu and other local reservoirs increasing from a combined total of 12% to 47%.
Total drinking water consumptionWater consumption in Western Water's service region decreased by 4% to 13,775 million litres during 2016/17 compared to 14,357 million litres the previous financial year.
The service area population was recently recalibrated following the release of Australian Bureau of Statistics Census 2016 data. With an average of 2.6 persons per household the population is calculated at 153,358, a decrease from the estimated 163,400 the previous year.
Despite the decrease in the population, the wetter than average spring resulted in per capita daily residential consumption decreasing from 204 litres in 2015/16 to 189 in 2016/17.
Average daily drinking water consumption across the region is shown in Table 13.
Consumption by districtConstant monitoring of water consumption at the town level and, in some cases, smaller district areas within towns, allows Western Water to be continually aware of its region's water demand. This comprehensive data can alert Western Water to sudden changes in demand which can indicate bursts or leaks within the reticulation system. Consumption of recycled water is also monitored and included in Table 14.
TABLE 11: MAJOR RESERVOIR LEVELS (% CAPACITY)
2007/08 2008/09 2009/10 2010/11 2011/12 2012/13 2013/14 2014/15 2015/16 2016/17
Rosslynne Reservoir 3% 3% 5% 66% 72% 85% 76% 44% 15% 38%
Merrimu Reservoir 13% 10% 9% 85% 78% 76% 63% 29% 10% 50%
TABLE 12: REGIONAL WATER CONSUMPTION (ML) AND POPULATION
2007/08 2008/09 2009/10 2010/11 2011/12 2012/13 2013/14 2014/15 2015/16 2016/17
Consumption (ML) 10,730 10,719 10,592 10,251 11,260 12,830 12,648 13,101 14,357 13,775
Population 134,810 139,730 144,948 150,664 155,431 158,290 159,813 161,447 163,401 153,358
TABLE 13: AVERAGE DAILY HOUSEHOLD DRINKING WATER CONSUMPTION (ML)
Jul Aug Sep Oct Nov Dec Jan Feb Mar Apr May Jun
Daily consumption (ave) 25 24 25 25 31 35 38 36 35 27 25 24
Monthly consumption 777 733 757 780 920 1,088 1,170 997 1,088 798 760 716

19
20,000
15,000
10,000
5,000
Consumption (ML)
0
2007
/08
2008
/09
2009
/10
2010
/11
2011
/12
2012
/13
2013
/14
2014
/15
2015
/16
2016
/17
120,000
140,000
160,000
180,000
100,000
Population
2007
/08
2008
/09
2009
/10
2010
/11
2011
/12
2012
/13
2013
/14
2014
/15
2015
/16
2016
/17
CHART 3: SERVICE AREA POPULATION CHART 2: WATER CONSUMPTION (ML)
OPERATIONS REPORT
Non-revenue water and real water losses Non-revenue water – including real water losses – is calculated and reported each customer billing period, three times a year. The calculation methodology is aligned with the guidelines in the National Performance Framework. A summary of water supplied and consumption – including real water losses for 2016/17 of 726 ML, down from 811 ML the previous year – is shown in Table 15.
Addressing water losses is a key component of Western Water’s efficiency approach to reduce costs and guarantee future supply. Total estimated non-revenue water for the supply system in 2016/17 was 8.9% of water consumption, a minor reduction from 9.1% recorded the previous year. Real losses (i.e. bursts and leaks from the supply system) are estimated at 5.3% of total consumption, as shown in Table 16, a slight reduction from the prior year’s results of 5.6%.
TABLE 14: WATER CONSUMPTION (ML) BY DISTRICT
Bacchus Marsh
Sunbury/ Macedon
RangesMelton/
EynesburyRomsey/
Lancefield Total
Residential water customers 8,182 24,319 24,088 2,529 59,118
Residential water consumption (ML) 1,663 4,124 4,360 437 10,584
Residential per capita consumption (litres/person/day) 213 180 191 183 189
Non-residential water customers 493 1,516 938 169 3,116
Non-residential water consumption (ML) 310 768 812 81 1,971
Annual real water losses (ML) 114 283 299 30 726
Non-revenue water (ML) 192 476 502 50 1,220
Total annual consumption (ML) 2,164 5,367 5,675 569 13,775
Average annual consumption (7 years)* (ML) 1,989 5,438 5,347 568 13,342
Recycled water consumption (ML) 273 4,178 4,067 301 8,819
* Average calculated for the seven financial years to 30 June 2017

20 WESTERN WATER ANNUAL REPORT 2016/17
Table 16 shows annual values for non-revenue water and real losses over the past five years as a proportion of drinking water consumption. The variations over the five years are associated with demand, climate impacts, particularly hot dry climate, and leakage reduction efforts including asset replacement and new infrastructure.
Corporate water consumptionIn 2016/17, Western Water's corporate water consumption increased to 604,000 litres from 529,000 litres the previous year, correlating with an increase in full-time equivalent (FTE) staff members.
This data is based on water used at Western Water’s Sunbury administration office and does not include consumption at any other site such as depots, treatment plants or sewer infrastructure.
The Corporation shares its Sunbury office's water meter with other tenants in the building and its share is calculated on the proportion its staff occupies. Increased usage per person at Western Water may not reflect actual behaviour as it can
be influenced by higher usage by other tenants, as well as greater numbers of visitors, contractors and consultants, who are not included in the Corporation's FTE figure.
In 2016/17, Western Water joined the Schools Water Efficiency Program (SWEP) to gain a better understanding of office water usage through improved resolution of water consumption data by digital metering.
To conserve drinking water, Western Water uses recycled water where possible to wash fleet vehicles, water gardens and for cleaning and other maintenance tasks, at its seven recycled water plants.
Bulk entitlements, transfers, groundwater and water shares Western Water has ten bulk entitlements providing it rights to use and supply water. Bulk entitlement agreements specify rules regarding the timing, location, type and amount of water that can be taken from streams, reservoirs and headworks.
TABLE 15: REAL WATER LOSSES CALCULATION (ML)
2015/16 2016/17
Operational use by Western Water (metered & unmetered) 119 134
Firefighting use (estimated) 92 90
Unauthorised consumption & meter errors (estimated) 281 270
Annual real losses 811 726
Total non-revenue water 1,303 1,220
TABLE 16: NON-REVENUE WATER AND REAL WATER LOSSES (% OF TOTAL CONSUMPTION)
2012/13 2013/14 2014/15 2015/16 2016/17
5 years performance
average
Non-revenue water 12.9% 9.0% 11.2% 9.1% 8.9% 10.2%
Real water losses 8.4% 5.5% 7.8% 5.6% 5.3% 6.5%
TABLE 17: OFFICE BASED WATER CONSUMPTION (KL)
2012/13 2013/14 2014/15 2015/16 2016/17
Water consumption (kL) 395 428 488 529 604
Full time equivalent (FTE) staff 108 105 100 104 118
Water consumption (kL) per year per FTE staff 3.7 4.1 4.9 5.1 5.1

21
Most of the local water sourced for the Western Water region is supplied through bulk entitlements to the two major local reservoirs - Merrimu Reservoir, near Bacchus Marsh, and Rosslynne Reservoir, near Gisborne. Both reservoirs are owned and operated by Southern Rural Water. Western Water has entitlements from several smaller local reservoirs.
Western Water also has an entitlement to access water from the Melbourne Headworks system, which was critical during the Millennium Drought. With demand increasing and water availability from local sources declining, Western Water will be more reliant on supplying major towns in its service area from the Melbourne system in the future.
The Bulk Entitlements Report in Appendix 2 provides details about water sourced by Western Water and its compliance with the ten bulk entitlements, as well as transfers and related topics.
The business supplements its surface water supplies through two operational groundwater bores in Lancefield and Romsey. Groundwater is supplied in compliance with Take and Use Licenses issued to Western Water and their use is closely monitored through a network of monitoring bores which allow the Corporation to determine any impact on the greater aquifer.
WATER QUALITYAll areas of the drinking water distribution network were compliant with requirements of the Safe Drinking Water Act 2003 and the water quality parameters specified in the Safe Drinking Water Regulations 2015 (SDWR), except for the following:
• Sunbury, Lerderderg and Romsey distribution systems which had one E.coli detection event each which did not meet the SDWR requirement, and
• the Riddells Creek/Mt Macedon distribution system which did not meet the SDWR requirements for Total Trihalomethanes in one month.
In February 2017, Western Water passed an external hazards and critical control points (HACCP) audit for drinking water quality and, in June 2016, passed the Department of Health and Human Services (DHHS) drinking water quality audit. When supply system changes occur, Western Water ensures customer needs are addressed through communications and increased quality monitoring. Tank integrity improvements were made during the reporting period and additional water quality improvement projects for the distribution network are planned for 2017/18.
WATER EFFICIENCY
Major non-residential water users Non-residential customers make up 5.0% of Western Water’s customer base and account for 14.3% of water consumption. There are no customers in the service region that would be categorised as major water users under the DELWP’s definition of exceeding 200 million litres of drinking water consumption per year.
Western Water’s two largest non-residential water customers are ABMT Textiles and Saizeriya Australia which respectively used 74.5 million litres and 94.4 million litres of drinking water in the past year. Western Water works closely with all large non-residential water users to optimise their water consumption, as illustrated in Table 18, while offering alternative water solutions where suitable.
OPERATIONS REPORT
TABLE 18: LARGE NON-RESIDENTIAL CUSTOMER PARTICIPATION IN WATER CONSERVATION PROGRAMS
Large non-residential water user Water conservation actions
ABMT Textiles, Melton ABMT continue working towards cleaner production strategies as well as other general improvements. Western Water is working with ABMT to progress the implementation of modified trade waste treatment processes. In association with Victoria University and Western Water, ABMT are committed to implementing an innovative treatment process to capture the salt and water for reuse within the process. Technical challenges are slowing the project but the three partners remain committed to finding solutions.
Saizeriya Australia, Melton
Saizeriya is implementing opportunities to minimise waste and water consumption, as identified in its waste management and cleaner production plan. They are also participating in research with Western Water to identify other water efficiency opportunities and are considering involvement in a potential waste to energy program.

22 WESTERN WATER ANNUAL REPORT 2016/17
Other water efficiency activitiesKey activities addressing water efficiency with major customers during 2016/17 include:
• Western Water continued to take a lead with the Intelligent Water Networks (IWN) program investigating innovative technology for the Victorian water industry. The IWN focus is on delivering services safely and efficiently with minimal impact to customers. Collaboration with other corporations allows technologies to be trialled in a variety of circumstances
• ongoing development of the market for recycled water. Currently Western Water supplies 119 properties with recycled water for non-residential uses. Locally sourced recycled water will provide a resilient water supply, supporting commerce and industry across the region, economic development and job creation, and
• continuing rollout of a nodal monitoring program to establish key water and sewer real-time monitoring locations across all serviced towns.
ENVIRONMENTAL SUSTAINABILITY
Sustainable water use Western Water’s Urban Water Strategy (UWS) and Integrated Water Management (IWM) Strategy outline the Corporation's approach to water planning and management to safeguard future water resources. The strategies provide a platform to collaborate with regional partners and implement actions that contribute value to the community.
Western Water UWS strategic priorities can be summarised as:
• providing an ongoing and adaptive engagement framework for the changing community
• ensuring affordability for customers
• building a flexible and diverse water supply portfolio, and
• maximising opportunities to extend the water, sewer and recycled water grids.
As part of the UWS, an implementation plan has been developed to align with a strategic pathway. Over the coming year, Western Water will begin
the process of delivering these actions to ensure the future water demands of the region are met. Sourcing water from the Melbourne Headworks system will remain an integral component of Western Water’s supply solution.
Significant sustainable water achievements during 2016/17 include:
• commencement of the implementation of the Sunbury Integrated Water Management Assessment (IWMA) outcomes
• completion of the Bacchus Marsh and Woodend IWMAs
• completion of a trial bore at the Melton Recycled Water Plant to further investigate the opportunities to utilise the aquifer for storage of recycled water, including capacity and water quality
• collaboration with local councils to map out critical open spaces that need to be included in a drought preparedness plan, and
• completion of an Urban Water Strategy outlining potable and alternative water supply and sewerage management strategies for the next 50 years.
Recycled water Western Water’s seven recycled water plants converted 9,142 million of litres of sewage into 12,170 million litres of recycled water, of which 72% was re-used. The amount of recycled water produced is higher than the sewage inflow due to the volume of recycled water used within the treatment process at its plants in Melton, Gisborne and Sunbury.
A total of 8,819 million litres were recycled, of which 4,979 million litres were used by customers. This saved about 4,788 million litres of drinking water where recycled water was substituted for non-potable purposes. Overall, recycled water use is equal to more than 37% of total drinking water consumption in the region, excluding water losses.
The number of recycled water customers increased significantly in the reporting period, with strong growth in the number of residential customers using Class A recycled water for such purposes as toilet flushing. More than 1,700 customers now have recycled water supplied to dwellings in Eynesbury and Toolern.

23
Western Water also has 119 non-residential, recycled water customers (Classes A, B and C) including industrial, recreational, agricultural, local government and construction businesses.
During the year, Western Water collaborated with local councils to map out critical open-spaces that need to be included in a drought preparedness plans. This will enable water security and liveability values to be maintained throughout drought and dry periods.
Highlights of Western Water’s recycled water program in 2016/17 include commencing:
• the Western Irrigation Network (WIN) Feasibility Study which, with significant support at federal, state and local government levels, will assist future recycled water customer supply scheme extensions supporting agriculture and liveability
• Sunbury IWMA including the appointment of a project manager to further investigate and implement the Sunbury assessment recommendations
• expansion of the Romsey Recycled Water Plant's farm to expand beneficial use of recycled water
• concept design of an interconnecting pipeline between the Melton and Bacchus Marsh Recycled Water Plants to transfer recycled water from both sources to service customer demand, while providing a wet weather outlet for recycled water produced at the Bacchus Marsh plant
• concept design for a pipeline to supply up to 1000ML of recycled water for agricultural uses close to the Melton Recycled Water Plant
• expansion of the Eynesbury Class C recycled water scheme to provide additional irrigation infrastructure, and
• concept design of a new winter storage at the Melton Recycled Water Plant to manage increasing recycled water volumes.
Projects completed in 2016/17 include:
• Urban Water Strategy outlining potable and alternative water supply and sewerage management strategies for the next 50 years
• Bacchus Marsh Integrated Water Management Assessment recommending increased recycled water supply for local agricultural and industrial uses in the Bacchus Marsh and Parwan areas
• Woodend Integrated Water Management Assessment recommending increased supply of recycled water to customers and continued supply of recycled water to local waterways
• an investigation into the feasibility of an irrigated agriculture scheme in Toolern. The findings are being incorporated into the WIN Feasibility Study
• a trial bore at the Melton Recycled Water Plant to further investigate the potential of using the aquifer for recycled water storage
• connection of a major recycled water customer on the Riddells Creek Recycled Water Plant scheme using up to 30 million litres of recycled water a year for agricultural purposes, and
• capability assessment of land surrounding the Melton Recycled Water Plant to enable the expansion of the plant's farm to manage additional recycled water volumes.
There were also separate continuing investigations into using recycled water to supplement flow shortages in both the Werribee River and Jacksons Creek, and into harvesting stormwater, particularly in new growth areas planned for Sunbury.
OPERATIONS REPORT
TABLE 19: RECYCLED WATER VOLUME PRODUCED AND USED
2012/13 2013/14 2014/15 2015/16 2016/17
Recycled water (ML) 7,494 7,628 7,500 10,848 12,170
Recycled water used (ML) 5,021 5,042 5,569 8,956 8,819
Recycled water used (%) 67% 66% 74% 83% 72%

24 WESTERN WATER ANNUAL REPORT 2016/17
Sustainable and resilient water services systems The Corporation ensures a sustainable and resilient water services system through its consultative and collaborative approach with regulators and stakeholders. It engages the community and others in its integrated water management philosophy while encouraging all to make the most of local water resources.
In 2016/17, Western Water undertook the following activities to build on its existing sustainable resilient water services systems:
Working with customers and communityThe business has a comprehensive customer and community engagement structure, including a well-established, online customer panel, project-based community consultation groups, regular speakers at formal and informal meetings, and social media.
This framework builds an understanding about the Corporation's business, while guiding interaction with customers, enhancing community input into decision making, and gathering feedback from customers and the wider community.
This engagement approach has ensured more than 3,400 customers have been engaged in the development of Western Water’s Price Submission 2018-2023.
Community Engagement Reference Group
This group - consisting of three Board directors, along with customer and community representatives -provides a direct link between the business and the community. It helps Western Water effectively engage with its customers and strengthen relationships with the community on important strategic and operational matters.
Indigenous engagement
Western Water publicly acknowledged the region’s Wurundjeri Traditional Owners by installing a plaque at the entrance to its Sunbury head office and commissioning an artwork by a local Wurundjeri artist to hang in the office foyer.
Western Water is involved in a joint Melbourne metropolitan water industry working group for Indigenous engagement. The working group has met with each of the Traditional Owners on whose country the water corporations operate. Each meeting was invaluable in helping the water corporations better understand the operational landscape, in particular the aspirations and challenges of each of the Traditional Owner groups.
Staff attended cultural immersion training with the Wurundjeri Tribe. Knowledge gained from this training is being shared across the business.
When undertaking capital works, the Corporation uses contractors with an extensive awareness of the Aboriginal cultural significance of waterways.
Online engagementMore than 20,000 customers are connected to Western Water through its online groups, including social media followers and online panel members during the reporting period. These online channels are vital to keep customers informed and engaged in Western Water's decision-making.
In early 2017 Western Water launched the Water Matters consultation site to enhance online engagement and provide greater opportunities for two-way communication.
Education and community relationsAlmost 8000 pre-school and primary school students took part in Western Water's educational presentations during the reporting period. The organisation's trained educators shared information about water conservation, water for health and the water cycle as part of the organisation's long-standing commitment to water education. In addition, more than half of the area's 60 schools take part in the Schools Water Efficiency Program - one of the highest levels of involvement in Victoria.
Choose Tap Choose Tap encourages the community to drink tap water instead of bottled water. Western Water promotes this message in cafes, businesses, local government and sporting clubs. In addition, we are working with councils to provide drinking fountains in parks and shopping strips. The Choose Tap message will also contribute to reducing the use of bottled water and landfill.

25
Sustainable water use – Target 155
Western Water's customers are being encouraged to limit their water consumption to 155 litres per person per day, in line with the State Government's Target 155 campaign.
The organisation promotes sustainable drinking water messages focusing on drinking tap water at community events through its Water Café and provides drinking water bottles as well as portable drinking water units at numerous community events throughout the year.
Sustainable gardening A key factor in extra water use by customers in recent years has been hot, dry summers causing people to increase garden watering.
Western Water provides a seasonal, electronic gardening newsletter - with local advice on sustainable gardening practices - to about 2000 gardening enthusiasts. This program supports customer interests identified during engagement.
GrantsWestern Water's grants program supports many schools, community and environment groups across the region to spread the message about water conservation and sustainability. In 2016/17, grants increased from $21,000 in 2015/16 to $31,660.
There were 10 grants totalling $19,660 to schools and preschools to develop gardens embracing water conservation through such things as water tanks, timed sprinklers, irrigations systems and plants.
Six grants totalling $12,000 were made to community or environmental groups for such projects as the development of an indigenous garden in the Riddells Creek Park, the conversion of an unused parking area in Romsey into an edible community garden, and an interactive and educational garden with sound sustainability principles in Woodend.
The grants support the development of more liveable communities across our service region.
OPERATIONS REPORT
TABLE 20: SCHOOL GARDEN GRANTS 2016
Recipient Project description $
Early Learning Kindergarten, Melton
Funding to support a wide range of water saving behaviours including a rainwater tank, buckets, watering cans and automatic taps.
2,000
Lancefield Kindergarten Funding establishment of a watering system, pump and timed sprinkler connected to rainwater tank.
2,000
Al Iman College, Melton South Funding a rain water tank as well as yard improvement and a kitchen garden project. 2,000
Melton South Primary School Funding a watering system connecting unused tanks to indigenous and other gardens. 2,000
Wedge Park Primary School, Melton
Funding to purchase a tank, irrigation system, 15 weed mats, soil and plants to develop vegetable gardens for whole school learning opportunities.
2,000
St Anne's Primary School, Sunbury
Funding to provide a water tank for a sensory garden. 2,000
Mount Macedon Primary School
Funding to install a herb garden via a gro-wall structure to complement existing vegie garden. 2,000
St Bernard's Primary School, Bacchus Marsh
Funding to purchase a tank, irrigation system, materials, fruit trees and vegetable boxes to support sustainable gardening program.
1,660
Staughton College, Melton South
Funding to develop an edible garden to support VCE and learnings across the curriculum. 2,000
Sunbury College Funding to purchase materials and tools for the Year 9 vegetable garden project. 2,000
Total school garden grants 19,660

26 WESTERN WATER ANNUAL REPORT 2016/17
Working with industry and local government
Intelligent Water Networks
Western Water continues to be a leader in the Intelligent Water Networks (IWN) program investigating pioneering technology of benefit to the overall Victorian water industry.
The work includes trials involving drones, pipeline robots and innovative new information technology systems, shared services and joint procurement.
The program aims to deliver services safely and efficiently with minimal impact to customers.
Town-based integrated water management plans
Stakeholder partnerships between Western Water and local councils, State Government (DELWP), other water corporations and industry groups, delivered the Integrated Water Management Assessments (IWMA) for the Bacchus Marsh, Woodend and the Toolern agricultural regions during 2016/17.
These ongoing partnerships are key to implementing recommendations from the management assessments for these areas, as well as the previously completed Sunbury and Melton Integrated Water Management Assessments.
During the reporting period, Western Water, in partnership with Melbourne Water, appointed a project manager to take the Sunbury IWMA to the implementation phase.
Recommendations from the Melton IWMA continue to be investigated through a collaborative approach with City West Water and Melbourne Water regarding the transfer of Class A recycled water and sewerage.
Integrated Water Management Assessments will be completed for the remaining Western Water towns where required in the following year, while environmental flow assessments are being completed through a collaborative approach with Melbourne Water and DELWP.
TABLE 21: COMMUNITY AND ENVIRONMENT GRANTS 2016
Recipient Project description $
Sunbury Community Health Funding to develop a disability-friendly fenced community play space between the Village Green and Sunbury Community Health Centre including sustainable water play area and wicking beds.
2,000
Woodend Neighbourhood House
Funding to develop an interactive and educational garden using sound sustainability principles at the front of Woodend Neighbourhood House in high visibility area, generating multiple related educational/social outcomes.
2,000
Riddells Creek Park Upgrade Funding to develop an indigenous garden in the town’s park. 2,000
Romsey Neighbourhood House
Funding to help convert unused car parking area into an edible community garden with raised beds, worm farm and a related mural on nearby wall.
2,000
Friends of Blind Creek/ Sunbury West Primary School
Funding to develop a Water.Life.Growth Environmental Education Day including educational information and environmental planting along Blind Creek.
2,000
Werribee River Association, Melton
Funding for promotional banners, stand, signs and materials to support the work of Werribee River Association.
2,000
Total community and environment grants 12,000

27
Council partnerships
Western Water engages all councils in the Western Water region through its Urban Water Strategy which was completed during the financial year. Through this process, the authority is evaluating all the councils' priorities for expansion of alternative water sources and maintaining liveability values. This partnership includes ongoing council engagement and enables detailed analysis of servicing options for open spaces to maintain liveability values through the connection of secure and alternative water sources.
Local, state and federal governments are involved in providing valued input into the Western Irrigation Network (WIN) Feasibility Study. WIN is aligned with the DELWP Water Plan and local government planning schemes including Green Wedge Management Plans.
Environmental statutory obligationsRegional Catchment Management StrategyThe Regional Catchment Management Strategy has several objectives and targets to improve land, water and biodiversity as part of the environmental and catchment management of Victoria. The goals are assigned to a few stakeholders including water corporations.
Western Water must comply with bulk water entitlements and biodiversity management targets. More information on Western Water’s bulk entitlement agreements is contained in Appendix 2.
As a significant landholder, Western Water undertakes biodiversity enhancement programs at its properties, which in 2016/17 included:
• a continued partnership with the Port Philip Catchment Management Authority to complete a tree planting project at Western Water's Melton Recycled Water Plant under Grow West's Greening the West 1 Million Trees program. More than 200 volunteers from across Victoria helped plant 3000 trees
• through Grow West's Greening the West 1 Million Trees program, Western Water prepared the Sunbury, Romsey and Melton recycled water facilities for tree planting in 2017/18. Preparation included fencing, weed control and obtaining relevant approvals to satisfy cultural heritage regulations
• together with City of Melton, Western Water successfully replanted 30 rare Spiny Rice-flowers at a native reserve which were initially destined for removal and disposal during the construction of a sewer scheme at Rockbank, and
• obtaining planning permits to offset losses from infrastructure construction projects through additional tree planting at Western Water properties and securing part of Pinkerton Forest as a vegetation offset.
Victorian Biodiversity StrategyWestern Water must conduct weed and pest control programs at its landholdings under the Victorian Biodiversity Strategy. During the reporting period, the Corporation continued to meet its regulatory obligation by undertaking these works across all its properties.
A notable achievement was removal of willows along Jacksons Creek at the Gisborne Recycled Water Plant. This project was undertaken in partnership with Melbourne Water and the adjoining property owner.
Victorian Waterway Management StrategyRivers within Western Water’s service region are classified as Cleared Hills and Coastal Plains in the State Environment Protection Policy (Waters of Victoria). The Victorian Waterway Management Strategy outlines specific management issues required for waterways for various stakeholders including water corporations.
Western Water is committed to minimising any potential impacts on surface water quality from the discharge of recycled water into streams. The Corporation also aims to achieve the objectives specified for the protection of the river segments in the Waters of Victoria Policy.
Waterway management obligationsAlthough Western Water has no direct control of river health, we recognise that activities – such as discharging recycled water into streams and harvesting water from streams – may have an adverse impact on river health and take action to mitigate and minimise these.
OPERATIONS REPORT

28 WESTERN WATER ANNUAL REPORT 2016/17
Western Water helps ensure waterway health through:
• conducting ecological risk assessments of waterways receiving recycled water to determine appropriate water quality and discharge volumes
• obtaining necessary EPA approvals and developing preventative action plans to minimise discharge
• improving the quality of recycled water from Melton and Riddells Creek Recycled Water Plants, particularly reducing the nutrients
• working with Melbourne Water, local government and other stakeholders to ensure adequate water resources to maintain flows in rivers and streams through the development of an Integrated Water Management Strategy. Improving environmental flows - particularly in Jacksons Creek - has been identified as a priority in Melbourne Water’s Healthy Waterways Strategy
• working with Melbourne Water over the past eight years to enhance stream frontages by planting trees and shrubs to minimise soil erosion and enhance biodiversity. Streamside vegetation improvement to provide native fauna habitat is one of the visions in Melbourne Water’s Healthy Waterways Strategy, and
• contributing matching funding to Melbourne Water’s stream frontage improvement grant program to build on the biodiversity enhancements achieved over the last eight years.
State Environment Protection Policy (Waters of Victoria)A core activity for Western Water is the collection of domestic wastewater and trade waste, and treating that waste to a standard to protect the environment. These standards are stipulated by State Environment Protection Policy (Waters of Victoria), outlined in licences issued by Victoria’s Environment Protection Authority (EPA). Western Water holds an EPA-issued amalgamated licence for its seven recycled water plants which are listed as scheduled premises under Environment Protection (Scheduled Premises and Exemptions) Regulations 2007. The policy states that recycled water must be reused, in preference to discharge to waterways, where it is practical and sustainable.
Discharge to waterwaysThe recycled water plants at Sunbury, Riddells Creek and Gisborne are licensed to discharge to Jacksons Creek. The Woodend Recycled Water Plant is licensed to discharge to Five Mile Creek and the Melton Recycled Water Plant to discharge to Werribee River. Discharge to surface water must comply with discharge limits for various water quality parameters specified in the licence and meet the water quality and biological indicators specified in the State Environment Protection Policy (Waters of Victoria). This compliance must be demonstrated through an appropriate monitoring program.
Discharge to landRecycled water plants at Bacchus Marsh and Romsey are licensed to discharge recycled water to land only for beneficial reuse, but their licences include an allowance for an automatic discharge to surface water during wet weather conditions. The licences have this flexibility because regardless of the appropriate design at these plants, some weather events may result in storages and irrigation areas being unable to contain all flows. When required, a controlled release of recycled water minimises the environmental impact.
EPA licences which allow discharges to waterways specify various limits and parameters to be complied with, and the overall compliance is assessed against licence limits specified as either an annual median or maximum amount. The only recycled water plant which failed to meet the annual compliance limit was Gisborne, which exceeded its maximum yearly limit for ammonia. While other plants occasionally exceeded their monthly targets, timely corrective actions ensured compliance against the annual median limits.
Despite difficult climatic conditions during the reporting period, the discharge quality compliance outcome is satisfactory. The recycled water plants at Riddells Creek, Romsey and Melton do not have enough land for the beneficial reuse of recycled water. During the reporting period, it was necessary to discharge excess recycled water to Jacksons Creek, Deep Creek and the Werribee River from these plants. These discharges were reported to the EPA.

29
During these emergency discharges the receiving waters were extensively monitored. Western Water has developed and submitted comprehensive Preventative Action Plans to prevent any further unlicensed discharge. The EPA did not pursue any enforcement actions.
During the reporting period, Western Water undertook a comprehensive soil and groundwater assessment at its recycled water plants to determine the risk of using recycled water for irrigation and storing recycled water. The assessment indicated that there is no risk of contamination from heavy metals. However, there are indications of elevated nutrients and sodium in the soil and Western Water will undertake remedial work to progressively reduce the nutrients. Groundwater assessment indicates that the sites' activities have minor impacts on groundwater and Western Water is working with EPA in implementing remedial actions.
Environmental flowsWestern Water must manage its water storages in accordance with environmental flow requirements detailed in the Bulk Entitlements Report. To meet these requirements, the Corporation's detailed monitoring infrastructure network is regularly examined to ensure compliance.
The network was upgraded in 2012 in conjunction with a Bureau of Meteorology funding program, to improve the accuracy and completeness of its data. Western Water continues to improve this network with three new metering sites completed, and upgrades to three of its existing sites.
Details of passing flows and environmental releases can be viewed in Western Water’s Bulk Entitlements Report, contained in Appendix 2.
BiosolidsIn 2016/17 Western Water produced 1,902 tonnes of biosolids - the solid, organic by-product of sewage treatment. These biosolids together with stockpiled product saw 2,088 tonnes reused safely as nutrients, soil conditioners and for compost during the reporting period.
Greenhouse gas emissions During 2016/17, Western Water developed its Greenhouse Gas Reduction and Energy Management Strategy. The strategy incorporates a five-year implementation plan to 2025 that includes actions to:
• increase Western Water’s renewable energy generation from assets
• develop energy design standards for new assets that avoid locking in energy intensive practices into future operations
• increase biogas production from the Melton Recycled Water Plant by capturing a greater proportion of organics in the sewage stream and processing it in the site’s anaerobic digester, and
• improve energy efficiency by installing equipment that uses less electricity, and reduce emissions from the vehicle fleet through revising the motor vehicle policy, investigating hybrid and electric vehicles and optimising field staff route planning.
The Greenhouse Gas Reduction and Energy Management Strategy sets the scene for meeting Western Water’s greenhouse gas reduction pledge, which was developed in consultation with the Department of Environment, Land, Water and Planning during 2016/17. Western Water has pledged to reduce its emissions by 10% by 2025 from a baseline of 27,906 tonnes CO2e. With significant growth in the service population expected over this time, this reduction equates to a decrease of 46% when compared to business as usual emissions.
Net greenhouse gas emissions for 2016/17 were 14% lower than last year at 27,379 tonnes CO2e. This reduction was primarily due to the removal of emissions associated with the operation of the Sunbury Recycled Water Plant from Western Water’s Operational Control to Downer EDI. If the greenhouse emissions from the Sunbury Recycled Water Plant were included in Western Water’s results, total emissions would have increased 1.0% from 2015/16 to 32,226 tonnes CO2e.
OPERATIONS REPORT

30 WESTERN WATER ANNUAL REPORT 2016/17
Energy consumption
Energy consumption for water treatment and supply was 29,575,335 megajoules. This equates to an energy intensity of 2,147 megajoules per million litres (MJ/ML) of water supplied. Energy consumption for sewage treatment and management was 26,896,654 megajoules. This equates to an energy intensity of 4,449 MJ/ML of recycled water produced. This represents a 38% increase in the energy intensity of sewage treatment and management from 2015/16 and can be attributed to removal of internal plant water usage from recycled water volume calculations. This reduced the recycled water volume by 4 million litres from 2015/16.
Significant activities generating greenhouse gas emissions
The two main activities generating greenhouse gas emissions for Western Water are the treatment and supply of water and the treatment and management of sewage. During 2016/17, emissions associated with water treatment and supply increased by 5%. This was primarily due to a 7% increase in electricity consumption, which is due to increased pumping of water from the Melbourne Water system. More than three quarters of the region’s water supply was sourced from Melbourne during the reporting period.
Emissions from the treatment and management of sewage decreased by 23% from last year. This was primarily due to the removal of emissions associated with the operation of the Sunbury Recycled Water Plant from Western Water’s operational control*.
If Sunbury Recycled Water plant had remained within Western Water’s operational control, emissions from the treatment and management of sewage would have decreased by 2%. This decrease can predominantly be attributed to a revision down of the persons per household figure from 2.87 in 2015/16 to 2.60 in 2016/17, which affects both methane and nitrous oxide emission calculations.
Emissions from fuel consumption increased by 25% from the previous year. This was primarily due to a 21% increase in the volume of diesel used. The bulk of increased diesel used throughout 2016/17 was consumed during the management of increased sewage volumes at recycled water plants (due to wet weather) and for heating the digester at the Melton Recycled Water Plant. Emissions from fuel consumption by Western Water’s vehicle fleet increased 3%.
Emission from recycled water distribution decreased by 44% during 2016/17. This was due to the removal of electricity consumption from the Sunbury recycled water scheme from Western Water’s operational control, as well as reduced overall recycled water demand from our customers due to a wet winter and spring.
Net greenhouse gas emission sources
The main contributor to Western Water’s overall net greenhouse gas emissions is electricity consumed from the Victorian electricity grid. This accounts for 67% of all emissions. Over the year electricity consumption increased by 4% (with Sunbury Recycled Water Plant electricity consumption excluded from both years to enable a more accurate comparison).
Highlights of Western Water’s greenhouse gas reduction program for 2016/17 include:
• adoption of the Greenhouse Gas Reduction and Energy Management Strategy and Greenhouse Gas Reduction Pledge of 10% below baseline levels by 2025
• resolution to restore the biogas co-generation facility at the Melton Recycled Water Plant back to full capacity
• options assessment for redirecting regional organic waste streams from landfill to the Melton Recycled Water Plant for treatment and conversion into biogas, and
• completion of an upgrade to the ultraviolet treatment system at Melton Recycled Water Plant which is expected to reduce greenhouse gas emissions by 377 tonnes CO2e per year.
* The National Greenhouse and Energy Reporting System guidelines specify that an entity is responsible for the greenhouse gas emissions associated with a facility if that entity has ‘operational control’ of that facility. Operational control is defined as the corporation that has the greatest authority to introduce and implement operating and environmental policies at the facility.

31
TABLE 22: TOTAL ENERGY CONSUMPTION
2012/13 2013/14 2014/15 2015/16 2016/17
Energy consumption: water treatment and supply 31,987,963 26,310,392 24,110,036 27,696,138 29,575,335
Energy consumption: sewage treatment and supply 25,806,684 29,199,273 33,861,710 35,048,830 26,896,654
Total potable water produced (ML) 12,830 12,648 13,101 14,357 13,775
Total recycled water produced (ML) 7,494 7,628 7,498 10,848 6,045*
MJ consumed/ML of potable water 2,493 2,080 1,840 1,929 2,147
MJ consumed/ML of recycled water produced 3,444 3,828 4,516 3,231 4,050
* The megalitres of recycled water produced figure is significantly lower than 2015/16 due to the removal of recycled water produced at the Sunbury RWP from calculations, as per National Greenhouse and Energy Reporting Scheme guidelines.
TABLE 23: SIGNIFICANT ACTIVITIES GENERATING GGE (TONNES CO2E)
Activities generating GGE 2012/13 2013/14 2014/15* 2015/16 2016/17
Water treatment and supply 10,574 8,551 7,903 8,697 9,131
Sewerage treatment and management 15,235 16,186 20,790 21,127 16,298
Transport 549 635 476 554 572
Other – recycled water distribution 1,183 1,281 1,477 1,522 854
Other – office 574 568 0** 0** 523
Total gross scope 1 and 2 emissions (tonnes CO2e) 28,115 27,221 30,646 31,900 27,379
* Updated to reflect corrections post-audit 2014/15
** Office emissions offset by the use of 100% GreenPower
TABLE 24: NET GGE SOURCE BREAKDOWN (TONNES CO2E)
2012/13 2013/14 2014/15* 2015/16 2016/17
Nitrous oxide emissions 3,643 3,591 3,605 3,714 2,654
Methane emissions 2,994 2,984 5,845 6,185 5,269
Diesel consumed 303 584 520 580 744
Unleaded petrol consumed 172 142 153 154 171
Gaseous fuel combustion 28 49 43 50 66
B20 biodiesel 1 - - 1 -
Other - - - - -
Autogas 1 3 - - -
Direct emissions (scope 1) 7,141 7,353 10,167 10,683 8,904
Vic grid electricity consumed 20,855 19,868 21,059 21,765 18,475
Reduction from GreenPower purchase (545) (568) (580) (548) -
Indirect emissions (scope 2) 20,310 19,300 20,478 21,217 18,475
Offsets purchased and retired (11,927) (11,436) - - -
Total net scope 1 and 2 emissions (tonnes CO2e) 15,524 15,217 30,646 31,900 27,379
* Updated to reflect corrections post-audit 2014/15
OPERATIONS REPORT

32 WESTERN WATER ANNUAL REPORT 2016/17
TABLE 25: WATER MAIN BURSTS PER 100KM
2012/13 2013/14 2014/15 2015/16 2016/17
Bursts per 100km of water main 18.8 14.0 12.1 13.3 12.3
TABLE 26: SEWER MAIN BLOCKAGES PER 100KM
2012/13 2013/14 2014/15 2015/16 2016/17
Sewer blockages per 100km of sewer main 12.7 15.7 15.5 14.1 11.5
TABLE 27: CUSTOMER COMPLAINTS
2015/16 2016/17
Water quality 251 145
Water supply reliability 1 0
Sewerage service reliability 6 3
Payment issue 28 33
Flow rate 3 1
Sewerage odour 34 7
Other 9 17
Total 332 206
Implementation of the Greenhouse Gas Reduction and Energy Management Strategy:
• planning has commenced on the installation of a solar photo-voltaic array at Melton Recycled Water Plant. A sizing study at the site indicated that a 500kW array could provide up to 35% of the plant’s annual electricity requirements, resulting in the avoidance of approximately 730 tonnes CO2e
• a feasibility study of a floating solar photo-voltaic array at the Lancefield Water Filtration Plant showed that a 99kW system could reduce emissions by around 150 tonnes CO2e, while also delivering additional benefits such as reduced evaporation and algae growth. Business cases for these two projects will be developed during 2017/18, and
• preliminary investigations to optimise the building management system at the Sunbury Office, upgrade the server room air-conditioning unit, and roll out an energy management system across the sites with the highest electricity consumption.
SOCIAL SUSTAINABILITY Serviced properties grew by 4% and local property numbers are forecast to grow by an estimated 4.1% per annum in coming years as Melton and Sunbury undergo rapid development. Overall customer satisfaction remains high across the service region.
Service delivery Water supply system In 2016/17, Western Water supplied water to 62,234 connected properties via 2,020km of drinking water mains. The extensive reticulation system is maintained through renewals, repairs and operational activities such as valve exercising, mains flushing, and flow and condition monitoring and assessment. These actions help reduce water losses through leakage and bursts and assist in maintaining water quality standards supplied to customers.
The number of water main bursts per 100km during 2016/17 was 12.3 or one less than the previous year (see Table 25).
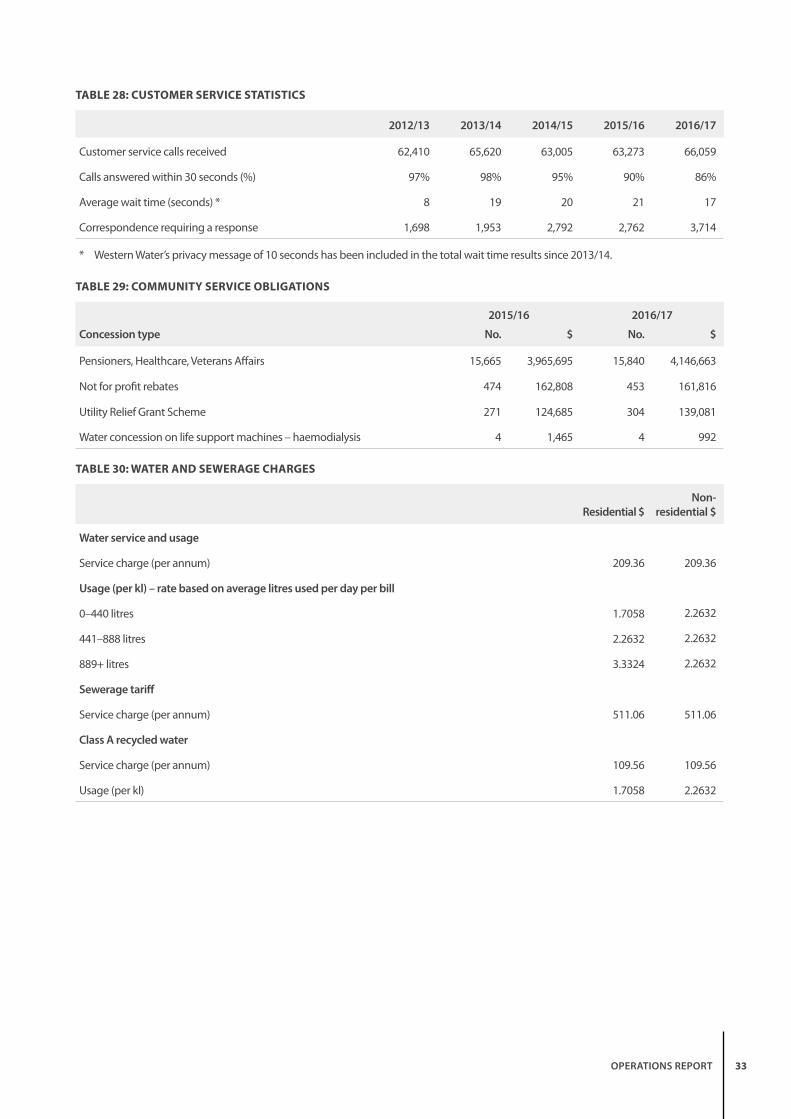
33 OPERATIONS REPORT
TABLE 28: CUSTOMER SERVICE STATISTICS
2012/13 2013/14 2014/15 2015/16 2016/17
Customer service calls received 62,410 65,620 63,005 63,273 66,059
Calls answered within 30 seconds (%) 97% 98% 95% 90% 86%
Average wait time (seconds) * 8 19 20 21 17
Correspondence requiring a response 1,698 1,953 2,792 2,762 3,714
* Western Water’s privacy message of 10 seconds has been included in the total wait time results since 2013/14.
TABLE 29: COMMUNITY SERVICE OBLIGATIONS
Concession type
2015/16 2016/17
No. $ No. $
Pensioners, Healthcare, Veterans Affairs 15,665 3,965,695 15,840 4,146,663
Not for profit rebates 474 162,808 453 161,816
Utility Relief Grant Scheme 271 124,685 304 139,081
Water concession on life support machines – haemodialysis 4 1,465 4 992
TABLE 30: WATER AND SEWERAGE CHARGES
Residential $Non-
residential $
Water service and usage
Service charge (per annum) 209.36 209.36
Usage (per kl) – rate based on average litres used per day per bill
0–440 litres 1.7058 2.2632
441–888 litres 2.2632 2.2632
889+ litres 3.3324 2.2632
Sewerage tariff
Service charge (per annum) 511.06 511.06
Class A recycled water
Service charge (per annum) 109.56 109.56
Usage (per kl) 1.7058 2.2632

34 WESTERN WATER ANNUAL REPORT 2016/17
Sewer systemIn 2016/17, Western Water supplied 56,264 connected properties with sewage and trade waste collection services through 1,285km of sewer mains. The innovative Sewer Spill Prevention Strategy continued to successfully maintain improved performance of the system.
Overall, there has been a significant decline in sewer blockages – and consequent spills - since the strategy commenced in 2010, reducing blockages per 100km of sewer mains from 14.1 in the previous year to 11.5 (see Table 26).
Customer service Customer service calls increased slightly in 2016/17 from 63,273 to 66,059, while customers seeking information from Western Waster's website continued to grow by more 30%. Fewer calls are being answered within 30 seconds (90% in 2015/16 down to 86% in 2016/17) due to an increased focus on first call resolution and customer payment arrangements. Refer to Table 28.
Managing complaintsOverall, customer complaints decreased by more than a third from 332 the previous year to 206 during 2016/17. This was mostly due to a reduction in water quality complaints from 251 to 145 in 2016/17. Sewerage odour complaints also dropped from 34 the previous year to 7.
Dissatisfied customers can refer complaints to the Energy and Water Ombudsman Victoria (EWOV). During 2016/17, EWOV handled 35 referrals on behalf of Western Water customers. The majority were handled as enquiries, requiring no further action.
The Ombudsman further investigated one complaint which remained open as at 30 June 2017.
Community service obligationsOne in four of Western Water’s residential customers hold a pensioner, healthcare or Veteran Affairs concession card. During the year, 49,742 concessions were provided to customers over three billing periods (with an annual concession cap of $305.50) amounting to more than $4.1 million.
There was a slight decrease in the number of not-for-profit organisations receiving rebates on their annual water and sewer charges to 453 groups which received $161,816 in rebates. The number of customers receiving Utility Relief Grants provided by Department of Health and Human Services increased from 271 to 304 in 2016/17.
Customers can receive payments from the Hardship Relief Grant Scheme (Sewerage Connection Scheme) and Non-Mains Water Concession directly from DHHS.
Utility Relief Grant SchemeOf 515 applications received from customers, 304 applications were approved, totalling over $139,081.
Service chargesWestern Water’s tariffs for 2016/17 were based on the Water Plan 2013–2018 price determination by the ESC.
Addressing hardshipWestern Water is a member of the Vulnerable Customer Taskforce, a water industry group formed to provide a consistent approach to prevention, early identification and provision of assistance to financially vulnerable customers. We also work with local financial counsellors to support customers experiencing financial difficulty, offering customers tailored individual payment solutions when required.
During 2016/17, 169 customers entered our Customer Support Program while 76 customers graduated. A total of 397 customers received financial assistance totalling $161,069.36, an increase of about 17% from 2015/16. This consistent increase since the commencement of the program indicates the program’s success in assisting vulnerable customers.
Eighty-six hardship assessment visits were conducted to support customers requiring financial assistance.

35 PERFORMANCE REPORT
PERFORMANCE REPORT
PERFORMANCE REPORTING INDICATORSFinancial performance indicatorsTABLE 31: FINANCIAL PERFORMANCE INDICATORS
Performance indicator2015/16
Result2016/17
Result
2016/17 Corp Plan
TargetVariance to
prior year % NotesVariance to
target % Notes
F1 Cash interest cover Net operating cash flows before net interest and tax/Net interest payments 2.77 2.76 2.34 (0.4%) 17.9% 6
F2 Gearing ratio Total debt (including finance leases)/ total assets * 100 22.3% 24.6% 27.3% 10.3% 1 (9.9%) 7
F3 Internal financing ratio (Net operating cash flow – dividends)/capital expenditure 59.1% 27.5% 14.5% (53.5%) 2 89.7% 8
F4 Current ratio Current assets/current liabilities (excluding long-term employee provisions and revenue in advance) 1.05 0.50 0.66 (52.4%) 3 (24.2%) 9
F5 Return on assets Earnings before net interest and tax/ average assets * 100 3.84% 3.17% 2.83% (17.4%) 4 12.0% 10
F6 Return on equity Net profit after tax/average total equity * 100 2.73% 2.05% 1.57% (24.9%) 5 30.6% 11
F7 EBITDA margin Earnings before interest, tax, depreciation and amortisation/total revenue * 100 47.32% 48.11% 46.78% 1.7% 2.8%

36 WESTERN WATER ANNUAL REPORT 2016/17
PERFORMANCE REPORTING INDICATORS (CONTINUED)Financial performance indicators
TABLE 31: FINANCIAL PERFORMANCE INDICATORSNotes:
1. The year on year increase in the gearing ratio is due to the increase in debt from $181 million in 2015/16 to $213 million in 2016/17 to fund the asset investment program. Total assets increased by $55 million, mainly from capital expenditure $60 million, $17 million of assets gifted from developers offset by depreciation and lower cash investments. Significant investment in assets is forecast for future years to service connection growth in the region - forecast at 4.5% on average for the next five years. Western Water will continue to reinvest net operating cash flow to fund the investment program however increases in debt funding will also be required in future years. Over the medium to longer term, revenue cash flows from the increased connections will allow for a fall in the gearing ratio.
2. The net operating cash flow has decreased year on year, in part as a result of income tax payments of $5 million. In addition, capital expenditure increased by $22 million year on year. As a result, the percentage of capital expenditure funded by the net operating cash flow has fallen. As discussed in Note 1 the substantial growth in connections forecast for Western Water's region will continue to result in increased investment with a higher proportion funded by debt as opposed to operating cash flows (and therefore a lower Internal Financing Ratio) in the near future. Over the medium to longer term, revenue cash flows from the increased connections will allow for an increase in the Internal Financing Ratio.
3. The current assets at 30 June 2017 were $5 million lower than in 2016 when cash was held to support the payment of the 2016/17 capital works program. Current liabilities have increased by $12 million in the area of higher capital accruals and trade creditor balances, reflecting the increased capital works program and in particular the Sunbury Recycled Water Plan Upgrade project. Western Water's capital and operating expenditure program are being managed to reduce the capital accruals and trade creditor balances to the extent possible thereby resulting in a higher Current Ratio.
4. The return on assets ratio for 2016/17 decreased compared with the prior year as a result of a higher average asset balance for 2016/17 by $71 million and decreased earnings before interest and tax. Despite increased revenue from new customer contributions, earnings before interest and tax decreased year on year largely as a result of lower service and usage customer revenues and higher depreciation and amortisation expense due to the increase in the fair value of assets as a result of the 2015-16 revaluation. Tariff revenues are forecast to marginally increase in future years resulting in a stable future Return on Assets.
5. The average total equity balance for 2016/17 was consistent with 2015/16. The return on equity ratio for 2016/17 decreased compared with the prior year as a result of reduced net profit after tax. Despite increased new customer contributions for development activity in the region, net profit after tax decreased year on year. This is largely as a result of higher depreciation and lower customer tariff revenue. Tariff revenues are forecast to marginally increase in future years resulting in a stable future Return on Equity.
6. The cash interest cover ratio is more favourable than target due to lower interest payments of $0.6 million. Lower than forecast capital expenditure resulted in lower debt than planned and therefore reduced interest payments. Net cash flows before net interest and tax were favourable to plan with higher developer cash contributions.
7. The gearing ratio is below target due the business increasing debt by a lower amount than forecast as a result of lower than planned capital expenditure in assets during the financial year. In addition, the asset base increase was higher than planned as a result of a larger revaluation impact from the 2015-16 revaluation and higher than expected developer gifted assets.
8. The net operating cash flow result for 2016/17 was above target due to higher developer cash contributions however the capital expenditure during the year was lower than the target level by approximately $25 million. The result is a favourable internal financing ratio as compared to the target.
9. The current assets at 30 June 2017 were $2 million higher than plan with a higher closing cash balance. However, current liabilities were $11 million higher than planned. Current liabilities have increased in the area of higher capital accruals and trade creditor balances, reflecting the increased capital works program and in particular the Sunbury Recycled Water Plan Upgrade project. Western Water's capital and operating expenditure program are being managed to reduce the capital accruals and trade creditor balances to the extent possible thereby resulting in a higher Current Ratio.
10. The return on assets ratio for 2016/17 is favourable compared with the target as result of a lower than planned average asset balance for 2016/17 by $6 million reflecting a reduced capital expenditure and favourable earnings before interest and tax driven by increased revenue from new customer contributions.
11. The average total equity balance for 2016/17 was consistent with the target level. The return on equity ratio for 2016/17 is favourable compared with the target as a result of favourable net profit after tax. Net profit after tax increased compared with that targeted largely as a result of higher New Customer Contributions related to development activity in the region and lower tax expense compared with that budgeted.

37 PERFORMANCE REPORT
Water and sewerage service performance indicatorsTABLE 32: WATER AND SEWERAGE SERVICE PERFORMANCE INDICATORS
Performance indicator2015/16
Result2016/17
Result
2016/17 Corp Plan
TargetVariance to
prior year % NotesVariance to
target % Notes
WS1 Unplanned water supply interruptions
Number of customers receiving >5 unplanned interruptions in the year/ total number of water (domestic and non-domestic) customers * 100 0% 0% 0.01% 0.0% (100.0%)
WS2 Interruption time indicators Average duration of unplanned water supply interruptions 92.8 minutes
214.7 minutes
88.0 minutes 131.4% 12 144.0% 12
WS3 Restoration of unplanned water supply Unplanned water supply interruptions restored within 5 hours/total unplanned water supply interruptions * 100 98.0% 82.9% 98.0% (15.4%) 13 (15.4%) 13
SS1 Containment of sewer spills Sewer spills from reticulation and branch sewers contained within 5 hours/total sewer spills from reticulation and branch sewers 100.0% 100.0% 99.9% 0.0% 0.10%
SS2 Sewerage interruptions Number of residential sewerage customers affected by sewerage interruptions restored within 5 hours 100.0% 98.3% 100.0% (1.7%) (1.7%)
Notes:
12. The average duration of unplanned interruptions exceeded target and the result for 2015/16 as a consequence of one complex burst affecting a large main in Sunbury impacting a significant number of customers over an extended period of time. Western Water is reviewing all water mains constructed of the equivalent material and predictive analytics is being employed to assist with scheduled maintenance programming in future.
13. The restoration of unplanned water supply interruptions within five hours was less than target and the result for 2015/16 as a result of one complex burst affecting a large main in Sunbury impacting a significant number of customers over an extended period of time. As stated in note 12 Western Water is reviewing all water mains constructed of the equivalent material and predictive analytics is being employed to assist with scheduled maintenance programming in future.

38 WESTERN WATER ANNUAL REPORT 2016/17
PERFORMANCE REPORTING INDICATORS (CONTINUED)Customer responsiveness performance indicatorsTABLE 33: CUSTOMER RESPONSIVENESS PERFORMANCE INDICATORS
Performance indicator2015/16
Result2016/17
Result
2016/17 Corp Plan
TargetVariance to
prior year % NotesVariance to
target % Notes
CR1 Water quality complaints * Number of complaints per 1000 customers 0.417 0.233 0.33 (44.1%) 14 (29.4%) 14
CR2 Sewerage service quality complaints * Number of complaints per 100 customers 0.011 0.005 0.02 (54.5%) 15 (75.0%) 15
CR3 Sewage odour complaints * Number of complaints per 100 customers 0.063 0.012 0.03 (81.0%) 16 (60.0%) 16
CR4 Billing complaints * Number of complaints per 100 customers 0.047 0.053 0.05 12.8% 17 6.0% 17
* Complaints that were investigated and found to be unrelated to a Western Water's infrastructure, operations or service delivery are excluded for 2016/17 in accordance with ESC 2016/17 water performance indicator definition CRS3.
Notes:
14. Water quality complaints per 100 customers for 2016/17 were lower than 2015/16 due to the consistency of water supply sources (changing supplies between Melbourne and local supplies impacted on customers outcomes last year). A focus on proactive maintenance, flushing and water quality monitoring programs in 2016/17 have also resulted in a favourable outcome against target.
15. Three complaints for sewerage service quality were recorded for 2016/17 (2015/16 was six). The few complaints received were addressed promptly and resolved to customer satisfaction ensuring a favourable 2016/17 result against target.
16. Seven sewer odour complaints were recorded for 2016/17 (2015/16 was 34). There was a significant reduction this year due to the resolution of a number of complex treatment plant and sewer pump station odour issues. The few complaints received were addressed promptly and resolved to customer satisfaction ensuring a favourable 2016/17 result against target.
17. Thirty-three billing complaints were recorded for 2016/17 (2015/16 was 28) which resulted in an unfavourable variance against target. Common billing complaints focussed on charges related to high water use, charges for special meter reads and vacant land charges (from the growing number of customers new to the area). Various options are being investigated to prevent and/or identify customer leaks and customer support is available. Special meter read charges are advertised on the website and customers advised up front. A fact sheet on Vacant Land Charges is provided to all new Western Water customers as part of a new customer information pack.
Environmental performance indicatorsTABLE 34: ENVIRONMENTAL PERFORMANCE INDICATORS
Performance indicator2015/16
Result2016/17
Result
2016/17 Corp Plan
TargetVariance to
prior year % NotesVariance to
target % Notes
E1 Effluent reuse volume (end use) Percentage recycled for each category 82.8% 72.5% 66.0% (12.4%) 18 9.8% 18
E2 Total net CO2 emissions Net tonnes CO2 equivalent 31,900 27,379 28,103 (14.2%) 19 (2.6%) 19
Notes:
18. Effluent reuse in 2016/17 was lower than the prior year due to lower agricultural reuse as a result of wetter conditions early in the year and a mild summer. Despite the effluent reuse result in 2016/17 being lower than 2015/16 result it was higher than the target as it assumed a lower volume of reuse. Western Water is currently assessing the feasibiity of extending the recycled water grid to provide opportunites for increased agricultural and commercial reuse in future.
19. Net greenhouse gas emissions for 2016/17 were 14.2% lower than 2015/16 primarily due to the removal of emissions associated with the operation of the Sunbury Recycled Water Plant from Western Water's operational control to a third party. Decreases in methane and nitrous oxide emissions from wastewater treatment also contributed to the favourable variation from the 2016/17 target.

39
CERTIFICATION OF PERFORMANCE REPORT 2016/17We certify that the accompanying Performance Report of Western Region Water Corporation in respect of the 2016/17 financial year is presented fairly in accordance with the Financial Management Act 1994.
The Performance Report outlines the relevant performance indicators for the financial year as determined by the Minister for Water and as set out in the 2016/17 Corporate Plan. We have reported our actual and comparative results achieved for the financial year against predetermined performance targets and these indicators. We have also reported an explanation of any significant variance between the actual results and performance targets and/or between the actual results in the current year and the previous year.
As at the date of signing, we are not aware of any circumstances which would render any particulars included in the Performance Report to be misleading or inaccurate.
Signed at Sunbury on 7 September 2017, on behalf of the Board.
Terry Larkins Neil Brennan Julie Williams Chair Managing Director Chief Finance & Accounting Officer
PERFORMANCE REPORT

40 WESTERN WATER ANNUAL REPORT 2016/17
AUDITOR GENERAL’S REPORT ON THE PERFORMANCE REPORT

41 PERFORMANCE REPORT

42 WESTERN WATER ANNUAL REPORT 2016/17
OTHER DISCLOSURES
Implementation of the Local Jobs First – Victorian Industry Participation Policy The Victorian Industry Participation Policy (VIPP) Act 2003 ensures that, where applicable, Government projects use local suppliers whenever and wherever they offer the best value for money.
State Government departments and public bodies are required to apply the VIPP on all tenders over $3 million in metropolitan Melbourne and $1 million in regional Victoria. In Western Water’s service area, both City of Hume and the City of Melton are considered metropolitan, while the Shire of Moorabool and Shire of Macedon Ranges are regional.
During 2016/17, Western Water commenced and/or completed:
• 3 contracts totalling $12.7M to which a VIPP Plan or Local Industry Development Plan (LIDP) was required
• 2 contracts to which a VIPP Plan was required in metropolitan Melbourne, representing 82 per cent of estimated local content, and
• 1 contract to which a VIPP Plan was required, in regional Victoria, representing 74 per cent of estimated local content.
The total VIPP Plan or LIDP commitments achieved as a result of contracts completed include:
• local content of 79 percentage of the total value of the contracts
• 3 new jobs and 39 retained jobs, and
• 1 new apprenticeships/traineeships and 4 retained apprenticeships/traineeships.
During 2016/17, 3 contracts which commenced on or after 1 September, had the minimum formal weighting of 10 per cent applied for local content in the tender evaluation of the VIPP Plan or LIDP.
Information and Communication Technology (ICT) expenditure ICT expenditure refers to Western Water’s costs in providing business-enabling information and communication technology services. Business as usual expenditure mainly relates to ongoing activities to operate and maintain the current ICT capability, while non business as usual expenditure relates to extending or enhancing the current capabilities. For 2016/17, Western Water had a total ICT expenditure of $7.5M, with the details shown in Table 35.
Advertising expenditure Western Water did not undertake any government advertising during 2016/17. Western Water’s total advertising spend was $45,048, including recruitment and operational advertising to meet legislative requirements. This low level of advertising expenditure is a result of continuing efforts to reduce advertising costs including a shift to lower cost, effective advertising campaigns in local newsletters and social media.
TABLE 35: ICT EXPENDITURE
ICT expenditure area $’000
Operational expenditure 1,413
Capital expenditure 3,805
Non business as usual expenditure (operational & capital expenditure) 5,218
Business as usual expenditure 2,286
Total ICT expenditure 7,504

43
Consultancy expenditureIn 2016/17, there were 22 consultancies where the total fees payable to the consultants were $10,000 or greater. The total expenditure incurred during the reporting period in relation to these consultancies is $897,416 (excluding GST). Details of individual consultancies can be viewed at westernwater.com.au.
In the reporting period, there were 5 consultancies where the total fees payable to the consultants were less than $10,000. The total expenditure incurred during the reporting period in relation to the consultancies is $26,104 (excluding GST).
Freedom of information Victoria’s Freedom of Information Act (the Act) gives customers the right to access documents held by government agencies, as well as the right to request that incorrect or misleading information be amended or removed. Western Water is a government agency under the Act and the decision to release information is made by an authorised officer.
During 2016/17, there were six requests for access to information in accordance with the Act. Four of these were non-personal requests of which one was not finalised within the financial year while another did not proceed. One non-personal request was granted access in full to identified documents
and the fourth non-personal request was granted access to identified documents in part. Two personal requests were received and both were granted access to identified documents in part. One non-personal request which was outstanding at 30 June 2016 was finalised in 2016/17 and access to identified documents was granted in part.
The FOI Commissioner informed Western Water that a complaint under section 61A of the Act, made in respect of a request in 2015/16, was withdrawn. One complaint relating to a request made in 2016/17 was also withdrawn. At 30 June 2017, one FOI Commission Review remains active.
Requests for access to information held by Western Water should be made in writing to:
FOI Officer Julie Williams General Manager, Business Services Western Water PO Box 2371, Sunbury DC Victoria 3429 Phone: 9218 5400 Email: [email protected]
From 1 July 2017, a fee of $28.40 applies to any application for documents. Additional information and how to make an FOI request is available on Western Water’s website and at www.foi.vic.gov.au.
Names and titles of FOI decision makers
Authorised person – Julie Williams, General Manager Business Services Principal officer – Neil Brennan, Managing Director
TABLE 36: FREEDOM OF INFORMATION SUMMARY
Summary
Personal requests received 2
Non personal requests received 4
Requests outstanding at 30 June 2017 1
Reviews by the FOI Commissioner received 1
Reviews by the FOI Commissioner where the original decision was confirmed 1
Reviews by the FOI Commissioner where the original decision was varied or overturned 0
VCAT appeals lodged 0
VCAT appeals confirmed decision 0
VCAT appeals varied or overturned decision 0
Exemptions in requests, reviews by the FOI Commissioner and VCAT appeals s.33(1)
Total dollar of application fees collected $83.70
Total dollar of charges collected and waived $83.70
OTHER DISCLOSURES

44 WESTERN WATER ANNUAL REPORT 2016/17
Compliance with the Building Act 1993 Western Water complies with the building and maintenance provisions of the Building Act 1993.
National Competition PolicyCompetitive neutrality seeks to enable fair competition between government and private sector business.
Western Water continues to comply with the requirements of the National Competition Policy and Competitive Neutrality Policy Victoria.
Compliance with Protected Disclosure Act 2012 The Protected Disclosure Act 2012 (the Act) facilitates the making of disclosures about serious improper conduct by public bodies or public officers or even members of the public who incite public bodies or officers to commit serious improper conduct. The Act provides for a system for these matters to be confidentially disclosed and impartially investigated. The Act also provides protection from detrimental action to the discloser and welfare support during the process.
What is a protected disclosure?A protected disclosure is a complaint of corrupt or improper conduct by a public officer or a public body. Western Water is a public body for the purposes of the Act.
What is improper or corrupt conduct?Improper or corrupt conduct involves substantial:
• mismanagement of public resources
• risk to public health or safety or the environment, or
• corruption.
The conduct must be criminal in nature or a matter for which an officer could be dismissed.
How do I make a protected disclosure?You can make a protected disclosure about Western Water or its Board Directors, officers or employees by contacting the Independent Broad-Based Anti-Corruption Commission using the following contact details.
Please note that Western Water is not able to receive protected disclosures.
ContactIndependent Broad-Based Anti-Corruption Commission Victoria
Street address: Level 1, North Tower 459 Collins Street Melbourne Victoria 3001
Postal address: IBAC, GPO Box 24234 Melbourne Victoria 3000
Phone 1300 735 135 or website www.ibac.vic.gov.au. Email: see the website above for the secure email disclosure process which also provides for anonymous disclosures.
How can I access Western Water’s procedures for the protection of persons from detrimental action?Western Water has established procedures for the protection of persons from detrimental action in reprisal for making a protected disclosure about Western Water or its employees. You can access Western Water’s procedures at westernwater.com.au.

45
Office-based environmental impacts Under Western Water’s Environmental Management System, the environmental impacts from office-based activities have been identified and an environmental management program developed. This includes waste reduction requirements via procurement as well as decreasing office:
• energy consumption and greenhouse gas emissions
• waste production
• use of paper
• water consumption, and
• transportation fuel consumption.
Office rubbish is now being separated between general rubbish, organics and recyclables. Office water consumption and greenhouse gas emissions are reported separately in this report (refer Table 17 and Table 23 respectively).
Additional information available on request Subject to the Freedom of Information Act 1982, the following information is available on request:
• a statement that declarations of pecuniary interests have been duly completed by all relevant officers
• details of shares held by a senior officer as nominee, or held beneficially in a statutory authority or subsidiary
• details of all publications produced by Western Water about itself, and how these can be obtained
• details of changes in prices, fees, charges, rates and levies charged by Western Water
• details of any major external reviews carried out on Western Water
• details of major research and development activities undertaken by Western Water
• details of overseas visits undertaken including a summary of the objectives and outcomes of each visit
• details of major promotional, public relations and marketing activities undertaken by Western Water to develop community awareness of Western Water and its services
• details of assessments and measures undertaken to improve the occupational health and safety of employees
• a general statement on industrial relations within Western Water and details of time lost through industrial accidents and disputes
• a list of major committees sponsored by Western Water, the purpose of each committee and the extent to which the purposes have been achieved, and
• details of all consultancies and contractors including consultants/contractors engaged, services provided, and expenditure committed.
RISK MANAGEMENT ATTESTATION I, Terry Larkins, Chair of the Board, certify that Western Water has fully complied with the Ministerial Standing Direction 3.7.1 – Risk Management Framework and Processes of the Standing Directions of the Minister for Finance 2016.
The Western Water Board has verified this compliance.
Terry Larkins Chair 21 June 2017
OTHER DISCLOSURES

46 WESTERN WATER ANNUAL REPORT 2016/17
FINANCIAL REPORT
FINANCIAL SUMMARYThe following summary tables and graphs illustrate that for the 2016/17 year, Western Water made an overall surplus of $15.0 million before tax. This result includes assets received from developers and cash paid by developers of $30.9 million.
Western Water invested $65.1 million in capital works during the year. The debt level, net of cash and cash equivalent assets, has now increased to $211.7 million from $173.4 million in 2015/16.
TABLE F1 – OPERATING REVENUE AND EXPENSES ($’000) – 5 YEAR SUMMARY
2012/13 2013/14 2014/15 2015/16 2016/17% change
on prior yearCorp Plan
2016/17
Operating revenue
Operating revenue 59,645 63,683 67,507 73,850 66,469 (10.0%) 63,963
New customer contributions 19,453 9,416 11,909 25,174 30,851 22.6% 26,767
Government contributions 1,227 2,044 182 179 89 (50.3%) 0
Interest 124 115 101 228 15 (93.4%) 65
Other 1,812 1,832 2,036 2,485 3,334 34.2% 2,101
Total 82,261 77,090 81,735 101,916 100,758 (1.1%) 92,895
Operating costs
Operating expenses 52,026 50,427 46,673 58,284 57,826 (0.8%) 54,328
Corporate expenses 14,349 11,878 10,284 11,575 13,983 20.8% 12,225
Finance 10,142 10,729 10,691 11,109 11,548 4.0% 12,505
Environmental contribution 1,615 2,410 2,410 2,410 2,410 0 2,410
Total 78,132 75,444 70,058 83,378 85,767 2.9% 81,468
Net profit before tax 4,129 1,646 11,677 18,538 14,991 (19.1%) 11,427

47
TABLE F2 – FINANCIAL RESULTS ($’000) – 5 YEAR SUMMARY
2012/13 2013/14 2014/15 2015/16 2016/17% change
on prior yearCorp Plan
2016/17
Current assets 21,838 19,918 32,099 20,993 15,872 (24.4%) 13,769
Non-current assets 696,871 686,205 690,003 789,200 849,311 7.6% 859,556
Total assets 718,709 706,123 722,102 810,193 865,183 6.8% 873,325
Current liabilities 34,742 48,553 18,295 25,375 37,713 48.6% 26,143
Non-current liabilities 226,776 221,115 259,184 280,113 312,299 11.5% 339,065
Total liabilities 261,518 269,668 277,479 305,488 350,021 14.6% 365,208
Net cash flow from operations 5,344 12,157 19,675 19,065 14,888 (21.9%) 11,512
Payments for property, plant & equipment 26,052 19,876 16,677 32,234 55,978 73.7% 74,876
TABLE F3 – FINANCIAL PERFORMANCE INDICATORS – 5 YEAR SUMMARY
2012/13 2013/14 2014/15 2015/16 2016/17Corp Plan
2016/17
Internal financing ratio 20.5% 61.2% 118.0% 59.1% 27.5% 14.5%
Gearing ratio 23.5% 24.6% 25.1% 22.3% 24.6% 27.3%
Interest cover (ebit) 1.41 1.16 2.10 2.70 2.30 1.92
Interest cover (cash) 1.54 2.15 2.88 2.77 2.76 2.34
Return on average assets 2.1% 1.7% 3.1% 3.8% 3.2% 2.8%
Return on average equity 0.7% 0.3% 1.9% 2.7% 2.1% 1.6%
FINANCIAL REPORT

48 WESTERN WATER ANNUAL REPORT 2016/17
Revenue Revenue decreased by 1.1% in 2016/17 largely reflecting the pass through to customers of a reduction in Melbourne Water’s bulk water related charges and decreased water demand resulting from a milder climate. This was offset in part by increased revenue from developer contributions.
CHART F1: REVENUE ($’000) – 5 YEARS
Expenditure Expenses were higher in 2016/17 due to higher depreciation expenditure resulting from increased asset values arising from the asset revaluation in June 2016, increased costs associated with servicing developers and new customers, as well as additional consulting expenditure from project work undertaken on price submission, process reviews and environmental activities. Offsetting these increased costs are lower bulk water costs as an outcome of the Melbourne Water Price Determination.
CHART F2: EXPENDITURE ($’000) – 5 YEARS
Net profit before tax Western Water made an overall pre-tax surplus of $15.0 million compared to $18.5 million in 2015/16. The overall result includes developer asset and cash contributions of $30.9 million ($25.2 million in 2015/16).
Developer contributionsTotal developer contributions increased by $5.7 million (23%) in 2016/17 reflecting increased growth activity within the region. Of the total revenue from developer contributions, cash contributions increased by 80.3% to $13.7 million as compared to $7.6 million in 2015/16. Connected properties increased by 2076 lots during the financial year.
Shareholder dividendWestern Water is required to pay a dividend in accordance with a determination of the Treasurer of Victoria under the Public Authorities (Dividend) Act 1983, based on a prescribed percentage of the previous years’ adjusted net profit. An obligation to pay a dividend only arises after consultation with the portfolio Minister and the Treasurer, and a formal determination is made by the Treasurer. No shareholder dividend was paid for the year 1 July 2016 to 30 June 2017.
Major changes or factors affecting performanceIn 2016/17 the milder and wetter climate saw customers using less water than 2015/16 resulting in lower water usage revenue of $1.9 million. However, with higher levels of water in storage, water treatment costs remained consistent year on year.
120,000
100,000
80,000
60,000
40,000
20,000
0
2012/13 2013/14 2014/15 2015/16 2016/17 2016/17 Corp plan
Operating revenue New customer contributions
Government contributions Interest Other
60,00050,00040,00030,000
80,00070,000
90,000
20,00010,000
Operating expenses Corporate expenses
Finance Environmental contribution
0
2012/13 2013/14 2014/15 2015/16 2016/17 2016/17 Corp plan

49 FINANCIAL REPORT
The Melbourne Water Price Determination resulted in a pass through of lower charges to customers. In 2015/16 Western Water received an efficiency rebate from Melbourne Water, which can be seen in Water Usage Charges. In 2016/17 Melbourne Water savings, including the efficiency rebate were passed through to Western Water as lower bulk water costs, which in turn Western Water passed on to customers as lower service charges.
As discussed earlier, developer contributions increased by $5.7 million reflecting growth in the region. This growth has contributed to a year on year increase of $29.1 million of capital expenditure during 2016/17, with a large portion of the $65.1 million total investment related to growth and compliance projects, including $19.6 million on the upgrade on the Sunbury Recycled Water Plant that is required to meet increased wastewater inflows from growth in Sunbury and surrounding areas.
Other operating and administration expenses were higher in 2016/17 as a result of increased expenditure incurred in servicing developers and increased customers within the region, increased expenditure on preparation of the Urban Water Strategy – a 50-year water supply planning strategy presented to the Minister in March 2017and the five-year price submission due to the Essential Services Commission in September 2017. Western Water also incurred increased expenditure in relation to environmental compliance obligations and managing its impact on the environment.
The asset revaluation in June 2016 that resulted in an increase in the carrying value of assets by $67.3 million was the key reason for the higher depreciation in 2016/17 of $2.9 million.
Significant changes in financial positionThere were no significant changes in the financial position for the year ending 30 June 2017.
Post balance date events There are no significant post balance sheet events.
Outlook 2017/18 Western Water’s operating profit in 2017/18 is expected to increase from the 2016/17 result as the region continues to experience strong customer growth – a slow-down in development would impact revenue from developers and therefore the profit outlook.
Western Water is implementing programs to encourage customers to conserve water and achieve the Government’s Target 155. The operating profit for 2017/18 forecasts a lower customer water use in line with achieving 155 litres per person per day across the region progressively over the coming few years.
The asset investment program will continue to increase over 2017/18 with a target program of $71.7 million of which a large portion is for investment in assets required to service growth in customers. Cash contributions from developers is expected to fund approximately $10.3 million of the investment expenditure with the remainder expected to be funded through increased borrowings, with the debt balance forecast to increase to $276.6 million by 30 June 2018.

50 WESTERN WATER ANNUAL REPORT 2016/17
UNDERSTANDING THE FINANCIAL REPORT
Statement of comprehensive incomeThe comprehensive operating statement presents Western Water’s financial performance over the year, and shows whether a profit or loss has been made in delivering products and services.
The statement includes all sources of revenue less all expenses incurred in earning that income. For the year ending 30 June 2017, Western Water made a profit after tax of $10.5 million compared with $13.0 million for the previous financial year.
Balance sheetThe balance sheet sets out Western Water’s net accumulated financial worth at a point in time. It shows the assets Western Water holds as well as liabilities or claims against those assets. Both assets and liabilities are expressed as current or non-current. Current means that assets or liabilities are expected to be converted to cash within the next 12 months. Non-current assets or liabilities are long-term. Equity is total capital and reserves plus profits that have been reinvested in the business over the years.
Statement of changes in equityThe statement of changes in equity shows the changes in equity between two financial periods reflecting the increase or decrease in its net assets during the year. The total overall change in equity during a financial year represents the total amount of income and expenses through the operating statement, and items charged directly to the equity account from revaluation of assets.
Cash flow statementThe cash flow statement summarises Western Water’s cash receipts and payments for the financial year and the net cash held position. It differs from the statement of comprehensive income in that it:
• excludes non-cash expenses such as depreciation and amortisation
• excludes the accruals taken into account within the income statement
• includes payments or receipts in relation to capital items, and
• includes any financing activities such as movements in loans held by Western Water.
For the year ending 30 June 2017, Western Water had a net cash inflow of $14.9 million from operating activities compared with $19.1 million for the previous financial year.
Notes to the financial statementsNotes to the financial statements provide further information in relation to the rules and assumptions used to prepare the financial statements as well as additional information and detail about specific items within the statements. The notes also advise the reader if there have been any changes to accounting standards, policy or legislation which may change the way the statements are prepared.
Information in the notes is particularly useful when there has been a significant change from the previous year’s comparative figure.
Statutory certificate and Auditor General’s reportThese attachments provide the reader with a written undertaking in relation to the correctness and trustworthiness of the financial statements.
In particular, the report from the Auditor General provides an independent view and will advise the reader if there are any issues of concern.

51 FINANCIAL REPORT
FINANCIAL STATEMENTS
Western Region Water Corporation has pleasure in presenting its audited general purpose financial statements for the financial year ended 30 June 2017.
It is presented in the following structure:
FINANCIAL STATEMENTS
Comprehensive operating statement 52
Balance sheet 53
Statement of changes in equity 54
Cash flow statement 55
NOTES TO THE FINANCIAL STATEMENTS 56
Note 1: About this report 56
Note 2: Funding delivery of our services 57
Note 3: The cost of delivering services 60
Note 4: Key assets available to support output delivery 66
Note 5: Other assets and liabilities 75
Note 6: How we financed our operations 79
Note 7: Risks, contingencies and valuation judgements 84
Note 8: Statutory obligations 97
Note 9: Other disclosures 100
STATUTORY CERTIFICATION 111
AUDITOR-GENERAL’S REPORT 112

52 WESTERN WATER ANNUAL REPORT 2016/17
COMPREHENSIVE OPERATING STATEMENT for the financial year ended 30 June 2017
Notes2017
$’0002016
$’000
Revenue
Service charges 2(b)(i) 45,367 48,688
Water usage charges 2(b)(i) 21,102 25,162
Government grants and contributions 9 89 179
Interest income 15 228
Developer contributions 2(b)(ii) 30,851 25,174
97,424 99,431
Net loss on disposal of infrastructure, property, plant and equipment 4(a)(viii) (64) (161)
Other revenue 2(b)(iii) 3,398 2,646
3,334 2,485
Total revenue 100,758 101,916
Expenses
Borrowing costs 6(a), 9 11,548 11,109
Depreciation 4(a), 7 19,811 16,916
Amortisation 4(a), 4(b), 7 2,141 1,895
Employee benefits 3(b), 3(c), 9 15,867 14,609
Repairs and maintenance 3(d) 3,975 4,013
Environmental contribution levy 8(b), 9 2,410 2,410
Water purchases 3(a), 9 9,679 14,934
Electricity 3(a) 3,366 3,319
Grants and other transfers 3(e) 32 19
Other operating & administration 3(f) 16,938 14,154
Total expenses 85,767 83,378
Net result before income tax expense 14,991 18,538
Income tax expense 8(a)(i) 4,525 5,573
Net result for the period 10,466 12,965
Other comprehensive income
Change in asset revaluation reserve - 67,311
Income tax relating to change in asset revaluation reserve - (20,194)
- 47,117
Comprehensive result 10,466 60,082
The above Comprehensive Operating Statement should be read in conjunction with the accompanying notes.

53 FINANCIAL REPORT
BALANCE SHEET as at 30 June 2017
Notes2017
$’0002016
$’000
Assets
Current assets
Cash and cash equivalents 6(b), 7 1,598 7,613
Receivables 5(a), 7 13,316 12,749
Prepayments 5(c) 596 631
Amounts in trust 5(c) 371 -
Total current assets 15,881 20,993
Non-current assets
Receivables 5(a), 7 187 181
Infrastructure assets, property, plant and equipment 4(a), 7 835,764 778,709
Intangible assets 4(b), 9 12,186 9,190
Deferred tax assets 8(a)(ii) 1,174 1,120
Total non-current assets 849,311 789,200
Total assets 865,192 810,193
Liabilities
Current liabilities
Payables 5(b), 7 29,680 17,539
Income in advance 2,921 2,297
Provisions and employee benefits 3(b), 9 3,346 3,031
Current tax payable 8(a)(i) 1,775 2,508
Total current liabilities 37,722 25,375
Non-current liabilities
Interest bearing liabilities 6(a), 7 213,250 181,000
Provisions and employee benefits 3(b) 413 494
Deferred tax liabilities 8(a)(ii) 98,636 98,619
Total non-current liabilities 312,299 280,113
Total liabilities 350,021 305,488
Net assets 515,171 504,705
Equity
Contributed capital 9(a)(i) 160,413 160,413
Asset revaluation reserves 9(a)(ii) 147,416 147,416
Accumulated surplus 9(a)(iii) 207,342 196,876
Total Equity 515,171 504,705
The above Balance Sheet should be read in conjunction with the accompanying notes.
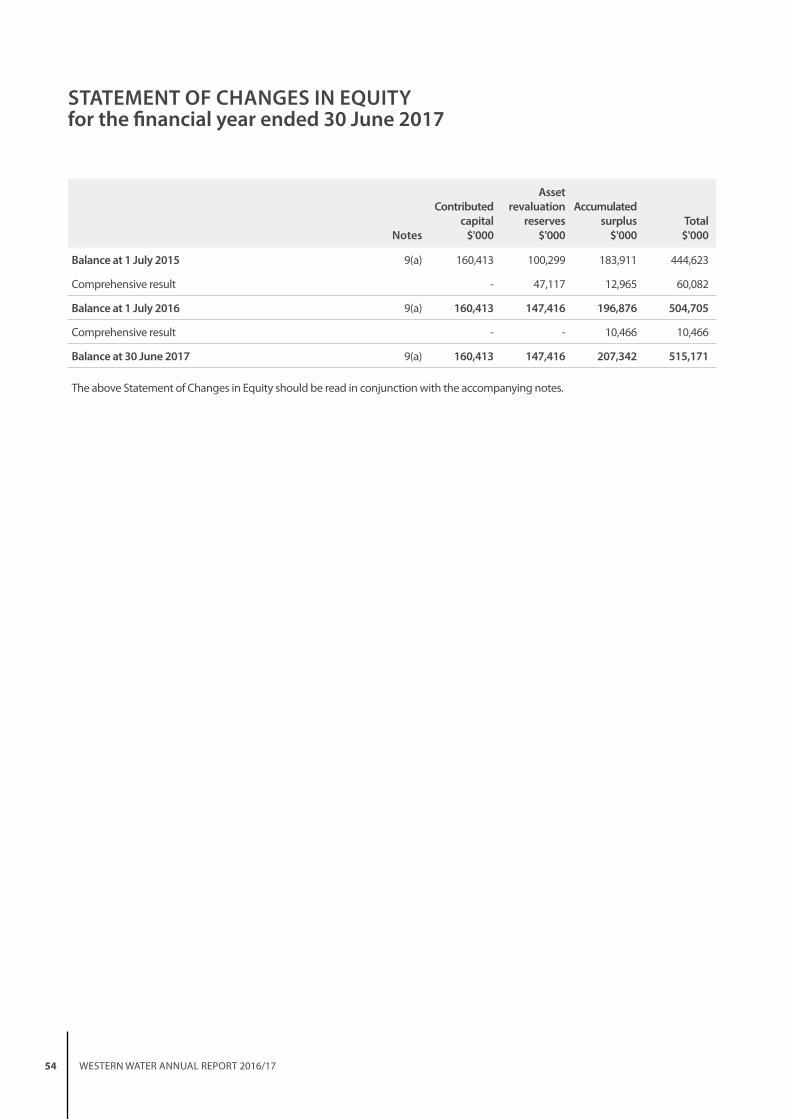
54 WESTERN WATER ANNUAL REPORT 2016/17
STATEMENT OF CHANGES IN EQUITY for the financial year ended 30 June 2017
Notes
Contributed capital
$'000
Asset revaluation
reserves $'000
Accumulated surplus
$'000Total
$'000
Balance at 1 July 2015 9(a) 160,413 100,299 183,911 444,623
Comprehensive result - 47,117 12,965 60,082
Balance at 1 July 2016 9(a) 160,413 147,416 196,876 504,705
Comprehensive result - - 10,466 10,466
Balance at 30 June 2017 9(a) 160,413 147,416 207,342 515,171
The above Statement of Changes in Equity should be read in conjunction with the accompanying notes.

55 FINANCIAL REPORT
CASH FLOW STATEMENT for the financial year ended 30 June 2017
Notes2017
$’0002016
$’000
Cash Flows from Operating Activities
Receipts
Service and usage charges 75,784 80,008
Goods and Services Tax received from the ATO 7,113 4,903
Developer contributions 14,482 7,590
Interest 15 253
Grants received from government – Other 367 208
Subtotal 97,761 92,962
Payments
Payment to employees (15,287) (14,562)
Payment to suppliers (48,247) (45,217)
Interest and other costs of finance (11,482) (11,204)
Income tax (5,277) (340)
Environmental contribution levy 8(b) (2,410) (2,410)
Goods and Services Tax paid to the ATO (170) (164)
Subtotal (82,873) (73,897)
Net cash inflow from Operating Activities 6(b) 14,888 19,065
Cash Flows from Investing Activities
Payments for infrastructure assets, property, plant and equipment (54,078) (30,934)
Deferred capital works security bonds 2,490 -
Proceeds from sale of infrastructure assets, property, plant & equipment 335 461
Payments for intangible assets (1,900) (1,300)
Net cash outflow from Investing Activities (53,153) (31,773)
Cash Flows from Financing Activities
Proceeds from new, paid down and refinanced borrowings 49,250 15,000
Payment for maturing borrowings paid down and refinanced (17,000) (15,000)
Net cash inflow from Financing Activities 32,250 -
Net decrease in cash and cash equivalents (6,015) (12,708)
Cash and cash equivalents at the beginning of the financial year 7,613 20,321
Cash and cash equivalents at end of the financial year 6(b) 1,598 7,613
The above Cash Flow Statement should be read in conjunction with the accompanying notes.

56 WESTERN WATER ANNUAL REPORT 2016/17
NOTES TO THE FINANCIAL STATEMENTS NOTE 1: ABOUT THIS REPORT
Basis of accountingThe financial report includes separate financial statements for Western Region Water Corporation (Western Water, or the Corporation) as an individual reporting entity. This annual financial report is an audited general purpose financial report that consists of a Comprehensive Operating Statement, Balance Sheet, Statement of Changes in Equity, Cash Flow Statement and accompanying notes for Western Water for the year ended 30 June 2017.
The general purpose financial report has been prepared in accordance with Australian Accounting Standards (AAS), Interpretations and other authoritative pronouncements of the Australian Accounting Standards Board, and the requirements of the Financial Management Act 1994 (FMA) and applicable Ministerial Directions.
Western Water is a not-for-profit entity for the purpose of preparing these financial statements. Where appropriate, those AAS paragraphs applicable to not-for-profit entities have been applied.
The accrual basis of accounting has been applied in the preparation of these financial statements whereby assets, liabilities, equity, revenue and expenses are recognised in the reporting period to which they relate, regardless of when cash is received or paid.
The annual financial statements were authorised for issue by the Board on 7 September 2017. The principal address is:
Western Region Water Corporation 36 Macedon Street SUNBURY VIC 3429
Accounting policiesAccounting policies are selected and applied in a manner which ensures that the resulting financial information satisfies the concepts of relevance and reliability, thereby ensuring that the substance of the underlying transactions or other events is reported.
Unless otherwise stated, all accounting policies applied are consistent with those of the prior year.
Functional and presentation currencyItems included in these financial statements are measured using the currency of the primary economic environment in which Western Water operates (the functional currency). The financial statements are presented in Australian dollars, which is Western Water’s functional and presentation currency.
Classification between current and non-currentIn the determination of whether an asset or liability is current or non-current, consideration is given to the time when each asset or liability is expected to be realised or paid. The asset or
liability is classified as current if it is expected to be released or settled within the next twelve months, being Western Water's operational cycle - see under Provisions for a variation in relation to employee benefits.
Comparative figuresWhere appropriate, comparative figures have been amended to align with current presentation and disclosure.
RoundingUnless otherwise stated, amounts in the report have been rounded to the nearest thousand dollars. Figures in the financial statements may not equate due to rounding.
Historical cost conventionThese financial statements have been prepared under the historical cost convention, except for the revaluation of financial assets, all classes of property, plant and equipment and investment property.
Accounting estimatesJudgements, estimates and assumptions are required to be made about financial information being presented. The significant judgements made in the preparation of these financial statements are disclosed in the notes where amounts affected by those judgements are disclosed. Estimates and associated assumptions are based on professional judgements derived from historical experience and various other factors that are believed to be reasonable under the circumstances. Actual results may differ from these estimates. Revisions to accounting estimates are made in the period in which the estimate is revised and also in future periods that are affected by the revision.
Judgements and assumptions made by Western Water in applying Australian Accounting Standards that have significant effects on the financial statements and estimates relate to:
• Accrued revenue (Note 2(b)(i));
• Residual values and useful lives (Note 4(a)(v));
• Fair value of infrastructure assets, property, plant and equipment (Note 4(a)(iii),4(a)(iv) and 7(f ));
• Impairment of assets (Note 4(a)(vi), 4(b) and 7(f ));
• Contingent assets and liabilities (Note 7(c));
• Employee benefit provisions (Note 3(b)(ii) and 3(c)(ii));
• Actuarial assumptions for employee benefit provisions based on likely tenure of existing staff, patterns of leave claims (Note 3(b) and 3(c)); and
• Recognition of deferred tax assets and liabilities (Note 8(a)(ii)).

57 FINANCIAL REPORT
NOTE 2: FUNDING DELIVERY OF OUR SERVICES
IntroductionThis section provides additional information about how Western Water is funded and the accounting policies that are relevant for an understanding of the items recognised in the financial statements.
Western Water’s overall objective is to deliver safe, reliable and affordable water, sewerage and recycled water services that meet the diverse needs of our customers and community. Our intent is to work with customers and stakeholders to enhance regional economic growth and resilience against a backdrop of population growth, a changing climate, natural resource scarcity and while caring for the environment.
Western Water generates its key sources of funding from water, sewerage, recycled water services and developer contributions.
(a) Summary of income that funds the delivery of our services
2017 $’000
2016 $’000
Revenue
Service charges 45,367 48,688
Water usage charges 21,102 25,162
Government grants and contributions 89 179
Interest income 15 228
Developer contributions
• Fees paid by developers 13,709 7,590
• Assets received from developers 17,142 17,584
Other income 3,398 2,646
Total revenue 100,822 102,077
Income is recognised to the extent it is probable the economic benefits will flow to Western Water and the income can be reliably measured at fair value. Where applicable, amounts disclosed as income are net of returns, allowances, duties and taxes.
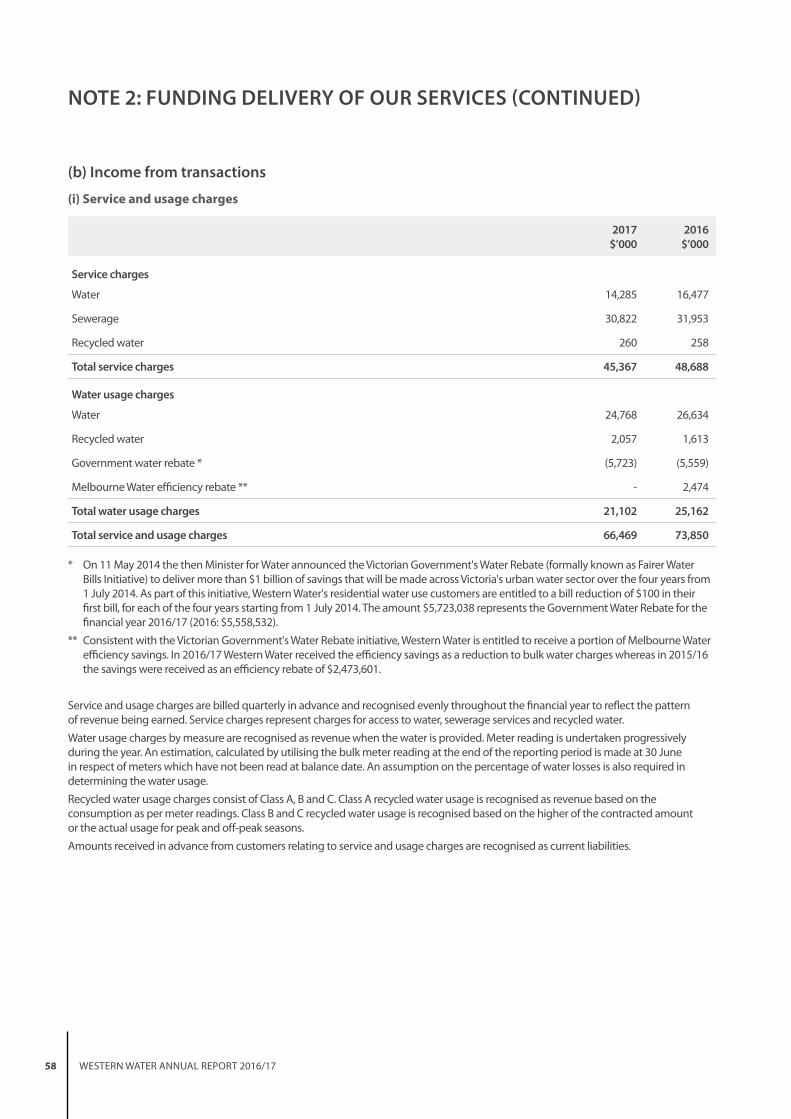
58 WESTERN WATER ANNUAL REPORT 2016/17
NOTE 2: FUNDING DELIVERY OF OUR SERVICES (CONTINUED)
(b) Income from transactions
(i) Service and usage charges
2017 $’000
2016 $’000
Service charges
Water 14,285 16,477
Sewerage 30,822 31,953
Recycled water 260 258
Total service charges 45,367 48,688
Water usage charges
Water 24,768 26,634
Recycled water 2,057 1,613
Government water rebate * (5,723) (5,559)
Melbourne Water efficiency rebate ** - 2,474
Total water usage charges 21,102 25,162
Total service and usage charges 66,469 73,850
* On 11 May 2014 the then Minister for Water announced the Victorian Government's Water Rebate (formally known as Fairer Water Bills Initiative) to deliver more than $1 billion of savings that will be made across Victoria's urban water sector over the four years from 1 July 2014. As part of this initiative, Western Water's residential water use customers are entitled to a bill reduction of $100 in their first bill, for each of the four years starting from 1 July 2014. The amount $5,723,038 represents the Government Water Rebate for the financial year 2016/17 (2016: $5,558,532).
** Consistent with the Victorian Government's Water Rebate initiative, Western Water is entitled to receive a portion of Melbourne Water efficiency savings. In 2016/17 Western Water received the efficiency savings as a reduction to bulk water charges whereas in 2015/16 the savings were received as an efficiency rebate of $2,473,601.
Service and usage charges are billed quarterly in advance and recognised evenly throughout the financial year to reflect the pattern of revenue being earned. Service charges represent charges for access to water, sewerage services and recycled water.
Water usage charges by measure are recognised as revenue when the water is provided. Meter reading is undertaken progressively during the year. An estimation, calculated by utilising the bulk meter reading at the end of the reporting period is made at 30 June in respect of meters which have not been read at balance date. An assumption on the percentage of water losses is also required in determining the water usage.
Recycled water usage charges consist of Class A, B and C. Class A recycled water usage is recognised as revenue based on the consumption as per meter readings. Class B and C recycled water usage is recognised based on the higher of the contracted amount or the actual usage for peak and off-peak seasons.
Amounts received in advance from customers relating to service and usage charges are recognised as current liabilities.

59 FINANCIAL REPORT
(ii) Developer contributions
2017 $’000
2016 $’000
Developer contributions
Fees paid by developers 13,709 7,590
Assets received from developers 17,142 17,584
Total developer contributions 30,851 25,174
Water infrastructure assets built by developers in new land subdivisions that on completion are transferred to Western Water or fees paid by developers to connect new developments to Western Water's existing water supply and sewerage systems, are recognised as revenue when the contributions are received.
Contributions of resources received free of charge or for nominal consideration are recognised at their fair value when Western Water obtains control over them, irrespective of whether restrictions or conditions are imposed over the use of the contributions. Contributions in the form of services are only recognised when a fair value can be reliably determined and the services would have been purchased if not received as a donation.
(iii) Other revenueOther income items are recognised on an accrual basis. Other income consists of items given in the table below:
2017 $’000
2016 $’000
Tapping and connection fees 1,776 1,436
Information statements 472 404
Chargeable works 206 249
Special meter reading fees 173 -
Property rental 56 65
Other 715 492
Total other revenue 3,398 2,646
Property rental income
Income from operating leases (i.e. property rentals) is recognised as income on a straight line basis over the lease term.

60 WESTERN WATER ANNUAL REPORT 2016/17
NOTE 3: THE COST OF DELIVERING SERVICES
IntroductionThis section provides additional information about how Western Water's funding is applied and the accounting policies that are relevant for an understanding of the items recognised in the financial statements.
(a) Summary of expenses incurred in delivery of services
2017 $’000
2016 $’000
Expenses
Employee benefits 15,867 14,609
Repairs and maintenance 3,975 4,013
Water purchases 9,679 14,934
Electricity 3,366 3,319
Other operating & administration 16,938 14,154
Total expenses incurred in delivery of services 49,825 51,029
Water purchases cost includes water usage and availability charges for the Greater Yarra System - Thomson River and Southern Rural Water reservoirs. Water purchases cost is recognised on an accrual basis.
Electricity expense includes the electricity used in water treatment activities and normal operating activities. Electricity expense is recognised on an accrual basis.
(b) Our people
(i) Employee benefits - Comprehensive Operating Statement
2017 $’000
2016 $’000
Salary & wages 13,588 12,523
Annual leave and long service leave expense 235 114
Employer's superannuation contributions 1,211 1,143
Other 833 829
Total employee benefits 15,867 14,609
Employee benefits include all costs related to employment including wages and salaries, fringe benefits tax, leave entitlements, termination payments and WorkCover premiums.
The amount charged to the Comprehensive Operating Statement in respect of superannuation represents contributions made or due by Western Water to the relevant superannuation plans in respect to the services of Western Water’s staff (both past and present). Superannuation contributions are made to the plans based on the relevant rules of each plan and any relevant compulsory superannuation requirements that Western Water is required to comply with.

61 FINANCIAL REPORT
(ii) Employee benefits – Balance SheetProvision is made for benefits accruing to employees in respect of annual leave and long service leave (LSL) for services rendered to the reporting date and recorded as an expense during the period the services are delivered.
2017 $’000
2016 $’000
Current provisions
Annual leave
Unconditional and expected to settle within 12 months 873 793
Long service leave
Unconditional and expected to settle within 12 months 399 282
Unconditional and expected to settle after 12 months 1,612 1,532
Provisions for on-costs
Unconditional and expected to settle within 12 months 214 186
Unconditional and expected to settle after 12 months 248 238
Total current provisions 3,346 3,031
Non-current provisions
Long service leave
Conditional and expected to settle after 12 months 358 428
Provisions for on-costs
Conditional and expected to settle after 12 months 55 66
Total non-current provisions 413 494
Total provisions for employee benefits 3,759 3,525
Reconciliation of movement in on-cost provision
Opening balance 490 481
Additional provisions recognised 25 9
Unwind of discount and effect of changes in the discount rate 2 -
Closing balance 517 490
Annual leaveAnnual leave is recognised in the provision for employee benefits as ‘current liabilities’, because Western Water does not have an unconditional right to defer settlements of these liabilities.
Depending on the expectation of the timing of settlement, liabilities for annual leave are measured at:
• nominal value if Western Water expects to wholly settle within 12 months;
• present value if Western Water does not expect to wholly settle within 12 months.
On-costsOn-costs such as payroll tax and workers' compensation insurance are recognised as liabilities when the employment to which they relate has occurred. They are not employee benefits and are recognised separately from the provisions for employee benefits.

62 WESTERN WATER ANNUAL REPORT 2016/17
NOTE 3: THE COST OF DELIVERING SERVICES (CONTINUED)
(b) Our people (continued)
(ii) Employee benefits – Balance Sheet (continued)
Long service leave (LSL)Liability for long service leave (LSL) is recognised in the provision for employee benefits.
Unconditional LSL is disclosed as a current liability, even where Western Water does not expect to settle the liability within 12 months because it will not have the unconditional right to defer the settlement of the entitlement should an employee take leave within 12 months.
The components of this current LSL liability are measured at:
• nominal value - if Western Water expects to wholly settle within 12 months; and
• present value - if Western Water does not expect to wholly settle within 12 months.
Conditional LSL is disclosed as a non-current liability. There is an unconditional right to defer the settlement of the entitlement until the employee has completed the requisite years of service. This non-current LSL liability is measured at present value.
Any gain or loss following revaluation of the present value of non-current LSL liability is recognised as a transaction, except to the extent that a gain or loss arises due to changes in bond interest rates for which it is then recognised in the net result.
(c) SuperannuationWestern Water makes its employer superannuation contributions in respect of its employees to a number of superannuation funds, with the majority of contributions made to the Local Authorities Superannuation Funds (the Fund).
The Fund has two categories of membership, accumulation and defined benefit, each of which is funded differently.
The obligations for contributions to the Fund and other Superannuation Funds are recognised as an expense in the Comprehensive Operating Statement when they are made or due.
(i) AccumulationThe Fund's accumulation category, Vision MySuper/Vision Super Saver, receives both employer and employee contributions on a progressive basis. Employer contributions are normally based on a fixed percentage of employee earnings. For the year ended 30 June 2017, this was 9.50% (2016: 9.50%) as required under Superannuation Guarantee legislation.
(ii) Defined Benefit PlanWestern Water does not use defined benefit accounting for its defined benefit obligations under the Fund's defined benefit category. This is because the Fund's defined benefit category is a pooled multi-employer sponsored plan.
There is no proportional split of the defined benefit liabilities, assets or costs between the participating employers as the defined benefit obligation is a floating obligation between the participating employers and the only time that the aggregate obligation is allocated to specific employers is when a call is made. As a result, the level of participation of Western Water in the Fund cannot be measured as a percentage compared with other participating employers. Therefore, the Fund Actuary is unable to allocate benefit liabilities, assets and costs between employers for the purposes of AASB 119.
(iii) Funding ArrangementsWestern Water makes employer contributions to the defined benefit category of the Fund at rates determined by the Trustee on the advice of the Fund's Actuary.
As at 30 June 2016, an interim actuarial investigation was held as the Fund provides lifetime pensions in the defined benefit category. The vested benefit index (VBI) of the defined benefit category of which Western Water is a contributing employer was 102.0%. To determine the VBI, the Fund Actuary used the following long-term assumptions:
• Net investment returns 7.0% pa;
• Salary information 4.25% pa; and
• Price inflation (CPI) 2.5% pa.
Vision Super has advised that the estimated VBI at June 2017 was 103.1%.
The VBI is to be used as the primary funding indicator. Because the VBI was above 100%, the 2016 interim actuarial investigation determined the defined benefit category was in a satisfactory financial position and that no change was necessary to the defined benefit category’s funding arrangements from prior years.

63 FINANCIAL REPORT
(iv) Employer contributions
Regular contributions
On the basis of the results of the 2016 interim actuarial investigation conducted by the Fund Actuary, Western Water makes employer contributions to the Fund’s defined benefit category at rates determined by the Fund’s Trustee. For the year ended 30 June 2017, this rate was 9.50% of members' salaries (2016: 9.50%). This rate will increase in line with the required Superannuation Guarantee contribution rate increases.
In addition, Western Water reimburses the Fund to cover the excess of the benefits paid as a consequence of retrenchment above the funded resignation or retirement benefit.
Funding calls
If the defined benefit category is in an unsatisfactory financial position at an actuarial investigation or the defined benefit category‘s VBI is below its shortfall limit at any time other than the date of the actuarial investigation, the defined benefit category has a shortfall for the purposes of SPS 160 and the Fund is required to put a plan in place so that the shortfall is fully funded within three years of the shortfall occurring. The Fund monitors its VBI on a quarterly basis and the Fund has set its shortfall limit at 97%.
In the event that the Fund Actuary determines that there is a shortfall based on the above requirement, the Fund’s participating employers (including Western Water) are required to make an employer contribution to cover the shortfall.
Using the agreed methodology, the shortfall amount is apportioned between the participating employers based on the pre-1 July 1993 and post-30 June 1993 service liabilities of the Fund’s defined benefit category, together with the employer’s payroll at 30 June 1993 and at the date the shortfall has been calculated.
Due to the nature of the contractual obligations between the participating employers and the Fund, and that the Fund includes lifetime pensioners and their reversionary beneficiaries, it is unlikely that the Fund will be wound up.
If there is a surplus in the Fund, the surplus cannot be returned to the participating employers. In the event that a participating employer is wound-up, the defined benefit obligations of that employer will be transferred to that employer’s successor.
The 2016 interim actuarial investigation surplus amountsThe Fund’s interim actuarial investigation as at 30 June 2016 identified the following in the defined benefit category of which Western Water is a contributing employer:
• A VBI surplus of $40.3 million; and
• A total service liability surplus of $156 million.
The VBI surplus means that the market value of the funds’ assets supporting the defined benefit obligations exceed the vested benefits that the defined benefit members would have been entitled to if they had all exited on 30 June 2016.
The total service liability surplus means that the current value of the assets in the Fund's defined benefit category plus expected future contributions exceeds the value of expected future benefits and expenses.
Western Water was notified of the 30 June 2016 VBI during August 2016.
The 2017 full triennial actuarial investigationA full actuarial investigation is being conducted for the Fund’s position as at 30 June 2017. It is anticipated that this actuarial investigation will be completed in December 2017.
(v) Superannuation contributionsContributions by Western Water (excluding any unfunded liability payments) to the various superannuation plans for the financial year ended 30 June 2017 are detailed below:
Scheme Type of scheme Contribution Rate2017
$’0002016
$’000
Vision Super Defined Benefit 9.50% 138 117
Vision Super Defined Contribution 9.50% 745 736
Other Super Funds Defined Contribution 9.50% - 10.00% 437 378
1,320 1,231
As at the reporting date, there was $79,810 (2016: $74,828) payable to Vision Super and $58,179 (2016: $41,694) payable to other super funds through Vision Clearing House for payments in the normal course of business and no loans issued from or to any of the above funds.
The expected contributions to be paid to the defined benefit category of Vision Super for the year ending 30 June 2018 is $138,587 (2017: $132,347).

64 WESTERN WATER ANNUAL REPORT 2016/17
NOTE 3: THE COST OF DELIVERING SERVICES (CONTINUED)
(d) Repairs and maintenanceRoutine maintenance, repair costs and minor renewal costs are expensed as incurred. Where the repair relates to the replacement of a component of an asset and the cost exceeds the capitalisation threshold (Note 4(a)(ii)), the cost is capitalised and depreciated.
2017 $’000
2016 $’000
Labour and materials 839 928
Mechanical 702 873
Electrical 800 715
Land and ground 523 324
Bio solids 115 609
Instrumentation and control 407 304
Incidents 270 80
Dam safety 232 70
Buildings 87 110
Total repairs and maintenance 3,975 4,013
(e) Grants and other transfers
2017 $’000
2016 $’000
Grants and other transfers 32 19
Total grants and other transfers 32 19
Grants and other transfers to third parties (other than contribution to owners) are recognised as an expense in the reporting period in which they are paid or payable. They include transactions such as: grants, subsidies, personal benefit payments made in cash to individuals, other transfer payments made to State-owned agencies, local government, non-government schools, and community groups.

65 FINANCIAL REPORT
(f ) Other operating and administration
Note2017
$’0002016
$’000
Supplies and services
Contractors and consultants 6,440 3,938
Office supplies and consumables 2,892 2,608
Information Communication Technology supplies and consumables 1,413 1,340
Water and recycled water quality testing 1,246 1,135
Chemicals 848 1,128
Staff related expenses - non labour 652 533
Travel and related expenses 654 553
Materials 437 384
Marketing and media 302 439
Biodiversity management 113 79
Directors fees 150 163
Insurance 223 365
Legal costs 123 120
License fee 199 127
Total supplies and services 15,692 12,912
Operating lease rental 634 634
Bad and doubtful debts 356 388
Auditors' remuneration 9 (e) 256 220
Total other operating and administration 16,938 14,154
Other operating and administration expenses generally represent the day-to-day running costs incurred in normal operations.
Supplies and services are recognised as an expense in the reporting period in which they are incurred.
Operating lease payments are recognised on a straight line basis over the lease term, except where another systematic basis is more representative of the time pattern of the benefits derived from the use of the leased asset.

66 WESTERN WATER ANNUAL REPORT 2016/17
NOTE 4: KEY ASSETS AVAILABLE TO SUPPORT OUTPUT DELIVERY
IntroductionWestern Water controls infrastructure and other assets that are utilised in fulfilling its objectives and conducting its activities. They represent the key resources that have been entrusted to Western Water to be utilised for delivery of those outputs.
(a) Total infrastructure assets, property, plant and equipment
(i) Classes of infrastructure, property, plant and equipment
2017 $’000
2016 $’000
Land
Gross carrying amount - at fair value 27,073 26,595
Net carrying amount 27,073 26,595
Buildings
Gross carrying amount - at fair value 10,179 9,820
Less: accumulated depreciation (357) -
Net carrying amount 9,822 9,820
Infrastructure
Gross carrying amount - at fair value 746,546 690,091
Less: accumulated depreciation (17,538) -
Net carrying amount 729,008 690,091
Equipment
Gross carrying amount - at fair value 17,825 16,374
Less: accumulated depreciation (8,664) (7,569)
Net carrying amount 9,161 8,805
Motor vehicles
Gross carrying amount - at fair value 3,704 3,664
Less: accumulated depreciation (1,255) (931)
Net carrying amount 2,449 2,733
Leasehold assets
Gross carrying amount - at fair value 1,896 1,886
Less: accumulated depreciation (1,842) (1,592)
Net carrying amount 54 294
Capital work in progress
Gross carrying amount - at cost 58,197 40,371
Total infrastructure, property, plant and equipment
Gross carrying amount 865,420 788,801
Less: accumulated depreciation (29,656) (10,092)
Net carrying amount 835,764 778,709

67 FINANCIAL REPORT
(ii) Initial recognitionInfrastructure assets, property, plant and equipment represent non-current physical assets comprising land, buildings, water, sewerage and recycled water infrastructure, plant, equipment and motor vehicles, all used by Western Water in its operations. Items with a cost or value in excess of $1,000 (2016: $1,000) and a useful life of more than one year are recognised as an asset (Note 3(d)). All other assets acquired are expensed.
Items of infrastructure assets, property, plant and equipment, are measured initially at cost and subsequently revalued at fair value less accumulated depreciation and impairment. Where an asset is acquired for no or nominal cost, the cost is its fair value at the date of acquisition. Assets transferred as part of a machinery of government change are transferred at their carrying amount.
The cost of constructed non-financial physical assets includes the cost of all materials used in construction, direct labour on the project and an appropriate proportion of variable and fixed overheads.
Leasehold improvements are recognised at fair value and are amortised over the unexpired period of the lease or the estimated useful life of the improvement, whichever is the shorter.
The initial cost for non-financial physical assets under a finance lease is measured at amounts equal to the fair value of the leased asset or, if lower, the present value of the minimum lease payments, each determined at the inception of the lease.
For all assets measured at fair value, the current use is considered the highest and best use.
(iii) Subsequent measurement of infrastructure assets, property, plant and equipmentInfrastructure assets, property, plant and equipment are subsequently measured at fair value less accumulated depreciation and impairment. Fair value is determined with regard to the asset’s highest and best use (considering legal or physical restrictions imposed on the asset, public announcements or commitments made in relation to the intended use of the asset). Refer to Note 7(f) for fair value disclosures.
(iv) Revaluation of infrastructure assets, property, plant and equipmentRevaluations are conducted in accordance with FRD 103F. Scheduled revaluations are undertaken every five years with an annual assessment of fair value to determine if it is materially different to the carrying value. If the difference to carrying value is greater than 10 per cent, a management revaluation is undertaken while a movement greater than 40 per cent will normally involve an Approved Valuer (usually the Valuer General of Victoria) to perform a detailed assessment of the fair value. If the movement in fair value since the last revaluation is less than or equal to 10 per cent, then no change is made to carrying amounts.
Plant, equipment, infrastructure and motor vehicles are measured at Fair Value.
Water infrastructure assets are measured at fair value less accumulated depreciation and impairment in accordance with FRD 103F. These assets comprise substructures or underlying systems held to facilitate harvesting, storage, treatment and transfer of water to meet customer needs. They also include infrastructure assets that underlie sewage and recycled water systems.
Revaluation increments are credited directly to equity in the asset revaluation reserve, except that, to the extent that an increment reverses a revaluation decrement in respect of that class of asset previously recognised as an expense in determining the net result, the increment is recognised as revenue in determining the net result.
Revaluation decrements are recognised immediately as an expense in the net result, except that, to the extent that a credit balance exists in the asset revaluation reserve in respect of the same class of assets, they are debited to the asset revaluation reserve.
Revaluation increases and revaluation decreases relating to individual assets within a class of infrastructure assets, property, plant and equipment are offset against one another within that class but are not offset in respect of assets in different classes.
Asset revaluation reserves are not transferred to accumulated surplus/ (deficit) on de-recognition of the relevant asset.

68 WESTERN WATER ANNUAL REPORT 2016/17
NOTE 4: KEY ASSETS AVAILABLE TO SUPPORT OUTPUT DELIVERY (CONTINUED)
(a) Total infrastructure assets, property, plant and equipment (continued)
(v) Depreciation and amortisation
Charge for the period2017
$’0002016
$’000
Depreciation
Buildings 357 256
Infrastructure 17,538 14,822
Equipment 1,364 1,418
Motor vehicles 552 420
Total depreciation 19,811 16,916
Amortisation
Leasehold improvements 250 253
Total amortisation 250 253
All infrastructure assets, property, plant and equipment that have finite useful lives are depreciated. Where assets have separate identifiable components that have distinct useful lives and/or residual values, a separate depreciation rate is determined for each component.
Leasehold improvements are recognised at fair value and are amortised over the unexpired period of the lease or the estimated useful life of the improvement, whichever is the shorter. At balance date leasehold improvements are amortised over a 10 year period.
Depreciation is calculated using the straight line basis, at rates that allocate the asset’s value, less any estimated residual value, over its estimated useful life, commencing from the time the asset is held ready for use.

69 FINANCIAL REPORT
Depreciation useful lives for each asset class are consistent with the previous year and fall within the following ranges:
Asset Useful life
Buildings 20 to 75 Years
Infrastructure
Water & recycled water:
• Storage 20 to 350 Years
• Distribution network 50 to 110 Years
• Treatment plants 10 to 90 Years
Sewerage:
• Storage 20 to 350 Years
• Distribution network 50 to 120 Years
• Treatment plants 10 to 90 Years
Plant & equipment:
• Equipment 2 to 50 Years
• Machinery 2 to 50 Years
• Furniture & computers 3 to 20 Years
• Motor vehicles 2 to 8 Years
Leasehold assets Up to 10 Years
The estimated useful lives, residual values and depreciation method are reviewed at the end of each annual reporting period, and adjustments made where appropriate.
Leasehold improvements are amortised over the shorter of the lease term and their useful lives.
Indefinite life assetsLand assets which are considered to have an indefinite life, are not depreciated. Depreciation is not recognised in respect of these assets because their service potential has not, in any material sense, been consumed during the reporting period.
(vi) Impairment of assetsNon-financial assets, including items of infrastructure, property, plant and equipment, are tested for impairment whenever there is an indication that the asset may be impaired.
The assets concerned are tested as to whether their carrying value exceeds their recoverable amount. Where an asset's carrying amount exceeds its recoverable amount, the difference will be debited to the asset revaluation surplus amount applicable to that class of asset and amounts in excess of the applicable asset revaluation surplus amount will be written off to the Comprehensive Operating Statement.
If there is an indication that there has been a reversal in impairment, the carrying amount shall be increased to its recoverable amount. However, this reversal will not increase the asset’s carrying amount above what would have been determined, net of depreciation or amortisation, if no impairment loss had been recognised in prior years.
The recoverable amount for most assets is measured at the higher of depreciated replacement cost and fair value less costs to sell. Recoverable amount for assets held primarily to generate net cash inflows is measured at the higher of the present value of future cash flows expected to be obtained from the asset and fair value less costs to sell.

70 WESTERN WATER ANNUAL REPORT 2016/17
NOTE 4: KEY ASSETS AVAILABLE TO SUPPORT OUTPUT DELIVERY (CONTINUED)
(a) Total infrastructure assets, property, plant and equipment (continued)
(vii) Reconciliation of movements in carrying values
Land at fair value
$'000
Buildings at fair value
$'000
Infrastructure at fair value
$'000
Equipment at fair value
$'000
Motor vehicles at
fair value $'000
Leasehold assets at
fair value $'000
Capital work in progress
at cost $'000
Total infrastructure,
property, plant and
equipment $'000
2017Infrastructure, property, plant and equipment
Opening balance 1 July 2016 26,595 9,820 690,091 8,805 2,733 294 40,371 778,709
Fair value of assets received free of charge - - 17,142 - - - - 17,142
Additions/capital expenditure 478 359 39,195 1,894 611 10 17,826 60,373
Disposals - - - (56) (343) - - (399)
Transfer between asset classes - - 118 (118) - - - -
Depreciation and amortisation - (357) (17,538) (1,364) (552) (250) - (20,061)
Closing balance 30 June 2017 27,073 9,822 729,008 9,161 2,449 54 58,197 835,764
2016Infrastructure, property, plant and equipment
Opening balance 1 July 2015 20,909 11,422 612,621 8,873 2,263 547 19,911 676,546
Fair value of assets received free of charge - - 17,584 - - - - 17,584
Additions/capital expenditure 2,356 - 9,676 1,061 1,406 - 19,084 33,583
Disposals - - - (6) (516) - - (522)
Transfer between asset classes (Note 4(b)) - - (40) 40 - - 1,376 1,376
Adjustment to revaluation 3,330 (1,346) 65,072 255 - - - 67,311
Depreciation and amortisation - (256) (14,822) (1,418) (420) (253) - (17,169)
Closing balance 30 June 2016 26,595 9,820 690,091 8,805 2,733 294 40,371 778,709

71 FINANCIAL REPORT
(viii) Net gain/(loss) on disposal of infrastructure assets, property, plant and equipmentThe total revenue from ordinary activities includes the following net loss.
2017 $’000
2016 $’000
Proceeds from sale of infrastructure, property, plant and equipment 335 461
Less: Written down value of asset sold (399) (622)
Net loss on disposal of infrastructure, property, plant and equipment (64) (161)
(ix) Capital commitmentsCapital commitments are arising from contracts. These commitments are recorded below at their nominal value and inclusive of GST. These future expenditures cease to be disclosed as commitments once the related capital expenditure is recognised in the balance sheet as infrastructure assets, property, plant and equipment.
2017 $’000
2016 $’000
Capital expenditure commitments payable
within one year 20,907 33,919
one to five years 29,689 24,108
Total capital commitments (inclusive of GST) 50,596 58,027
Less GST recoverable (4,600) (5,275)
Total commitments (exclusive of GST) 45,996 52,752

72 WESTERN WATER ANNUAL REPORT 2016/17
NOTE 4: KEY ASSETS AVAILABLE TO SUPPORT OUTPUT DELIVERY (CONTINUED)
(b) Intangible assets
Computer software *
$'000
Bulk entitlement
$'000
Assigned water
allocation $'000
Total $'000
Year ended 30 June 2017
At 1 July 2016, net of accumulated amortisation 4,579 2,591 - 7,170
Additions 2,790 - 1,600 4,390
Amortisation (1,891) - - (1,891)
5,478 2,591 1,600 9,669
Under construction
At 1 July 2016 2,020 - - 2,020
Additions 4,752 - - 4,752
Capitalisation (4,255) - - (4,255)
2,517 - - 2,517
At 30 June 2017, net of accumulated amortisation 7,995 2,591 1,600 12,186
Cost 20,169 2,591 1,600 24,360
Less: accumulated amortisation (12,174) - - (12,174)
Net carrying amount 7,995 2,591 1,600 12,186
Year ended 30 June 2016
At 1 July 2015, net of accumulated amortisation 4,995 2,591 - 7,586
Additions 1,226 - - 1,226
Amortisation (1,642) - - (1,642)
4,579 2,591 - 7,170
Under construction
At 1 July 2015 2,623 - - 2,623
Additions 773 - - 773
Transfer between asset classes (Note 4(a)(vii)) (1,376) - - (1,376)
2,020 - - 2,020
At 30 June 2016, net of accumulated amortisation 6,599 2,591 - 9,190
Cost 16,883 2,591 - 19,474
Less: accumulated amortisation (10,284) - - (10,284)
Net carrying amount 6,599 2,591 - 9,190
* Software includes capitalised development costs being an internally generated intangible asset.

73 FINANCIAL REPORT
RecognitionIntangible assets represent identifiable non-monetary assets without physical substance. Purchased intangible assets are initially recognised at cost. When the recognition criteria in AASB 138 Intangible Assets is met, internally generated intangible assets are recognised at cost. Subsequently, intangible assets with finite useful lives are carried at cost less accumulated amortisation and accumulated impairment losses. Amortisation begins when the asset is available for use, that is, when it is in the location and condition necessary for it to be capable of operating in the manner intended by management.
An internally-generated intangible asset arising from development (or from the development phase of an internal project) is recognised if, and only if, all of the following are demonstrated:
• the technical feasibility of completing the intangible asset so that it will be available for use or sale;
• an intention to complete the intangible asset and use or sell it;
• the ability to use or sell the intangible asset;
• the intangible asset will generate probable future economic benefits;
• the availability of adequate technical, financial and other resources to complete the development and to use or sell the intangible asset; and
• the ability to measure reliably the expenditure attributable to the intangible asset during its development.
A summary of the policies applied to the Corporation’s intangible assets is as follows:
Computer Software Bulk Entitlement Assigned Water Allocation
Useful lives Finite Infinite Finite
Amortisation method used 5 years - Straight line Not amortised or revalued Units of production as utilised
Acquired/ internally generated Acquired and internally generated
Acquired Acquired
Impairment test/ recoverable amount testing
Amortisation method reviewed at each financial year end: Reviewed annually for indicators of impairment
Annually tested and/or where an indicator of impairment exists
Annually tested and/or where an indicator of impairment exists
Permanent Water EntitlementsPermanent water entitlements purchased after 1 July 2011 are treated as an intangible asset on the Balance Sheet at cost (in accordance with AASB 138 Intangible Assets and FRD 109A Intangible Assets), and will not be subject to amortisation, as the permanent water entitlements have an indefinite life. Permanent water entitlements purchased after 1 July 2011 are tested annually for impairment. Bulk permanent water entitlements purchased prior to 1 July 2011 are not recorded in the Balance Sheet as an intangible asset, as they cannot be reliably measured.
Assigned Water AllocationIn accordance with the Water Act 1989, water allocation trading is permitted when the volume of unused water allocation available in a licence holder’s allocation account (Barwon Water in this instance) is greater than or equal to the volume being traded (in this instance 5,000 ML). Barwon Water offered for sale the right to an unused water allocation of 5,000 ML that was purchased by Western Water. The result of trade was a one-off transfer of 5,000 ML from Barwon Water’s Greater Yarra System-Thomson River allocation account to Western Water’s Greater Yarra System-Thomson River allocation account.
The right to the allocated water is a finite life intangible asset initially recognised at cost and after initial recognition Western Water will carry the asset at its cost less any accumulated amortisation and any accumulated impairment losses. Impairment testing will be undertaken at least annually.
As a finite life intangible asset, the water allocated will be amortised on a systematic basis over its useful life. This is based on the expected usage of the right. Assuming a normal climate and demand scenario usage is expected to occur over the period 2026/27 to 2035/36.

74 WESTERN WATER ANNUAL REPORT 2016/17
NOTE 4: KEY ASSETS AVAILABLE TO SUPPORT OUTPUT DELIVERY (CONTINUED)
(b) Intangible assets (continued)
(i) Amortisation
2017 $’000
2016 $’000
Charge for the period
Intangible assets 1,891 1,642
Total amortisation 1,891 1,642
The majority of the intangible assets with finite useful lives are amortised as an expense on a systematic basis (typically straight line), commencing from the time the asset is available for use. The Assigned Water Allocation will be amortised on the basis of the water being utilised or lost due to spillage. The amortisation periods are reviewed and adjusted if appropriate at each balance date. Intangible assets with indefinite useful lives are not amortised. However, all intangible assets are assessed for impairment annually as outlined below.
Impairment of intangible assetsIntangible assets with indefinite useful lives (and intangible assets not yet available for use) are tested annually for impairment and whenever there is an indication that the asset may be impaired. Intangible assets with finite useful lives are tested for impairment whenever an indication of impairment is identified.
In accordance with AASB 136 Impairment of Assets, Western Water has reviewed the carrying value of permanent water entitlements and the Assigned Water Allocation at 30 June 2017. The assets were tested for impairment using value in use at the cash generating unit (CGU) level. The value in use was higher than the carrying value therefore there is no impairment of the permanent water entitlements or the Assigned Water Allocation.
In determining the value in use, the permanent water entitlements and the Assigned Water Allocation have been allocated to the total water system CGU. The recoverable amount of the water system CGU has been determined based on a value in use calculation using current five year cash flow projections. Cash flows beyond the final year forecast period have been extrapolated using a 3.1% growth rate (reflecting an assumed 2.3% price escalation and 0.8% organic growth forecast).
A pre-tax nominal discount rate of 7.25% that represents the current market assessment of the risks specific to the CGU, a long term normalised view of the cost of equity and taking into consideration the time value of money, has been utilised in determining the value in use.
Management has assessed the sensitivity of the value in use to key assumptions and consider that no reasonable possible change in a key assumption would cause the CGU carrying amount to exceed its recoverable amount.

75 FINANCIAL REPORT
NOTE 5: OTHER ASSETS AND LIABILITIES
IntroductionThis section sets out those assets and liabilities that arose from Western Water's controlled operations.
(a) Receivables
2017 $’000
2016 $’000
Current
Contractual
Trade receivables 6,338 6,780
Accrued water income 5,152 5,129
Provision for impaired receivables (87) (155)
11,403 11,754
Statutory
GST receivable 1,913 995
Total current receivables 13,316 12,749
Non-current
Contractual
Other receivables 187 181
Total non-current receivables 187 181
Total receivables 13,503 12,930
Contractual receivables, classified as financial instruments and categorised as receivables. They are initially recognised at fair value plus any directly attributable transaction costs. Subsequent to initial measurement they are measured at amortised cost using the effective interest method, less any impairment. Current debtors - contractual relating to trade receivables are due for settlement no more than 28 days from the date of recognition for water service and usage debtors, and no more than 30 days for other debtors.
Current debtors - statutory relating to GST receivables, do not arise from a contract and are recognised and measured similarly to contractual receivables (except for impairment), but are not classified as financial instruments.
Non-current debtors - contractual relating to other receivables are Private Schemes, payable on terms of up to 20 years.
Payments received from customers in advance have been separated out from debtors and disclosed as a liability.
Western Water bills both existing customers and non-customers a Waterways & Drainage Charge for all properties that fall within a designated boundary. The charge is not recognised as revenue by Western Water as the funds are collected on behalf of Melbourne Water and therefore recognised as a corresponding liability.
Western Water only remits funds to Melbourne Water upon receipt from the customer.
Fixed and variable service charges for Water, Sewer, Recycled Water (excluding Class B & C) and Melbourne Water Waterways and Drainage charge are levied under the Water Act 1989 and therefore uncollected charges remain an outstanding charge on the property, providing Western Water with an opportunity to collect when the property is sold.

76 WESTERN WATER ANNUAL REPORT 2016/17
NOTE 5: OTHER ASSETS AND LIABILITIES (CONTINUED)
(a) Receivables (continued)
(i) Movement in the provision for impaired receivableAs at 30 June 2017, current receivables of the Corporation with a nominal value of $87,210 (2016: $154,515) were impaired. The amount of the provision was $87,210 (2016: $154,515). The individually impaired receivables relate to provision of Recycled Water Service, cost recovery, 3rd party damage to Western Water assets and unlocatable vacated tenants.
2017 $’000
2016 $’000
Balance at beginning of the year (155) (165)
Provision for impairment recognised during the year (356) (378)
Receivables written off during the year as uncollectable 424 388
Balance at end of the year (87) (155)
Collectability of contractual receivables is reviewed on an ongoing basis. A provision for impaired receivables is recognised when there is objective evidence that the debts may not be collected and bad debts are written off when identified.
In assessing impairment of statutory (non-contractual) financial assets, which are not financial instruments, professional judgement is applied in assessing materiality using estimates, averages and other computational methods in accordance with AASB 136 Impairment of Assets.
A provision is made for estimated irrecoverable amounts from the sale of goods and services when there is objective evidence that an individual receivable is impaired. The increase in the provision for the year is recognised in the net result.
Bad debts considered as written off by mutual consent are classified as a transaction expense. Bad debts not written off are included in the provision for impaired receivables.
(ii) Ageing analysis of contractual receivablesThe ageing of these receivables is as follows:
2017 $’000
2016 $’000
Not past due and not impaired 6,064 6,095
Total not past due and not impaired 6,064 6,095
1 to 3 months 2,852 3,185
4 months 91 12
Over 4 months 2,396 2,462
Total past due but not impaired 5,339 5,659
Total contractual receivables 11,403 11,754
No interest is charged on outstanding receivables. The average credit period for sales of goods/services and for other receivables is 30 days. There are no material financial assets that are individually determined to be impaired.
Past due but not impaired trade receivables relate to a number of independent customers for whom there is no recent history of default.
Based on credit history, it is expected that not past due and not impaired trade receivables amounts will be received when due. There are no financial assets that have had their terms renegotiated so as to prevent them from being past due or impaired, and they are stated at the carrying amounts as indicated.

77 FINANCIAL REPORT
(b) Payables
2017 $’000
2016 $’000
Current/unsecured
Contractual
Trade creditors 11,187 5,659
Contractor deposits & retentions 4,064 1,030
Accrued expenses – Interest 2,403 2,336
Accrued expenses – Other 11,779 8,316
Total contractual payables 29,433 17,341
Statutory
Payables – GST 41 16
Payables – FBT 10 12
Payables – Superannuation 138 117
Payables – Payroll Tax 58 53
Total statutory payables 247 198
Total current payables 29,680 17,539
Payables consists of:
• contractual payables, classified as financial instruments and measured at amortised cost. Trade creditors represent liabilities for goods and services provided to Western Water prior to the end of the financial year that are unpaid; and
• statutory payables, that are recognised and measured similarly to contractual payables, but are not classified as financial instruments and not included in the category of financial liabilities at amortised cost, because they do not arise from a contract.
Payables for supplies and services have an average credit period of 30 days.
On behalf of Melbourne Water, Western Water collects Waterways and Drainage Charges from customers. The Waterways and Drainage Charge collected from customers are paid to Melbourne Water at the end of each billing cycle as per the Service Level Agreement between Western Water and Melbourne Water. These collections are identified as a current liability - trade creditors.
(i) Ageing analysis of contractual payables
2017 $’000
2016 $’000
Less than 1 month 7,007 5,668
1 to 3 months 17,982 10,643
3 to 12 months 4,444 1,030
Total 29,433 17,341
Carrying amount 29,433 17,341
Nominal amount 29,433 17,341

78 WESTERN WATER ANNUAL REPORT 2016/17
NOTE 5: OTHER ASSETS AND LIABILITIES (CONTINUED)
(c) Other current assets
2017 $’000
2016 $’000
Prepayments 596 631
Amounts in trust 371 -
Total other current assets 967 631
Prepayments represent payments in advance of the receipt of goods or services, or that part of expenditure made in one accounting period covering a term extending beyond that period.
Amounts in trust represent the consideration paid by the Corporation for acquisition of land that is still to be settled.
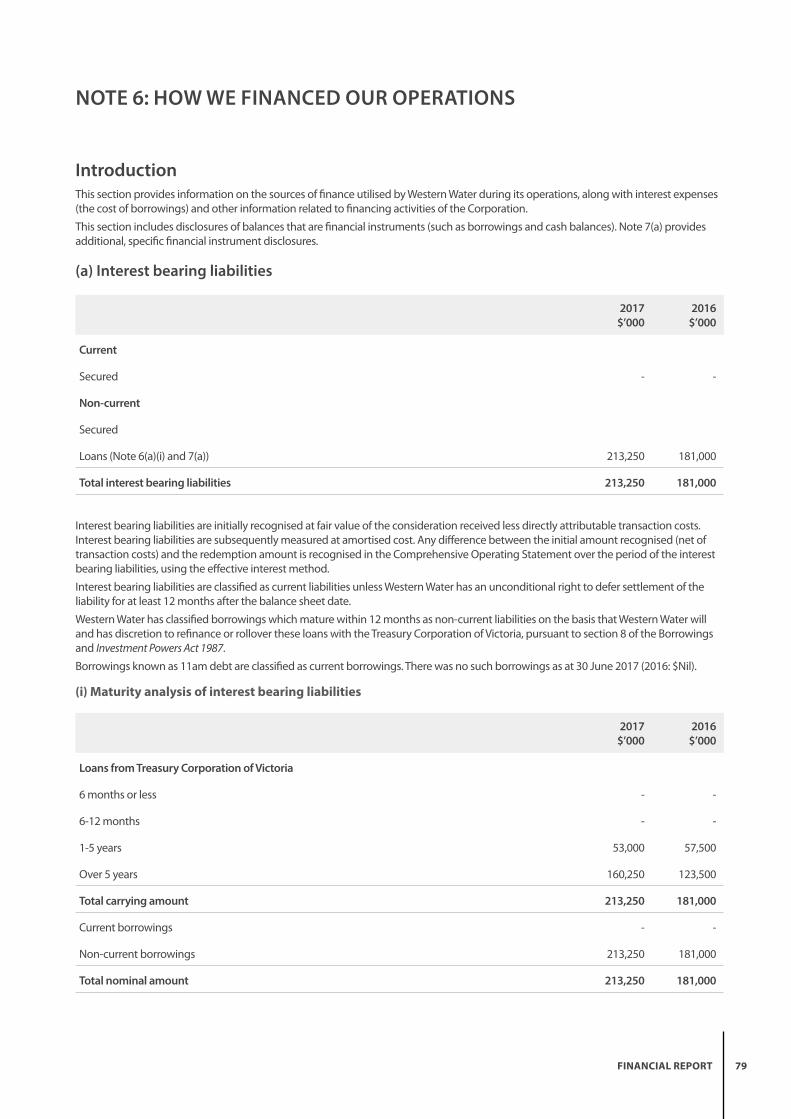
79 FINANCIAL REPORT
NOTE 6: HOW WE FINANCED OUR OPERATIONS
IntroductionThis section provides information on the sources of finance utilised by Western Water during its operations, along with interest expenses (the cost of borrowings) and other information related to financing activities of the Corporation.
This section includes disclosures of balances that are financial instruments (such as borrowings and cash balances). Note 7(a) provides additional, specific financial instrument disclosures.
(a) Interest bearing liabilities
2017 $’000
2016 $’000
Current
Secured - -
Non-current
Secured
Loans (Note 6(a)(i) and 7(a)) 213,250 181,000
Total interest bearing liabilities 213,250 181,000
Interest bearing liabilities are initially recognised at fair value of the consideration received less directly attributable transaction costs. Interest bearing liabilities are subsequently measured at amortised cost. Any difference between the initial amount recognised (net of transaction costs) and the redemption amount is recognised in the Comprehensive Operating Statement over the period of the interest bearing liabilities, using the effective interest method.
Interest bearing liabilities are classified as current liabilities unless Western Water has an unconditional right to defer settlement of the liability for at least 12 months after the balance sheet date.
Western Water has classified borrowings which mature within 12 months as non-current liabilities on the basis that Western Water will and has discretion to refinance or rollover these loans with the Treasury Corporation of Victoria, pursuant to section 8 of the Borrowings and Investment Powers Act 1987.
Borrowings known as 11am debt are classified as current borrowings. There was no such borrowings as at 30 June 2017 (2016: $Nil).
(i) Maturity analysis of interest bearing liabilities
2017 $’000
2016 $’000
Loans from Treasury Corporation of Victoria
6 months or less - -
6-12 months - -
1-5 years 53,000 57,500
Over 5 years 160,250 123,500
Total carrying amount 213,250 181,000
Current borrowings - -
Non-current borrowings 213,250 181,000
Total nominal amount 213,250 181,000

80 WESTERN WATER ANNUAL REPORT 2016/17
NOTE 6: HOW WE FINANCED OUR OPERATIONS (CONTINUED)
(a) Interest bearing liabilities (continued)(ii) Borrowing costs
2017 $’000
2016 $’000
Interest expense on government loans 9,067 8,994
Financial accommodation levy 2,481 2,115
Total borrowing costs 11,548 11,109
Borrowing costs include costs incurred in connection with borrowing of funds. It includes interest on bank overdrafts, short term and long term borrowings, amortisation of discounts or premiums relating to borrowings, financial accommodation levy and interest components of finance lease repayments.
Borrowing costs are recognised in the period in which they are incurred.
(b) Cash flow informationCash and deposits, including cash equivalents comprise cash on hand and cash at bank, deposits at call and those highly liquid investments with an original maturity of three months or less, which are held for the purpose of meeting short term cash commitments rather than for investment purposes, and which are readily convertible to known amounts of cash and are subject to an insignificant risk of changes in value.
2017 $’000
2016 $’000
Cash on hand 2 2
Cash at bank 1,596 311
Deposits at call - 7,300
Balance as per cash flow statement 1,598 7,613

81 FINANCIAL REPORT
(i) Reconciliation of net result for the period to net cash inflows from operating activities
2017 $’000
2016 $’000
Net results for the period 10,466 12,965
Non-cash movements:
Loss on disposal of infrastructure assets, property, plant and equipment 64 161
Depreciation and amortisation 21,951 18,811
Assets received from developers (17,142) (17,584)
Provision for impaired receivables 68 10
Changes in assets and liabilities
Decrease/(increase) in receivables (559) (1,636)
Decrease/(increase) in prepayments 35 32
Decrease/(increase) in deferred tax asset (53) 2,006
Increase/(decrease) in trade creditors (83) 1,483
Increase/(decrease) in income in advance 624 139
Increase/(decrease) in tax payable (733) 2,508
Increase/(decrease) in deferred tax liabilities 16 56
Increase/(decrease) in provisions 234 114
Net cash inflows from operating activities 14,888 19,065

82 WESTERN WATER ANNUAL REPORT 2016/17
NOTE 6: HOW WE FINANCED OUR OPERATIONS (CONTINUED)
(b) Cash flow information (continued)
(ii) Financing facilities
2017 $’000
2016 $’000
Secured bank overdraft facility, reviewed annually and payable at call (i)
Amount used at balance date - -
Amount unused at balance date 500 500
Total 500 500
Secured loan facilities (ii)
Amount used at balance date 213,250 181,000
Amount unused at balance date - -
Total 213,250 181,000
(i) Overdraft limit - $0.5 million secured by a mortgage over the general revenue of the Corporation.(ii) Security for loans is by way of Treasurer's guarantee in favour of the Treasury Corporation of Victoria dated 22nd June 2000. Loan
interest is payable either every three or six months and loans have a maturity profile of up to 12.7 years (2016: 13 years).
All loans are with Treasury Corporation of Victoria borrowed under the Treasurer's approval. Any unused facilities are not automatically carried over into the next financial year with a fresh approval required for each financial year. Treasurer's approval was obtained in June 2017 which included the refinancing of $16.5 million (2017: $17.0 million) of loans maturing in 2017/18 and obtaining new loans of $70.6 million (2017: $55.0 million) between 1 July 2017 and 30 June 2018.

83 FINANCIAL REPORT
(c) Commitments for expenditureCommitments for future expenditure include operating and capital commitments arising from contracts. Please refer to Note 4(a)(x) and 8(b)(i) for details on capital and environmental commitments, respectively. These future expenditures and revenues cease to be disclosed as commitments once the related operating expenditure and other revenue is recognised in the operating statement. The operating commitments are disclosed below at their nominal value and inclusive of the Goods and Services Tax (GST) payable.
(i) Total operating commitments payable
2017 $’000
2016 $’000
Nominal amounts
Operating lease commitments
within one year 588 634
one to five years 2,297 14
Total operating lease commitments payable 2,885 648
Other significant operating commitments
within one year 4,501 3,610
one to five years 868 552
Total other significant operating commitments payable 5,369 4,162
Total operating commitments payable (inclusive of GST) 8,254 4,810
Less: GST recoverable (750) (437)
Total operating commitments payable (exclusive of GST) 7,504 4,373
(ii) Total operating commitments receivable
Nominal amounts
Operating lease receivables
within one year 261 254
one to five years 1,310 1,197
over five years 1,074 979
Total operating lease receivables (inclusive of GST) 2,645 2,430
Less: GST payable (240) (221)
Total operating commitments receivable (exclusive of GST) 2,405 2,209
Minimum future lease payments receivable includes the aggregate of all lease payments receivable and any guaranteed residual.Rental income from operating leases is recognised on a straight line basis over the term of the relevant lease.All incentives for the agreement of a new or renewed operating lease are recognised as an integral part of the net consideration agreed for the use of the leased asset, irrespective of the incentive’s nature or form or the timing of payments.In the event that lease incentives are given to the lessee, the aggregate cost of incentives are recognised as a reduction of rental income over the lease term, on a straight line basis unless another systematic basis is more representative of the time pattern over which the economic benefit of the leased asset is diminished.

84 WESTERN WATER ANNUAL REPORT 2016/17
NOTE 7: RISKS, CONTINGENCIES AND VALUATION JUDGEMENTS
IntroductionThe Corporation is exposed to risk from its activities and outside factors. In addition, it is often necessary to make judgements and estimates associated with recognition and measurement of items in the financial statements.
This section sets out financial instrument specific information, (including exposures to financial risks) as well as those items that are contingent in nature or require a higher level of judgement to be applied mainly related to fair value determination.
(a) Financial instruments specific disclosuresFinancial instruments arise out of contractual agreements that give rise to a financial asset of one entity and a financial liability or equity instrument of another entity.
(i) Categories of financial instrumentsLoans and receivables and cash are financial instrument assets with fixed and determinable payments that are not quoted on an active market. These assets and liabilities are initially recognised at fair value plus any directly attributable transaction costs. Subsequent to initial measurement, loans and receivables are measured at amortised cost using the effective interest method (and for assets, less any impairment). The Corporation recognises the following assets in this category:
• cash and cash equivalents; and
• receivables (excluding statutory receivables).
Financial liabilities at amortised cost are initially recognised on the date they are originated. They are initially measured at fair value plus any directly attributable transaction costs. Subsequent to initial recognition, these financial instruments are measured at amortised cost with any difference between the initial recognised amount and the redemption value being recognised in profit and loss over the period of the interest bearing liability, using the effective interest rate method. Western Water recognises the following liabilities in this category:
• payables (excluding statutory payables); and
• interest bearing liabilities.
(ii) Derecognition of financial assetsA financial asset (or, where applicable, a part of a financial asset or part of a group of similar financial assets) is derecognised when:
• the rights to receive cash flows from the asset have expired; or
• Western Water retains the right to receive cash flows from the asset, but has assumed an obligation to pay them in full without material delay to a third party under a ‘pass through’ arrangement; or
• Western Water has transferred its rights to receive cash flows from the asset and either:
- has transferred substantially all the risks and rewards of the asset; or
- has neither transferred nor retained substantially all the risks and rewards of the asset, but has transferred control of the asset.
Where Western Water has neither transferred nor retained substantially all the risks and rewards or transferred control, the asset is recognised to the extent of the Corporation’s continuing involvement in the asset.
(iii) Impairment of financial assetsAt the end of each reporting period Western Water assesses whether there is objective evidence that a financial asset or group of financial assets is impaired. All financial instrument assets, except those measured at fair value through profit or loss, are subject to annual review for impairment.
The allowance is the difference between the financial asset’s carrying amount and the present value of estimated future cash flows, discounted at the effective interest rate (AASB 139.58 70 AASB 7.B5(f)). In assessing impairment of statutory (non-contractual) financial assets, which are not financial instruments, professional judgement is applied in assessing materiality using estimates, averages and other computational methods in accordance with AASB 136 Impairment of Assets. Impairment losses are recognised in the Comprehensive Operating Statement. Impairment losses recognised in the Comprehensive Operating Statement on equity instruments classified as available for sale are not reversed through Comprehensive Operating Statement.
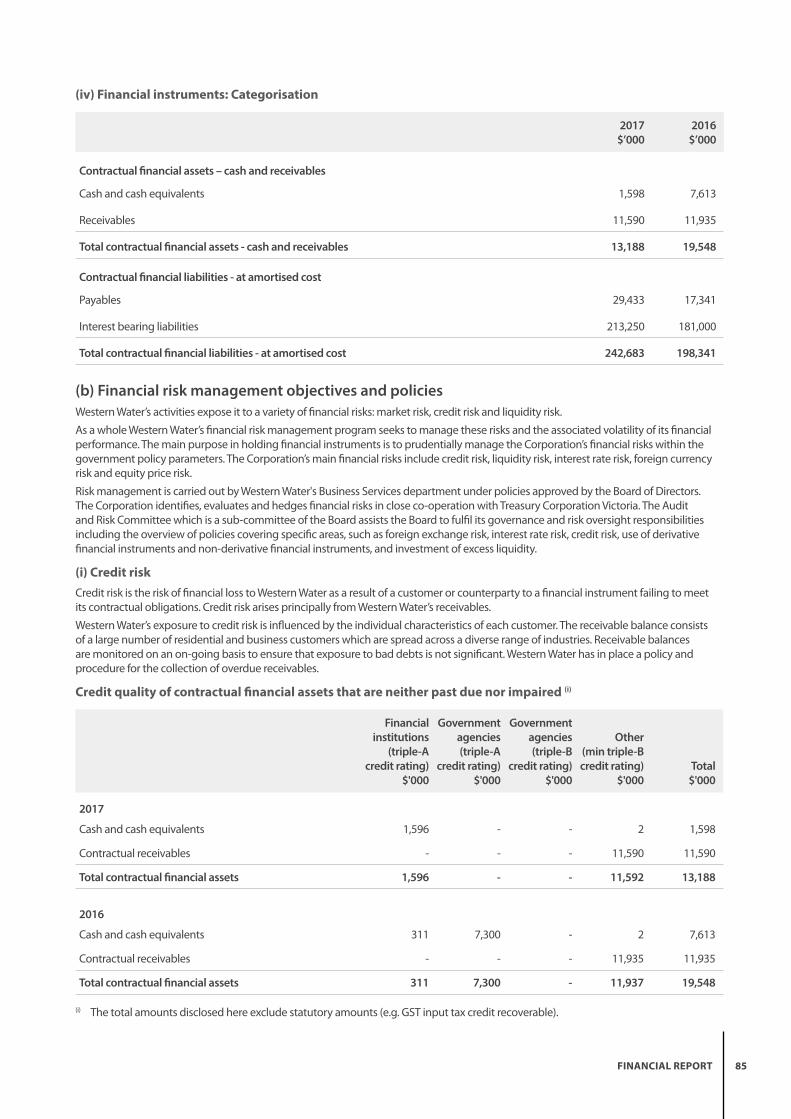
85 FINANCIAL REPORT
(iv) Financial instruments: Categorisation
2017 $’000
2016 $’000
Contractual financial assets – cash and receivables
Cash and cash equivalents 1,598 7,613
Receivables 11,590 11,935
Total contractual financial assets - cash and receivables 13,188 19,548
Contractual financial liabilities - at amortised cost
Payables 29,433 17,341
Interest bearing liabilities 213,250 181,000
Total contractual financial liabilities - at amortised cost 242,683 198,341
(b) Financial risk management objectives and policiesWestern Water’s activities expose it to a variety of financial risks: market risk, credit risk and liquidity risk.
As a whole Western Water’s financial risk management program seeks to manage these risks and the associated volatility of its financial performance. The main purpose in holding financial instruments is to prudentially manage the Corporation’s financial risks within the government policy parameters. The Corporation’s main financial risks include credit risk, liquidity risk, interest rate risk, foreign currency risk and equity price risk.
Risk management is carried out by Western Water's Business Services department under policies approved by the Board of Directors. The Corporation identifies, evaluates and hedges financial risks in close co-operation with Treasury Corporation Victoria. The Audit and Risk Committee which is a sub-committee of the Board assists the Board to fulfil its governance and risk oversight responsibilities including the overview of policies covering specific areas, such as foreign exchange risk, interest rate risk, credit risk, use of derivative financial instruments and non-derivative financial instruments, and investment of excess liquidity.
(i) Credit riskCredit risk is the risk of financial loss to Western Water as a result of a customer or counterparty to a financial instrument failing to meet its contractual obligations. Credit risk arises principally from Western Water’s receivables.
Western Water’s exposure to credit risk is influenced by the individual characteristics of each customer. The receivable balance consists of a large number of residential and business customers which are spread across a diverse range of industries. Receivable balances are monitored on an on-going basis to ensure that exposure to bad debts is not significant. Western Water has in place a policy and procedure for the collection of overdue receivables.
Credit quality of contractual financial assets that are neither past due nor impaired (i)
Financial institutions
(triple-A credit rating)
$'000
Government agencies (triple-A
credit rating) $'000
Government agencies (triple-B
credit rating) $'000
Other
(min triple-B credit rating)
$'000Total
$'000
2017
Cash and cash equivalents 1,596 - - 2 1,598
Contractual receivables - - - 11,590 11,590
Total contractual financial assets 1,596 - - 11,592 13,188
2016
Cash and cash equivalents 311 7,300 - 2 7,613
Contractual receivables - - - 11,935 11,935
Total contractual financial assets 311 7,300 - 11,937 19,548
(i) The total amounts disclosed here exclude statutory amounts (e.g. GST input tax credit recoverable).

86 WESTERN WATER ANNUAL REPORT 2016/17
NOTE 7: RISKS, CONTINGENCIES AND VALUATION JUDGEMENTS (CONTINUED)
(b) Financial risk management objectives and policies
(ii) Liquidity riskLiquidity risk arises from being unable to meet financial obligations as they fall due. Western Water’s policy is to settle financial obligations within 30 days and in the event of dispute make payments within 30 days from the date of resolution.
Western Water manages liquidity risk by maintaining adequate reserves, banking facilities and reserve borrowing facilities by continuously monitoring forecasts and actual cash flows and matching the maturity profiles of financial assets and financial liabilities.
During the course of the financial year, Western Water relies on the Treasury Corporation of Victoria’s ability to provide borrowings within the annual Treasurer’s approval limits. Treasurer’s approvals are usually provided in June prior to the commencement of the subsequent financial year based on Western Water’s Corporate Plan submission. The Treasurer's approval for 2017/18 borrowings was obtained in June 2017. Western Water’s financial liability maturities have been disclosed in Note 5(b)(i) , 6(a)(i) and 7(b)(iv)).
(iii) Market riskMarket risk is the risk that changes in market prices will affect the fair value or future cash flows of Western Water’s financial instruments. Market risk comprises of interest rate risk, foreign exchange risk and other price risk. Western Water’s exposure to market risk is primarily through interest rate risk. There is no exposure to foreign exchange risk and insignificant exposure to other price risks.
Objectives, policies and processes used to manage these risks are disclosed in the paragraphs below:
Interest rate riskWestern Water’s exposure to market interest rates relates primarily to Western Water’s long term interest bearing liabilities and funds invested with TCV. Western Water has limited exposure to interest rate risk through its holding of cash assets with TCV and other financial assets.
Western Water minimises its exposure to interest rate changes on its long term borrowings by holding a high portion of fixed rate debt. Debt is sourced from Treasury Corporation of Victoria and is managed within a range of Board approved limits with debt levels and interest rates being monitored regularly.
Western Water has approval to enter into Forward Settling Loans (FSL) to hedge/protect the value of the Corporation's assets and liabilities against adverse movements in interest rates in accordance with its Treasury Management Policies. As at 30 June 2017, no FSL arrangements were in place (2016: Nil).
Foreign exchange riskWestern Water has no exposure to changes in the foreign exchange rate.
Other price riskWestern Water has no significant exposure to other price risk.
(iv) Interest rate risk exposure of financial instrumentsFair value interest rate risk is the risk that the fair value of a financial instrument will fluctuate because of changes in market interest rates. The Corporation does not hold any interest bearing financial instruments that are measured at fair value, and therefore has no exposure to fair value interest rate risk.
Cash flow interest rate risk is the risk that the future cash flows of a financial instrument will fluctuate because of changes in market interest rates. The Corporation has minimal exposure to cash flow interest rate risks through cash and deposits, term deposits and bank overdrafts that are at floating rate.

87 FINANCIAL REPORT
Interest rate risk exposureThe carrying amounts of financial assets and financial liabilities that are exposed to interest rates and the Corporation’s sensitivity to interest rate risk are set out in the table that follows:
Non interest bearing
$'000
Fixed interest
rate $'000
Floating interest
rate $'000
1 Year or Less
$'000
Contractual repricing or maturity periods
Total $'000
Over 1 to 2 Years
$'000
Over 2 to 3 Years
$'000
Over 3 to 4 Years
$'000
Over 4 to 5 Years $'000 s
Over 5 years
$'000
2017
Financial assets
Cash 2 - 1,596 - - - - - - 1,598
Contractual receivables 11,590 - - - - - - - - 11,590
11,592 - 1,596 - - - - - - 13,188
Financial liabilities
Contractual Payables 29,433 - - - - - - - - 29,433
Interest bearing liabilities - 213,250 - - 13,500 10,000 17,500 12,000 160,250 213,250
29,433 213,250 - - 13,500 10,000 17,500 12,000 160,250 242,683
Net financial liabilities (17,841) (213,250) 1,596 - (13,500) (10,000) (17,500) (12,000) (160,250) (229,495)
Weighted average interest rate -% -% .90% -% 5.19% 5.82% 6.43% 4.93% 4.27%
2016
Financial assets
Cash 2 - 7,611 - - - - - - 7,613
Contractual receivables 11,935 - - - - - - - - 11,935
11,937 - 7,611 - - - - - - 19,548
Financial liabilities
Contractual Payables 17,341 - - - - - - - - 17,341
Interest bearing liabilities - 181,000 - - 16,500 13,500 10,000 17,500 123,500 181,000
17,341 181,000 - - 16,500 13,500 10,000 17,500 123,500 198,341
Net financial liabilities (5,404) (181,000) 7,611 - (16,500) (13,500) (10,000) (17,500) (123,500) (178,793)
Weighted average interest rate -% -% 2.37% -% 6.62% 5.19% 5.82% 6.43% 4.25%
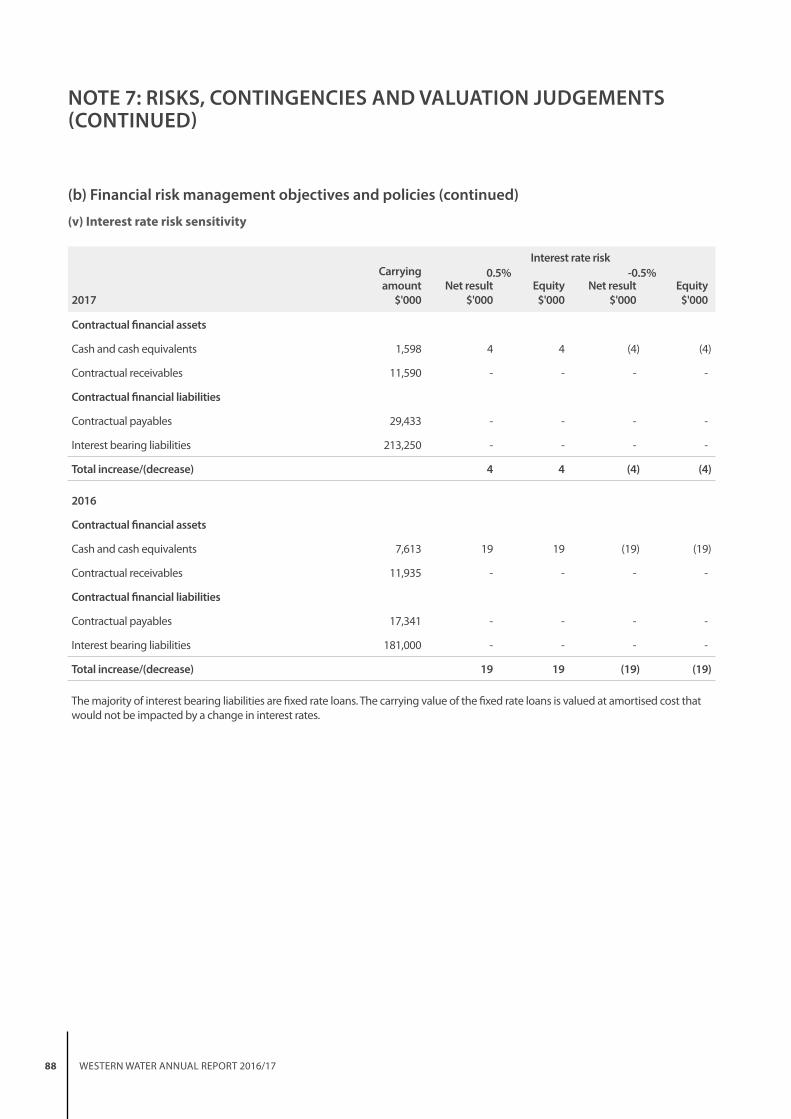
88 WESTERN WATER ANNUAL REPORT 2016/17
NOTE 7: RISKS, CONTINGENCIES AND VALUATION JUDGEMENTS (CONTINUED)
(b) Financial risk management objectives and policies (continued)
(v) Interest rate risk sensitivity
2017
Carrying amount
$'000
Interest rate risk0.5% -0.5%
Net result $'000
Equity $'000
Net result $'000
Equity $'000
Contractual financial assets
Cash and cash equivalents 1,598 4 4 (4) (4)
Contractual receivables 11,590 - - - -
Contractual financial liabilities
Contractual payables 29,433 - - - -
Interest bearing liabilities 213,250 - - - -
Total increase/(decrease) 4 4 (4) (4)
2016
Contractual financial assets
Cash and cash equivalents 7,613 19 19 (19) (19)
Contractual receivables 11,935 - - - -
Contractual financial liabilities
Contractual payables 17,341 - - - -
Interest bearing liabilities 181,000 - - - -
Total increase/(decrease) 19 19 (19) (19)
The majority of interest bearing liabilities are fixed rate loans. The carrying value of the fixed rate loans is valued at amortised cost that would not be impacted by a change in interest rates.

89 FINANCIAL REPORT
(c) Contingent assets and contingent liabilitiesContingent assets and contingent liabilities are not recognised in the balance sheet but are disclosed and, if quantifiable, are measured at nominal value. Contingent assets and liabilities are presented inclusive of GST receivable or payable respectively.
(i) Contingent assetsContingent assets are possible assets that arise from past events, whose existence will be confirmed only by the occurrence or non-occurrence of one or more uncertain future events not wholly within the control of the Corporation.
Developer assets
2017 $’000
2016 $’000
Total estimated contingent assets - developer assets 9,266 5,881
Western Water enters into agreements with land developers whereby assets are transferred to Western Water at no cost. These assets are brought to account as revenue and capitalised on completion of the project. At the reporting date, land developers had commenced construction of assets that would eventually be transferred to Western Water contingent upon the release of Statements of Compliance by Western Water. This amount has been calculated as the sum of the estimate of the project costs by their percentage complete at 30 June.
Bulk entitlements - Carry-over water
Western Water holds bulk entitlements that allow for a carry-over of water not utilised under the annual allocation. There will be future economic benefits associated with the carried over water through its utilisation by selling to the Corporation's customers and/or trade to an approved buyer post obtaining approval of the Minister. The quantum of bulk entitlement water allocation carried over and held by the Corporation as at 30 June 2017 was 47,923ML (2016: 29,603ML).
(ii) Contingent liabilitiesContingent liabilities are:
• possible obligations that arise from past events, whose existence will be confirmed only by the occurrence or non-occurrence of one or more uncertain future events not wholly within the control of the entity; or
• present obligations that arise from past events but are not recognised because:
- it is not probable that an outflow of resources embodying economic benefits will be required to settle the obligations; or
- the amount of the obligations cannot be measured with sufficient reliability.
2017 $’000
2016 $’000
Total estimated contingent liabilities - 347
Developers are responsible for constructing water and sewer mains up to a diameter of 150mm and 225mm respectively. If Western Water requires a main in excess of these sizes, an agreement may be entered into with the developer to construct the upsized main with the incremental cost being funded by Western Water.

90 WESTERN WATER ANNUAL REPORT 2016/17
NOTE 7: RISKS, CONTINGENCIES AND VALUATION JUDGEMENTS (CONTINUED)
(d) Fair value determinationSignificant judgement: Fair value measurements of assets and liabilities
Fair value determination requires judgement and the use of assumptions. This section discloses the most significant assumptions used in determining fair values. Changes to assumptions could have a material impact on the results and financial position of the Corporation.
Fair value is the price that would be received to sell an asset or paid to transfer a liability in an orderly transaction between market participants at the measurement date.
Consistent with AASB 13 Fair Value Measurement, Western Water determines the policies and procedures for both recurring fair value measurements such as infrastructure, property, plant and equipment and financial instruments and for non-recurring fair value measurements such as assets held for sale, in accordance with the requirements of AASB 13 and the relevant Financial Reporting Directions.
Fair value hierarchyAll assets and liabilities for which fair value is measured or disclosed in the financial statements are categorised within the fair value hierarchy, described as follows, based on the lowest level input that is significant to the fair value measurement as a whole:
• Level 1 - Quoted (unadjusted) market prices in active markets for identical assets or liabilities;
• Level 2 - Valuation techniques for which the lowest level input that is significant to the fair value measurement is directly or indirectly observable; and
• Level 3 - Valuation techniques for which the lowest level input that is significant to the fair value measurement is unobservable.
For the purpose of fair value disclosures, Western Water has determined classes of assets and liabilities on the basis of the nature, characteristics and risks of the asset or liability and the level of the fair value hierarchy as explained above.
(e) Fair value determination of financial assets and liabilitiesThe fair values and net fair values of financial assets and liabilities are determined as follows:
• Level 1 - the fair value of financial instrument with standard terms and conditions and traded in active liquid markets are determined with reference to quoted market prices;
• Level 2 - the fair value is determined using inputs other than quoted prices that are observable for the financial asset or liability, either directly or indirectly; and
• Level 3 - the fair value is determined in accordance with generally accepted pricing models based on discounted cash flow analysis using unobservable market inputs.
Western Water currently holds a range of financial instruments that are recorded in the financial statements where the carrying amounts are a reasonable approximation of fair value, either due to their short-term nature or with the expectation that they will be paid in full by the end of the 2017-18 reporting period.
These financial instruments include:
Financial assets Financial liabilities
Cash and cash equivalents
Receivables: From sale of goods and services Payables: For supplies and services
Due to the short-term nature of the financial assets and liabilities held by the Corporation, their carrying value is assumed to approximate their fair value.

91 FINANCIAL REPORT
Fair valueThe following tables present Western Water's financial assets and financial liabilities measured and recognised at fair value at 30 June 2017 and 30 June 2016. It also shows the comparison between the carrying amount of the asset or liability and its fair value.
Carrying amount as at 30 June 2017
2017 $'000
Fair value measurement at end of reporting period using:
Level 1 $'000
Level 2 $'000
Level 3 $'000
Financial assets
Cash 1,598 1,598 - -
Contractual receivables 11,590 - 11,590 -
Total financial assets 13,188 1,598 11,590 -
Financial liabilities
Contractual payables 29,433 - 29,433 -
Interest bearing liabilities 213,250 - 229,894 -
Total financial liabilities 242,683 - 259,327 -
Carrying amount as at 30 June 2016
2016 $'000
Fair value measurement at end of reporting period using:
Level 1 $'000
Level 2 $'000
Level 3 $'000
Financial assets
Cash 7,613 7,613 - -
Contractual receivables 11,935 - 11,935 -
Total financial assets 19,548 7,613 11,935 -
Financial liabilities
Contractual payables 17,341 - 17,341 -
Interest bearing liabilities 181,000 - 206,656 -
Total financial liabilities 198,341 - 223,997 -
There have been no transfers between levels during the period.
None of the classes of interest bearing liabilities are readily traded on organised markets in standardised form. The fair value of borrowings is based upon market prices, where a market exists or by discounting the expected future cash flows by the current interest rates for liabilities with similar risk profiles. Fair value is inclusive of costs which would be incurred on settlement of a liability.
None of the Corporation's financial instruments are recorded at fair value post initial recognition.
The carrying amounts of receivables and payables are assumed to approximate their fair values due to their short-term nature. The fair value of financial liabilities for disclosure purposes is estimated by discounting the future contractual cash flows at the current market interest rate that is available to the Corporation for similar financial instruments. The fair value of current borrowings approximates the carrying amount, as the impact of discounting is not significant.
The fair value of the financial assets and liabilities is included at the amount at which the instrument could be exchanged in a current transaction between willing parties, other than in a forced or liquidation sale.
The fair values of non-current interest bearing liabilities are based on cash flows discounted using borrowing rates varying from 2.615% to 7.225%, depending on the type of the borrowing (2016: 1.890% to 7.225%).
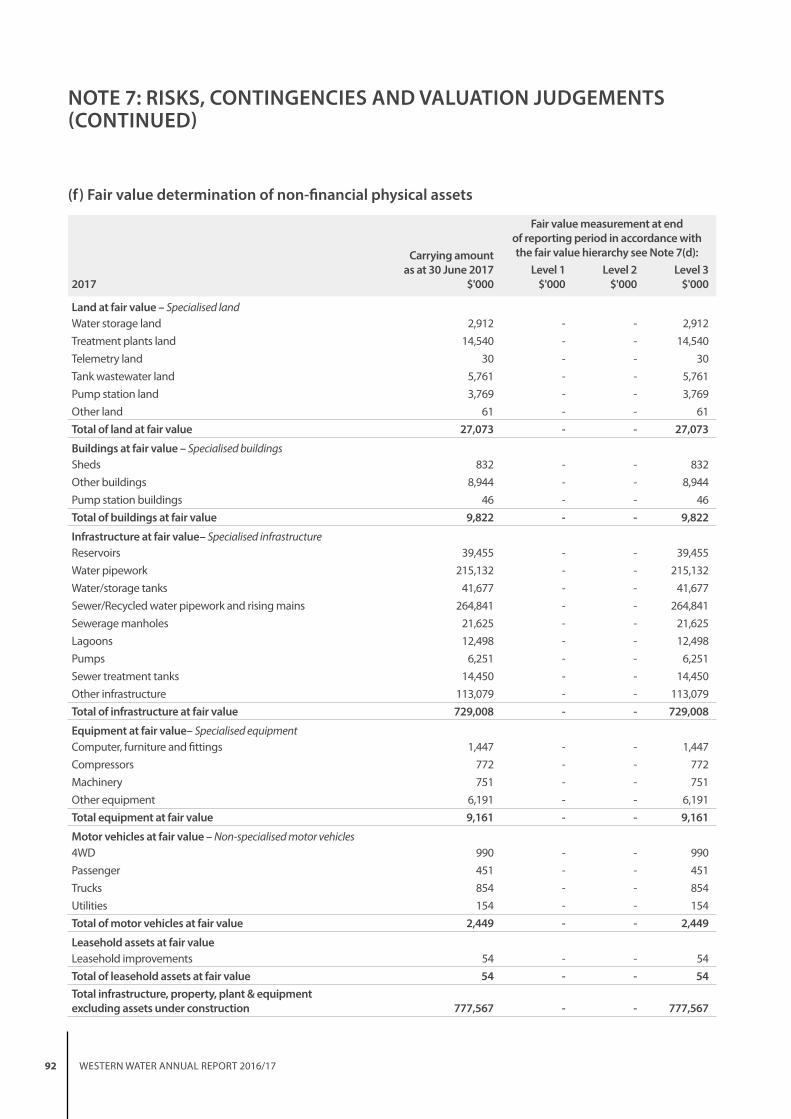
92 WESTERN WATER ANNUAL REPORT 2016/17
NOTE 7: RISKS, CONTINGENCIES AND VALUATION JUDGEMENTS (CONTINUED)
(f) Fair value determination of non-financial physical assets
Carrying amount as at 30 June 2017
2017 $'000
Fair value measurement at end of reporting period in accordance with the fair value hierarchy see Note 7(d):
Level 1 $'000
Level 2 $'000
Level 3 $'000
Land at fair value – Specialised landWater storage land 2,912 - - 2,912
Treatment plants land 14,540 - - 14,540
Telemetry land 30 - - 30
Tank wastewater land 5,761 - - 5,761
Pump station land 3,769 - - 3,769
Other land 61 - - 61
Total of land at fair value 27,073 - - 27,073
Buildings at fair value – Specialised buildingsSheds 832 - - 832
Other buildings 8,944 - - 8,944
Pump station buildings 46 - - 46
Total of buildings at fair value 9,822 - - 9,822
Infrastructure at fair value– Specialised infrastructureReservoirs 39,455 - - 39,455
Water pipework 215,132 - - 215,132
Water/storage tanks 41,677 - - 41,677
Sewer/Recycled water pipework and rising mains 264,841 - - 264,841
Sewerage manholes 21,625 - - 21,625
Lagoons 12,498 - - 12,498
Pumps 6,251 - - 6,251
Sewer treatment tanks 14,450 - - 14,450
Other infrastructure 113,079 - - 113,079
Total of infrastructure at fair value 729,008 - - 729,008
Equipment at fair value– Specialised equipmentComputer, furniture and fittings 1,447 - - 1,447
Compressors 772 - - 772
Machinery 751 - - 751
Other equipment 6,191 - - 6,191
Total equipment at fair value 9,161 - - 9,161
Motor vehicles at fair value – Non-specialised motor vehicles4WD 990 - - 990
Passenger 451 - - 451
Trucks 854 - - 854
Utilities 154 - - 154
Total of motor vehicles at fair value 2,449 - - 2,449
Leasehold assets at fair value Leasehold improvements 54 - - 54
Total of leasehold assets at fair value 54 - - 54 Total infrastructure, property, plant & equipment excluding assets under construction 777,567 - - 777,567

93 FINANCIAL REPORT
Carrying amount as at 30 June 2016
2016 $'000
Fair value measurement at end of reporting period in accordance with the fair value hierarchy see Note 7(d):
Level 1 $'000
Level 2 $'000
Level 3 $'000
Land at fair value – Specialised landWater storage land 2,912 - - 2,912
Treatment plants land 14,540 - - 14,540
Telemetry land 30 - - 30
Tank wastewater land 5,283 - - 5,283
Pump station land 3,769 - - 3,769
Other land 61 - - 61
Total of land at fair value 26,595 - - 26,595
Buildings at fair value – Specialised buildingsSheds 844 - - 844
Other buildings 8,930 - - 8,930
Pump station buildings 46 - - 46
Total of buildings at fair value 9,820 - - 9,820
Infrastructure at fair value – Specialised infrastructureReservoirs 39,346 - - 39,346
Water pipework 207,063 - - 207,063
Water/storage tanks 42,668 - - 42,668
Sewer/Recycled water pipework and rising mains 247,318 - - 247,318
Sewerage manholes 19,827 - - 19,827
Lagoons 12,682 - - 12,682
Pumps 6,126 - - 6,126
Sewer treatment tanks 15,129 - - 15,129
Other infrastructure 99,932 - - 99,932
Total of infrastructure at fair value 690,091 - - 690,091
Equipment at fair value – Specialised equipmentComputer, furniture and fittings 1,549 - - 1,549
Compressors 792 - - 792
Machinery 813 - - 813
Other equipment 5,651 - - 5,651
Total equipment at fair value 8,805 - - 8,805
Motor vehicles at fair value – Non-specialised motor vehicles4WD 1,154 - - 1,154
Passenger 438 - - 438
Trucks 923 - - 923
Utilities 218 - - 218
Total of motor vehicles at fair value 2,733 - - 2,733
Leasehold assets at fair value Leasehold improvements 294 - - 294
Total of leasehold assets at fair value 294 - - 294Total infrastructure, property, plant & equipment excluding assets under construction 738,338 - - 738,338

94 WESTERN WATER ANNUAL REPORT 2016/17
NOTE 7: RISKS, CONTINGENCIES AND VALUATION JUDGEMENTS (CONTINUED)
(f) Fair value determination of non-financial physical assets (continued)There have been no transfers between levels during the period.
The Valuer General Victoria (VGV) is the Corporation’s independent valuation agency in relation to valuation of property, plant and equipment and infrastructure.
The Corporation, in conjunction with VGV, monitors changes in the fair value of property, plant and equipment and infrastructure through relevant data sources to determine whether revaluation is required.
Specialised landThe market approach is used for specialised land, although is adjusted for the Community Service Obligation (CSO) to reflect the specialised nature of the land being valued.
The CSO adjustment is a reflection of the valuer’s assessment of the impact of restrictions associated with an asset to the extent that is also equally applicable to market participants. This approach is in light of the highest and best use consideration required for fair value measurement, and takes into account the use of the asset that is physically possible, legally permissible, and financially feasible. As adjustments of CSO are considered as significant unobservable inputs, specialised land would be classified as Level 3 assets.
An independent valuation of Western Water’s specialised land was performed by the Valuer General Victoria as at 30 June 2016.
The land was valued on the basis of the existing zoning or underlying zonings.
If appropriate an allowance was made for the risk associated with the removal of the public use restrictions of the site and consideration was given to any political, social or economic restraints due to the Public Sector ownership.
In assessing the Fair Value, the valuation also had regard to the Highest and Best Use (HBU) of the land.
The Corporation conducted an assessment at 30 June 2017 with no material movement identified since the 2016 valuation.
Specialised buildingsFor the majority of Western Water’s specialised buildings, the Depreciated Replacement Cost (DRC) method is used, adjusting for the associated depreciation. As depreciation adjustments are considered as significant unobservable inputs in nature, specialised buildings are classified as Level 3 fair value measurements.
Buildings were valued at 30 June 2016 by the Valuer General Victoria (VGV) and representatives of VGV. The DRC approach considered the specialised nature of the buildings and was deemed suitable given the absence of an active market for such buildings.
Building costs were used in assessing the Fair Value based on best available evidence from recognised building cost indicators and or Quantity Surveyors and examples of current costs.
The assessment included upgrading the buildings to meet current building regulations, professional fees, building and design approval and other general fees and disbursements.
The Corporation conducted an assessment at 30 June 2017 with no material movement identified since the 2016 valuation.
Specialised infrastructureSpecialised infrastructure is valued using the depreciated replacement cost method. This cost represents the replacement cost of the infrastructure (building/component) after applying depreciation rates on a useful life basis. Replacement costs relate to costs to replace the current service capacity of the asset. Economic obsolescence has also been factored into the depreciated replacement cost calculation.
Where it has not been possible to examine hidden works such as water pipe works, structural frames and floors, the use of reasonable materials and methods of construction have been assumed bearing in mind the age and nature of the structure. The estimated cost of reconstruction includes structure services and finishes as applicable.
An independent valuation of Western Water's specialised infrastructure was performed by JLT Valuation Services on behalf of the Valuer General Victoria. The valuation was performed based on the depreciated replacement cost of the assets. The effective date of the valuation is 30 June 2016.
These assets are classified as Level 3 fair value as the lowest level input. The absence of an active market, has a significant impact on the fair value which is unobservable.
The Corporation conducted an assessment at 30 June 2017 with no material movement identified since the 2016 valuation.
EquipmentEquipment is held at fair value. When equipment is specialised in use, such that it is rarely sold other than as part of a going concern, fair value is determined using the depreciated replacement cost method.
Equipment was valued at 30 June 2016 by JLT Valuation Services.
There were no changes in valuation techniques throughout the year to 30 June 2017. For all assets measured at fair value, the current use is considered the highest and best use.

95 FINANCIAL REPORT
Motor vehiclesVehicles are valued using the depreciated replacement cost method, adjusting for the associated depreciation. Western Water acquires new vehicles and at times disposes of them before the end of their economic life. The process of acquisition, use and disposal in the market is managed by experienced fleet managers in Western Water who set relevant depreciation rates during use to reflect the utilisation of the vehicles.
As depreciation adjustments are considered as significant unobservable inputs in nature, motor vehicles are classified as Level 3 fair value measurement.
Leasehold assetsLeasehold assets represent the leasehold improvements. Leasehold assets are valued using the depreciated replacement cost method.
These assets are classified as Level 3 fair value as the lowest level input. The absence of an active market, has a significant impact on the fair value which is unobservable.
The Corporation conducted an assessment at 30 June 2017 with no material movement identified since the 2016 valuation.
No infrastructure or property, plant and equipment assets of Western Water have been pledged as security.
(i) Reconciliation of Level 3 fair value movementsThis is a reconciliation from the opening balances to the closing balances for fair value measurements categorised within Level 3 of the fair value hierarchy, disclosing separately changes during the period.
Reconciliation of Level 3 fair value movements
Specialised land
$'000
Specialised buildings
$'000
Specialised infrastructure
$'000
Specialised equipment
$'000
Non- specialised
motor vehicles
$'000
Leasehold assets $'000
2017
Opening balance 26,595 9,820 690,091 8,805 2,733 294
Fair value of assets received free of charge - - 17,142 - - -
Additions/Capital expenditure 478 359 39,195 1,894 611 10
Sales - - - (56) (343) -
Transfers in (out) of Level 3 - - - - - -
Reclassification within Level 3 - - 118 (118) - -
Depreciation and amortisation - (357) (17,538) (1,364) (552) (250)
Subtotal 27,073 9,822 729,008 9,161 2,449 54
Closing balance 27,073 9,822 729,008 9,161 2,449 54
2016
Opening balance 20,909 11,422 612,621 8,873 2,263 547
Fair value of assets received free of charge - - 17,584 - - -
Additions/Capital expenditure 2,356 - 9,676 1,061 1,406 -
Sales - - - (6) (516) -
Transfers in (out) of Level 3 - - - - - -
Reclassification within Level 3 - - (40) 40 - -
Depreciation and amortisation - (256) (14,822) (1,418) (420) (253)
Subtotal 23,265 11,166 625,019 8,550 2,733 294
Revaluation 3,330 (1,346) 65,072 255 - -
Subtotal 3,330 (1,346) 65,072 255 - -
Closing balance 26,595 9,820 690,091 8,805 2,733 294
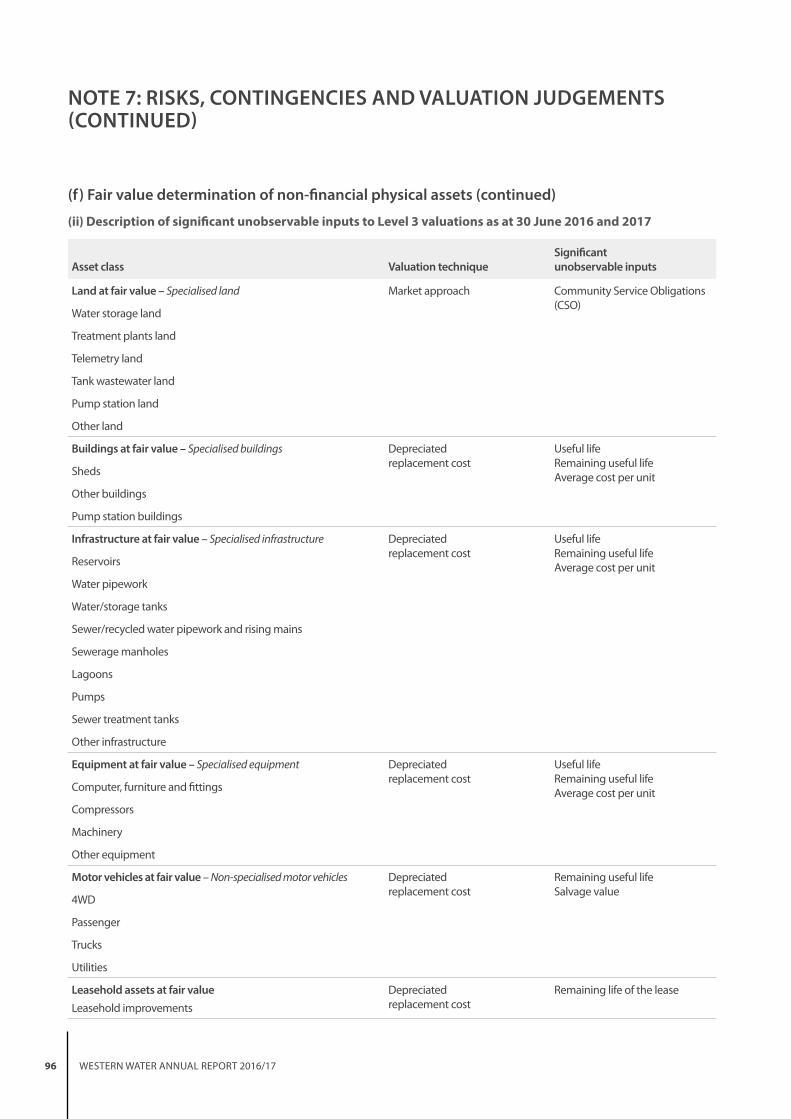
96 WESTERN WATER ANNUAL REPORT 2016/17
NOTE 7: RISKS, CONTINGENCIES AND VALUATION JUDGEMENTS (CONTINUED)
(f) Fair value determination of non-financial physical assets (continued)
(ii) Description of significant unobservable inputs to Level 3 valuations as at 30 June 2016 and 2017
Asset class Valuation techniqueSignificant unobservable inputs
Land at fair value – Specialised land Market approach Community Service Obligations (CSO)
Water storage land
Treatment plants land
Telemetry land
Tank wastewater land
Pump station land
Other land
Buildings at fair value – Specialised buildings Depreciated replacement cost
Useful life Remaining useful life Average cost per unitSheds
Other buildings
Pump station buildings
Infrastructure at fair value – Specialised infrastructure Depreciated replacement cost
Useful life Remaining useful life Average cost per unitReservoirs
Water pipework
Water/storage tanks
Sewer/recycled water pipework and rising mains
Sewerage manholes
Lagoons
Pumps
Sewer treatment tanks
Other infrastructure
Equipment at fair value – Specialised equipment Depreciated replacement cost
Useful life Remaining useful life Average cost per unitComputer, furniture and fittings
Compressors
Machinery
Other equipment
Motor vehicles at fair value – Non-specialised motor vehicles Depreciated replacement cost
Remaining useful life Salvage value
4WD
Passenger
Trucks
Utilities
Leasehold assets at fair value
Leasehold improvements
Depreciated replacement cost
Remaining life of the lease

97 FINANCIAL REPORT
NOTE 8: STATUTORY OBLIGATIONS
IntroductionThis section includes disclosures in relation to the Corporation’s statutory obligations.
(a) Tax
(i) Income taxWestern Water is subject to the National Tax Equivalent Regime (NTER), which is administered by the Australian Taxation Office.
The income tax expense or revenue for the period is the expected tax payable or receivable on the current period's taxable income based on the national corporate income tax rate of 30%, adjusted by changes in deferred tax assets and liabilities attributable to temporary differences between the tax bases of assets and liabilities and their carrying amounts in the financial statements, and to unused tax losses.
The income tax expense for the financial year differs from the amount calculated on the net result. The differences are reconciled as follows:
2017 $’000
2016 $’000
Comprehensive Operating Statement
Current income tax expense (paid or payable) 4,538 2,848
Deferred income tax expense
Deferred tax relating to temporary differences (37) 715
Deferred tax asset - 2,036
(Over)/Under provision on prior year tax return 24 -
Other - (26)
Income tax as reported in the Comprehensive Operating Statement 4,525 5,573
Tax reconciliation
Net result before income tax expense 14,991 18,538
Tax at the Australian tax rate of 30% (2016: 30%) 4,498 5,561
Tax effect of amounts which are not deductible/(taxable) in calculating taxable income:
• Adjustment in respect of income tax of previous year 24 -
• Other 3 12
Income tax on profit before tax as reported in the Comprehensive Operating Statement 4,525 5,573
Tax expense relating to items of Other Comprehensive Income
Revaluation increase of infrastructure, property, plant and equipment - 20,194
- 20,194

98 WESTERN WATER ANNUAL REPORT 2016/17
NOTE 8: STATUTORY OBLIGATIONS (CONTINUED)
(a) Tax (continued)(ii) Deferred tax assets and liabilitiesDeferred tax assets and liabilities are recognised for temporary differences at the tax rate expected to apply when the assets are recovered or liabilities are settled, based on those tax rates which are enacted or substantially enacted. The relevant tax rates are applied to the cumulative amounts of deductible and taxable temporary differences to measure the deferred tax asset or liability.
No deferred tax asset or liability is recognised in relation to these temporary differences if they arose in a transaction that at the time of the transaction did not affect either accounting profit or taxable profit or loss. Deferred tax assets are recognised for deductible temporary differences and unused tax losses only if it is probable that future taxable amounts will be available to utilise those temporary differences and losses.
2017 $’000
2016 $’000
Deferred tax assets
Amounts recognised in Comprehensive Operating Statement
Doubtful debts 26 46
Employee benefits 1,129 1,054
Tax losses - -
Other 20 20
Total deferred tax assets at 30 June 1,175 1,120
Movements
Opening balance at 1 July 1,120 3,126
Credited/(debited) to the Comprehensive Operating Statement 55 31
Tax losses - (2,037)
Closing balance at 30 June 1,175 1,120
Deferred tax asset to be recovered within 12 months - -
Deferred tax asset to be recovered after more than 12 months 1,175 1,120
Closing balance at 30 June 1,175 1,120
Deferred tax liabilities
Amounts recognised in Comprehensive Operating Statement
Depreciation 35,458 42,259
35,458 42,259
Amounts recognised directly in equity
Revaluation of infrastructure, property, plant and equipment 63,178 56,360
63,178 56,360
Total deferred tax liabilities at 30 June 98,636 98,619
Movements
Opening balance at 1 July 98,619 77,707
Charged to the Comprehensive Operating Statement 17 718
Asset revaluation - 20,194
Closing balance 30 June 98,636 98,619
Deferred tax liabilities to be recovered within 12 months - -
Deferred tax liabilities to be recovered after more than 12 months 98,636 98,619
Net deferred tax assets/(liabilities) (97,462) (97,499)

99 FINANCIAL REPORT
(b) Environmental contribution levy
2017 $’000
2016 $’000
Environmental contribution levy 2,410 2,410
Total environmental contribution levy 2,410 2,410
The environmental contribution levy is collected from water supply authorities under the Water Industry Act 1994 (the Act). Under a 2004 amendment to the Act, the environmental contribution levy is collected to fund initiatives that seek to promote the sustainable management of water or address adverse water related environmental impacts.
The Victorian Government has committed to a fourth round or ('tranche') of the environmental contribution levy. The four-year tranche commenced on 1 July 2016. The Act establishes an obligation for authorities to pay into the consolidated fund annual contributions for the first period, from 1 July 2016 to 30 June 2020 in accordance with the pre-established schedule of payments, which sets out the amounts payable by each corporation.
The purpose of the environmental contribution levy is set out in the Act, and the funding may be used for the purpose of funding initiatives that seek to promote the sustainable management of water or address water-related initiatives.
Western Water has a statutory obligation to pay an environmental contribution levy to the Department of Environment, Land, Water and Planning. This contribution is recognised as an expense during the reporting period as incurred.
(i) Environmental contribution levy commitmentsAt 30 June 2017, Western Water had environmental contribution levy commitments exclusive of GST, to be paid as follows:
2017 $’000
within one year 2,410
one to five years 6,166
Total environment contribution levy commitments payable 8,576

100 WESTERN WATER ANNUAL REPORT 2016/17
NOTE 9: OTHER DISCLOSURES
IntroductionThis section includes additional material disclosures required by accounting standards or otherwise, for the understanding of this financial report.
(a) Equity
(i) Contributed capital
2017 $’000
2016 $’000
Opening balance at 1 July 160,413 160,413
Capital transactions with the State in its capacity as owner arising from:
• Capital contributions - -
Closing balance at 30 June 160,413 160,413
Consistent with the requirements of AASB 1004 Contributions, contributions by owners (that is, contributed capital and its repayment) are treated as equity transactions and, therefore, do not form part of the income and expenses of the Department.
Additions to net assets that have been designated as contributions by owners are recognised as contributed capital. Other transfers that have been designated as contributions by owners are in the nature of contributions to or distributions by owners.
(ii) Asset revaluation reserves
2017 $’000
2016 $’000
Composition of the asset revaluation reserves
Land 20,918 20,918
Buildings 1,664 1,664
Infrastructure 124,656 124,656
Equipment 178 178
Closing balance at 30 June 147,416 147,416
Movements during the reporting period
Balance 1 July 147,416 100,299
Revaluation increment/(decrement) net of tax effect
Land - 2,331
Buildings - (942)
Infrastructure - 45,550
Equipment - 178
Closing balance at 30 June 147,416 147,416

101 FINANCIAL REPORT
(iii) Accumulated surplus
2017 $’000
2016 $’000
Accumulated surplus at beginning of financial year 196,876 183,911
Net result for the period 10,466 12,965
Accumulated surplus at end of financial year 207,342 196,876
(b) Events occurring after the balance sheet date
No matters or circumstances have arisen since the end of the reporting period which significantly affected or may significantly affect the operations of the Corporation, the results of those operations, or the state of affairs of the Corporation in future financial years.
(c) Remuneration of executive officersThe number of executive officers, other than minister and the accountable officer, and their total remuneration during the reporting period are shown in the table below. Total annualised employee equivalents provides a measure of full time equivalent executive officers over the reporting period.
Remuneration comprises employee benefits in all forms of consideration paid, payable or provided by the Corporation, or on behalf of the entity, in exchange for services rendered, and is disclosed in the following categories:
Short-term employee benefits include amounts such as wages, salaries, annual leave or sick leave that are usually paid or payable on a regular basis, as well as non-monetary benefits such as allowances and free or subsidised goods or services.
Post-employment benefits include pensions and other retirement benefits paid or payable on a discrete basis when employment has ceased.
Other long-term benefits include long service leave, other long-service benefit or deferred compensation.
Termination benefits include termination of employment payments, such as severance packages.
Total remuneration of executive officers
2017 $’000
Short-term employee benefits 1,367
Post-employment benefits 134
Other long-term benefits 33
Total remuneration (i) (ii) 1,534
Total number of executives (iii) 8
Total annualised employee equivalents (iv) 7.48
(i) No comparatives have been reported because remuneration in the prior year was determined in line with the basis and definition under FRD 21B. Remuneration previously excluded non-monetary benefits and comprised any money, consideration or benefit received or receivable, excluding reimbursement of out-of-pocket expenses, including any amount received or receivable from a related party transaction. Refer to the prior year’s financial statements for executive remuneration for the 2015-16 reporting period.
(ii) The total number of executive officers includes persons who meet the definition of Key Management Personnel (KMP) of the Corporation under AASB 124 Related Party Disclosures and are also reported within the related parties note disclosure (Note 9(f) and 9(f)(ii)).
(iii) Three non-executive staff on GSERP contracts are included in 2016/17 (2015/16: Five).(iv) Annualised employee equivalent is based on the time fraction worked over the reporting period.

102 WESTERN WATER ANNUAL REPORT 2016/17
NOTE 9: OTHER DISCLOSURES (CONTINUED)
d) Responsible PersonsIn accordance with the Ministerial Directions issued by the Minister for Finance under the Financial Management Act 1994, the following disclosures are made regarding responsible persons for the reporting period.
The persons who held the positions of ministers and accountable officers in the Corporation are as follows:
Name Title Period of appointment
The Hon. Lisa Neville MP Minister for Water 1 July 2016 to 30 June 2017
T Larkins Chairman of the Board of Directors 1 July 2016 to 30 June 2017
Chairman of the People and Culture Committee 1 July 2016 to 30 June 2017
R Anderson Board Member 1 July 2016 to 30 June 2017
Chairman of the Investment Review Committee 1 July 2016 to 30 June 2017
J Anderson Deputy Chairman of the Board of Directors 1 July 2016 to 31 August 2016
Board Member 1 July 2016 to 31 August 2016
Chairman of the Community Engagement Committee 1 July 2016 to 31 August 2016
J Doolan Deputy Chairman of the Board of Directors 18 October 2016 to 30 June 2017
Board Member 1 July 2016 to 30 June 2017
R Walker Board Member 1 July 2016 to 30 June 2017
Chairman of the Audit and Risk Committee 1 July 2016 to 30 June 2017
L Prain Board Member 1 July 2016 to 30 June 2017
Chairman of the Community Engagement Committee 18 October 2016 to 30 June 2017
M McGarvie Board Member 1 July 2016 to 30 June 2017
R McQuilten Board Member 1 July 2016 to 30 June 2017
N Brennan Managing Director 1 July 2016 to 30 June 2017

103 FINANCIAL REPORT
(i) Remuneration of responsible personsThe compensation detailed below excludes the salaries and benefits the Portfolio Minister receives. The Minister’s remuneration and allowances is set by the Parliamentary Salaries and Superannuation Act 1968 and is reported within the Department of Parliamentary Services’ Financial Report.
Remuneration received or receivable by the responsible persons in connection with the management of the Corporation during the reporting period was in the range: $540,000 - $549,999 ($510,000 - $519,999 in 2015-16).
For the period July to October 2016 Western Water entered into a secondment contract with Goulburn Murray Water under which the Western Water Accountable Officer provided Managing Director services to Goulburn Murray Water. Western Water received a secondment fee for the provision of the services. During this period the Accountable Officer was still being paid by Western Water and their remuneration for this period is included in the amount above.
The number of responsible persons whose remuneration from Western Water was within the specified bands are as follows:
Income Band ($)2017
No.2016
No
0–9,999 2 5
10,000–19,999 - 5
20,000–29,999 5 2
30,000–39,999 - 1
40,000–49,999 1 -
50,000–59,999 - -
130,000–139,999 - -
270,000–279,999 - -
320,000–329,999 - -
330,000–339,999 1 1
Total number of responsible persons 9 14
In 2015/16 five Directors' appointments ceased on 30 September 2015, five new Directors were appointed on 1 October 2015 and one new director appointed 18 December 2015. In 2016/17 one Director's appointment ceased.
(ii) Retirement benefits of responsible personsNo retirement benefits were paid by the Corporation in connection with the retirement of responsible persons for the financial year 2016/17 (2015/16: $nil).
(e) Remuneration of auditors
2017 $’000
2016 $’000
Victorian Auditor-General’s Office
Audit or review of the annual financial statements 57 49
57 49
Other non-audit services (v)
Internal audit services 118 79
Regulatory audit services 81 92
199 171
Total remuneration of auditors 256 220
(v) The Victorian Auditor General’s Office is not allowed to provide non-audit services.
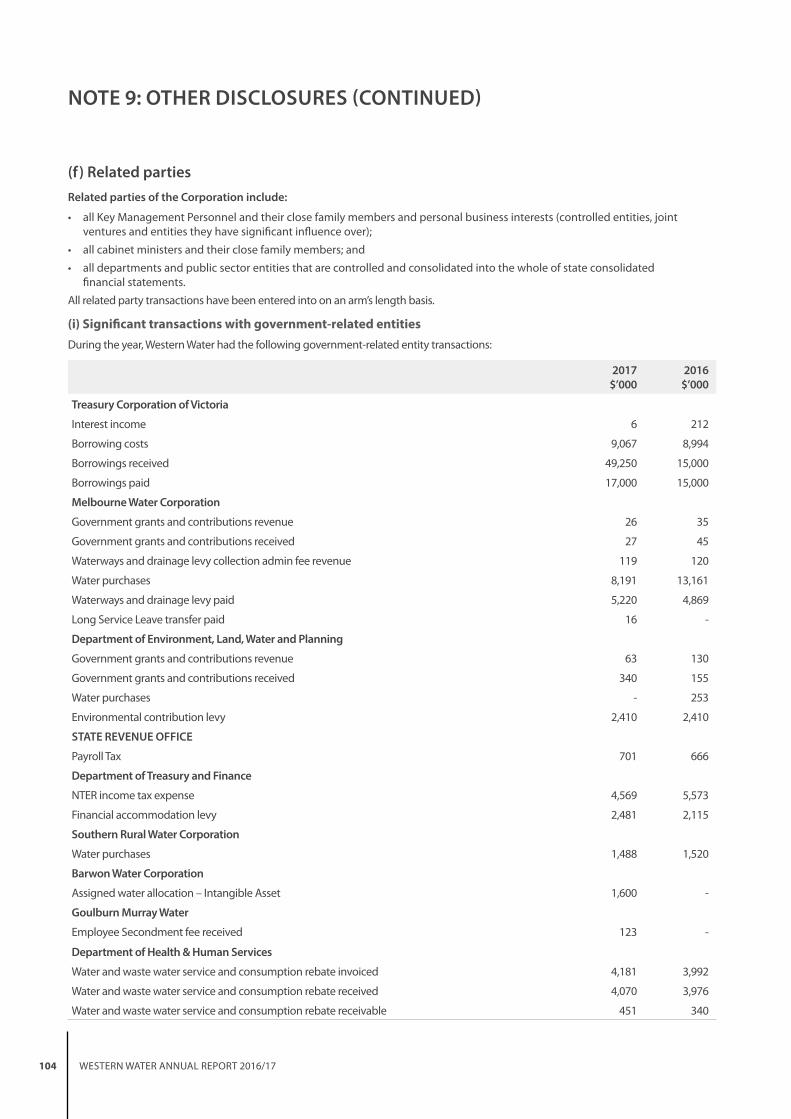
104 WESTERN WATER ANNUAL REPORT 2016/17
NOTE 9: OTHER DISCLOSURES (CONTINUED)
(f) Related partiesRelated parties of the Corporation include:
• all Key Management Personnel and their close family members and personal business interests (controlled entities, joint ventures and entities they have significant influence over);
• all cabinet ministers and their close family members; and
• all departments and public sector entities that are controlled and consolidated into the whole of state consolidated financial statements.
All related party transactions have been entered into on an arm’s length basis.
(i) Significant transactions with government-related entities During the year, Western Water had the following government-related entity transactions:
2017 $’000
2016 $’000
Treasury Corporation of Victoria
Interest income 6 212
Borrowing costs 9,067 8,994
Borrowings received 49,250 15,000
Borrowings paid 17,000 15,000
Melbourne Water Corporation
Government grants and contributions revenue 26 35
Government grants and contributions received 27 45
Waterways and drainage levy collection admin fee revenue 119 120
Water purchases 8,191 13,161
Waterways and drainage levy paid 5,220 4,869
Long Service Leave transfer paid 16 -
Department of Environment, Land, Water and Planning
Government grants and contributions revenue 63 130
Government grants and contributions received 340 155
Water purchases - 253
Environmental contribution levy 2,410 2,410
STATE REVENUE OFFICE
Payroll Tax 701 666
Department of Treasury and Finance
NTER income tax expense 4,569 5,573
Financial accommodation levy 2,481 2,115
Southern Rural Water Corporation
Water purchases 1,488 1,520
Barwon Water Corporation
Assigned water allocation – Intangible Asset 1,600 -
Goulburn Murray Water
Employee Secondment fee received 123 -
Department of Health & Human Services
Water and waste water service and consumption rebate invoiced 4,181 3,992
Water and waste water service and consumption rebate received 4,070 3,976
Water and waste water service and consumption rebate receivable 451 340

105 FINANCIAL REPORT
(ii) Key Management PersonnelKey Management Personnel of the Corporation includes:
Key Management Personnel Title
The Hon.Lisa Neville MP Minister for Water
T Larkins Chairman of the Board of Directors
R Anderson Board Member
J Anderson Board Member
J Doolan Board Member
L Prain Board Member
R Walker Board Member
M McGarvie Board Member
R McQuilten Board Member
N Brennan Managing Director
J Williams General Manager - Business Services Chief Finance and Accounting Officer
G Holt General Manager - Customer, Community Relations and Operations
L Bonazzi General Manager - Strategy & Planning
L Hasler General Manager - People and Culture
R Murphy General Manager - Capital Program & Delivery
M Jeal Company Secretary
(iii) Compensation of Key Management PersonnelThe compensation detailed below excludes the salaries and benefits the Portfolio Minister receives. The Minister’s remuneration and allowances is set by the Parliamentary Salaries and Superannuation Act 1968 and is reported within the Department of Parliamentary Services’ Financial Report.
2017 $’000
Short-term employee benefits 1,591
Post-employment benefits 148
Other long term benefits 33
Total compensation (vi) 1,772
(vi) Comparatives not required as AASB 124 not applicable to Western Water in 2015-16.
Note that this information relates to Key Management Personnel which differs to note 9(c) which relates to executive officers. For the period July to October 2016 Western Water entered into a secondment contract with Goulburn Murray Water under which the Western Water Accountable Officer provided Managing Director services to Goulburn Murray Water. Western Water received a secondment fee for the provision of the services. During this period the Accountable Officer was still being paid by Western Water and their remuneration for this period is included in the amount above.

106 WESTERN WATER ANNUAL REPORT 2016/17
NOTE 9: OTHER DISCLOSURES (CONTINUED)
(f) Related parties (continued)
(iv) Transactions with Key Management Personnel and other related partiesGiven the breadth and depth of Corporation activities, related parties transact with the Victorian public sector in a manner consistent with other members of the public e.g. water usage and other government fees and charges. Further employment of processes within the Victorian public sector occur on terms and conditions consistent with the Public Administration Act 2004 and Codes of Conduct and Standards issued by the Victorian Public Sector Commission. Procurement processes occur on terms and conditions consistent with the Victorian Government Procurement Board requirements.
Outside of normal citizen type transactions with the Corporation, there were no related party transactions that involved Key Management Personnel and their close family members. No provision has been required, nor any expense recognised, for impairment of receivables from related parties.
All other transactions that have occurred with Key Management Personnel and their related parties have been trivial or domestic in nature. In this context, transactions are only disclosed when they are considered of interest to users of the financial report in making and evaluation decisions about the allocation of scare resources.
(g) Ex-gratia expenses
2017 $’000
2016 $’000
Forgiveness or waiver of debt 424 388
Total ex-gratia expenses 424 388
The ex-gratia expenses relate to unpaid water usage charges by vacated residential tenants, waivers due to water leakage allowances as per industry guidelines and grants given to customers as part of the customer support program.

107 FINANCIAL REPORT
(h) Australian Accounting Standards issued that are not yet effectiveThe following AASs become effective for reporting periods commencing after the operative dates stated:
Certain new Australian accounting standards and interpretations applicable to the Corporation have been published that are not mandatory for the 30 June 2017 reporting period. Western Water has not and does not intend to adopt these standards early. Department of Treasury and Finance assesses the impact of all these new standards and advises the Corporation of their applicability and early adoption where applicable.
Standard/ Interpretation Key requirements
Effective date
Effective date for the entity
Impact on Western Water financial statements
AASB 9 Financial Instruments.
The key changes include the simplified requirements for the classification and measurement of financial assets, a new hedging accounting model and a revised impairment loss model to recognise impairment losses earlier, as opposed to the current approach that recognises impairment only when incurred.
1 January 2018
1 January 2018
The assessment has identified that the financial impact of Available For Sale (AFS) assets will now be reported through Other Comprehensive Income (OCI) and no longer recycled to the profit and loss. While the preliminary assessment has not identified any material impact arising from AASB 9 as Western Water does not hold any AFS assets, it will continue to be monitored and assessed.
AASB 2014 - 1 Amendments to Australian Accounting Standards (AAAs) [Part E Financial Instruments].
This results in amendments to various AASs to reflect the Australian Accounting Standards Board’s (AASB's) decision to defer the mandatory application date of AASB 9 to annual reporting periods beginning on or after 1 January 2018 as a consequence of Chapter 6 Hedge Accounting, and to amend reduced disclosure requirements.
1 January 2018
1 January 2018
This amending standard will defer the application period of AASB 9 to the 2018-19 reporting period in accordance with the transition requirements. While the preliminary assessment has not identified any material impact arising from AASB 9, Western Water will continue to assess the impact of this standard.
AASB 15 Revenue from Contracts with Customers.
The core principle of AASB 15 requires an entity to recognise revenue when the entity satisfies a performance obligation by transferring a promised good or service to a customer.
1 January 2018
1 January 2018
The changes in revenue recognition requirements in AASB 15 may result in changes to the timing and amount of revenue recorded in the financial statements. The Standard will also require additional disclosures on service revenue and contract modifications. The assessment has indicated that Western Water has no immediate potential impact to recognise revenue upfront. Ongoing work is being done further to monitor and assess the impact of this standard.
AASB 2016-7 Amendments to Australian Accounting Standards – Deferral of AASB 15 for Not-for-Profit Entities.
This standard defers the mandatory effective date of AASB 15 for not-for-profit entities from 1 January 2018 to 1 January 2019.
1 January 2019
1 January 2019
This amending standard will defer the application period of AASB 15 for not-for-profit entities to the 2019-20 reporting period. Ongoing work is being done to monitor and assess the impact of this standard.

108 WESTERN WATER ANNUAL REPORT 2016/17
Standard/ Interpretation Key requirements
Effective date
Effective date for the entity
Impact on Western Water financial statements
AASB 2010 - 7 Amendments to Australian Accounting Standards arising from AASB 9 (December 2010).
The requirements for classifying and measuring financial liabilities were added to AASB 9. The existing requirements for the classification of financial liabilities and the ability to use the fair value option have been retained. However, where the fair value option is used for financial liabilities the change in fair value is accounted for as follows:
• the change in fair value attributable to changes in credit risk is presented in Other Comprehensive Income (OCI); and
• other fair value changes are presented in profit or loss. If this approach creates or enlarges an accounting mismatch in the profit or loss, the effect of the changes in credit risk are also presented in profit or loss.
1 January 2018
1 January 2018
The assessment has indicated that there will be no significant impact for the Corporation.
AASB 2014 - 5 Amendments to Australian Accounting Standards arising from AASB 15.
Amends the measurement of trade receivables and the recognition of dividends. Trade receivables, that do not have a significant financing component, are to be measured at their transaction price, at initial recognition.
Dividends are recognised in the profit and loss only when:
• the entity's right to receive payment of the dividend is established;
• it is probable that the economic benefits associated with the dividend will flow to the entity; and
• the amount can be measured reliably.
1 January 2017, except amend-ments to AASB 9 (December 2009) and AASB 9 (December 2010) apply from 1 January 2018
1 January
2017,
except amend-ments to AASB 9 (December 2009) and AASB 9 (December 2010) apply from 1 January 2018
The assessment has indicated that there will be no significant impact for the Corporation.
AASB 2014 - 7 Amendments to Australian Accounting Standards arising from AASB 9.
This results in amendments to various AASs to incorporate the consequential amendments arising from the issuance of AASB 9.
1 July 2018
1 July 2018
The assessment has indicated that there will be no significant impact for the Corporation.
NOTE 9: OTHER DISCLOSURES (CONTINUED)
(f) Australian Accounting Standards issued that are not yet effective (continued)

109 FINANCIAL REPORT
Standard/ Interpretation Key requirements
Effective date
Effective date for the entity
Impact on Western Water financial statements
AASB 16 Leases.
The key changes introduced by AASB 16 include the recognition of most operating leases (which are currently not recognised) on balance sheet.
1 January 2019
1 January 2019
The assessment has indicated that as most operating leases will come on balance sheet, recognition of lease assets and lease liabilities will cause net debt to increase.
Depreciation of lease assets and interest on lease liabilities will be recognised in the income statement with marginal impact on the operating surplus.
The amounts of cash paid for the principal portion of the lease liability will be presented within financing activities and the amounts paid for the interest portion will be presented within operating activities in the cash flow statement.
No change for lessors.
AASB 2015 - 8 Amendments to Australian Accounting Standards - Effective Date of AASB 15
Revenue from Contracts with Customers.
This Standard defers the mandatory effective date of AASB 15 from 1 January 2017 to 1 January 2018.
1 January 2018
1 January 2018
This amending standard will defer the application period of AASB 15 to the 2018-19 reporting period in accordance with the transition requirements.
AASB 2016-4 Amendments to Australian Accounting Standards – Recoverable Amount of Non Cash Generating Specialised Assets of Not-for-Profit Entities.
The standard amends AASB 136 Impairment of Assets to remove references to using Depreciated Replacement Cost (DRC) as a measure of value in use for not-for-profit entities.
1 January 2017
1 January 2017
The assessment has indicated that there is minimal impact. Given the specialised nature and restrictions of public sector assets, the existing use is presumed to be the Highest and Best Use (HBU), hence current replacement cost under AASB 13 Fair Value Measurement is the same as the depreciated replacement cost concept under AASB 136. Ongoing work is being done to monitor and assess the impact of this standard.

110 WESTERN WATER ANNUAL REPORT 2016/17
Standard/ Interpretation Key requirements
Effective date
Effective date for the entity
Impact on Western Water financial statements
AASB 2016-3 Amendments to Australian Accounting Standards – Clarifications to AASB 15 Revenue from Contracts with Customers.
This Standard amends AASB 15 to clarify the requirements on identifying performance obligations, principal versus agent considerations and the timing of recognising revenue from granting a licence. The amendments require:
• A promise to transfer to a customer a good or service that is ‘distinct’ to be recognised as a separate performance obligation;
• For items purchased online, the entity is a principal if it obtains control of the good or service prior to transferring to the customer; and
• For licences identified as being distinct from other goods or services in a contract, entities need to determine whether the licence transfers to the customer over time (right to use) or at a point in time (right to access).
1 January 2018
1 January 2018
The assessment has indicated that there will be no significant impact for the Corporation, other than the impact identified in AASB 15.
AASB 1058 Income of Not-for-Profit Entities
This Standard will replace AASB 1004 Contributions and establishes revenue recognition principles for transactions that are not within the scope of AASB 15, where the consideration to acquire an asset is significantly less than fair value to enable not-for-profit entities to further their objectives.
1 January 2019
1 January 2019
Ongoing work is being done to monitor and assess the impact of this standard.
In addition to the new standards and amendments above, the AASB has issued the following list of other accounting pronouncements that are not effective for the 2016-17 reporting period (as listed below). At this stage, preliminary assessment suggests they may have insignificant impacts on public sector reporting.
• AASB 2016-1 Amendments to Australian Accounting Standards - Recognition of Deferred Tax Assets for Unrealised Losses [AASB 112];
• AASB 2016-2 Amendments to Australian Accounting Standards - Disclosure Initiative: Amendments to AASB 107;
• AASB 2016-5 Amendments to Australian Accounting Standards - Classification and Measurement of Share based Payment Transactions;
• AASB 2016-6 Amendments to Australian Accounting Standards - Applying AASB 9 Financial Instruments with ASB 4 Insurance Contracts;
• AASB 2017-1 Amendments to Australian Accounting Standards - Transfers of Investment Property, Annual Improvements 2014-2016 Cycle and Other Amendments; and
• AASB 2017-2 Amendments to Australian Accounting Standards - Further Annual Improvements 2014-16 Cycle.
NOTE 9: OTHER DISCLOSURES (CONTINUED)
(h) Australian Accounting Standards issued that are not yet effective (continued)

111 FINANCIAL REPORT
STATUTORY CERTIFICATION
Directors' and Chief Finance and Accounting Officer’s DeclarationThe attached financial report for Western Region Water Corporation has been prepared in accordance with Standing Directions 5.2 of the Financial Management Act 1994, applicable Financial Reporting Directions, Australian Accounting Standards including Interpretations, and other mandatory professional reporting requirements.
We further state that, in our opinion, the information set out in the comprehensive operating statement, balance sheet, statement of changes in equity, cash flow statement and accompanying notes, presents fairly the financial transactions during the financial year ended 30 June 2017 and financial position of the Corporation as at 30 June 2017.
At the time of signing, we are not aware of any circumstance which would render any particulars included in the financial statements to be misleading or inaccurate.
We authorise the attached financial statements for issue on 7 September 2017.
Terry Larkins Neil Brennan Julie Williams Chair Managing Director Chief Finance & Accounting Officer Western Region Water Corporation Western Region Water Corporation Western Region Water Corporation

112 WESTERN WATER ANNUAL REPORT 2016/17
AUDITOR - GENERAL'S REPORT OF WESTERN REGION WATER CORPORATION

113 FINANCIAL REPORT

114 WESTERN WATER ANNUAL REPORT 2016/17
APPENDICES
APPENDIX 1: DISCLOSURE INDEXPage
Financial reporting directions
Financial policy and disclosures
FRD 100A Financial Reporting Directions – framework 111
FRD 102A Inventories n/a
FRD 103F Non-current physical assets 56
FRD 104 Foreign currency 56
FRD 105B Borrowing costs 80
FRD 106A Impairment of assets 84
FRD 107B Investment properties n/a
FRD 108C Classification of entities as for-profit 56
FRD 109A Intangible assets 72
FRD 110A Cash flow statement 55
FRD 112D Defined benefit superannuation obligations 62
FRD 113A Investments in subsidiaries, jointly controlled entities and associates n/a
FRD 114B Financial instruments – general government entities and public non-financial corporations 84
FRD 116A Financial instruments – public financial corporations 84
FRD 117A Contributions of existing non-financial assets to third parties n/a
FRD 120K Accounting and reporting pronouncements applicable to 2016/17 reporting period 107
Non-financial policy and disclosures
FRD 03A Accounting for dividends 108
FRD 07B Early adoption of authoritative accounting pronouncements 107
FRD 11A Disclosure of ex-gratia payments 107
FRD 15D Executive officer disclosures 102
FRD 17B Wage inflation and discount rates for employee benefits 61
FRD 21C Disclosures of responsible persons, executive officers in the financial report 103
FRD 24C Reporting of office-based environmental data 45
FRD 26B Accounting for VicFleet motor vehicle lease arrangements on or after 1 February 2004 n/a
FRDs affecting the report of operations
FRD 10A Disclosure index 114
FRD12B Disclosure of major contracts 7
FRD 22H Manner of establishment and responsible Minister 1
Objectives, functions, powers and duties 1
Nature and range of services provided 2
Organisational structure 8
Comparative workforce data 14
Occupational health and safety 16
Application of the Protected Disclosure Act 44
Financial summary, objectives and performance 46

115
Page
FRD 22H Significant changes in financial position 49
Post balance date events 49
Consultancies 43
Government advertising 42
Environmental performance 27, 38
Application of the Freedom of Information Act 43
Availability of other information 45
Compliance with the Building Act 44
Compliance with the National Competition Policy 44
FRD 25C Local Jobs First - Victorian Industry Participation Policy 42
FRD 27C Presentation and reporting of performance information 35
FRD 29B Workforce data disclosures in the report of operations 14
FRD 30D Standard requirements for the publication of annual reports -
Standing directions
SD 3.2.1 Audit committee roles and responsibilities 12
SD 3.7.1 Risk management compliance attestation 45
SD 5.2 Comprehensive operating statement 52
Balance sheet 53
Statement of changes in equity 54
Cash flow statement 55
Notes to the financial statements 56
SD 5.1.4 Compliance with Australian Accounting Standards and other authoritative pronouncements 56
Accountable Officer’s declaration 111
SD 5.2 Compliance with FRDs 56, 111
SD 5.2.1(b) Compliance with Model Financial Report 51
SD 5.2.2 Sign off requirements 111
Ministerial reporting directions
MRD 01 Performance reporting 35
MRD 02 Water consumption 18
Drought response 18
Corporate water consumption 20
MRD 03 Sustainable water use 22
Sustainable and resilient water services systems 24
Other statutory obligations 27
Greenhouse gas emissions and net energy consumption 29
Community service obligations 34
MRD 04 Bulk entitlement reporting 116
MRD 05 Major non-residential water users 21
Legislation
Freedom of Information Act 1982 43
Building Act 1983 44
Protected Disclosure Act 2012 44
Victorian Industry Participation Policy (VIPP) Act 2003 42
Financial Management Act 1994 5, 56
APPENDICES

116 WESTERN WATER ANNUAL REPORT 2016/17
APPENDIX 2: BULK ENTITLEMENTS REPORTUnder bulk entitlement (BE) compliance requirements, Western Water must report the following for 2016/17 on the 10 BEs currently held by Western Water.
References to the relevant BE clause are stated in (brackets/lowercase).
Reporting for Barringo Lancefield Macedon Maribyrnong Myrniong Riddells Creek Romsey Werribee WoodendMelbourne Headworks System
Under BE clause 11.1 14.1 14.1 19.1 12.1 11.1 12.1 13.1 14.1 16.1
Water source and storage Barringo Creek, Pierce Reservoir
Garden Hut Creek (G), Monument Creek (M), Garden Hut Reservoir
Railway Creek, Turitable Creek, Willimigongon Creek and Reservoir (W), Kitty English (K), Frank Mann (F), Andersons (A), McDonalds (MC) and Orde Hill (O) Reservoirs
Slatey Creek, Jacksons Creek, Salty Creek, Gisborne Creek, Rosslynne Reservoir
Pykes Creek, Pykes Creek Reservoir
Main Creek, Forster and Wright Reservoirs
Bolinda Creek, Kerrie Reservoir
Lerderderg River, Goodmans Creek, Coimadai Creek, Lake Merrimu (M) Djerriwarrh Creek, Djerriwarrh Reservoir (DJ)
Campaspe River, Falls and Smokers Creeks, Barbour and Kavanagh Springs, Straws Lane Bore, Campaspe (CR), Graham Brock (GB) Reservoir, Reservoir C (C)
Various catchments via Melbourne Water’s supply system
Annual rainfall (mm) 1,011 806 1,108 877 681 849 854 551 920 N/A
Capacity of storage (ML) 64 46 475 25,368 22,119 76 297 32,516 (M) 1,014 (DJ)
366 1,812,175
Annual bulk entitlement (ML) 525 in any year, 1,600 over 5 years
315 873 in any year, 3,225 over 5 years
6,100 58 300 460 8,500 (M) 1,486 (DJ)
470 18,250
Western Water’s entitlement in storage at the start of the financial year (ML), and % full for the storage
15 23%
3.7 8% (d)
387 81% (d)
2,426 15% (a, ii)
58 100%
62 81%
229 77%
1,514 - 10% (M) 418 – 41% (DJ) (a, ii)
135 37% (d)
24,463 134% of BE
Inflows to storages from this BE water source (ML)
0 2,662 (a) 588 (a) 7,856 (a, iii) SRW 8.1 (e) 695 (e) 12,814 (M) (a,iii) 676 (DJ) (a,iv)
6,894 CR (a) 7.21 – Local catchment & Springs 0.0 - Falls Ck & Bore
15,068 (b)
Extra inflows (e.g. diversions into the storages) or local catchment runoff
9 0 0 754 0 92 93 0 (M) 77 (DJ)
0.00 - Melbourne Headworks 199.05 – Macedon 5.25 - Maribyrnong BE
0
Volume taken from the storage (ML)
0 (e) 131 (e) 199 - Woodend supply (O, MC, A, W) 363 – Macedon & Rosslynne supply (O, MC, A, W)
1,498 (a, i) 45.2 (b) 93 457 (e) 1,519 (M) (a, i) 50 (DJ)
234 (CR) (e) 283 (GB, C) (e)
10,443 (a)
Maximum extraction rate from storage or water source (ML/day)
0 from Barringo Creek (c) 1 Garden Hut Reservoir (c) 1.71- Macedon storages (c) 13.7 - Rosslynne Reservoir 0.3 from Pykes Reservoir
0.4 - Main Creek (c)
16.6 - Bolinda Creek (c)
11 from (M) 1 from (DJ)
1.4 (CR) 0 Falls & Smokers Ck (c)
56
Estimated evaporation (ML) -1.5 3.4 -23 SRW See Note 2 (a, iv)
SRW See Note 2
1.7 6.6 SRW (M) See note 2 99.95 (DJ)
5 MW
Other losses e.g. seepage, plant losses (ML)
7.2 Included in passing flows 18.4 531 See Note 2
SRW -2 298 See Note 4
1,338 (M) (a (v), a (vi), i) 137 (DJ)
-78 1891
Environmental releases (ML) N/A N/A 0 1,340 SRW 0 0 371 (M) (a, v) 26 (DJ) 18 N/A
Volume of environmental and passing flows (ML)
857 (b) 2,534 (G) & all Monument Creek flows (b)
426.2 (b) SRW (a, v) SRW 440.5 (b) 1612 (b) 371 (M) 26 (DJ) 6,466 (b) N/A
Passing/environmental requirements met
Yes Yes See note 1 N/A SRW See Note 3 Yes SRW (M) See Note 5 (DJ) Yes N/A
Any new bulk entitlement with respect of the system or amendments to the bulk entitlement
No (h) No (i) No (i,i) No (d, e) No (i) No (h) No (i) No (d) No (i) Yes (f)
Failure to comply with the BE, or compliance difficulties experienced or anticipated in the future
No (j) No (k) See note 1 (k) No (g) No (k) See Note 3 (j) No (k) See Note 5 (j) No (k) No (h)
Western Water’s entitlement unused or remaining in storage at end of financial year (ML) and % full for the storage
18 28%
20 44%
418 88%
7,616 38%
12.8 22%
68.7 90%
255.6 86%
11,041 50.5% (M)
959 95% (DJ)
329 90%
32,198 176% of BE
Key to table abbreviations WW Western Water component SRW Aspect managed by Southern Rural Water

117
APPENDIX 2: BULK ENTITLEMENTS REPORTUnder bulk entitlement (BE) compliance requirements, Western Water must report the following for 2016/17 on the 10 BEs currently held by Western Water.
References to the relevant BE clause are stated in (brackets/lowercase).
Reporting for Barringo Lancefield Macedon Maribyrnong Myrniong Riddells Creek Romsey Werribee WoodendMelbourne Headworks System
Under BE clause 11.1 14.1 14.1 19.1 12.1 11.1 12.1 13.1 14.1 16.1
Water source and storage Barringo Creek, Pierce Reservoir
Garden Hut Creek (G), Monument Creek (M), Garden Hut Reservoir
Railway Creek, Turitable Creek, Willimigongon Creek and Reservoir (W), Kitty English (K), Frank Mann (F), Andersons (A), McDonalds (MC) and Orde Hill (O) Reservoirs
Slatey Creek, Jacksons Creek, Salty Creek, Gisborne Creek, Rosslynne Reservoir
Pykes Creek, Pykes Creek Reservoir
Main Creek, Forster and Wright Reservoirs
Bolinda Creek, Kerrie Reservoir
Lerderderg River, Goodmans Creek, Coimadai Creek, Lake Merrimu (M) Djerriwarrh Creek, Djerriwarrh Reservoir (DJ)
Campaspe River, Falls and Smokers Creeks, Barbour and Kavanagh Springs, Straws Lane Bore, Campaspe (CR), Graham Brock (GB) Reservoir, Reservoir C (C)
Various catchments via Melbourne Water’s supply system
Annual rainfall (mm) 1,011 806 1,108 877 681 849 854 551 920 N/A
Capacity of storage (ML) 64 46 475 25,368 22,119 76 297 32,516 (M) 1,014 (DJ)
366 1,812,175
Annual bulk entitlement (ML) 525 in any year, 1,600 over 5 years
315 873 in any year, 3,225 over 5 years
6,100 58 300 460 8,500 (M) 1,486 (DJ)
470 18,250
Western Water’s entitlement in storage at the start of the financial year (ML), and % full for the storage
15 23%
3.7 8% (d)
387 81% (d)
2,426 15% (a, ii)
58 100%
62 81%
229 77%
1,514 - 10% (M) 418 – 41% (DJ) (a, ii)
135 37% (d)
24,463 134% of BE
Inflows to storages from this BE water source (ML)
0 2,662 (a) 588 (a) 7,856 (a, iii) SRW 8.1 (e) 695 (e) 12,814 (M) (a,iii) 676 (DJ) (a,iv)
6,894 CR (a) 7.21 – Local catchment & Springs 0.0 - Falls Ck & Bore
15,068 (b)
Extra inflows (e.g. diversions into the storages) or local catchment runoff
9 0 0 754 0 92 93 0 (M) 77 (DJ)
0.00 - Melbourne Headworks 199.05 – Macedon 5.25 - Maribyrnong BE
0
Volume taken from the storage (ML)
0 (e) 131 (e) 199 - Woodend supply (O, MC, A, W) 363 – Macedon & Rosslynne supply (O, MC, A, W)
1,498 (a, i) 45.2 (b) 93 457 (e) 1,519 (M) (a, i) 50 (DJ)
234 (CR) (e) 283 (GB, C) (e)
10,443 (a)
Maximum extraction rate from storage or water source (ML/day)
0 from Barringo Creek (c) 1 Garden Hut Reservoir (c) 1.71- Macedon storages (c) 13.7 - Rosslynne Reservoir 0.3 from Pykes Reservoir
0.4 - Main Creek (c)
16.6 - Bolinda Creek (c)
11 from (M) 1 from (DJ)
1.4 (CR) 0 Falls & Smokers Ck (c)
56
Estimated evaporation (ML) -1.5 3.4 -23 SRW See Note 2 (a, iv)
SRW See Note 2
1.7 6.6 SRW (M) See note 2 99.95 (DJ)
5 MW
Other losses e.g. seepage, plant losses (ML)
7.2 Included in passing flows 18.4 531 See Note 2
SRW -2 298 See Note 4
1,338 (M) (a (v), a (vi), i) 137 (DJ)
-78 1891
Environmental releases (ML) N/A N/A 0 1,340 SRW 0 0 371 (M) (a, v) 26 (DJ) 18 N/A
Volume of environmental and passing flows (ML)
857 (b) 2,534 (G) & all Monument Creek flows (b)
426.2 (b) SRW (a, v) SRW 440.5 (b) 1612 (b) 371 (M) 26 (DJ) 6,466 (b) N/A
Passing/environmental requirements met
Yes Yes See note 1 N/A SRW See Note 3 Yes SRW (M) See Note 5 (DJ) Yes N/A
Any new bulk entitlement with respect of the system or amendments to the bulk entitlement
No (h) No (i) No (i,i) No (d, e) No (i) No (h) No (i) No (d) No (i) Yes (f)
Failure to comply with the BE, or compliance difficulties experienced or anticipated in the future
No (j) No (k) See note 1 (k) No (g) No (k) See Note 3 (j) No (k) See Note 5 (j) No (k) No (h)
Western Water’s entitlement unused or remaining in storage at end of financial year (ML) and % full for the storage
18 28%
20 44%
418 88%
7,616 38%
12.8 22%
68.7 90%
255.6 86%
11,041 50.5% (M)
959 95% (DJ)
329 90%
32,198 176% of BE
APPENDICES
MW Aspect managed by Melbourne Water ML Megalitres N/A Not applicable

118 WESTERN WATER ANNUAL REPORT 2016/17
General information for bulk entitlements (BE)
Barringo Pierce Reservoir is an emergency off stream storage supplied by Barringo Creek and was not used for supply during the year.
Lancefield The Lancefield bores & Garden Hut Creek are used together as the sources of water for this town, after being treated at the Lancefield Water Filtration Plant. The transfer network from Romsey allowed water to be transferred from Romsey, Riddells and Maribyrnong BE during the year.
Macedon (see table for sources)
Storages are closely monitored to ensure adequate levels are maintained for fire-fighting (i.e. > 60%). This was achieved at all times during the year. The Macedon system allows for storages to be grouped for efficient monitoring of the total volume taken from these groups of storages. These groups are Kitty English and Frank Mann reservoirs (Railway Creek), Andersons and McDonalds reservoirs (Turitable Creek), and Orde Hill and Willimigongon reservoirs (Willimigongon Creek).
Maribyrnong Rosslynne Reservoir is operated by SRW, WW has BE to take water from this storage. WW supplied water from Rosslynne and significant inflows resulted in a storage increase during the year.
Myrniong Significant inflows resulted in a storage increase during the year, no changes to security of supply were made during 2016/17. No water was taken under this entitlement at any other works other than Pykes Creek Reservoir by Western Water.
Riddells Creek A volume of Maribyrnong BE was transferred to Riddells Creek and, combined with Riddells Creek BE, was transferred to Kerrie Reservoir to supplement supply and security in Romsey and Lancefield.
Romsey No volume can be added to the drought reserve for this BE from 2016/17. Extra inflows were sent to this BE from Riddells Creek and Maribyrnong BEs. Bore water was used during 2016/17 to supplement surface water supplies for Romsey.
Werribee Djerriwarrh Reservoir can supply an additional volume if needed for Melton and Bacchus Marsh, which are supplied via Merrimu Water Filtration Plant. A small raw water supply is also provided for local properties. Merrimu Reservoir is operated by SRW, WW has BE to take water from this storage. Significant inflows resulted in a storage increase during the year.
Woodend Woodend is supplied by local sources from Campaspe River and storages located on Mt Macedon. The connection to Macedon also means Woodend can be supplied from the Maribyrnong BE and Melbourne Headworks.
Melbourne Headworks
The total taken shown in the table can be split into 6,317 ML taken via the Hillside interface point to Melton and Bacchus Marsh, and 4,126 ML taken via the Loemans Rd interface point to Sunbury and the Macedon Ranges region.
Southern Rural Water (SRW) traded an additional 1,200 ML into Western Water’s Melbourne Headworks BE as an assignment transfer in June 2016 for supplying the Bacchus Marsh Irrigation District. SRW did not require any of this volume during 2016/17 however a volume of 93 ML was lost from this account during the year due to spills resulting in an EOFY balance of 1,107 ML. Western Water traded an additional 5,000 ML from Barwon Water during the year which has been added to Western Water’s 2016/17 carryover balance.
Western Water has worked with DELWP, SRW and Melbourne Water in the operation of its Bulk Entitlements during the year, and has largely complied with the provisions and requirements they contain, except as noted below. 2016/17 saw some significant inflows into Western Water storages.
Any reference to SRW in the above table indicates that this item is managed by SRW and the information can be sourced from the SRW Annual Report.
Western Water submitted a metering plan to DEPI (now DELWP) which was approved by the Minister. Implementation of this plan commenced in 2011/12 with improvements made in 2012 in conjunction with the Bureau of Meteorology funding program, to improve the accuracy and completeness of data captured. Western Water continues to improve the network with upgrades to two existing sites during 2016/17.
Western Water has previously submitted an Environmental Management Program associated with its bulk entitlements.
Western Water made no applications for changes under the Making Allowances clause in any of its relevant bulk entitlements in 2016-17.
Western Water made an application during 2016/17 to amend the Bulk Entitlement (Greater Yarra System – Thomson River Pool – Western Water) Order 2014. The amendment application was submitted by all Primary Entitlement holders to the Greater Yarra System – Thomson River Pool and related to a transfer of 9 GL from the urban retail entitlements to the environment. The amendment was approved and Gazetted on 1 June 2017.

119 APPENDICES
Notes
Note Comment
1 Passing flow requirements on Willimigongon Creek require manual operation and are difficult to operate under most conditions due to large variations in daily flows. As a result, failures to daily passing flow requirements occurred during 2016/17. This was compensated by ensuring average passing flows over the year exceeded the shortfall. To improve the manual process, telemetry was added during 2016/17 with alarming set to be completed in 2017/18 to further improve compliance with passing flow requirements.
2 SRW provides net inflows which include adjustments for Merrimu, Rosslynne and Pykes Creek reservoirs. The estimated evaporation for Merrimu and Rosslynne reservoirs is included in ‘Other losses’ and is part of the SRW volume correction water balance.
3 Passing flow requirements on Main Creek require manual operation. On six occasions, an over extraction occurred resulting in passing flows requirements not being met. This was compensated by ensuring average passing flows over the year exceeded the shortfall. Telemetry and alarming has been added to this monitoring network to improve compliance with passing flow requirements.
4 High losses from system assumed to be inflows to the reservoir that have lost as spills from Kerrie Reservoir.
5 Western Water has recently relied on changes in storage volume to determine inflows to Djerriwarrh Reservoir. These reservoir volumes are recorded weekly. This has been adequate in the past due to the stop/start nature of inflows. 2016/17 saw consistent daily inflows over a long period, meaning weekly data collection was inadequate to determine passing flow requirement. During 2017/18, a level sensor will be installed to improve data collection frequency.

120 WESTERN WATER ANNUAL REPORT 2016/17
ANNUAL REPORT INDEX
Page Page
Advertising 42 Integrated water management plans 26
Audit and Risk Committee 12 Intelligent Water Networks 26
Biodiversity 27 Investment Review Committee 12
Biosolids 29 Manner of establishment 1
Board 10 National Competition Policy 44
Board committees 12 Nature and range of services provided 2
Board Directors 10 Objectives, functions, powers & duties 1
Building Act compliance 44 Occupational Health & Safety 16
Bulk entitlements 20 Organisational structure 8
Bulk Entitlements Report 116 People and Culture Committee 12
Business at a glance 6 Performance Report 35
Capital projects 7 Protected disclosures 44
Community Engagement Committee 12 Recycled water 22
Community service obligations 34 Regional Catchment Management Strategy 27
Complaints 34 Reservoir levels 18
Consultancies 43 Responsible Minister 1
Corporate governance 8 Risk management 45
Customer service 34 Service area 3
Disclosure index 114 Service charges 34
Diversity and inclusion 14 Service delivery 32
Drought response 18 Sewer system 34
Energy consumption 30 State Environment Protection Policy 28
Environmental flows 29 Strategic intent 2
Environmental impacts 45 Sustainable water use 22
Environmental obligations 27 Utility Relief Grant Scheme 34
Environmental sustainability 22 Values 2
Financial Report 46 Victorian Biodiversity Strategy 27
Financial summary 46 Victorian Industry Participation Policy 42
Foreword from the Chair and MD 5 Water consumption 18
Freedom of information 43 Water efficiency 21
Grants 25 Water losses 19
Greenhouse gas emissions 29 Water quality 21
Highlights 4 Water supply system 32
Human resource management 14 Waterway management 27
Information and communication technology 42 Workforce 14
Information available on request 45 Year in review 4

Contact
Address 36 Macedon Street, Sunbury Hours 8.15am to 5pm Website www.westernwater.com.au Email [email protected] Telephone 1300 650 425 Mobile telephones and interstate callers 03 9218 5400 Facsimile 03 9218 5444
Mailing address Western Water, PO Box 2371, Sunbury DC, Victoria 3429
© State Government of Victoria, Western Region Water Corporation (Western Water) 2017. This publication is copyright. No part may be reproduced by any process except in accordance with the provisions of the Copyright Act 1968.
ISSN 1835-5927 (print) ISSN 1835-5935 (online)