Embed Size (px)
Citation preview

ANNUAL REPORTOCTOBER 31, 2017
CLOUGH GLOBAL DIVIDEND AND INCOME FUND
CLOUGH GLOBAL EQUITY FUND
CLOUGH GLOBAL OPPORTUNITIES FUND

Clough Global Dividend and Income Fund, Clough Global Equity Fund, and Clough Global Opportunities Fund (each a “Fund” and collectively,
the “Funds”), acting pursuant to a Securities and Exchange Commission (“SEC”) exemptive order and with the approval of each Fund’s Board of
Trustees (the “Board”), have adopted a plan, consistent with each Fund’s investment objectives and policies to support a level distribution of
income, capital gains and/or return of capital (the “Plan”). In accordance with the Plan, until July 2019, each Fund will pay monthly distributions
in an annualized amount of not less than 10% of the respective Fund’s average monthly net asset value (“NAV”). From August 2019 to July 2021,
each Fund will pay monthly distributions in an amount not less than the average distribution rate of a peer group of closed-end funds selected
by the Board of Trustees.
Under the Plan, each Fund will distribute all available investment income to its shareholders, consistent with each Fund’s primary investment
objectives and as required by the Internal Revenue Code of 1986, as amended (the “Code”). If sufficient investment income is not available on a
monthly basis, each Fund will distribute long-term capital gains and/or return of capital to shareholders in order to maintain a level distribution.
Each monthly distribution to shareholders is expected to be at the fixed amount established by the Board, except for extraordinary distributions
and potential distribution rate increases to enable each Fund to comply with the distribution requirements imposed by the Code.
Shareholders should not draw any conclusions about each Fund’s investment performance from the amount of these distributions or from the
terms of the Plan. Each Fund’s total return performance on net asset value is presented in its financial highlights table.
Until July 2021, each Board may amend, suspend or terminate each Fund’s Plan without prior notice if the Board determines in good faith that
continuation would constitute a breach of fiduciary duty or would violate the Investment Company Act of 1940. The suspension or termination
of the Plan could have the effect of creating a trading discount (if a Fund’s stock is trading at or above net asset value) or widening an existing
trading discount. Each Fund is subject to risks that could have an adverse impact on its ability to maintain level distributions. Examples of
potential risks include, but are not limited to, economic downturns impacting the markets, increased market volatility, companies suspending
or decreasing corporate dividend distributions and changes in the Code. Please refer to the Notes to Financial Statements in the Annual Report
to Shareholders for a more complete description of its risks.
Please refer to Additional Information for a cumulative summary of the Section 19(a) notices for each Fund’s current fiscal period. Section 19(a)
notices for each Fund, as applicable, are available on the Clough Global Closed-End Funds website www.cloughglobal.com.
Section 19(b) DiScloSure
October 31, 2017 (Unaudited)

Shareholder Letter .................................................................................................................... 2
Portfolio Allocation
Clough Global Dividend and Income Fund ........................................................................... 7
Global Equity Fund ............................................................................................................... 8
Global Opportunities Fund ................................................................................................... 9
Statement of Investments
Clough Global Dividend and Income Fund ......................................................................... 10
Global Equity Fund ............................................................................................................. 15
Global Opportunities Fund ................................................................................................. 19
Statements of Assets and Liabilities ........................................................................................ 24
Statements of Operations ....................................................................................................... 25
Statements of Changes in Net Assets ...................................................................................... 26
Statements of Cash Flows ....................................................................................................... 29
Financial Highlights
Clough Global Dividend and Income Fund ......................................................................... 30
Global Equity Fund ............................................................................................................. 31
Global Opportunities Fund ................................................................................................. 32
Notes to Financial Statements ................................................................................................ 33
Report of Independent Registered Public Accounting Firm............................... ............. ........52
Dividend Reinvestment Plan ................................................................................................... 53
Additional Information
Fund Proxy Voting Policies & Procedures .......................................................................... 54
Portfolio Holdings .............................................................................................................. 54
Notice ................................................................................................................................. 54
Shareholder Meeting ......................................................................................................... 54
Section 19(A) Notices ......................................................................................................... 54
Tax Designations ................................................................................................................ 55
Trustees & Officers .................................................................................................................. 56
Privacy Policy ........................................................................................................................... 61
Clough Global Funds Table of Contents

Clough Global Funds Shareholder Letter October 31, 2017 (Unaudited)
2 www.cloughglobal.com
To Our Investors:
Annual Results Clough Global Dividend and Income Fund (GLV) During the year ended October 31, 2017, the Clough Global Dividend and Income Fund’s total return, assuming reinvestment of all distributions, was 17.89% based on the net asset value and 34.22% based on the market price of the Fund. The S&P 500 and the Blended Index (50% Barclays U.S. Aggregate Index, 50% MSCI World Index) returned 23.63% and 11.68% respectively over the same period. During the year ended October 31, 2017, the Fund paid $1.29 per share in distributions. As of October 31st, the Fund had a dividend distribution rate on the market price of 9.11%.
Clough Global Equity Fund (GLQ) During the year ended October 31, 2017, the Clough Global Equity Fund’s total return, assuming reinvestment of all distributions, was 25.99% based on the net asset value and 41.01% based on the market price of the Fund. The S&P 500 and the MSCI World Index returned 23.63% and 23.46% respectively over the same period. During the year ended October 31, 2017, the Fund paid $1.24 per share in distributions. As of October 31st, the Fund had a dividend distribution rate on the market price of 9.08%.
Clough Global Opportunities Fund (GLO) During the year ended October 31, 2017, the Clough Global Opportunities Fund’s total return, assuming reinvestment of all distributions, was 20.99% based on the net asset value and 39.95% based on the market price of the Fund. The S&P 500 and the Blended Index (25% Barclays U.S. Aggregate Index, 75% MSCI World Index) returned 23.63% and 17.44% respectively over the same period. During the year ended October 31, 2017, the Fund paid $1.07 per share in distributions. As of October 31st, the Fund had a dividend distribution rate on the market price of 9.37%.
Final Thoughts for Fiscal Year 2017 For the fiscal year ending on October 31, 2017, all three funds exhibited very strong absolute and relative performance to their respective benchmarks. The leading contributors to performance were found in the information technology and consumer discretionary sectors while the largest detractors were in financial and industrial short positions. The largest individual contributor in all three funds was Apple. Bank of America, Citigroup, as well as Liberty Ventures were also top performers that are still large positions in the portfolio today. We will go into more detail on our larger themes later in the letter. During the fiscal period, the top five detractors included US Treasuries, Deutsche Lufthansa, Fairway Energy, KBW Regional Bank ETF and State Bank of India. Our short position in the KBW Regional Bank ETF was a large detractor, but we are inclined to keep this position as a flattening yield curve and cost pressures continue to cut into small banks’ margins and ability to compete with the larger money center banks. We are still very bullish on India, but decided to exit the State Bank of India position. We still believe in a low rate environment going forward so we will continue to hold the US Treasuries despite the losses incurred this year. The recent flattening in the yield curve has offset some of these losses. The funds’ short position in German airline Deutsche Lufthansa was also a detractor and is no longer held in the funds. Fairway Energy is a privately held security that is in the process of building salt domes for oil storage in Texas. Construction delays and the active hurricane season have delayed the initial public offering.
COMMENTARY ON SOME OF OUR CURRENT LARGER THEMES
THE APPLE‐LED SMARTPHONE CYCLE Both Apple Inc. and Samsung remain among our largest current holdings. Sentiment surrounding the smartphone demand cycle, in particular the iPhone X (“X”), is too pessimistic and we think the market is seriously under pricing the phone’s likely success. Reports of disappointing sales of the iPhone 8 simply point to more pent up demand for the more profitable X, in our view. Over the next few years, as Apple moves its loyal user base to the iPhone X and iPhone 8+, there is a likelihood that pricing will rise by 30‐40% over older iPhone models. That says to us that revenues will likely expand far more than current analyst models indicate. There is a lot more profit margin built into the X as price increases do far more than simply adjust for component costs. While announced price increases are $200 higher on the X, for example, we do not think costs will be up more than $80. Yet Apple stock sells at 11x earnings per share (EPS) once balance sheet cash is deducted. We also think investors will come to understand that the value of Apple’s loyal customer base is unrecognized by the marketplace and its secular price‐earnings ratio (P/E) can rise. Meanwhile, Samsung is demonstrating that a $950 phone can sell even in emerging markets and that indicates Apple’s iPhone X could be very successful in China and other emerging markets. The Samsung Galaxy Note 8 upon introduction received over 250,000 registrations in almost no time. Ironically for Samsung, we think there is more money to be made selling components to Apple than in selling its own phones. The company is also a strong participant in both semiconductor memory and organic light‐emitting diode (OLED) screen design which will be used across all industry products. Yet despite this near proprietary technological leadership, the stock sells at a mere three times earnings before interest, tax, depreciation, and amortization (EBITDA) to enterprise value.

Clough Global Funds Shareholder Letter October 31, 2017 (Unaudited)
Annual Report | October 31, 2017 3
CHINA INTERNET A significant part of our China portfolio includes a number of what we consider to be “best in class” China internet companies. After flat lining for several years, China internet stocks are performing in response to acceleration in revenues that we think is sustainable. E‐commerce activity is booming in China, it is almost double that of the United States, and the backdrop for sustained growth in internet activity is strong. The most inefficient state‐owned enterprises (SOEs) are being restructured and in the industrial sector steel and coal manufacturing is being replaced by auto and aerospace components. And finally the “One Belt, One Road” initiative, a development strategy that focuses on connectivity between Eurasian countries, looms as a massive infrastructure event promising strong fiscal stimulus in coming years. China’s internet companies are finding more effective ways to monetize their customer bases, and the companies are penetrating into third tier cities where incomes are growing more rapidly. They are also pushing the envelope in terms of innovation. The stocks in the aggregate trade at substantial discounts to their US counterparts, which is understandable given complicated offshore public ownership structures. Our view, however, is that these companies have global ambitions so global stock ownership makes sense and their growth rates are so much higher that valuations can converge somewhat over time. We believe a number of our current portfolio holdings in this area have very attractive sustainable growth trajectories driven by a number of factors. For example, JD.com operates in the business to consumer sector of China’s internet economy, and is the only company in China with end to end logistics. As a result, the customer experience is considered better than most competitors. Many of its clients are offered same day/next day delivery, for example. A current holding in GLQ and GLO, Baidu, is China’s dominant search engine with over 80% market share. The company’s past financial performance had been hurt by ill‐advised investments in the online‐to‐offline segment, which dragged corporate operating margins from the low 40% range in 2013 to the low 20% range in the beginning of 2017. What makes us more optimistic about the prospects for the stock, however, was the appointment in the beginning of January of Qi Lu as president of the company. Mr. Lu was a key deputy to Microsoft’s Chief Executive Officer Satya Nadella and was in charge of the Office and Bing search engine products. Since his ascension, we have seen Baidu divest from some of its non‐core businesses and focus its efforts not only in search, but also in its iQiyi business, which is similar to Netflix, and artificial intelligence. We have recently seen his efforts pay off, with operating margins recovering nicely in the company’s most recent quarter. Management recently guided for better‐than‐consensus revenues. We believe that Baidu’s restructuring is just beginning and the company’s growth drivers in search, video and artificial intelligence have created a nice platform for sustainable growth. Baozun is the leading provider of ecommerce solutions in China. As e‐commerce in China grows, the need for supply chains solutions, especially warehousing, will also grow. There is a particular opportunity to provide these services to foreign brands as they grow their business on Alibaba, JD.com and their own websites. There is also a large need to service local Chinese businesses as they migrate from offline to online. These business need a platform to manage fluctuating online transaction volumes and payment processing, in addition to warehouse management and shipping capabilities. Companies like Shopify, which has a similar model here, have been very successful and we have high expectations for Baozun if it can replicate a fraction of this success in China.
INDIA Our bullish feelings for India come from the emergence of financial sector reform, a positive credit cycle and a leader that has clearly laid out an economic vision. One year out from the exchange of old high value banknotes for new, the so‐called “demonetization” scheme, the motive is clearer. It was more than a crackdown on corruption and money laundering. It reflected Mr. Modi’s intent to change the history of India and purge it of socialist era economic policies by removing the easy use of cash to operate within it. The Goods and Services Tax (GST) and bankruptcy law changes enhance productivity and broaden the tax base, which gives the government more fiscal flexibility. There is a growing sense that government policy will be focused on growing the economy. Sixty five percent of India’s population is less than 35 years of age and they have to be provided jobs. Fortunately, they have a person with a vision and mandate to lead. Freeing up the flow of credit is a key challenge because the state‐owned banks, which control 70% of bank assets in the country, are paralyzed by bad loans, are essentially without equity and are shrinking. India is pushing to restructure and shrink public banks. Most press commentary rests on current dysfunction but evidence is emerging that India can grow more rapidly than most people think. For example, India posted 6% growth in the face of a virtual collapse in available cash after Mr. Modi’s demonetization scheme was implemented. India has a vast stock of private savings and now that available cash has been restored, non‐banks and private sector banks are taking up the slack, providing much needed loans to small and mid‐sized businesses. Wealth is no longer being stored only in land and collectibles, but in liquid savings. Loans are picking up as customers switch from high cost sidewalk lenders. Private non‐bank lenders are lending to poorer Indians who use the proceeds to pay off the loan sharks, then they can take out the loans which lift them out of poverty. Non‐banks are growing loans at 25% per annum and many focus on a single sector. Two of our largest India holdings such as Housing Development Finance Corp. and Indiabulls Housing Finance are focused on funding the reconstruction of India’s poor housing stock since government subsidies are precisely aimed at that. Private

Clou
4
banks haare picki FIXED INThe fundlevels of a low ratgoing for We still sand comlong termto their r
LOOKIN Several ohave subAsian mainvest inand profresident Long shoshort boA flawed
FUND D The fundnumber 10% untrelative tBoard wi If you ha Sincerely
Charles I
Robert M
ugh Globa
ave the technolong up in India, g
NCOME ds are currently the year. The fute environment rward.
see attractive inmmercial mortgam track records return on equity
NG FORWARD:
of the fund’s strabstantially increaarkets have only these markets. fitable their conial housing stock
ort strategies haook has become d natural gas ETF
DISCOUNT MA
ds have taken a of changes to ril July 2019, subto net asset valuill continue to loo
ave any question
y,
I. Clough, Jr.
M. Zdunczyk
al Funds
ogy to assess cregrowing 25% in r
positioned veryunds currently hin the long term
come and capitaage real estate iin managing crey.
THE REEMERG
ategies are perfased. While US sy recently come We believe thatnsumer franchisks.
ve faced huge hmore focused oF, lenders with in
NAGEMENT PR
number of stepseduce the expebject to certain ue. Finally, the Bok for other opp
ns about your inv
editworthiness arecent years.
y conservativelyold short dated
m and will use an
al appreciation pnvestment trustedit, produce 8%
GENCE OF VAL
orming stronglystocks have beeto life and it is t our investmenes are becomin
headwinds in recon companies dincreasing asset r
ROGRAM
s in the last yearnse ratios of theconditions. HistBoard also impleortunities to tak
vestment, pleas
and those invest
in fixed incomeinvestment gradny widening in c
potential in somt (REIT) Starwoo% to 10% dividen
LUE AND EMER
after trading win strong for almour view they cts in large US bang. The domesti
cent years in an splaying bad barisk and compan
r to shrink the pre fund. This pasory has shown temented a signie shareholder fr
e call 1‐877‐256
ments should be
e. The yield curvde corporate decredit spreads or
me of our specialod Property Trusnd yields, and ar
RGING MARKE
ithin a limited ramost a decade anould outperformanks will likely alc housing cycle
exchange tradelance sheets, lonies on the wron
rice discount to t fall, the fund’sthat funds with ficant tender ofiendly actions th
6‐8445.
e buttressed by
ve has flattenedebt and longer dr increase in trea
ty finance namest. We see valuere trading histor
ET STRENGTH A
ange for a few ynd many commem meaningfully ilso see valuation is also finally p
ed fund (ETF) dring term deteriong side of emerg
net asset value.s Board of Trusthigher distributffer in Novembehat will also shrin
Sh
private equity f
d and credit spreated US Treasurasury yields as a
es like middle me in names like ically below the
ARE FUND TAI
years while the uentators expressin coming yearsn upgrades as it picking up, prov
iven world, but woration in revenuging technologie
. Throughout thtees agreed to ation rates trade er at 98.5% of nenk the funds price
hareholdeOctober 31, 201
www.clou
flows. Even life i
eads are just offries. We continua potential buyin
arket lender AreAres and Starwir book value m
LWINDS
underlying fundas “bubble concer. We believe webecomes clear viding a positive
we think that wues and declinins are a few exam
he year, Clough Ca managed distr at more attractet asset value. Ce discount to net
er Letter17 (Unaudited)
ughglobal.com
nsurance sales
f their tightest ue to believe in ng opportunity
es Capital Corp wood that have ultiple relative
amental values rns”, emerging e know how to how dominant e backdrop for
ill change. Our ng profitability. mples.
Capital made a ibution rate of tive valuations Clough and the t asset value.

Clough Global Funds Shareholder Letter October 31, 2017 (Unaudited)
Annual Report | October 31, 2017 5
This letter is provided for informational purposes only and is not an offer to purchase or sell shares. Clough Global Dividend and Income Fund, Clough Global Equity Fund and Clough Opportunities Fund (the “Funds”) are closed-end funds, which are traded on the NYSE American LLC, and does not continuously issue shares for sale as open-end mutual funds do. The market price of a closed-end Fund is based on the market’s value.
The information in this letter represents the opinions of the individual Portfolio Managers and is not intended to be a forecast of future events, a guarantee of future results, or investment advice. Past performance is no guarantee of future results.
MSCI World Index: a stock market index of world stocks. It is maintained by MSCI Inc. and is often used as a common benchmark for world or global stock funds. The index includes a collection of stocks of all the developed markets in the world as defined by MSCI.
S&P 500 Index: Broad-based measurement of changes in stock market conditions based on the average performance of 500 widely held common stocks commonly known as the Standard & Poor’s 500® or S&P 500®. Index in unmanaged.
Barclays U.S. Aggregate Bond Index: Measures the performance of the U.S. investment grade bond market. The index invests in a wide spectrum of public, investment-grade, taxable, fixed income securities in the United States, including government, corporate, and international dollar denominated bonds, as well as mortgage-backed and asset-backed securities, all with maturities of more than 1 year.
The net asset value (NAV) of a closed-end fund is the market price of the underlying investments (i.e., stocks and bonds) in the fund’s portfolio, minus liabilities, divided by the total number of fund shares outstanding. However, the fund also has a market price; the value of which it trades on an exchange. This market price can be more or less than its NAV.
It is not possible to invest directly in an Index.
RISKS An investor should consider investment objectives, risks, charges and expenses carefully before investing. To obtain a prospectus, annual report or semiannual report which contains this and other information visit www.cloughglobal.com or call 1-877-256-8445. Read them carefully before investing.
A Fund’s distribution policy will, under certain circumstances, have certain adverse consequences to the Fund and its shareholders because it may result in a return of capital resulting in less of a shareholder’s assets being invested in the Fund and, over time, increase the Fund’s expense ratio.
Distributions may be paid from sources of income other than ordinary income, such as net realized short-term capital gains, net realized long-term capital gains and return of capital. Based on current estimates, we anticipate the most recent distribution has been paid from short-term and long-term capital gains. The actual amounts and sources of the amounts for tax reporting purposes will depend upon a Fund’s investment experience during the remainder of its fiscal year and may be subject to changes based on tax regulations. If a distribution includes anything other than net investment income, the Fund provides a Section 19(a) notice of the best estimate of its distribution sources at that time. These estimates may not match the final tax characterization (for the full year’s distributions) contained in shareholders’ 1099-DIV forms after the end of the year.
A Fund’s investments in securities of foreign issuers are subject to risks not usually associated with owning securities of U.S. issuers. These risks can include fluctuations in foreign currencies, foreign currency exchange controls, social, political and economic instability, differences in securities regulation and trading, expropriation or nationalization of assets, and foreign taxation issues.
A Fund’s investments in preferred stocks and bonds of below investment grade quality (commonly referred to as “high yield” or “junk bonds”), if any, are predominately speculative because of the credit risk of their issuers.
An investment by a Fund in REITs will subject it to various risks. The first, real estate industry risk, is the risk that the REIT share prices will decline because of adverse developments affecting the real estate industry and real property values. In general, real estate values can be affected by a variety of factors, including supply and demand for properties, the economic health of the country or of different regions, and the strength of specific industries that rent properties. The second, investment style risk, is the risk that returns from REITs—which typically are small or medium capitalization stocks—will trail returns from the overall stock market. The third, interest rate risk, is the risk that changes in interest rates may hurt real estate values or make REIT shares less attractive than other income-producing investments. Credit risk is the risk that an issuer of a preferred or debt security will become unable to meet its obligation to make dividend, interest and principal payments.
Interest rate risk is the risk that preferred stocks paying fixed dividend rates and fixed-rate debt securities will decline in value because of changes in market interest rates. When interest rates rise the value of such securities generally will fall. Derivative transactions (such as futures contracts and options thereon, options, swaps, and short sales) subject a Fund to increased risk of principal loss due to imperfect correlation or unexpected price or interest rate movements. Compared to investment companies that focus only on large companies, the Fund’s share price may be more volatile because it also invests in small and medium capitalization companies.
Past performance is no guarantee of future results.

Clough Global Funds Portfolio Allocation October 31, 2017 (Unaudited)
6 www.cloughglobal.com
CLOUGH GLOBAL DIVIDEND AND INCOME FUND Top 10 Equity Holdings* % of Total Portfolio 1. Apple, Inc. 5.57% 2. Lam Research Corp. 3.26% 3. Microsoft Corp. 2.76% 4. Bank of America Corp. 2.54% 5. Citigroup, Inc. 2.50% 6. Samsung Electronics Co., Ltd. 2.12% 7. Pfizer, Inc. 2.04% 8. Starwood Property Trust, Inc. 2.00% 9. Ares Capital Corp. 1.86% 10. Broadcom, Ltd. 1.86%
CLOUGH GLOBAL EQUITY FUND
Top 10 Equity Holdings* % of Total Portfolio 1. Apple, Inc. 5.29% 2. Bank of America Corp. 2.64% 3. Citigroup, Inc. 2.56% 4. Broadcom, Ltd. 2.56% 5. Lam Research Corp. 2.52% 6. Starwood Property Trust, Inc. 2.23% 7. Blackstone Mortgage Trust, Inc. 2.20% 8. Ares Capital Corp. 2.09% 9. Liberty Ventures 1.97% 10. Microsoft Corp. 1.88%
CLOUGH GLOBAL OPPORTUNITIES FUND
Top 10 Equity Holdings* % of Total Portfolio 1. Apple, Inc. 5.34% 2. Bank of America Corp. 2.58% 3. Lam Research Corp. 2.54% 4. Citigroup, Inc. 2.54% 5. Starwood Property Trust, Inc. 2.03% 6. JPMorgan Chase & Co. 1.89% 7. Samsung Electronics Co., Ltd. 1.84% 8. Liberty Ventures 1.83% 9. Broadcom, Ltd. 1.76% 10. Liberty Broadband Corp. 1.73% Holdings are subject to change. *Only long positions are listed.

Clough Global Dividend and Income Fund Portfolio Allocation October 31, 2017 (Unaudited)
Annual Report | October 31, 2017 7
Asset Allocation* % of Total Portfolio Common Stock ‐ US 21.97%Common Stock ‐ Foreign 20.73%Exchange Traded Funds ‐2.59%Participation Notes 1.42%Total Return Swap Contracts 5.88%
Total Equities 47.41%
Corporate Debt 19.17%Government L/T 11.28%Asset/ Mortgage Backed 8.37%Municipal Bond 3.57%Preferred Stock 2.45%
Total Fixed Income 44.84%
Short‐Term Investments 8.23%Other (Cash) ‐0.48%
TOTAL INVESTMENTS 100.00%
Country Allocation**
Long
Exposure %TNA
Short
Exposure %TNA
Gross
Exposure %TNA
Net Exposure
%TNA United States 101.9% ‐7.8% 109.7% 94.1%U.S. Multinationals* 21.0% ‐2.3% 23.3% 18.7%India 8.4% 0.0% 8.4% 8.4%China 4.9% 0.0% 4.9% 4.9%Japan 4.2% ‐0.5% 4.7% 3.7%South Korea 2.9% 0.0% 2.9% 2.9%Singapore 2.6% 0.0% 2.6% 2.6%United Kingdom 1.3% 0.0% 1.3% 1.3%Canada 0.7% 0.0% 0.7% 0.7%Denmark 0.5% 0.0% 0.5% 0.5%Other 1.8% ‐1.5% 3.3% 0.3%
TOTAL INVESTMENTS 150.2% ‐12.1% 162.3% 138.1%
* Percentages are based on total investments, including securities sold short and derivative contracts. Holdings are subject to change.
^ Includes securities sold short, derivative contracts and foreign cash balances.
† US Multinational Corporations – has more than 50% of revenues derived outside of the U.S.
** Calculated as percent of total net assets using value of cash traded securities and foreign cash balances, and notional value of derivative contracts.
Global Securities Holdings^ % of Total Portfolio United States 68.08%U.S. Multinationals* 13.55%India 6.11%China 3.57%Japan 2.66%South Korea 2.12%Singapore 1.86%United Kingdom 0.95%Canada 0.47%Denmark 0.40%Other 0.23%
TOTAL INVESTMENTS 100.00%

Clough Global Equity Fund Portfolio Allocation October 31, 2017 (Unaudited)
8 www.cloughglobal.com
Asset Allocation* % of Total Portfolio Common Stock ‐ US 41.76%Common Stock ‐ Foreign 30.21%Exchange Traded Funds ‐2.57%Participation Notes 1.42%Total Return Swap Contracts 6.56%
Total Equities 77.38%
Government L/T 5.80%Preferred Stock 2.43%Asset/ Mortgage Backed 0.26%
Total Fixed Income 8.49%
Short‐Term Investments 14.44%Other (Cash) ‐0.31%
TOTAL INVESTMENTS 100.00%
Country Allocation**
Long
Exposure %TNA
Short
Exposure %TNA
Gross
Exposure %TNA
Net Exposure
%TNA United States 91.5% ‐8.2% 99.7% 83.3%U.S. Multinationals* 19.4% ‐2.3% 21.7% 17.1%China 10.6% 0.0% 10.6% 10.6%India 9.1% 0.0% 9.1% 9.1%Japan 4.4% ‐0.5% 4.9% 3.9%Singapore 3.5% 0.0% 3.5% 3.5%South Korea 2.5% 0.0% 2.5% 2.5%United Kingdom 1.6% 0.0% 1.6% 1.6%Switzerland 1.0% 0.0% 1.0% 1.0%Austria 0.9% 0.0% 0.9% 0.9%Other 2.8% ‐1.5% 4.3% 1.3%
TOTAL INVESTMENTS 147.3% ‐12.5% 159.8% 134.8%
* Percentages are based on total investments, including securities sold short and derivative contracts. Holdings are subject to change.
^ Includes securities sold short, derivative contracts and foreign cash balances.
† US Multinational Corporations – has more than 50% of revenues derived outside of the U.S.
** Calculated as percent of total net assets using value of cash traded securities and foreign cash balances, and notional value of derivative contracts.
Global Securities Holdings^ % of Total Portfolio United States 61.81%U.S. Multinationals* 12.74%China 7.86%India 6.78%Japan 2.91%Singapore 2.56%South Korea 1.83%United Kingdom 1.18%Switzerland 0.74%Austria 0.66%Other 0.93%
TOTAL INVESTMENTS 100.00%

Clough Global Opportunities Fund Portfolio Allocation October 31, 2017 (Unaudited)
Annual Report | October 31, 2017 9
Asset Allocation* % of Total Portfolio Common Stock ‐ US 30.53%Common Stock ‐ Foreign 26.25%Exchange Traded Funds ‐2.62%Participation Notes 1.45%Total Return Swap Contracts 6.10%
Total Equities 61.71%
Corporate Debt 13.53%Government L/T 10.34%Asset/ Mortgage Backed 6.28%Municipal Bond 1.65%Preferred Stock 1.16%
Total Fixed Income 32.96%
Short‐Term Investments 6.27%Other (Cash) ‐0.94%
TOTAL INVESTMENTS 100.00%
Country Allocation**
Long
Exposure %TNA
Short
Exposure %TNA
Gross
Exposure %TNA
Net Exposure
%TNA United States 94.7% ‐9.2% 103.9% 85.5%U.S. Multinationals* 20.1% ‐2.3% 22.4% 17.8%China 10.3% 0.0% 10.3% 10.3%India 8.6% 0.0% 8.6% 8.6%Japan 4.6% ‐0.5% 5.1% 4.1%South Korea 2.5% 0.0% 2.5% 2.5%Singapore 2.4% 0.0% 2.4% 2.4%Canada 1.6% 0.0% 1.6% 1.6%United Kingdom 1.3% 0.0% 1.3% 1.3%Switzerland 1.0% 0.0% 1.0% 1.0%Other 2.7% ‐1.5% 4.2% 1.2%
TOTAL INVESTMENTS 149.8% ‐13.5% 163.3% 136.3%
* Percentages are based on total investments, including securities sold short and derivative contracts. Holdings are subject to change.
^ Includes securities sold short, derivative contracts and foreign cash balances.
† US Multinational Corporations – has more than 50% of revenues derived outside of the U.S.
** Calculated as percent of total net assets using value of cash traded securities and foreign cash balances, and notional value of derivative contracts.
Global Securities Holdings^ % of Total Portfolio United States 62.67%U.S. Multinationals* 13.03%China 7.58%India 6.32%Japan 3.00%South Korea 1.84%Singapore 1.76%Canada 1.20%United Kingdom 0.93%Switzerland 0.77%Other 0.90%
TOTAL INVESTMENTS 100.00%

Clough Global Dividend and Income Fund Statement of Investments October 31, 2017
10 www.cloughglobal.com
Shares Value COMMON STOCKS 66.60% Consumer Discretionary 9.53%
BYD Co., Ltd. ‐ Class H 93,000 $814,796DR Horton, Inc.(a)(b) 51,226 2,264,702Lennar Corp. ‐ Class A(a)(b) 18,100 1,007,627Liberty Broadband Corp. ‐
Class C(a)(b)(c) 23,748 2,072,963Liberty Ventures ‐ Series
A(a)(b)(c) 37,843 2,155,537Man Wah Holdings, Ltd. 368,800 332,806Panasonic Corp. 124,900 1,867,925PulteGroup, Inc.
(a)(b) 65,600 1,983,088Service Corp. International(a)(b) 29,100 1,031,886Sony Corp. 27,700 1,075,064
14,606,394
Consumer Staples 1.09% Japan Tobacco, Inc. 50,700 1,670,752
Energy 0.51% Fairway Energy LP(c)(d)(e)(f)(g) 130,700 773,744
Financials 25.54% Ares Capital Corp.(a) 245,400 3,946,032Bank of America Corp.(a)(b) 196,291 5,376,411Blackstone Mortgage Trust,
Inc. ‐ Class A(a) 100,300 3,192,549
Citigroup, Inc.(a)(b) 71,930 5,286,855Community Healthcare Trust,
Inc.(a) 108,100 2,965,183
Franklin Resources, Inc.(a)(b) 15,100 636,163Global Medical REIT, Inc.
(a) 77,000 651,420Golub Capital BDC, Inc.(a) 89,700 1,700,712JPMorgan Chase & Co.(a)(b) 39,000 3,923,790Ladder Capital Corp.
(a) 55,518 746,162PennyMac Mortgage
Investment Trust(a) 78,114 1,254,511
Ping An Insurance Group Co. of China, Ltd. ‐ Class H 310,000 2,721,947
Solar Capital, Ltd.(a) 82,500 1,749,825Starwood Property Trust, Inc.(a) 196,800 4,233,168TPG Specialty Lending, Inc.
(a) 37,000 756,280
39,141,008
Health Care 3.66% Bristol‐Myers Squibb Co.(a)(b) 21,187 1,306,390Pfizer, Inc.(a)(b) 122,900 4,308,874
5,615,264
Information Technology 25.72% Apple, Inc.(a)(b) 69,760 11,792,230Broadcom, Ltd.(a)(b) 14,945 3,944,135
Shares Value Information Technology (continued)
Cognizant Technology Solutions Corp. ‐ Class A(a)(b) 21,100 $1,596,637
Cypress Semiconductor Corp.(a) 76,700 1,216,462Hon Hai Precision Industry Co.,
Ltd. 259,000 961,820Lam Research Corp.
(a)(b) 33,050 6,893,238Microsoft Corp.(a)(b) 70,200 5,839,236Nintendo Co., Ltd. 1,800 693,373Samsung Electronics Co., Ltd. 1,830 4,498,434Ulvac, Inc. 16,300 1,145,394ViaSat, Inc.(a)(b)(c) 12,749 829,960
39,410,919
Materials 0.55%Chr Hansen Holding A/S 9,622 841,967
TOTAL COMMON STOCKS (Cost $85,890,220) 102,060,048
PARTICIPATION NOTES 1.97% Consumer Discretionary 1.44%
Midea Group Co., Ltd. ‐ Class A (Loan Participation Notes issued by Morgan Stanley Asia Products), expiring 05/13/2019
(d) 285,700 2,198,554
Consumer Staples 0.53%Kweichow Moutai Co., Ltd. ‐
Class A (Loan Participation Notes issued by Morgan Stanley Asia Products), expiring 11/09/2017
(d) 8,717 812,893
TOTAL PARTICIPATION NOTES (Cost $1,947,328) 3,011,447
PREFERRED STOCKS 3.38% Annaly Capital Management, Inc.
Series E, 7.625%(a) 47,542 1,207,091Ares Management LP
Series A, 7.000%(a) 35,000 938,700
First Republic Bank Series D, 5.500% 35,000 884,450
Global Medical REIT, Inc. Series A, 7.500% 10,900 272,827
MTGE Investment Corp. Series A, 8.125%
(a) 10,640 278,130

Clough Global Dividend and Income Fund Statement of Investments October 31, 2017
Annual Report | October 31, 2017 11
Shares Value Materials (continued) PREFERRED STOCKS (continued)
PennyMac Mortgage Investment Trust Series A, 3M US L +
5.831%(a)(h) 22,000 $557,920
Series B, 3M US L + 5.99%
(a)(h) 10,000 254,000Two Harbors Investment Corp.
Series A, 3M US L + 5.66%(a)(h) 28,500 791,160
5,184,278
TOTAL PREFERRED STOCKS (Cost $4,951,530) 5,184,278
Description and Principal Maturity Date Amount Value CORPORATE BONDS 26.48% Bank of America Corp.
10/21/2022, 2.503%(a)(b) $2,000,000 1,980,321
Berkshire Hathaway Energy Co. 11/15/2018, 2.000%(a) 1,000,000 1,002,613
BMW US Capital LLC 09/15/2021, 1.850% 500,000 490,47409/15/2021, 1.850%
(a)(b)(d) 1,000,000 980,799BP Capital Markets PLC
05/10/2019, 2.237%(a) 1,000,000 1,006,972
Citigroup, Inc. 04/25/2022, 2.750%
(a) 1,000,000 1,004,022Citizens Bank National Association
03/14/2019, 2.500%(a) 1,000,000 1,006,621
05/13/2021, 2.550%(a)(b) 2,000,000 2,009,604Dr Pepper Snapple Group, Inc.
11/15/2021, 2.530%(a) 965,000 972,014
EMC Corp. 06/01/2020, 2.650%
(a) 1,000,000 988,444First Republic Bank
06/17/2019, 2.375%(a) 1,000,000 1,004,015Ford Motor Credit Co. LLC
03/12/2019, 2.375%(a)(b) 1,000,000 1,003,954
03/18/2021, 3.336%(a)(b) 1,000,000 1,027,372General Motors Financial Co., Inc.
04/10/2018, 2.400%(a) 1,000,000 1,002,371
Goldman Sachs Group, Inc. 04/25/2019, 2.000%(a)(b) 1,000,000 999,67709/15/2020, 2.750%
(a)(b) 1,000,000 1,011,21711/15/2021, 2.350% 1,000,000 990,849
Hercules Capital, Inc. 10/23/2022, 4.625% 1,000,000 1,004,295
Jackson National Life Global Funding 04/29/2021, 2.250%(a)(d) 1,000,000 996,616
Jersey Central Power & Light Co. 06/15/2018, 4.800%
(a) 1,000,000 1,016,036
Description and Principal Maturity Date Amount Value CORPORATE BONDS (continued) JPMorgan Chase & Co.
06/07/2021, 2.400%(a)(b) $1,000,000 $1,002,06809/23/2022, 3.250%(a) 1,000,000 1,029,656
Manufacturers & Traders Trust Co. 02/06/2020, 2.100%(a) 1,000,000 1,001,49305/18/2022, 2.500%
(a) 1,000,000 1,001,701Morgan Stanley
05/19/2022, 2.750%(a)(b) 2,000,000 2,004,986New York Life Global Funding
01/17/2024, 2.900%(a)(d) 1,000,000 1,009,751ONE Gas, Inc.
02/01/2019, 2.070%(a)(b) 1,114,000 1,117,568
Philip Morris International, Inc. 08/22/2022, 2.500%(a) 750,000 749,861
PNC Bank National Association 11/05/2020, 2.450%
(a)(b) 1,650,000 1,664,388Royal Bank of Canada
02/05/2020, 1.875%(a) 1,000,000 997,657
Sempra Energy 10/07/2019, 1.625%
(a)(b) 1,000,000 993,255Tencent Holdings, Ltd.
05/02/2019, 3.375%(a) 1,000,000 1,017,934
Voya Financial, Inc. 02/15/2018, 2.900%(a) 457,000 458,302
Wells Fargo & Co. 07/22/2022, 2.625%
(a)(b) 2,000,000 1,997,960Welltower, Inc.
04/01/2019, 4.125%(a) 1,000,000 1,026,056
Xcel Energy, Inc. 03/15/2021, 2.400%(a)(b) 2,000,000 2,008,335
TOTAL CORPORATE BONDS
(Cost $40,613,406) 40,579,257
ASSET/MORTGAGE BACKED SECURITIES 11.57%Federal Home Loan Mortgage Corp.
‐ REMICS Series 2017‐4707, Class AD,
07/15/2047, 2.500% 989,544 977,806Federal National Mortgage
Association ‐ REMICS Series 2017‐16, Class NA,
03/25/2047, 3.000% 902,729 902,962Series 2017‐60, Class C,
08/25/2047, 3.500% 914,350 914,230Government National Mortgage
Association ‐ REMICS Series 2014‐67, Class AE,
05/16/2039, 2.150% 1,089,489 1,099,710Series 2012‐83, Class A,
07/16/2041, 1.368% 764,157 737,963Series 2014‐172, Class AC,
09/16/2041, 1.900% 497,011 493,147

Clough Global Dividend and Income Fund Statement of Investments October 31, 2017
12 www.cloughglobal.com
Description and Principal Maturity Date Amount Value ASSET/MORTGAGE BACKED SECURITIES (continued)
Series 2011‐47, Class C, 02/16/2042, 3.844%(h) $531,546 $542,112
Series 2013‐68, Class AC, 02/16/2046, 1.300% 756,480 718,521
Series 2017‐103, Class HG, 01/20/2047, 2.500% 990,812 977,413
Series 2015‐130, Class AB, 08/16/2047, 2.550% 780,978 779,019
Series 2017‐128, Class AB, 03/16/2049, 2.250% 996,928 979,282
Series 2016‐92, Class AB, 04/16/2050, 2.100% 488,190 481,440
Series 2014‐166, Class PJ, 07/16/2051, 2.500% 658,502 656,191
Series 2012‐111, Class A, 09/16/2052, 2.387% 1,024,296 1,019,858
Series 2012‐125, Class AB, 02/16/2053, 2.111%
(h) 662,034 640,103Series 2013‐101, Class AD,
12/16/2053, 2.623%(h) 740,250 737,438
Series 2017‐29, Class A, 01/16/2058, 2.400% 2,478,583 2,431,199
Series 2017‐49, Class AC, 09/16/2058, 2.600%
(a) 2,532,381 2,489,224United States Small Business
Administration Series 2008‐20L, Class 1,
12/01/2028, 6.220% 130,265 143,185
TOTAL ASSET/MORTGAGE BACKED SECURITIES
(Cost $17,960,968) 17,720,803
GOVERNMENT & AGENCY OBLIGATIONS 15.59% U.S. Treasury Bonds
11/15/2026, 6.500%(a) 1,600,000 2,146,562
08/15/2029, 6.125%(a) 1,250,000 1,727,124
05/15/2030, 6.250% 1,000,000 1,412,65602/15/2038, 4.375% 1,000,000 1,265,56605/15/2040, 4.375% 500,000 635,11711/15/2040, 4.250%(a) 3,000,000 3,751,34802/15/2041, 4.750%(a) 2,200,000 2,945,12105/15/2041, 4.375% 1,000,000 1,274,55102/15/2044, 3.625% 1,000,000 1,145,03908/15/2044, 3.125% 1,500,000 1,576,87502/15/2047, 3.000% 1,000,000 1,024,395
U.S. Treasury Notes 10/31/2018, 1.250% 2,500,000 2,494,09209/30/2019, 1.375% 2,500,000 2,489,746
TOTAL GOVERNMENT & AGENCY OBLIGATIONS (Cost $23,960,826) 23,888,192
Description and Principal Maturity Date Amount Value MUNICIPAL BONDS 4.94% Colorado State Housing & Finance
Authority Revenue Bonds, Series A 08/01/2047, 3.000%(a) $1,620,577 $1,620,707
Memphis‐Shelby County, Tennessee Industrial Development Board Revenue Bonds, Series C 11/01/2022, 2.608%
(a) 1,000,000 1,003,320New York City Transitional Finance
Authority Revenue Bonds, Series E‐2 02/01/2026, 3.080%(a)
1,000,000 1,006,350New York State Transportation
Development Corp. Revenue Bonds, Series B 07/01/2024, 3.023%
(a) 1,000,000 969,930New York State Urban
Development Corp. Revenue Bonds, Series B 03/15/2023, 2.670%
(a) 1,000,000 999,270Wisconsin State General Fund
Annual Appropriation Revenue Bonds, Series A 05/01/2022, 1.899%
(a) 1,000,000 988,13005/01/2023, 2.049%(a) 1,000,000 981,030
TOTAL MUNICIPAL BONDS
(Cost $7,582,156) 7,568,737
Shares/Principal
Amount Value SHORT‐TERM INVESTMENTS 11.38% Money Market Fund 3.28%
BlackRock Liquidity Funds, T‐Fund Portfolio ‐ Institutional Class (0.936% 7‐day yield) 5,024,302 5,024,302
U.S. Treasury Bills 8.10%U.S. Treasury Bills
03/08/2018, 0.789%(a)(i) $4,000,000 3,983,42004/26/2018, 1.077%(i) 2,500,000 2,484,90706/21/2018, 1.191%(a)(i) 3,000,000 2,975,10808/16/2018, 1.263%
(i) 3,000,000 2,967,660
12,411,095
TOTAL SHORT‐TERM INVESTMENTS
(Cost $17,437,637) 17,435,397

Clough Global Dividend and Income Fund Statement of Investments October 31, 2017
Annual Report | October 31, 2017 13
Shares/Principal
Amount Value SHORT‐TERM INVESTMENTS (continued) Total Investments ‐ 141.91%
(Cost $200,344,071) $217,448,159
Liabilities in Excess of Other Assets ‐ (41.91%)(j) (64,215,364)
NET ASSETS ‐ 100.00% $153,232,795
SCHEDULE OF SECURITIES SOLD SHORT (c) Shares Value COMMON STOCKS (7.62%) Consumer Discretionary (0.51%)
Viacom, Inc. ‐ Class B (32,700) (785,781)
Financials (2.26%) Ally Financial, Inc. (63,500) (1,659,255)Deutsche Bank AG (45,700) (743,539)Santander Consumer USA
Holdings, Inc. (63,500) (1,056,640)
(3,459,434)
Health Care (1.30%) AmerisourceBergen Corp. (10,800) (831,060)McKesson Corp. (6,500) (896,220)Owens & Minor, Inc. (10,900) (267,813)
(1,995,093)
Information Technology (3.55%) AU Optronics Corp. ‐
Sponsored ADR (76,300) (313,593)Ingenico Group SA (7,823) (759,446)International Business
Machines Corp. (17,690) (2,725,322)LINE Corp. ‐ Sponsored ADR (19,700) (817,747)Manhattan Associates, Inc. (19,600) (820,456)
(5,436,564)
TOTAL COMMON STOCKS (Proceeds $11,309,174) (11,676,872)
EXCHANGE TRADED FUNDS (3.58%) SPDR® S&P® Regional Banking
ETF (80,700) (4,608,777)United States Natural Gas
Fund LP (147,200) (880,256)
SCHEDULE OF SECURITIES SOLD SHORT (c) Shares Value Information Technology (continued) TOTAL EXCHANGE TRADED FUNDS (Proceeds $5,323,900) $(5,489,033)
TOTAL SECURITIES SOLD SHORT
(Proceeds $16,633,074) $(17,165,905)
Investment Abbreviations: 1D FEDEF - Federal Funds Effective Rate (Daily) LIBOR - London Interbank Offered Rate Libor Rates: 3M US L - 3 Month LIBOR as of October 31, 2017 was 1.38%
(a) Pledged security; a portion or all of the security is pledged as collateral for securities sold short or borrowings. As of October 31, 2017, the aggregate value of those securities was $145,879,475, representing 95.20% of net assets. (See Note 1 and Note 6).
(b) Loaned security; a portion or all of the security is on loan as of October 31, 2017.
(c) Non-income producing security. (d) Security exempt from registration of the Securities Act of
1933. These securities may be resold in transactions exempt from registration under Rule 144A, normally to qualified institutional buyers. As of October 31, 2017, these securities had an aggregate value of $6,772,357 or 4.42% of net assets.
(e) Private Placement; these securities may only be resold in transactions exempt from registration under the Securities Act of 1933. As of October 31, 2017, these securities had a total value of $773,744 or 0.50% of net assets and have been deemed illiquid by the Adviser based on procedures approved by the Board of Trustees. (See Note 1).
(f) Fair valued security; valued by management in accordance with procedures approved by the Fund's Board of Trustees. As of October 31, 2017, these securities had an aggregate market value of $773,744 or 0.50% of total net assets.
(g) As a result of the use of significant unobservable inputs to determine fair value, these investments have been classified as Level 3 assets. See also footnote 1 to the financial statements for additional information.
(h) Variable rate investment. Interest rates reset periodically. Interest rate shown reflects the rate in effect at October 31, 2017. For securities based on a published reference rate and spread, the reference rate and spread are indicated in the description above.
(i) Rate shown represents the bond equivalent yield to maturity at date of purchase.
(j) Includes cash which is being held as collateral for total return swap contracts and securities sold short.

Clough Global Dividend and Income Fund Statement of Investments October 31, 2017
14 www.cloughglobal.com
TOTAL RETURN SWAP CONTRACTS
Reference Notional Floating Rate Floating Termination Net Unrealized
Counter Party Entity/Obligation Amount Paid by the Fund Rate Index Date Value Appreciation Credit Suisse Hero MotoCorp, Ltd. $ 443,404
152 bps + 1M LIBOR 1 M LIBOR 12/31/2020 $ 541,663
$ 98,259Morgan Stanley Hero MotoCorp, Ltd. 699,924
225 bps + 1D FEDEF 1 D FEDEF 10/18/2018 814,544
114,620
Credit Suisse Housing Development Finance Corp. 1,305,565
175 bps + 1M LIBOR 1 M LIBOR 12/31/2020 1,768,761
463,196
Morgan Stanley Housing Development Finance Corp. 2,020,030
225 bps + 1D FEDEF 1 D FEDEF 10/18/2018 2,471,715
451,685Credit Suisse Indiabulls Housing Finance 1,073,680
199 bps + 1M LIBOR 1 M LIBOR 12/31/2020 1,661,736
588,056Morgan Stanley ITC, Ltd. 1,200,826
225 bps + 1D FEDEF 1 D FEDEF 10/18/2018 1,268,189
67,363Credit Suisse Larsen & Toubro, Ltd. 1,676,219
155 bps + 1M LIBOR 1 M LIBOR 12/31/2020 2,203,683
527,464Morgan Stanley Larsen & Toubro, Ltd. 568,919
225 bps + 1D FEDEF 1 D FEDEF 10/18/2018 690,415
121,496Morgan Stanley Mahindra & Mahindra, Ltd. 1,393,322
225 bps + 1D FEDEF 1 D FEDEF 10/18/2018 1,512,657
119,335Morgan Stanley United Microelectronics Corp. (487,105)
1D FEDEF ‐ 75 bps 1 D FEDEF 09/24/2019 (475,389)
11,716
$ 9,894,784
$ 12,457,974
$ 2,563,190
See Notes to the Financial Statements.

Clough Global Equity Fund Statement of Investments October 31, 2017
Annual Report | October 31, 2017 15
Shares Value COMMON STOCKS 103.64% Consumer Discretionary 19.18%
Altice USA, Inc. ‐ Class A(a)(b)(c) 60,000 $1,420,800Amazon.com, Inc.(a)(b) 5,174 5,718,719BYD Co., Ltd. ‐ Class H 151,500 1,327,329Carvana Co.(a)(b)(c) 130,600 1,851,908Ctrip.com International, Ltd. ‐
ADR(a)(b) 36,988 1,771,355DR Horton, Inc.(b)(c) 97,921 4,329,088JD.com, Inc. ‐ ADR(a)(b) 70,100 2,630,152Lennar Corp. ‐ Class A
(b)(c) 35,800 1,992,986Liberty Broadband Corp. ‐
Class C(a)(b)(c) 71,066 6,203,351Liberty Ventures ‐ Series
A(a)(b)(c) 119,521 6,807,916Man Wah Holdings, Ltd. 596,800 538,554Panasonic Corp. 203,900 3,049,399PulteGroup, Inc.
(b)(c) 121,500 3,672,945Service Corp. International
(b)(c) 40,900 1,450,314Sony Corp. 44,600 1,730,969TRI Pointe Group, Inc.
(a) 85,500 1,512,495Wayfair, Inc. ‐ Class A
(a)(b) 19,500 1,363,050zooplus AG(a) 10,230 1,696,302
49,067,632
Consumer Staples 1.05% Japan Tobacco, Inc. 81,700 2,692,317
Energy 0.50% Fairway Energy LP(a)(d)(e)(f)(g) 217,600 1,288,192
Financials 28.45% Arbor Realty Trust, Inc.(b) 172,300 1,424,921Ares Capital Corp.(b) 449,000 7,219,920Bank of America Corp.
(b) 331,705 9,085,400Blackstone Mortgage Trust,
Inc. ‐ Class A(b) 238,400 7,588,272
Citigroup, Inc.(b) 120,219 8,836,096
Community Healthcare Trust, Inc. 45,800 1,256,294
Credit Acceptance Corp.(a)(b)(c) 14,062 4,031,997Franklin Resources, Inc.
(b) 24,000 1,011,120Global Medical REIT, Inc.(b) 121,000 1,023,660Golub Capital BDC, Inc.(b) 185,809 3,522,939JPMorgan Chase & Co.
(b)(c) 64,100 6,449,101Ladder Capital Corp.
(b) 164,979 2,217,318PennyMac Mortgage
Investment Trust(b) 167,488 2,689,857
Physicians Realty Trust(b) 136,000 2,363,680Ping An Insurance Group Co. of
China, Ltd. ‐ Class H 374,500 3,288,288Solar Capital, Ltd.(b) 99,100 2,101,911Starwood Property Trust, Inc.
(b) 356,900 7,676,919
Shares Value Financials (continued)
TPG Specialty Lending, Inc.(b) 49,500 $1,011,780
72,799,473
Health Care 14.53%Alexion Pharmaceuticals,
Inc.(a)(b)(c) 10,300 1,232,498Align Technology, Inc.
(a)(b)(c) 13,900 3,321,822Apellis
Pharmaceuticals(a)(d)(e)(f)(g) 56,297 308,731Biogen, Inc.(a)(b) 8,110 2,527,563BioMarin Pharmaceutical,
Inc.(a)(b)(c) 11,100 911,199Bioverativ, Inc.
(a)(b) 22,800 1,288,200Boston Scientific Corp.(a)(b)(c) 127,500 3,587,850Bristol‐Myers Squibb Co.(b)(c) 50,216 3,096,319Cardiome Pharma Corp.
(a)(b)(c) 418,200 736,032Celgene Corp.
(a)(b)(c) 11,400 1,151,058Clovis Oncology, Inc.(a) 10,500 791,385CRISPR Therapeutics AG(a) 132,467 2,556,613Express Scripts Holding Co.
(a)(b) 52,200 3,199,338Galapagos NV ‐ Sponsored
ADR(a)(b) 17,200 1,676,656GW Pharmaceuticals PLC ‐
ADR(a)(b)(c) 14,100 1,522,095
Hologic, Inc.(a)(b)(c) 31,800 1,203,630Intra‐Cellular Therapies,
Inc.(a)(b) 95,800 1,493,522
Pfizer, Inc.(b)(c) 81,600 2,860,896Sienna Biopharmaceuticals ‐
Series B(a)(d)(e)(f) 76,575 1,465,852
Sienna Biopharmaceuticals, Inc.
(a) 52,400 1,027,040Vertex Pharmaceuticals,
Inc.(a)(b)(c) 8,250 1,206,397
37,164,696
Information Technology 34.33% Alibaba Group Holding, Ltd. ‐
Sponsored ADR(a)(b)(c) 33,020 6,105,068ams AG 25,050 2,283,664Apple, Inc.
(b) 107,880 18,236,035Baidu, Inc. ‐ Sponsored
ADR(a)(b)(c) 4,450 1,085,533Baozun, Inc. ‐ Sponsored
ADR(a)(b)(c) 56,900 1,786,091
Broadcom, Ltd.(b)(c) 33,462 8,830,957
Cognizant Technology Solutions Corp. ‐ Class A(b)(c) 44,400 3,359,748
Cypress Semiconductor Corp.(b) 125,600 1,992,016
Facebook, Inc. ‐ Class A(a)(b)(c) 13,600 2,448,816Hon Hai Precision Industry Co.,
Ltd. 282,000 1,047,232Lam Research Corp.
(b)(c) 41,620 8,680,683

Clough Global Equity Fund Statement of Investments October 31, 2017
16 www.cloughglobal.com
Shares Value Information Technology (continued)
LogMeIn, Inc.(b)(c) 23,710 $2,870,096Micron Technology, Inc.
(a)(b) 56,300 2,494,653
Microsemi Corp.(a)(b)(c) 37,800 2,017,386Microsoft Corp.(b) 78,000 6,488,040Nintendo Co., Ltd. 5,700 2,195,682Salesforce.com, Inc.(a)(b) 28,600 2,926,924Samsung Electronics Co., Ltd. 2,566 6,307,640Ulvac, Inc. 24,400 1,714,577ViaSat, Inc.
(a)(b)(c) 45,042 2,932,234Yelp, Inc.(a)(b)(c) 43,700 2,041,664
87,844,739
Materials 0.54% Chr Hansen Holding A/S 15,704 1,374,169
Utilities 5.06% Dominion Energy, Inc.(b)(c) 64,000 5,192,960Eversource Energy
(b)(c) 82,900 5,192,856National Grid PLC ‐ Sponsored
ADR(b)(c) 41,983 2,563,062
12,948,878
TOTAL COMMON STOCKS (Cost $230,400,860) 265,180,096
CLOSED‐END FUNDS 1.64% Altaba, Inc.(a)(b)(c) 59,900 4,200,188
TOTAL CLOSED‐END FUNDS (Cost $3,985,874) 4,200,188
PARTICIPATION NOTES 1.92% Consumer Discretionary 1.39%
Midea Group Co., Ltd. ‐ Class A (Loan Participation Notes issued by Morgan Stanley Asia Products), expiring 05/13/2019
(d) 462,100 3,556,010
Consumer Staples 0.53% Kweichow Moutai Co., Ltd. ‐
Class A (Loan Participation Notes issued by Morgan Stanley Asia Products), expiring 11/09/2017(d) 14,542 1,356,096
TOTAL PARTICIPATION NOTES (Cost $3,164,289) 4,912,106
Shares Value Utilities (continued)PREFERRED STOCKS 3.28%
Annaly Capital Management, Inc. Series E, 7.625%
(b) 144,431 $3,667,103Ares Management LP
Series A, 7.000%(b) 71,000 1,904,220
Global Medical REIT, Inc. Series A, 7.500% 17,700 443,031
PennyMac Mortgage Investment Trust Series A, 3M US L +
5.831%(h) 28,000 710,080Series B, 3M US L +
5.99%(h) 10,000 254,000
Two Harbors Investment Corp. Series A, 3M US L +
5.66%(h) 51,000 1,415,760
8,394,194
TOTAL PREFERRED STOCKS (Cost $7,918,280) 8,394,194
Description and Principal Maturity Date Amount Value ASSET/MORTGAGE BACKED SECURITIES 0.35%Government National Mortgage
Association ‐ REMICS Series 2011‐142, Class A,
10/16/2040, 2.337%(b) 901,237 902,330
TOTAL ASSET/MORTGAGE BACKED SECURITIES
(Cost $915,109) 902,330
GOVERNMENT & AGENCY OBLIGATIONS 7.82%U.S. Treasury Bonds
02/15/2018, 3.500%(b) 4,000,000 4,026,307
11/15/2026, 6.500%(b) 1,600,000 2,146,562
08/15/2029, 6.125%(b) 4,500,000 6,217,646
08/15/2044, 3.125% 2,500,000 2,628,125U.S. Treasury Notes
10/31/2018, 1.250% 2,500,000 2,494,09209/30/2019, 1.375% 2,500,000 2,489,746
TOTAL GOVERNMENT & AGENCY OBLIGATIONS (Cost $20,346,301) 20,002,478

Clough Global Equity Fund Statement of Investments October 31, 2017
Annual Report | October 31, 2017 17
Shares/Principal
Amount Value SHORT‐TERM INVESTMENTS 19.46% Money Market Fund 16.16%
BlackRock Liquidity Funds, T‐Fund Portfolio ‐ Institutional Class (0.936% 7‐day yield) 41,357,206 $41,357,206
U.S. Treasury Bills 3.30% U.S. Treasury Bills
04/26/2018, 1.077%(i) $2,500,000 2,484,90706/21/2018, 1.191%(i) 3,000,000 2,975,10808/16/2018, 1.263%
(i) 3,000,000 2,967,660
8,427,675
TOTAL SHORT‐TERM INVESTMENTS
(Cost $49,786,486) 49,784,881
Total Investments ‐ 138.11%
(Cost $316,517,199) 353,376,273
Liabilities in Excess of Other Assets ‐ (38.11%)(j) (97,506,450)
NET ASSETS ‐ 100.00% $255,869,823
SCHEDULE OF SECURITIES SOLD SHORT (a) Shares Value COMMON STOCKS (8.31%) Consumer Discretionary (0.49%)
Viacom, Inc. ‐ Class B (52,800) (1,268,784)
Consumer Staples (0.80%) Walgreens Boots Alliance, Inc. (30,800) (2,041,116)
Financials (2.20%) Ally Financial, Inc. (103,700) (2,709,681)Deutsche Bank AG (73,400) (1,194,218)Santander Consumer USA
Holdings, Inc. (103,500) (1,722,240)
(5,626,139)
Health Care (1.27%) AmerisourceBergen Corp. (17,600) (1,354,321)McKesson Corp. (10,600) (1,461,528)Owens & Minor, Inc. (17,600) (432,432)
(3,248,281)
Information Technology (3.55%) AU Optronics Corp. ‐
Sponsored ADR (174,600) (717,606)Ingenico Group SA (12,722) (1,235,034)
SCHEDULE OF SECURITIES SOLD SHORT (a) (continued) Shares Value Information Technology (continued)
International Business Machines Corp. (28,770) $(4,432,306)
LINE Corp. ‐ Sponsored ADR (32,300) (1,340,773)Manhattan Associates, Inc. (32,200) (1,347,892)
(9,073,611)
TOTAL COMMON STOCKS (Proceeds $20,973,108) (21,257,931)
EXCHANGE TRADED FUNDS (3.47%) SPDR® S&P® Regional Banking
ETF (130,700) (7,464,277)United States Natural Gas
Fund LP (234,800) (1,404,104)
TOTAL EXCHANGE TRADED FUNDS (Proceeds $8,593,821) (8,868,381)
TOTAL SECURITIES SOLD SHORT
(Proceeds $29,566,929) $(30,126,312)
Investment Abbreviations: 1D FEDEF - Federal Funds Effective Rate (Daily) LIBOR - London Interbank Offered Rate Libor Rates: 3M US L - 3 Month LIBOR as of October 31, 2017 was 1.38%
(a) Non-income producing security. (b) Pledged security; a portion or all of the security is pledged as
collateral for securities sold short or borrowings. As of October 31, 2017, the aggregate value of those securities was $230,979,376, representing 90.27% of net assets. (See Note 1 and Note 6).
(c) Loaned security; a portion or all of the security is on loan as of October 31, 2017.
(d) Security exempt from registration of the Securities Act of 1933. These securities may be resold in transactions exempt from registration under Rule 144A, normally to qualified institutional buyers. As of October 31, 2017, these securities had an aggregate value of $7,974,881 or 3.12% of net assets.
(e) Private Placement; these securities may only be resold in transactions exempt from registration under the Securities Act of 1933. As of October 31, 2017, these securities had a total value of $3,062,775 or 1.20% of net assets and have been deemed illiquid by the Adviser based on procedures approved by the Board of Trustees. (See Note 1).
(f) Fair valued security; valued by management in accordance with procedures approved by the Fund's Board of Trustees. As of October 31, 2017, these securities had an aggregate market value of $3,062,775 or 1.20% of total net assets.

Clough Global Equity Fund Statement of Investments October 31, 2017
18 www.cloughglobal.com
(g) As a result of the use of significant unobservable inputs todetermine fair value, these investments have been classified asLevel 3 assets. See also footnote 1 to the financial statements foradditional information.
(h) Variable rate investment. Interest rates reset periodically.Interest rate shown reflects the rate in effect at October 31,2017. For securities based on a published reference rate andspread, the reference rate and spread are indicated in thedescription above.
(i) Rate shown represents the bond equivalent yield to maturity atdate of purchase.
(j) Includes cash which is being held as collateral for total returnswap contracts and securities sold short.
TOTAL RETURN SWAP CONTRACTS
Reference Notional Floating Rate Floating Termination Net Unrealized
Counter Party Entity/Obligation Amount Paid by the Fund Rate Index Date Value Appreciation Credit Suisse Hero MotoCorp, Ltd. $ 2,348,400
152 bps + 1M LIBOR 1 M LIBOR 12/31/2020 $ 2,910,699
$ 562,299Morgan Stanley Hero MotoCorp, Ltd. 1,115,874
225 bps + 1D FEDEF 1 D FEDEF 10/18/2018 1,298,611
182,737
Credit Suisse Housing Development Finance Corp. 2,001,128
175 bps + 1M LIBOR 1 M LIBOR 12/31/2020 2,711,094
709,966
Morgan Stanley Housing Development Finance Corp. 3,254,548
225 bps + 1D FEDEF 1 D FEDEF 10/18/2018 3,982,276
727,728Credit Suisse Indiabulls Housing Finance 1,607,556
199 bps + 1M LIBOR 1 M LIBOR 12/31/2020 2,487,629
880,073Morgan Stanley ITC, Ltd. 1,925,274
225 bps + 1D FEDEF 1 D FEDEF 10/18/2018 2,032,526
107,252Credit Suisse Larsen & Toubro, Ltd. 2,608,606
155 bps + 1M LIBOR 1 M LIBOR 12/31/2020 3,431,998
823,392Morgan Stanley Larsen & Toubro, Ltd. 906,980
225 bps + 1D FEDEF 1 D FEDEF 10/18/2018 1,100,672
193,692Morgan Stanley Mahindra & Mahindra, Ltd. 1,956,526
225 bps + 1D FEDEF 1 D FEDEF 10/18/2018 2,107,519
150,993Morgan Stanley United Microelectronics Corp. (796,219)
1D FEDEF ‐ 75 bps 1 D FEDEF 09/24/2019 (777,069)
19,150
$ 16,928,673
$ 21,285,955
$ 4,357,282
Reference Notional Floating Rate Floating Termination Net Unrealized
Counter Party Entity/Obligation Amount Paid by the Fund Rate Index Date Value Depreciation Credit Suisse Mahindra & Mahindra, Ltd. $ 1,374,538
125 bps + 1M LIBOR 1 M LIBOR 12/31/2020 $ 1,320,482
$ (54,056)
$ 1,374,538
$ 1,320,482
$ (54,056)
$ 18,303,211
$ 22,606,437
$ 4,303,226
See Notes to the Financial Statements.

Clough Global Opportunities Fund Statement of Investments October 31, 2017
Annual Report | October 31, 2017 19
Shares Value COMMON STOCKS 84.11% Consumer Discretionary 15.67%
Amazon.com, Inc.(a)(b)(c) 12,961 $14,325,534BYD Co., Ltd. ‐ Class H 377,000 3,302,990Ctrip.com International, Ltd. ‐
ADR(a)(b)(c) 92,531 4,431,310DR Horton, Inc.(b)(c) 217,601 9,620,140JD.com, Inc. ‐ ADR(a)(b) 176,600 6,626,032Lennar Corp. ‐ Class A(b)(c) 78,600 4,375,662Liberty Broadband Corp. ‐
Class C(a)(b)(c) 168,367 14,696,755
Liberty Ventures ‐ Series A(a)(b)(c) 272,862 15,542,220
Man Wah Holdings, Ltd. 1,474,000 1,330,141Panasonic Corp. 507,700 7,592,840PulteGroup, Inc.
(b)(c) 266,900 8,068,387Sony Corp. 113,000 4,385,638Wayfair, Inc. ‐ Class A(a)(b)(c) 48,400 3,383,160
97,680,809
Consumer Staples 1.07% Japan Tobacco, Inc. 203,100 6,692,896
Energy 0.51% Fairway Energy LP(a)(d)(e)(f)(g) 536,000 3,173,120
Financials 23.66% Ares Capital Corp.(b) 880,000 14,150,400Bank of America Corp.
(b) 801,710 21,958,837Blackstone Mortgage Trust,
Inc. ‐ Class A(b) 406,700 12,945,261Citigroup, Inc.
(b)(c) 293,527 21,574,234Credit Acceptance Corp.(a)(b)(c) 35,012 10,038,991Franklin Resources, Inc.(b)(c) 59,800 2,519,374Global Medical REIT, Inc.
(b) 310,000 2,622,600Golub Capital BDC, Inc.
(b) 313,957 5,952,625
JPMorgan Chase & Co.(b)(c) 159,200 16,017,112Ladder Capital Corp.
(b) 230,242 3,094,452PennyMac Mortgage
Investment Trust(b) 322,414 5,177,969Ping An Insurance Group Co.
of China, Ltd. ‐ Class H 939,500 8,249,257Solar Capital, Ltd.
(b) 224,331 4,758,060Starwood Property Trust,
Inc.(b) 801,786 17,246,417TPG Specialty Lending, Inc. 57,539 1,176,097
147,481,686
Health Care 12.11% Alexion Pharmaceuticals,
Inc.(a)(b)(c) 25,850 3,093,211Align Technology, Inc.(a)(b)(c) 35,280 8,431,214Apellis
Pharmaceuticals(a)(d)(e)(f)(g) 139,701 766,117
Shares Value Health Care (continued)
Biogen, Inc.(a)(b)(c) 12,150 $3,786,669BioMarin Pharmaceutical,
Inc.(a)(b)(c) 13,700 1,124,633Bioverativ, Inc.(a)(b)(c) 56,600 3,197,900Boston Scientific Corp.(a)(b)(c) 129,900 3,655,386Bristol‐Myers Squibb Co.(b)(c) 80,400 4,957,464Cardiome Pharma Corp.
(a)(b) 1,042,181 1,834,239Celgene Corp.(a)(b)(c) 28,500 2,877,645Clovis Oncology, Inc.(a)(b)(c) 26,100 1,967,157CRISPR Therapeutics AG(a)(b) 338,610 6,535,173Express Scripts Holding Co.(a)(b) 129,800 7,955,442GW Pharmaceuticals PLC ‐
ADR(a)(b)(c) 35,100 3,789,045Hologic, Inc.(a)(b)(c) 80,600 3,050,710Intra‐Cellular Therapies,
Inc.(a)(b) 240,400 3,747,836Pfizer, Inc.
(b) 157,200 5,511,432Sienna Biopharmaceuticals ‐
Series B(a)(d)(e)(f) 190,624 3,649,058Sienna Biopharmaceuticals,
Inc.(a)(b) 128,600 2,520,560
Vertex Pharmaceuticals, Inc.
(a)(b)(c) 20,650 3,019,650
75,470,541
Information Technology 30.54% Alibaba Group Holding, Ltd. ‐
Sponsored ADR(a)(b)(c) 69,610 12,870,193ams AG 62,154 5,666,222Apple, Inc.
(b)(c) 268,190 45,334,838Baidu, Inc. ‐ Sponsored
ADR(a)(b)(c) 8,450 2,061,293
Broadcom, Ltd.(b)(c) 56,654 14,951,557Cognizant Technology
Solutions Corp. ‐ Class A(b)(c) 124,800 9,443,616
Cypress Semiconductor Corp.(b) 312,500 4,956,250
Facebook, Inc. ‐ Class A(a)(b)(c) 33,730 6,073,424
Hon Hai Precision Industry Co., Ltd. 701,000 2,603,226
Lam Research Corp.(b)(c) 103,670 21,622,452Micron Technology, Inc.
(a)(b)(c) 139,900 6,198,969Microsoft Corp.(b)(c) 153,900 12,801,402Nintendo Co., Ltd. 14,800 5,701,069Salesforce.com, Inc.
(a)(b)(c) 79,300 8,115,562Samsung Electronics Co., Ltd. 6,361 15,636,358Ulvac, Inc. 62,700 4,405,901ViaSat, Inc.(a)(b)(c) 105,835 6,889,858Yelp, Inc.
(a)(b)(c) 108,500 5,069,120
190,401,310

Clough Global Opportunities Fund Statement of Investments October 31, 2017
20 www.cloughglobal.com
Shares Value Materials 0.55%
Chr Hansen Holding A/S 39,001 $3,412,759
TOTAL COMMON STOCKS (Cost $449,251,435) 524,313,121
CLOSED‐END FUNDS 1.68% Altaba, Inc.(a)(b) 149,100 10,454,892
TOTAL CLOSED‐END FUNDS (Cost $9,921,545) 10,454,892
PARTICIPATION NOTES 1.97% Consumer Discretionary 1.43%
Midea Group Co., Ltd. ‐ Class A (Loan Participation Notes issued by Morgan Stanley Asia Products), expiring 05/13/2019
(d) 1,163,600 8,954,280
Consumer Staples 0.54% Kweichow Moutai Co., Ltd. ‐
Class A (Loan Participation Notes issued by Morgan Stanley Asia Products), expiring 11/09/2017
(d) 36,007 3,357,789
TOTAL PARTICIPATION NOTES (Cost $7,958,745) 12,312,069
PREFERRED STOCKS 1.58% Annaly Capital Management, Inc.
Series E, 7.625%(b) 162,911 4,136,310
Ares Management LP Series A, 7.000%
(b) 147,000 3,942,540PennyMac Mortgage Investment Trust
Series B, 3M US L + 5.99%(b)(h) 70,000 1,778,000
9,856,850
TOTAL PREFERRED STOCKS (Cost $9,364,164) 9,856,850
Description and Principal Maturity Date Amount Value CORPORATE BONDS 18.45% Bank of America Corp.
10/21/2022, 2.503%(b) $5,000,000 4,950,801
Biogen, Inc. 09/15/2020, 2.900% 20,000 20,429
Description and Principal Maturity Date Amount Value CORPORATE BONDS (continued) BMW US Capital LLC
09/15/2021, 1.850% $3,890,000 $3,815,892Citigroup, Inc.
04/25/2022, 2.750%(b) 8,000,000 8,032,180Citizens Bank National Association
12/04/2019, 2.450%(b) 2,802,000 2,820,343
05/13/2021, 2.550%(b) 4,910,000 4,933,578EMC Corp.
06/01/2020, 2.650%(b) 3,000,000 2,965,333Exelon Corp.
12/01/2020, 5.150%(b) 2,900,000 3,119,498First Republic Bank
06/17/2019, 2.375%(b) 3,000,000 3,012,044
Ford Motor Credit Co. LLC 03/18/2021, 3.336%
(b)(c) 6,000,000 6,164,231General Motors Financial Co., Inc.
07/06/2021, 3.200%(b) 5,000,000 5,105,418
Goldman Sachs Group, Inc. 09/15/2020, 2.750%
(b)(c) 4,000,000 4,044,86911/15/2021, 2.350%(b) 4,500,000 4,458,821
Hercules Capital, Inc. 10/23/2022, 4.625% 3,000,000 3,012,885
Jackson National Life Global Funding 04/29/2021, 2.250%
(b)(d) 4,160,000 4,145,921JPMorgan Chase & Co.
06/07/2021, 2.400%(b)(c) 4,000,000 4,008,27009/23/2022, 3.250%
(b)(c) 4,000,000 4,118,625Manufacturers & Traders Trust Co.
02/06/2020, 2.100%(b)(c) 4,000,000 4,005,971Morgan Stanley
05/19/2022, 2.750%(b) 5,000,000 5,012,465
New York Life Global Funding 01/17/2024, 2.900%
(b)(d) 4,000,000 4,039,003Philip Morris International, Inc.
08/22/2022, 2.500%(b) 1,600,000 1,599,702
PNC Bank National Association 11/05/2020, 2.450%
(b)(c) 4,000,000 4,034,879Royal Bank of Canada
02/05/2020, 1.875%(b)(c) 5,000,000 4,988,286Tencent Holdings, Ltd.
05/02/2019, 3.375%(b) 4,000,000 4,071,736
Toronto‐Dominion Bank 12/14/2020, 2.500%
(b) 3,332,000 3,367,013Wells Fargo & Co.
07/22/2022, 2.625%(b) 10,000,000 9,989,800Welltower, Inc.
04/01/2019, 4.125%(b) 5,033,000 5,164,142
TOTAL CORPORATE BONDS
(Cost $114,998,812) 115,002,135

Clough Global Opportunities Fund Statement of Investments October 31, 2017
Annual Report | October 31, 2017 21
Description and Principal Maturity Date Amount Value ASSET/MORTGAGE BACKED SECURITIES 8.55% Federal National Mortgage
Association ‐ REMICS Series 2017‐16, Class NA,
03/25/2047, 3.000%(b) $2,708,186 $2,708,885Series 2017‐60, Class C,
08/25/2047, 3.500%(b) 3,657,399 3,656,920
Government National Mortgage Association ‐ REMICS Series 2014‐67, Class AE,
05/16/2039, 2.150%(b) 7,725,464 7,797,945Series 2012‐83, Class A,
07/16/2041, 1.368% 3,820,787 3,689,814Series 2014‐172, Class AC,
09/16/2041, 1.900%(b) 3,976,089 3,945,175Series 2013‐68, Class AC,
02/16/2046, 1.300% 3,290,687 3,125,568Series 2017‐103, Class HG,
01/20/2047, 2.500% 2,261,033 2,230,455Series 2015‐130, Class AB,
08/16/2047, 2.550% 3,123,912 3,116,077Series 2014‐166, Class PJ,
07/16/2051, 2.500% 3,951,014 3,937,144Series 2012‐111, Class A,
09/16/2052, 2.387% 2,042,788 2,033,938Series 2013‐101, Class AD,
12/16/2053, 2.623%(h) 2,961,001 2,949,751
Series 2017‐29, Class A, 01/16/2058, 2.400% 4,461,450 4,376,158
Series 2017‐49, Class AC, 09/16/2058, 2.600%
(b) 9,930,906 9,761,665
TOTAL ASSET/MORTGAGE BACKED SECURITIES (Cost $54,119,011) 53,329,495
GOVERNMENT & AGENCY OBLIGATIONS 14.10% U.S. Treasury Bonds
11/15/2026, 6.500%(b) 6,300,000 8,452,09008/15/2029, 6.125%(b) 6,750,000 9,326,47002/15/2038, 4.375% 4,000,000 5,062,26505/15/2040, 4.375% 4,500,000 5,716,05511/15/2040, 4.250%(b) 12,000,000 15,005,39102/15/2041, 4.750% 8,800,000 11,780,48405/15/2041, 4.375% 4,000,000 5,098,20308/15/2044, 3.125% 6,000,000 6,307,50002/15/2047, 3.000% 5,000,000 5,121,973
U.S. Treasury Notes 10/31/2018, 1.250% 6,000,000 5,985,82002/15/2019, 2.750% 4,000,000 4,062,73409/30/2019, 1.375% 6,000,000 5,975,391
TOTAL GOVERNMENT & AGENCY OBLIGATIONS (Cost $88,453,767) 87,894,376
Description and Principal Maturity Date Amount Value MUNICIPAL BONDS 2.25% New York City Transitional Finance
Authority Revenue Bonds, Series E‐2 02/01/2026, 3.080%(b) $4,000,000 $4,025,400
New York State Transportation Development Corp. Revenue Bonds, Series B 07/01/2024, 3.023%
(b) 3,150,000 3,055,280New York State Urban
Development Corp. Revenue Bonds, Series B 03/15/2023, 2.670%
(b) 3,000,000 2,997,810Wisconsin State General Fund
Annual Appropriation Revenue Bonds, Series A 05/01/2023, 2.049%
(b) 4,000,000 3,924,120
TOTAL MUNICIPAL BONDS
(Cost $14,030,714) 14,002,610
Shares/Principal
Amount Value SHORT‐TERM INVESTMENTS 8.55% Money Market Fund 5.05%
BlackRock Liquidity Funds, T‐Fund Portfolio ‐ Institutional Class (0.936% 7‐day yield) 31,484,148 31,484,148
U.S. Treasury Bills 3.50%U.S. Treasury Bills
04/26/2018, 1.077%(i) $6,000,000 5,963,777
06/21/2018, 1.191%(i) 8,000,000 7,933,62208/16/2018, 1.263%
(i) 8,000,000 7,913,760
21,811,159
TOTAL SHORT‐TERM INVESTMENTS
(Cost $53,299,490) 53,295,307
Total Investments ‐ 141.24%
(Cost $801,397,683) 880,460,855
Liabilities in Excess of Other Assets ‐ (41.24%)(j) (257,100,333)
NET ASSETS ‐ 100.00% $623,360,522

Clough Global Opportunities Fund Statement of Investments October 31, 2017
22 www.cloughglobal.com
SCHEDULE OF SECURITIES SOLD SHORT (a) Shares Value COMMON STOCKS (8.39%) Consumer Discretionary (0.51%)
Viacom, Inc. ‐ Class B (131,500) $(3,159,945)
Consumer Staples (0.81%) Walgreens Boots Alliance, Inc. (76,800) (5,089,536)
Financials (2.24%) Ally Financial, Inc. (256,000) (6,689,280)Deutsche Bank AG (183,000) (2,977,410)Santander Consumer USA
Holdings, Inc. (257,300) (4,281,472)
(13,948,162)
Health Care (1.30%) AmerisourceBergen Corp. (43,700) (3,362,715)McKesson Corp. (26,500) (3,653,820)Owens & Minor, Inc. (43,800) (1,076,166)
(8,092,701)
Information Technology (3.53%) AU Optronics Corp. ‐
Sponsored ADR (305,512) (1,255,654)Ingenico Group SA (31,412) (3,049,434)International Business
Machines Corp. (71,700) (11,046,102)LINE Corp. ‐ Sponsored ADR (79,500) (3,300,045)Manhattan Associates, Inc. (79,700) (3,336,242)
(21,987,477)
TOTAL COMMON STOCKS (Proceeds $51,524,719) (52,277,821)
EXCHANGE TRADED FUNDS (3.58%) SPDR® S&P® Regional Banking
ETF (328,755) (18,775,198)United States Natural Gas
Fund LP (588,000) (3,516,240)
TOTAL EXCHANGE TRADED FUNDS (Proceeds $21,600,146) (22,291,438)
TOTAL SECURITIES SOLD SHORT
(Proceeds $73,124,865) $(74,569,259)
Investment Abbreviations: 1D FEDEF - Federal Funds Effective Rate (Daily) LIBOR - London Interbank Offered Rate Libor Rates: 3M US L - 3 Month LIBOR as of October 31, 2017 was 1.38%
(a) Non-income producing security. (b) Pledged security; a portion or all of the security is pledged as collateral
for securities sold short or borrowings. As of October 31, 2017, the aggregate value of those securities was $622,584,048, representing 99.88% of net assets. (See Note 1 and Note 6).
(c) Loaned security; a portion or all of the security is on loan as of October 31, 2017.
(d) Security exempt from registration of the Securities Act of 1933. These securities may be resold in transactions exempt from registration under Rule 144A, normally to qualified institutional buyers. As of October 31, 2017, these securities had an aggregate value of $28,085,288 or 4.51% of net assets.
(e) Private Placement; these securities may only be resold in transactions exempt from registration under the Securities Act of 1933. As of October 31, 2017, these securities had a total value of $7,588,295 or 1.22% of net assets and have been deemed illiquid by the Adviser based on procedures approved by the Board of Trustees. (See Note 1).
(f) Fair valued security; valued by management in accordance with procedures approved by the Fund's Board of Trustees. As of October 31, 2017, these securities had an aggregate market value of$7,588,295 or 1.22% of total net assets.
(g) As a result of the use of significant unobservable inputs to determine fair value, these investments have been classified as Level 3 assets. See also footnote 1 to the financial statements for additional information.
(h) Variable rate investment. Interest rates reset periodically. Interest rate shown reflects the rate in effect at October 31, 2017. For securities based on a published reference rate and spread, the reference rate and spread are indicated in the description above.
(i) Rate shown represents the bond equivalent yield to maturity at date of purchase.
(j) Includes cash which is being held as collateral for total return swap contracts and securities sold short.

Clough Global Opportunities Fund Statement of Investments October 31, 2017
Annual Report | October 31, 2017 23
TOTAL RETURN SWAP CONTRACTS
Reference Notional Floating Rate Floating Termination Net Unrealized
Counter Party Entity/Obligation Amount Paid by the Fund Rate Index Date Value Appreciation Credit Suisse Hero MotoCorp, Ltd. $ 3,741,915
152 bps + 1M LIBOR 1 M LIBOR 12/31/2020 $ 4,667,877
$ 925,962Morgan Stanley Hero MotoCorp, Ltd. 2,789,428
225 bps + 1D FEDEF 1 D FEDEF 10/18/2018 3,246,228
456,800
Credit Suisse Housing Development Finance Corp. 5,148,051
175 bps + 1M LIBOR 1 M LIBOR 12/31/2020 6,974,503
1,826,452
Morgan Stanley Housing Development Finance Corp. 8,000,581
225 bps + 1D FEDEF 1 D FEDEF 10/18/2018 9,789,537
1,788,956Credit Suisse Indiabulls Housing Finance 4,242,917
199 bps + 1M LIBOR 1 M LIBOR 12/31/2020 6,566,467
2,323,550Morgan Stanley ITC, Ltd. 4,878,884
225 bps + 1D FEDEF 1 D FEDEF 10/18/2018 5,154,821
275,937Credit Suisse Larsen & Toubro, Ltd. 4,420,572
155 bps + 1M LIBOR 1 M LIBOR 12/31/2020 5,890,214
1,469,642Morgan Stanley Larsen & Toubro, Ltd. 2,267,279
225 bps + 1D FEDEF 1 D FEDEF 10/18/2018 2,751,471
484,192Morgan Stanley Mahindra & Mahindra, Ltd. 4,961,257
225 bps + 1D FEDEF 1 D FEDEF 10/18/2018 5,349,136
387,879Morgan Stanley United Microelectronics Corp. (1,977,910)
1D FEDEF ‐ 75 bps 1 D FEDEF 09/24/2019 (1,930,337)
47,573
$ 38,472,974
$ 48,459,917
$ 9,986,943
Reference Notional Floating Rate Floating Termination Net Unrealized
Counter Party Entity/Obligation Amount Paid by the Fund Rate Index Date Value Depreciation Credit Suisse Mahindra & Mahindra, Ltd. $ 3,470,932
125 bps + 1M LIBOR 1 M LIBOR 12/31/2020 $ 3,334,425
$ (136,507)
$ 3,470,932
$ 3,334,425
$ (136,507)
$ 41,943,906
$ 51,794,342
$ 9,850,436
For Fund compliance purposes, each Fund’s sector classifications refer to any one of the sector sub-classifications used by one or more widely recognized market indexes, and/or as defined by each Fund's management. This definition may not apply for purposes of this report, which may combine sector sub-classifications for reporting ease. Sectors are shown as a percent of net assets. These sector classifications are unaudited.
See Notes to the Financial Statements.
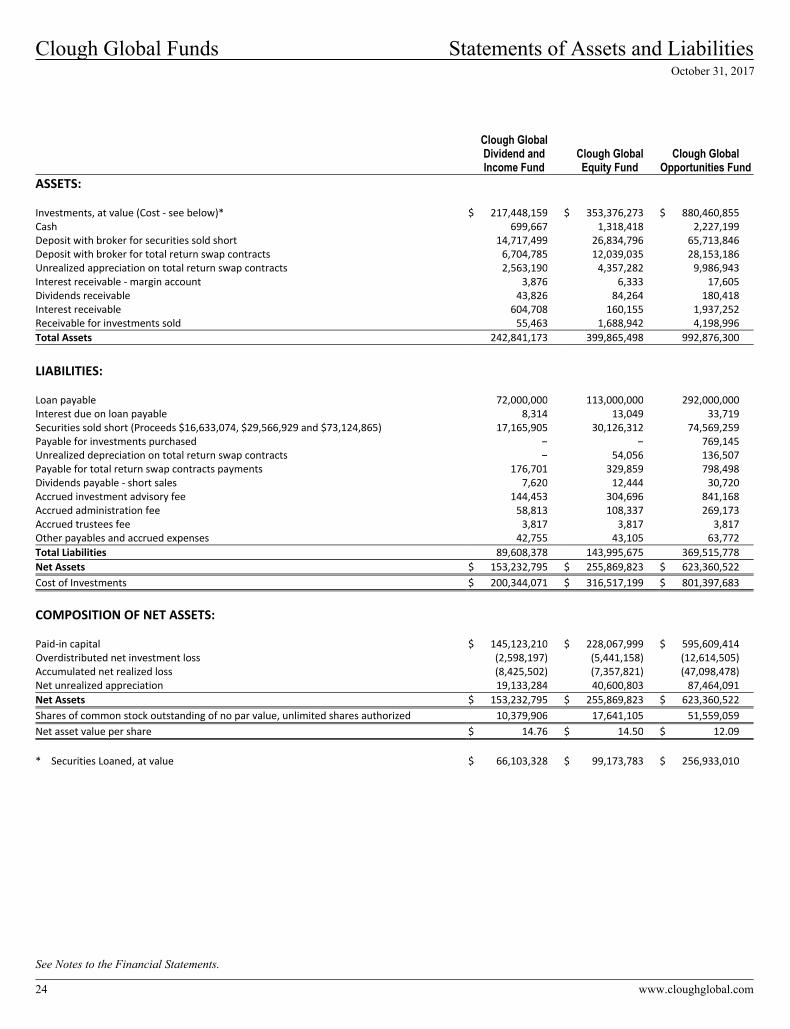
Clough Global Funds Statements of Assets and Liabilities October 31, 2017
See Notes to the Financial Statements.
24 www.cloughglobal.com
Clough Global Dividend and Income Fund
Clough Global Equity Fund
Clough Global Opportunities Fund
ASSETS: Investments, at value (Cost ‐ see below)* $ 217,448,159 $ 353,376,273
$ 880,460,855Cash 699,667 1,318,418
2,227,199Deposit with broker for securities sold short 14,717,499 26,834,796
65,713,846Deposit with broker for total return swap contracts 6,704,785 12,039,035
28,153,186Unrealized appreciation on total return swap contracts 2,563,190 4,357,282
9,986,943Interest receivable ‐ margin account 3,876 6,333
17,605Dividends receivable 43,826 84,264
180,418Interest receivable 604,708 160,155
1,937,252Receivable for investments sold 55,463 1,688,942
4,198,996
Total Assets 242,841,173 399,865,498
992,876,300
LIABILITIES: Loan payable 72,000,000 113,000,000
292,000,000Interest due on loan payable 8,314 13,049
33,719Securities sold short (Proceeds $16,633,074, $29,566,929 and $73,124,865) 17,165,905 30,126,312
74,569,259Payable for investments purchased – –
769,145Unrealized depreciation on total return swap contracts – 54,056
136,507Payable for total return swap contracts payments 176,701 329,859
798,498Dividends payable ‐ short sales 7,620 12,444
30,720Accrued investment advisory fee 144,453 304,696
841,168Accrued administration fee 58,813 108,337
269,173Accrued trustees fee 3,817 3,817
3,817Other payables and accrued expenses 42,755 43,105
63,772
Total Liabilities 89,608,378 143,995,675
369,515,778
Net Assets $ 153,232,795 $ 255,869,823
$ 623,360,522
Cost of Investments $ 200,344,071 $ 316,517,199
$ 801,397,683
COMPOSITION OF NET ASSETS: Paid‐in capital $ 145,123,210 $ 228,067,999
$ 595,609,414Overdistributed net investment loss (2,598,197) (5,441,158)
(12,614,505)Accumulated net realized loss (8,425,502) (7,357,821)
(47,098,478)Net unrealized appreciation 19,133,284 40,600,803
87,464,091
Net Assets $ 153,232,795 $ 255,869,823
$ 623,360,522
Shares of common stock outstanding of no par value, unlimited shares authorized 10,379,906 17,641,105
51,559,059
Net asset value per share $ 14.76 $ 14.50
$ 12.09
* Securities Loaned, at value $ 66,103,328 $ 99,173,783
$ 256,933,010

Clough Global Funds Statements of Operations For the year ended October 31, 2017
See Notes to the Financial Statements.
Annual Report | October 31, 2017 25
Clough Global Dividend and Income Fund
Clough Global Equity Fund
Clough Global Opportunities Fund
INVESTMENT INCOME: Dividends (net of foreign withholding taxes of $33,863, $56,508 and $142,798) $ 3,187,983 $ 6,248,592
$ 9,623,938Interest on investment securities 2,405,118 681,606
8,171,107Interest income ‐ margin account 138 1,527
–Hypothecated securities income (See Note 6) 36,066 221,178
347,528
Total Income 5,629,305 7,152,903
18,142,573
EXPENSES: Investment advisory fee 1,659,447 3,422,539
9,537,029Administration fee 675,424 1,215,122
3,049,831Interest on loan 1,363,538 2,139,979
5,529,799Interest expense ‐ margin account – –
1,181Trustees fee 155,875 155,876
155,876Dividend expense ‐ short sales 41,360 66,472
167,429Legal fees 162,895 162,558
162,674Shareholder Proxy 233,810 271,833
400,187Other expenses 53,614 59,439
96,072
Total Expenses 4,345,963 7,493,818
19,100,078
Net Investment Income/(Loss) 1,283,342 (340,915)
(957,505)
NET REALIZED GAIN/(LOSS) ON: Investment securities 10,682,221 25,593,718
51,920,102Futures contracts 309,922 680,641
1,721,039Securities sold short (3,546,309) (5,944,261)
(14,462,872)Total return swap contracts 126,336 78,786
432,948Foreign currency transactions 17,038 23,520
161,736Long‐term capital gains distributions from other investment companies 227,025 104,461
186,087
Net realized gain 7,816,233 20,536,865
39,959,040
NET CHANGE IN UNREALIZED APPRECIATION/(DEPRECIATION) ON:Investment securities 13,839,791 32,247,525
66,188,761Futures contracts (48,860) (108,006)
(275,159)Securities sold short (1,951,554) (2,977,009)
(7,250,463)Total return swap contracts 2,560,709 4,399,180
10,092,541Translation of assets and liabilities denominated in foreign currencies 5,562 8,782
22,411
Net change in unrealized appreciation 14,405,648 33,570,472
68,778,091
Net realized and unrealized gain 22,221,881 54,107,337
108,737,131
Net Increase in Net Assets Attributable to Common Shares from Operations $ 23,505,223 $ 53,766,422
$ 107,779,626

Clough Global Dividend and Income Fund Statements of Changes in Net Assets
See Notes to the Financial Statements.
26 www.cloughglobal.com
For the Year Ended
October 31, 2017
For the Year Ended
October 31, 2016(1) COMMON SHAREHOLDERS OPERATIONS: Net investment income/(loss) $ 1,283,342 $ (125,061)Net realized gain/(loss) 7,816,233 (14,362,911)Net change in unrealized appreciation/(depreciation) 14,405,648 9,597,736
Net Increase/(Decrease) in Net Assets From Operations 23,505,223 (4,890,236)
DISTRIBUTIONS TO COMMON SHAREHOLDERS: Net investment income (3,908,415) –Net realized gains – (6,159,918)Tax return of capital (9,527,880) (8,281,647)
Net Decrease in Net Assets from Distributions (13,436,295) (14,441,565)
CAPITAL SHARE TRANSACTIONS Repurchase of fund shares (155,239) –
Net Decrease in Net Assets From Share Transactions (155,239) –
Net Increase/(Decrease) in Net Assets Attributable to Common Shares 9,913,689 (19,331,801)
NET ASSETS ATTRIBUABLE TO COMMON SHARES: Beginning of year 143,319,106 162,650,907
End of year* $ 153,232,795 $ 143,319,106
*Includes overdistributed net investment loss of: $ (2,598,197) $ (6,951)
(1) Effective July 31, 2016, the Clough Global Allocation Fund name changed to Clough Global Dividend and Income Fund.

Clough Global Equity Fund Statements of Changes in Net Assets
See Notes to the Financial Statements.
Annual Report | October 31, 2017 27
For the Year Ended
October 31, 2017
For the Year Ended
October 31, 2016 COMMON SHAREHOLDERS OPERATIONS: Net investment loss $ (340,915) $ (4,017,280)Net realized gain/(loss) 20,536,865 (25,483,445)Net change in unrealized appreciation/(depreciation) 33,570,472 10,621,370
Net Increase/(Decrease) in Net Assets From Operations 53,766,422 (18,879,355)
DISTRIBUTIONS TO COMMON SHAREHOLDERS: Net investment income (2,298,935) –Net realized gains – (15,868,789)Tax return of capital (19,645,484) (7,640,117)
Net Decrease in Net Assets from Distributions (21,944,419) (23,508,906)
CAPITAL SHARE TRANSACTIONS Repurchase of fund shares (139,566) –
Net Decrease in Net Assets From Share Transactions (139,566) –
Net Increase/(Decrease) in Net Assets Attributable to Common Shares 31,682,437 (42,388,261)
NET ASSETS ATTRIBUABLE TO COMMON SHARES: Beginning of year 224,187,386 266,575,647
End of year* $ 255,869,823 $ 224,187,386
*Includes overdistributed net investment loss of: $ (5,441,158) $ (2,804,394)

Clough Global Opportunities Fund Statements of Changes in Net Assets
See Notes to the Financial Statements.
28 www.cloughglobal.com
For the Year Ended
October 31, 2017
For the Year Ended
October 31, 2016 COMMON SHAREHOLDERS OPERATIONS: Net investment loss $ (957,505) $ (7,963,225)Net realized gain/(loss) 39,959,040 (79,294,641)Net change in unrealized appreciation/(depreciation) 68,778,091 51,323,517
Net Increase/(Decrease) in Net Assets From Operations 107,779,626 (35,934,349)
DISTRIBUTIONS TO COMMON SHAREHOLDERS: Net investment income (6,976,864) –Net realized gains – (9,287,743)Tax return of capital (48,235,156) (50,435,017)
Net Decrease in Net Assets from Distributions (55,212,020) (59,722,760)
CAPITAL SHARE TRANSACTIONS Repurchase of fund shares (138,330) –
Net Decrease in Net Assets From Share Transactions (138,330) –
Net Increase/(Decrease) in Net Assets Attributable to Common Shares 52,429,276 (95,657,109)
NET ASSETS ATTRIBUABLE TO COMMON SHARES: Beginning of year 570,931,246 666,588,355
End of year* $ 623,360,522 $ 570,931,246
*Includes overdistributed net investment loss of: $ (12,614,505) $ (4,944,987)

Clough Global Funds Statements of Cash Flows For the year ended October 31, 2017
See Notes to the Financial Statements.
Annual Report | October 31, 2017 29
Clough Global Dividend and Income Fund
Clough Global Equity Fund
Clough Global Opportunities Fund
CASH FLOWS FROM OPERATING ACTIVITIES: Net increase in net assets from operations $ 23,505,223 $ 53,766,422
$ 107,779,626Adjustments to reconcile net increase/(decrease) in net assets from operations to net cash
provided by operating activities: Purchase of investment securities (312,587,441) (448,327,492)
(1,386,637,735)Proceeds from disposition of investment securities 331,130,726 472,623,239
1,455,865,926Proceeds from securities sold short transactions 67,057,612 116,171,029
275,818,295Cover securities sold short transactions (87,238,020) (147,953,711)
(352,983,406)Net purchases of short‐term investment securities (14,536,805) (11,315,561)
(43,635,176)Net realized (gain)/loss on:
Investment securities (10,682,221) (25,593,718)
(51,920,102)Securities sold short 3,546,309 5,944,261
14,462,872Long‐term capital gains distributions from other investment companies (227,025) (104,461)
(186,087)Net change in unrealized (appreciation)/depreciation on:
Investment securities (13,839,791) (32,247,525)
(66,188,761)Futures contracts 48,860 108,006
275,159Securities sold short 1,951,554 2,977,009
7,250,463Total return swap contracts (2,560,709) (4,399,180)
(10,092,541)Translation of assets and liabilities denominated in foreign currencies (5,562) (8,782)
(22,411)Net amortization/(accretion) of premiums/discounts 469,143 945,058
1,855,018(Increase)/Decrease in assets:
Deposits with broker for futures contracts 85,500 189,000
481,501Deposits with broker for securities sold short 28,143,777 42,748,622
107,003,512Deposits with brokers for total return swap contracts (2,924,785) (5,109,035)
(12,573,186)Dividends receivable 91,290 96,604
263,211Interest receivable ‐ margin account 361,822 621,625
1,559,207Variation margin receivable 4,275 9,450
24,075Increase/(Decrease) in liabilities:
Interest due on loan payable (7,185) (12,541)
(30,529)Payable for total return swap contracts payments 168,870 309,238
746,336Dividends payable ‐ short sales 7,620 12,444
30,720Interest payable ‐ margin account (9,134) (14,827)
(37,726)Accrued investment advisory fee (23,307) (42,338)
(134,422)Accrued administration fee (9,229) (16,005)
(42,969)Accrued trustees fee 3,817 3,817
3,817Other payables and accrued expenses 42,755 43,105
63,772
Net cash provided by operating activities 11,967,939 21,423,753
48,998,459
CASH FLOWS FROM FINANCING ACTIVITIES: Repurchase of fund shares (155,239) (139,566)
(138,330)Cash distributions paid (13,436,295) (21,944,419)
(55,212,020)
Net cash used in financing activities (13,591,534) (22,083,985)
(55,350,350)
Effect of exchange rates on cash 5,562 8,782
22,411
Net Change in Cash and Foreign Rates on Cash and Foreign Currency (1,618,033) (651,450)
(6,329,480)
Cash and foreign currency, beginning of year $ 2,317,700 $ 1,969,868
$ 8,556,679
Cash and foreign currency, end of year $ 699,667 $ 1,318,418
$ 2,227,199
SUPPLEMENTAL DISCLOSURE OF CASH FLOW INFORMATION:Cash paid during the year for interest from loan payable: $ 1,370,723 $ 2,152,520
$ 5,560,328

Clough Global Dividend and Income Fund Financial Highlights For a share outstanding throughout the period/years indicated
See Notes to the Financial Statements.
30 www.cloughglobal.com
For the Year Ended
October 31, 2017
For the Year Ended
October 31, 2016(1)
For the Year Ended
October 31, 2015
For the Period Ended
October 31, 2014(2)
For the Year Ended
March 31, 2014
For the Year Ended
March 31, 2013
PER COMMON SHARE OPERATING PERFORMANCE:Net asset value ‐ beginning of period $13.79 $15.65 $16.96 $17.51 $17.38 $16.30
Income from investment operations: Net investment income/(loss)* 0.12 (0.01) (0.27) (0.12) (0.26) (0.01)Net realized and unrealized
gain/(loss) on investments 2.14 (0.46) 0.38 0.31 1.90 2.29
Total Income/(Loss) from Investment Operations 2.26 (0.47) 0.11 0.19 1.64 2.28
DISTRIBUTIONS TO COMMON SHAREHOLDERS FROM:Net investment income (0.37) – (0.07) (0.14) (0.24) (0.90)Net realized gains – (0.59) (1.34) (0.60) (1.27) (0.30)Tax return of capital (0.92) (0.80) – – – –
Total Distributions to Common Shareholders (1.29) (1.39) (1.41) (0.74) (1.51) (1.20)
CAPITAL SHARE TRANSACTIONS: Dilutive impact of capital share
transactions* (0.00)(3) – (0.01) – – –
Total Capital Share Transactions (0.00)(3) – (0.01) – – –
Net asset value ‐ end of period $14.76 $13.79 $15.65 $16.96 $17.51 $17.38
Market price ‐ end of period $14.16 $11.62 $13.60 $14.60 $15.18 $15.07
Total Investment Return ‐ Net Asset Value:(4) 17.89% (1.14)% 1.61% 1.68% 11.14% 16.19%
Total Investment Return ‐ Market Price:(4) 34.22% (4.14)% 2.57% 0.97% 11.12% 17.81%
RATIOS AND SUPPLEMENTAL DATA: Net assets attributable to common
shares, end of period (000s) $153,233 $143,319 $162,651 $176,968 $182,737 $181,309Ratios to average net assets attributable
to common shareholders: Total expenses 2.94% 3.65% 3.95% 3.25%(5) 3.34% 3.24%Total expenses excluding interest
expense and dividends on short sales expense 1.99% 2.09% 2.17% 2.00%(5) 1.94% 1.93%
Net investment income/(loss) 0.87% (0.08)% (1.58)% (1.15)%(5) (1.47)% (0.04)%Portfolio turnover rate(6) 149% 205% 172% 110% 179% 250%
Borrowings at End of Period Aggregate Amount Outstanding (000s) $72,000 $72,000 $93,300 $93,300 $93,300 $89,800Asset Coverage Per $1,000 (000s) $3,128 $2,991 $2,743 $2,897 $2,959 $3,019
* Based on average shares outstanding. (1) Effective July 31, 2016, the Clough Global Allocation Fund name changed to Clough Global Dividend and Income Fund. (2) The Board announced, on September 12, 2014, approval to change the fiscal year-end of the Fund from March 31 to October 31. (3) Less than $0.005. (4) Total investment return is calculated assuming a purchase of a common share at the opening on the first day and a sale at the closing on the last
day of each period reported. Dividends and distributions, if any, are assumed for purposes of this calculation to be reinvested at price obtained under the Fund's dividend reinvestment plan. Total investment returns do not reflect brokerage commissions on the purchase or sale of the Fund's common shares. Past performance is not a guarantee of future results. Total returns for the period indicated are not annualized.
(5) Annualized. (6) Portfolio turnover rate for periods less than one full year have not been annualized.

Clough Global Equity Fund Financial Highlights For a share outstanding throughout the period/years indicated
See Notes to the Financial Statements.
Annual Report | October 31, 2017 31
For the Year Ended
October 31, 2017
For the Year Ended
October 31, 2016
For the Year Ended
October 31, 2015
For the Period Ended
October 31, 2014(1)
For the Year Ended
March 31, 2014
For the Year Ended
March 31, 2013
PER COMMON SHARE OPERATING PERFORMANCE:Net asset value ‐ beginning of period $12.70 $15.10 $16.47 $17.15 $16.63 $15.53
Income from investment operations: Net investment loss* (0.02) (0.23) (0.45) (0.17) (0.33) (0.06)Net realized and unrealized
gain/(loss) on investments 3.06 (0.84) 0.46 0.23 2.33 2.32
Total Income/(Loss) from Investment Operations 3.04 (1.07) 0.01 0.06 2.00 2.26
DISTRIBUTIONS TO COMMON SHAREHOLDERS FROM:Net investment income (0.13) – (0.04) (0.08) (0.38) (0.87)Net realized gains – (0.90) (1.32) (0.66) (1.10) (0.29)Tax return of capital (1.11) (0.43) – – – –
Total Distributions to Common Shareholders (1.24) (1.33) (1.36) (0.74) (1.48) (1.16)
CAPITAL SHARE TRANSACTIONS: Dilutive impact of capital share
transactions* (0.00)(2) – (0.02) – – –
Total Capital Share Transactions (0.00)(2) – (0.02) – – –
Net asset value ‐ end of period $14.50 $12.70 $15.10 $16.47 $17.15 $16.63
Market price ‐ end of period $13.66 $10.69 $12.92 $14.34 $15.42 $14.70
Total Investment Return ‐ Net Asset Value:(3) 25.99% (5.36)%(4) 0.76% 0.86% 13.57% 16.90%
Total Investment Return ‐ Market Price:(3) 41.01% (6.90)% (0.98)% (2.33)% 15.52% 22.60%
RATIOS AND SUPPLEMENTAL DATA: Net assets attributable to common
shares, end of period (000s) $255,870 $224,187 $266,576 $293,829 $305,958 $296,710Ratios to average net assets attributable
to common shareholders: Total expenses 3.14% 4.21% 4.56% 3.68%(5) 3.76% 3.67%Total expenses excluding interest
expense and dividends on short sales expense 2.21% 2.59% 2.77% 2.42%(5) 2.36% 2.35%
Net investment loss (0.14)% (1.70)% (2.73)% (1.68)%(5) (1.95)% (0.37)%Portfolio turnover rate(6) 141% 182% 154% 102% 166% 250%
Borrowings at End of Period Aggregate Amount Outstanding (000s) $113,000 $113,000 $156,000 $156,000 $156,000 $147,000Asset Coverage Per $1,000 (000s) $3,264 $2,984 $2,709 $2,884 $2,961 $3,018
* Based on average shares outstanding. (1) The Board announced, on September 12, 2014, approval to change the fiscal year-end of the Fund from March 31 to October 31. (2) Less than $0.005. (3) Total investment return is calculated assuming a purchase of a common share at the opening on the first day and a sale at the closing on the last
day of each period reported. Dividends and distributions, if any, are assumed for purposes of this calculation to be reinvested at price obtained under the Fund's dividend reinvestment plan. Total investment returns do not reflect brokerage commissions on the purchase or sale of the Fund's common shares. Past performance is not a guarantee of future results. Total returns for the period indicated are not annualized.
(4) In 2016, 0.07% of the Funds's total return consists of a reimbursement by the Adviser for a realized investment loss. Excluding this item, total return would have been (5.43)%.
(5) Annualized. (6) Portfolio turnover rate for periods less than one full year have not been annualized.

Clough Global Opportunities Fund Financial Highlights For a share outstanding throughout the period/years indicated
See Notes to the Financial Statements.
32 www.cloughglobal.com
For the Year Ended
October 31, 2017
For the Year Ended
October 31, 2016
For the Year Ended
October 31, 2015
For the Period Ended
October 31, 2014(1)
For the Year Ended
March 31, 2014
For the Year Ended
March 31, 2013
PER COMMON SHARE OPERATING PERFORMANCE:Net asset value ‐ beginning of period $11.07 $12.92 $14.11 $14.67 $14.64 $13.84
Income from investment operations: Net investment loss* (0.02) (0.15) (0.35) (0.15) (0.32) (0.09)Net realized and unrealized
gain/(loss) on investments 2.11 (0.54) 0.36 0.26 1.72 1.97
Total Income/(Loss) from Investment Operations 2.09 (0.69) 0.01 0.11 1.40 1.88
DISTRIBUTIONS TO COMMON SHAREHOLDERS FROM:Net investment income (0.14) – – – (0.11) (1.08)Net realized gains – (0.18) (1.19) (0.67) (1.26) –Tax return of capital (0.93) (0.98) – – – –
Total Distributions to Common Shareholders (1.07) (1.16) (1.19) (0.67) (1.37) (1.08)
CAPITAL SHARE TRANSACTIONS: Dilutive impact of capital share
transactions* (0.00)(2) – (0.01) – – –
Total Capital Share Transactions (0.00)(2) – (0.01) – – –
Net asset value ‐ end of period $12.09 $11.07 $12.92 $14.11 $14.67 $14.64
Market price ‐ end of period $11.42 $9.04 $11.25 $12.18 $12.75 $12.87
Total Investment Return ‐ Net Asset Value:(3) 20.99% (3.48)% 1.13% 1.39% 11.26% 15.87%
Total Investment Return ‐ Market Price:(3) 39.95% (9.49)% 1.93% 0.70% 9.99% 19.67%
RATIOS AND SUPPLEMENTAL DATA: Net assets attributable to common
shares, end of period (000s) $623,361 $570,931 $666,588 $729,855 $759,084 $757,452Ratios to average net assets attributable
to common shareholders: Total expenses 3.23% 4.32% 4.62% 3.86%(4) 3.97% 3.86%Total expenses excluding interest
expense and dividends on short sales expense 2.27% 2.73% 2.82% 2.60%(4) 2.55% 2.52%
Net investment loss (0.16)% (1.33)% (2.47)% (1.76)%(4) (2.15)% (0.64)%Portfolio turnover rate(5) 165% 191% 176% 111% 178% 241%
Borrowings at End of Period Aggregate Amount Outstanding (000s) $292,000 $292,000 $388,900 $388,900 $388,900 $388,900Asset Coverage Per $1,000 (000s) $3,135 $2,955 $2,714 $2,877 $2,952 $2,948
* Based on average shares outstanding. (1) The Board announced, on September 12, 2014, approval to change the fiscal year-end of the Fund from March 31 to October 31. (2) Less than $0.005. (3) Total investment return is calculated assuming a purchase of a common share at the opening on the first day and a sale at the closing on the last
day of each period reported. Dividends and distributions, if any, are assumed for purposes of this calculation to be reinvested at price obtained under the Fund's dividend reinvestment plan. Total investment returns do not reflect brokerage commissions on the purchase or sale of the Fund's common shares. Past performance is not a guarantee of future results. Total returns for the period indicated are not annualized.
(4) Annualized. (5) Portfolio turnover rate for periods less than one full year have not been annualized.

Clough Global Funds Notes to Financial Statements October 31, 2017
Annual Report | October 31, 2017 33
1. ORGANIZATION AND SIGNIFICANT ACCOUNTING AND OPERATING POLICIES
Clough Global Dividend and Income Fund, Clough Global Equity Fund, and Clough Global Opportunities Fund (each a “Fund”, collectively the “Funds”), are closed‐end management investment companies registered under the Investment Company Act of 1940 (the “1940 Act”). The Funds were organized under the laws of the state of Delaware on April 27, 2004, January 25, 2005, and January 12, 2006, respectively for Clough Global Dividend and Income Fund, Clough Global Equity Fund, and Clough Global Opportunities Fund. The Funds were previously registered as non‐diversified investment companies. As a result of ongoing operations, each of the Funds became a diversified company. The Funds may not resume operating in a non‐diversified manner without first obtaining shareholder approval. Each Fund’s investment objective is to provide a high level of total return. Each Declaration of Trust provides that the Board of Trustees (the “Board”) may authorize separate classes of shares of beneficial interest. The common shares of Clough Global Dividend and Income Fund, Clough Global Equity Fund, and Clough Global Opportunities Fund are listed on the NYSE American LLC and trade under the ticker symbols “GLV”, “GLQ” and “GLO” respectively. The following is a summary of significant accounting policies followed by the Funds. These policies are in conformity with U.S. generally accepted accounting principles (“GAAP”). The preparation of financial statements in accordance with GAAP requires management to make estimates and assumptions that affect the reported amounts and disclosures in the financial statements during the reporting period. Management believes the estimates and security valuations are appropriate; however, actual results may differ from those estimates, and the security valuations reflected in the financial statements may differ from the value the Funds ultimately realize upon sale of the securities. Each Fund is considered an investment company for financial reporting purposes under GAAP and follows the accounting and reporting guidance applicable to investment companies as codified in Accounting Standards Codification Topic (“ASC”) 946 – Investment Companies. The net asset value per share of each Fund is determined no less frequently than daily, on each day that the New York Stock Exchange (“NYSE” or the “Exchange”) is open for trading, as of the close of regular trading on the Exchange (normally 4:00 p.m. New York time). Trading may take place in foreign issues held by the Fund at times when a Fund is not open for business. As a result, each Fund’s net asset value may change at times when it is not possible to purchase or sell shares of a Fund.
Investment Valuation: Securities, including preferred stocks, exchange traded funds, closed‐end funds and participation notes held by each Fund for which exchange quotations are readily available are valued at the last sale price, or if no sale price or if traded on the over‐the‐counter market, at the mean of the bid and asked prices on such day. Most securities listed on a foreign exchange are valued at the last sale price at the close of the exchange on which the security is primarily traded. In certain countries market maker prices are used since they are the most representative of the daily trading activity. Market maker prices are usually the mean between the bid and ask prices. Certain markets are not closed at the time that the Funds price their portfolio securities. In these situations, snapshot prices are provided by the individual pricing services or other alternate sources at the close of the NYSE as appropriate. Securities not traded on a particular day are valued at the mean between the last reported bid and the asked quotes, or the last sale price when appropriate; otherwise fair value will be determined by the board‐appointed fair valuation committee. Debt securities for which the over‐the‐counter market is the primary market are normally valued on the basis of prices furnished by one or more pricing services or dealers at the mean between the latest available bid and asked prices. As authorized by the Board, debt securities (including short‐term obligations that will mature in 60 days or less) may be valued on the basis of valuations furnished by a pricing service which determines valuations based upon market transactions for normal, institutional‐size trading units of securities or a matrix method which considers yield or price of comparable bonds provided by a pricing service. Over‐the‐counter options are valued at the mean between bid and asked prices provided by dealers. Exchange‐traded options are valued at closing settlement prices. Total return swaps are priced based on valuations provided by a Board approved independent third party pricing agent. If a total return swap price cannot be obtained from an independent third party pricing agent the Fund shall seek to obtain a bid price from at least one independent and/or executing broker. If the price of a security is unavailable in accordance with the aforementioned pricing procedures, or the price of a security is unreliable, e.g., due to the occurrence of a significant event, the security may be valued at its fair value determined by management pursuant to procedures adopted by the Board. For this purpose, fair value is the price that a Fund reasonably expects to receive on a current sale of the security. Due to the number of variables affecting the price of a security, however; it is possible that the fair value of a security may not accurately reflect the price that a Fund could actually receive on a sale of the security. A three‐tier hierarchy has been established to classify fair value measurements for disclosure purposes. Inputs refer broadly to the assumptions that market participants would use in pricing the asset or liability, including assumptions about risk. Inputs may be observable or unobservable. Observable inputs are inputs that reflect the assumptions market participants would use in pricing the asset or liability that are developed based on market data obtained from sources independent of the reporting entity. Unobservable inputs are inputs that reflect the reporting entity’s own assumptions about the assumptions market participants would use in pricing the asset or liability that are developed based on the best information available.

Clough Global Funds Notes to Financial Statements October 31, 2017
34 www.cloughglobal.com
Various inputs are used in determining the value of each Fund’s investments as of the reporting period end. These inputs are categorized in the following hierarchy under applicable financial accounting standards: Level 1 – Unadjusted quoted prices in active markets for identical, unrestricted assets or liabilities that a Fund has the ability to access at the
measurement date; Level 2 – Quoted prices which are not active, quoted prices for similar assets or liabilities in active markets or inputs other than quoted prices that
are observable (either directly or indirectly) for substantially the full term of the asset or liability; and Level 3 – Significant unobservable prices or inputs (including the Fund’s own assumptions in determining the fair value of investments) where
there is little or no market activity for the asset or liability at the measurement date. The following is a summary of the inputs used as of October 31, 2017, in valuing each Fund’s investments carried at value. The Funds recognize transfers between the levels as of the end of the period in which the transfer occurred. There were no transfers between Level 1 and Level 2 securities during the year ended October 31, 2017.
Clough Global Dividend and Income Fund Investments in Securities at Value* Level 1 Level 2 Level 3 Total Common Stocks
Consumer Discretionary $ 14,606,394 $ – $ –
$ 14,606,394Consumer Staples 1,670,752 – –
1,670,752Energy – – 773,744
773,744Financials 39,141,008 – –
39,141,008Health Care 5,615,264 – –
5,615,264Information Technology 39,410,919 – –
39,410,919Materials 841,967 – –
841,967Participation Notes – 3,011,447 –
3,011,447Preferred Stocks 5,184,278 – –
5,184,278Corporate Bonds – 40,579,257 –
40,579,257Asset/Mortgage Backed Securities – 17,720,803 –
17,720,803Government & Agency Obligations – 23,888,192 –
23,888,192Municipal Bonds – 7,568,737 –
7,568,737Short‐Term Investments
Money Market Fund 5,024,302 – –
5,024,302U.S. Treasury Bills – 12,411,095 –
12,411,095
TOTAL $ 111,494,884 $ 105,179,531 $ 773,744
$ 217,448,159
Other Financial Instruments Level 1 Level 2 Level 3 Total Assets Total Return Swap Contracts** $ – $ 2,563,190 $ –
$ 2,563,190
Liabilities Securities Sold Short
Common Stocks (11,676,872) – –
(11,676,872)Exchange Traded Funds (5,489,033) – –
(5,489,033)
TOTAL $ (17,165,905) $ 2,563,190 $ –
$ (14,602,715)

Clough Global Funds Notes to Financial Statements October 31, 2017
Annual Report | October 31, 2017 35
Clough Global Equity Fund Investments in Securities at Value* Level 1 Level 2 Level 3 Total Common Stocks
Consumer Discretionary $ 49,067,632 $ – $ –
$ 49,067,632Consumer Staples 2,692,317 – –
2,692,317Energy – – 1,288,192
1,288,192Financials 72,799,473 – –
72,799,473Health Care 35,390,113 1,465,852 308,731
37,164,696Information Technology 87,844,739 – –
87,844,739Materials 1,374,169 – –
1,374,169Utilities 12,948,878 – –
12,948,878Closed‐End Funds 4,200,188 – –
4,200,188Participation Notes – 4,912,106 –
4,912,106Preferred Stocks 8,394,194 – –
8,394,194Asset/Mortgage Backed Securities – 902,330 –
902,330Government & Agency Obligations – 20,002,478 –
20,002,478Short‐Term Investments
Money Market Fund 41,357,206 – –
41,357,206U.S. Treasury Bills – 8,427,675 –
8,427,675
TOTAL $ 316,068,909 $ 35,710,441 $ 1,596,923
$ 353,376,273
Other Financial Instruments Level 1 Level 2 Level 3 Total Assets Total Return Swap Contracts** $ – $ 4,357,282 $ –
$ 4,357,282
Liabilities Securities Sold Short
Common Stocks (21,257,931) – –
(21,257,931)Exchange Traded Funds (8,868,381) – –
(8,868,381)Total Return Swap Contracts
** – (54,056) –
(54,056)
TOTAL $ (30,126,312) $ 4,303,226 $ –
$ (25,823,086)

Clough Global Funds Notes to Financial Statements October 31, 2017
36 www.cloughglobal.com
Clough Global Opportunities Fund Investments in Securities at Value* Level 1 Level 2 Level 3 Total Common Stocks
Consumer Discretionary $ 97,680,809 $ – $ –
$ 97,680,809Consumer Staples 6,692,896 – –
6,692,896Energy – – 3,173,120
3,173,120Financials 147,481,686 – –
147,481,686Health Care 71,055,366 3,649,058 766,117
75,470,541Information Technology 190,401,310 – –
190,401,310Materials 3,412,759 – –
3,412,759Closed‐End Funds 10,454,892 – –
10,454,892Participation Notes – 12,312,069 –
12,312,069Preferred Stocks 9,856,850 – –
9,856,850Corporate Bonds – 115,002,135 –
115,002,135Asset/Mortgage Backed Securities – 53,329,495 –
53,329,495Government & Agency Obligations – 87,894,376 –
87,894,376Municipal Bonds – 14,002,610 –
14,002,610Short‐Term Investments
Money Market Fund 31,484,148 – –
31,484,148U.S. Treasury Bills – 21,811,159 –
21,811,159
TOTAL $ 568,520,716 $ 308,000,902 $ 3,939,237
$ 880,460,855
Other Financial Instruments Level 1 Level 2 Level 3 Total Assets Total Return Swap Contracts** $ – $ 9,986,943 $ –
$ 9,986,943
Liabilities Securities Sold Short
Common Stocks (52,277,821) – –
(52,277,821)Exchange Traded Funds (22,291,438) – –
(22,291,438)Total Return Swap Contracts** – (136,507) –
(136,507)
TOTAL $ (74,569,259) $ 9,850,436 $ –
$ (64,718,823)
* For detailed sector descriptions, see the accompanying Statements of Investments. ** Swap contracts are reported at their unrealized appreciation/(depreciation) at measurement date, which represents the change in the contract's value
from trade date.
In the event a Board approved independent pricing service is unable to provide an evaluated price for a security or Clough Capital Partners L.P. (the “Adviser” or “Clough”) believes the price provided is not reliable, securities of each Fund may be valued at fair value as described above. In these instances the Adviser may seek to find an alternative independent source, such as a broker/dealer to provide a price quote, or by using evaluated pricing models similar to the techniques and models used by the independent pricing service. These fair value measurement techniques may utilize unobservable inputs (Level 3). On a monthly basis, the Fair Value Committee of each Fund meets and discusses securities that have been fair valued during the preceding month in accordance with the Funds’ Fair Value Procedures and reports quarterly to the Board on the results of those meetings.

Clough Global Funds Notes to Financial Statements October 31, 2017
Annual Report | October 31, 2017 37
The following is a reconciliation of the investments in which significant unobservable inputs (Level 3) were used in determining fair value: Clough Global Dividend and Income Fund
Investments in Securities
Balance as of October 31,
2016 Realized
Gain/(Loss)
Change in Unrealized
Appreciation/ (Depreciation) Purchases
Sales Proceeds
Transfer into
Level 3
Transfer out of
Level 3 Balance as of
October 31, 2017
Net change in unrealized
appreciation/ (depreciation) attributable to
Level 3 investments held at
October 31, 2017 Common
Stocks $ – $ – $ – $ – $ – $ 773,744 $ – $ 773,744 $ (549,594)
Total $ – $ – $ – $ – $ – $ 773,744 $ – $ 773,744 $ (549,594)
Clough Global Equity Fund
Investments in Securities
Balance as of October 31,
2016 Realized
Gain/(Loss)
Change in Unrealized
Appreciation/ (Depreciation) Purchases
Sales Proceeds
Transfer into
Level 3
Transfer out of
Level 3 Balance as of
October 31, 2017
Net change in unrealized
appreciation/ (depreciation) attributable to
Level 3 investments held
at October 31, 2017
Common Stocks $ – $ – $ – $ 308,731 $ – $1,288,192 $ – $ 1,596,923 $ (915,008)
Total $ – $ – $ – $ 308,731 $ – $1,288,192 $ – $ 1,596,923 $ (915,008) Clough Global Opportunities Fund
Investments in Securities
Balance as of October 31,
2016 Realized
Gain/(Loss)
Change in Unrealized
Appreciation/ (Depreciation) Purchases
Sales Proceeds
Transfer into
Level 3
Transfer out of
Level 3 Balance as of
October 31, 2017
Net change in unrealized
appreciation/ (depreciation) attributable to
Level 3 investments held at
October 31, 2017 Common
Stocks $ – $ – $ – $ 766,117 $ – $ 3,173,120 $ – $ 3,939,237 $ (2,253,880)
Total $ – $ – $ – $ 766,117 $ – $ 3,173,120 $ – $ 3,939,237 $ (2,253,880)
The following is a summary of valuation techniques and quantitative information used in determining the fair value of the Fund’s Level 3 investments at October 31, 2017: Fund Sector Fair Value Valuation Technique Unobservable Input(a) Range / Premium Clough Global Dividend Income Fund Energy $773,744 Comparable Company Approach Implied Premium 35.53% Projected EV/EBITDA Multiple 7.08x – 8.19x Projected EV/Revenue Multiple 4.16x – 4.58x Clough Global Equity Fund Energy $1,288,192 Comparable Company Approach Implied Premium 35.53% Projected EV/EBITDA Multiple 7.08x – 8.19x Projected EV/Revenue Multiple 4.16x – 4.58x Health Care $308,731 Recent Financings Transaction Price N/A Clough Global Opportunities Fund Energy $3,173,120 Comparable Company Approach Implied Premium 35.53% Projected EV/EBITDA Multiple 7.08x – 8.19x Projected EV/Revenue Multiple 4.16x – 4.58x Health Care $766,117 Recent Financings Transaction Price N/A (a) A change to the unobservable input may result in a significant change to the value of the investment as follows:

Clough Global Funds Notes to Financial Statements October 31, 2017
38 www.cloughglobal.com
Unobservable Input Impact to Value if Input Increases Impact to Value if Input Decreases Implied Premium Increase Decrease Projected EV/EBITDA Multiple Increase Decrease Projected EV/Revenue Multiple Increase Decrease Transaction Price Increase Decrease Foreign Securities: Each Fund may invest a portion of its assets in foreign securities. In the event that a Fund executes a foreign security transaction, the Fund will generally enter into a foreign currency spot contract to settle the foreign security transaction. Foreign securities may carry more risk than U.S. securities, such as political, market and currency risks. The accounting records of each Fund are maintained in U.S. dollars. Prices of securities denominated in foreign currencies are translated into U.S. dollars at the closing rates of exchange at period end. Amounts related to the purchase and sale of foreign securities and investment income are translated at the rates of exchange prevailing on the respective dates of such transactions. The effect of changes in foreign currency exchange rates on investments is reported with investment securities realized and unrealized gains and losses in the Funds’ Statements of Operations. A foreign currency spot contract is a commitment to purchase or sell a foreign currency at a future date, at a negotiated rate. Each Fund may enter into foreign currency spot contracts to settle specific purchases or sales of securities denominated in a foreign currency and for protection from adverse exchange rate fluctuation. Risks to a Fund include the potential inability of the counterparty to meet the terms of the contract. The net U.S. dollar value of foreign currency underlying all contractual commitments held by a Fund and the resulting unrealized appreciation or depreciation are determined using prevailing forward foreign currency exchange rates. Unrealized appreciation and depreciation on foreign currency spot contracts are reported in the Funds’ Statements of Assets and Liabilities as a receivable for investments sold or a payable for investments purchased and in the Funds’ Statements of Operations with the change in unrealized appreciation or depreciation on translation of assets and liabilities denominated in foreign currencies. These spot contracts are used by the broker to settle investments denominated in foreign currencies. A Fund may realize a gain or loss upon the closing or settlement of the foreign transactions, excluding investment securities. Such realized gains and losses are reported with all other foreign currency gains and losses in the Statements of Operations.
Exchange Traded Funds: Each Fund may invest in exchange traded funds (“ETFs”), which are funds whose shares are traded on a national
exchange. ETFs may be based on underlying equity or fixed income securities, as well as commodities or currencies. ETFs do not sell individual shares directly to investors and only issue their shares in large blocks known as “creation units.” The investor purchasing a creation unit then sells the individual shares on a secondary market. Although similar diversification benefits may be achieved through an investment in another investment company, ETFs generally offer greater liquidity and lower expenses. Because an ETF incurs its own fees and expenses, shareholders of a Fund investing in an ETF will indirectly bear those costs. Such Funds will also incur brokerage commissions and related charges when purchasing or selling shares of an ETF. Unlike typical investment company shares, which are valued once daily, shares in an ETF may be purchased or sold on a securities exchange throughout the trading day at market prices that are generally close to the NAV of the ETF.
Short Sales: Each Fund may sell a security it does not own in anticipation of a decline in the fair value of that security. When a Fund sells a security
short, it must borrow the security sold short and deliver it to the broker‐dealer through which it made the short sale. A gain, limited to the price at which a Fund sold the security short, or a loss, unlimited in size, will be recognized upon the termination of the short sale. Each Fund's obligation to replace the borrowed security will be secured by collateral deposited with the broker‐dealer, usually cash, U.S. government securities or other liquid securities. Each Fund will also be required to designate on its books and records similar collateral with its custodian to the extent, if any, necessary so that the aggregate collateral value is at all times at least equal to the current value of the security sold short. The cash amount is reported on the Statements of Assets and Liabilities as Deposit with broker for securities sold short which is held with one counterparty. Each Fund is obligated to pay interest to the broker for any debit balance of the margin account relating to short sales. The interest incurred by the Funds is reported on the Statements of Operations as Interest expense – margin account. Interest amounts payable, if any, are reported on the Statements of Assets and Liabilities as Interest payable – margin account. Each Fund may also sell a security short if it owns at least an equal amount of the security sold short or another security convertible or exchangeable for an equal amount of the security sold short without payment of further compensation (a short sale against‐the‐box). In a short sale against‐the‐box, the short seller is exposed to the risk of being forced to deliver stock that it holds to close the position if the borrowed stock is called in by the lender, which would cause gain or loss to be recognized on the delivered stock. Each Fund expects normally to close its short sales against‐the‐box by delivering newly acquired stock. Since the Funds intend to hold securities sold short for the short term, these securities are excluded from the purchases and sales of investment securities in Note 4 and each Fund’s Portfolio Turnover in the Financial Highlights.

Clough Global Funds Notes to Financial Statements October 31, 2017
Annual Report | October 31, 2017 39
Derivatives Instruments and Hedging Activities: The following discloses the Funds’ use of derivative instruments and hedging activities. The Funds’ investment objectives not only permit the Funds to purchase investment securities, they also allow the Funds to enter into various types of derivative contracts, including, but not limited to, purchased and written options, swaps, futures and warrants. In doing so, the Funds will employ strategies in differing combinations to permit them to increase, decrease, or change the level or types of exposure to market factors. Central to those strategies are features inherent to derivatives that make them more attractive for this purpose than equity securities; they require little or no initial cash investment, they can focus exposure on only certain selected risk factors, and they may not require the ultimate receipt or delivery of the underlying security (or securities) to the contract. This may allow the Funds to pursue their objectives more quickly and efficiently than if they were to make direct purchases or sales of securities capable of affecting a similar response to market factors. Risk of Investing in Derivatives: The Funds’ use of derivatives can result in losses due to unanticipated changes in the market risk factors and the overall market. In instances where the Funds are using derivatives to decrease or hedge exposures to market risk factors for securities held by the Funds, there are also risks that those derivatives may not perform as expected, resulting in losses for the combined or hedged positions. Derivatives may have little or no initial cash investment relative to their market value exposure and therefore can produce significant gains or losses in excess of their cost. This use of embedded leverage allows the Funds to increase their market value exposure relative to their net assets and can substantially increase the volatility of the Funds’ performance. Additional associated risks from investing in derivatives also exist and potentially could have significant effects on the valuation of the derivative and the Funds. Typically, the associated risks are not the risks that the Funds are attempting to increase or decrease exposure to, per their investment objectives, but are the additional risks from investing in derivatives. Examples of these associated risks are liquidity risk, which is the risk that the Funds will not be able to sell the derivative in the open market in a timely manner, and counterparty credit risk, which is the risk that the counterparty will not fulfill its obligation to the Funds. Associated risks can be different for each type of derivative and are discussed by each derivative type in the notes that follow. Each Fund may acquire put and call options and options on stock indices and enter into stock index futures contracts, certain credit derivatives transactions and short sales in connection with its equity investments. In connection with a Fund's investments in debt securities, it may enter into related derivatives transactions such as interest rate futures, swaps and options thereon and certain credit derivatives transactions. Derivatives transactions of the types described above subject a Fund to increased risk of principal loss due to imperfect correlation or unexpected price or interest rate movements. Each Fund also will be subject to credit risk with respect to the counterparties to the derivatives contracts purchased by a Fund. If a counterparty becomes bankrupt or otherwise fails to perform its obligations under a derivatives contract due to financial difficulties, each Fund may experience significant delays in obtaining any recovery under the derivatives contract in a bankruptcy or other reorganization proceeding. Each Fund may obtain only a limited recovery or may obtain no recovery in such circumstances. Market Risk Factors: In addition, in pursuit of their investment objectives, certain Funds may seek to use derivatives, which may increase or decrease exposure to the following market risk factors:
Equity Risk: Equity risk relates to the change in value of equity securities as they relate to increases or decreases in the general market. Foreign Exchange Rate Risk: Foreign exchange rate risk relates to the change in the U.S. dollar value of a security held that is denominated in a foreign currency. The value of a foreign currency denominated security will decrease as the dollar appreciates against the currency, while the value of the foreign currency denominated security will increase as the dollar depreciates against the currency.
Option Writing/Purchasing: Each Fund may purchase or write (sell) put and call options. One of the risks associated with purchasing an option among others, is that a Fund pays a premium whether or not the option is exercised. Additionally, a Fund bears the risk of loss of premium and change in value should the counterparty not perform under the contract. The cost of securities acquired through the exercise of call options is increased by premiums paid. The proceeds from securities sold through the exercise of put options are decreased by the premiums paid. Each Fund is obligated to pay interest to the broker for any debit balance of the margin account relating to options. Each Fund pledges cash or liquid assets as collateral to satisfy the current obligations with respect to written options. The interest incurred on the Funds is reported on the Statements of Operations as Interest expense – margin account. Interest amounts payable by the Funds, if any, are reported on the Statements of Assets and Liabilities as Interest payable – margin account. When a Fund writes an option, an amount equal to the premium received by a Fund is recorded as a liability and is subsequently adjusted to the current value of the option written. Premiums received from writing options that expire unexercised are treated by a Fund on the expiration date as realized gains. The difference between the premium received and the amount paid on effecting a closing purchase transaction, including brokerage commissions, is recorded as a realized gain or loss. If a call option is exercised, the premium is added to the proceeds from the sale of the underlying security or currency in determining whether a Fund has realized a gain or loss. If a put option is exercised, the premium reduces the cost basis of the securities purchased by a Fund. Each Fund, as writer of an option, bears the market risk of an unfavorable change in the price of the security underlying the written option. There was no written option or purchased option activity for the year ended October 31, 2017.

Clough Global Funds Notes to Financial Statements October 31, 2017
40 www.cloughglobal.com
Futures Contracts: Each Fund may enter into futures contracts. A futures contract is an agreement to buy or sell a security or currency (or to deliver a final cash settlement price in the case of a contract relating to an index or otherwise not calling for physical delivery at the end of trading in the contract) for a set price at a future date. If a Fund buys a security futures contract, the Fund enters into a contract to purchase the underlying security and is said to be "long" under the contract. If a Fund sells a security futures contact, the Fund enters into a contract to sell the underlying security and is said to be "short" under the contract. The price at which the contract trades (the "contract price") is determined by relative buying and selling interest on a regulated exchange. Futures contracts are marked to market daily and an appropriate payable or receivable for the change in value (“variation margin”) is recorded by the Fund. Such payables or receivables are recorded for financial statement purposes as variation margin payable or variation margin receivable by each Fund. Each Fund pledges cash or liquid assets as collateral to satisfy the current obligations with respect to futures contracts. The cash amount is reported on the Statements of Assets and Liabilities as Deposit with broker for futures contracts which is held with one counterparty. Management has reviewed the futures agreement under which the futures contracts are traded and has determined that the Funds do not have the right to set‐off, and therefore the futures contracts are not subject to enforceable netting arrangements. The Funds enter into such transactions for hedging and other appropriate risk‐management purposes or to increase return. While a Fund may enter into futures contracts for hedging purposes, the use of futures contracts might result in a poorer overall performance for the Fund than if it had not engaged in any such transactions. If, for example, the Fund had insufficient cash, it might have to sell a portion of its underlying portfolio of securities in order to meet daily variation margin requirements on its futures contracts or options on futures contracts at a time when it might be disadvantageous to do so. There may be an imperfect correlation between the Funds’ portfolio holdings and futures contracts entered into by the Fund, which may prevent the Fund from achieving the intended hedge or expose the Fund to risk of loss. Futures contract transactions may result in losses substantially in excess of the variation margin. There can be no guarantee that there will be a correlation between price movements in the hedging vehicle and in the portfolio securities being hedged. An incorrect correlation could result in a loss on both the hedged securities in a Fund and the hedging vehicle so that the portfolio return might have been greater had hedging not been attempted. There can be no assurance that a liquid market will exist at a time when the Fund seeks to close out a futures contract. Lack of a liquid market for any reason may prevent a Fund from liquidating an unfavorable position, and the Fund would remain obligated to meet margin requirements until the position is closed. In addition, the Fund could be exposed to risk if the counterparties to the contracts are unable to meet the terms of their contracts. With exchange‐traded futures contracts, there is minimal counterparty credit risk to the Funds since futures contracts are exchange‐traded and the exchange’s clearinghouse, as counterparty to all exchange‐traded futures contracts, guarantees the futures contracts against default. During the year ended October 31, 2017, the Funds invested in futures contracts. Swaps: During the year each Fund engaged in total return swaps. A swap is an agreement that obligates two parties to exchange a series of cash flows at specified intervals based upon or calculated by reference to changes in specified prices or rates for a specified amount of an underlying asset. Each Fund may utilize swap agreements as a means to gain exposure to certain assets and/or to “hedge” or protect the Fund from adverse movements in securities prices or interest rates. Each Fund is subject to equity risk and interest rate risk in the normal course of pursuing its investment objective through investments in swap contracts. Swap agreements entail the risk that a party will default on its payment obligation to a Fund. If the other party to a swap defaults, a Fund would risk the loss of the net amount of the payments that it contractually is entitled to receive. If each Fund utilizes a swap at the wrong time or judges market conditions incorrectly, the swap may result in a loss to the Fund and reduce the Fund’s total return. Total return swaps involve an exchange by two parties in which one party makes payments based on a set rate, either fixed or variable, while the other party makes payments based on the return of an underlying asset, which includes both the income it generates and any capital gains over the payment period. A Fund’s maximum risk of loss from counterparty risk or credit risk is the discounted value of the payments to be received from/paid to the counterparty over the contract’s remaining life, to the extent that the amount is positive. The risk is mitigated by having a netting arrangement between a Fund and the counterparty and by the posting of collateral to a Fund to cover the Fund’s exposure to the counterparty. Each Fund pledges cash or liquid assets as collateral to satisfy the current obligations with respect to swap contracts. The cash amount is reported on the Statements of Assets and Liabilities as Deposit with broker for total return swap contracts which is held with one counterparty. International Swaps and Derivatives Association, Inc. Master Agreements (“ISDA Master Agreements”) govern OTC financial derivative transactions entered into by a Fund and those counterparties. The ISDA Master Agreements maintain provisions for general obligations, representations, agreements, collateral and events of default or termination. Events of termination include conditions that may entitle counterparties to elect to terminate early and cause settlement of all outstanding transactions under the applicable ISDA Master Agreement. Any election to early terminate could be material to the financial statements. During the year ended October 31, 2017, the Funds invested in swap agreements consistent with the Funds’ investment strategies to gain exposure to certain markets or indices. Warrants/Rights: Each Fund may purchase or otherwise receive warrants or rights. Warrants and rights generally give the holder the right to receive, upon exercise, a security of the issuer at a set price. Funds typically use warrants and rights in a manner similar to their use of purchased options on securities, as described in options above. Risks associated with the use of warrants and rights are generally similar to risks associated with the use of purchased options. However, warrants and rights often do not have standardized terms, and may have longer maturities and may

Clough Global Funds Notes to Financial Statements October 31, 2017
Annual Report | October 31, 2017 41
be less liquid than exchange‐traded options. In addition, the terms of warrants or rights may limit each Fund’s ability to exercise the warrants or rights at such times and in such quantities as each Fund would otherwise wish. During the year each Fund invested in warrants. Each Fund held no warrants or rights at the end of the year. The effect of derivatives instruments on each Fund’s Statement of Assets and Liabilities as of October 31, 2017:
Asset Derivatives Risk Exposure Statements of Assets and Liabilities Location Fair Value Clough Global Dividend and Income Fund
Equity Contracts (Total Return Swap Contracts) Unrealized appreciation on total return swap contracts $ 2,563,190
$ 2,563,190
Clough Global Equity Fund Equity Contracts (Total Return Swap Contracts) Unrealized appreciation on total return swap contracts $ 4,357,282
$ 4,357,282
Clough Global Opportunities Fund Equity Contracts (Total Return Swap Contracts) Unrealized appreciation on total return swap contracts $ 9,986,943
$ 9,986,943
Liability Derivatives Statements of Assets and Liabilities Location Fair Value Clough Global Equity Fund
Equity Contracts (Total Return Swap Contracts) Unrealized depreciation on total return swap contracts $ 54,056
Total $ 54,056
Clough Global Opportunities Fund Equity Contracts (Total Return Swap Contracts) Unrealized depreciation on total return swap contracts $ 136,507
Total $ 136,507

Clough Global Funds Notes to Financial Statements October 31, 2017
42 www.cloughglobal.com
The effect of derivatives instruments on each Fund’s Statement of Operations for the year ended October 31, 2017:
Risk Exposure Statements of Operations Location
Realized Gain/(Loss)
on Derivatives Recognized in Income
Change in Unrealized
Appreciation/ (Depreciation) on Derivatives
Recognized in Income
Clough Global Dividend and Income Fund Foreign Currency Contracts
(Futures Contracts) Net realized gain/(loss) on futures contracts/Net change in
unrealized appreciation/(depreciation) on futures contracts $ 309,922 $ (48,860)
Equity Contracts (Total Return Swap Contracts)
Net realized gain/(loss) on total return swap contracts/Net change in unrealized appreciation/(depreciation) on total return swap contracts 126,336 2,560,709
Equity Contracts (Warrants)
Net realized gain/(loss) on investment securities/ Net change in unrealized appreciation/(depreciation) on investment securities (1,170) (584)
Total $ 435,088 $ 2,511,265
Clough Global Equity Fund Foreign Currency Contracts
(Futures Contracts) Net realized gain/(loss) on futures contracts/Net change in
unrealized appreciation/(depreciation) on futures contracts $ 680,641 $ (108,006)
Equity Contracts (Total Return Swap Contracts)
Net realized gain/(loss) on total return swap contracts/Net change in unrealized appreciation/(depreciation) on total return swap contracts 78,786 4,399,180
Equity Contracts (Warrants)
Net realized gain/(loss) on investment securities/ Net change in unrealized appreciation/(depreciation) on investment securities (1,957) (979)
Total $ 757,470 $ 4,290,195
Clough Global Opportunities Fund Foreign Currency Contracts
(Futures Contracts) Net realized gain/(loss) on futures contracts/Net change in
unrealized appreciation/(depreciation) on futures contracts $ 1,721,039 $ (275,159)
Equity Contracts (Total Return Swap Contracts)
Net realized gain/(loss) on total return swap contracts/Net change in unrealized appreciation/(depreciation) on total return swap contracts 432,948 10,092,541
Equity Contracts (Warrants)
Net realized gain/(loss) on investment securities/ Net change in unrealized appreciation/(depreciation) on investment securities (4,873) (2,437)
Total $ 2,149,114 $ 9,814,945

Clough Global Funds Notes to Financial Statements October 31, 2017
Annual Report | October 31, 2017 43
The average total return swap contracts notional amount during the year ended October 31, 2017, is noted below for each of the Funds.
Fund Average Total Return Swap Contracts Notional Amount Clough Global Dividend and Income Fund $ 10,477,849Clough Global Equity Fund 19,357,456Clough Global Opportunities Fund 45,774,388
The average warrant value during the year ended October 31, 2017, is noted below for each of the Funds.
Fund Average Warrant Market Value Clough Global Dividend and Income Fund $ 314Clough Global Equity Fund 616Clough Global Opportunities Fund 1,533
The average futures contracts notional amount during the year ended October 31, 2017, is noted below for each of the Funds.
Fund Average Futures Contracts Notional Amount Clough Global Dividend and Income Fund $ (2,183,153)Clough Global Equity Fund (3,757,888)Clough Global Opportunities Fund (9,678,979)
Certain derivative contracts are executed under either standardized netting agreements or, for exchange‐traded derivatives, the relevant contracts for a particular exchange which contain enforceable netting provisions. A derivative netting arrangement creates an enforceable right of set‐off that becomes effective, and affects the realization of settlement on individual assets, liabilities and collateral amounts, only following a specified event of default or early termination. Default events may include the failure to make payments or deliver securities timely, material adverse changes in financial condition or insolvency, the breach of minimum regulatory capital requirements, or loss of license, charter or other legal authorization necessary to perform under the contract.

Clough Global Funds Notes to Financial Statements October 31, 2017
44 www.cloughglobal.com
The following tables present derivative financial instruments that are subject to enforceable netting arrangements as of October 31, 2017.
Offsetting of Derivatives Assets
Gross Amounts Not Offset in the
Statements of Assets and Liabilities
Gross Amounts of Recognized Assets
Gross Amounts Offset in the
Statements of Assets and Liabilities
Net Amounts Presented in the
Statements of Assets and Liabilities
Financial Instruments(a)
Cash Collateral Received(a) Net Amount
Clough Global Dividend and Income Fund Total Return Swap Contracts $ 2,563,190
$ –
$ 2,563,190 $ – $ –
$ 2,563,190
Total $ 2,563,190
$ –
$ 2,563,190 $ – $ –
$ 2,563,190
Clough Global Equity Fund Total Return Swap Contracts $ 4,357,282
$ –
$ 4,357,282 $ (54,056) $ –
$ 4,303,226
Total $ 4,357,282
$ –
$ 4,357,282 $ (54,056) $ –
$ 4,303,226
Clough Global Opportunities Fund Total Return Swap Contracts $ 9,986,943
$ –
$ 9,986,943 $ (136,507) $ –
$ 9,850,436
Total $ 9,986,943
$ –
$ 9,986,943 $ (136,507) $ –
$ 9,850,436
Offsetting of Derivatives Liabilities
Gross Amounts Not Offset in the
Statements of Assets and Liabilities
Gross Amounts of Recognized Liabilities
Gross Amounts Offset in the
Statements of Assets and Liabilities
Net Amounts Presented in the
Statements of Assets and Liabilities
Financial Instruments(a)
Cash Collateral Pledged(a) Net Amount
Clough Global Dividend and Income Fund Total Return Swap Contracts $ –
$ –
$ – $ – $ –
$ –
Total $ –
$ –
$ – $ – $ –
$ –
Clough Global Equity Fund Total Return Swap Contracts $ 54,056
$ –
$ 54,056 $ (54,056) $ –
$ –
Total $ 54,056
$ –
$ 54,056 $ (54,056) $ –
$ –
Clough Global Opportunities Fund Total Return Swap Contracts $ 136,507
$ –
$ 136,507 $ (136,507) $ –
$ –
Total $ 136,507
$ –
$ 136,507 $ (136,507) $ –
$ –
(a) These amounts are limited to the derivative asset/liability balance and, accordingly, do not include excess collateral received/pledged, which is disclosed in the Statement of Investments.

Clough Global Funds Notes to Financial Statements October 31, 2017
Annual Report | October 31, 2017 45
Restricted and Illiquid Securities: Although the Funds will invest primarily in publicly traded securities, they may invest a portion of their assets
(generally, 5% of its value) in restricted securities and other investments which are illiquid. Restricted securities are securities that may not be sold to the public without an effective registration statement under the Securities Act of 1933, as amended (the "Securities Act") or, if they are unregistered, may be sold only in a privately negotiated transaction or pursuant to an exemption from registration.
The Funds may invest in securities for which there is no readily available trading market or which are otherwise illiquid. Illiquid securities include securities legally restricted as to resale, such as commercial paper issued pursuant to Section 4(2) of the Securities Act, and securities eligible for resale pursuant to Rule 144A thereunder. Section 4(2) and Rule 144A securities may, however, be treated as liquid by Clough pursuant to procedures adopted by the Board, which require consideration of factors such as trading activity, availability of market quotations and number of dealers willing to purchase the security. The restricted securities held at October 31, 2017 are identified below and are also presented in the Funds' Statement of Investments:
Fund Security % of
Net Assets Acquisition
Date Shares Cost Fair Value Clough Global Dividend and Income Fund Fairway Energy LP 0.51% 6/30/2015 130,700 $ 1,307,000 $ 773,744
Total 0.51% $ 1,307,000 $ 773,744
Clough Global Equity Fund Fairway Energy LP 0.51% 6/30/2015 217,600 $ 2,176,000 $ 1,288,192
Apellis Pharmaceuticals 0.12% 8/7/2017 56,297 308,731 308,731
Sienna Biopharmaceuticals ‐ Series B(a) 0.57% 4/12/2017 76,575 937,021 1,465,852
Total 1.20% $ 3,421,752 $ 3,062,775
Clough Global Opportunities Fund Fairway Energy LP 0.51% 6/30/2015 536,000 $ 5,360,000 $ 3,173,120 Apellis Pharmaceuticals 0.12% 8/7/2017 139,701 766,117 766,117 Sienna Biopharmaceuticals ‐ Series B(a) 0.59% 4/12/2017 190,624 2,332,592 3,649,058
Total 1.22% $ 8,458,709 $ 7,588,295
(a) The Fund also invests in unrestricted securities of the same issuer. The fair value of restricted securities is 58.80% and 59.15%, respectively, of
the total value of securities of the same issuer. Income Taxes: Each Fund’s policy is to comply with the provisions of the Internal Revenue Code applicable to regulated investment companies
and to distribute all of its taxable income to its shareholders. Therefore, no federal income tax provision is required. As of and during the year ended October 31, 2017, the Funds did not have a liability for any unrecognized tax benefits. The Funds recognize the interest and penalties, if any, related to the unrecognized tax benefits as income tax expense in the Statements of Operations. During the period, the Funds did not incur any interest or penalties. The Funds file U.S. federal, state, and local tax returns as required. The Funds’ tax returns are subject to examination by the relevant tax authorities until expiration of the applicable statute of limitations, which is generally three years after the filing of the tax return but which can be extended to six years in certain circumstances. Tax returns for open years have incorporated no uncertain tax positions that require a provision for income taxes. Certain foreign countries impose a capital gains tax which is accrued by the Funds based on the unrealized appreciation, if any, on affected securities. Any accrual would reduce a Fund’s NAV. The tax is paid when the gain is realized and is included in capital gains tax in the Statements of Operations.
Distributions to Shareholders: Each Fund intends to make a dividend distribution each month to Common Shareholders after payment of
interest on any outstanding borrowings. Any net capital gains earned by a Fund are distributed at least annually to the extent necessary to avoid federal income and excise taxes. Distributions to shareholders are recorded by each Fund on the ex‐dividend date. Each Fund has received approval from the Securities and Exchange Commission (the “Commission”) for exemption from Section 19(b) of the 1940 Act, and Rule 19b‐1 there under permitting each Fund to make periodic distributions of long‐term capital gains, provided that the distribution policy of a Fund with respect to its Common Shares calls for periodic (e.g. quarterly/monthly) distributions in an amount equal to a fixed percentage of each Fund’s average net asset value over a specified period of time or market price per common share at or about the time of distributions or pay‐out of a level dollar amount. Effective August 2017, each Fund’s Board approved a managed dividend distribution rate of 10% of each Fund’s prior month average NAV. Subject to certain conditions, these distribution policies will remain in effect through July 2019, when each Board might consider reducing the amount to not less than the average distribution rate of a peer group of closed‐end funds selected by the Board. During the fiscal year prior to August 2017,

Clough Global Funds Notes to Financial Statements October 31, 2017
46 www.cloughglobal.com
each Fund made the following level dividend distributions each month: Clough Global Dividend and Income Fund, $0.1032 per share on a monthly basis; Clough Global Equity Fund, $0.0989 on a monthly basis; and Clough Global Opportunities Fund, $0.0860 on a monthly basis.
Securities Transactions and Investment Income: Investment security transactions are accounted for on a trade date basis. Dividend income
and Dividend expense‐short sales are recorded on the ex‐dividend date. Certain dividend income from foreign securities will be recorded, in the exercise of reasonable diligence, as soon as a Fund is informed of the dividend if such information is obtained subsequent to the ex‐dividend date and may be subject to withholding taxes in these jurisdictions. Withholding taxes on foreign dividends are paid (a portion of which may be reclaimable) or provided for in accordance with the applicable country’s tax rules and rates and are disclosed in the Statements of Operations. Interest income, which includes amortization of premium and accretion of discount, is recorded on the accrual basis. Realized gains and losses from securities transactions and unrealized appreciation and depreciation of securities are determined using the identified cost basis for both financial reporting and income tax purposes.
Counterparty Risk: Each of the Funds run the risk that the issuer or guarantor of a fixed income security, the counterparty to an over‐the‐counter
derivatives contract, a borrower of each Fund’s securities or the obligor of an obligation underlying an asset‐backed security will be unable or unwilling to make timely principal, interest, or settlement payments or otherwise honor its obligations. In addition, to the extent that each of the Funds use over‐the‐counter derivatives, and/or has significant exposure to a single counterparty, this risk will be particularly pronounced for each of the Funds.
Other Risk Factors: Investing in the Funds may involve certain risks including, but not limited to, the following:
Unforeseen developments in market conditions may result in the decline of prices of, and the income generated by, the securities held by the Funds. These events may have adverse effects on the Funds such as a decline in the value and liquidity of many securities held by the Funds, and a decrease in net asset value. Such unforeseen developments may limit or preclude the Funds’ ability to achieve their investment objective. Investing in stocks may involve larger price fluctuation and greater potential for loss than other types of investments. This may cause the securities held by the Funds to be subject to larger short‐term declines in value. The Funds may have elements of risk due to concentrated investments in foreign issuers located in a specific country. Such concentrations may subject the Funds to additional risks resulting from future political or economic conditions and/or possible impositions of adverse foreign governmental laws or currency exchange restrictions. Investments in securities of non‐U.S. issuers have unique risks not present in securities of U.S. issuers, such as greater price volatility and less liquidity. Fixed income securities are subject to credit risk, which is the possibility that a security could have its credit rating downgraded or that the issuer of the security could fail to make timely payments or default on payments of interest or principal. Additionally, fixed income securities are subject to interest rate risk, meaning the decline in the price of debt securities that accompanies a rise in interest rates. Bonds with longer maturities are subject to greater price fluctuations than bonds with shorter maturities. The Funds invest in bonds which are rated below investment grade. These high yield bonds may be more susceptible than higher grade bonds to real or perceived adverse economic or industry conditions. The secondary market, on which high yield bonds are traded, may also be less liquid than the market for higher grade bonds.
2. TAXES
Classification of Distributions: Net investment income/(loss) and net realized gain/(loss) may differ for financial statement and tax purposes.
The character of distributions made during the year from net investment income or net realized gains may differ from its ultimate characterization for federal income tax purposes. Also, due to the timing of dividend distributions, the fiscal year in which amounts are distributed may differ from the fiscal year in which the income or realized gain was recorded by the Funds.

Clough Global Funds Notes to Financial Statements October 31, 2017
Annual Report | October 31, 2017 47
The tax character of the distributions paid by the Funds during the years ended October 31, 2017 and October 31, 2016, were as follows:
Ordinary Income
Long-Term Capital Gains Return of Capital Total
Clough Global Dividend and Income Fund October 31, 2017 $ 3,908,415 $ – $ 9,527,880
$ 13,436,295October 31, 2016 – 6,159,918 8,281,647
14,441,565Clough Global Equity Fund
October 31, 2017 $ 2,298,935 $ – $ 19,645,484
$ 21,944,419October 31, 2016 – 15,868,789 7,640,117
23,508,906Clough Global Opportunities Fund
October 31, 2017 $ 6,976,864 $ – $ 48,235,156
$ 55,212,020October 31, 2016 – 9,287,743 50,435,017
59,722,760
Components of Earnings: Tax components of distributable earnings are determined in accordance with income tax regulations which may differ
from composition of net assets reported under accounting principles generally accepted in the United States. Accordingly, for the year ended October 31, 2017, certain differences were reclassified. These differences relate primarily to the differing tax treatment of passive foreign investment companies (PFICs), foreign currencies, partnerships, paydowns and certain other investments. The reclassifications were as follows:
Undistributed Ordinary Income
Accumulated Capital Loss Paid-in Capital
Clough Global Dividend and Income Fund $ 33,827 $ (30,580) $ (3,247)
Clough Global Equity Fund 3,086 3,029 (6,115)
Clough Global Opportunities Fund 264,851 (249,790) (15,061)
Capital loss carryovers used during the year ended October 31, 2017, were:
Fund Amount Clough Global Dividend and Income Fund $ 4,726,787
Clough Global Equity Fund 15,278,865
Clough Global Opportunities Fund 26,723,033
Capital losses deferred to the year ending October 31, 2018 were as follows:
Fund Non-Expiring Short-Term
Non-Expiring Long-Term
Clough Global Dividend and Income Fund $ 7,656,856 $ –
Clough Global Equity Fund 6,150,225 –
Clough Global Opportunities Fund 43,260,709 –
The Funds elect to defer to the year ending October 31, 2018, late year ordinary losses in the amounts of:
Fund Amount Clough Global Equity Fund $ 407,573
Clough Global Opportunities Fund 903,150

Clough Global Funds Notes to Financial Statements October 31, 2017
48 www.cloughglobal.com
Tax Basis of Distributable Earnings: Tax components of distributable earnings are determined in accordance with income tax regulations which
may differ from composition of net assets reported under GAAP.
As of October 31, 2017, the components of distributable earnings on a tax basis were as follows:
Clough Global Dividend
and Income Fund Clough Global Equity
Fund Clough Global
Opportunities Fund Accumulated net realized loss on investments $ (7,656,856) $ (6,150,225) $ (43,260,709)
Net unrealized appreciation on investments 15,801,447 34,417,900 72,058,523
Other accumulated losses (35,006) (465,851) (1,046,706)
Total $ 8,109,585 $ 27,801,824 $ 27,751,108
Tax Basis of Investments: Net unrealized appreciation/(depreciation) of investments based on federal tax cost as of October 31, 2017, were
as follows:
Clough Global Dividend and Income
Fund Clough Global Equity
Fund Clough Global
Opportunities Fund Gross appreciation (excess of value over tax cost)(a) $ 30,014,112 $ 63,759,324
$ 138,246,620 Gross depreciation (excess of tax cost over value)(a) (14,211,502) (29,339,310)
(66,182,974) Net depreciation (excess of tax cost over value) of foreign currency and derivatives (1,163) (2,114)
(5,123)
Net unrealized appreciation $ 15,801,447 $ 34,417,900
$ 72,058,523
Cost of investments for income tax purposes $ 201,112,717 $ 318,396,876
$ 806,952,815
(a) Includes appreciation/(depreciation) on securities sold short. The difference between book and tax basis unrealized appreciation is attributable primarily to wash sales and tax treatment of certain other investments.
3. CAPITAL TRANSACTIONS
Common Shares: There are an unlimited number of no par value common shares of beneficial interest authorized for each Fund.
The Board of each Fund announced, on April 20, 2015, that it had approved a share repurchase program in accordance with Section 23(c) of the 1940 Act. Under the share repurchase program, each Fund may purchase up to 5% of its outstanding common shares as of April 9, 2015, in the open market, through the Funds’ fiscal year end of October 31, 2015. The Board of Trustees of each Fund approved, in October 2015, to extend the share repurchase program through the Funds’ fiscal year end of October 31, 2016. The Board of each Fund approved, in December 2016, to extend the share repurchase program through the Funds’ fiscal year end of October 31, 2017. In April 2017, the Board temporarily suspended the share repurchase program in light of prevailing discount rates.
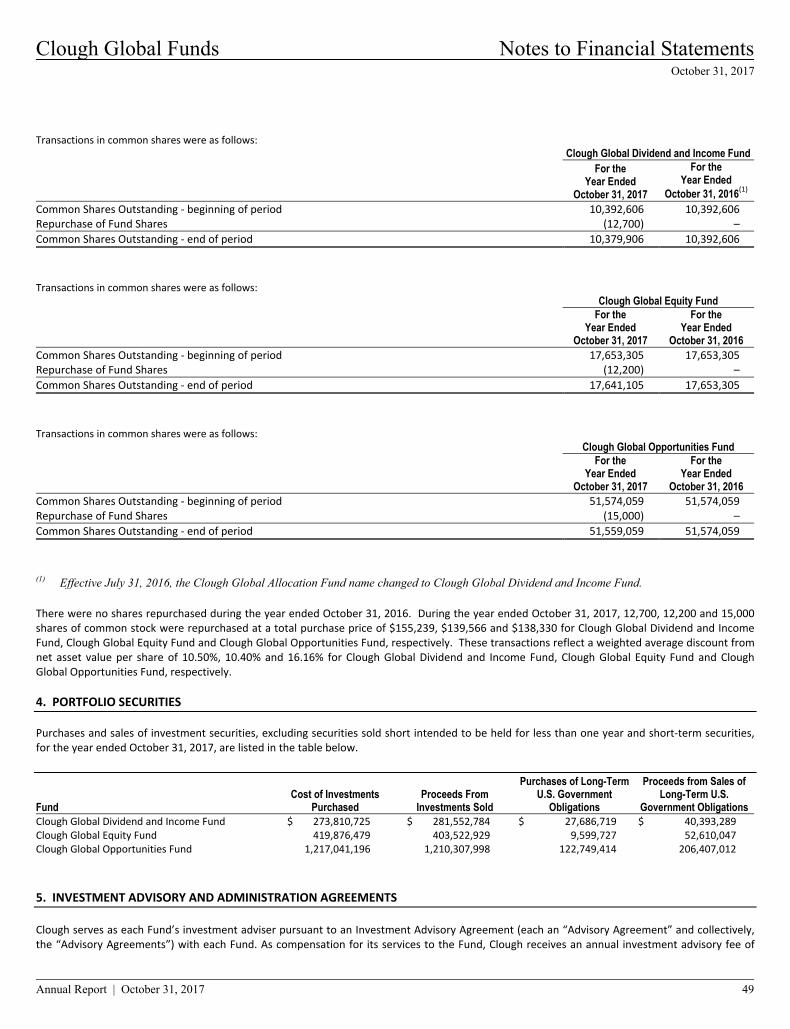
Clough Global Funds Notes to Financial Statements October 31, 2017
Annual Report | October 31, 2017 49
Transactions in common shares were as follows: Clough Global Dividend and Income Fund
For the Year Ended
October 31, 2017
For the Year Ended
October 31, 2016(1) Common Shares Outstanding ‐ beginning of period 10,392,606
10,392,606 Repurchase of Fund Shares (12,700)
–
Common Shares Outstanding ‐ end of period 10,379,906
10,392,606
Transactions in common shares were as follows: Clough Global Equity Fund
For the Year Ended
October 31, 2017
For the Year Ended
October 31, 2016 Common Shares Outstanding ‐ beginning of period 17,653,305
17,653,305 Repurchase of Fund Shares (12,200)
–
Common Shares Outstanding ‐ end of period 17,641,105
17,653,305
Transactions in common shares were as follows: Clough Global Opportunities Fund
For the Year Ended
October 31, 2017
For the Year Ended
October 31, 2016 Common Shares Outstanding ‐ beginning of period 51,574,059
51,574,059 Repurchase of Fund Shares (15,000)
–
Common Shares Outstanding ‐ end of period 51,559,059
51,574,059
(1) Effective July 31, 2016, the Clough Global Allocation Fund name changed to Clough Global Dividend and Income Fund.
There were no shares repurchased during the year ended October 31, 2016. During the year ended October 31, 2017, 12,700, 12,200 and 15,000 shares of common stock were repurchased at a total purchase price of $155,239, $139,566 and $138,330 for Clough Global Dividend and Income Fund, Clough Global Equity Fund and Clough Global Opportunities Fund, respectively. These transactions reflect a weighted average discount from net asset value per share of 10.50%, 10.40% and 16.16% for Clough Global Dividend and Income Fund, Clough Global Equity Fund and Clough Global Opportunities Fund, respectively.
4. PORTFOLIO SECURITIES Purchases and sales of investment securities, excluding securities sold short intended to be held for less than one year and short‐term securities, for the year ended October 31, 2017, are listed in the table below.
Fund Cost of Investments
Purchased Proceeds From
Investments Sold
Purchases of Long-Term U.S. Government
Obligations
Proceeds from Sales of Long-Term U.S.
Government Obligations Clough Global Dividend and Income Fund $ 273,810,725
$ 281,552,784 $ 27,686,719 $ 40,393,289
Clough Global Equity Fund 419,876,479
403,522,929 9,599,727 52,610,047
Clough Global Opportunities Fund 1,217,041,196
1,210,307,998 122,749,414 206,407,012
5. INVESTMENT ADVISORY AND ADMINISTRATION AGREEMENTS
Clough serves as each Fund’s investment adviser pursuant to an Investment Advisory Agreement (each an “Advisory Agreement” and collectively, the “Advisory Agreements”) with each Fund. As compensation for its services to the Fund, Clough receives an annual investment advisory fee of

Clough Global Funds Notes to Financial Statements October 31, 2017
50 www.cloughglobal.com
0.70%, 0.90% and 1.00% based on Clough Global Dividend and Income Fund’s, Clough Global Equity Fund’s and Clough Global Opportunities Fund’s, respectively, average daily total assets, computed daily and payable monthly. ALPS Fund Services, Inc. (“ALPS”) serves as each Fund’s administrator pursuant to an Administration, Bookkeeping and Pricing Services Agreement with each Fund. As compensation for its services to each Fund, ALPS receives an annual administration fee based on each Fund’s average daily total assets, computed daily and payable monthly. ALPS will pay all expenses incurred by each Fund, with the exception of advisory fees, trustees’ fees, portfolio transaction expenses, litigation expenses, taxes, expenses of conducting repurchase offers for the purpose of repurchasing fund shares, costs of preferred shares, and extraordinary expenses. Both Clough and ALPS are considered to be “affiliates” of the Funds as defined in the 1940 Act. 6. COMMITTED FACILITY AGREEMENT AND LENDING AGREEMENT Each Fund entered into a financing package that includes a Committed Facility Agreement (the “Agreement”) dated January 16, 2009, as amended, between each Fund and BNP Paribas Prime Brokerage, Inc. (“BNP”) that allows each Fund to borrow funds from BNP. Each Fund is currently borrowing the maximum commitment covered by the agreement. Each Fund entered a Special Custody and Pledge Agreement (the “Pledge Agreement”) dated December 9, 2013, as amended, between each Fund, the Funds’ custodian, and BNP. As of October 31, 2016, the Pledge Agreement was assigned from BNP to BNP Paribas Prime Brokerage International, Ltd. Per the Pledge Agreement, borrowings under the Agreement are secured by assets of each Fund that are held by the Fund’s custodian in a separate account (the “pledged collateral”) valued at $132,394,606, $216,339,991 and $583,205,558 for the Clough Global Dividend and Income Fund, Clough Global Equity Fund and Clough Global Opportunities Fund, respectively. Each Fund may, with 30 days notice, reduce the Maximum Commitment Financing (Initial Limit amount plus the increased borrowing amount in excess of the Initial Limit) to a lesser amount if drawing on the full amount would result in a violation of the applicable asset coverage requirement of Section 18 of the 1940 Act. Interest is charged at the three month LIBOR (London Inter‐bank Offered Rate) plus 0.70% on the amount borrowed and 0.65% on the undrawn balance. Each Fund also pays a one‐time arrangement fee of 0.25% on (i) the Initial Limit and (ii) any increased borrowing amount in the excess of the Initial Limit, paid in monthly installments for the six months immediately following the date on which borrowings were drawn by the Fund. The Agreement was amended on October 31, 2016, to decrease the Maximum Commitment Financing, effective October 28, 2016, to $72,000,000, $113,000,000 and $292,000,000 for the Clough Global Dividend and Income Fund, Clough Global Equity Fund and the Clough Global Opportunities Fund, respectively. Prior to October 28, 2016 the Maximum Commitment Financing was $93,300,000, $156,000,000 and $388,900,000 for the Clough Global Dividend and Income Fund, Clough Global Equity Fund and the Clough Global Opportunities Fund, respectively. For the year ended October 31, 2017, the average borrowings outstanding for Clough Global Dividend and Income Fund, Clough Global Equity Fund and Clough Global Opportunities Fund under the agreement were $72,000,000, $113,000,000 and $292,000,000, respectively, and the average interest rate for the borrowings was 1.88%. As of October 31, 2017, the outstanding borrowings for Clough Global Dividend and Income Fund, Clough Global Equity Fund and Clough Global Opportunities Fund were $72,000,000, $113,000,000 and $292,000,000, respectively. The interest rate applicable to the borrowings of Clough Global Dividend and Income Fund, Clough Global Equity Fund and Clough Global Opportunities Fund on October 31, 2017, was 2.08%. The Lending Agreement is a separate side‐agreement between each Fund and BNP pursuant to which BNP may borrow a portion of the pledged collateral (the “Lent Securities”) in an amount not to exceed the outstanding borrowings owed by a Fund to BNP under the Agreement. The Lending Agreement is intended to permit each Fund to significantly reduce the cost of its borrowings under the Agreement. BNP has the ability to re‐register the Lent Securities in its own name or in another name other than the Fund to pledge, re‐pledge, sell, lend or otherwise transfer or use the collateral with all attendant rights of ownership. (It is each Fund’s understanding that BNP will perform due diligence to determine the creditworthiness of any party that borrows Lent Securities from BNP.) Each Fund may designate any security within the pledged collateral as ineligible to be a Lent Security, provided there are eligible securities within the pledged collateral in an amount equal to the outstanding borrowing owed by a Fund. During the year in which the Lent Securities are outstanding, BNP must remit payment to each Fund equal to the amount of all dividends, interest or other distributions earned or made by the Lent Securities. Under the terms of the Lending Agreement, the Lent Securities are marked to market daily, and if the value of the Lent Securities exceeds the value of the then‐outstanding borrowings owed by a Fund to BNP under the Agreement (the “Current Borrowings”), BNP must, on that day, either (1) return Lent Securities to each Fund’s custodian in an amount sufficient to cause the value of the outstanding Lent Securities to equal the Current Borrowings; or (2) post cash collateral with each Fund’s custodian equal to the difference between the value of the Lent Securities and the value of the Current Borrowings. If BNP fails to perform either of these actions as required, each Fund will recall securities, as discussed below, in an amount sufficient to cause the value of the outstanding Lent Securities to equal the Current Borrowings. Each Fund can recall any of the Lent Securities and BNP shall, to the extent commercially possible, return such security or equivalent security to each Fund’s custodian no later than three business days after such request. If a Fund recalls a Lent Security pursuant to the Lending Agreement, and BNP fails to return the Lent Securities or equivalent securities in a timely fashion, BNP shall remain liable for the ultimate delivery to each Fund’s custodian of such Lent Securities, or equivalent securities, and for any buy‐in costs that the executing broker for the sales transaction may impose with respect to the failure to deliver. Should the borrower of the securities fail financially, the Funds have the right to reduce the outstanding amount of the Current Borrowings against which the pledged collateral has been secured. Although risk is mitigated by the collateral, the Funds could experience a

Clough Global Funds Notes to Financial Statements October 31, 2017
Annual Report | October 31, 2017 51
delay in recovering their securities and possible loss of income or value if the borrower fails to return the borrowed securities. Under the terms of the Lending Agreement, each Fund shall have the right to apply and set‐off an amount equal to one hundred percent (100%) of the then current fair value of such Lent Securities against the Current Borrowings. As of October 31, 2017, the value of the Lent Securities for Clough Global Dividend and Income Fund, Clough Global Equity Fund and Clough Global Opportunities Fund were $66,103,328, $99,173,783 and $256,933,010, respectively. The Board has approved each Agreement and the Lending Agreement. No violations of the Agreement or the Lending Agreement have occurred during the year ended October 31, 2017. Each Fund receives income from BNP based on the value of the Lent Securities. This income is recorded as Hypothecated securities income on the Statements of Operations. The interest incurred on borrowed amounts is recorded as Interest on loan in the Statements of Operations, a part of Total Expenses. 7. OTHER The Independent Trustees of each Fund receive from each Fund a quarterly retainer of $3,500 and an additional $1,500 for each board meeting attended. The Chairman of the Board of each Fund receives a quarterly retainer from each Fund of $4,200 and an additional $1,800 for each board meeting attended. The Chairman of the Audit Committee of each Fund receives a quarterly retainer from each Fund of $3,850 and an additional $1,650 for each board meeting attended. The per‐meeting fees for each special telephonic board meeting are as follows: (i) $500 for each Independent Trustee; (ii) $600 for the Chairman of the Board; and (iii) $550 for the Chairman of the Audit Committee. The Independent Trustees will continue to not receive any additional fees for in‐person or telephonic committee meetings. 8. RECENT ACCOUNTING PRONOUNCEMENT In December 2016, the Financial Accounting Standards Board ("FASB") issued Accounting Standards Update (“ASU”) 2016‐19, “Technical Corrections and Improvements.” It includes an update to Accounting Standards Codification Topic 820 (“Topic 820”), Fair Value Measurement. The update to Topic 820 clarifies the difference between a valuation approach and a valuation technique. It also requires disclosure when there has been a change in either or both a valuation approach and/or a valuation technique. The changes related to Topic 820 are effective for annual reporting periods, including interim periods within those annual periods, beginning after December 15, 2016. Management is currently evaluating the impact of the ASU to the financial statements. 9. SUBSEQUENT EVENT On October 13, 2017 the Funds commenced tender offers which expired on November 10, 2017. Each Fund’s tender offer was oversubscribed, and as a result, Clough Global Equity Fund and Clough Global Opportunities Fund purchased 37.5% of its respective outstanding common shares of beneficial interest and Clough Global Dividend and Income Fund purchased 32.5% of its outstanding common shares of beneficial interest. A total of 4,998,066, 10,052,547 and 31,646,419 shares, for Clough Global Dividend and Income Fund, Clough Global Equity Fund and Clough Global Opportunities Fund, respectively, were properly tendered and not withdrawn. The Funds accepted 3,373,469, 6,615,414 and 19,334,647 shares, for Clough Global Dividend and Income Fund, Clough Global Equity Fund and Clough Global Opportunities Fund, respectively, for cash payment totaling $49,421,321, $95,394,270 and $232,209,110 at a purchase price of $14.65, $14.42 and $12.01 per common share for Clough Global Dividend and Income Fund, Clough Global Equity Fund and Clough Global Opportunities Fund, respectively, which is 98.5% of the net asset value per common share determined as of the close of the regular trading session of the New York Stock Exchange on November 13, 2017. Accordingly, on a pro rata basis, Clough Global Dividend and Income Fund, Clough Global Equity Fund and Clough Global Opportunities Fund accepted approximately 67%, 66% and 61%, respectively, of the shares properly tendered. The Committed Facility Agreement was amended on November 2, 2017, to decrease the Maximum Commitment Financing, effective November 15, 2017, to $55,000,000, $85,000,000 and $207,000,000 for the Clough Global Dividend and Income Fund, Clough Global Equity Fund and the Clough Global Opportunities Fund, respectively.

Report of Independent Registered Public Accounting Firm
52 www.cloughglobal.com
To the Shareholders and Board of Trustees of Clough Global Dividend and Income Fund, Clough Global Equity Fund, and Clough Global Opportunities Fund We have audited the accompanying statements of assets and liabilities, including the statements of investments, of Clough Global Dividend and Income Fund, Clough Global Equity Fund, and Clough Global Opportunities Fund (each a “Fund”, collectively the “Funds”) as of October 31, 2017, and the related statements of operations and cash flows for the year then ended, the statements of changes in net assets for each of the two years in the period then ended, and the financial highlights for each of the six periods in the period then ended. These financial statements and financial highlights are the responsibility of the Funds’ management. Our responsibility is to express an opinion on these financial statements and financial highlights based on our audits. We conducted our audits in accordance with the standards of the Public Company Accounting Oversight Board (United States). Those standards require that we plan and perform the audit to obtain reasonable assurance about whether the financial statements and financial highlights are free of material misstatement. An audit includes examining, on a test basis, evidence supporting the amounts and disclosures in the financial statements. Our procedures included confirmation of securities owned as of October 31, 2017, by correspondence with the custodian, issuer, transfer agent, and brokers or by other appropriate auditing procedures where replies from brokers or counterparties were not received. An audit also includes assessing the accounting principles used and significant estimates made by management, as well as evaluating the overall financial statement presentation. We believe that our audits provide a reasonable basis for our opinion. In our opinion, the financial statements and financial highlights referred to above present fairly, in all material respects, the financial position of Clough Global Dividend and Income Fund, Clough Global Equity Fund, and Clough Global Opportunities Fund as of October 31, 2017, the results of their operations and cash flows for the year then ended, the changes in their net assets for each of the two years in the period then ended, and the financial highlights for each of the six periods in the period then ended, in conformity with accounting principles generally accepted in the United States of America.
COHEN & COMPANY, LTD. Cleveland, Ohio December 20, 2017
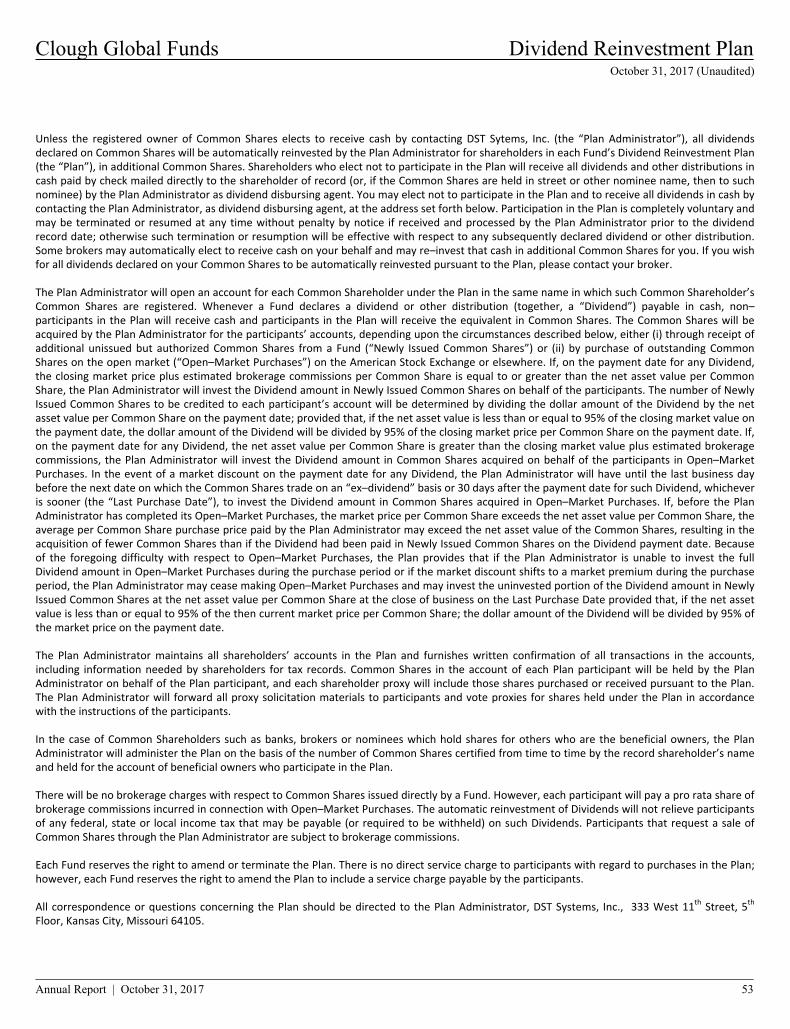
Clough Global Funds Dividend Reinvestment Plan October 31, 2017 (Unaudited)
Annual Report | October 31, 2017 53
Unless the registered owner of Common Shares elects to receive cash by contacting DST Sytems, Inc. (the “Plan Administrator”), all dividends declared on Common Shares will be automatically reinvested by the Plan Administrator for shareholders in each Fund’s Dividend Reinvestment Plan (the “Plan”), in additional Common Shares. Shareholders who elect not to participate in the Plan will receive all dividends and other distributions in cash paid by check mailed directly to the shareholder of record (or, if the Common Shares are held in street or other nominee name, then to such nominee) by the Plan Administrator as dividend disbursing agent. You may elect not to participate in the Plan and to receive all dividends in cash by contacting the Plan Administrator, as dividend disbursing agent, at the address set forth below. Participation in the Plan is completely voluntary and may be terminated or resumed at any time without penalty by notice if received and processed by the Plan Administrator prior to the dividend record date; otherwise such termination or resumption will be effective with respect to any subsequently declared dividend or other distribution. Some brokers may automatically elect to receive cash on your behalf and may re–invest that cash in additional Common Shares for you. If you wish for all dividends declared on your Common Shares to be automatically reinvested pursuant to the Plan, please contact your broker. The Plan Administrator will open an account for each Common Shareholder under the Plan in the same name in which such Common Shareholder’s Common Shares are registered. Whenever a Fund declares a dividend or other distribution (together, a “Dividend”) payable in cash, non–participants in the Plan will receive cash and participants in the Plan will receive the equivalent in Common Shares. The Common Shares will be acquired by the Plan Administrator for the participants’ accounts, depending upon the circumstances described below, either (i) through receipt of additional unissued but authorized Common Shares from a Fund (“Newly Issued Common Shares”) or (ii) by purchase of outstanding Common Shares on the open market (“Open–Market Purchases”) on the American Stock Exchange or elsewhere. If, on the payment date for any Dividend, the closing market price plus estimated brokerage commissions per Common Share is equal to or greater than the net asset value per Common Share, the Plan Administrator will invest the Dividend amount in Newly Issued Common Shares on behalf of the participants. The number of Newly Issued Common Shares to be credited to each participant’s account will be determined by dividing the dollar amount of the Dividend by the net asset value per Common Share on the payment date; provided that, if the net asset value is less than or equal to 95% of the closing market value on the payment date, the dollar amount of the Dividend will be divided by 95% of the closing market price per Common Share on the payment date. If, on the payment date for any Dividend, the net asset value per Common Share is greater than the closing market value plus estimated brokerage commissions, the Plan Administrator will invest the Dividend amount in Common Shares acquired on behalf of the participants in Open–Market Purchases. In the event of a market discount on the payment date for any Dividend, the Plan Administrator will have until the last business day before the next date on which the Common Shares trade on an “ex–dividend” basis or 30 days after the payment date for such Dividend, whichever is sooner (the “Last Purchase Date”), to invest the Dividend amount in Common Shares acquired in Open–Market Purchases. If, before the Plan Administrator has completed its Open–Market Purchases, the market price per Common Share exceeds the net asset value per Common Share, the average per Common Share purchase price paid by the Plan Administrator may exceed the net asset value of the Common Shares, resulting in the acquisition of fewer Common Shares than if the Dividend had been paid in Newly Issued Common Shares on the Dividend payment date. Because of the foregoing difficulty with respect to Open–Market Purchases, the Plan provides that if the Plan Administrator is unable to invest the full Dividend amount in Open–Market Purchases during the purchase period or if the market discount shifts to a market premium during the purchase period, the Plan Administrator may cease making Open–Market Purchases and may invest the uninvested portion of the Dividend amount in Newly Issued Common Shares at the net asset value per Common Share at the close of business on the Last Purchase Date provided that, if the net asset value is less than or equal to 95% of the then current market price per Common Share; the dollar amount of the Dividend will be divided by 95% of the market price on the payment date. The Plan Administrator maintains all shareholders’ accounts in the Plan and furnishes written confirmation of all transactions in the accounts, including information needed by shareholders for tax records. Common Shares in the account of each Plan participant will be held by the Plan Administrator on behalf of the Plan participant, and each shareholder proxy will include those shares purchased or received pursuant to the Plan. The Plan Administrator will forward all proxy solicitation materials to participants and vote proxies for shares held under the Plan in accordance with the instructions of the participants. In the case of Common Shareholders such as banks, brokers or nominees which hold shares for others who are the beneficial owners, the Plan Administrator will administer the Plan on the basis of the number of Common Shares certified from time to time by the record shareholder’s name and held for the account of beneficial owners who participate in the Plan. There will be no brokerage charges with respect to Common Shares issued directly by a Fund. However, each participant will pay a pro rata share of brokerage commissions incurred in connection with Open–Market Purchases. The automatic reinvestment of Dividends will not relieve participants of any federal, state or local income tax that may be payable (or required to be withheld) on such Dividends. Participants that request a sale of Common Shares through the Plan Administrator are subject to brokerage commissions. Each Fund reserves the right to amend or terminate the Plan. There is no direct service charge to participants with regard to purchases in the Plan; however, each Fund reserves the right to amend the Plan to include a service charge payable by the participants. All correspondence or questions concerning the Plan should be directed to the Plan Administrator, DST Systems, Inc., 333 West 11
th Street, 5th Floor, Kansas City, Missouri 64105.

Clough Global Funds Additional Information October 31, 2017 (Unaudited)
54 www.cloughglobal.com
FUND PROXY VOTING POLICIES & PROCEDURES
Each Fund’s policies and procedures used in determining how to vote proxies relating to portfolio securities are available on the Funds’ website at http://www.cloughglobal.com. Information regarding how each Fund voted proxies relating to portfolio securities held by each Fund for the period ended June 30, are available without charge, upon request, by contacting the Funds at 1‐877‐256‐8445 and on the Commission’s website at http://www.sec.gov.
PORTFOLIO HOLDINGS
The Funds file their complete schedule of portfolio holdings with the Commission for the first and third quarters of each fiscal year on Form N–Q within 60 days after the end of the period. Copies of the Funds’ Form N–Q are available without a charge, upon request, by contacting the Funds at 1–877–256–8445 and on the Commission’s website at http://www.sec.gov. You may also review and copy Form N–Q at the Commission’s Public Reference Room in Washington, D.C. For more information about the operation of the Public Reference Room, please call the Commission at 1–800–SEC–0330.
NOTICE
Notice is hereby given in accordance with Section 23(c) of the Investment Company Act of 1940 that each Fund may purchase at market prices from time to time shares of its common stock in the open market.
SHAREHOLDER MEETING
On August 3, 2017, the Funds held their annual meeting of Shareholders for the purpose of voting on a proposal to elect Trustees of the Funds. The results of the proposal for each Fund were as follows:
Clough Global Dividend and Income Fund Proposal: To elect the following trustees to the Clough Global Dividend and Income Fund Board. Adam Crescenzi Jerry Rutledge
For 6,024,371 6,025,131 Withheld 154,353 153,593
Clough Global Equity Fund Proposal: To elect the following trustees to the Clough Global Equity Fund Board. Edmund Burke Vincent Versaci Clifford Weber
For 11,374,507 11,376,427 11,376,758 Withheld 296,591 294,671 294,340
Clough Global Opportunities Fund Proposal: To elect the following trustees to the Clough Global Opportunities Fund Board. Robert Butler Karen DiGravio Kevin McNally
For 30,118,163 30,148,030 30,145,641 Withheld 1,874,256 1,844,389 1,846,778
SECTION 19(A) NOTICES
The following table sets forth the estimated amount of the sources of distribution for purposes of Section 19 of the Investment Company Act of 1940, as amended, and the related rules adopted there under. Each Fund estimates the following percentages, of the total distribution amount per share, attributable to (i) current and prior fiscal year net investment income, (ii) net realized short‐term capital gain, (iii) net realized long‐term capital gain and (iv) return of capital or other capital source as a percentage of the total distribution amount. These percentages are disclosed for the fiscal year‐to‐date cumulative distribution amount per share for each Fund. The amounts and sources of distributions reported in these 19(a) notices are only estimates and not for tax reporting purposes. The actual amounts and sources of the amounts for tax reporting purposes will depend upon the Fund’s investment experience during the remainder of its fiscal year and may be subject to changes based on tax regulations. The Fund will send you a Form 1099‐DIV for the calendar year that will tell you how to report these distributions for federal income tax purposes.

Clough Global Funds Additional Information October 31, 2017 (Unaudited)
Annual Report | October 31, 2017 55
Total Cumulative Distributions for the year
ended October 31, 2017 % Breakdown of the Total Cumulative Distributions for
the year ended October 31, 2017
Net Investment
Income
Net Realized Capital Gains
Return of Capital
Total Per Common
Share
Net Investment
Income
Net Realized Capital Gains
Return of Capital
Total Per Common
Share Clough Global Dividend and Income Fund $ 0.2098 $ 0.00000 $ 1.0844 $ 1.2942 16.21% 0.00% 83.79% 100.00%
Clough Global Equity Fund $ 0.0653 $ 0.00000 $ 1.1785 $ 1.2438 5.25% 0.00% 94.75% 100.00%
Clough Global Opportunities Fund $ 0.0312 $ 0.00000 $ 1.0396 $ 1.0708 2.91% 0.00% 97.09% 100.00% Each Fund’s dividend policy is to distribute all or a portion of its net investment income to its shareholders on a monthly basis. In order to provide shareholders with a more stable level of dividend distributions, each Fund may at times pay out less than the entire amount of net investment income earned in any particular month and may at times in any particular month pay out such accumulated but undistributed income in addition to net investment income earned in that month. As a result, the dividends paid by each Fund for any particular month may be more or less than the amount of net investment income earned by the Fund during such month. Each Fund’s current accumulated but undistributed net investment income, if any, is disclosed in the Statements of Assets and Liabilities, which comprises part of the financial information included in this report.
TAX DESIGNATIONS
The Funds hereby designate the following as a percentage of taxable ordinary income distributions, or up to the maximum amount allowable, for the calendar year ended December 31, 2016:
Clough Global Dividend and Income Fund Clough Global Equity Fund
Clough Global Opportunities Fund
Corporate Dividends Received Deduction 22.59% 0.00% 0.00%
Qualified Dividend Income 35.72% 0.00% 0.00%
Please consult a tax advisor if you have questions about federal or state income tax laws, or how to prepare your tax returns.

Clough Global Funds Trustees & Officers October 31, 2017 (Unaudited)
56 www.cloughglobal.com
Name, Address1 and Year of Birth
Position(s) Held with the Fund
Term of office and length of service with
the Fund2 Principal Occupation(s) During Past Five Years
Number of Portfolios in
Fund Complex Overseen by
Trustee3
Other Directorships Held by Trustee During the Past
Five Years Non-Interested Trustees/Nominees Robert L. Butler 1941
Chairman of the Board and Trustee
Trustee since: GLV: 2004 GLQ: 2005 GLO: 2006 Term expires: GLV: 2018 GLQ: 2019 GLO: 2020
Since 2001, Mr. Butler has been an independent consultant for businesses. Mr. Butler has over 45 years’ experience in the investment business, including 17 years as a senior executive with a global investment management/natural resources company and 20 years with a securities industry regulation organization.
3 None
Adam D. Crescenzi 1942
Trustee
Trustee since: GLV: 2004 GLQ: 2005 GLO: 2006 Term expires: GLV: 2020 GLQ: 2018 GLO: 2019
Mr. Crescenzi has served as the Founding Partner of Simply Tuscan Imports LLC since 2007. He has been a founder and investor of several start‐up technology and service firms. He currently serves as an Associate Trustee of Dean College and previously served as a Trustee from 2003 to 2015. He also serves as a Director of two non‐profit organizations and as a member of the Board of Governors for the Naples Botanical Gardens and the Club Pelican Bay. He retired from CSC Index as Executive Vice‐President of Management Consulting Services.
3 None
Karen DiGravio 1969
Trustee
Trustee since: GLV: 2017 GLQ: 2017 GLO: 2017 Term expires: GLV: 2018 GLQ: 2019 GLO: 2020
Ms. DiGravio was a Partner, Chief Financial Officer and Chief Compliance Officer of Westfield Capital Management. Thereafter, she served as a member of the Westfield Advisory Board until 2015. Ms. DiGravio is co‐chair of Connecticut College’s 1911 Society and is also a member of the college’s President’s Leadership Council.
3 None
Jerry G. Rutledge 1944
Trustee Trustee since: GLV: 2004 GLQ: 2005 GLO: 2006 Term expires: GLV: 2020 GLQ: 2018 GLO: 2019
Mr. Rutledge is the President and owner of Rutledge’s Inc., a retail clothing business. Mr. Rutledge was from 1994 to 2007 a Regent of the University of Colorado. In addition, Mr. Rutledge is currently serving as a Director of the University of Colorado Hospital. Mr. Rutledge also served as a Director of the American National Bank from 1985 to 2009.
3 Mr. Rutledge is currently a Trustee of the Financial Investors Trust and the Principal Real Estate Income Fund.

Clough Global Funds Trustees & Officers October 31, 2017 (Unaudited)
Annual Report | October 31, 2017 57
Name, Address1 and Year of Birth
Position(s) Held with the Fund
Term of office and length of service with
the Fund2 Principal Occupation(s) During Past Five Years
Number of Portfolios in
Fund Complex Overseen by
Trustee3
Other Directorships Held by Trustee During the Past
Five Years Non-Interested Trustees/Nominees Hon. Vincent W. Versaci 1971
Trustee Nominee
Trustee since: GLV: 2013 GLQ: 2013 GLO: 2013 Term expires: GLV: 2019 GLQ: 2020 GLO: 2018
Judge Versaci has served as a Judge in the New York State Courts since January 2003. Currently, Judge Versaci is assigned as an Acting Supreme Court Justice and also presides over the Surrogate’s Court for Schenectady County, New York. Previously, Judge Versaci has served as an Adjunct Professor at Schenectady County Community College and a practicing attorney with an emphasis on civil and criminal litigation primarily in New York State Courts.
3 None
Clifford J. Weber 1963
Trustee Trustee since: GLV: 2017 GLQ: 2017 GLO: 2017 Term expires: GLV: 2019 GLQ: 2020 GLO: 2018
Mr. Weber is the founder of Financial Products Consulting Group, LLC (a consulting firm). Prior to starting Financial Products Consulting Group, he was the Executive Vice President – Global Index and Exchange Traded Products of the NYSE, a subsidiary of Intercontinental Exchange, from 2013 to 2015. Previously, Mr. Weber was the Executive Vice President – Head of Strategy and Product Development of NYSE Liffe U.S., a division of NYSE Euronext, from 2008 to 2013, and held various positions with the American Stock Exchange from 1990 to 2008.
4 Mr. Weber is currently a Trustee of Clough Funds Trust, Janus Detroit Street Trust, Clayton Street Trust, Elevation ETF Trust.

Clough Global Funds Trustees & Officers October 31, 2017 (Unaudited)
58 www.cloughglobal.com
Name, Address1 and Year of Birth
Position(s) Held with the Fund
Term of office and length of service with
the Fund2 Principal Occupation(s) During Past Five Years
Number of Portfolios in
Fund Complex Overseen by
Trustee3
Other Directorships Held by Trustee During the Past
Five Years Interested Trustees4 / Nominees Edmund J. Burke5 1961
Trustee and President
Trustee since: GLV: 2006 GLQ: 2006 GLO: 2006 Term expires: GLV: 2019 GLQ: 2020 GLO: 2018 President: GLV: 2004 GLQ: 2005 GLO: 2006
Mr. Burke joined ALPS in 1991 and is currently Director and President of ALPS Holdings, Inc. (a wholly‐owned subsidiary of DST), and President and Director of ALPS Advisors, Inc., and Director of ALPS Distributors, Inc., ALPS Fund Services, Inc., and ALPS Portfolio Solutions Distributor, Inc. Mr. Burke is also Director of Boston Financial Data Services. Mr. Burke is deemed an affiliate of the Fund as defined under the 1940 Act.
5 Mr. Burke is also Trustee and President of Financial Investors Trust, ALPS ETF Trust, and Clough Funds Trust, a Trustee and Vice President of the Liberty All‐Star Equity Fund, Trustee, and is a Director and Vice President of the Liberty All‐Star Growth Fund, Inc.
Kevin McNally 1969
Trustee
Trustee since: GLV: 2017 GLQ: 2017 GLO: 2017 Term expires: GLV: 2018 GLQ: 2019 GLO: 2020
Mr. McNally has over 24 years of industry experience focusing almost exclusively on closed‐end funds. Mr. McNally is currently a Managing Director at Clough and serves as the portfolio manager for an investment fund advised by Clough that invests primarily in closed‐end funds. Prior to joining Clough Capital Partners L.P. in 2014, he served as the Director of Closed‐End Funds at ALPS Fund Services, Inc. from 2003 to 2014, was Director of Closed‐End Fund and ETF Research at Smith Barney, a division of Citigroup Global Markets, Inc. from 1998 to 2003, and Director of Closed‐End Fund and ETF Marketing at Morgan Stanley Dean Witter Discover & Co. from 1997 to 1998. Previously, he was an analyst covering closed‐end funds in the Mutual Fund Research Department at Merrill Lynch, Pierce, Fenner, & Smith, Inc. from 1994 to 1997, and also was Manager of the Closed‐End Fund Marketing Department at Prudential Securities from 1992 to 1994. Mr. McNally received a Bachelor of Arts degree from the University of Massachusetts at Amherst in 1991 and an MBA in Finance from New York University’s Stern School of Business in 1998.
4 Mr. McNally is also Trustee of Clough Funds Trust.

Clough Global Funds Trustees & Officers October 31, 2017 (Unaudited)
Annual Report | October 31, 2017 59
Name, Address1 and Year of Birth
Position(s) Held with the Fund
Term of office and length of service with
the Fund2 Principal Occupation(s) During Past Five Years
Number of Portfolios in
Fund Complex Overseen by
Trustee3
Other Directorships Held by Trustee During the Past
Five Years Officers
Jeremy O. May 1970
Treasurer Officer since7 GLV: 2004 GLQ: 2005 GLO: 2006
Mr. May joined ALPS in 1995 and is currently President and Director of ALPS, ALPS Distributors, Inc., and ALPS Portfolio Solutions Distributor, Inc., and Executive Vice President and Director of ALPS Advisors, Inc. and ALPS Holdings, Inc. Mr. May is also President and Trustee of ALPS Series Trust, the Reaves Utility Income Fund and Elevation ETF Trust. Mr. May is also President of RiverNorth Opportunities Fund, Inc. Mr. May is currently on the Board of Directors of the University of Colorado Foundation.
N/A N/A
Karen S. Gilomen, 1970
Secretary Officer since7 GLV: 2017 GLQ: 2017 GLO: 2017
Ms. Gilomen joined ALPS in August 2016 as Vice President and Senior Counsel. Prior to joining ALPS, Ms. Gilomen was Vice President ‐ General Counsel & CCO of Monticello Associates, Inc. from 2010 to 2016. Ms. Gilomen is also the Secretary of Clough Global Dividend and Income Fund, Clough Global Equity Fund, Clough Global Opportunities Fund, Financial Investors Trust and Reaves Utility Income Fund, and the Assistant Secretary of the WesMark Funds.
N/A N/A
Ted Uhl, 1974
Interim Chief Compliance Officer (“CCO”)
Officer since7
GLV: 2017 GLQ: 2017 GLO: 2017
Mr. Uhl joined ALPS in October 2006, and is currently Deputy Compliance Officer of ALPS. Prior to his current role, Mr. Uhl served as Senior Risk Manager for ALPS from October 2006 until June 2010. Before joining ALPS, Mr. Uhl served a Sr. Analyst with Enenbach and Associates (RIA), and a Sr. Financial Analyst at Sprint. Mr. Uhl is also CCO of the Boulder Growth & Income Fund, Inc., Centre Funds, Elevation ETF Trust, Financial Investors Trust, Index Funds, Reality Shares ETF Trust, Reaves Utility Income Fund and XAI Octagon Floating Rate & Alternative Income Term Trust and the Interim CCO of Clough Funds Trust.
N/A N/A

Clough Global Funds Trustees & Officers October 31, 2017 (Unaudited)
60 www.cloughglobal.com
Name, Address1 and Year of Birth
Position(s) Held with the Fund
Term of office and length of service with
the Fund2 Principal Occupation(s) During Past Five Years
Number of Portfolios in
Fund Complex Overseen by
Trustee3
Other Directorships Held by Trustee During the Past
Five Years Officers Jill Kerschen, 1975
Assistant Treasurer
Officer since7 GLV: 2017 GLQ: 2017 GLO: 2017
Ms. Kerschen joined ALPS in July 2013 and is currently Vice President and Fund Controller. She currently serves as Treasurer of Reaves Utility Income Fund and Clough Funds Trust. Prior to joining ALPS she spent twelve years at Great‐West Financial in various fund administration roles, with the last seven years being in fund administration, tax and compliance, specifically related to mutual funds, collective trusts and separate accounts. At Great‐West Financial, Ms. Kerschen served as the Senior Manager, Financial Reporting and as Assistant Treasurer for the mutual funds & the investment adviser. Prior to joining Great‐West Financial, Ms. Kerschen worked at Oppenheimer Funds in fund administration. Ms. Kerschen holds a BS in Finance from Kansas State University.
N/A N/A
Sareena Khwaja‐Dixon 1980
Assistant Secretary
Officer since7
GLV: 2016 GLQ: 2016 GLO: 2016
Ms. Khwaja‐Dixon joined ALPS in August 2015 and is currently Senior Counsel and Vice President of ALPS Fund Services, Inc. Prior to joining ALPS, Ms. Khwaja‐Dixon served as a Senior Paralegal/Paralegal for Russell Investments (2011 – 2015). Ms. Khwaja‐Dixon is also Secretary of Liberty All‐Star Equity Fund, Liberty All‐Star Growth Fund, Inc., and Assistant Secretary of Clough Funds Trust.
N/A N/A
Jennifer A. Craig 1973
Assistant Secretary
Officer since7 GLV: 2016 GLQ: 2016 GLO: 2016
Ms. Craig joined ALPS in 2007 and is currently Assistant Vice President and Paralegal Manager of ALPS. Prior to joining ALPS, Ms. Craig was Legal Manager at Janus Capital Management LLC and served as Assistant Secretary of Janus Investment Fund, Janus Adviser Series and Janus Aspen Series. Ms. Craig is also Assistant Secretary of Financial Investors Trust, ALPS Series Trust, Liberty All‐Star Equity Fund and Liberty All‐Star Growth Fund, Inc., and Clough Funds Trust.
N/A N/A
1 Address: 1290 Broadway, Suite 1100, Denver, Colorado 80203, unless otherwise noted. 2 GLV commenced operations July 28, 2004, GLQ commenced operations April 27, 2005, and GLO commenced operations April 25, 2006. 3 The Fund Complex for all Trustees, except Mr. Rutledge, Mr. Weber, Mr. McNally and Mr. Burke, consists of the Clough Global Dividend and
Income Fund, Clough Global Equity Fund and Clough Global Opportunities Fund. The Fund Complex for Mr. Rutledge consists of Clough Global Dividend and Income Fund, Clough Global Equity Fund, Clough Global Opportunities Fund and Clough China Fund, a series of the Financial Investors Trust. The Fund Complex for Mr. Burke consists of Clough Global Dividend and Income Fund, Clough Global Equity Fund, Clough Global Opportunities Fund, Clough China Fund, a series of the Financial Investors Trust, and Clough Global Long-Short Fund, a series of Clough Funds Trust. The Fund Complex for Mr. Weber and Mr. McNally consists of Clough Global Dividend and Income Fund, Clough Global Equity Fund, Clough Global Opportunities Fund, and Clough Global Long-Short Fund, a series of Clough Funds Trust.
4 “Interested Trustees” refers to those Trustees who constitute “interested persons” of the Fund as defined in the 1940 Act. 5 Mr. Burke is considered to be an “Interested Trustee” because he is President of the Fund. 6 Mr. McNally is considered to be an “Interested Trustee” because of his affiliation with Clough, which acts as the Fund’s investment adviser. 7 Officers are elected annually and each officer will hold such office until a successor has been elected by the Board.

Clough Global Funds Privacy Policy October 31, 2017 (Unaudited)
Annual Report | October 31, 2017 61
The Funds are committed to ensuring your financial privacy. This notice is being sent to comply with privacy regulations of the Securities and Exchange Commission. The following policy is in effect with respect to nonpublic personal information about Fund customers:
Only such information received from you, through application forms or otherwise, and information about your Fund transactions will be collected.
None of such information about you (or former customers) will be disclosed to anyone, except as permitted by law (which includes disclosure to employees necessary to service your account).
Policies and procedures (including physical, electronic and procedural safeguards) are in place that are designed to protect the confidentiality of such information.
The Funds do not currently obtain consumer information. If the Funds were to obtain consumer information at any time in the future, appropriate procedural safeguards that comply with federal standards to protect against unauthorized access to and properly dispose of consumer information would be employed.
For more information about the Funds’ privacy policies call (877) 256-8445 (toll-free).

The Funds are neither insured nor guaranteed by the U.S. Government, the FDIC, the Federal Reserve Board or any other governmental agency or insurer.
For more information about the Funds, including a prospectus, please visit www.cloughglobal.com or call 1–877–256–8445.
Secondary market support provided to the Funds by ALPS Fund Services, Inc.’s affiliate ALPS Portfolio Solutions Distributor, Inc. FINRA Member Firm
1290 Broadway, Suite 1100, Denver, CO 80203
2017 ANNUAL REPORT