Embed Size (px)
Citation preview

1
Albany Hills State School
2016 ANNUAL REPORT
Queensland State School Reporting
Inspiring minds. Creating opportunities. Shaping Queensland’s future. Every student succeeding. State Schools Strategy 2016-2020
Department of Education and Training

2
Contact Information
Postal address: PO Box 378 Albany Creek 4035
Phone: (07) 3264 0777
Fax: (07) 3264 0700
Email: [email protected]
Webpages: Additional reporting information pertaining to Queensland state schools is located on the My School website and the Queensland Government data website.
Contact Person: Rod Mason - Principal
School Overview
As an Independent Public School Albany Hills State School's vision of ‘High performance to achive personal best’ within a context of ‘Generosity of spirit’ maximizes opportunities for all students whilst maintaing an environment of respect and support.
The school has a proud history of providing quality education to its local community. Highlighted by a culture of learning and mutual respect, parents and staff partner together in the best interests of students. It is this calm but energetic environment that makes Albany Hills such a special place to work and learn.
The school maintains an extensive range of extracurricular activities and strongly supports many students with special talents and abilities. Participation in the full range of Performing Arts including musicals, choirs, dance, drama and instrumental music provides opportunities for our talented and enthusiastic students. Sport, Health and Wellbeing is another area of High Performance with many students going on to regional and state representation.
Numeracy and Mathematics, as the building blocks for other areas of learning are High Performance Areas that ensure students succeed across other areas of learning. Capabilities of all students are assessed and form the basis of special education programming, intervention, extension and Gifted and/or Talented programs. Inclusion of all students in as many areas of learning as possible is a feature of the school.
Science, identified as a High Performance Area is a signature subject for the school. Links with the environment are important aspects of the Science program and are well supported by a partnership with and excursions to Bunyaville Environmental Education Centre. Student entries in Young Scientistof the Year have a history of significant success.
The school is an integral part of the community and is committed to promoting high standards of academic achievement and student leadership and endeavour. The community is an integral part of school life and their participation in a vast array of events and activities bears testament to the strong support enjoyed by the school. All this contributes to a school that prepares our students to maximize their potential, thus ensuring an exciting and viable future for us all.
3
This statement has been populated from your school’s My School Profile statement. If you do not have a statement please include one here. If your statement needs updating please update here and via the My School Principal Portal. Portal address: https://schools.myschool.edu.au. Using the Portal: https://schools.myschool.edu.au/ContactUs/UsingThePortal. You may choose to include additional information on school history, school vision or school values.
Principal’s Forward
Introduction
School Progress towards its goals in 2016
The school’s improvement agenda for 2016 focussed on Mathematics, Science and Writing,
supplemented by Spelling as the year progressed. Teachers engaged in professional development to
build their professional knowledge and skills when planning and teaching in theses key areas of the
curriculum.
Science continued to be a major focus for Albany Hills State School, with students participating in a
range of experiences including the Young Scientist of the Year competition and various science
based clubs. A Lead Teacher: Science led the development of the learning program with teachers,
creating strong links with Bunyaville Environmental Education Centre. Enhanced use of the school
environment and the beginnings of inclusion of Indigenious perspectives in Science have paved the
way for the future development of learing in Science. Science Week was celebrated and a ‘Where
Science Meets Arts’ community evening was strongly supported by the school community and local
secondary schools.
In 2016, ICTs (Information and Communication Technologies), continued to be a focus of professional learning, with teachers exploring and developing new teaching strategies to enhance teaching and learning. During 2016, the Bring Your Own Laptop program for Year 5 and 6 students had a high take up rate enhancing student access to technology. All classrooms have interactive whiteboards and wifi allowing students to engage in dynamic learning experiences.
In 2016, the priorities at Albany Hills State School included :
High Performance in Academia was a focus, with students being encouraged and supported to achieve their personal best. This was supported by continued implementation of the Albany Hills Curriculum Plan and associated Pedagogical Framework, focusing on Mathematics, Writing, Spelling and Science.
Enhancement of student achievement in Writing through application of the NAPLAN Marking Guide and implementation of effective teaching practices, including ‘Seven Steps to Writing Success’.
Enhanced collection, analysis and use of data to inform teaching and learning with a focus on accessing classroom assessment as a key driver.
Development of a Professional Learning Environment based on collegiate collaboration and consultation.
Enhancement of productive partnerships with parents based on their knowing what their children were learning; how well; and the next step for their learning.
4
High Performance in Performing Arts (Classroom Music, Dance, Choral Groups, Musicals and Instrumental Music) is a key aspect of the learning opportunities available to students.
High performance in Sport was facilitated by the appointment of an additional Physical Education Teacher. Exploration of Health and Wellbeing commenced in preparation for future development of a specific program in this important area.
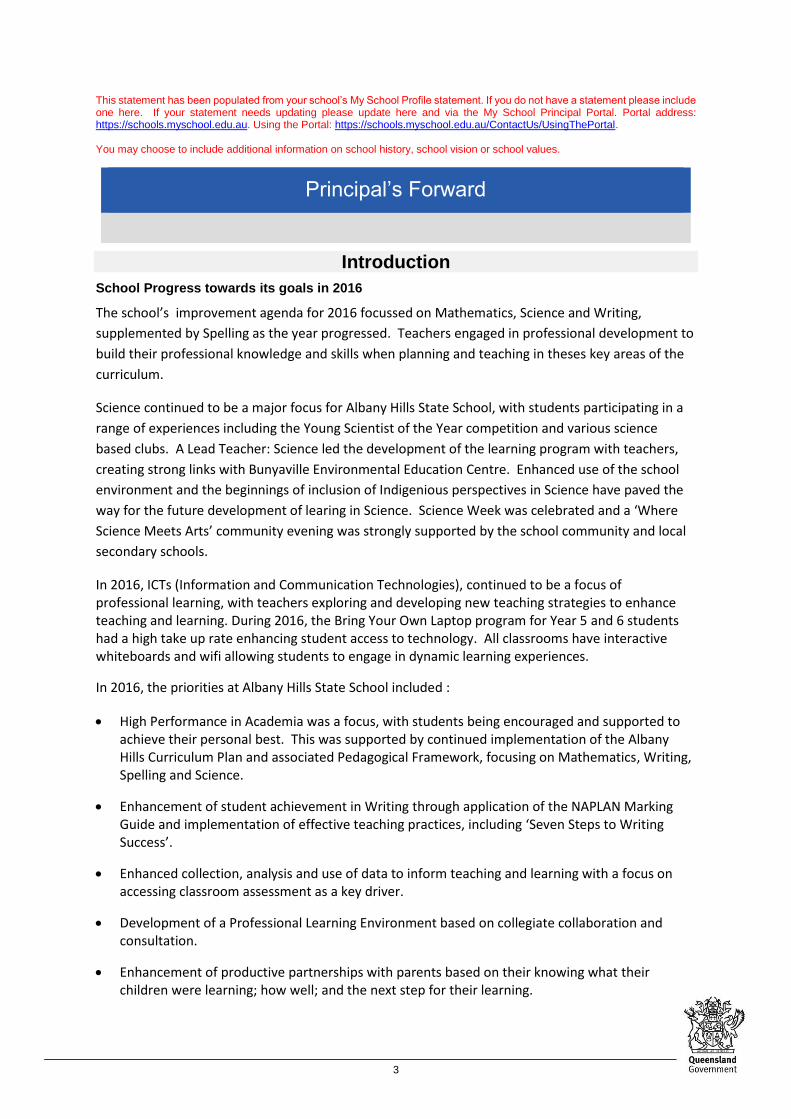
Future Outlook
During 2017 embedding the curriculum initiatives began in 2016 is the main task. As the diagram below illustrates, Numeracy is of the highest priority with aspects of Literacy being enhanced and sustained. Science also continues to be developed and construction of a Science and Art Learning Area in 2017 will see these subjects delivered with an emphasis on experiential and group learning.
5
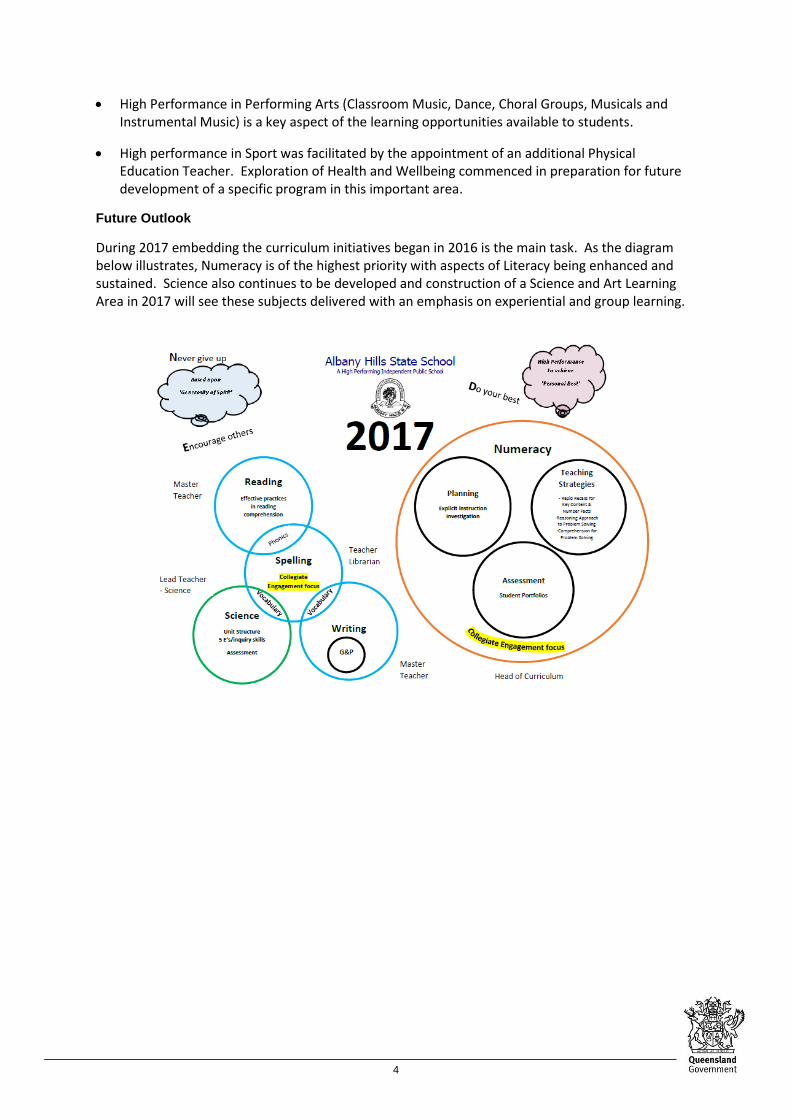
Our School at a Glance
School Profile
Coeducational or single sex: Coeducational
Independent Public School: Yes
Year levels offered in 2016: Prep Year - Year 6
Student enrolments for this school:
Total Girls Boys Indigenous
Enrolment Continuity
(Feb – Nov)
2014 757 374 383 16 96%
2015* 792 384 408 13 98%
2016 817 415 402 14 98%
Student counts are based on the Census (August) enrolment collection.
*From 2015, data for all state high schools include Year 7 students. Prior to 2015, only state high schools offering Year 7 had these students included in their counts.
In 2016, there were no students enrolled in a pre-Prep** program.
** pre-Prep is a kindergarten program for Aboriginal and Torres Strait Islander children, living across 35 Aboriginal and Torres Strait Islander
communities, in the year before school (http://deta.qld.gov.au/earlychildhood/families/pre-prep-indigenous.html).
Characteristics of the Student Body
Overview
Students at Albany Hills State School are renowned for their positive attitude and respect for each other, their school and for adults. Staff and parents have created a learning environment that provides numerous opportunities for students to engage in learning. Classrooms are characterized by a calm, productive atmosphere where high standards are set and students are supported to achieve their best.
The inclusive nature of the school is illustrated by the participation of all students who wish to in
numerous extracurricular actives, including performing arts, lunch-time clubs, after school sport and
community sourced programs. Special Education Provision, Gifted Education and individualized
attention are provided to ensure all students have access to a quality education.
Parents from a number of areas at a distance to the school choose to enroll their children based
upon the school’s reputation. Albany Hills became enrolment managed mid-year due to the growth
in student numbers. Strong support for the school is evident as parents engage in classrooms, work
on projects and are active in the Parents and Citizen’s Association.
A significant number of families are involved in the Defence Forces, making continuity of learning for
their children a significant aspect of the school’s educational provision. Although there is only a
small number of Indigenous families enrolled in the school, ‘Closing the Gap’ and paying due
attention to ‘Reconciliation’, is considered important as we play our part in building a strong and
inclusive society. There is also a small number of students whose English is an additional language or

6
dialect to their family. Providing additional learning in English is part of the inclusive policy of the
school.
Average Class Sizes
The following table shows the average class size information for each phase of schooling.
AVERAGE CLASS SIZES
Phase 2014 2015* 2016
Prep – Year 3 23 24 23
Year 4 – Year 7 23 26 28
Year 8 – Year 10
Year 11 – Year 12
*From 2015, data for all state high schools include Year 7 students. Prior to 2015, only state high schools offering Year 7 had these students included in their counts.
Curriculum Delivery
Our Approach to Curriculum Delivery
The learning program is based on the national curriculum utilizing explicit instruction as the signature pedagogy. Teaching of Science also utilises this framework, using the inquiry method to encourage creativity and exploration. Development of the Science program was led by the Lead Teacher: Science, providing for sequential, progressive and high quality learning.
Literacy and numeracy are considered the foundations of all learning, these skills increasingly and explicitly applied across curriculum areas such as History, Geography and Science. Quality assuring the overall curriculum program is the responsibility of the Head of Curriculum who guides planning, assessment and teaching.
Pedagogical practices were supported by the Master Teacher who collaborated, modelled and provided feedback to teachers on their implementation of Explicit Instruction, especially as it applied to Mathematics, Writing and Spelling.
Throughout the school, there are a range of programs that boost the literacy and numeracy skills of students. In the early years, these include the Early Literacy Fundamentals (ELF) and Jolly Phonics programs. Such programs develop both the phonological awareness necessary for the development of reading, listening and spelling, as well as the motor, sensory and postural skills underlying handwriting, cutting and other essential school skills.
Student skills in writing are developing as teachers’ expertise is enhanced through training in Seven Steps to Writing Success. This was modified to suit the school circumstance. This was introduced in 2015 and continued into 2016.
Our Environmental Education Program is part of our efforts to raise awareness of our individual and collective responsibility for, and connection to the earth. A whole of school program has been developed over the past two decades, and has led to us taking real steps in reducing our carbon footprint on the planet. The program includes litter education, composting and paper recycling. Native vegetation is also planted to support the survival of endangered species such as the glossy red crested cockatoo, whose habitat is slowly being eroded from encroaching housing development.
In Science, a partnership with Bunyaville Environmental Centre has been created to further embed study of the local environment into the school program.
Co-curricular Activities
Students at Albany Hills State School have the opportunity to participate in a whole range of extracurricular activities, across a broad skill set, many offered in clubs and groups:
Academic Enhancement:

7
A number of clubs operate during breaks or after school. These provide a diverse choice to students including: Chess, Senior and Junior Clubs Poetry Club, Writers’ Club, and Chatterbooks. In addition students may choose to attend clubs dealing with Space Sciences, Robotics, Eco Kids, Junior and Senior Drawing and Construction.
In addition to the high quality Japanese program that operates across Years 4-6, we have Japanese Clubs, which were run during the lunch hour, by our Languages teacher and other teachers. In 2016, an exchange tour with our sister school in Kagoshima, Japan, took place. Sixteen students from our school visited Japan and stayed with families from our sister school. A group of our students from Kagoshima will visit Albany Hills in 2017.
During 2016, our school participated in many local, state and international competitions including ICAS academic challenges and the district Mathematics Tournament. A Maths club operates for those students keen to explore the world of Mathematics.
Sport and recreation:
Albany Hills State School has a broad representation of students in District, State and National sporting competitions. Participation in interschool and Representative Sport, Skipping Club, tennis coaching (private provider), Gymnastics (private provider) all provide options for students to explore and develop their sporting abilities
Performing Arts
Our students are given extensive performance opportunities in The Arts. Annual events include junior and senior musicals, Night of Excellence (talent quest), Grandparents Day and Christmas concerts. This is strengthened by the partnership with our local high school, cluster primary schools and the shared instrumental music teachers.
School Musicals, Instrumental Music, School Bands and Choirs (four choirs including a Boys Choir), Dance Club, Talent Quest, Shake and Stir (private provider) are amongst the many options available.
How Information and Communication Technologies are used to Assist Learning
Computer technology is used throughout the school in a variety of ways including: key integrating devices (iPads for Prep to Year 3), everyday classroom tools, presentation devices, robotics and Claymation tools. Our school has achieved the recommended ratio of computers to students. Computers are continually updated and replaced, and available in all classrooms as well as a recently refurbished, well-equipped computer lab.
The ICT committee is continually exploring ways of integrating new technologies in classrooms. A BYOL (Bring Your Own Laptop) program operates in Year 5 and Year 6.
The library provides extensive access to books and technology in welcoming and relaxed atmosphere. A courtyard where students may read, play and interact with each other provides another area for students and parents to use. Many parents and their children make use of the library before and after school, borrowing and reading books together. Bookweek is celebrated with children enjoying the opportunity to purchase a quality book to share with each other and their family.
Social Climate
Overview
The social climate of this school is especially positive, with high parent support and high expectations for individual students. There is a dedicated band of volunteers who give generously of their time to the school, and their work is hugely appreciated.
Our school is serviced by a Special Education Program, students with learning difficulties/disabilities teachers, a speech language pathologist, an English as a second language teacher and a developmental guidance officer.
8
Whenever there is an issue for a child, the matter may be referred to the School Support Services Team for assessment and action.
Our school also has a Chaplain to support students three days each week.
Albany Hills State School has a very effective Responsible Behaviour Plan in place. All students are aware of the plan and it is made available to all new families upon enrolment.
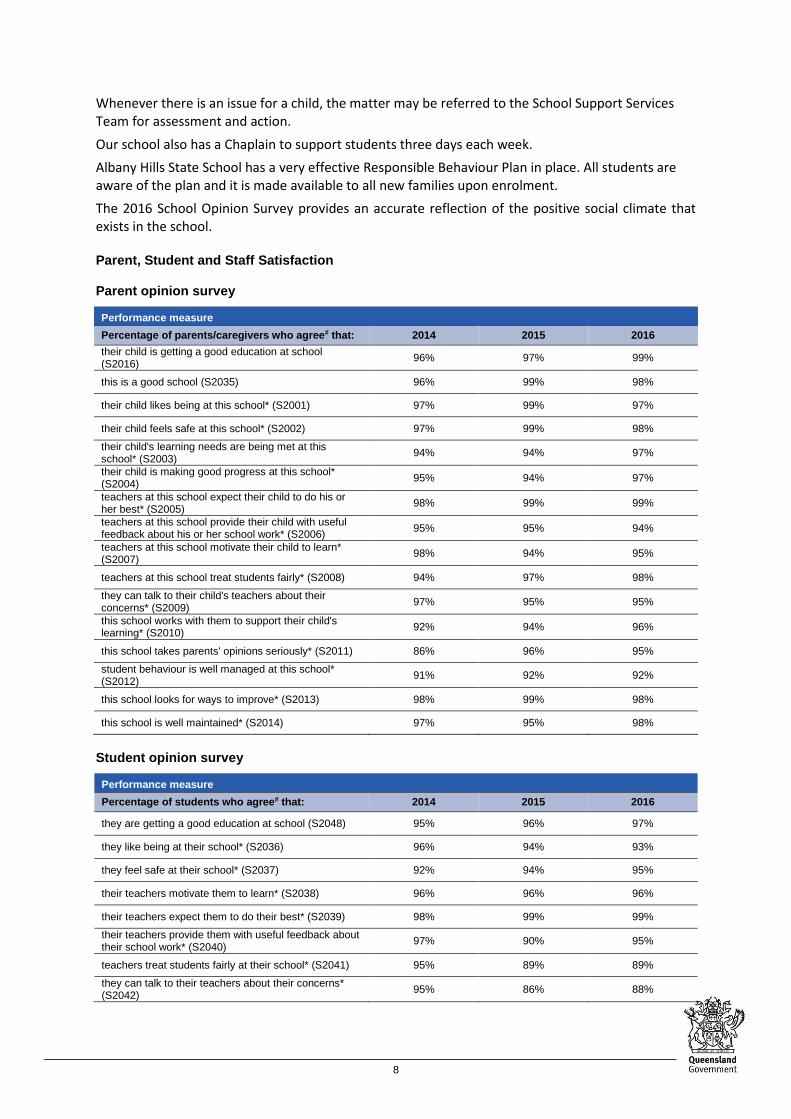
The 2016 School Opinion Survey provides an accurate reflection of the positive social climate that exists in the school.
Parent, Student and Staff Satisfaction Parent opinion survey
Performance measure
Percentage of parents/caregivers who agree# that: 2014 2015 2016
their child is getting a good education at school (S2016)
96% 97% 99%
this is a good school (S2035) 96% 99% 98%
their child likes being at this school* (S2001) 97% 99% 97%
their child feels safe at this school* (S2002) 97% 99% 98%
their child's learning needs are being met at this school* (S2003)
94% 94% 97%
their child is making good progress at this school* (S2004)
95% 94% 97%
teachers at this school expect their child to do his or her best* (S2005)
98% 99% 99%
teachers at this school provide their child with useful feedback about his or her school work* (S2006)
95% 95% 94%
teachers at this school motivate their child to learn* (S2007)
98% 94% 95%
teachers at this school treat students fairly* (S2008) 94% 97% 98%
they can talk to their child's teachers about their concerns* (S2009)
97% 95% 95%
this school works with them to support their child's learning* (S2010)
92% 94% 96%
this school takes parents' opinions seriously* (S2011) 86% 96% 95%
student behaviour is well managed at this school* (S2012)
91% 92% 92%
this school looks for ways to improve* (S2013) 98% 99% 98%
this school is well maintained* (S2014) 97% 95% 98%
Student opinion survey
Performance measure
Percentage of students who agree# that: 2014 2015 2016
they are getting a good education at school (S2048) 95% 96% 97%
they like being at their school* (S2036) 96% 94% 93%
they feel safe at their school* (S2037) 92% 94% 95%
their teachers motivate them to learn* (S2038) 96% 96% 96%
their teachers expect them to do their best* (S2039) 98% 99% 99%
their teachers provide them with useful feedback about their school work* (S2040)
97% 90% 95%
teachers treat students fairly at their school* (S2041) 95% 89% 89%
they can talk to their teachers about their concerns* (S2042)
95% 86% 88%

9
Performance measure
Percentage of students who agree# that: 2014 2015 2016
their school takes students' opinions seriously* (S2043)
97% 89% 85%
student behaviour is well managed at their school* (S2044)
92% 84% 83%
their school looks for ways to improve* (S2045) 95% 95% 96%
their school is well maintained* (S2046) 95% 91% 93%
their school gives them opportunities to do interesting things* (S2047)
93% 91% 94%
Staff opinion survey
Performance measure
Percentage of school staff who agree# that: 2014 2015 2016
they enjoy working at their school (S2069) 97% 100% 98%
they feel that their school is a safe place in which to work (S2070)
97% 100% 96%
they receive useful feedback about their work at their school (S2071)
79% 92% 88%
they feel confident embedding Aboriginal and Torres Strait Islander perspectives across the learning areas (S2114)
94% 96% 92%
students are encouraged to do their best at their school (S2072)
97% 100% 98%
students are treated fairly at their school (S2073) 97% 100% 96%
student behaviour is well managed at their school (S2074)
90% 97% 85%
staff are well supported at their school (S2075) 76% 97% 87%
their school takes staff opinions seriously (S2076) 79% 94% 84%
their school looks for ways to improve (S2077) 85% 100% 98%
their school is well maintained (S2078) 100% 97% 98%
their school gives them opportunities to do interesting things (S2079)
85% 100% 100%
* Nationally agreed student and parent/caregiver items # ‘Agree’ represents the percentage of respondents who Somewhat Agree, Agree or Strongly Agree with the statement. DW = Data withheld to ensure confidentiality.
Parent and community engagement
Albany Hills State School is an integral part of the Albany Creek community. With its administration, staff and P&C Association working together, we ensure our school is that special, important place in the lives our students and their families. We welcome all who come to share in our learning and activities, and we encourage community involvement in our school. Our auditorium is available to the community for a relatively nominal fee, and the sports ground is free of charge for community activities such as district cricket. Also, our school is able to provide a range of venues for the community for meetings and various community events.
There is an open, friendly partnership between the parents, caregivers and teachers, based on trust. This begins from the meeting when prospective parents initially make contact with school personnel as they decide on the school for their children. School Leaders make personal contact with parents and their children during the enrolment process and this continues into the following year, as the children settle into their Prep year. This assists the learning of our children, their motivation and behaviour. Parent participation is especially invited, and a broad range of school events and special days and activities exemplify this. Information evenings, parent/teacher interviews and the active encouragement of interaction between staff and parents all contribute to the involvement of parents in their child’s education.
10
The School Council provides the strategic direction of the school, linking priorities and parental support together.
Our active P&C Association, parent attendance at weekly student assemblies, uniform shop operations, tuckshop volunteers and classroom volunteers, attest to the many parents who play an important role in the life of Albany Hills State School.
Communications provides a vital link to our community. A weekly newsletter, ‘The Herald’, along with the school website, facebook and twitter provide for the exchange of information. Qschools and Qparents is an additional service that allows for online contact and two-way communications. All staff are open to contact with parents as well as providing written and face-to-face reporting of student achievement. The School Promotions Officer has a key role in keeping all communication medium up to date.
Respectful relationships programs
The school has developed and implemented a program or programs that focus on appropriate, respectful and healthy relationships.
The Responsible Behaviour Plan is based upon mutual respect and trust to build partnerships with parents. Class teachers take responsibility for their students, delivering lesson that develop social skills, and making early contact with parents when necessary.
Students base their behavior on NED (Never give up, Encourage others and Do your best). Students are also made aware of the rule of ‘Safe Play’ that encourages them to adopt habits and strategies that allows them to explore play whilst maintaining positive relationships and safety.
School Disciplinary Absences
The Responsible Behaviour Policy, involved adopting a positive and proactive response to student behaviour. Based on the work of Glassar, expectations are clearly, stated with consequences applied to assist students to make choices that result in their adopting socially acceptable and safe behaviour.
In 2016 the process was refined so students made explicit connections to expectations through the Student Leadership program. Employment of a Lead Teacher: Student Engagement and support from a Teacher Aide: Student Engagement provided substantial support for students, staff and families.
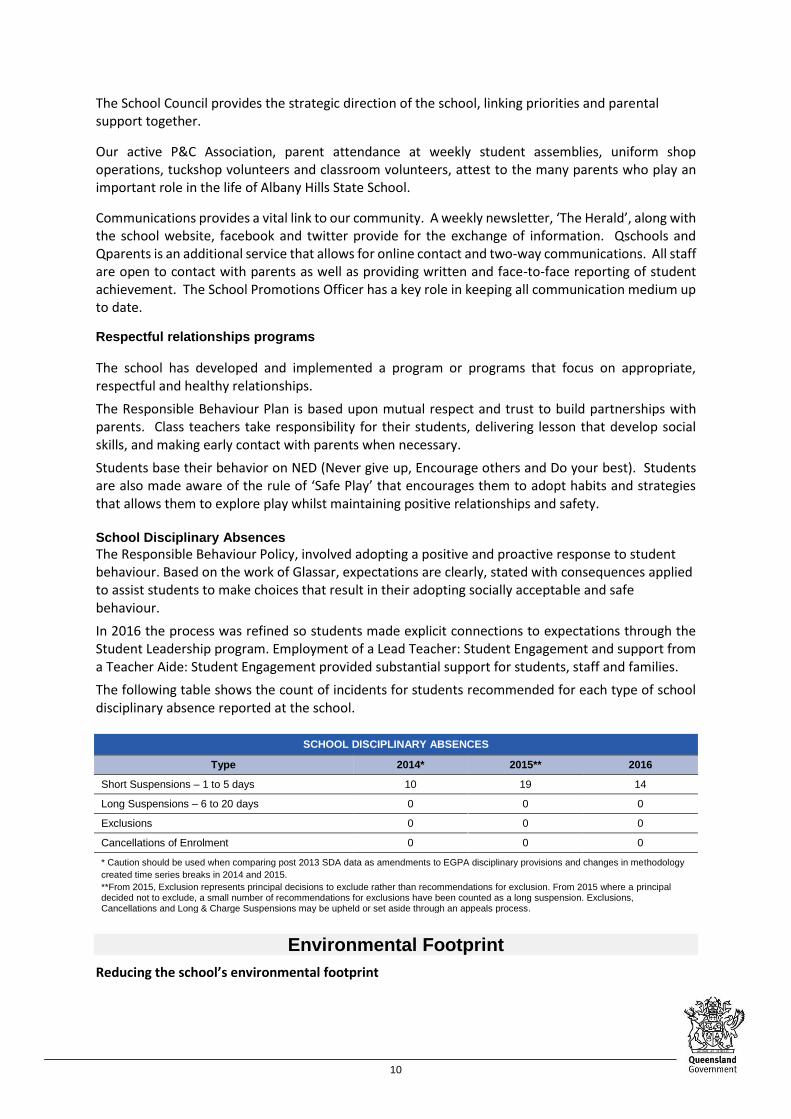
The following table shows the count of incidents for students recommended for each type of school disciplinary absence reported at the school.
SCHOOL DISCIPLINARY ABSENCES
Type 2014* 2015** 2016
Short Suspensions – 1 to 5 days 10 19 14
Long Suspensions – 6 to 20 days 0 0 0
Exclusions 0 0 0
Cancellations of Enrolment 0 0 0
* Caution should be used when comparing post 2013 SDA data as amendments to EGPA disciplinary provisions and changes in methodology
created time series breaks in 2014 and 2015.
**From 2015, Exclusion represents principal decisions to exclude rather than recommendations for exclusion. From 2015 where a principal decided not to exclude, a small number of recommendations for exclusions have been counted as a long suspension. Exclusions, Cancellations and Long & Charge Suspensions may be upheld or set aside through an appeals process.
Environmental Footprint
Reducing the school’s environmental footprint

11
During 20156, the Albany Hills State School community continued to work towards reducing its environmental footprint.
All classrooms are air conditioned and usage is efficient. Students and teachers have been made aware of the most effective way of, and conditions for, using air conditioning, to ensure that electricity use is reasonable. Our most recently built classroom block (consisting of eight classrooms and four teacher preparation areas) has been fitted with energy efficient lighting. Solar panels to defray some energy costs have been installed.
Water tanks continue to provide water supply to all student amenities blocks. Additional tanks were installed with the construction of the new classroom block several years ago. The school dam collects water which is pumped to irrigate the school oval as required. This means a reduction in the quantity of water required from the town supply in the long term. Mechanical issues with devices such as pumps, can from time to time, result in an increase in the use of town water. This is carefully monitored by our grounds staff.
Albany Hills State School has a proud history in the area of waste management which spans the last twenty years. The program includes practices such as recycling, composting and paper recycling and promotes student education in ways to reduce their environmental footprint.
ENVIRONMENTAL FOOTPRINT INDICATORS
Years Electricity
kWh Water
kL
2013-2014 266,031 69,420
2014-2015 257,021 28,098
2015-2016 282,145 2,243
The consumption data is compiled from sources including ERM, Ergon reports and utilities data entered into OneSchool by each school. The data provides an indication of the consumption trend in each of the utility categories which impact on the school’s environmental footprint.
School Funding
School income broken down by funding source School income, reported by financial year accounting cycle using standardized national methodologies and broken down by funding source is available via the My School website at http://www.myschool.edu.au/.
To access our income details, click on the My School link above. You will then be taken to the My School website with the following ‘Find a school’ text box.
Where it states ‘School name’, type in the name of the school you wish to view, select the school from the drop-down list and select <GO>. Read and follow the instructions on the next screen; you will be asked to confirm that you are not a robot then by

12
clicking continue, you acknowledge that you have read, accepted and agree to the Terms of Use and Privacy Policy before being given access to the school’s profile webpage.
School financial information is available by selecting ‘School finances’ in the menu box in the top left corner of the school’s profile webpage. If you are unable to access the internet, please contact the school for a paper copy of income by funding source.
Our Staff Profile
Workforce Composition
Staff composition, including Indigenous staff
2016 WORKFORCE COMPOSITION
Description Teaching Staff Non-Teaching Staff Indigenous Staff
Headcounts 58 32 <5
Full-time Equivalents 51 19 <5
Qualification of all teachers
TEACHER* QUALIFICATIONS
Highest level of qualification Number of classroom teachers and school leaders at the
school
Doctorate
Masters 4
Graduate Diploma etc.** 6
Bachelor degree 41
Diploma 4
Certificate
*Teaching staff includes School Leaders **Graduate Diploma etc. includes Graduate Diploma, Bachelor Honours Degree, and Graduate Certificate.
Professional Development
Expenditure On and Teacher Participation in Professional Development
The total funds expended on teacher professional development in 2016 were $82 426.
The major professional development initiatives were:
Literacy and Numeracy – Mathematics (Problem Solving and Reasoning), Writing, Spelling, Rapid Recall Routines
Collaborative planning to implement curriculum priorities consistently across and within the grades.
Environmental training to implement that aspect of the Science program.
Gifted Education
Leadership programs for administration team and teacher leaders
First Aid and Workplace Health and Safety, specifically training and awareness of anaphylaxis and asthma
Restorative practices and positive behaviour strategies to support student engagement.
13
Initiatives were also conducted through the Independent Public Schools Professional Alliance, Teachers’ Learning Network, Science Teachers’ Association, Early Childhood Teachers’ Association, Principals’, Deputy Principals’ and HOC Networks.
Training for Teachers Aides was implemented to support their work in literacy and numeracy. They also participated in training in responsible behaviour strategies.
The proportion of the teaching staff involved in professional development activities during 2016 was 100%.
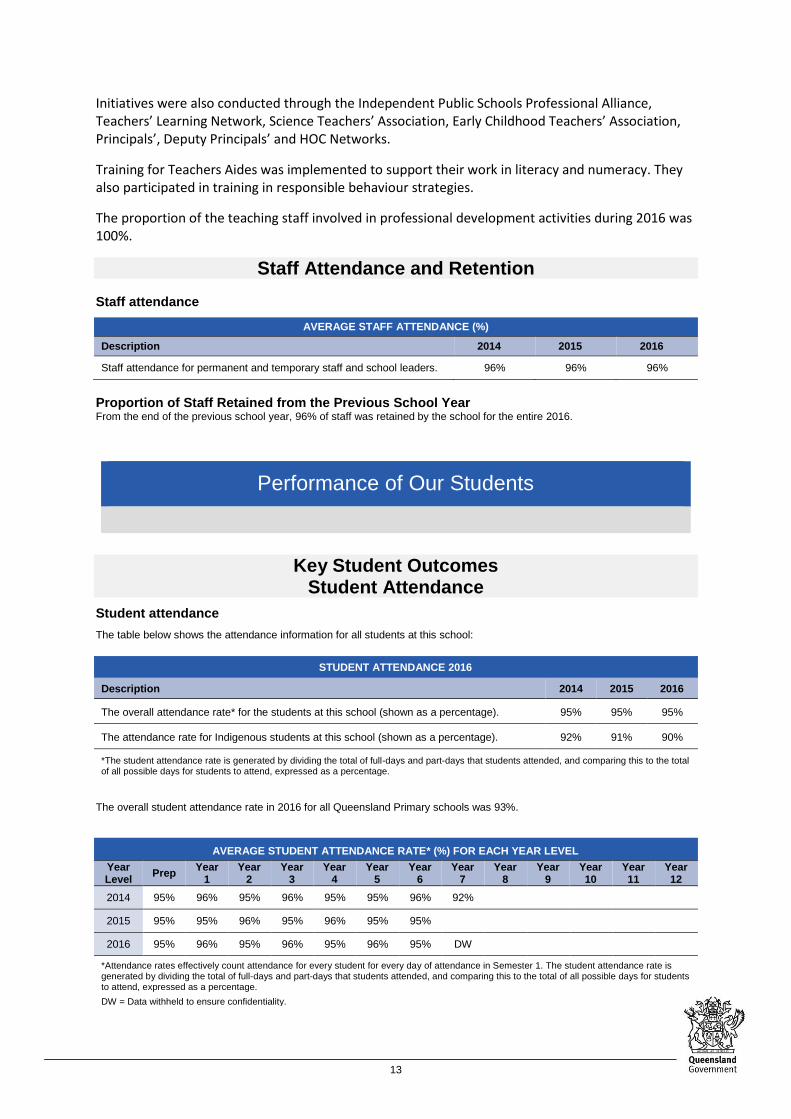
Staff Attendance and Retention Staff attendance
AVERAGE STAFF ATTENDANCE (%)
Description 2014 2015 2016
Staff attendance for permanent and temporary staff and school leaders. 96% 96% 96%
Proportion of Staff Retained from the Previous School Year From the end of the previous school year, 96% of staff was retained by the school for the entire 2016.
Performance of Our Students
Key Student Outcomes
Student Attendance
Student attendance
The table below shows the attendance information for all students at this school:
STUDENT ATTENDANCE 2016
Description 2014 2015 2016
The overall attendance rate* for the students at this school (shown as a percentage). 95% 95% 95%
The attendance rate for Indigenous students at this school (shown as a percentage). 92% 91% 90%
*The student attendance rate is generated by dividing the total of full-days and part-days that students attended, and comparing this to the total of all possible days for students to attend, expressed as a percentage.
The overall student attendance rate in 2016 for all Queensland Primary schools was 93%.
AVERAGE STUDENT ATTENDANCE RATE* (%) FOR EACH YEAR LEVEL
Year Level
Prep Year
1 Year
2 Year
3 Year
4 Year
5 Year
6 Year
7 Year
8 Year
9 Year 10
Year 11
Year 12
2014 95% 96% 95% 96% 95% 95% 96% 92%
2015 95% 95% 96% 95% 96% 95% 95%
2016 95% 96% 95% 96% 95% 96% 95% DW
*Attendance rates effectively count attendance for every student for every day of attendance in Semester 1. The student attendance rate is generated by dividing the total of full-days and part-days that students attended, and comparing this to the total of all possible days for students to attend, expressed as a percentage.
DW = Data withheld to ensure confidentiality.

14
Student Attendance Distribution The proportions of students by attendance range:
Description of how non-attendance is managed by the school
Non-attendance is managed in state schools in line with the DETE policies, SMS-PR-029: Managing Student Absences and SMS-PR-036: Roll Marking in State Schools, which outline processes for managing and recording student attendance and absenteeism.
The procedures at Albany Hills State School are in accordance with those outlined in this policy. Specifically, considerable effort was given throughout 2016 to following up the very small number of students with unreasonable numbers or patterns of absence. All parents were reminded of the ‘Every Day Counts’ strategy through avenues such as the school newsletter and where necessary, provided with a copy.
NAPLAN
Our reading, writing, spelling, grammar and punctuation, and numeracy results for the Years 3, 5, 7 and 9 are available via the My School website at http://www.myschool.edu.au/.
To access our NAPLAN results, click on the My School link above. You will then be taken to the My School website with the
following ‘Find a school’ text box.
Where it states ‘School name’, type in the name of the school you wish to view, select the school from the drop-down list and select <GO>. Read and follow the instructions on the next screen; you will be asked to confirm that you are not a robot then by
5
4
5
6
6
7
24
26
25
65
64
63
0% 20% 40% 60% 80% 100%
2016
2015
2014
Proportion of Students
Attendance Rate: 0% to <85% 85% to <90% 90% to <95% 95% to 100%

15
clicking continue, you acknowledge that you have read, accepted and agree to the Terms of Use and Privacy Policy before being given access to the school’s profile webpage.
School NAPLAN information is available by selecting ‘NAPLAN’ in the menu box in the top left corner of the school’s profile webpage. If you are unable to access the internet, please contact the school for a paper copy of our school’s NAPLAN results.