Embed Size (px)
Citation preview
BUILDING SUSTAINABLE FUTURE
ANNUAL REPORT 2019
We believe in a sustainable development where needs of current are met without compromising the abilities of future generations to meet their own needs. We are striving to achieve economic development with a socially responsible and environment friendly attitude. Depleting water reservoir and increasing carbon emission are among key challenges the world is facing today. We are committed to develop more and more renewable energy sources for clean-energy and water re-cycling facilities to stay green and eco-friendly for building a sustainable future.
BUILDING SUSTAINABLE FUTURE

ANNUAL REPORT 2019 01
CONTENTSORGANISATIONAL OVERVIEW AND EXTERNAL ENVIRONMENT ...........................................................3Company Profile & Principal Business Activities ...........4Our Vision & Mission ....................................................8Our Values ..................................................................11Code of Business Conduct and Ethical Principles ......12Culture .......................................................................13Corporate Strategy.....................................................13Group Structure .........................................................14Position in Value Chain ...............................................17Factors Effecting External Environment ......................18
STRATEGY AND RESOURCE ALLOCATION .............21Strategic Objectives 2019-2020 .................................22Strategies and Management Objectives .....................23Key Performance Indicators (KPIs) .............................24
RISKS AND OPPORTUNITIES ...................................26Risks and Opportunities Analysis ...............................30Key Risks and Opportunities of Capitals ....................31
GOVERNANCE ..........................................................32Notice of Annual General Meeting ..............................33Chairman’s Review .....................................................48Directors’ Report ........................................................50Statement of Compliance with the Listed Companies (Code of Corporate Governance) Regulations, 2017 ......................................................57Independent Auditor’s Review Report to the Members on the Statement of Compliance ................61Report of the Audit Committee ..................................62Brief Profile of Directors ..............................................64Terms of Reference of Board Committees..................71Management Committees & Terms of Reference .......73Other Corporate Matters ............................................76
STAKEHOLDERS RELATIONSHIP AND ENGAGEMENT ..........................................................83Policy for Stakeholders’ Engagement .........................84
CORPORATE SUSTAINABILITY .................................88Calendar of Corporate Events ....................................94Calendar of Other Notable Events ..............................94
OUTLOOK .................................................................96Forward Looking statement .......................................97SWOT Analysis ..........................................................91
PERFORMANCE AND POSITION ............................100Compliance with International Financial Reporting Standards (IFRS) ......................................101Integrated Reporting Framework ..............................102Financial Review .......................................................103Statement of Cash Flows - (Direct Method) ..............106Results Reported in Interim Financial Statements and Final Accounts................................107Value Addition and Distribution .................................109Horizontal Analysis of Financial Statements ..............110Vertical Analysis of Financial Statements ..................112Key Operating and Financial Data ............................114DuPont Analysis .......................................................118Definition and Glossary of Terms ..............................120Jama Punji ...............................................................121
FINANCIAL STATEMENTS .......................................122Independent Auditors’ Report ..................................123Statement of Financial Position ................................128Statement of Profit or Loss.......................................130Statement of Comprehensive Income ......................131Statement of Changes in Equity ...............................132Statement of Cash Flows .........................................133Notes to the Financial Statements ............................134Pattern of Shareholding ............................................185
CONSOLIDATED FINANCIAL STATEMENTS ...........189Directors’ Report on Consolidated Financial Statements ................................................190Independent Auditors’ Report ..................................191Consolidated Statement of Financial Position...........198Consolidated Statement of Profit or Loss .................200Consolidated Statement of Comprehensive Income ......201Consolidated Statement of Changes in Equity .........202Consolidated Statement of Cash Flows ...................203Notes to the Consolidated Financial Statements ......204PROXY FORM
KOHINOOR TEXTILE MILLS LIMITED02
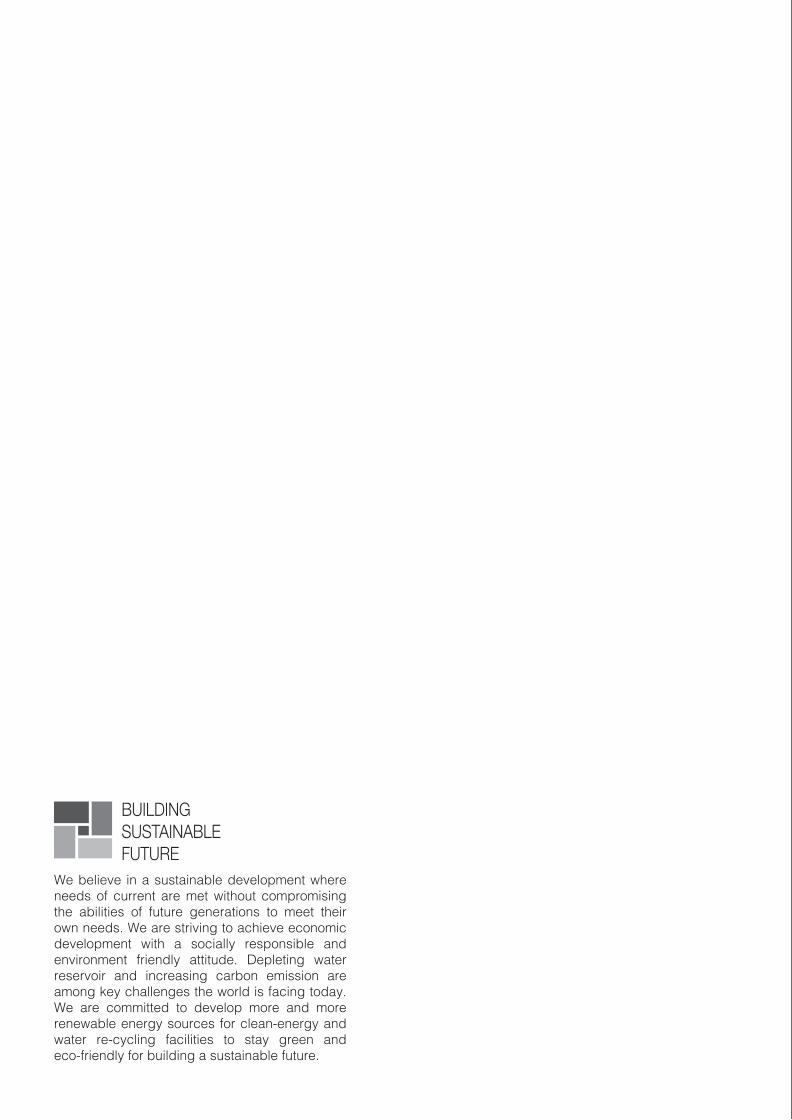
Gross Profit
Rs. 3,561
16.78%
Net Profit
Rs. 1,751
8.25%
Earnings pershare
Rs. 5.85
Revenue
million
Rs. 21,220
1.09Current Ratio
Times
6.55
Interest Cover
Times
0.30
FinancialLeverage
Times
10:90
Debt toEquity Ratio
10.32
Returnon Equity
percentage
Rs. 2,692
Profit fromOperations
million
Rs. 573
Cash used in Investing
Activities
millionRs. 1,866
Cash used in Financing
Activities
million
Rs. 2,494
Cash Generated
from Operating Activities
million
Rs. 2.00
Dividendper Share
20%
DividendYield
11.75
Cash from Operations
to Sales
Times
million
million
per share
(GP)
(NP)
(EPS)
16.32%
17.74%
16.42% 16.58%
7.04%
1.2
2.5
1.09 1.06
4,910
5,470
5,156
5,684
6.32% 5.80%
13.70%
YEAR AT A GLANCE2019

ANNUAL REPORT 2019 03
ORGANISATIONALOVERVIEW AND EXTERNAL
ENVIRONMENT

KOHINOOR TEXTILE MILLS LIMITED04
COMPANY PROFILE & PRINCIPAL
BUSINESS ACTIVITIESKOHINOOR TEXTILE MILLS LIMITED (“THE COMPANY”)
COMMENCED TEXTILE OPERATIONS IN 1953 AS A PRIVATE LIMITED COMPANY AND BECAME A PUBLIC
LIMITED COMPANY IN 1968.

ANNUAL REPORT 2019 05
The Company’s spinning production facilities now comprise 157,488 ring spindles and 1,848 open-end rotors capable of spinning a wide range of counts using cotton and man-made fibers. The weaving facilities at Raiwind comprise 288 looms capable of weaving a wide range of greige fabrics. The processing facilities at the Rawalpindi unit are capable of dyeing and printing fabrics for the home textile market. The stitching facilities produce a diversified range of home textiles for the export market. Both the dyeing and stitching facilities are being augmented to take advantage of greater market access. Fully equipped laboratory facilities for quality control and process optimization have been setup at all three sites.
The Company has been investing heavily in Information Technology, training of its human resources and preparing its management to meet the challenges of market integration.
The Company continues to ensure that its current competitive position is maintained as well as supporting the ongoing improvement process in our endeavor to maintain the world’s best manufacturing practice. Operations of the Company are subject to different environmental and labour laws. The Company is fully complying with all applicable environmental, labour, corporate and other relevant legal laws.
Product Portfolio – To cater to varying needs of the market, the Company produces the following product:
i) Yarnii) Greige Fabriciii) Dyed and Printed Fabriciv) Home Textile Products (Bed Linen, Quilting, Embroidery, Curtains, etc)
The Company sells its products to local as well as international markets. Finished products of home textile business are exported to mainly Europe, America & Australia.

KOHINOOR TEXTILE MILLS LIMITED06

ANNUAL REPORT 2019 07
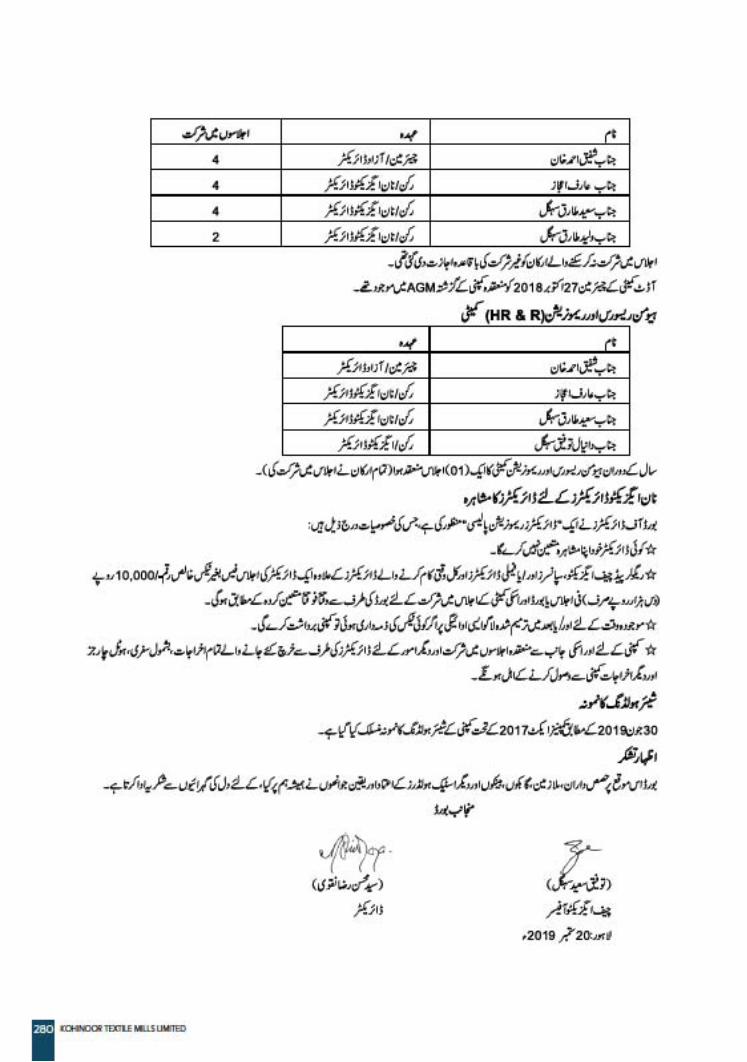
COMPANY INFORMATIONBoard of DirectorsMr. Tariq Sayeed Saigol ChairmanMr. Taufique Sayeed Saigol Chief ExecutiveMr. Sayeed Tariq Saigol Mr. Waleed Tariq Saigol Mr. Danial Taufique Saigol Mr. Shafiq Ahmed Khan Mr. Arif Ijaz Syed Mohsin Raza Naqvi
Audit CommitteeMr. Shafiq Ahmed Khan ChairmanMr. Arif Ijaz MemberMr. Sayeed Tariq Saigol MemberMr. Waleed Tariq Saigol Member
Human Resource & Remuneration CommitteeMr. Shafiq Ahmed Khan ChairmanMr. Arif Ijaz MemberMr. Sayeed Tariq Saigol MemberMr. Danial Taufique Saigol Member
Chief Financial OfficerSyed Mohsin Raza Naqvi
Mills • Peshawar Road, Rawalpindi Tel: (0092-51) 5495328-32 Fax: (0092-51) 5495304
• 8 K.M., Manga Raiwind Road, District Kasur Tel: (0092-42) 32560683-85, Fax: (0092-42) 32560686-87
• Gulyana Road, Gujar Khan, District Rawalpindi Tel: (0092-51) 3564472-74
Website: • www.kmlg.com
Note -KTML’s Financial Statements are also available at the above website
Company SecretaryMr. Muhammad Ashraf
Chief Internal AuditorMr. Zeeshan Malik Bhutta
AuditorsM/s. Riaz Ahmad & CompanyChartered Accountants
Legal AdviserMr. Abdul Rehman Qureshi Advocate High Court
Registered Office42-Lawrence Road, Lahore.Tel: (0092-42) 36302261-62Fax: (0092-42) 36368721
Share RegistrarVision Consulting Limited1st Floor, 3-C, LDA Flats,Lawrence Road, LahoreTel: (0092-42) 36283096-97Fax: (0092-42) 36312550E-Mail: [email protected]
Bankers of the CompanyAl Baraka Bank (Pakistan) LimitedAllied Bank LimitedAskari Bank LimitedBank Alfalah LimitedBank Al-Habib LimitedFaysal Bank LimitedJS Bank LimitedMCB Bank LimitedMeezan Bank LimitedNational Bank LimitedPAIR Investment Company LimitedThe Bank of PunjabUnited Bank Limited

KOHINOOR TEXTILE MILLS LIMITED08
OUR VISIONThe Kohinoor Textile Mills Limited stated vision is to achieve and then remain as the most progressive and profitable Company in Pakistan in terms of industry standards and stakeholders’ interest.
OUR MISSIONThe Company shall achieve its mission through a continuous process of having sourced, developed, implemented and managed the best leading-edge technology, industry best practice, human resource and innovative products and services and sold these to its customers, suppliers and stakeholders.

ANNUAL REPORT 2019 09

KOHINOOR TEXTILE MILLS LIMITED10

ANNUAL REPORT 2019 11
OUR VALUESEMPATHYWe share each others’ feelings and emotions, making us a stronger, more cohesive team; we communicate effectively and approach challenges collectively.
INTEGRITYWe ensure adherence to moral and ethical principles; we act with honesty, we do not compromise our values.
PASSIONIt’s about growth & success; we chase our goals and objectives – personal & professional – with the highest level of energy and enthusiasm.
KOHINOOR TEXTILE MILLS LIMITED12
CODE OF BUSINESS CONDUCT AND ETHICAL PRINCIPLESThe following principles constitute the code of conduct which all directors and employees of Kohinoor Textile Mills Limited are required to apply in their daily work and observe in the conduct of Company’s business.
While the Company will ensure that all employees are fully aware of these principles, it is the responsibility of each employee to implement the Company’s policies. Contravention is viewed as misconduct.
The code emphasizes the need for a high standard of honesty and integrity which are vital for the success of any business.
ETHICAL PRINCIPLES 1. Directors and employees are expected not
to engage in any activity which can cause conflict between their personal interest and the interest of the Company such as interest in an organization supplying goods/ services to the Company or purchasing its products. In case a relationship with such an organization exists, the same must be disclosed to the Management.
2. Dealings with third parties which include Government officials, suppliers, buyers, agents and consultants must always ensure that the integrity and reputation of the Company are not in any way compromised.
3. Directors and employees are not allowed to accept any favours or kickbacks from any organization dealing with the Company.
4. Directors and employees are not permitted to divulge any confidential information relating to the Company to any unauthorized person. Nor should they, while communicating
publicly on matters that involve the Company’s business, presume to speak for the Company unless they are certain that the views that they express are those of the Company and it is the Company’s desire that such views be publicly disseminated.
5. All employees share a responsibility for the Company’s good public relations particularly at the community level. Their readiness to help with religious, charitable, educational and civic activities is accordingly encouraged provided it does not create an obligation that interferes with their commitment to the Company’s best interests.
6. The Company has strong commitment to the health and safety of its employees and preservation of the environment and the Company will persevere towards achieving continuous improvement of its Health, Safety and Environment (HSE) performance by reducing potential hazards, preventing pollution and improving awareness. Employees are required to operate the Company’s facilities and processes keeping this commitment in view.
7. Commitment and team work are key elements to ensure that the Company’s work is carried out effectively and efficiently. Also all employees will be equally respected and actions such as sexual harassment and disparaging remarks based on gender, religion, race or ethnicity will be avoided.

ANNUAL REPORT 2019 13
CORPORATE STRATEGYWe, at Kohinoor Textile Mills Limited, manufacture and market yarn, cloth and wide range Home textiles. Our strategy is to be competitive in the market through quality and efficient operations. As a responsible member of the community, we are committed to serve the interests of our stakeholders and contribute towards the prosperity of the Country.
CULTUREOrganisational culture in Kohinoor Textile Mills Limited depicts the Company’s philosophy which is based on shared values and beliefs. The Company is committed to build a strong corporate culture based on its core value at the highest standards of Empathy, Integrity and Passion. The Company believes in empowering its people by encouraging a culture of collective efforts for the achievement of Company’s vision and objectives followed by self-assessment for continuous improvement.

KOHINOOR TEXTILE MILLS LIMITED14
GROUP STRUCTUREThe Company is a part of Kohinoor Maple Leaf Group (KMLG). KMLG structure comprises of two listed public limited companies i.e. Kohinoor Textile Mills Limited (KTML) and Maple Leaf Cement Factory Limited (MLCF) and three unlisted public limited companies i.e. Maple Leaf Capital Limited (MLCL), Maple Leaf Power Limited (MLPL) and Kohinoor Capital Limited (KCL).
Maple Leaf Capital Limited (MLCL)
Wholly-owned subsidiary of MLCFL
55.22% subsidiary 82.92% subsidiary
Maple Leaf Power Limited (MLPL)
Wholly-owned subsidiary of MLCL
Kohinoor Capital Limited(KCL)
Kohinoor Textile Mills Limited (KTML)
The Holding Company
y
Maple Leaf Cement Factory Limited (MLCFL)
Kohinoor Textile Mills Limited (KTML) is a parent Company of other four below mentioned Companies. The initial capacity of its Rawalpindi Unit comprised 25,000 spindles and 600 looms. Later, fabric processing facilities were added and spinning capacity was augmented. Additional production facilities were acquired on the Raiwind-Manga Road near Lahore in District Kasur and on the Gulyana Road near Gujar Khan, by way of merger.
Maple Leaf Cement Factory Limited (MLCFL) was incorporated in Pakistan on 13 April 1960 under the Companies Act, 1913 (now the Companies Act, 2017) as a public company limited by shares. The Company is listed on Pakistan Stock Exchange. The cement factory is located at Iskanderabad District Mianwali in the province of Punjab. The principal activity of the Company is production and sale of cement. The Company is a subsidiary of Kohinoor Textile Mills Limited (“the Holding Company”).
Maple Leaf Power Limited (MLPL), a wholly owned subsidiary of MLCF, an unlisted public limited company, has established a 40 MW Coal Fired Power Plant at Iskanderabad, District Mianwali which has successfully started its commercial production
on 12th October 2017. The project was completed within budget and as per the planned timelines. The principal activity of MLPL is to generate, purchase, transform, distribute and supply electric power to MLCF. The project has added another reliable and inexpensive source of power compared to the national grid and has reduced dependency on the same. Project has provided a cushion against current bullish trend in furnace oil prices and is the cheapest source of electricity after waste heat recovery plant.
Maple Leaf Capital Limited (MLCL), was incorporated in Pakistan on 25 April 2014 under the Companies Ordinance 1984 (now the Companies Act, 2017) as a public company limited by shares. The principal object of MLCL is to buy, sell, hold or otherwise acquire or invest its capital in any sort of financial instruments. MLCL is a subsidiary of KTML.
Kohinoor Capital Limited (KCL) was incorporated in Pakistan on 28 Nov 2018 under the Companies Act, 2017 as a public company limited by shares. The principal object of KCL is to buy, sell, hold or otherwise acquire or invest its capital in any sort of financial instruments. KCL is a wholly owned subsidiary of MLCL.

ANNUAL REPORT 2019 15
ORGANIZATION CHART
SeniorSenior Senior Senior
Legends:KTML: Kohinoor Textile Mills Limited
Functional Reporting
Administrative Reporting
Audit Committee
HR & R Committee
ProjectManagementCommittee
BusinessProcess
Re-engineeringCommittee
EnergyManagementCommittee
TotalQuality
ManagementCommittee
StandardOperating
ProceduresReview
Committee

KOHINOOR TEXTILE MILLS LIMITED16
GEOGRAPHICAL PRESENCE
MillsPeshawar Road, Rawalpindi
MillsGulyana Road, Gujar Khan, Rawalpindi
Mills8 K.M., Manga Raiwind Road, District: Kasur
Regional Sales Office25-West Wharf Road,Karachi
Head office42 - Lawrence Road, Lahore
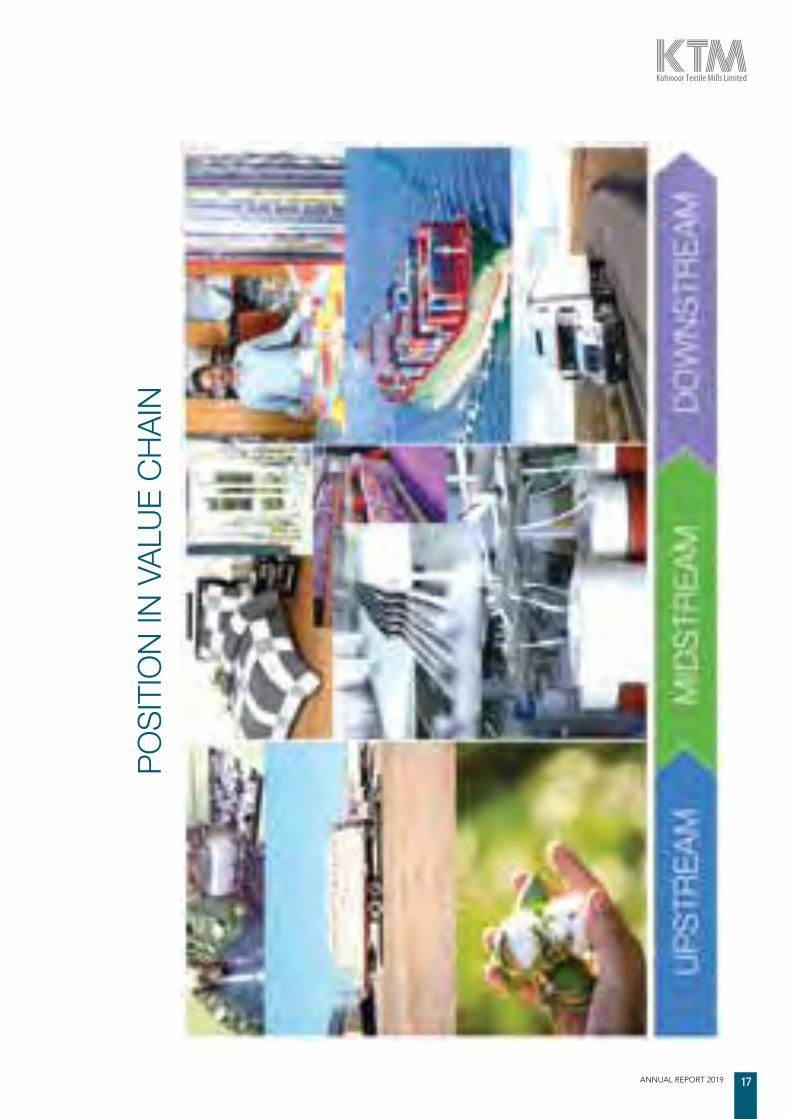
ANNUAL REPORT 2019 17
POSI
TIO
N IN
VAL
UE C
HAIN

KOHINOOR TEXTILE MILLS LIMITED18
FACTORS EFFECTING EXTERNAL ENVIRONMENTExternalComponent
Political
Economic
Factors
• Frequent changes introduced by Government in regulations for doing business.
• Reduced foreign investment badly impacting the performance of Pakistan stock exchange (PSX)
• Price hike in major input costs (imported materials) due to devaluation of local currency.
• Inflation
Organizational response
• Management proactively plans to manage the operations of Company in a way so that full compliance may be made with all applicable rules & regulations.
• Impact on financials for each new amendment is monitored by projection / analysis on continuous basis so that operational decisions may be made efficiently.
• Exploring new export markets is an ongoing exercise to efficiently utilize production capacities in response to reduction in sales volumetric growth in local market.
• Regular market analysis by senior management and the Board.
• Conducting corporate briefings and roadshows, both at national and international level, to mitigate the impact of government policies and actions on the market capitalization of the company. It further helped increase and sustain foreign shareholding in the total capital structure of the company.
• The company met price hikes in input costs by:
• Efficient procurement of local & imported cotton with better negotiation.
• Effective inventory management by meticulously reviewing inventory holding periods.
• Cost reduction initiatives to control production and non -production related fixed costs
• The company avoided the enormous forex hit by paying maximum portion of LC in advance of its ongoing expansion projects and procurement of raw materials.

ANNUAL REPORT 2019 19
ExternalComponent
Social
Technological
Legal
Factors
• Stakeholders’ inclination towards CSR compliant organizations
• Better retention in organizations offering affordable health and educational facilities
• Attitude change towards welfare of public at large
• Technical obsolescence of production facilities
• Continuous development of information technology infrastructures and Management Information Systems (MIS) software
• Communication infrastructure
• Enforcement of new Companies Act, 2017
• Continuous amendment in the provisions of income tax ordinance 2001 and sales tax act 1990 resulting from finance bill on annual basis
• Amendments in the requirements of code of corporate governance, Pakistan stock exchange rules and the requirements of SECP act
• Severe FBR actions to deter non- compliance and late payments
• Amendments in employment laws and industrial relations regulations
Organizational response
• Ensuring compliance with all requirements of Corporate Social responsibility
• The Company supports provision of educational facilities for public at large and the Board has approved the construction of Al-Aleem medical college in Gulab Devi Educational Complex.
• Company has the most novel technology to avoid any risk of technical obsolescence and keep on investing on BMR.
• Company continuously invests in the robust hardware and software for system up-gradation and MIS. Recently company has managed ERP modules for meeting latest reporting needs.
• The company has ensured the provision of latest Microsoft outlook software to meet communication needs of all company personals internally and with all external stakeholder groups.
• Company has engaged an efficient team of professionals to ensure compliance with all enacted or substantially enacted statutes, acts and ordinances. It further equips the company with an up to date knowledge of all prevailing legal requirements.
• Company ensures that all taxes and duties payments, whether income tax or sales tax, are made timely by having an effective cash management system in place.
• The Company has equipped itself with a competent legal team to make itself updated on employment and industrial laws. It further helps the management in complying with requisite updates on timely basis.

KOHINOOR TEXTILE MILLS LIMITED20
ExternalComponent
Environmental
Factors
• Attitude towards and support for renewable energy
• Air pollution & deforestation
• Lowering of underground water belt
• Growing attention towards “green” attitudes
Organizational response
• Company is successfully operating waste heat recovery project (WHRP) for electricity generation from emitted heat of the engines. Solar based power generation has also augmented the operational efficiencies of the Company.
• Planting trees to limit the emission of harmful gases in the atmosphere and to ensure maintenance and lifting up the underground water level by reducing the evaporation process.
• Various water conservation plans are under process
• The Company has been approved the standards of ISO 14001 and ISO 18001 for complying with an effective Environmental Management System (EMS) and Occupational Health and Safety Assessment Series (OHSAS) requirements.
Note:
In connection with risk and opportunities pertaining to the Company, Board’s efforts for determining level of risk, Board’s statement regarding robust assessment of risks, information about default in payment of any debt and inadequacy in capital structure have been covered in the Directors’ Report.
SIGNIFICANT CHANGES FROM PRIOR YEARS
In comparison to the preceding year, a new venture, i.e., Kohinoor Capital Limited – a public unlisted company has been added in group structure during the current year.
External environment is constantly changing and rise in raw material prices globally followed by unprecedented devaluation of Pak. Rupee in comparison to US Dollar have affected the profitability of the Company.
EFFECT OF SEASONALITY ON BUSINESS IN TERMS OF PRODUCTION AND SALES
Being exporter of Home Textiles mostly in western countries, sales of the company show significantly increase in 2nd quarter of the year due to spiritual Christmas occasion across western world. Thereafter demand little bit slows for some time which again reaches to its normal pace.
KTML strength is to produce fine count of yarn that is used for summer suiting. Sales significantly increase in winter because cotton / lawn dresses are being prepared across the market in winter season to meet requirements. Due to less winter span, for which suiting is prepared in summer season, demand little bit slowdown for some time in summer.
ANNUAL REPORT 2019 21
STRATEGY AND RESOURCE ALLOCATION

KOHINOOR TEXTILE MILLS LIMITED22
STRATEGIC OBJECTIVES 2019 – 2020
Following are the main areas that constitute the strategic objectives of Kohinoor Textile Mills Limited: -
Short Term Objectives
1. Effective use of available resources; and
2. Improved capacity utilization of the Company’s production facilities.
Medium Term Objectives
3. Effective marketing and innovative concepts;
4. Modernization of production facilities to ensure the most effective production;
5. Further improvements in implementation of Code of Corporate Governance through optimization of management processes; and
6. Strengthening independence in terms of secure supply of low-cost services and resources, including energy supply, transportation and logistics services.
Long Term Objectives
7. Explore alternative energy resources;
8. Implementation of effective technical and human resource solutions. Personnel development, creating proper environment for professional growth of highly skilled professionals, ensuring safe labour environment, competitive staff remuneration and social benefits in accordance with scope and quality of their work;
9. Compliance with local and international environmental and quality management standards, implementation of technologies allowing to comply with the limitations imposed on pollutant emissions; and
10. Implementation of projects in the social and economic development of communities.

ANNUAL REPORT 2019 23
STRATEGIES AND MANAGEMENT
OBJECTIVES
Management has the objective to transform the culture of the Company into highly customer driven, empowered and cross functionality focused company in order to maximize the return for stakeholders. Management has the belief that Quality may not be achieved without implementation of Key Performance Indicators (KPI’s) in all the critical, contemporary areas of performance.
Total Quality Management team has been formed to monitor the KPI’s in all the key areas on continuous basis and make corrective actions instantly where required. We strive to achieve our objectives with collective wisdom and empathy. We believe that training was and will remain the source of all process driven thinking. Accordingly, trainings for management team have been regularly arranged during the year 2018-19 and will continue in the year 2019-20. We have framed well defined different teams to address the key areas like Team energy, Team strategy, Team Culture Development etc.
We have reduced variable cost due to efficient energy management and other cost reduction measures. The to-date result, financial and non-financial, are the reflection of achievement of management’s objective which are strategically placed to increase the wealth of stakeholder. The said results are properly evaluated against the respective strategic objectives to confirm the achievement.
There is no material change in Company’s objective and strategies from the previous year.
ENTITY’S SIGNIFICANT RESOURCES
Our resources consist of mainly human resource, financial resource, and technological resource. The Company assorted and hired team of professionals with enormous expertise in latest technologies who proficiently design the ways for improving and upgrading our production process, networking and control systems. We have developed a dedicated team to analyse the human resource right from selection till retirement. We believe in adding value to our human resource by extensive trainings and development program.
KOHINOOR TEXTILE MILLS LIMITED24
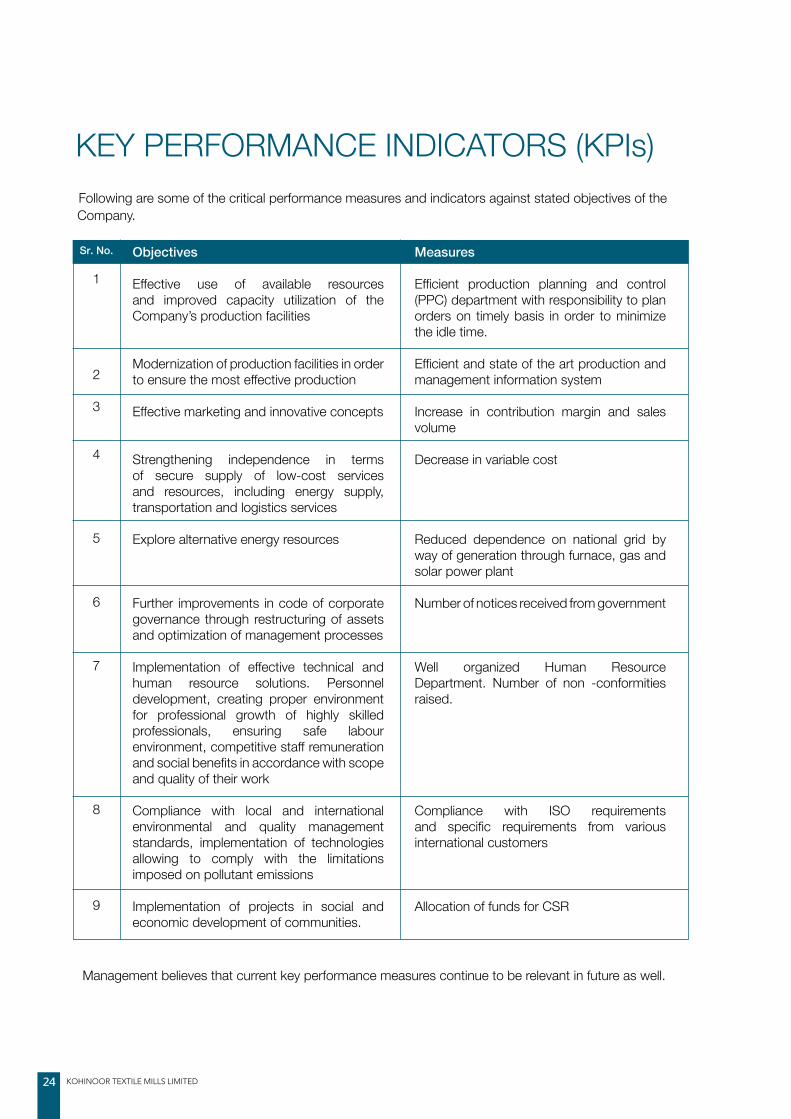
KEY PERFORMANCE INDICATORS (KPIs)
Management believes that current key performance measures continue to be relevant in future as well.
Following are some of the critical performance measures and indicators against stated objectives of the Company.
Sr. No.
1
2
3
4
5
6
7
8
9
Objectives
Effective use of available resources and improved capacity utilization of the Company’s production facilities
Modernization of production facilities in order to ensure the most effective production
Effective marketing and innovative concepts
Strengthening independence in terms of secure supply of low-cost services and resources, including energy supply, transportation and logistics services
Explore alternative energy resources
Further improvements in code of corporate governance through restructuring of assets and optimization of management processes
Implementation of effective technical and human resource solutions. Personnel development, creating proper environment for professional growth of highly skilled professionals, ensuring safe labour environment, competitive staff remuneration and social benefits in accordance with scope and quality of their work
Compliance with local and international environmental and quality management standards, implementation of technologies allowing to comply with the limitations imposed on pollutant emissions
Implementation of projects in social and economic development of communities.
Measures
Efficient production planning and control (PPC) department with responsibility to plan orders on timely basis in order to minimize the idle time.
Efficient and state of the art production and management information system
Increase in contribution margin and sales volume
Decrease in variable cost
Reduced dependence on national grid by way of generation through furnace, gas and solar power plant
Number of notices received from government
Well organized Human Resource Department. Number of non -conformities raised.
Compliance with ISO requirements and specific requirements from various international customers
Allocation of funds for CSR
ANNUAL REPORT 2019 25
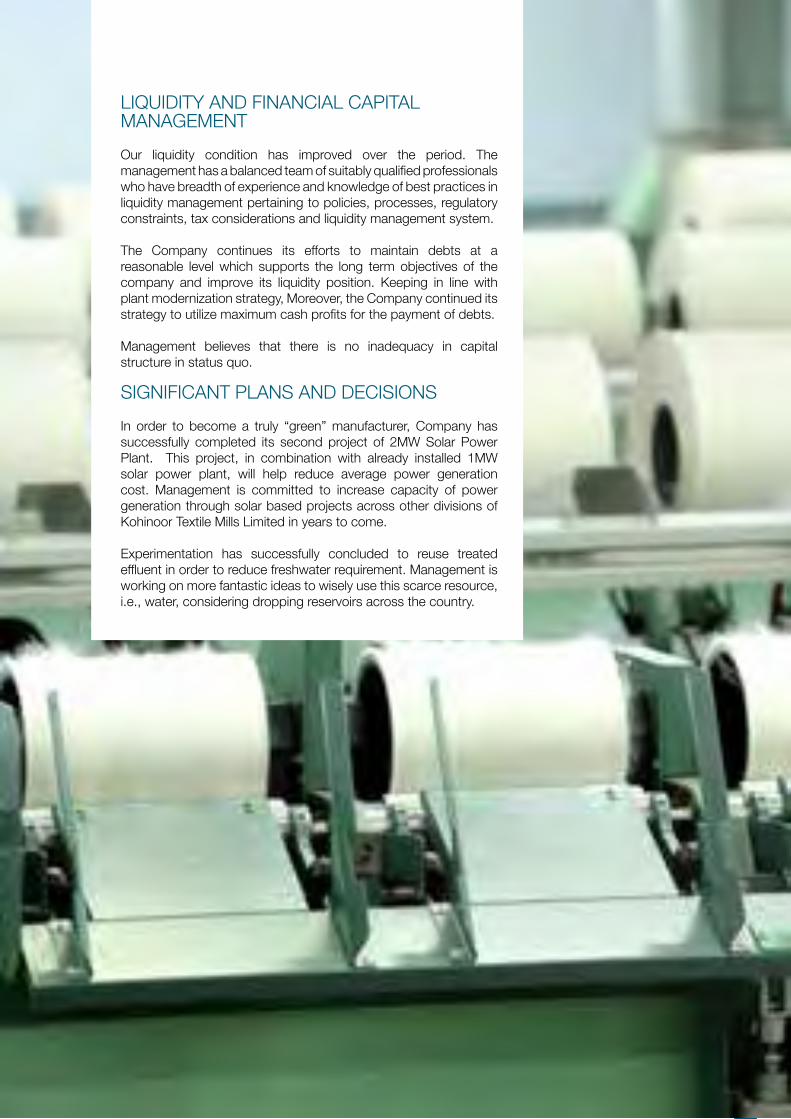
LIQUIDITY AND FINANCIAL CAPITAL MANAGEMENT Our liquidity condition has improved over the period. The management has a balanced team of suitably qualified professionals who have breadth of experience and knowledge of best practices in liquidity management pertaining to policies, processes, regulatory constraints, tax considerations and liquidity management system.
The Company continues its efforts to maintain debts at a reasonable level which supports the long term objectives of the company and improve its liquidity position. Keeping in line with plant modernization strategy, Moreover, the Company continued its strategy to utilize maximum cash profits for the payment of debts.
Management believes that there is no inadequacy in capital structure in status quo.
SIGNIFICANT PLANS AND DECISIONSIn order to become a truly “green” manufacturer, Company has successfully completed its second project of 2MW Solar Power Plant. This project, in combination with already installed 1MW solar power plant, will help reduce average power generation cost. Management is committed to increase capacity of power generation through solar based projects across other divisions of Kohinoor Textile Mills Limited in years to come.
Experimentation has successfully concluded to reuse treated effluent in order to reduce freshwater requirement. Management is working on more fantastic ideas to wisely use this scarce resource, i.e., water, considering dropping reservoirs across the country.

KOHINOOR TEXTILE MILLS LIMITED26
RISKS ANDOPPORTUNITIES

ANNUAL REPORT 2019 27
RISKS AND OPPORTUNITIES ANALYSISThe Board of Directors is committed to minimize the risks and take advantage of potential opportunities to systematically and sustainably improve the value of the Company for all stakeholders. Management has adopted a risk management approach and internal control framework, based on its business philosophy and corporate objectives, which is explained below:
STRATEGY FORMULATION
Management reviews the Statement of Strategic Objectives annually that represent the Stakeholder’ expectations and are the lead indicators for determining the success level of the Company. To materialize the objectives, Management adopts certain strategies. These strategies are approved by the Board of Directors and are subject to adjustment, depending upon any changes in the external business environment or internal organizational factors.
RISK ASSESSMENT
Risk assessment is an on-going process that highlights numerous uncertainties that poses potential threats which may hinder the accomplishment of objectives of the Company. If these risks are not being addressed in timely manner, may culminate in loss. Such risks and uncertainties can arise both from external as well as internal factors within the Company. Broad categories of risks which may hinder operations of the Company are as follows:
RISKS TYPE IMPLICATION
Strategic Risks Strategic risks can be defined as the uncertainties and untapped opportunities embedded in strategic intent. These risks are key matters for the Board of Directors, and impinge on the whole business, rather than just an isolated unit.
Commercial Risks Commercial risks refer to potential losses arising from the trading partners or the market in which the Company operates.
Operational Risks Operational risks refer to risks resulting from breakdowns in internal procedures, people and system.
Financial Risks Financial risk is an umbrella term for multiple types of risk associated with financing, profitability, liquidity and credit.
MATERIALITY APPROACH
Management believes materiality as a key component of an effective communication with stakeholders. The management has adopted materiality approach which is based on a combination of stakeholder engagement, understanding of environmental limits and strategic alignment. It has made the process, assumptions and evidence base for identifying material issues for more transparent, credible and amenable disclosures to have more transparency on risk and opportunities.
Not being conclusive, management considers that following are the major risks which may affect the operations of the Company and mitigating strategies for these risks.
KOHINOOR TEXTILE MILLS LIMITED28
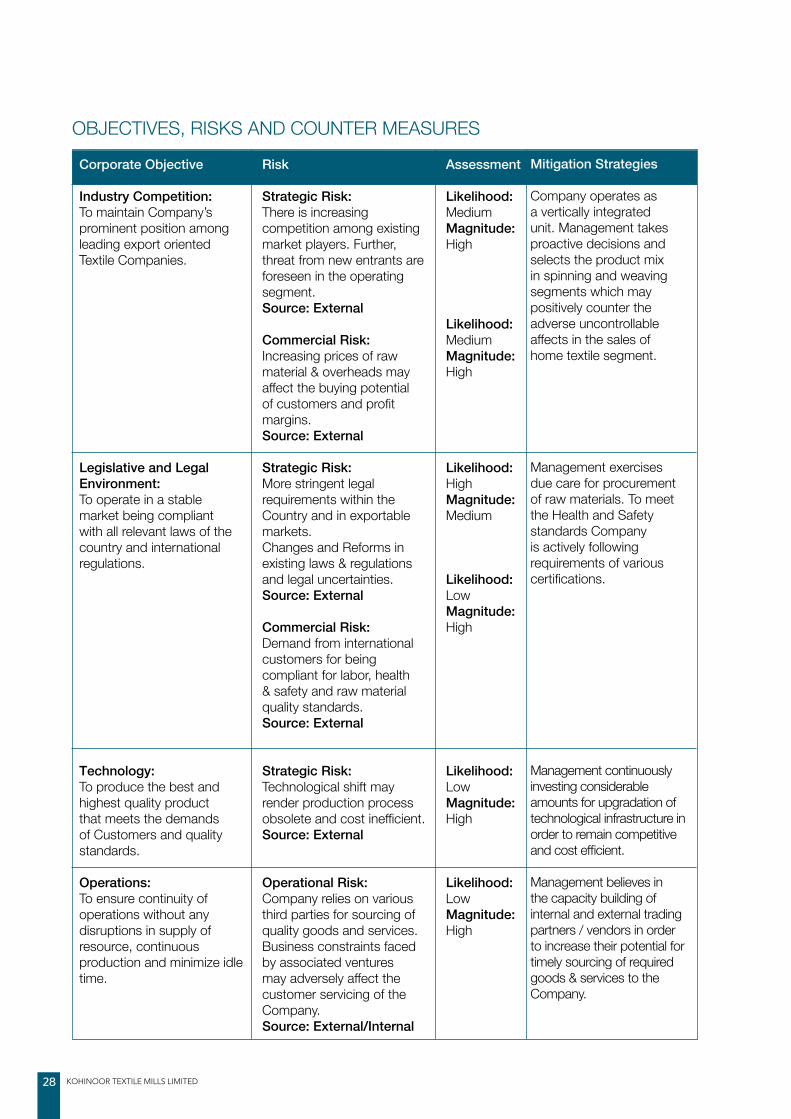
Corporate Objective
Industry Competition:To maintain Company’s prominent position among leading export oriented Textile Companies.
Legislative and Legal Environment: To operate in a stable market being compliant with all relevant laws of the country and international regulations.
Technology:To produce the best and highest quality product that meets the demands of Customers and quality standards.
Operations:To ensure continuity of operations without any disruptions in supply of resource, continuous production and minimize idle time.
Risk
Strategic Risk:There is increasing competition among existing market players. Further, threat from new entrants are foreseen in the operating segment.Source: External
Commercial Risk:Increasing prices of raw material & overheads may affect the buying potential of customers and profit margins.Source: External
Strategic Risk: More stringent legal requirements within the Country and in exportable markets.Changes and Reforms in existing laws & regulations and legal uncertainties.Source: External
Commercial Risk:Demand from international customers for being compliant for labor, health & safety and raw material quality standards.Source: External
Strategic Risk: Technological shift may render production process obsolete and cost inefficient.Source: External
Operational Risk: Company relies on various third parties for sourcing of quality goods and services. Business constraints faced by associated ventures may adversely affect the customer servicing of the Company.Source: External/Internal
Assessment
Likelihood:MediumMagnitude:High
Likelihood:MediumMagnitude:High
Likelihood:HighMagnitude:Medium
Likelihood:LowMagnitude:High
Likelihood:LowMagnitude:High
Likelihood:LowMagnitude:High
Mitigation Strategies
Company operates as a vertically integrated unit. Management takes proactive decisions and selects the product mix in spinning and weaving segments which may positively counter the adverse uncontrollable affects in the sales of home textile segment.
Management exercises due care for procurement of raw materials. To meet the Health and Safety standards Company is actively following requirements of various certifications.
Management continuously investing considerable amounts for upgradation of technological infrastructure in order to remain competitive and cost efficient.
Management believes in the capacity building of internal and external trading partners / vendors in order to increase their potential for timely sourcing of required goods & services to the Company.
OBJECTIVES, RISKS AND COUNTER MEASURES
ANNUAL REPORT 2019 29
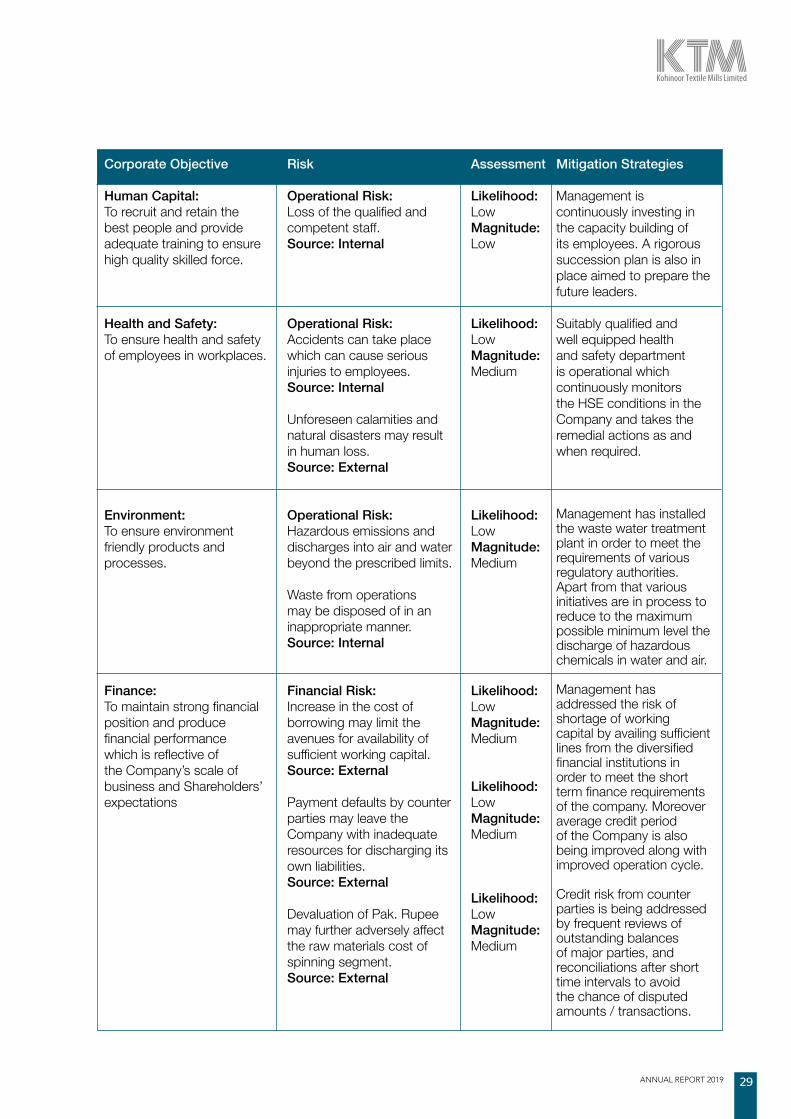
Corporate Objective
Human Capital:To recruit and retain the best people and provide adequate training to ensure high quality skilled force.
Health and Safety:To ensure health and safety of employees in workplaces.
Environment:To ensure environment friendly products and processes.
Finance:To maintain strong financial position and produce financial performance which is reflective of the Company’s scale of business and Shareholders’ expectations
Risk
Operational Risk:Loss of the qualified and competent staff.Source: Internal
Operational Risk: Accidents can take place which can cause serious injuries to employees.Source: Internal
Unforeseen calamities and natural disasters may result in human loss.Source: External
Operational Risk:Hazardous emissions and discharges into air and water beyond the prescribed limits.
Waste from operations may be disposed of in an inappropriate manner.Source: Internal
Financial Risk:Increase in the cost of borrowing may limit the avenues for availability of sufficient working capital.Source: External
Payment defaults by counter parties may leave the Company with inadequate resources for discharging its own liabilities.Source: External
Devaluation of Pak. Rupee may further adversely affect the raw materials cost of spinning segment.Source: External
Assessment
Likelihood:LowMagnitude:Low
Likelihood:LowMagnitude:Medium
Likelihood:LowMagnitude:Medium
Likelihood:LowMagnitude:Medium
Likelihood:LowMagnitude:Medium
Likelihood:LowMagnitude:Medium
Mitigation Strategies
Management is continuously investing in the capacity building of its employees. A rigorous succession plan is also in place aimed to prepare the future leaders.
Suitably qualified and well equipped health and safety department is operational which continuously monitors the HSE conditions in the Company and takes the remedial actions as and when required.
Management has installed the waste water treatment plant in order to meet the requirements of various regulatory authorities. Apart from that various initiatives are in process to reduce to the maximum possible minimum level the discharge of hazardous chemicals in water and air.
Management has addressed the risk of shortage of working capital by availing sufficient lines from the diversified financial institutions in order to meet the short term finance requirements of the company. Moreover average credit period of the Company is also being improved along with improved operation cycle.
Credit risk from counter parties is being addressed by frequent reviews of outstanding balances of major parties, and reconciliations after short time intervals to avoid the chance of disputed amounts / transactions.

KOHINOOR TEXTILE MILLS LIMITED30
OPPORTUNITY ANALYSISUnlocking and exploiting operational opportunities is an important aspect of Kohinoor entrepreneurial activities. We are committed to use existing products and new solutions to systematically enhance our growth and strengthen our position in global markets. Investing in new projects and increasing the productivity of existing ones are key elements for future organic growth. In the year under review, we strengthened the basis for further growth in the coming years by making selective investments in our existing businesses and developing innovations that support in achievement of company’s stated vision.
In connection with risk and opportunities pertaining to the Company, Board’s efforts for determining level of risk, Board’s statement regarding robust assessment of risks, information about default in payment of any debt and inadequacy in capital structure have been covered in the Director’s Report.
Key opportunity
Growing demand in local market
Source: External
Cost reduction by using innovative production technology.
Source: Internal
Development of human relations/resource.
Source: Internal
Improvements in the business process.
Source: Internal
Impact area
Social & relationship capital and; Financial Capital
Manufactured capital
Human capital
Financial capital
Strategy to materialize
The Company has increased its capacity of fabric printing by adding a latest machine of digital printing technology.
The Company, realizing the importance of reducing electric costs, has an active waste heat recovery plant at site which converts heat from power engine into steam, which was previously lost, into energy. Furthermore, the recent completed 2-MW solar power plant in addition to existing 1-MW plant further provides free electricity to the Company.
Developing the human resource is engraved in the company’s mission statement and long-term objectives. By conducting extensive trainings and through its development program, the human resource add value to the company with their professional ability, caliber and integrity.
The Company can capture healthy profits through its ability to:
• Operate at maximum capacity• efficient cash management system• making sound liquid investments• effective control over inventory

ANNUAL REPORT 2019 31
KEY RISKS AND OPPORTUNITIES OF CAPITALS
FORM OF CAPITAL KEY RISK KEY OPPORTUNITIES
Financial Capital Increased fuel Growing demand in local market, energy and power cost / finance cost generation through solar power plant.
Human Capital Loss of qualified and Bagging unparalleled and competent staff ideal workforce from the market.
Manufacturing Capital Obsolescence of technology Investing in the latest technologies and state of the art equipment.
Social and Relationship Bad reputation and publicity Building relationships along the valueCapital chain and developing the Company portfolio. Natural Capital Water shortages Easy access to local raw materials for yarn and fabric manufacture.

KOHINOOR TEXTILE MILLS LIMITED32
CORPORATE BRIEFING• NOTICE OF ANNUAL GENERAL MEETING• CHAIRMAN’S REVIEW• DIRECTORS’ REPORT TO THE SHAREHOLDERS• STATEMENT OF COMPLIANCE WITH LISTED COMPANIES (CODE
OF CORPORATE GOVERNANCE) REGULATIONS, 2017• INDEPENDENT AUDITOR’S REVIEW REPORT ON THE STATEMENT
OF COMPLIANCE CONTAINED IN LISTED COMPANIES (CODE OF CORPORATE GOVERNANCE) REGULATIONS, 2017
• REPORT OF THE AUDIT COMMITTEE• OTHER CORPORATE MATTERS
GOVERNANCE
ANNUAL REPORT 2019 33
NOTICE OF ANNUAL GENERAL MEETINGNotice is hereby given that the 51st Annual General Meeting of the members of Kohinoor Textile Mills Limited (the “Company”) will be held on Saturday, October 26, 2019 at 12:00 Noon at its Registered Office, 42-Lawrence Road, Lahore, to transact the following business: -
Ordinary Business:
1) To receive, consider and adopt the audited accounts of the Company including consolidated financial statements for the year ended June 30, 2019 together the Chairman’s Review, Directors’ and Auditors’ Reports thereon.
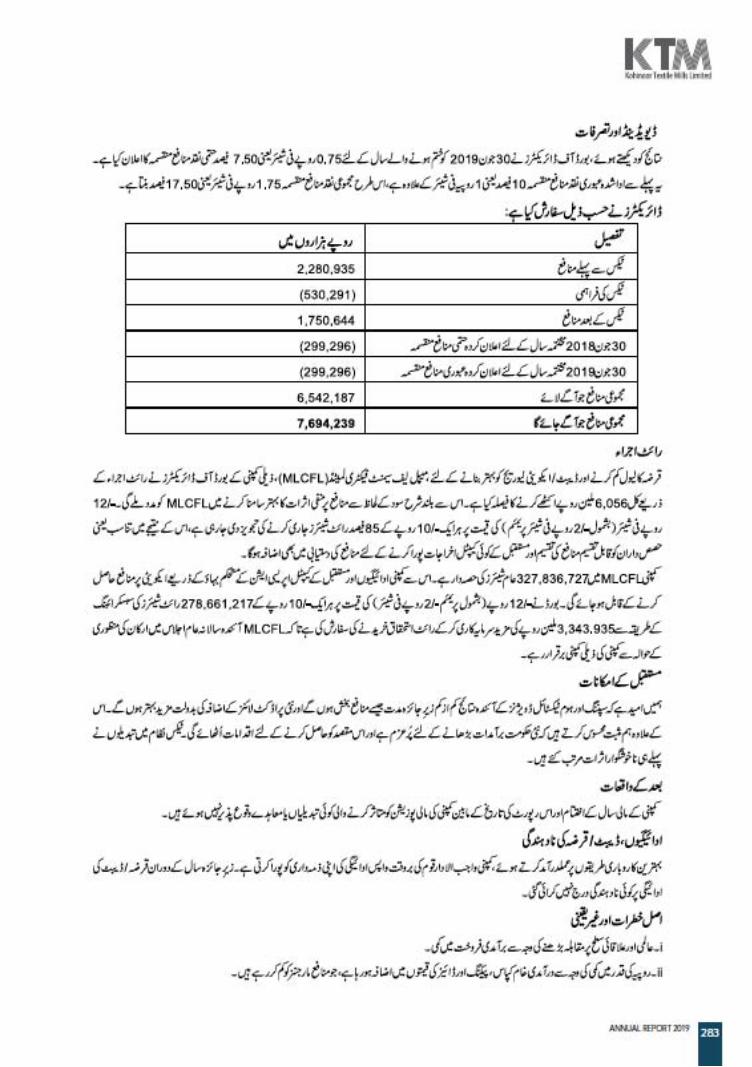
2) To approve final cash dividend for the year ended June 30, 2019 at Re. 0.75 per share (7.50%), as recommended by the Board of Directors. This is in addition to the interim cash dividend already paid to the shareholders at Re. 1/- per share (10%), thus making a total cash dividend at Rs.1.75 per share (17.50%) for the year.
3) To appoint Auditors for the year ending on June 30, 2020 and fix their remuneration. The Board has recommended, as suggested by the Audit Committee, the appointment of M/s. Riaz Ahmad & Company, Chartered Accountants, the retiring auditors and being eligible offer themselves for re-appointment.
Special Business:
4) To consider and, if deemed fit, pass the following Resolution as a Special Resolution under Section 199 of the Companies Act, 2017, with or without modification, as recommended by the Directors:-
“Resolved that the Chief Executive Officer of Kohinoor Textile Mills Limited (the “Company”) be and is hereby authorized to make a long term equity investment, in accordance with Section 199 of the Companies Act, 2017, in the ordinary share capital of Maple Leaf Cement Factory Limited, a subsidiary of the Company, upto Rs. 3,343.935 million for subscribing 85% right shares numbering 278,661,217 in the ratio of 85 shares for every 100 shares held of Rs. 10/- each at a price of Rs. 12/- per share (inclusive of premium of Rs. 2/- per share).
Resolved further that the Chief Executive Officer of the Company be and is hereby authorized to take any or all necessary actions to subscribe Right Shares and dispose off the shares so subscribed as and when he thinks fit on behalf of the Company.
Resolved further that the Company Secretary be and is hereby authorized to do all acts, deeds, things, and to take any or all necessary actions to complete all legal formalities and file all necessary documents in this regards as he thinks fit on behalf of the Company.”
5) To consider and, if deemed fit, pass the following resolution as a special resolution under Section 199 of the Companies Act, 2017, with or without modification, as recommended by the Directors:-
“Resolved by way of special resolution that consent and approval of Kohinoor Textile Mills Limited (the “Company”) be and is hereby accorded under Section 199 of the Companies Act, 2017 (the “Act”) for investment in the form of loans / advances from time to time to Maple Leaf Cement Factory Limited, a subsidiary of the Company, upto an aggregate sum of Rs. 1,500 million (Rupees one thousand five hundred million only) for a period of one year commencing November 01, 2019 to October 31, 2020 (both days inclusive) at the mark-up rate of one percent above the three months KIBOR or one percent above the average borrowing cost of the Company, whichever is higher. Vide special resolution passed in general meeting held on October 27, 2018 by the shareholders, the Company was authorized to extend a facility of similar nature to the extent of Rs. 1,000 million which is valid till October 31, 2019.
Resolved further that the Chief Executive Officer and the Company Secretary of the Company be and are hereby authorized singly to take all steps necessary, ancillary and incidental, corporate and legal formalities for the completion of transactions in relation to the loans / advances to the subsidiary company but not limited to filing of all the requisite statutory forms and all other documents with the Securities and Exchange Commission of Pakistan, executing
KOHINOOR TEXTILE MILLS LIMITED34
documents all such notices, reports, letters and any other document or instrument to give effect to the above resolution.”
6) To ratify and approve transactions conducted with the Related Parties for the year ended June 30, 2019 by passing the following special resolution with or without modification: -
“Resolved that the transactions conducted with the Related Parties as disclosed in the note 34 of the unconsolidated financial statements for the year ended June 30, 2019 and specified in the Statement of Material Information under Section 134(3) be and are hereby ratified, approved and confirmed.”
7) To authorize the Board of Directors of the Company to approve transactions with the related parties for the financial year ending on June 30, 2020 by passing the following special resolution with or without modification: -
“Resolved that the Board of Directors of the Company be and is hereby authorized to approve the transactions to be conducted with the Related Parties on case to case basis for the financial year ending on June 30, 2020.
Resolved further that these transactions by the Board shall be deemed to have been approved by the shareholders and shall be placed before the shareholders in the next Annual General Meeting for their formal ratification/approval.”
BY ORDER OF THE BOARD
Lahore: (Muhammad Ashraf) October 05, 2019 Company Secretary
NOTES:
1. The Share Transfer Books of the Company will remain closed from October 19, 2019 to October 26, 2019 (both days inclusive). Physical transfers / CDS Transaction IDs received at the Company’s Share Registrar, M/s. Vision Consulting Ltd, 3-C, LDA Flats, First Floor, Lawrence Road, Lahore, at the close of business on October 18, 2019 will be considered in time for the purpose of final cash dividend and to determine voting rights of the shareholders for attending the meeting.
2. A member eligible to attend, speak and vote at this meeting may appoint another member as his/her proxy to attend, speak and vote instead of him/her. CDC beneficial owners and Proxy Holder must bring with them their Computerized National Identity Cards (CNIC)/Passports in original to prove his/her identity. In case of Proxy, CDC beneficial owners and Proxy Holder must enclose an attested copy of their CNIC/Passport with Proxy Form. Proxies in order to be effective must be received at the Company’s Registered Office not later than 48 hours before the time for holding the meeting. A member shall not be entitled to appoint more than one proxy.
3. In case of corporate entity, the Board of Directors’ resolution / power of attorney with specimen signature of the nominee (unless it has been provided earlier) should be attached with the proxy form or may be provided at the time of meeting.

ANNUAL REPORT 2019 35
4. Members holding aggregate 10% or more shareholding, residing in a city other than Lahore, may demand the facility of video link for participation in the annual general meeting.
In this regard, please fill the following and submit at the Registered Office of the Company situated at 42-Lawrence Road, Lahore, at least 07 days prior to the date of Annual General Meeting.
“I/We, _____________________ of ____________________________________, being a member of Kohinoor Textile Mills Limited, holder of ___________ Ordinary Share(s) as per Registered Folio / CDC A/c # _______ hereby opt for video conference facility at ___________.
Signature of Member(s) / Attorney” (please affix company stamp in case of corporate entity)
5. The Members, who desire for receiving the annual audited financial statements and AGM Notice through e-mail, are requested to send their written consent on a Standard Request Form available on website www.kmlg.com in order to avail this facility. The audited financial statements for the year ended June 30, 2019 are available on website of the Company. Further, the Company has sent its Annual Report 2019 through CD/DVD/USB to the shareholders at their available Registered Addresses instead of hard copy. However, hard copy of Annual Report will be provided free of cost on written request of the shareholder.
6. Shareholders are requested to notify / submit the following information & documents, in case of book entry securities in CDS to their respective CDS participants and in case of physical shares to our Share Registrar, if not earlier provided / notified: -
a. Change in their addresses;
b. Pursuant to requirement of Section 242 of the Companies Act, 2017, any dividend payable in cash declared by a listed company shall only be paid through electronic mode directly into the bank account designated by the entitled shareholder. Accordingly, shareholders who have not yet provided / updated their International Bank Account Number (IBAN) details, are requested to furnish the information as provided on website of the Company on priority basis. In case of non-submission of IBAN of 24 digits, the Company will withhold the payment of dividends under the Companies (Distribution of Dividends) Regulations, 2017;
c. In case of non-submission of valid & legible copy of CNIC, the Company will be unable to comply with SRO 831(I)/2012 dated July 05, 2012 of SECP and will be constrained under the Companies Act, 2017 to withhold the payment of dividend to such shareholders;
d. Valid and legible copies of National Tax Number (NTN) or NTN Certificate(s) of corporate entities and must quote the company name and their respective Folio / CDC Account Numbers thereon while sending the copies to the Share Registrar of the Company;
e. Filer & Non-Filer shareholders will pay tax on dividend income @15% and 30% respectively. Therefore, please ensure that their name(s) have been entered into Active Taxpayers List (ATL) provided on website www.fbr.gov.pk of the Federal Board of Revenue (FBR), despite the fact that the shareholder is a filer, before the date of approval of cash dividend at the Annual General Meeting on October 26, 2019, otherwise tax on their cash dividend will be deducted @30% instead of 15%;
f. As per clarification of FBR, each joint holder is to be treated individually as either a ‘Filer’ or ‘Non-Filer’ and tax will be deducted on the basis of shareholding notified by each joint holder. Accordingly, such shareholder(s) may notify in writing within 07 days from entitlement date i.e. October 18, 2019 as per

KOHINOOR TEXTILE MILLS LIMITED36
following format to our Share Registrar. If no notification is received to our Share Registrar, then it will be assumed that the shares are held in equal proportion by the principal shareholder and the joint holder(s): -
Folio / CDC Total Principal Shareholder Joint Shareholder(s) Signature(s) Account No. Shares
Name & Shareholding Name & Shareholding CNIC No. Proportion CNIC No. Proportion (No. of Shares) (No. of Shares)
g. Valid income tax exemption certificate issued by the concerned Commissioner of Inland Revenue is to be furnished to the Company / Share Registrar in order to avail tax exemption u/s 150 of the Income Tax Ordinance 2001 (tax on dividend) where the statutory exemption under clause 47B of Part-IV of Second Schedule is available and want to avail exemption u/s 150 of the Ordinance, otherwise tax will be deducted under the provisions of laws;
h. Members are requested to submit their Notarized Declarations (CZ-50) as per Zakat & Ushr Ordinance, 1980 for zakat exemption, if they want to claim exemption towards non-deduction of zakat on cash dividend;
i. Pursuant to requirement of Section 244 of the Companies Act, 2017, shareholders who could not collect their cash dividends / physical shares, are advised to contact at the Registered Office of the Company to collect / enquire about their unclaimed dividends or physical shares, if any;
j. As per Section 72 of the Companies Act, 2017, every existing listed company shall be required to replace its physical shares with book-entry form in a manner as may be specified and from the date notified by the Commission, within a period not exceeding four years from the commencement of this Act, i.e. May 30, 2017;
The shareholders having physical shareholding are encouraged to open CDC sub-account with any of the brokers or Investor Account directly with CDC to place their physical shares into scrip less form, this will facilitate them in many ways, including safe custody and sale of shares, any time they want, as the trading of physical shares is not permitted as per existing regulations of the Pakistan Stock Exchange Ltd.
k. For any query / information, the shareholders may contact with the Company Secretary at the above Registered Office and / or Mr. Abdul Ghaffar Ghaffari of Share Registrar, Vision Consulting Ltd, 3-C, LDA Flats, Lawrence Road, Lahore, Ph. Nos. (042) 36283096-97.
ANNUAL REPORT 2019 37

KOHINOOR TEXTILE MILLS LIMITED38
STATEMENT UNDER SECTION 134(3) OF THE ACT:Agenda Item Number 4 of the Notice –Equity Investment in Maple Leaf Cement Factory Limited
Maple Leaf Cement Factory Limited, having its Registered Office at 42-Lawrence Road, Lahore (the “MLCFL”) and Authorized Share Capital of Rs. 9,000,000,000/- (Rupees nine billion only) divided into 900,000,000 shares of Rs. 10/- each, comprising 800,000,000 Ordinary and 100,000,000 Preference Shares of Rs. 10/- each, with issued, subscribed and Paid Up Capital of Rs. 5,937,006,660/- divided into 593,700,666 ordinary shares of Rs. 10/- each. MLCFL is a public listed company engaged in the business of manufacturing and sale of cement and the factory is located at Iskanderabad, District Mianwali. MLCFL is a subsidiary of the Company and the Company, being a holding company, holds 327,836,727 ordinary shares constituting 55.22% of the aggregate paid-up capital in MLCFL and has also established an additional dry process clinker production line of 7,300 tpd grey clinker production and its grey cement capacity has been enhanced upto 18,000 tons per day. Commercial production of its expansion project has been started in the month of May 2019.
This statement sets out the
material facts pertaining to the special business to be transacted
at the Annual General Meeting of the Company
to be held on October 26,
2019.
In order to reduce current debt levels and improve debt/equity leverage, MLCFL has announced 85% Ordinary Right Shares at a price of Rs. 12/- per share (inclusive of premium of Rs. 2/- per share) to its existing ordinary shareholders. This will help MLCFL to mitigate the adverse impact on profitability on account of rising interest costs.
The Board of Directors of the Company at their meeting held on September 20, 2019, has considered and recommended to subscribe the right entitlement by making an equity investment of Rs. 3,343.935 million by way of subscribing 278,661,217 ordinary right shares of Rs. 10/- each at a price of Rs. 12/- (inclusive of premium of Rs. 2/- per share) so that MLCFL continues to remain the subsidiary of the Company.
The Directors have carried out their due diligence relating to the proposed investment and duly signed recommendation of due diligence report shall be available for inspection of members in the general meeting along with the latest audited accounts of the subsidiary company.
ANNUAL REPORT 2019 39
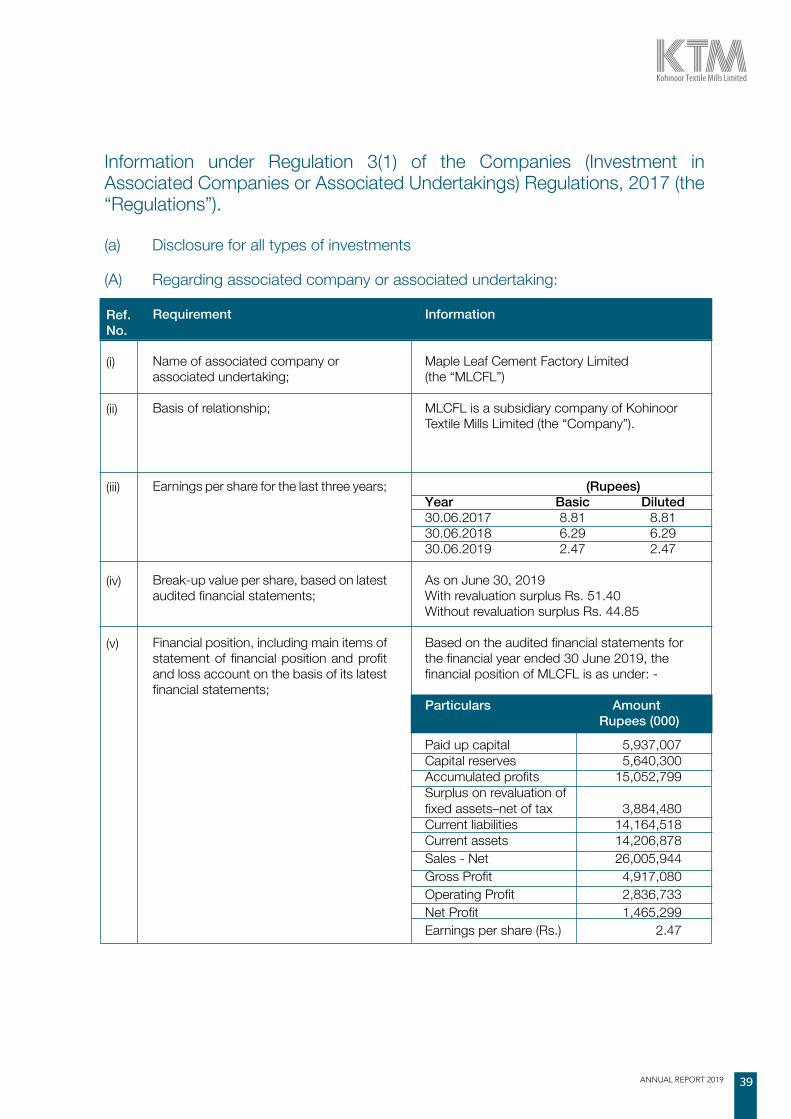
Information under Regulation 3(1) of the Companies (Investment in Associated Companies or Associated Undertakings) Regulations, 2017 (the “Regulations”).
(a) Disclosure for all types of investments
(A) Regarding associated company or associated undertaking:
Ref. No.
(i)
(ii)
(iii)
(iv)
(v)
Requirement
Name of associated company or associated undertaking;
Basis of relationship;
Earnings per share for the last three years;
Break-up value per share, based on latest audited financial statements;
Financial position, including main items of statement of financial position and profit and loss account on the basis of its latest financial statements;
Information
Maple Leaf Cement Factory Limited(the “MLCFL”)
MLCFL is a subsidiary company of Kohinoor Textile Mills Limited (the “Company”).
(Rupees)Year Basic Diluted30.06.2017 8.81 8.8130.06.2018 6.29 6.2930.06.2019 2.47 2.47
As on June 30, 2019With revaluation surplus Rs. 51.40Without revaluation surplus Rs. 44.85
Based on the audited financial statements for the financial year ended 30 June 2019, the financial position of MLCFL is as under: -
Particulars Amount Rupees (000)
Paid up capital 5,937,007Capital reserves 5,640,300Accumulated profits 15,052,799Surplus on revaluation of fixed assets–net of tax 3,884,480Current liabilities 14,164,518Current assets 14,206,878Sales - Net 26,005,944Gross Profit 4,917,080Operating Profit 2,836,733Net Profit 1,465,299Earnings per share (Rs.) 2.47

KOHINOOR TEXTILE MILLS LIMITED40
(B) General Disclosures:
Ref. No.
(i)
(ii)
(iii)
(iv)
(v)
Requirement
Maximum amount of investment to be made;
Purpose, benefits likely to accrue to the investing company and its members from such investment and period of investment;
Source of funds to be utilized for investment andwhere the investment is intended to be made using borrowed funds, - (I) Justification for investment through
borrowings;(II) Detail of collateral, guarantees
provided and assets pledged for obtaining such funds; and
(III) Cost benefit analysis;
Salient features of agreement(s), if any, with associated company or associated undertaking with regards to the proposed investment;
Direct or indirect interest of directors, sponsors, majority shareholders and their relatives, if any, in the associated company or associated undertaking or the transaction under consideration;
Information
Upto Rs. 3,343.935 million
Purpose: : KTML expects dividend income which would further augment the cash flow.
Benefits: Price appreciation of KTML’s share and better profit distribution to the valued shareholders of KTML
Period: A long term equity investment.
• Internal cash generation• Inter Corporate arrangement
• Funds will be utilized to partially finance the subscription of right entitlement of MLCFL so that it continues to remain subsidiary and lucrative return by way of payouts thus enhancing liquidity of KTML resulting in appreciation in KTML’s share value and better profit distribution to the shareholders of KTML.
• No collateral is considered necessary since funds are being arranged from Group Company.
NA
Investing Company i.e. KTML is a holding company of MLCF and Seven Directors are common in both the companies may be deemed to be interested to the extent of their shareholding.
None of the Directors or their relatives or associates are interested in any of the above resolution in any way except as members of the Company.

ANNUAL REPORT 2019 41
Ref. No.
(vi)
(vii)
Requirement
In case any investment in associated company or associated undertaking has already been made, the performance review of such investment including complete information/justification for any impairment or write offs; and
Any other important details necessary for the members to understand the transaction;
Information
Presently, KTML holds 55.22% ordinary shares of MLCFL. KTML’s liquidity has been augmented due to persistent dividend payouts by MLCFL since 2015. No impairment and/or write off has been recorded so far.
N/A
Ref. No.
(i)
(ii)
(iii)
(iv)
(v)
(vi)
Requirement
Maximum price at which securities will be acquired;
In case the purchase price is higher than market value in case of listed securities and fair value in case of unlisted securities, justification thereof;
Maximum number of securities to be acquired;
Number of securities and percentage thereof held before and after the proposed investment;
Current and preceding twelve weeks’ weighted average market price where investment is proposed to be made in listed securities; and
Fair value determined in terms of sub-regulation (1) of regulation 5 for investments in unlisted securities;
Information
Rs. 12/- per share
N/A
278,661,217 shares
Before: 327,836,727 sharesShareholding Percentage: 55.22%After: No. of Shares: 606,497,944
Current quoted price of MLCF scrip as on 30/9/2019: Rs. 14.68
Weighted Average Market Price of MLCF Scrip: Rs.18.67
N/A
(b) Additional disclosure regarding Equity Investment:
KOHINOOR TEXTILE MILLS LIMITED42
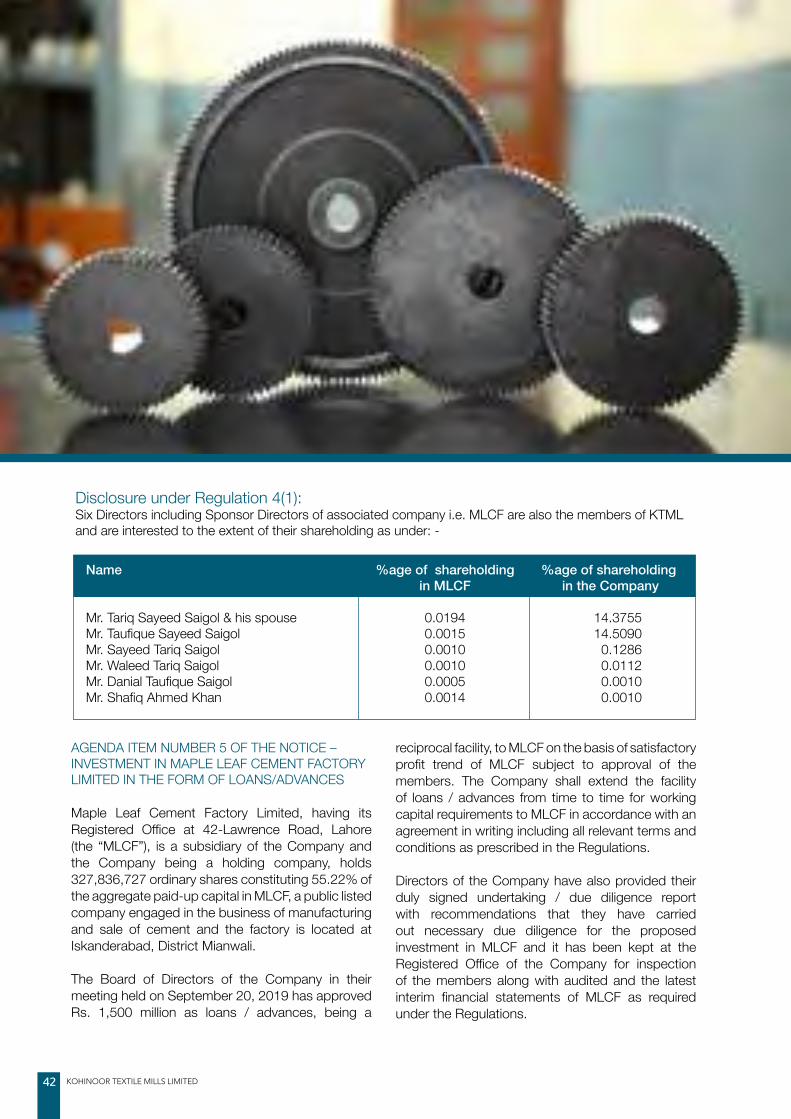
Name %age of shareholding %age of shareholding in MLCF in the Company
Mr. Tariq Sayeed Saigol & his spouse 0.0194 14.3755Mr. Taufique Sayeed Saigol 0.0015 14.5090Mr. Sayeed Tariq Saigol 0.0010 0.1286Mr. Waleed Tariq Saigol 0.0010 0.0112Mr. Danial Taufique Saigol 0.0005 0.0010Mr. Shafiq Ahmed Khan 0.0014 0.0010
AGENDA ITEM NUMBER 5 OF THE NOTICE –INVESTMENT IN MAPLE LEAF CEMENT FACTORY LIMITED IN THE FORM OF LOANS/ADVANCES
Maple Leaf Cement Factory Limited, having its Registered Office at 42-Lawrence Road, Lahore (the “MLCF”), is a subsidiary of the Company and the Company being a holding company, holds 327,836,727 ordinary shares constituting 55.22% of the aggregate paid-up capital in MLCF, a public listed company engaged in the business of manufacturing and sale of cement and the factory is located at Iskanderabad, District Mianwali.
The Board of Directors of the Company in their meeting held on September 20, 2019 has approved Rs. 1,500 million as loans / advances, being a
reciprocal facility, to MLCF on the basis of satisfactory profit trend of MLCF subject to approval of the members. The Company shall extend the facility of loans / advances from time to time for working capital requirements to MLCF in accordance with an agreement in writing including all relevant terms and conditions as prescribed in the Regulations.
Directors of the Company have also provided their duly signed undertaking / due diligence report with recommendations that they have carried out necessary due diligence for the proposed investment in MLCF and it has been kept at the Registered Office of the Company for inspection of the members along with audited and the latest interim financial statements of MLCF as required under the Regulations.
Disclosure under Regulation 4(1):Six Directors including Sponsor Directors of associated company i.e. MLCF are also the members of KTML and are interested to the extent of their shareholding as under: -
ANNUAL REPORT 2019 43
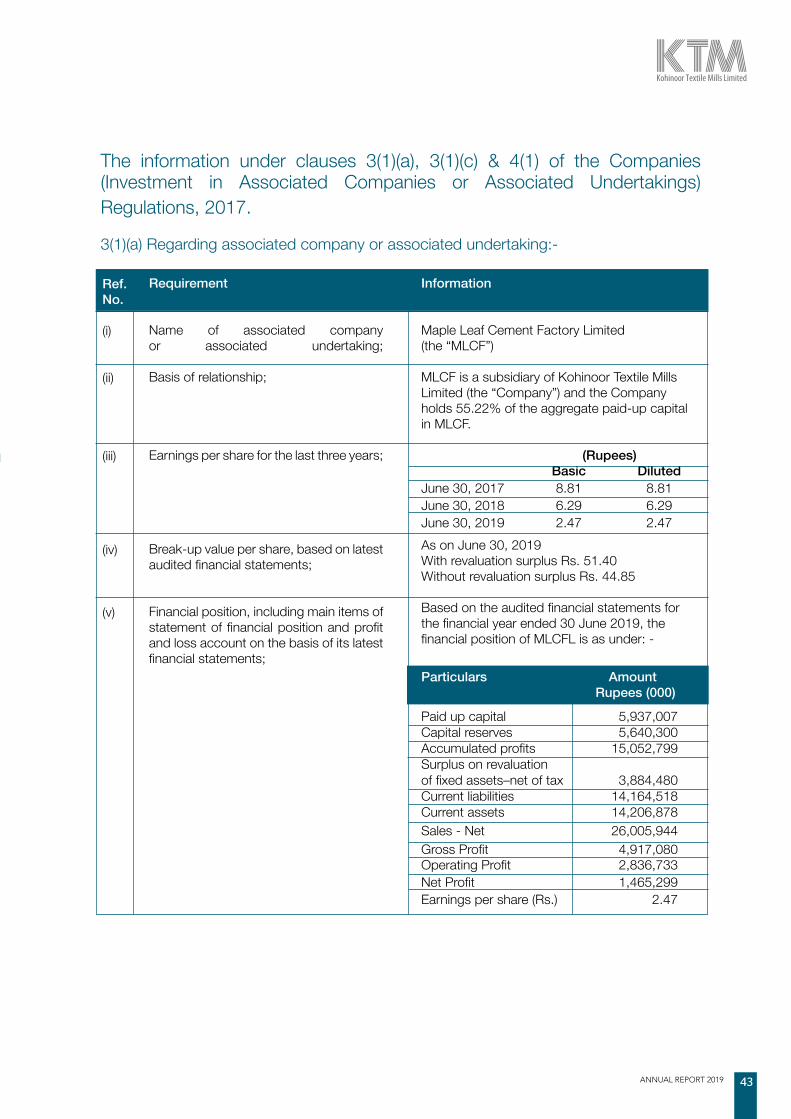
The information under clauses 3(1)(a), 3(1)(c) & 4(1) of the Companies (Investment in Associated Companies or Associated Undertakings) Regulations, 2017.
3(1)(a) Regarding associated company or associated undertaking:-
Ref. No.
(i)
(ii)
(iii)
(iv)
(v)
Requirement
Name of associated company or associated undertaking;
Basis of relationship;
Earnings per share for the last three years;
Break-up value per share, based on latest audited financial statements;
Financial position, including main items of statement of financial position and profit and loss account on the basis of its latest financial statements;
Information
Maple Leaf Cement Factory Limited(the “MLCF”)
MLCF is a subsidiary of Kohinoor Textile Mills Limited (the “Company”) and the Company holds 55.22% of the aggregate paid-up capital in MLCF.
(Rupees) Basic DilutedJune 30, 2017 8.81 8.81June 30, 2018 6.29 6.29June 30, 2019 2.47 2.47As on June 30, 2019With revaluation surplus Rs. 51.40Without revaluation surplus Rs. 44.85
Based on the audited financial statements for the financial year ended 30 June 2019, the financial position of MLCFL is as under: -
Particulars Amount Rupees (000)
Paid up capital 5,937,007Capital reserves 5,640,300Accumulated profits 15,052,799Surplus on revaluation of fixed assets–net of tax 3,884,480Current liabilities 14,164,518Current assets 14,206,878Sales - Net 26,005,944Gross Profit 4,917,080Operating Profit 2,836,733Net Profit 1,465,299Earnings per share (Rs.) 2.47

KOHINOOR TEXTILE MILLS LIMITED44
General Disclosures:-
Ref. No.
(i)
(ii)
(iii)
(iv)
Requirement
Maximum amount of investment to be made;
Purpose, benefits likely to accrue to the investing company and its members from such investment and period of investment;
Source of funds to be utilized for investment and where the investment is intended to be made using borrowed funds, - (I) Justification for investment through
borrowings;(II) Detail of collateral, guarantees
provided and assets pledged for obtaining such funds; and
(III) Cost benefit analysis;
Salient features of agreement(s), if any, with associated company or associated undertaking with regards to the proposed investment;
Information
Rs. 1,500 million (Rupees one thousand five hundred million only).
Purpose: To earn income on the loans and/or advances to be provided to MLCF from time to time for working capital requirements of MLCF.
Benefits: The Company will receive mark up at the rate of one percent above three months KIBOR or one percent above the average borrowing cost of the Company, whichever is higher. This shall benefit the Company’s cash flow by earning profit on idle funds.
Period: For a period of one year from November 01, 2019 to October 31, 2020.
Loan and/or advance will be given out of own funds of the Company.
N/A
Nature Loan / advancePurpose To earn mark-up / profit on loan /
advance being provided to MLCF which will augment the Company’s cash flow.
Period One YearRate of Mark-up One percent above the three
months KIBOR or one percent above the average borrowing cost of the Company, whichever is higher.
Repayment Principal plus mark-up/ profit upto October 31, 2020
Penalty charges 3-months KIBOR plus one
percent in addition to the outstanding amount(s).

ANNUAL REPORT 2019 45
Ref. No.
(v)
(vi)
(vii)
Requirement
Direct or indirect interest of directors, sponsors, majority shareholders and their relatives, if any, in the associated company or associated undertaking or the transaction under consideration;
In case any investment in associated company or associated undertaking has already been made, the performance review of such investment including complete information/justification for any impairment or write offs; and
Any other important details necessary for the members to understand the transaction;
Information
Investing Company i.e. the Company is a holding company of MLCF and Seven Directors are common in both the companies may be deemed to be interested to the extent of their shareholding.
None of the Directors or their relatives or associates are interested in any of the above resolution in any way except as members of the Company.
A similar nature of loan/advance facility of Rs. 1,000 million from time to time for working capital requirements has been granted by the valued shareholders of the Company vide special resolution passed in the Annual General Meeting held on October 27, 2018 which is valid till October 31, 2019. There is no impairment and/or write off against the above facility.
N/A
Ref. No.
(i)
(ii)
(iii)
(iv)
Requirement
Category-wise amount of investment;
Average borrowing cost of the investing company, the Karachi Inter Bank Offered Rate (KIBOR) for the relevant period, rate of return for Shariah Compliant products and rate of return for unfunded facilities, as the case may be, for the relevant period;
Rate of interest, mark up, profit, fees or commission etc. to be charged by investing company;
Particulars of collateral or security to be obtained in relation to the proposed investment;
Information
Short term loan for working capital requirements for a period of one year as dilated in preamble.
Average borrowing cost of the Company is 5.40% for the year ended June 30, 2019.
Mark-up will be charged from MLCF at one percent above the three months KIBOR or one percent above the average borrowing cost of the Company, whichever is higher.
No collateral is considered necessary since MLCF is a subsidiary company of the Company.
3(1)(c) Investments in the form of loans

KOHINOOR TEXTILE MILLS LIMITED46
Six Directors including Sponsor Directors of associated company i.e. MLCF are also the members of the Company and are interested to the extent of their shareholding as under: -
Name %age of shareholding %age of shareholding in MLCF in the Company
Mr. Tariq Sayeed Saigol & his spouse 0.0194 14.3755Mr. Taufique Sayeed Saigol 0.0015 14.5090Mr. Sayeed Tariq Saigol 0.0010 0.1286Mr. Waleed Tariq Saigol 0.0010 0.0112Mr. Danial Taufique Saigol 0.0005 0.0010Mr. Shafiq Ahmed Khan 0.0014 0.0010
Ref. No.
(v)
(vi)
Requirement
If the investment carries conversion feature i.e. it is convertible into securities, this fact along with terms and conditions including conversion formula, circumstances in which the conversion may take place the time when the conversion may be exercisable; and
Repayment schedule and terms and conditions of loans or advances to be given to the associated company or associated undertaking.
Information
N/A
The loan / advance would be for a period of one year from November 01, 2019 to October 31, 2020 (both days inclusive). MLCF will pay interest / mark-up on quarterly basis whereas repayment of principal amount shall be on or before October 31, 2020.
AGENDA ITEM NO. 6 OF THE NOTICE - RATIFICATION AND APPROVAL OF THE RELATED PARTY TRANSACTIONS:
Transactions conducted with the related parties have to be approved by the Board of Directors duly recommended by the Audit Committee on quarterly basis pursuant to clause 15 of the Listed Companies (Code of Corporate Governance) Regulations, 2017. However, during the year since majority of the Company’s Directors were interested due to their common directorships and therefore these transactions are being placed for the approval by shareholders in the Annual General Meeting. In last Annual General Meeting of the Company, in order to promote transparent business practices, the shareholders had authorized the Board of Directors
to approve transactions with the related parties from time-to-time on cases to case basis for the year ended June 30, 2019 and such transactions were deemed to be approved by the shareholders. Such transactions were to be placed before the shareholders in the next annual general meeting for their formal approval/ratification. Accordingly, these transactions are being placed before the shareholders in this meeting for their formal approval/ratification.
All transactions with related parties to be ratified have been disclosed in the note 34 to the unconsolidated financial statements for the year ended June 30, 2019. Party-wise details of such related party transactions are given below: -

ANNUAL REPORT 2019 47
The Company carries out transactions as per the approved policy with respect to ‘transactions with related parties’ in the normal course of business. All transactions entered into with related parties require the approval of the Audit Committee of the Company, which is chaired by an Independent Director of the Company. Upon the recommendation of the Audit Committee, such transactions were placed before the Board of Directors for approval.
The nature of relationship with these related parties has also been indicated in the unconsolidated financial statements for the year ended June 30, 2019. The Directors are interested in the resolution only to the extent of their shareholding and having their common directorships in such related parties.
AGENDA ITEM NUMBER 7 OF THE NOTICE – AUTHORIZATION FOR THE BOARD OF DIRECTORS TO APPROVE THE RELATED PARTY TRANSACTIONS DURING THE YEAR ENDING ON JUNE 30, 2020.
The Company shall be conducting transactions with its related parties during the year ending on
June 30, 2020 as per the approved policy with respect to ‘transactions with related parties’ in the normal course of business. The majority of Directors are interested due to their common directorships in the subsidiary/associated companies. In order to promote transparent business practices, the shareholders are required to authorize the Board of Directors to approve transactions with the related parties from time-to-time and on case to case basis for the year ending on June 30, 2020, which transactions shall be deemed to be approved by the Shareholders. The nature and scope of such related party transactions is explained above. These transactions shall be placed before the shareholders in the next AGM for their formal approval/ratification.
The Directors are interested in the resolution only to the extent of their shareholding and/or only their common directorships in such related parties.
Sr. Name of Related Relationship Description of Transactions Rupees in No. Party thousands
Maple Leaf Cement Factory Limited
Maple Leaf Capital Limited
Provident Fund
Subsidiary Company
Subsidiary Company
Post-employment benefit plan
Purchase of goods and services 107,894Dividend income 327,836Mark up on loans 2,116Loan obtained 100,000Loan repaid 531,530Mark-up on loans 14,495
Contribution 53,031
1)
2)
3)
KOHINOOR TEXTILE MILLS LIMITED48
CHAIRMAN’S REVIEWI am pleased to present the annual report and audited financial statements of the Company for the year ended 30 June, 2019 to our valued shareholders. Significant aspects of performance of your Company have been shared with you during the course of the financial year 2018-19. The Management of the Company is encouraged by the future prospects and expects to continue to demonstrate satisfactory performance through its efforts and strategic directions provided by the Board.
Pursuant to requirement of the Listed Companies (Code of Corporate Governance) Regulations, 2017, mechanism has been put in place for annual evaluation of the performance of the Board of Directors (the “Board”) of Kohinoor Textile Mills Limited (the “Company”). The main objective of this exercise is to internally evaluate the performance of the Board and its Committees in order to facilitate the Management and to play an effective role as a coordinated team for the success of the Company. Strategic goals for the Management have been earmarked for the coming year and the Board’s effectiveness is measured in the context of achievement of such objectives. Accordingly, the Board has completed its annual self-evaluation for the year 2019 and I am pleased to report that the overall performance benchmarked on the basis of criteria set for the year 2019, remained satisfactory. Such assessment was based on standards set by the Board in line with best corporate governance practices.
COMPOSITION OF THE BOARD:
The composition of the Board depicts reasonable balance of executive and non-executive Directors including independent Directors and as a Group, possess the requisite skills, core competencies and industry knowledge to lead the Company. All Board members have exercised their individual business judgment and are involved in important Board decisions.
VISION & MISSION STATEMENTS:
The Board members are aware of the high level of ethical and professional standards laid down in our Vision & Mission Statements which are adopted by the Company and fully support the same in attaining the objectives dilated therein.
STRATEGIC DECISION MAKING:
Overall corporate strategy and objectives have been set in line with the strategic vision of the Board from
which the annual business plan is derived, as well as, projected plans for the next five years have been set by the Management, covering all functional and operational areas by utilization of available resources, modernization and expansion and production facilities to ensure continued growth in the bottom line which should hopefully result in high growth.
DILIGENCE:
The Board reviews the quality and appropriateness of financial statements of the Company, reporting and transparency of disclosures, Company’s accounting policies, corporate objective plans, budgets and other reports. The meetings of the Board are held at required frequencies and agenda along with working papers are circulated in sufficient time prior to Board and Committee meetings.
ADEQUATE GOVERNANCE:
The Board has framed the Code of Conduct which defines requisite behaviour and has been disseminated throughout the Company, along-with supporting policies and procedures. Adequate controls and robust systems are in place to ensure effective control environment so compliance of best policies of Corporate Governance are achieved. The Board sets high standards of honesty and integrity which we consider are vital for success of the business.
PRESENTATIONS:
During the course of discussion and approvals of financial statements, comprehensive presentations are placed before the Board based on incisive, critical and strategic analysis of all functional areas relating to core business of the Company. Benchmarking compared with the industry’s peer group are carried out. This practice provides ample opportunity for objective analysis of the Company’s goals and evaluation of its own financial performance with the peer group. The Board provides appropriate directions and oversight emanated on the basis of thorough and detailed discussions.
Lahore (Tariq Sayeed Saigol) 20 September 2019 Chairman
ANNUAL REPORT 2019 49

KOHINOOR TEXTILE MILLS LIMITED50
DIRECTORS’ REPORT to the ShareholdersIn compliance with Section 227 of the Companies Act, 2017, the Directors are pleased to present 51st Annual Report along with audited financial statements and Auditors’ Report thereon for the year ended 30 June 2019.

ANNUAL REPORT 2019 51
PRINCIPAL ACTIVITIES
Kohinoor Textile Mills Limited (“the Company”) is a public limited company incorporated in Pakistan and listed on Pakistan Stock Exchange Limited. The principal activity of the Company is manufacturing of yarn and cloth, processing and stitching the cloth and trade of textile products.
REVIEW OF OPERATIONS
In the year under review, the Spinning division showed a strong result with profits increasing significantly. This increase drew largely from the Company’s timely purchase of raw materials and major improvements in productivity and quality due to heavy investments in new technology. The markets currently face turmoil due to efforts of the Government to document the economy. To cope with these temporary difficulties, the Company has slightly altered its product mix, producing counts which can be taken up by documented and registered buyers. This has been a challenge but has been navigated satisfactorily. We are in the process of commencing procurement of raw materials – both imported and local – and it is hoped that the financial results will remain strong in the coming year. The Company continues to invest in modernization of equipment and enhancement of Spinning capacity which should lead to increase in sales and profits.
The Weaving division’s efforts towards cost reduction and efficiency improvement are reflected in its results. These efforts will continue going forward as the Company strives to solidify its position.
The financial results of the Cut & Sew division were much improved over those of the previous year. We expect further improvement as the impact of investments in the Company’s capability to produce complex products bears fruit. It is planned to further augment digital printing capacity at the Finishing plant.
The second phase of the Company’s solar project at its Rawalpindi site has been completed and is operating well. Further expansions are also being planned. Additionally, a solar project has been
launched at the Company’s Raiwind site. These developments fall in line with KTML’s vision of becoming an environmentally friendly “Green” company.
With coming corrections in energy prices and exchange rates, we expect the current year to be profitable with greater emphasis on increasing exports where we see potential for growth.
FINANCIAL REVIEW
During the year under review, Company’s sales increased by 18.99% to Rupees 21,220 million (2018: Rupees 17,834 million), while cost of sales increased by 15.00% to Rupees 17,659 million (2018: Rupees 15,356 million). This resulted in gross profit of Rupees 3,561 million (2018: Rupees 2,478 million). Operating profit for the year under review stood at Rupees 2,692 million (2018: Rupees 2,516 million). The Company recorded after tax profit of Rupees 1,751 million (2018: Rupees 1,664 million). Earnings per share for the year ended 30 June 2019 stood at Rupees 5.85 against Rupees 5.64 for the last year.
GROUP FINANCIAL REVIEW
During the year under review, Company’s consolidated revenue increased to Rupees 47,118 million (2018: Rupees 43,467 million), while cost of sales increased to Rupees 37,196 million (2018: Rupees 32,167 million). This resulted in gross profit of Rupees 9,922 million (2018: Rupees 11,300 million). Earnings per share for the year ended 30 June 2019 were at Rupees 10.45 against Rupees 11.95 for the last year.
DIVIDEND & APPROPRIATIONS
Keeping in view the results, the Board of Directors has announced final cash dividend for the year ended June 30, 2019 at Re. 0.75 per share (7.50%). This is in addition to interim cash dividend already paid at Rs. 1/- per share (10%), thus making a total cash dividend at Rupees 1.75 per share (17.50%) for the year.
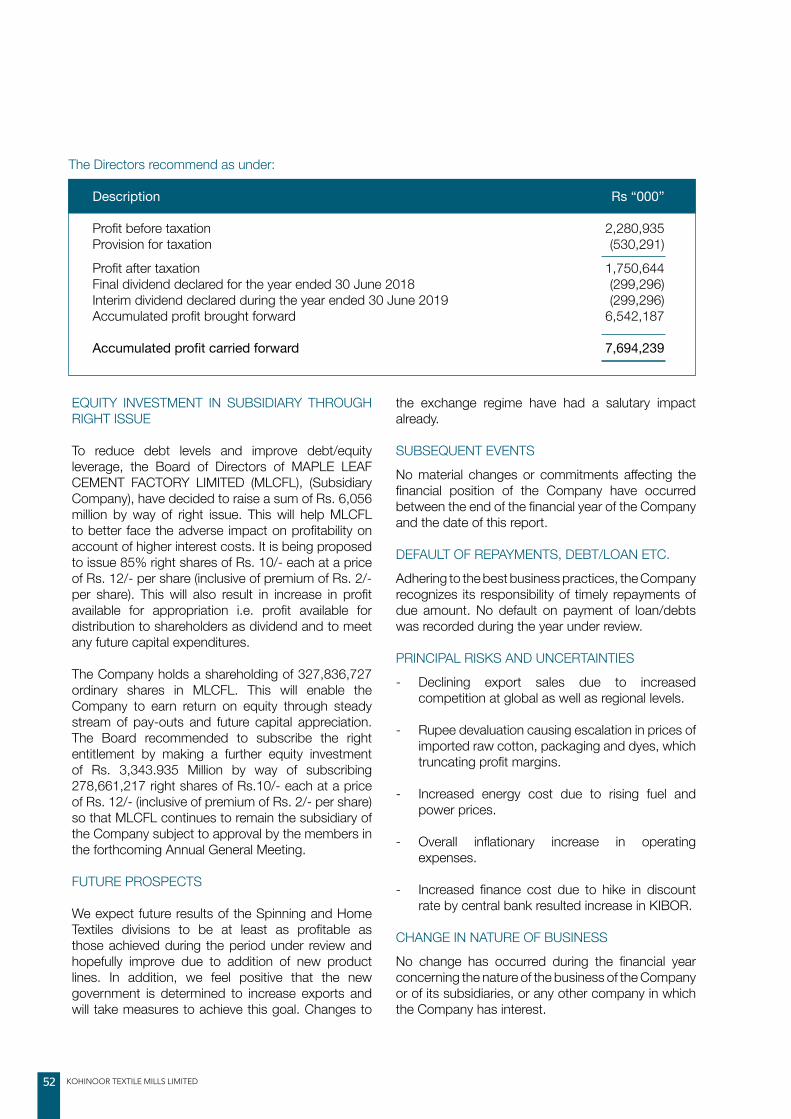
KOHINOOR TEXTILE MILLS LIMITED52
The Directors recommend as under:
Description Rs “000”
Profit before taxation 2,280,935 Provision for taxation (530,291)
Profit after taxation 1,750,644 Final dividend declared for the year ended 30 June 2018 (299,296) Interim dividend declared during the year ended 30 June 2019 (299,296) Accumulated profit brought forward 6,542,187
Accumulated profit carried forward 7,694,239
EQUITY INVESTMENT IN SUBSIDIARY THROUGH RIGHT ISSUE
To reduce debt levels and improve debt/equity leverage, the Board of Directors of MAPLE LEAF CEMENT FACTORY LIMITED (MLCFL), (Subsidiary Company), have decided to raise a sum of Rs. 6,056 million by way of right issue. This will help MLCFL to better face the adverse impact on profitability on account of higher interest costs. It is being proposed to issue 85% right shares of Rs. 10/- each at a price of Rs. 12/- per share (inclusive of premium of Rs. 2/- per share). This will also result in increase in profit available for appropriation i.e. profit available for distribution to shareholders as dividend and to meet any future capital expenditures.
The Company holds a shareholding of 327,836,727 ordinary shares in MLCFL. This will enable the Company to earn return on equity through steady stream of pay-outs and future capital appreciation. The Board recommended to subscribe the right entitlement by making a further equity investment of Rs. 3,343.935 Million by way of subscribing 278,661,217 right shares of Rs.10/- each at a price of Rs. 12/- (inclusive of premium of Rs. 2/- per share) so that MLCFL continues to remain the subsidiary of the Company subject to approval by the members in the forthcoming Annual General Meeting.
FUTURE PROSPECTS
We expect future results of the Spinning and Home Textiles divisions to be at least as profitable as those achieved during the period under review and hopefully improve due to addition of new product lines. In addition, we feel positive that the new government is determined to increase exports and will take measures to achieve this goal. Changes to
the exchange regime have had a salutary impact already.
SUBSEQUENT EVENTS
No material changes or commitments affecting the financial position of the Company have occurred between the end of the financial year of the Company and the date of this report.
DEFAULT OF REPAYMENTS, DEBT/LOAN ETC.
Adhering to the best business practices, the Company recognizes its responsibility of timely repayments of due amount. No default on payment of loan/debts was recorded during the year under review.
PRINCIPAL RISKS AND UNCERTAINTIES
- Declining export sales due to increased competition at global as well as regional levels.
- Rupee devaluation causing escalation in prices of imported raw cotton, packaging and dyes, which truncating profit margins.
- Increased energy cost due to rising fuel and power prices.
- Overall inflationary increase in operating expenses.
- Increased finance cost due to hike in discount rate by central bank resulted increase in KIBOR.
CHANGE IN NATURE OF BUSINESS
No change has occurred during the financial year concerning the nature of the business of the Company or of its subsidiaries, or any other company in which the Company has interest.

ANNUAL REPORT 2019 53
CORPORATE SOCIAL RESPONSIBILITY
The Company acknowledges its responsibility towards society and performs its duty by providing financial assistance to projects for society development by various charitable institutions on consistent basis. The Company has been recognized by the Pakistan Centre for Philanthropy as a leader in social and charitable contributions and strives to be a constructive member of the communities in which it has a presence.
The Company has contributed in medical social sciences project and in this regard, during the last financial year, the Company’s Board of Directors and the Board of the subsidiary company jointly decided to donate towards construction of Admin Block at Al-Aleem Medical College in Gulab Devi Chest Hospital (GDCH), Lahore. As of today, 40% of the work has been completed at site and is expected to complete by January 2020. Total cost to complete this project is expected to be Rupees 160 million. A committee of the members of Board is formed for better monitoring and execution of this task.
The Company has also contributed in the past for medical social service projects and in this regard the Company donated a state-of-the-art Cardiac facility to the Gulab Devi Chest Hospital (GDCH) in Lahore by building Sayeed Saigol Cardiac Complex at GDCH.
Kohinoor Maple Leaf Group has received “Corporate Social Responsibility National Excellence Award 2019” on account of its performance of various social obligations.
IMPACT OF COMPANY’S BUSINESS ON THE ENVIRONMENT
Management understands the harmful effects of contaminated water on the surrounding areas after emission from the mills premises. In order to prevent the potentially harmful effects of any chemicals used in processing on the surrounding water table, a waste water treatment plant has been constructed minimizing or negating any contamination in water discharged from the factory. Further, the company continues to investigate and implement pilot projects into alternative, sustainable energy sources.
ADEQUACY OF INTERNAL CONTROL
The Board of Directors is aware of its responsibility with respect to internal controls environment and accordingly has established an efficient system of
internal financial controls for ensuring effective and efficient conduct of operations, safeguarding of Company assets, compliance with applicable laws and regulations and reliable financial reporting. The independent Internal Audit function of the Company regularly appraises and monitors the implementation of financial controls, whereas the Audit Committee reviews the effectiveness of the internal control framework and financial statements on quarterly basis.
MANAGEMENT’S RESPONSIBILITY TOWARD PREPARATION AND PRESENTATION OF FINANCIAL STATEMENTS
The Management is aware of its responsibility for the preparation and fair presentation of the financial statements in accordance with the accounting and reporting standards as applicable in Pakistan and the requirements of Companies Act, 2017 (XIX of 2017) and for such internal controls as management determines is necessary to enable the preparation of financial statements that are free from material misstatement, whether due to fraud or error.
AUDITORS’ REPORT
The existing auditors of the Company M/s. Riaz Ahmad & Company, Chartered Accountants, in their independent auditors’ report on financial statements of the Company for the year have expressed an unqualified opinion on the state of affairs of the Company.
AUDITORS
The Board has recommended, as suggested by the Audit Committee, the appointment of M/s. Riaz Ahmad & Company, Chartered Accountants, the retiring auditors and being eligible, they have offered themselves for re-appointment for the ensuing year subject to approval of the members in the forthcoming Annual General Meeting.
COMPOSITION OF BOARD OF DIRECTORS
Total Number of Directors:
a) Male 8b) Female -
Composition:
Independent Director 1Other Non-Executive Directors 4Executive Directors 3

KOHINOOR TEXTILE MILLS LIMITED54
NAME OF DIRECTORS AND BOARD MEETINGS
During the year under review, four meetings of the Board of Directors were held in Pakistan and no meeting was held outside Pakistan. Attendance by each Director was as follows: -
Category Names Meetings Attended
Independent Director Mr. Shafiq Ahmed Khan 4Other Non-Executive Directors Mr. Tariq Sayeed Saigol 4 Mr. Sayeed Tariq Saigol 4 Mr. Waleed Tariq Saigol 4 Mr. Arif Ijaz 4Executive Directors Mr. Taufique Sayeed Saigol 4 Mr. Danial Taufique Saigol 4 Syed Mohsin Raza Naqvi 4
Following executive directors are also non-executive directors in other companies: -
Category Names No. of directorships in other companies Executive Directors Mr. Taufique Sayeed Saigol 4 Mr. Danial Taufique Saigol 3 Syed Mohsin Raza Naqvi 2
Pursuant to requirement of the Listed Companies (Code of Corporate Governance) Regulations, 2017, the following Committees were constituted:-
AUDIT COMMITTEE
A total number of four meetings of the Audit Committee were held during the year. The attendance of each member was as under:-
Name Designation Meetings Attended
Mr. Shafiq Ahmed Khan Chairman (Independent Director) 4Mr. Arif Ijaz Member (Non-Executive Director) 4Mr. Sayeed Tariq Saigol Member (Non-Executive Director) 4Mr. Waleed Tariq Saigol Member (Non-Executive Director) 2
Leave of absence was granted to the Member(s) who could not attend the meetings.
The Chairman of the Audit Committee was present in the last AGM of the Company held on October 27, 2018.

ANNUAL REPORT 2019 55

KOHINOOR TEXTILE MILLS LIMITED56
HUMAN RESOURCE & REMUNERATION COMMITTEE (HR & R COMMITTEE)
NAME DESIGNATION Mr. Shafiq Ahmed Khan Chairman / Independent DirectorMr. Arif ijaz Member / Non-Executive DirectorMr. Sayeed Tariq Saigol Member / Non-Executive DirectorMr. Danial Taufique Saigol Member / Executive Director
NUMBER OF MEETINGS HELD – 01 (All Members attended the meeting).
REMUNERATION TO NON-EXECUTIVE / INDEPENDENT DIRECTORS
The Board of Directors has approved a ‘Directors’ Remuneration Policy’, the salient features of which are:
• No Director shall determine his/her own remuneration.
• Meeting fee of a Director other than regular paid Chief Executive, Sponsors and / or family Directors and full time working Director(s), shall be net of tax amounting to Rs.10,000/- (Rupees ten thousand only) per meeting or as time to time determined by the Board for attending the Board and its Committee meetings.
• Any tax obligation against such payment applicable for the time being and/or amended hereinafter shall be borne by the Company.
• The Directors shall be entitled to be paid all reasonable expenses, including travelling, hotel charges and other expenses incurred by them for attending meetings and for other business conducted for and on behalf of the Company
PATTERN OF SHAREHOLDING
Pattern of shareholding of the Company in accordance with the Companies Act, 2017 as at June 30, 2019 is annexed.
ACKNOWLEDGEMENT
The Directors are grateful to the Company’s members, financial institutions and customers for their co-operation and support. They also appreciate hard work and dedication of all the employees working at the various divisions.
For and on behalf of the Board
Lahore (Syed Mohsin Raza Naqvi) (Taufique Sayeed Saigol)20 September 2019 Director Chief Executive

ANNUAL REPORT 2019 57
STATEMENT OF COMPLIANCE With the Listed Companies (Code of Corporate Governance) Regulations, 2017
Name of Company: Kohinoor Textile Mills LimitedYear Ended: June 30, 2019
This Company has complied with the requirements of the Regulations in the following manner: -
1. The total number of Directors is Eight as per the following: -
Male: 8 Female: -
The requirement of minimum number of female and independent Directors on the Board would be complied by within the time allowed by these Regulations.
2. The Composition of Board is as follows: -
Category Names Independent Director Mr. Shafiq Ahmed Khan
Other Non-Executive Directors Mr. Tariq Sayeed Saigol Mr. Sayeed Tariq Saigol Mr. Waleed Tariq Saigol Mr. Arif Ijaz
Executive Directors Mr. Taufique Sayeed Saigol Mr. Danial Taufique Saigol Syed Mohsin Raza Naqvi
3. The Directors have confirmed that none of them is serving as a Director on more than five listed companies, including this Company.
4. The Company has prepared a Code of Conduct and has ensured that appropriate steps have been taken to disseminate it throughout the Company along with its supporting policies and procedures.
5. The Board has developed a vision/mission statement, overall corporate strategy and significant policies of the Company. A complete record of particulars of significant policies along with the dates on which they were approved or amended has been maintained.
6. All the powers of the Board have been duly exercised and decisions on relevant matters have been taken by the Board / Shareholders as empowered by the relevant provisions of the Act and these Regulations.
7. The meetings of the Board were presided over by the Chairman. The Board has complied with the requirements of Act and the Regulations with respect to frequency, recording and circulating minutes of meeting of the Board.
8. The Board of Directors have a formal policy and transparent procedures for remuneration of Directors in accordance with the Act and these Regulations.

KOHINOOR TEXTILE MILLS LIMITED58
9. In terms of Regulation 20 of the Code, the Company was required to ensure that at least 50% of the Directors on their Board have acquired prescribed certification under Directors’ Training Program by 30 June 2019. The Board had arranged Orientation Courses for two of its Directors during the preceding years from recognized institutions of Pakistan that meet the criteria specified by the SECP whereas two Directors having the requisite educational qualification and experience on the Board(s) of Listed Companies are exempt from the Directors’ Training Program for which SECP’s approval has been obtained.
10. The Board has approved appointment of CFO, Company Secretary and Head of Internal Audit, including their remuneration and terms and conditions of employment and complied with relevant requirements of the Regulations.
11. CFO and CEO duly endorsed the financial statements before approval of the Board.
12. The Board has formed committees comprising of members given below:
AUDIT COMMITTEE
NAME DESIGNATION Mr. Shafiq Ahmed Khan Chairman (Independent Director) Mr. Arif Ijaz Member (Non-Executive Director) Mr. Sayeed Tariq Saigol Member (Non-Executive Director) Mr. Waleed Tariq Saigol Member (Non-Executive Director)
Human Resource & Remuneration Committee
NAME DESIGNATION Mr. Shafiq Ahmed Khan Chairman (Independent Director) Mr. Arif Ijaz Member (Non-Executive Director) Mr. Sayeed Tariq Saigol Member (Non-Executive Director) Mr. Danial Taufique Saigol Member (Executive Director)
13. The terms of reference of the aforesaid committees have been formed, documented and advised to the committees for compliance.
14. The frequency of meetings of the committees were as per following:
MEETINGS FREQUENCY Audit Committee Four meetings were held during the financial year. Human Resource and Remuneration Committee One meeting was held during the financial year.
15. The Board has set up an effective internal audit function who are considered suitably qualified and experienced for the purpose and are conversant with the policies and procedures of the Company.

ANNUAL REPORT 2019 59
KOHINOOR TEXTILE MILLS LIMITED60
16. The statutory auditors of the Company have confirmed that they have been given a satisfactory rating under the quality control review program of the ICAP and registered with Audit Oversight Board of Pakistan, that they or any of the partners of the firm, their spouses and minor children do not hold shares of the Company and that the firm and all its partners are in compliance with International Federation of Accountants (IFAC) guidelines on code of ethics as adopted by the ICAP.
17. The statutory auditors or the persons associated with them have not been appointed to provide other services except in accordance with the Act, these regulations or any other regulatory requirement and the auditors have confirmed that they have observed IFAC guidelines in this regard.
18. We confirm that all other requirements of the Regulations have been complied with.
(TARIQ SAYEED SAIGOL) CHAIRMAN
Lahore: September 20, 2019

ANNUAL REPORT 2019 61
We have reviewed the enclosed Statement of Compliance with the Listed Companies (Code of Corporate Governance) Regulations, 2017 (the Regulations) prepared by the Board of Directors of Kohinoor Textile Mills Limited (the Company) for the year ended 30 June 2019 in accordance with the requirements of regulation 40 of the Regulations. The responsibility for compliance with the Regulations is that of the Board of Directors of the Company. Our responsibility is to review whether the Statement of Compliance reflects the status of the Company’s compliance with the provisions of the Regulations and report if it does not and to highlight any non-compliance with the requirements of the Regulations. A review is limited primarily to inquiries of the Company’s personnel and review of various documents prepared by the Company to comply with the Regulations.
As a part of our audit of the financial statements we are required to obtain an understanding of the accounting and internal control systems sufficient to plan the audit and develop an effective audit approach. We are not required to consider whether the Board of Directors’ statement on internal control covers all risks and controls or to form an opinion on the effectiveness of such internal controls, the Company’s corporate governance procedures and risks.
The Regulations require the Company to place before the Audit Committee, and upon recommendation of the Audit Committee, place before the Board of Directors for their review and approval, its related party transactions and also ensure compliance with the requirements of section 208 of the Companies Act, 2017. We are only required and have ensured compliance of this requirement to the extent of the approval of the related party transactions by the Board of Directors upon recommendation of the Audit Committee. We have not carried out procedures to assess and determine the Company’s process for identification of related parties and that whether the related party transactions were undertaken at arm’s length price or not.
Based on our review, nothing has come to our attention which causes us to believe that the Statement of Compliance does not appropriately reflect the Company’s compliance, in all material respects, with the requirements contained in the Regulations as applicable to the Company for the year ended 30 June 2019.
RIAZ AHMAD & COMPANY Chartered Accountants
Lahore Date: September 20, 2019
INDEPENDENT AUDITOR’S REVIEW REPORTTo the members of Kohinoor Textile Mills LimitedReview Report on the Statement of Compliance contained in Listed Companies (Code of Corporate Governance) Regulations, 2017

KOHINOOR TEXTILE MILLS LIMITED62
The Audit Committee comprises of one Independent Non-Executive Director and three Non-Executive Directors. The Chief Financial Officer, the Chief Internal Auditor and the external auditors attend the Audit Committee meetings as provided in Listed Companies (Code of Corporate Governance) Regulations, 2017. Four meetings of the Audit Committee were held during the year 2018-2019. Based on reviews and discussions in these meetings, the Audit Committee reports that:
1) The Audit Committee reviewed and approved the quarterly, half yearly and annual financial statements of the Company including consolidated financial statements and recommended them for approval of the Board of Directors.
2) Appropriate accounting policies have been consistently applied. All core and other applicable International Accounting Standards were followed in preparation of financial statements of the Company and consolidated financial statements on a going concern basis, which present fairly the state of affairs, results of operations, cash flows and changes in equity of the Company.
3) Accounting estimates are based on reasonable and prudent judgment. Proper and adequate accounting records have been maintained by the
Company in accordance with the Companies Act, 2017, and the external reporting is consistent with management processes and adequate for shareholder needs.
4) The Audit Committee reviewed and approved all related party transactions.
5) No cases of material complaints regarding accounting, internal accounting controls or audit matters, or Whistle Blowing were received by the Committee.
6) The Company’s system of internal control is sound in design and is continually evaluated for effectiveness and adequacy.
7) The Board has established internal audit function being an independent appraisal function for the review of the internal control system in all areas of the business activity and provides management with objective evaluations, appraisals and recommendations on the adequacy, effectiveness and compliance with each system reviewed.
8) Company’s internal audit function is headed by a Chartered Accountant with a team of professionals who are suitably qualified and experienced and well aware of the Company’s policies and procedures.
REPORT OF THE AUDIT COMMITTEE

ANNUAL REPORT 2019 63
9) Internal audit function operates under the charter approved by the Audit Committee and head of the internal audit function has direct access to the Audit Committee.
10) Company’s internal audit function prepares annual plan for the financial year and a strategic audit plan for following two years during which all major systems and areas of activity will be audited. Annual and strategic audit plan is approved by the Audit Committee.
11) Internal audit reports include findings, conclusions, recommendations and action plans agreed with management. These are reported promptly to the appropriate level of management. Follow up in implementation is ensured.
12) The Audit Committee, on the basis of the internal audit reports, reviewed the adequacy of controls and compliance shortcomings in areas audited and discussed corrective actions in the light of management’s responses. This has ensured the continual evaluation of controls and improved compliance.
13) The Audit Committee has reviewed the Annual Report for the last financial year and found it fair, balance and understandable to users of financial statements. Annual Report provides the necessary information to all the stakeholders about the Company’s financial performance, financial position and future prospects.
14) Performance of the Audit Committee is annually reviewed by the Board of Directors. However, the Committee is devising a checklist for self-evaluation of its performance.
15) The Audit Committee ensured that statutory and regulatory obligations and requirements of best practices of governance have been met.
16) Present Auditors, M/s. Riaz Ahmad & Company, Chartered Accountants, were appointed as on December 30, 2004. They are professional
services company having satisfactory QCR rating. They carry out objective examination and evaluation of the financial statements to make sure that the records are fair and accurate representation of the transactions. They confirm every year that the firm and all Partners in the firm are compliant with the IFAC guidelines on code of Ethics as adopted by the Institute of Chartered Accountants of Pakistan.
17) The external auditors, M/s Riaz Ahmad & Company, Chartered Accountants, were allowed direct access to the Audit Committee and necessary coordination with internal auditors was also ensured. Major findings arising from audits and any matters that the external auditors wished to highlight were freely discussed with them.
18) The Audit Committee reviewed the Management Letter issued by the external auditors and the management response thereto. Observations were discussed with the auditors and required actions recorded.
19) Appointment of external auditors and fixing of their audit fee was reviewed and the Audit Committee following this review recommended to the Board of Directors re-appointment of M/s Riaz Ahmad & Company, Chartered Accountants, as external auditors for the year 2019-2020.
On behalf of the Audit Committee
(Shafiq Ahmed Khan)Chairman, Audit Committee
20 September 2019

KOHINOOR TEXTILE MILLS LIMITED64
Mr. Tariq Sayeed Saigol is the Chairman of Kohinoor Maple Leaf Group (KMLG). He is a member of the reputed Saigol Family who pioneered in textile manufacturing after partition and later ventured into the financial sector, chemicals, synthetic fibres, sugar, edible oil refining, civil engineering, construction, cement and energy.
Mr. Saigol was schooled at Aitchison College, Lahore and graduated from Government College University, Lahore, following which he studied Law at University Law College, Lahore.
He started his career in 1968 at Kohinoor’s Chemical Complex at Kala Shah Kaku. Upon trifurcation of the Group in 1976, he became Chief Executive of Kohinoor Textile Mills Limited, Rawalpindi. Since 1984, he has been Chairman of Kohinoor Maple Leaf Group which has interests in textiles, cement manufacturing and energy.
He remained Chairman of All Pakistan Textile Mills Association from 1992 to 94, President of Lahore Chamber of Commerce and Industry for 1995-97 and Chairman of All Pakistan Cement Manufacturers Association from 2003-2006.
Mr. Saigol was a member of the Federal Export Promotion Board and Central Board of State Bank of Pakistan. He has also served on several Government Commissions and Committees on a number of subjects, including Export Promotion, reorganization of WAPDA and EPB, Right Sizing of State owned Corporations and Resource Mobilization. He is the author of “Textile Vision 2005” which was adopted by the Government in 2000 and also its critique prepared in 2006. He also served as a member of the Central Board of State Bank of Pakistan for a second term in 2007 and was a member of the Prime Minister’s Economic Advisory Council established in 2008.
He takes keen interest in the development of education and health care in Pakistan. He has been a member of the Board of Governors of Lahore University of Management Sciences, Founding Chairman of the Board of Governors of Chandbagh School, Founder Trustee of Textile University of Pakistan, Member of the Syndicate of University of Health Sciences and Member of Board of Governors of Aitchison College, Lahore. He presently serves on the Managing Committee, Gulab Devi Chest Hospital, Lahore.
In recognition of his contribution, he was conferred with the civilian award, Sitara-e-Isaar by the President of Pakistan in 2006.
He is a keen golfer and has represented Pakistan at Golf in Sri Lanka and Pakistan in 1967.
MR. TARIQ SAYEED SAIGOL(CHAIRMAN / DIRECTOR)
OTHER ENGAGEMENTS
CHAIRMAN / DIRECTORMaple Leaf Cement Factory Limited
Maple Leaf Power LimitedKohinoor Capital Limited
BRIEF PROFILE OF DIRECTORS
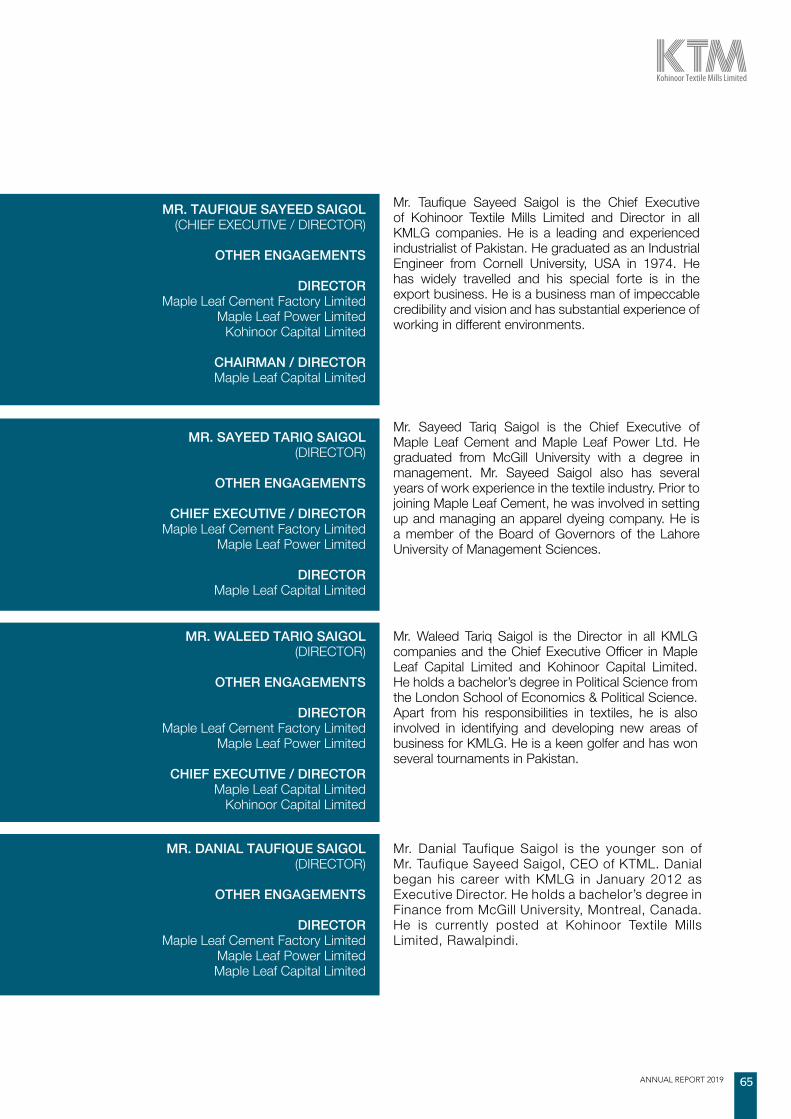
ANNUAL REPORT 2019 65
Mr. Taufique Sayeed Saigol is the Chief Executive of Kohinoor Textile Mills Limited and Director in all KMLG companies. He is a leading and experienced industrialist of Pakistan. He graduated as an Industrial Engineer from Cornell University, USA in 1974. He has widely travelled and his special forte is in the export business. He is a business man of impeccable credibility and vision and has substantial experience of working in different environments.
Mr. Sayeed Tariq Saigol is the Chief Executive of Maple Leaf Cement and Maple Leaf Power Ltd. He graduated from McGill University with a degree in management. Mr. Sayeed Saigol also has several years of work experience in the textile industry. Prior to joining Maple Leaf Cement, he was involved in setting up and managing an apparel dyeing company. He is a member of the Board of Governors of the Lahore University of Management Sciences.
Mr. Waleed Tariq Saigol is the Director in all KMLG companies and the Chief Executive Officer in Maple Leaf Capital Limited and Kohinoor Capital Limited. He holds a bachelor’s degree in Political Science from the London School of Economics & Political Science. Apart from his responsibilities in textiles, he is also involved in identifying and developing new areas of business for KMLG. He is a keen golfer and has won several tournaments in Pakistan.
Mr. Danial Taufique Saigol is the younger son of Mr. Taufique Sayeed Saigol, CEO of KTML. Danial began his career with KMLG in January 2012 as Executive Director. He holds a bachelor’s degree in Finance from McGill University, Montreal, Canada. He is currently posted at Kohinoor Textile Mills Limited, Rawalpindi.
MR. TAUFIQUE SAYEED SAIGOL(CHIEF EXECUTIVE / DIRECTOR)
OTHER ENGAGEMENTS
DIRECTORMaple Leaf Cement Factory Limited
Maple Leaf Power LimitedKohinoor Capital Limited
CHAIRMAN / DIRECTORMaple Leaf Capital Limited
MR. SAYEED TARIQ SAIGOL(DIRECTOR)
OTHER ENGAGEMENTS
CHIEF EXECUTIVE / DIRECTORMaple Leaf Cement Factory Limited
Maple Leaf Power Limited
DIRECTORMaple Leaf Capital Limited
MR. WALEED TARIQ SAIGOL(DIRECTOR)
OTHER ENGAGEMENTS
DIRECTORMaple Leaf Cement Factory Limited
Maple Leaf Power Limited
CHIEF EXECUTIVE / DIRECTORMaple Leaf Capital Limited
Kohinoor Capital Limited
MR. DANIAL TAUFIQUE SAIGOL(DIRECTOR)
OTHER ENGAGEMENTS
DIRECTORMaple Leaf Cement Factory Limited
Maple Leaf Power LimitedMaple Leaf Capital Limited
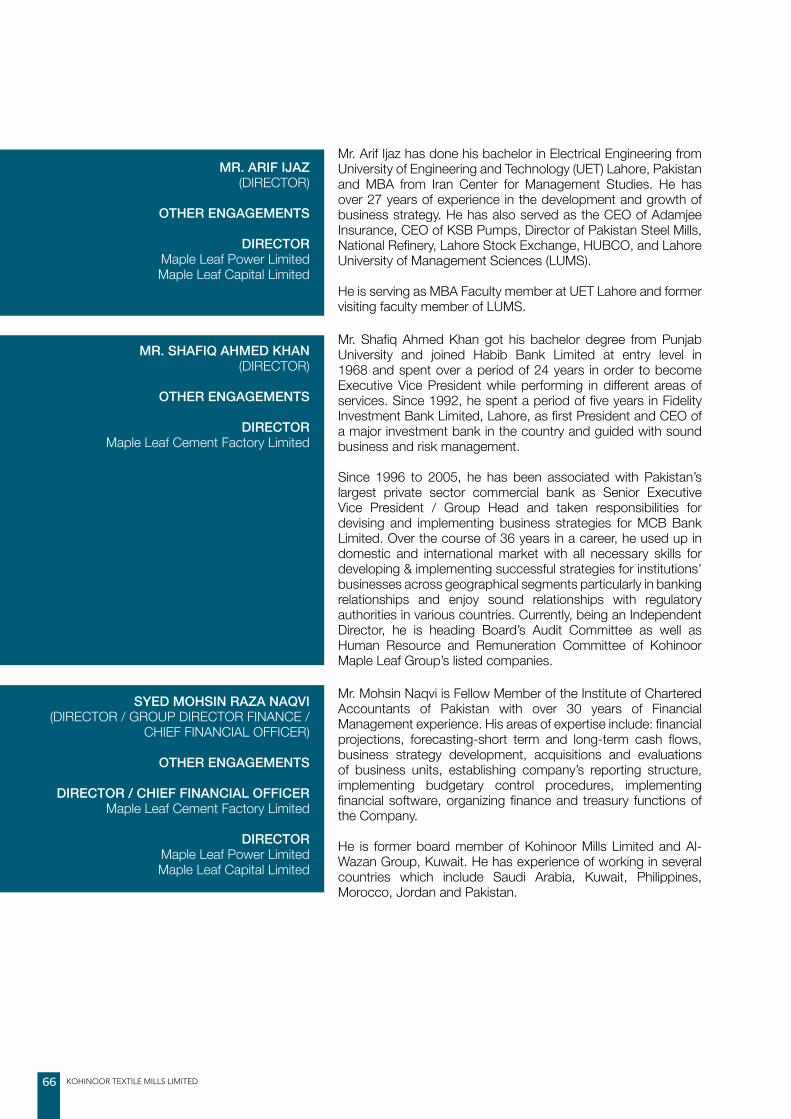
KOHINOOR TEXTILE MILLS LIMITED66
Mr. Arif Ijaz has done his bachelor in Electrical Engineering from University of Engineering and Technology (UET) Lahore, Pakistan and MBA from Iran Center for Management Studies. He has over 27 years of experience in the development and growth of business strategy. He has also served as the CEO of Adamjee Insurance, CEO of KSB Pumps, Director of Pakistan Steel Mills, National Refinery, Lahore Stock Exchange, HUBCO, and Lahore University of Management Sciences (LUMS).
He is serving as MBA Faculty member at UET Lahore and former visiting faculty member of LUMS.
Mr. Shafiq Ahmed Khan got his bachelor degree from Punjab University and joined Habib Bank Limited at entry level in 1968 and spent over a period of 24 years in order to become Executive Vice President while performing in different areas of services. Since 1992, he spent a period of five years in Fidelity Investment Bank Limited, Lahore, as first President and CEO of a major investment bank in the country and guided with sound business and risk management.
Since 1996 to 2005, he has been associated with Pakistan’s largest private sector commercial bank as Senior Executive Vice President / Group Head and taken responsibilities for devising and implementing business strategies for MCB Bank Limited. Over the course of 36 years in a career, he used up in domestic and international market with all necessary skills for developing & implementing successful strategies for institutions’ businesses across geographical segments particularly in banking relationships and enjoy sound relationships with regulatory authorities in various countries. Currently, being an Independent Director, he is heading Board’s Audit Committee as well as Human Resource and Remuneration Committee of Kohinoor Maple Leaf Group’s listed companies.
Mr. Mohsin Naqvi is Fellow Member of the Institute of Chartered Accountants of Pakistan with over 30 years of Financial Management experience. His areas of expertise include: financial projections, forecasting-short term and long-term cash flows, business strategy development, acquisitions and evaluations of business units, establishing company’s reporting structure, implementing budgetary control procedures, implementing financial software, organizing finance and treasury functions of the Company.
He is former board member of Kohinoor Mills Limited and Al-Wazan Group, Kuwait. He has experience of working in several countries which include Saudi Arabia, Kuwait, Philippines, Morocco, Jordan and Pakistan.
MR. ARIF IJAZ(DIRECTOR)
OTHER ENGAGEMENTS
DIRECTORMaple Leaf Power LimitedMaple Leaf Capital Limited
MR. SHAFIQ AHMED KHAN(DIRECTOR)
OTHER ENGAGEMENTS
DIRECTORMaple Leaf Cement Factory Limited
SYED MOHSIN RAZA NAQVI(DIRECTOR / GROUP DIRECTOR FINANCE /
CHIEF FINANCIAL OFFICER)
OTHER ENGAGEMENTS
DIRECTOR / CHIEF FINANCIAL OFFICERMaple Leaf Cement Factory Limited
DIRECTORMaple Leaf Power LimitedMaple Leaf Capital Limited

ANNUAL REPORT 2019 67
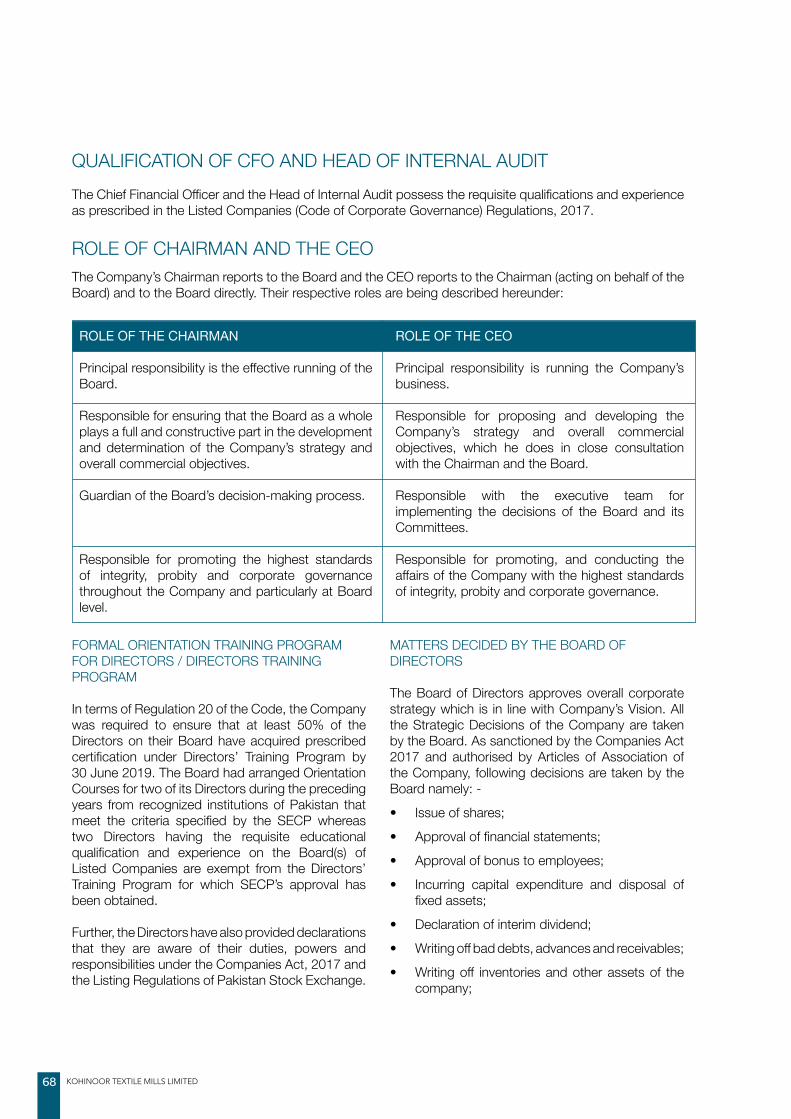
KOHINOOR TEXTILE MILLS LIMITED68
The Company’s Chairman reports to the Board and the CEO reports to the Chairman (acting on behalf of the Board) and to the Board directly. Their respective roles are being described hereunder:
FORMAL ORIENTATION TRAINING PROGRAM FOR DIRECTORS / DIRECTORS TRAINING PROGRAM
In terms of Regulation 20 of the Code, the Company was required to ensure that at least 50% of the Directors on their Board have acquired prescribed certification under Directors’ Training Program by 30 June 2019. The Board had arranged Orientation Courses for two of its Directors during the preceding years from recognized institutions of Pakistan that meet the criteria specified by the SECP whereas two Directors having the requisite educational qualification and experience on the Board(s) of Listed Companies are exempt from the Directors’ Training Program for which SECP’s approval has been obtained.
Further, the Directors have also provided declarations that they are aware of their duties, powers and responsibilities under the Companies Act, 2017 and the Listing Regulations of Pakistan Stock Exchange.
MATTERS DECIDED BY THE BOARD OF DIRECTORS
The Board of Directors approves overall corporate strategy which is in line with Company’s Vision. All the Strategic Decisions of the Company are taken by the Board. As sanctioned by the Companies Act 2017 and authorised by Articles of Association of the Company, following decisions are taken by the Board namely: -
• Issue of shares;
• Approval of financial statements;
• Approval of bonus to employees;
• Incurring capital expenditure and disposal of fixed assets;
• Declaration of interim dividend;
• Writing off bad debts, advances and receivables;
• Writing off inventories and other assets of the company;
QUALIFICATION OF CFO AND HEAD OF INTERNAL AUDITThe Chief Financial Officer and the Head of Internal Audit possess the requisite qualifications and experience as prescribed in the Listed Companies (Code of Corporate Governance) Regulations, 2017.
ROLE OF THE CHAIRMAN
Principal responsibility is the effective running of the Board.
Responsible for ensuring that the Board as a whole plays a full and constructive part in the development and determination of the Company’s strategy and overall commercial objectives.
Guardian of the Board’s decision-making process.
Responsible for promoting the highest standards of integrity, probity and corporate governance throughout the Company and particularly at Board level.
ROLE OF THE CEO
Principal responsibility is running the Company’s business.
Responsible for proposing and developing the Company’s strategy and overall commercial objectives, which he does in close consultation with the Chairman and the Board.
Responsible with the executive team for implementing the decisions of the Board and its Committees.
Responsible for promoting, and conducting the affairs of the Company with the highest standards of integrity, probity and corporate governance.
ROLE OF CHAIRMAN AND THE CEO

ANNUAL REPORT 2019 69
• Make borrowings in the form of loans, debentures, leasing contracts or redeemable capital
• Investment of funds of the company;
• To determine the terms of and the circumstances in which a law suit may be compromised and a claim or right in favor of a company may be released, extinguished or relinquished
• Other matters of strategic nature e.g. taking over a company or acquiring a controlling or substantial stake in another company;
MATTERS DELEGATED TO THE MANAGEMENT
Management of the Company is entrusted with the responsibility to conduct operations of the Company adhering to corporate strategy approved by Board of Directors. Tactical and operational matters are delegated to the Management of the Company which mainly include:
• Cash flow Management;
• Selling and Marketing;
• Compliance with legal requirements;
• Production Management;
• Procurement Management and
• Other support functions like Human Resource Management.
COMPENSATION POLICY OF EXECUTIVE DIRECTORS WHO ALSO SERVE OTHER COMPANIES BOARD OF DIRECTORS
Executive Director of the Company shall be appropriately compensated for their service in the Company and for representation on the Company’s Board. This compensation shall take into consideration the amount of time required to be devoted to Board activities, the fiduciary responsibility of such positions and the competitiveness of the compensation levels. Compensation is subject to change at the discretion of the Board. Board may approve revision in Director’s Compensation Policy from time to time.
No fee is paid to Executive Directors of the Company by way of their appointment in other associated in the capacity of Non-Executive Director.
Moreover, none of our Executive Director is working as Non-Executive Director in companies which are not associated companies.
SECURITY CLEARANCE OF FOREIGN DIRECTOR
No foreign director was on Board of Directors of the Company during the year.

KOHINOOR TEXTILE MILLS LIMITED70

ANNUAL REPORT 2019 71
AUDIT COMMITTEE
The Main terms of reference of the Audit Committee of the Company include the following:-
a) Determination of appropriate measures to safeguard the Company’s assets;
b) Review of annual and interim financial statements of the Company, prior to their approval by the Board of Directors, focusing on:
(i) Major judgmental areas;
(ii) Significant adjustments resulting from the audit;
(iii) Going concern assumption;
(iv) Any changes in accounting policies and practices;
(v) Compliance with applicable accounting standards;
(vi) Compliance with these regulations and other statutory and regulatory requirements; and
(vii) All related party transactions.
c) Review of preliminary announcements of results prior to external communication and publication;
d) Facilitating the external audit and discussion with external auditors of major observations arising from interim and final audits and any matter that the auditors may wish to highlight (in the absence of management, where necessary);
e) Review of management letter issued by external auditors and management’s response thereto;
TERMS OF REFERENCE OF BOARD COMMITTEES

KOHINOOR TEXTILE MILLS LIMITED72
f) Ensuring coordination between the internal and external auditors of the Company;
g) Review of the scope and extent of internal audit, audit plan, reporting framework and procedures and ensuring that the internal audit function has adequate resources and is appropriately placed within the Company;
h) Consideration of major findings of internal investigations of activities characterized by fraud, corruption and abuse of power and management’s response thereto;
i) Ascertaining that the internal control systems including financial and operational controls, accounting systems for timely and appropriate recording of purchases and sales, receipts and payments, assets and liabilities and the reporting structure are adequate and effective;
j) Review of the Company’s statement on internal control systems prior to endorsement by the Board of Directors and internal audit reports;
k) Instituting special projects, value for money studies or other investigations on any matter specified by the Board of Directors, in consultation with the Chief Executive Officer and to consider remittance of any matter to the external auditors or to any other external body;
l) Determination of compliance with relevant statutory requirements;
m) Monitoring compliance with these regulations and identification of significant violations thereof;
n) Review of arrangement for staff and management to report to Audit Committee in confidence, concerns, if any, about actual or potential improprieties in financial and other matters and recommend instituting remedial and mitigating measures;
o) Recommend to the Board of Directors the appointment of external auditors, their removal, audit fees, the provision of any service permissible to be rendered to the Company by the external auditors in addition to audit of its
financial statements. The Board of Directors shall give due consideration to the recommendations of the Audit Committee and where it acts otherwise it shall record the reasons thereof.
p) Consideration of any other issue or matter as may be assigned by the Board of Directors.
HUMAN RESOURCE & REMUNERATION COMMITTEE
The Main terms of reference of HR&R Committee of the Company include the following: -
i. Recommending human resource management policies to the Board;
ii. Recommending to the Board the selection, evaluation, development, compensation (including retirement benefits) of Chief Operating Officer, Chief Financial Officer, Company Secretary and Head of Internal Audit;
iii. Consideration and approval on recommendations of Chief Executive Officer on such matters for key management positions who report directly to Chief Executive Officer or Chief Operating Officer; and
iv. Where human resource and remuneration consultants are appointed, their credentials shall be known by the committee and a statement shall be made by them as to whether they have any other connection with the Company.

ANNUAL REPORT 2019 73
Management Committees are constituted to monitor and control the progress of various operational and strategic goals and ensure their effective contribution towards achieving Company’s strategic objective.
Following is a brief description of each committee, its cross-functional composition and its terms of reference:-
PROJECT MANAGEMENT COMMITTEE
Project management committee (PMC), serves as a driving forum to monitor the progress of agreed goals & objectives of the company on consistent basis, and steer the organization in right direction in order to achieve the stated vision and mission of the organization.
MEMBERSDirectorHead of Department – MarketingHead of Department – ProductionHead of Department – EngineeringHead of Department – FinanceHead of Department – Information TechnologyHead of Department – Human ResourceHead of Department – Commercial
Terms of reference
• Possible review each of the project areas – activities or sub projects
• Developing a framework for integrating planning.• Tools for achieving sustainable coastal
economies and environments• Handling financial issues, budget monitoring
and modifications• Develop standards & follow-up project progress
NO. OF MEETINGS HELD: 36
BUSINESS PROCESS RE-ENGINEERING COMMITTEE
Business Process Re-engineering (BPR) team has been formed to achieve dramatic improvements in critical, contemporary measures of performance, such as cost, quality, service and speed on consistent basis. Information technology and information systems are the main areas of interest where
management is rigorously investing considerable resources to determine and then opt what feasible technological options are available that best meets the goals of the organization in order to remain cost competitive and provide the maximum return to stakeholders.
MEMBERS DirectorHead of Department – MarketingHead of Department – ProductionHead of Department – EngineeringHead of Department – FinanceHead of Department – Information TechnologyHead of Department – Human Resource
Terms of reference
• Our BPR team implies specific business objectives such as cost reduction, time reduction, output quality improvement.
• We focus on the most important processes that reflect our business vision.
• Understand and measure the existing process to avoid repeating of old mistakes and to provide a baseline for future improvements.
• Design and build the prototype of new processes and ensure quick delivery of results and involvement and satisfaction of customers.
NO. OF MEETINGS HELD: 15
ENERGY MANAGEMENT COMMITTEE
Management has strong commitment towards securing the future of company, to remain competitive and provide the maximum return to stakeholders. Efficient use of energy cannot be compromised therefore; Energy Management Committee (EMC) has been formed to suggest the cost cutting opportunities for the sake of improvement in performance through wise energy use in all the departments of the company. MEMBERSDirectorHead of Department – Engineering Head of Department – FinanceHead of Department – Production Head of Department – Marketing
MANAGEMENT COMMITTEES & TERMS OF REFERENCE

KOHINOOR TEXTILE MILLS LIMITED74
Terms of reference
• Our team is committed for annual energy cost reductions from continuous improvements.
• To minimize environmental impacts, it incorporates energy efficiency, water conservation, waste minimization, pollution prevention, resource efficient materials and indoor air quality in all phases of a building’s life.
• EMC design plans that help us meet our climate protection commitments.
• The appointment of a full time energy management coordinator ensures the plan proceeds.
• Responsible for energy procurement, monitoring and targeting energy savings, maintaining program of energy saving measures, raising energy awareness and corporate wide energy monitoring and reporting.
NO. OF MEETINGS HELD: 20
TOTAL QUALITY MANAGEMENT COMMITTEE
Total Quality Management (TQM) committee is formed to improve quality at every level in the organization. TQM is an organization wide program aimed to ensure standardization and continual improvement in all its products, services, processes & procedures. This program lays down the Quality Management standards for all the processes & procedures in the organization and is equipping the existing human resources to improve their innate abilities in order to achieve the desired level of performance through synergistic activities.
MEMBERSDirectorHead of Department – Quality AssuranceHead of Department – MarketingHead of Department – ProductionHead of Department – EngineeringHead of Department – FinanceHead of Department – Information TechnologyHead of Department – Human ResourceHead of Department – Commercial
Terms of reference
• Standardization of processes and operations within every function of the company.
• Introduction of Performance Measurement System by developing Key Performance Indicators and continuous compilation of their associated data, analysis and reporting to concerned stakeholders, so that performance of every key function and process is monitored, controlled, and improved.
• Reduction and elimination of wastages from different processes.
• Improvement in organization wide abilities, procedures and plans.
• Training of employees on basic, medium and advanced problem solving and statistical tools in order to improve their analytical abilities.
• Creation of various forums within an organization where Quality improvement initiatives are formally institutionalized, e.g. Kaizen, Quality Circles, and functional / Cross Functional Teams.
NO. OF MEETINGS HELD: 10
STANDARD OPERATING PROCEDURES REVIEW COMMITTEE
Standard operating procedures review committee has been formed to review and update SOP’s for all the activities / procedures being performed in the Company & develop new SOP’s if required.
MEMBERSDirectorHead of Department – Internal AuditHead of Department – MarketingHead of Department – ProductionHead of Department – Finance
Terms of reference
• Documentation of all the important activities and procedures.
• Standardization of documents as prescribed by Quality Management standards.
• Incorporation of industry best practices in the procedures to make the system efficient and effective.
• Elimination of duplication of records in different procedures.
NO. OF MEETINGS HELD: 15

ANNUAL REPORT 2019 75

KOHINOOR TEXTILE MILLS LIMITED76
ANNUAL EVALUATION OF BOARD PERFORMANCEThe Board has set a criterion based on emerging and leading practices to assist in the self-assessment of an individual director and the full Board’s performance. It is not intended to be all-inclusive. When completing the performance evaluation, Board considers the following main performance evaluation process or behaviour: - • Adequate Board composition.
• Satisfactory Processes and Procedures for Board meetings.
• The Board sets objectives and formulates an overall corporate strategy.
• The Board has set up adequate number of its Committees.
• Each Director has adequate knowledge of economic and business environment in which the Company operates.
• Each Board member contributes towards effective and robust oversight.
• The Board has established a sound internal control system and regularly reviews it.
• The Board reviews the Company’s significant accounting policies according to the adequate financial reporting regulatory framework.
• The Board considers the quality and appropriateness of financial accounting and reporting and the transparency of disclosures.
EVALUATION CRITERIA OF BOARD PERFORMANCEFollowing is the main criteria:
• Financial policies reviewed and updated;
• Capital and operating budgets approved annually;
• Board receives regular financial reports;
• Procedure for annual audit;
• Board approves annual business plan;
• Board focuses on goals and results;
• Availability of Board’s guideline to management;
• Regular follow up to measure the impact of Board’s decisions;
• Assessment to ensure compliance with code of ethics and corporate governance.
During the year under review, the performance review of Board was not carried out by any external consultant.
PERFORMANCE REVIEW OF BOARD COMMITTEESPerformance of Board Committees is regularly evaluated by the Board of Directors based on the terms of reference as defined and approved by the Board.
CEO’S PERFORMANCE REVIEWThe performance of the CEO is regularly evaluated by the Board of Directors and this evaluation is based on the criteria defined by the Board of Directors which includes various financial and nonfinancial key performance indicators (KPIs). At the start of the year, CEO presents his KPI for the upcoming year to the Board of Directors. The Board periodically evaluates the actual performance against those KPIs during the year and discusses the future course of action to attain the Company’s stated goals. The CEO also appraises to the Board regarding an assessment of senior management and their potential to achieve the objectives of the Company.
OTHER CORPORATE MATTERS
ANNUAL REPORT 2019 77
BOARD’S REVIEW OF BUSINESS CONTINUITY AND DISASTER RECOVERY PLAN The Board of Directors periodically review the Company’s Business Continuity & Disaster Recovery (BC/DR) plan to ensure that critical business functions will be available to customers, suppliers, regulators, and other entities that have access to those functions even under extraordinary circumstances. BC/ DR plan mainly includes daily tasks such as customer/suppliers correspondence, production data, trading activities, project management, system backups and help desk operations.The primary activities of the Board for the execution of the plan include:• To develop and maintain a formal plan that is
responsive to the Company’s current business needs and operating environment.
• To ensure that a Business Continuity Recovery Team includes representatives from all business units.
• To provide ongoing business continuity training to all employees, including executive management and the Board.
• Ensure that thorough current business impact analysis and risk assessments are maintained.
• Ensure a centralized executive view of the business continuity plan and programs.
CONFLICT OF INTEREST MANAGEMENT POLICYThe company has the policy for actual and perceived conflicts of interest and measures are adopted to avoid any conflict of interest, identify the existence of any conflict of interest, and to disclose the existence of conflict of Interest. The Company annually circulates and obtains a signed copy of Code of Conduct applicable to all its employees and Directors, which also relates to matters relating to conflict of interest.Further, it seeks to set out the process, procedures and internal controls to facilitate compliance with the Policy as well as to highlight the consequences of non-compliance with the Policy by all its employees and Directors. The Company Policy provides a guide as to what constitutes a conflict of interest, the processes and procedures that are in place in order to facilitate compliance and, the consequences of non-compliance. The Policy is intended to assist directors
and employees in making the right decisions when confronted with potential conflict of interest issues.
MANAGEMENT OF CONFLICT OF INTEREST:The primary goal of Kohinoor policy is to manage conflicts of interest to ensure that decisions are made and are seen to be made on proper grounds, for legitimate reasons and without bias. To do this Kohinoor has set the following procedures to manage and monitor the conflict of Interest: • Identify areas of risk.• Develop strategies and responses for risky
areas.• Educate all employees about the conflict of
interest policy.• Communicate with stakeholders to provide the
platform for proper disclosure.• Enforce the policyFurther, the directors are annually reminded of the insider trading circular issued by the Securities and Exchange Commission of Pakistan to avoid dealing in shares while they are in possession of the insider information. Every director is required to provide to the Board complete details regarding any material transaction which may bring conflict of interest with the Company for prior approval of the Board. The interested director do not participate in the discussion neither they vote on such matters. The transactions with all the related parties are made on arms-length basis and complete details are provided to the Board for their approval. Further all the transactions with the related parties are fully disclosed in the financial statements of the Company.
INVESTORS’ GRIEVANCES POLICYThe company believes that Investor services is a vital element for sustained business growth and we want to ensure that our Investors receive exemplary service across different touch points of the Company. Prompt and efficient service is essential to retain existing relationships and therefore, Investor satisfaction becomes critical to the Company. Investor queries and complaints constitute an important voice of Investor, and this policy details grievance handling through a structured grievance framework. Grievance policy is supported by a review mechanism, to minimize the recurrence of similar issues in future. Investors has the facility to call toll free call centre

KOHINOOR TEXTILE MILLS LIMITED78
24/7 to register their grievances. The Company’s Grievance policy follows the following principles:
• Investors are treated fairly at all times.• Complaints raised by Investors are dealt with
courtesy and in a timely manner.• Investors are informed of avenues to raise their
queries and complaints within the organization and their rights if they are not satisfied with the resolution of their complaints.
• Queries and complaints are treated efficiently and fairly.
• The Company’s employees work in good faith and without prejudice, towards the interests of the Investors.
SAFETY OF RECORDS
The Company is effectively implementing the policy to ensure the safety of the records. All records must be retained for as long as they are required to meet legal, administrative, operational, and other requirements of the Company. The main purposes of the Company Policy are:
• To ensure that the Company’s Records are created, managed, retained, and disposed of in an effective and efficient manner;
• To facilitate the efficient management of the Company’s Records through the development of a coordinated Records Management program;
• To ensure preservation of the Company’s Records of permanent value to support both protection of privacy and freedom of information services throughout the Company to promote collegiality and knowledge sharing;
• Information will be held only as long as required, and disposed of in accordance with the record retention policy and retention schedules and
• Records and information are owned by the Company, not by the individual or team.
IT GOVERNANCE POLICY
Kohinoor has properly documented and implemented IT governance policy to ensure an integrated framework for evolving and maintaining existing information technology and acquiring new technology to achieve the Company’s strategic focus. The purpose of this policy is to define the IT governance scope, and its roles and responsibilities. IT Governance policy consist of the following:
• To provide a structured decision making process around IT investment decisions.
• Promotes accountability, due diligence, efficient and economic delivery of the Company’s IT services.
• Lay down solid foundation for management decision making and oversight.
• Safeguard of Company’s financial data.• Development and up gradation of different
modules to provide reliable, efficient and timely information.
• To create a culture of paper less environment within the Company.
HUMAN RESOURCE MANAGEMENT
The Company is committed to build a strong organizational culture that is shaped by empowered employees who demonstrate a deep belief in Company’s vision and values. Therefore, Human Resource Management (HRM) is an integral part of our business strategy. The Company fosters leadership, individual accountability and teamwork. The main objectives of the Company’s HRM policy are:
• Selecting the right person, with the right experience, at the right time, offering the right compensation.
• Developing management philosophies and practices to promote and encourage motivation and retention of the best employees.
• Recognizing and rewarding employees’ contribution to the business.
• Fostering the concept of team work and synergetic efforts
• Encouraging and supporting team concepts and team building techniques.
• Nurturing a climate of open communications between management and employees.
• Making all reasonable efforts to achieve a high quality of work-life balance.
SUCCESSION PLANNING
The Company believes in proactive approach towards succession planning. We recruit employees, develop their knowledge, skills, abilities, and prepare them for advancement or promotion into ever more challenging roles. Rigorous succession planning is also in place throughout the organization. Succession planning ensures that employees are constantly groomed up to fill each needed role.

ANNUAL REPORT 2019 79

KOHINOOR TEXTILE MILLS LIMITED80
TRAINING AND DEVELOPMENT OF EMPLOYEESNo Company, small or large, can win over the long run, without energized employees, who believe in the Mission of the Company and understands how to achieve it. In KOHINOOR, we look for people who exemplify continuous improvement when we are spotting future successors. In this relation, the Company also expends a lot in terms of finances and time for the training of its resources as is evident from the below trainings held during the year: • Emotional Intelligence • Effective Communication Skills• Project Management• Supply chain management• Simatic Program Logic Controllers• Situational Leadership II• Building Impactful Brands • Benchmarking Session • Management Development Program • HSE Emergency Response Training• Developing Future Leaders
SOCIAL AND ENVIRONMENTAL RESPONSIBILITY POLICYThe Company’s Social and Environmental Responsibility Policy reflects the Company’s recognition that there is a strong, positive correlation between financial performance and corporate, social and environmental responsibility. The Company believes that the observance of sound environmental and social strategies is essential for building strong brand and safeguarding reputation, which in turn is vital for long term success.
SOCIAL RESPONSIBILITY POLICY:• Implementation of Employee Code of Conduct
that fits with local customs and regulations.• Culture of ethics and behaviour which improve
values like integrity and transparency.• Focusing on social involvement by
developing multicultural teams with different competencies.
• Promoting the culture of work facilitation and knowledge transfer.
• Carrying out corporate philanthropy actions that focus in particular on preserving life and the environment.

ANNUAL REPORT 2019 81
• Maintaining collaborative relations with the society through a good harmony and effective communication.
ENVIRONMENTAL RESPONSIBILITY POLICY• Ensure our products, operations and services
comply with relevant environmental legislation and regulations.
• Maintain and continually improve our environmental management systems to conform to the ISO Standards or more stringent requirements as dictated by specific markets or local regulations.
• Operate in a manner that is committed to continuous improvement in environmental sustainability through recycling, conservation of resources, prevention of pollution, product development and promotion of environmental responsibility amongst our employees.
• Responsibly managing the use of hazardous materials in our operations, products and services and promote recycling or reuse of our products.
• Inform suppliers, including contractors, of our environmental expectations and require them to adopt environmental management practices aligned with these expectations.
POLICY ON DIVERSITYAt Kohinoor Textile Mills Limited, we aim to be an inclusive organisation, where diversity is valued, respected and built upon. We recruit and retain a diverse workforce irrespective of religious and political beliefs, gender, race, ethnicity, disability, education, colour, language, age, socioeconomic background, and geographic location and region. The culture of the Company values differences and recognises that stakeholders from different backgrounds and experiences can bring valuable insights to enable a collaborative work environment by introduction of varied ideas and perspectives within the Company.
We Aim to pro-actively tackle discrimination and to ensure that no individual or group is directly or indirectly discriminated against for any reason regarding employment and the Company bears no tolerance for harassment/bullying and persecution. The company has a whistle blowing policy in place, and employees are encouraged to report all such matters and related grievances to the Human Resources department.

KOHINOOR TEXTILE MILLS LIMITED82
The Board ensures application of diversity policy through Human Resource department by ensuring that all talent hunting seminars, job fairs and advertisements specifically mention that we are an equal opportunity employer in all areas and we nourish an organizational culture where individual differences are appreciated rather than criticized for novel ideas and improvements. Furthermore, Internal Audit department ensures and reports compliance of diversity policy on periodic basis.
WHISTLE BLOWING POLICYIn line with the Company’s commitment to open communication, the whistle blowing policy through non-conformance reporting was designed to provide an avenue for employees to raise concerns, and reassurance that they will be protected. As an aware and attentive organization, Kohinoor believes in the conduct of the affairs of its business in a fair and see-through approach by adopting the uppermost principles of professionalism, truthfulness, reliability and principled manners. The said policy has the following main procedures:
• All Protected Disclosures should be addressed to the nominated Ombudsperson of the Company.
• Protected Disclosures should preferably be reported in writing so as to ensure a clear understanding of the issues raised and should either be typed or written in a legible in English, Urdu or in the regional language.
• The Protected Disclosure should be forwarded under a covering letter which shall bear the identity of the Whistle Blower.
• Protected Disclosures should be factual and not speculative or in the nature of a conclusion, and should contain as much specific information as possible to allow for proper assessment of the nature and extent of the concern and the urgency of a preliminary investigative procedure.
• Anonymous disclosures will not be entertained by the Ombudsperson as it would not be possible for it to interview the Whistle Blowers.
• If initial enquiries by the Ombudsperson indicate that the concern / complaint has no basis, or it is not a matter to be investigation pursued under this Policy, it may be dismissed at this stage.
• Where initial enquiries indicate that further investigation is necessary, this will be carried through in a fair manner, as a neutral fact-finding process and without presumption of guilt. A written report of the findings would be made.
In Kohinoor, no whistle blowing related incidence was highlighted and reported under the above said procedures during the year.
GOVERNANCE PRACTICES EXCEEDING LEGAL REQUIREMENTThe management of the Company believes to follow best governance practices that can be implemented in the Company’s environment. To implement these practices the minimum benchmark is to comply with all the legal requirements. However, the management goes ahead to implement best practices of corporate governance that are followed globally and are in favour of the Company’s shareholders, employees, environment and community.
Following additional governance practices implemented by the management include: • Disbursement of additional corporate and
financial information to shareholders and legal authorities, although not required by any law, to make the Company’s affairs more transparent and to give better insight of the Company’s affairs, policies and strategies.
• Implementation of Health, Safety and Environment Policy for better and safe work place environment for employees, workers and surrounded community.
The Company understands and fulfil its corporate social responsibility and has implemented various social projects for welfare of the community.
RELATED PARTY TRANSACTIONSThe Company has made detailed disclosures about related party transactions in its financial statements annexed with this annual report. Such disclosure is in line with the requirements of the 4th Schedule to the Companies Act, 2017 and applicable International Financial Reporting Standards.Moreover, the Company has also decided to place its related party transactions before the Annual General Meeting for obtaining shareholders’ approval for the same. Details of party-wise disclosure of such transactions is also given in the statement u/s 134 annexed with the Notice of AGM. TRANSACTION / TRADE OF COMPANY’S SHARESThe Board has reviewed the threshold for disclosure of interest by executives holding of Company’s shares which includes Chief Executive Officer, Chief Financial Officer, General Manager (Finance), Sr. Manager (Finance), Head of Internal Audit and Company Secretary. None of the Directors, CEO, CFO, GM (Finance), Sr. Manager (Finance), Head of Internal Audit and Company Secretary (including their spouses and minor children) traded in the shares of the Company.

ANNUAL REPORT 2019 83
STAKEHOLDERS’ RELATIONSHIP AND
ENGAGEMENT

KOHINOOR TEXTILE MILLS LIMITED84
Kohinoor Textile Mills Limited maintains sound collaborative relationships with its stakeholders. The Company understands the importance of continuous collaboration with shareholders of the Company regarding all significant decisions to be made, the performance of the Company in varying circumstances, challenges it faced and the necessary steps taken to mitigate those challenges.
BOARD’S INTERACTION WITH MAJOR SHAREHOLDERS
The Board has devised a mechanism to arrange interactive sessions between management of the Company and its shareholders to solicit and understand views of shareholders. It includes management briefings to its shareholders about the performance of the Company, macro and micro economic factors affecting the Company, prospects of the Company and the steps taken by the Company to improve its performance in challenging circumstances. These communications help the Board to understand and resolve the concerns of the shareholders and to add synergy factor to achieve better results in the Company’s prospects.
PROCEDURES FOR STAKEHOLDERS’ ENGAGEMENT:
Procedures for stake-holders engagement includes effective communication, good harmony, compliance with laws & regulations and customer focused approach which are the key success for establishment of collaborative relationship with stakeholder.
ENGAGEMENT FREQUENCY
The Company maintains its good relationships with all stakeholders based on mutual interest, integrity and confidence. We maintain collaborative relations with our stakeholders through harmonious and effective communication and through our customer focused approach. Moreover, the Company maintains good relationship with its Bankers and arranges Investors’ conferences periodically to discuss business prospects and financial management plans with the Lenders which also enhances their confidence in the Company.
POLICY FOR STAKEHOLDERS’ ENGAGEMENT
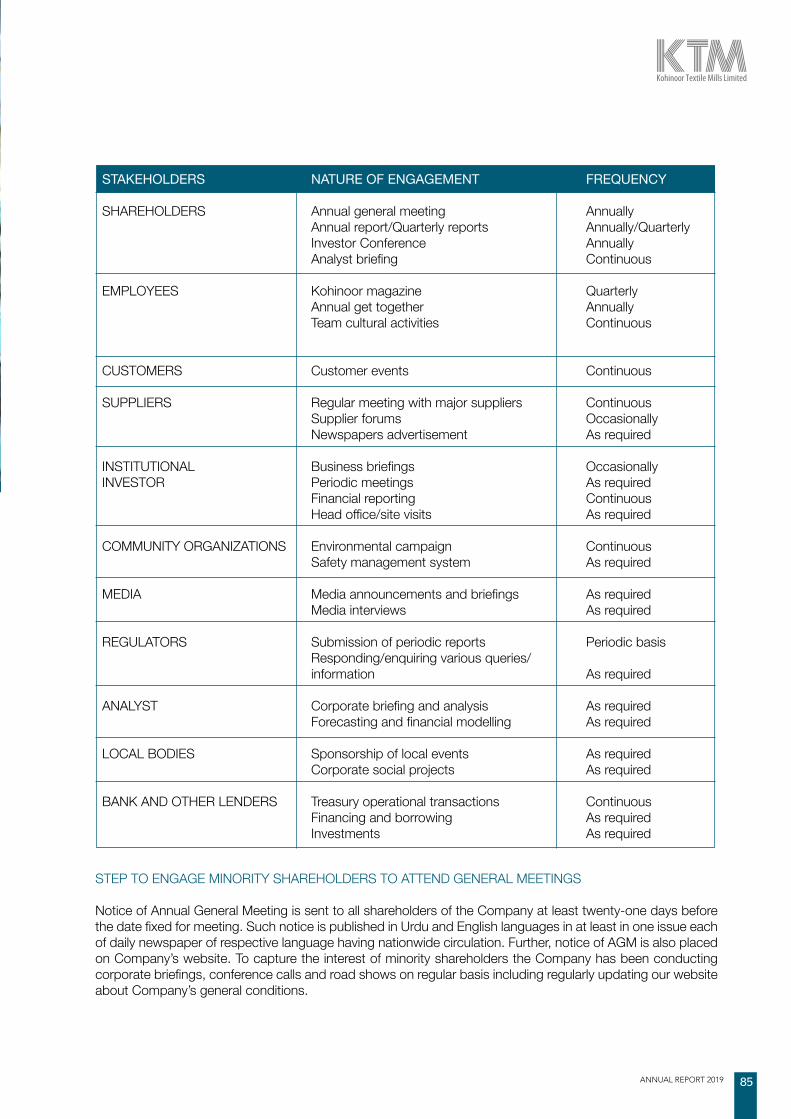
ANNUAL REPORT 2019 85
STEP TO ENGAGE MINORITY SHAREHOLDERS TO ATTEND GENERAL MEETINGS
Notice of Annual General Meeting is sent to all shareholders of the Company at least twenty-one days before the date fixed for meeting. Such notice is published in Urdu and English languages in at least in one issue each of daily newspaper of respective language having nationwide circulation. Further, notice of AGM is also placed on Company’s website. To capture the interest of minority shareholders the Company has been conducting corporate briefings, conference calls and road shows on regular basis including regularly updating our website about Company’s general conditions.
STAKEHOLDERS
SHAREHOLDERS
EMPLOYEES
CUSTOMERS
SUPPLIERS
INSTITUTIONALINVESTOR
COMMUNITY ORGANIZATIONS
MEDIA
REGULATORS
ANALYST
LOCAL BODIES
BANK AND OTHER LENDERS
NATURE OF ENGAGEMENT
Annual general meetingAnnual report/Quarterly reportsInvestor ConferenceAnalyst briefing
Kohinoor magazineAnnual get togetherTeam cultural activities
Customer events
Regular meeting with major suppliersSupplier forumsNewspapers advertisement
Business briefingsPeriodic meetingsFinancial reportingHead office/site visits
Environmental campaignSafety management system
Media announcements and briefingsMedia interviews
Submission of periodic reportsResponding/enquiring various queries/information
Corporate briefing and analysisForecasting and financial modelling
Sponsorship of local eventsCorporate social projects
Treasury operational transactionsFinancing and borrowingInvestments
FREQUENCY
AnnuallyAnnually/QuarterlyAnnuallyContinuous
QuarterlyAnnuallyContinuous
Continuous
ContinuousOccasionallyAs required
OccasionallyAs requiredContinuousAs required
ContinuousAs required
As requiredAs required
Periodic basis
As required
As requiredAs required
As requiredAs required
ContinuousAs requiredAs required

KOHINOOR TEXTILE MILLS LIMITED86
ISSUES RAISED IN THE LAST AGM, DECISIONS TAKEN AND THEIR IMPLEMENTATION STATUS
On query of a shareholder, the Chairman apprized about future prospects pertaining to exports and local sales. Results of operating divisions should remain profitable as a result of constant upgradation of production facilities and measures taken for improving the margins through rationalization and process improvement.
SIGNIFICANT CORPORATE BRIEFING SESSIONS
The interactive sessions include the annual general meeting, extra ordinary general meetings, corporate briefings/road shows, responding to investor queries either raised on email, website or on telephone. During the year, following major international and local road shows/corporate briefings sessions were held with investors:
• MENA & Frontier Conference at Dubai
• EFG Hermes London Conference
• South Asia Conference, Dubai
• 14th Annual One on One Conference EFG Hermes, Dubai
• Karachi PSX Brokers Meeting Organized by AKD
INVESTORS’ RELATIONS SECTION ON CORPORATE WEBSITE
The Company disseminates information to its investors and shareholders through a mix of information exchange platforms, including its corporate website. The website is updated regularly to provide detailed and latest company information including financial highlights, investor information and other requisite information besides the link to SECP’s investor education portal; the ‘Jamapunji’.
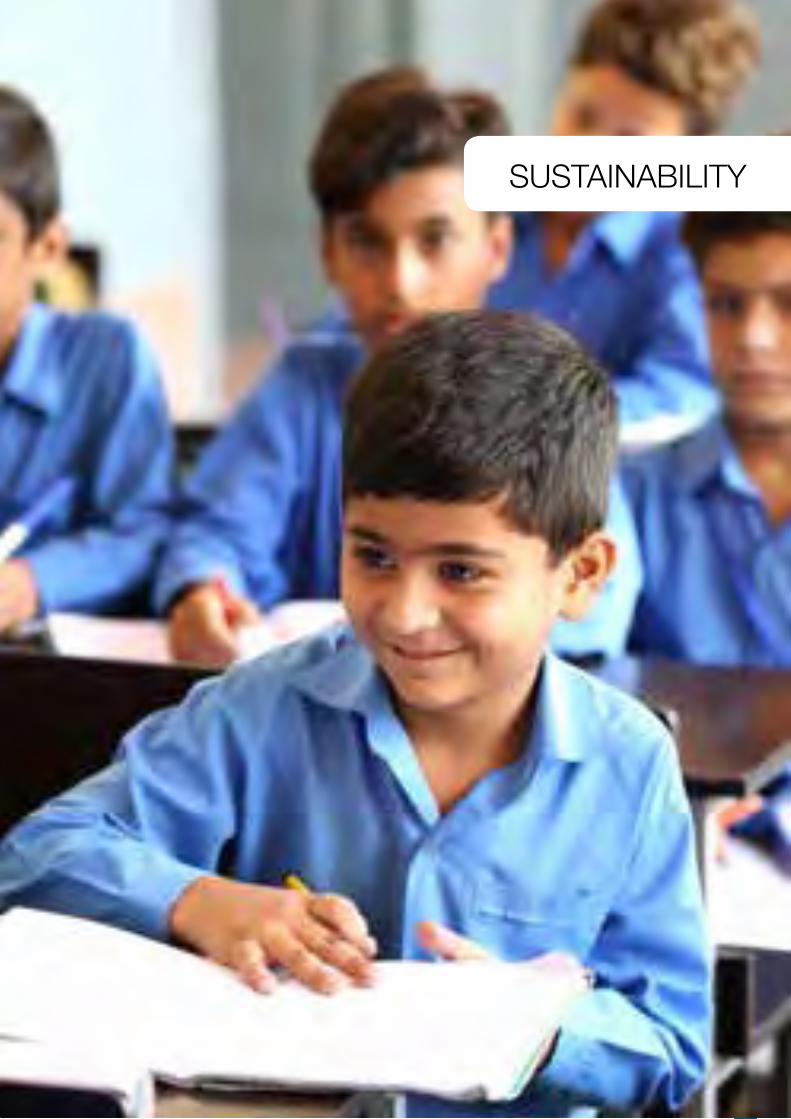
ANNUAL REPORT 2019 87
SUSTAINABILITY

KOHINOOR TEXTILE MILLS LIMITED88
INDUSTRIAL RELATIONS The company has established an Industrial Relations (IR) department for determination of adequate terms and conditions of employment. Further, the IR department is responsible for avoidance and settlement of disputes and differences between the Company, it’s employees, and their representatives through negotiation. The company has operates a Provident fund and a Worker’s Profit Participation Fund for its employees, as well as paying bonuses to employees on the basis of the company’s profitability and individual performance. The company is committed to providing equal opportunities to all existing and prospective employees without discrimination on the basis of race, religion, gender, or age.
ENERGY SAVING MEASURESGiven the current energy crisis in Pakistan, Kohinoor’s management recognises the importance of the efficient usage of energy in the corporate sector, and has therefore has formed an energy committee with the aim of finding more efficient and sustainable methods for generating and managing energy. The Company’s processing department has already reaped large benefits through its collaboration with several major multinational chemical suppliers; together they have substantially reduced the usage of water, chemicals, and energy while maintaining or improving quality and environmental standards. The Company hopes that future progress in these projects will yield further reductions in the costs of energy and usage of other resources such as water, etc. Further, in anticipation of increased scarcity and load shedding of natural gas and electricity, the Company is taking steps to further diversify its energy production capabilities, expanding into steam generation via wood, coal and waste heat recovery, and initiating a pilot project in solar heating of water.
SOLAR POWER GENERATIONIn order to become a truly “green” manufacturer, Company has successfully completed its second project of 2MW Solar Power Plant. This project, in combination with already installed 1MW solar power plant, will help reduce average power generation cost. Management is committed to increase capacity of power generation through solar based projects across other divisions of Kohinoor Textile Mills Limited in years to come.
CONSUMER PROTECTION MEASURESWe are committed to ensuring that our products are shipped in a manner complying with the highest safety standards and meeting or exceeding all legal requirements. The Company takes care and applies appropriate procedures to manufacture its products so as to ensure that no harmful substances are present in any of its products.
QUALITY MANAGEMENT SYSTEMSThe Company maintains its reputation as a high quality supplier and owes its current business, in large part, to this reputation. Quality control checks occur at all points in the production chain, starting at the delivery of raw material to the factories, through to the Quality Assurance team acting as the customer’s representative when conducting audits of finished goods before handing them over to the customer’s audit teams for the final inspection. It is worth noting that the Company’s Quality Management Systems are so highly regarded that several customers no longer require the presence of external auditors before shipping of finished goods.The Company is ISO-9001:2008 certified and firmly believes in the necessity of Quality Management Systems.
CORPORATE SUSTAINABILITY

ANNUAL REPORT 2019 89
INFORMATION TECHNOLOGYManagement has a strong commitment to strengthen the platform for information technology and information systems in order to remain competitive and cater the requirements of coming era. The company continues to upgrade and improve our information systems and processes, an effort led by a team of IT professionals with wide ranged experience in latest information technologies.
OCCUPATIONAL HEALTH, SAFETY AND ENVIRONMENTAL (HSE) PROTECTION MEASURESThe Company continues to meet and exceed the health and safety standards required for SA 8000 certification. Frequent audits are conducted by customers, regulatory agencies, and the Company’s own audit teams in order to ensure compliance with these standards and those set by the Company’s customers. The Company strives to provide a safe and healthy workplace for its employees and to act responsibly towards the communities and environment, in which it operates. It realizes this through the commitment of its leadership, the dedication of its staff, and application of the highest professional standards of work. Recently we have
done a complete re-examination and improvement of our fire safety protocols to further ensure the safety of our employees. Management takes all possible measures to prevent unsafe activities by its hiring practices and through the implementation of effective management, human resources and operational policies.
BUSINESS ETHICS & ANTI-CORRUPTION MEASURESThe Company, through its training, management standards and procedures, aims to develop a disciplined and constructive control environment in which all employees understand their roles and obligations. Employees are encouraged to report any deals that may be supported by kickbacks, and no employees are allowed to run parallel businesses. The Company maintains a system by which any employee can report the non-conformance (NC) to the top management. All NCs reported are addressed by the top management on timely basis and a regular follow up activity is being carried out in order to ensure that all issues highlighted are permanently resolved. Further, the Company’s Internal Audit department is empowered to perform regular and ad-hoc checks and audits of any and all functions and operations of the company and reports directly

KOHINOOR TEXTILE MILLS LIMITED90
to the Audit Committee. Moreover, the Company has also formulated whistle blowing policy.
WASTE WATER TREATMENT PLANTManagement understands the harmful effects of contaminated water on the surrounding areas after emission from the mills premises. In order to prevent the potentially harmful effects of any chemicals used in processing on the surrounding water table, a waste water treatment plant has been constructed minimizing or negating any contamination in water discharged from the factory. Further, the company continues to investigate and implement pilot projects into alternative, sustainable energy sources.
MINIMAL LIQUID DISCHARGEADOPTING A ‘LESS IS MORE’ MINDSET.Experimentation has successfully concluded to reuse treated effluent in order to reduce freshwater requirement. Management is working on more fantastic ideas to wisely use this scarce resource, i.e., water, considering dropping reservoirs across the country.
NATIONAL CAUSE DONATIONSDuring the year, Company has contributed Rs. 33.868 Million to Gulab Devi Educational Complex, Lahore towards construction of Al-Aleem Medical College in Gulab Devi Chest Hospital (GDCH), Lahore. The Company has also contributed in
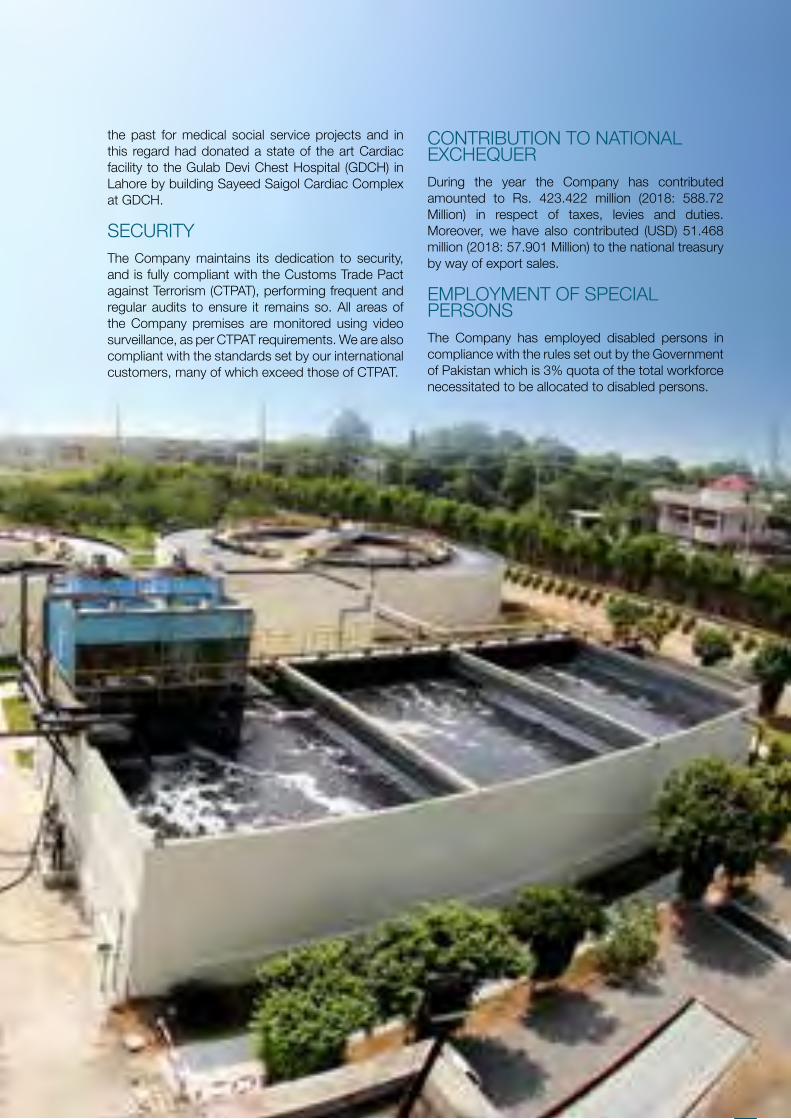
ANNUAL REPORT 2019 91
the past for medical social service projects and in this regard had donated a state of the art Cardiac facility to the Gulab Devi Chest Hospital (GDCH) in Lahore by building Sayeed Saigol Cardiac Complex at GDCH.
SECURITYThe Company maintains its dedication to security, and is fully compliant with the Customs Trade Pact against Terrorism (CTPAT), performing frequent and regular audits to ensure it remains so. All areas of the Company premises are monitored using video surveillance, as per CTPAT requirements. We are also compliant with the standards set by our international customers, many of which exceed those of CTPAT.
CONTRIBUTION TO NATIONAL EXCHEQUERDuring the year the Company has contributed amounted to Rs. 423.422 million (2018: 588.72 Million) in respect of taxes, levies and duties. Moreover, we have also contributed (USD) 51.468 million (2018: 57.901 Million) to the national treasury by way of export sales.
EMPLOYMENT OF SPECIAL PERSONSThe Company has employed disabled persons in compliance with the rules set out by the Government of Pakistan which is 3% quota of the total workforce necessitated to be allocated to disabled persons.

KOHINOOR TEXTILE MILLS LIMITED92
COMMUNITY INVESTMENT AND WELFARE SCHEMESThe Company has a long tradition of maintaining good community relations, and many of its employees are actively involved in welfare schemes. We believe that investing in our communities is an integral part of our social responsibility, and is vital to ensure the sustained success of the Company. We aim to ensure that our businesses and factories have the resources and support to identify those projects, initiatives, and partnerships that can make a real difference in their communities, and those that will mean something to our employees and their families.
RURAL DEVELOPMENT PROGRAMThe Company’s Mills are located in rural area therefore various corporate social responsibility activities are effectively implemented in those areas.The Company has been working hard to initiate and sustain rural development programs for the enhancement of health of the rural population. Therefore a “Dengue Fever Awareness Program” was carried out to demonstrate the prevention techniques and share knowledge with community members to ensure maximum awareness at plant site and the local community.
MITIGATING EFFORTS TO CONTROL INDUSTRY EFFLUENTSTraditionally, dying factories have been considered environmentally hazardous but Kohinoor has installed the most modern and state-of-the-art equipment to control effluent discharge negating the effects industrial effluents on the surrounding environment; the Company makes every effort to ensure a healthy environment to employees and locals. To enhance
environmental standards and continuously promoting a better and Green Environment within the factory as well in the nearby areas the Company is arranging regular Tree Plantation activities to provide healthy environment to employees and other community living in surroundings.
BEST CORPORATE REPORT AWARDCompany has maintained its history of delivering best user friendly financial reports and again bagged award for “Best Corporate Report 2018” in the ceremony jointly hosted by Institute of Chartered Accountants of Pakistan (ICAP) and Institute of Cost and Management Accountants of Pakistan (ICMAP) in Textile Sector by securing 1st position. This achievement secured by the Company reflects best ethical values and management practices in corporate reporting. The Company has promoted accountability and transparency through provision of accurate, informative, factual and reader-friendly Annual Reports on timely basis for the valuable stake holders.
ANNUAL REPORT 2019 93
Certificate of Approval
Lloyd's Register Group Limited, its affiliates and subsidiaries, including Lloyd's Register Quality Assurance Limited (LRQA), and their respective officers, employees or agents are, individually and collectively, referred to in this clause as'Lloyd's Register'. Lloyd's Register assumes no responsibility and shall not be liable to any person for any loss, damage or expense caused by reliance on the information or advice in this document or howsoever provided, unless thatperson has signed a contract with the relevant Lloyd's Register entity for the provision of this information or advice and in that case any responsibility or liability is exclusively on the terms and conditions set out in that contract.Issued by: Lloyd's Register Quality Assurance Limited, Dubai, Festival Office Tower, Suite 2001, Dubai Festival City, Dubai
Page 1 of 1
This is to certify that the Management System of:
Kohinoor Textile Mills LtdRawalpindi Division, Peshawar Road, Rawalpindi, Pakistan
has been approved by LRQA to the following standards:
ISO 9001:2015
Basem Obaid - Area Operations Manager
Issued by: Lloyd's Register Quality Assurance Limited
Current issue date: 31 July 2018 Original approval(s):Expiry date: 30 June 2020 ISO 9001 – 23 June 1999Certificate identity number: 10112216
Approval number(s): ISO 9001 – 0049984
The scope of this approval is applicable to:Design & Manufacture of Yarn made from Cotton & Man Made Fibres. Fabric Conversion through Bleaching,
Dyeing, Printing, Finishing and Stitching for Home Furnishings.
Certificate of Approval
Lloyd's Register Group Limited, its affiliates and subsidiaries, including Lloyd's Register Quality Assurance Limited (LRQA), and their respective officers, employees or agents are, individually and collectively, referred to in this clause as'Lloyd's Register'. Lloyd's Register assumes no responsibility and shall not be liable to any person for any loss, damage or expense caused by reliance on the information or advice in this document or howsoever provided, unless thatperson has signed a contract with the relevant Lloyd's Register entity for the provision of this information or advice and in that case any responsibility or liability is exclusively on the terms and conditions set out in that contract.Issued by: Lloyd's Register Quality Assurance Limited, Dubai, Festival Office Tower, Suite 2001, Dubai Festival City, Dubai
Page 1 of 1
This is to certify that the Management System of:
Kohinoor Textile Mills LtdRawalpindi Division, Peshawar Road, Rawalpindi, Pakistan
has been approved by LRQA to the following standards:
ISO 14001:2015
Basem Obaid - Global Head of Training and Improvement Services
Issued by: Lloyd's Register Quality Assurance Limited
Current issue date: 8 October 2018Expiry date: 21 July 2021Certificate identity number: 10140068
Original approval(s):ISO 14001 – 22 July 2015
Approval number(s): ISO 14001 – 00016747
The scope of this approval is applicable to:Design and Manufacture of Yarn made from Cotton and Man Made Fibres. Fabric Conversion through
Bleaching, Dyeing, Printing, Finishing and Stitching for Home Furnishings.
EU Ecolabel Certificate
Ecolabelling Norway has awarded the EU Ecolabel licence number
NO/016/002
to: Kohinoor Textile Mills Limited
for Textile products
See product specification enclosed.
This certificate is valid, together with the contract concluded between Ecolabelling Norway and Kohinoor Textile Mills Limited, until 05-12-2020.
Norway, 23-11-2017, Ecolabelling Norway
Anita Winsnes
Managing Director
Certificate of Approval
Lloyd's Register Group Limited, its affiliates and subsidiaries, including Lloyd's Register Quality Assurance Limited (LRQA), and their respective officers, employees or agents are, individually and collectively, referred to in this clause as'Lloyd's Register'. Lloyd's Register assumes no responsibility and shall not be liable to any person for any loss, damage or expense caused by reliance on the information or advice in this document or howsoever provided, unless thatperson has signed a contract with the relevant Lloyd's Register entity for the provision of this information or advice and in that case any responsibility or liability is exclusively on the terms and conditions set out in that contract.Issued by: Lloyd's Register Quality Assurance Limited, Dubai, Festival Office Tower, Suite 2001, Dubai Festival City, Dubai for and on behalf of: Lloyd's Register Quality Assurance Limited, 1 Trinity Park, Bickenhill Lane, Birmingham B377ES, United Kingdom
Page 1 of 1
This is to certify that the Management System of:
Kohinoor Textile Mills Limited8 Km, Manga - Raiwind Road, District Kasur, Lahore, 12345, Pakistan
has been approved by LRQA to the following standards:
ISO 14001:2015 | ISO 9001:2015
Basem Obaid - Global Head of Training and Improvement Services
Issued by: Lloyd's Register Quality Assurance Limited
Current issue date: 13 May 2019Expiry date: 30 April 2022Certificate identity number: 10190838
Original approval(s):ISO 14001 – 22 July 2010ISO 9001 – 17 May 2010
Approval number(s): ISO 14001 – 0050178 / ISO 9001 – 0050179
The scope of this approval is applicable to:Design & Manufacture of Greige Fabric in Cotton & Manmade Fibres for Home Furnishing & Apparel.

KOHINOOR TEXTILE MILLS LIMITED94
CALENDAR OF CORPORATE EVENTSJULY 2018- JUNE 2019
CALENDAR OF OTHER NOTABLE EVENTSJULY 2018- JUNE 2019
CalendarC O R P O R A T E
18-sep-18
B o a r d M e e t i n g y e a r e n d e d 2 0 1 8
18-sep-18
A n n o u n c e m e n t o f a n n u a l r e s u lt s f o r
y e a r 2 0 1 8
18-sep-18
F i n a l D i v i d e n d 2 0 1 8 D e c l a r e d @ R s . 1 . 0 0 /
S h a r e24-oct-18
D e c l a r at i o n o f 1 s t Q t r A c c o u n t s - 2 0 1 9
20-feb-19
D e c l a r at i o n o f H a l f Y e a r ly
A c c o u n t s - 2 0 1 9
20-feb-19
I n t e r i m D i v i d e n d 2 0 1 8 - 1 9 D e c l a r e d @ R s . 1 . 0 0 / S h a r e
25-apr-19
D e c l a r at i o n o f 3 r d Q T R A c c o u n t s - 2 0 1 9
27-oct-18
A n n u a l G e n e r a l M e e t i n g 2 0 1 8
Solar Park Inauguration Ceremony July-2018
Independence Day Celebrations Aug 2018
Mehfil E Milad November 2018

ANNUAL REPORT 2019 95
Christmas Day December 2018
Special Employees Event December 2018
KTML Wellness Club Opening Ceremony Jan 2019
Women’s day Celebrations March 2019
Kohinoor Premier League April 2019
Executive Iftar Dinner and Mango Party, May and June 2019

KOHINOOR TEXTILE MILLS LIMITED96
OUTLOOK

ANNUAL REPORT 2019 97
During the year, Federal Board of Revenue has introduced a system of refund of pending sales tax claims by issuance of 3 years Bonds. Currently Financial institutions are totally unaware regarding modes operandi of these bonds. Being, export-oriented textile manufacturer, we expect that Government will make necessary amendments in relevant laws & regulations and make a smooth system through which textile sector may timely obtain its long hold sales tax refunds. Moreover, finance ministry will release funds to settle the pending DLTL approved cases. This will result in reduction of financial cost of the company and will improve profit margins.
Some further minor hindrances need to be removed in zero rated sales tax regime, which should lead to arrest the decline in exports from Pakistan. The Company is actively taking advantage of the State Bank’s Long-Term Financing Facility, resulting in large-scale investment in modernization and expansion of our sites. It is hoped that this excellent facility will continue.
Dividend income from the Company’s subsidiaries is expected to be substantial and should further bolster the Company’s balance sheet. We envisage improved turnover in spinning division due to improved performance and better marketing position in the Spinning division due to cost reduction measures taken and favorable exchange rates, going forward. Trading conditions in the US are stable, although Europe continues to face difficulties.
We are confident that the Company will be able to meet the challenges presented by local as well as international conditions. Future financial forecasts based on management’s best estimates are as follows:
FINANCIAL FORECAST
The projections are very encouraging with continued growth expected locally and internationally as new potential businesses are being explored and various measures adopted by the Company to reduce the cost.
Financial Forecast FY 2019-20 Rs. in MillionRevenue 25,219Gross Profit 3,552Profit from Operations 2,120
Financial & Non-financial considerations
Financial considerations are used to make the projections of the Company which are as follows:
• Increase in sales volume for all types of products.• Reduced cost of production through:
- optimizing power generation mix - lower weighted average cost of capital
Non-financial measures are the many intangible variables that impact performance of the Company. These are difficult to quantify compared to financial measures but equally important. These indicators are more likely to be closer to the long-term organizational strategies. Following are the non-financial measures in place by the Company:
• Stakeholders’ engagement – different committees and forums are in place and meetings are held periodically to keep the stakeholders involved in every aspect of the business.
• Customer satisfaction – Company places strong emphasizes on customers’ satisfaction and ensure to produce & deliver the goods as per specific demands of customers.
• Employees’ development - the Company has conducted various training courses for the development of existing human capital.
• Innovation in manufacturing methods – ongoing R & D is in place to improve the production process and efficiencies
FORWARD LOOKING STATEMENT

KOHINOOR TEXTILE MILLS LIMITED98
SOURCES OF INFORMATION AND ASSUMPTIONSThe preparation of financial statements requires management and the Board of Directors to make estimates and judgments that affect reported amounts of assets, liabilities, revenues and expenses and related disclosure of contingencies. These estimates are based on historical experience and various other assumptions that management and the Board believe are reasonable under the circumstances, the results of which form the basis for making judgments about the carrying values of assets and liabilities that are not readily apparent from other sources. Actual results may differ from these estimates under different assumptions or conditions.
Estimating useful life of assets
The useful lives are estimated having regard to the factors as asset usage, maintenance, rate of technical and commercial obsolescence. The useful lives of assets are reviewed annually.
Investment properties
Investment properties are valued at fair value determined by an independent valuer having relevant professional qualifications. The fair value is determined on the basis of professional assessment of the current prices in an active market for similar properties in the same location and condition.
SWOT analysis is being used at Kohinoor Textile Mills Limited (KTML) as a strategy formulation tool, to match our strengths with perceived opportunities and minimize our weaknesses to avoid market and other threats.
Management at KTML, considers the following factors of SWOT analysis relevant to us:
STRENGTHS
• Latest and state of the art equipment for meeting quality management standards
• Experienced Management & qualified team• Dedicated customer services• Strong local and International branding• Vertically integrated composite units• Well diversified fuel mix and efficient operation• Captive power producer• Solar power generation• Efficient information systems
OPPORTUNITIES
• Unprecedented Rupee devaluation will help to increase export revenue
• Potential to expand product lines in new markets locally & internationally
• Rising population works as a catalyst for fabric needs• Commitment by Government to provide utilities on
controlled rates• Export re-finance scheme and provision of long term
finances at reduced mark-up rates• Reuse treated effluent
WEAKNESSES
• High operating leverage (being capital intensive industry)
• Delayed refund processing from regulatory departments
• Labor Productivity• Infrastructure issues
THREATS
• Price hike for imported raw materials• Unavailability of high-end raw cotton
locally• Stiff competition from textile-based
countries• High incidence of taxes• Hype to increase fuel prices due to
recent terrorist attacks in Saudia • Economic un-stability • Slow-down in business activity due to
active measures taken by federal board of revenue to enhance tax net.
SWOT ANALYSIS

ANNUAL REPORT 2019 99
Taxation
Determining income tax provisions involves judgment on the tax treatment of certain transactions. Deferred tax is recognized on tax losses not yet used and on temporary differences where it is probable that there will be taxable revenue against which these can be offset. Management has made judgments as to the probability of future taxable revenues being generated against which tax losses will be available for offset.
Employee benefit scheme
The defined benefit obligations are based on actuarial assumptions such as discount rate, expected rate of return on plan assets, expected rate of growth in salaries and expected average remaining working life of employees which are extensively detailed in relevant notes to the financial statements. STATUS OF CURRENT AND PREVIOUS PROJECTS
The Company has successfully completed 3-MW Solar power projects which are fully operational. These projects will help reduce average power generation cost. Now the management is considering to replicate these projects in other divisions of Company. ANALYSIS OF PRIOR YEAR FORWARD LOOKING DISCLOSURE
The Company’s actual performance in terms of the bottom line of financial results in the year 2018-19 exceeded the forward-looking disclosures made in the last year annual report.
Net profits improved significantly due to improved selling margins. Sales increased as compared with the projections. Gross profits increased mainly due better selling margins and increased quantities. Finance cost increased significantly during the year due to borrowing availed to meet the increased working capital requirements that varies with the level of business activates. Another reason for such an increase in finance cost is unprecedented hike in interest rates as compared with previous year.

KOHINOOR TEXTILE MILLS LIMITED100
PERFORMANCE AND POSITION

ANNUAL REPORT 2019 101
The management of the Company strongly believes in adherence to unreserved compliance with all the applicable International Accounting Standards (IAS)/IFRS vital to true and fair preparation and presentation of financial information. Compliance to IFRS encourages sufficient disclosures of the financial statements that are beneficial for informed decisions of stakeholders.
Financial statements for the year 2018-19 have been prepared in accordance with the accounting and reporting standards issued by International Accounting Standards Board as are applicable in Pakistan. IFRS adoption status is in detail is explained in note 2.1 (a) of annexed standalone financial statements.
COMPLIANCE WITH INTERNATIONAL FINANCIAL REPORTING STANDARDS (IFRS)
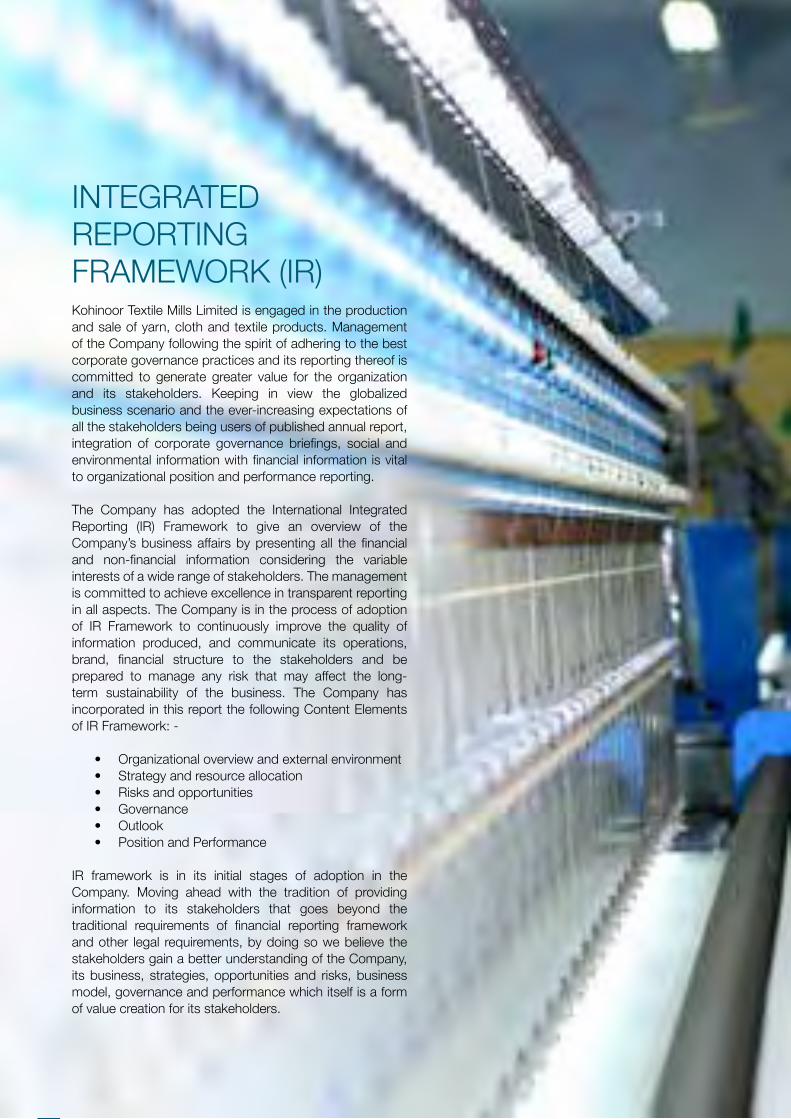
KOHINOOR TEXTILE MILLS LIMITED102
Kohinoor Textile Mills Limited is engaged in the production and sale of yarn, cloth and textile products. Management of the Company following the spirit of adhering to the best corporate governance practices and its reporting thereof is committed to generate greater value for the organization and its stakeholders. Keeping in view the globalized business scenario and the ever-increasing expectations of all the stakeholders being users of published annual report, integration of corporate governance briefings, social and environmental information with financial information is vital to organizational position and performance reporting.
The Company has adopted the International Integrated Reporting (IR) Framework to give an overview of the Company’s business affairs by presenting all the financial and non-financial information considering the variable interests of a wide range of stakeholders. The management is committed to achieve excellence in transparent reporting in all aspects. The Company is in the process of adoption of IR Framework to continuously improve the quality of information produced, and communicate its operations, brand, financial structure to the stakeholders and be prepared to manage any risk that may affect the long-term sustainability of the business. The Company has incorporated in this report the following Content Elements of IR Framework: -
• Organizational overview and external environment• Strategy and resource allocation• Risks and opportunities• Governance• Outlook• Position and Performance
IR framework is in its initial stages of adoption in the Company. Moving ahead with the tradition of providing information to its stakeholders that goes beyond the traditional requirements of financial reporting framework and other legal requirements, by doing so we believe the stakeholders gain a better understanding of the Company, its business, strategies, opportunities and risks, business model, governance and performance which itself is a form of value creation for its stakeholders.
INTEGRATED REPORTING FRAMEWORK (IR)
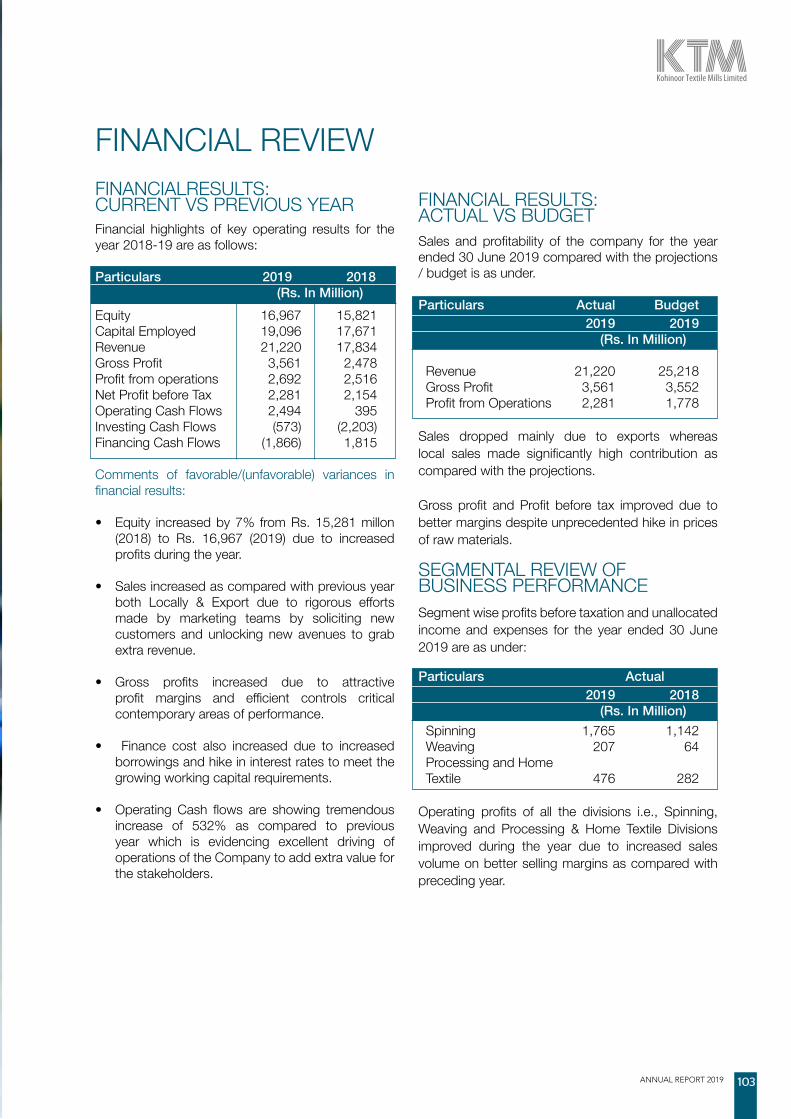
ANNUAL REPORT 2019 103
FINANCIAL REVIEWFINANCIALRESULTS: CURRENT VS PREVIOUS YEARFinancial highlights of key operating results for the year 2018-19 are as follows:
Particulars 2019 2018 (Rs. In Million) Equity 16,967 15,821Capital Employed 19,096 17,671Revenue 21,220 17,834Gross Profit 3,561 2,478Profit from operations 2,692 2,516Net Profit before Tax 2,281 2,154Operating Cash Flows 2,494 395Investing Cash Flows (573) (2,203)Financing Cash Flows (1,866) 1,815
Comments of favorable/(unfavorable) variances in financial results:
• Equity increased by 7% from Rs. 15,281 millon (2018) to Rs. 16,967 (2019) due to increased profits during the year.
• Sales increased as compared with previous year both Locally & Export due to rigorous efforts made by marketing teams by soliciting new customers and unlocking new avenues to grab extra revenue.
• Gross profits increased due to attractive profit margins and efficient controls critical contemporary areas of performance.
• Finance cost also increased due to increased borrowings and hike in interest rates to meet the growing working capital requirements.
• Operating Cash flows are showing tremendous increase of 532% as compared to previous year which is evidencing excellent driving of operations of the Company to add extra value for the stakeholders.
FINANCIAL RESULTS: ACTUAL VS BUDGETSales and profitability of the company for the year ended 30 June 2019 compared with the projections / budget is as under.
Particulars Actual Budget 2019 2019 (Rs. In Million)
Revenue 21,220 25,218 Gross Profit 3,561 3,552 Profit from Operations 2,281 1,778
Sales dropped mainly due to exports whereas local sales made significantly high contribution as compared with the projections.
Gross profit and Profit before tax improved due to better margins despite unprecedented hike in prices of raw materials.
SEGMENTAL REVIEW OF BUSINESS PERFORMANCESegment wise profits before taxation and unallocated income and expenses for the year ended 30 June 2019 are as under:
Particulars Actual 2019 2018 (Rs. In Million)
Spinning 1,765 1,142 Weaving 207 64 Processing and Home Textile 476 282
Operating profits of all the divisions i.e., Spinning, Weaving and Processing & Home Textile Divisions improved during the year due to increased sales volume on better selling margins as compared with preceding year.

KOHINOOR TEXTILE MILLS LIMITED104
COMPOSITION OF LOCAL VERSUS IMPORTED MATERIAL AND SENSITIVITY ANALYSIS
2019 2018 Rs. ‘000 % Rs. ‘000 % Local Materials: Raw materials 11,806,017 62% 7,332,491 56%Stores and spares 1,716,613 9% 1,048,346 8%Fuel and power 2,383,419 13% 2,003,884 15%
15,906,049 84% 10,384,721 79%Imported materials Raw materials 2,763,722 15% 2,618,032 20%Stores and spares 355,272 2% 92,592 1%
3,118,994 16% 2,710,624 21% 19,025,043 100% 13,095,345 100%
Sensitivity Analysis For each percent change in value of foreign currency, cost of imported materials will change by Rs 31.190 million (2018: 27,106 million). 2019 2018 Rs. ‘000 Rs. ‘000 Appreciation of PKR (31,190) (27,106) Depreciation of PKR 31,190 27,106 Percentage of COS 0.18% 0.18%
The management of the Company constantly monitors the international prices of imported materials and exchange rates fluctuations. Management takes necessary measures to mitigate such impacts as per Company’s risk management policies.
Free Cash Flows Net cash generated from operating activities 2,975,165 891,663 Capital expenditures (880,261) (851,614)
Free Cash Flows 2,094,904 40,049 Free Cash Flow (FCF) is the Cash a Company produces through its operations, less the cost of expenditures on assets & net borrowings. Ample availability of Cash depicts financial health of a Company to discharge its financial and operational commitments hence having lesser dependency on external sources of finance providers. Economic Value Added Net Profit after Tax 2,082,561 1,958,362 Less: Cost of capital (642,262) (830,990)
Economic Value Added 1,440,299 1,127,372 Economic value added (EVA) is a measure of a Company’s operating profit after tax generated in excess of cost of funds depolyed. Ample EVA exhibits that operations of the Company are driven with level of accuracy to full fill the requirements of finance providers.

ANNUAL REPORT 2019 105
Description 2019 2018 Number of shares
Weighted average number of shares outstanding at beginning of the year 299,296,456 285,178,699 Bonus element in right issue - weighted average number of ordinary share - - Weighted average number of shares outstanding at beginning of the year - restated 299,296,456 285,178,699 Right issue - weighted average number of ordinary share - 9,901,770 Weighted average number of shares outstanding at end of the year 299,296,456 295,080,469
RECONCILIATION OF WEIGHTED AVERAGE NUMBER OF SHARES FOR EPS
FAIR VALUE OF PROPERTY, PLANT AND EQUIPMENTMarket value of the Company’s property, plant and equipment is around Rs. 14.65 billion. The Company’s property, plant and equipment except freehold land and capital work in progress are stated at cost less accumulated depreciation and accumulated impairment loss in its financial statements. Freehold land is stated at revalued amount at the date of revaluation less any identified impairment loss and capital work-in-progress is stated at cost.
SIGNIFICANT / MATERIAL ASSETS OR IMMOVABLE PROPERTYThe Company’s material assets comprise of land, building, ring spinning machinery, open-end spinning machinery, wider width weaving looms, high definition digital printing machine, printing rotaries, dyeing and finishing machines, Jenbacher, Wartsila and Nigatta engines, and solar power plant installation.
SHARE PRICE SENSITIVITY ANALYSISCompany’s share price is directly linked with the operational and financial performance of Company. In the current situation, Management considers the following factors to which the performance and share price of the Company may be sensitive.
a. Agriculture
Performance in textile sector is mainly dependent on better results of agriculture sector for supply of quality cotton on cheaper rates. Good environmental conditions for cotton crop, having required rain falls, results in optimal quality of
cotton with reasonable prices. Availability of quality cotton on cheaper rates supports to generate higher profit margins for producing various types of yarn which in turns affect positively the share price of Company.
b. Demand Factor
Increase in demand of yarn / fabric & Home Textile products may result in increase in market price which will contribute towards better profitability and Earnings per share (EPS) which will ultimately increase the share price.
c. Increase in Cost of Production
Any increase in variable cost (Raw materials, power & utilities cost) may badly affect the gross margins and will resultantly fall in the profitability and fall in EPS. This may badly affect the market price of the share downward.
d. Political Unrest (Strikes, protests)
Volatile political situation often creates disruption in the business processes. Strikes, protests creates hindrance in production operations which may adversely affect the Company to meet deadlines of National / International customers. This factor although not very much material at the moment, but may affect share price of the Company adversely.
e. Change in Government Policies
Any change in Government policies related to textile sector may affect the share price of the Company. If policy change is positive than share price will increase, otherwise vice versa.

KOHINOOR TEXTILE MILLS LIMITED106
STATEMENT OF CASH FLOWS (DIRECT METHOD)FOR THE YEAR ENDED 30 JUNE 2019 2019 2018 (Rupees in thousand)
CASH FLOWS FROM OPERATING ACTIVITIES Cash receipts from customers 21,434,385 17,432,561Cash paid to suppliers and employees 18,459,220 16,540,898
Cash generated from operations 2,975,165 891,663Finance cost paid (400,647) (343,077)Income tax paid (77,854) (160,757)Net decrease in long term deposits (2,965) 7,055 Net cash generated from operating activities 2,493,699 394,884 CASH FLOWS FROM INVESTING ACTIVITIES Capital expenditure on property, plant and equipment (880,261) (851,614)Proceeds from sale of property, plant and equipment 41,752 19,529 Long term investments made (24,819) (2,367,710)Short term investments made (1,103,118) (2,663,941)Proceeds from sale of short term investments 1,051,322 2,646,341 Interest received 14,355 12,037 Dividends received 327,839 1,002,415
Net cash used in investing activities (572,930) (2,202,943) CASH FLOWS FROM FINANCING ACTIVITIES Proceeds from long term financing 596,883 441,988Repayment of long term financing (373,565) (272,328)Repayment of liabilities against assets subject to finance lease - (20,717)Proceeds from issue of right shares - 1,010,571Short term borrowings - net (1,493,861) 1,447,518Dividend paid (595,765) (792,003)
Net cash (used in) / from financing activities (1,866,308) 1,815,029
Net increase in cash and cash equivalents 54,461 6,970Cash and cash equivalents at the beginning of the year 161,905 154,935
Cash and cash equivalents at the end of the year 216,366 161,905

ANNUAL REPORT 2019 107
RESULTS REPORTED IN INTERIM FINANCIAL STATEMENTS AND FINAL ACCOUNTS
Interim Reports Results Annual Particulars 3 Months Period 6 Months Period 9 Months Period Full Year Ended Ended 30-09-2018 Ended 31-12-2018 Ended 31-03-2019 30-06-2019 Rupees ‘000 % Rupees ‘000 % Rupees ‘000 % Rupees ‘000 %
Net Turnover 4,909,925 10,380,045 15,535,787 21,220,135 Gross Profit 801,497 16.32% 1,772,054 17.07% 2,618,529 16.85% 3,561,072 16.78%Operating Profit 547,277 11.15% 1,578,132 15.20% 2,158,427 13.89% 2,692,046 12.69%Profit before tax 459,412 9.36% 1,375,680 13.25% 1,848,428 11.90% 2,280,935 10.75%Profit after tax 345,732 7.04% 1,095,288 10.55% 1,420,928 9.15% 1,750,644 8.25%Equity 16,166,358 16,616,618 16,642,962 16,966,815 Current ratio (in time) 0.98 1.03 0.92 1.09
ANALYSIS OF VARIATION IN RESULTS REPORTED IN INTERIM FINANCIAL STATEMENTS WITH THE FINAL ACCOUNTS 3 Months Ended 30 September 2018Gross Profit was 16.32% as compared with annual GP of 16.78% due to slightly squeezed profit margins in 1st quarter.Operating profit was 11.15% as compared with annual operating profit of 12.69%.Net profit before tax was 9.36% as compared with annual net profit before tax of 10.75% squeezed profit margins. Net Profit after tax was 7.04% as compared with annual net profit after tax of 8.25% due to reasons aforementioned. Shareholders’ equity was Rupees. 9,588 million as compared with annual equity of Rupees. 10,100 million mainly due to dividend income and gain on sale of short term investments in last quarters. Current ratio was 0.98 times as compared with annual current ratio of 1.09 times due to bulk buying of Raw Materials to meet annual production requirements. 6 Months Ended 31 December 2018Gross Profit was 17.07% as compared with annual GP of 16.78% due to better profit margins in 2nd quarter of the year.
Operating profit for the first half year was 15.20% as compared with annual operating profit of 12.69% mainly due to dividend income from subsidiary Company in 2nd quarter.Net profit before tax was 13.25% as compared with annual net profit before tax of 10.75% due to aforementioned reasons.Shareholders’ equity was Rupees. 16,616 million as compared with annual equity of Rupees. 16,966 million due to dividend from subsidiary Company and better margins.Current ratio was 1.03 times as compared with annual ratio of 1.09 times due to reason afore mentioned. 9 Months Ended 31 March 2019Gross profit was 16.85% as compared with annual GP of 16.78% due to better utilizations, selling margins in first 9 months. Operating profit for the first 9 months was 13.89% as compared with annual operating profit of 12.69% due to better selling margins.Shareholders’ equity was Rupees. 16,642 million as compared with annual equity of Rupees. 16,966 million.Current ratio was 0.92 times as compared with annual current ratio of 1.09 times due to higher working finances which paid subsequently in 4th quarter, leading to improved ratio in last quarter of the financial year.

KOHINOOR TEXTILE MILLS LIMITED108
GRAPHICAL PRESENTATION
1st Quarter FY 2019
2nd Quarter FY 2019
3rd Quarter FY 2019
4th Quarter FY 2019

ANNUAL REPORT 2019 109
VALUE ADDITION AND DISTRIBUTION 2019 2018 2017 2016 2015 2014 Rs “000” % age Rs “000” % age Rs “000” % age Rs “000” % age Rs “000” % age Rs “000” % age Wealth Generated Net sales 21,220,135 97.21% 17,833,540 93.78% 17,404,708 90.98% 16,088,302 93.78% 15,776,611 92.30% 15,302,242 94.61%Other operating income 608,755 2.79% 1,183,527 6.22% 1,725,445 9.02% 1,067,529 6.22% 1,315,992 7.70% 871,815 5.39%
21,828,890 100.00% 19,017,067 100.00% 19,130,153 100.00% 17,155,831 100.00% 17,092,603 100.00% 16,174,057 100.00% Distribution of wealth Cost of Sales (excluding employees’ remuneration) 16,107,686 73.79% 13,874,754 72.96% 13,365,225 69.86% 11,716,169 68.29% 11,938,725 69.85% 12,344,449 76.32%Distribution, administration & Other expenses 1,103,538 5.06% 798,627 4.20% 821,843 4.30% 869,714 5.07% 834,508 4.88% 735,069 4.54%Employees Remuneration 1,925,620 8.82% 1,827,395 9.61% 1,772,981 9.27% 1,604,413 9.35% 1,422,147 8.32% 1,240,563 7.67%Financial charges 411,111 1.88% 362,200 1.90% 267,593 1.40% 337,357 1.97% 490,917 2.87% 565,384 3.50%Government taxes (includes income tax) 530,291 2.43% 489,769 2.58% 550,732 2.88% 495,963 2.89% 319,473 1.87% 118,940 0.74%Dividend to shareholders 598,592 2.74% 797,654 4.19% 1,411,775 7.38% 1,350,393 7.87% 245,526 1.44% - 0.00%Retained within the business 1,152,052 5.28% 866,668 4.56% 940,004 4.91% 781,822 4.56% 1,841,307 10.77% 1,169,652 7.23%
21,828,890 100.00% 19,017,067 100.00% 19,130,153 100.00% 17,155,831 100.00% 17,092,603 100.00% 16,174,057 100.00%
GRAPHICAL PRESENTATION

KOHINOOR TEXTILE MILLS LIMITED110
HORI
ZONT
AL A
NALY
SIS
OF
FINA
NCIA
L ST
ATEM
ENT
20
19
Chan
ge
2018
Ch
ange
20
17
Chan
ge
2016
Ch
ange
20
15
Chan
ge
2014
w.
r.t 2
018
w.
r.t 2
017
w.r.
t 201
6
w.r.t
201
5 w
.r.t 2
014
Rs
“000
” %
Rs
“000
” %
Rs
“000
” %
Rs
“000
” %
Rs
“000
” %
Rs
“000
” FI
NANC
IAL
POSI
TIO
N
To
tal E
quity
1
6,96
6,81
5
7.2
4
15,
820,
626
1
3.63
1
3,92
2,79
6
7.4
3
12,
959,
673
1
0.92
1
1,68
4,05
3
18.
71
9,8
42,7
46
Tota
l non
-cur
rent
liabi
lities
2
,129
,031
1
5.04
1
,850
,676
4
.20
1
,776
,007
4
7.37
1
,205
,135
6
2.03
7
43,7
94
81.
24
410
,396
To
tal c
urre
nt lia
biliti
es
6,4
50,7
32
(10.
41)
7,2
00,6
54
42.
70
5,0
46,0
39
1.1
0
4,9
90,9
09
(3.7
6)
5,1
85,7
53
(11.
64)
5,8
68,5
66
Tota
l equ
ity a
nd lia
biliti
es
25,
546,
578
2
.71
2
4,87
1,95
6
19.
89
20,
744,
842
8
.30
1
9,15
5,71
7
8.7
6
17,
613,
600
9
.25
1
6,12
1,70
8
Tota
l non
-cur
rent
ass
ets
18,
512,
532
1
.96
1
8,15
5,89
1
17.
53
15,
447,
434
1
7.40
1
3,15
8,13
4
7.1
9
12,
275,
578
1
4.06
1
0,76
2,19
0 To
tal c
urre
nt a
sset
s 7
,034
,046
4
.73
6
,716
,065
2
6.78
5
,297
,408
(1
1.67
) 5
,997
,583
1
2.36
5
,338
,022
(0
.40)
5
,359
,518
Tota
l ass
ets
25,
546,
578
2
.71
2
4,87
1,95
6
19.
89
20,
744,
842
8
.30
1
9,15
5,71
7
8.7
6
17,
613,
600
9
.25
1
6,12
1,70
8
PRO
FIT
AND
LOSS
ACC
OUN
T
Ne
t sale
s 2
1,22
0,13
5
18.
99
17,
833,
540
2
.46
1
7,40
4,70
8
8.1
8
16,
088,
302
1
.98
1
5,77
6,61
1
3.1
0
15,
302,
242
Cost
of s
ales
17,
659,
063
1
5.00
1
5,35
5,78
8
3.5
9
14,
823,
393
1
3.60
1
3,04
8,86
6
(0.6
4)
13,
132,
754
(1
.96)
1
3,39
5,07
9
Gr o
ss p
rofit
3
,561
,072
4
3.72
2
,477
,752
(4
.01)
2
,581
,315
(1
5.07
) 3
,039
,436
1
4.96
2
,643
,857
3
8.63
1
,907
,163
Se
lling
and
dist
ribut
ion
expe
nses
5
61,1
81
13.
19
495
,766
(7
.90)
5
38,2
94
(6.2
6)
574
,226
(7
.42)
6
20,2
81
8.1
4
573
,592
Ad
min
istra
tive
expe
nses
5
52,2
20
11.
67
494
,532
7
.35
4
60,6
81
14.
85
401
,099
9
.36
3
66,7
54
16.
01
316
,152
O
ther
ope
ratin
g ex
pens
es
364
,380
1
35.5
5
154
,690
1
2.35
1
37,6
81
(17.
11)
166
,105
1
19.7
4
75,
591
1
14.3
9
35,
258
Oth
er o
pera
ting
inco
me
608
,755
(4
8.56
) 1
,183
,527
(3
1.41
) 1
,725
,445
6
1.63
1
,067
,529
(1
8.88
) 1
,315
,992
5
0.95
8
71,8
15
Profi
t fro
m o
pera
tions
2
,692
,046
6
.98
2
,516
,291
(2
0.62
) 3
,170
,104
6
.90
2
,965
,535
2
.36
2
,897
,223
5
6.27
1
,853
,976
Fi
nanc
e co
st
411
,111
1
3.50
3
62,2
00
35.
35
267
,593
(2
0.68
) 3
37,3
57
(31.
28)
490
,917
(1
3.17
) 5
65,3
84
Profi
t bef
ore
taxa
tion
2,2
80,9
35
5.8
9
2,1
54,0
91
(25.
79)
2,9
02,5
11
10.
44
2,6
28,1
78
9.2
2
2,4
06,3
06
86.
74
1,2
88,5
92
Prov
ision
for t
axat
ion
530
,291
8
.27
4
89,7
69
(11.
07)
550
,732
1
1.04
4
95,9
63
55.
24
319
,473
1
68.6
0
118
,940
Profi
t afte
r tax
atio
n 1
,750
,644
5
.19
1
,664
,322
(2
9.23
) 2
,351
,779
1
0.30
2
,132
,215
2
.17
2
,086
,833
7
8.41
1
,169
,652

ANNUAL REPORT 2019 111
GRAPHICAL PRESENTATION AND COMMENTS ON HORIZONTAL ANALYSIS OF FINANCIAL STATEMENTFinancial PositionContinuous increase in shareholder’s equity is primarily because of profitable operations of the Company. Non-current liabilities have been increased by Rupees. 278 Million Due to increase in long term financing obtained for the expansion and modernization of production facilities and Solar based power generation. Non-current assets of the Company have been increased by Rupees. 356 Million Due to modernization / expansion of production facilities. Current assets of the Company have been increased mainly because of Raw materials which have been bulk purchased due to rising trend in purchase prices.
Profit and Loss Account
Company’s sales are being increased by 19% due to excellent performance in local as well as export market. Gross profit has been increased by 44% due to selection of high yield orders and stringent controls over critical contemporary areas of performance. Finance cost increased by 13.5% due to constant hike in interest rates.

KOHINOOR TEXTILE MILLS LIMITED112
VERT
ICAL
ANA
LYSI
S O
F FI
NANC
IAL
STAT
EMEN
T
2019
%
20
18
%
2017
%
20
16
%
2015
%
20
14
%
......
......
......
..... .
......
......
......
......
......
......
......
......
......
.. Rup
ees
in th
ousa
nd...
......
......
......
.. ....
......
......
......
......
......
......
......
......
.....
FI
NANC
IAL
POSI
TIO
N
Tota
l Equ
ity
16,
966,
815
6
6.42
1
5,82
0,62
6
63.
61
13,
922,
796
6
7.11
1
2,95
9,67
3
67.
65
11,
684,
053
6
6.34
9
,842
,746
6
1.05
To
tal n
on-c
urre
nt lia
biliti
es
2,1
29,0
31
8.3
3
1,8
50,6
76
7.4
4
1,7
76,0
07
8.5
6
1,2
05,1
35
6.2
9
743
,794
4
.22
4
10,3
96
2.5
5 To
tal c
urre
nt lia
biliti
es
6,4
50,7
32
25.
25
7,2
00,6
54
28.
95
5,0
46,0
39
24.
32
4,9
90,9
09
26.
05
5,1
85,7
53
29.
44
5,8
68,5
66
36.
40
Tota
l equ
ity a
nd lia
biliti
es
25,
546,
578
1
00.0
0
24,8
71,9
56
100
.00
2
0,74
4,84
2
100
.00
1
9,15
5,71
7
100
.00
1
7,61
3,60
0
100
.00
16
,121
,708
1
00.0
0
To
tal n
on-c
urre
nt a
sset
s 1
8,51
2,53
2
72.
47
18,
155,
891
7
3.00
1
5,44
7,43
4
74.
46
13,
158,
134
6
8.69
1
2,27
5,57
8
69.
69
10,
762,
190
6
6.76
To
tal c
urre
nt a
sset
s 7
,034
,046
2
7.53
6
,716
,065
2
7.00
5
,297
,408
2
5.54
5
,997
,583
3
1.31
5
,338
,022
3
0.31
5
,359
,518
3
3.24
To
tal a
sset
s 2
5,54
6,57
8
100
.00
24
,871
,956
1
00.0
0
20,
744,
842
1
00.0
0
19,
155,
717
1
00.0
0
17,
613,
600
1
00.0
0
16,1
21,7
08
100
.00
PROF
IT AN
D LO
SS A
CCOU
NT
Ne
t sale
s 2
1,22
0,13
5
100
.00
17
,833
,540
1
00.0
0
17,
404,
708
1
00.0
0
16,
088,
302
1
00.0
0
15,
776,
611
1
00.0
0
15,3
02,2
42
100
.00
Cost
of s
ales
17,
659,
063
8
3.22
1
5,35
5,78
8
86.
11
14,
823,
393
8
5.17
1
3,04
8,86
6
81.
11
13,
132,
754
8
3.24
1
3,39
5,07
9
87.
54
Gr o
ss p
rofit
3
,561
,072
1
6.78
2
,477
,752
1
3.89
2
,581
,315
1
4.83
3
,039
,436
1
8.89
2
,643
,857
16
.76
1,9
07,1
63
12.
46
Sellin
g an
d di
strib
utio
n ex
pens
es
561
,181
2
.64
4
95,7
66
2.7
8
538
,294
3
.09
5
74,2
26
3.5
7
620
,281
3.
93
573
,592
3
.75
Adm
inist
rativ
e ex
pens
es
552
,220
2
.60
4
94,5
32
2.7
7
460
,681
2
.65
4
01,0
99
2.4
9
366
,754
2.
32
316
,152
2
.07
Oth
er o
pera
ting
expe
nses
3
64,3
80
1.7
2
154
,690
0
.87
1
37,6
81
0.7
9
166
,105
1
.03
7
5,59
1
0.48
3
5,25
8
0.2
3 O
ther
ope
ratin
g in
com
e 6
08,7
55
2.8
7
1,1
83,5
27
6.6
4
1,7
25,4
45
9.9
1
1,0
67,5
29
6.6
4
1,3
15,9
92
8.34
8
71,8
15
5.7
0
Profi
t fro
m o
pera
tions
2
,692
,046
1
2.69
2
,516
,291
1
4.11
3
,170
,104
1
8.21
2
,965
,535
1
8.43
2
,897
,223
18
.36
1,8
53,9
76
12.
12
Fina
nce
cost
4
11,1
11
1.9
4
362
,200
2
.03
2
67,5
93
1.5
4
337
,357
2
.10
4
90,9
17
3.11
5
65,3
84
3.6
9
Profi
t bef
ore
taxa
tion
2,2
80,9
35
10.
75
2,1
54,0
91
12.
08
2,9
02,5
11
16.
68
2,6
28,1
78
16.
34
2,4
06,3
06
15.2
5 1
,288
,592
8
.42
Prov
ision
for t
axat
ion
530
,291
2
.50
4
89,7
69
2.7
5
550
,732
3
.16
4
95,9
63
3.0
8
319
,473
2.
02
118
,940
0
.78
Profi
t afte
r tax
atio
n 1
,750
,644
8
.25
1
,664
,322
9
.33
2
,351
,779
1
3.51
2
,132
,215
1
3.25
2
,086
,833
1
3.23
1
,169
,652
7
.64

ANNUAL REPORT 2019 113
GRAPHICAL PRESENTATION AND COMMENTS ON VERTICAL ANALYSIS OF FINANCIAL STATEMENT
Financial Position
Equity component is 66.42% of the balance sheet footing. A major factor for such tremendous increase is profitable operations of the Company and steering the financial resources of the Company with acute responsibility to enhance debt servicing to external sources of finance providers. During current year, non- current liabilities are 8% of the balance sheet footing as compared to 7% for the preceding year, this increase is primarily because of expansion and modernization of production facilities. Non-current assets has been increased from Rs. 18,155 Million in 2018 to Rs. 18,512 Million in 2019. Such increase is due to capital expenditure for production facilities and solar based power project.
Profit & Loss Account
Cost of sales is 83.22% in (2019) as compared to 86.11% in (2018), despite increase in sales. Such decrease is mainly due to efficient buying of Raw Materials & having excellent controls to minimize in-efficiencies through-out the production process. Increase in Finance cost by Rs. 49 Million in 2019 is due to increase in interest rates and new finances obtained for modernization of plant & machinery. Other operating income decreased mainly due to decrease in dividend from subsidiary company.

KOHINOOR TEXTILE MILLS LIMITED114
KEY OPERATING AND FINANCIAL DATASix Years Summary
PKR ‘000’FINANCIAL POSITION Tangible fixed assets-net 8,907,570 8,578,713 8,222,022 7,437,640 6,565,198 5,919,751 Intangible assets - - 11,974 9,305 - - Investment & Other assets 9,604,962 9,577,178 7,213,438 5,711,189 5,710,380 4,842,439
18,512,532 18,155,891 15,447,434 13,158,134 12,275,578 10,762,190 Current assets 7,034,046 6,716,065 5,297,408 5,997,583 5,338,022 5,359,518 Current liabilities 6,450,732 7,200,654 5,046,039 4,990,909 5,185,753 5,868,566
Net working capital 583,314 (484,589) 251,369 1,006,674 152,269 (509,048)Capital employed 19,095,846 17,671,302 15,698,803 14,164,808 12,427,847 10,253,142 Less: Long term loan & other liabilities 2,129,031 1,850,676 1,776,007 1,205,135 743,794 410,396 Less: Surplus on revaluation of property 3,843,044 3,843,044 3,822,453 3,799,334 3,673,825 3,673,825
Share holders Equity 16,966,815 15,820,626 13,922,796 12,959,673 11,684,053 9,842,746 Represented By: Share capital 2,992,964 2,992,964 2,823,551 2,823,551 2,455,262 2,455,262 Reserves & unappropriated profit 13,973,851 12,827,662 11,099,245 10,136,122 9,228,791 7,387,484
16,966,815 15,820,626 13,922,796 12,959,673 11,684,053 9,842,746
PROFIT AND LOSS ACCOUNT
Net sale 21,220,135 17,833,540 17,404,708 16,088,302 15,776,611 15,302,242
Profitability Gross Profit 3,561,072 2,477,752 2,581,315 3,039,436 2,643,857 1,907,163 Operating profit 2,692,046 2,516,291 3,170,104 2,965,535 2,897,223 1,853,976 Profit before tax 2,280,935 2,154,091 2,902,511 2,628,178 2,406,306 1,288,592 Provision for income tax 530,291 489,769 550,732 495,963 319,473 118,940
Profit after tax 1,750,644 1,664,322 2,351,779 2,132,215 2,086,833 1,169,652 KEY FINANCIAL RATIOS
Profitability Ratios: Gross Profit to sales (%age) 16.78 13.89 14.83 18.89 16.76 12.46 Net Profit to sales (%age) 8.25 9.33 13.51 13.25 13.23 7.64EBITDA (%age) 15.19 16.92 20.76 20.70 20.45 14.22 Return on equity (%age) 10.32 10.52 16.89 16.45 17.86 11.88 Return on capital employed (%age) 9.17 9.42 14.98 15.05 16.79 11.41 Operating leverage ratio 0.37 (10.50) 0.88 1.00 18.67 4.14 Profit before tax ratio (%age) 10.75 12.08 16.68 16.34 15.25 8.42 Effective tax rate (%age) 23.25 22.74 18.97 18.87 13.28 9.23 Cost / Revenue ratio (%age) 83.22 86.11 85.17 81.11 83.24 87.54Return on Fixed Assets 19.76% 31.79% 28.67% 28.60% 19.40% 19.65%Return on Total Assets 7.26% 11.85% 11.13% 11.34% 6.69% 6.85% Liquidity Ratios: Current ratio 1.09 0.93 1.05 1.20 1.03 0.91 Acid test ratio 0.50 0.50 0.54 0.66 0.56 0.52Cash to current liabilities 0.03 0.02 0.03 0.05 0.02 0.02Cash flow from operations to sales % 11.75 2.21 6.73 6.23 8.31 1.49 Activity / Turnover Ratios: No. of days in Inventory 66 54 52 59 54 50 No. of days in receivables 27 31 25 25 24 23No. of days in creditors 41 39 35 39 36 32 Operating cycle 52 46 41 45 42 41 Inventory turn over 6 7 7 6 7 7 Debtors turn over ratio 13 12 15 15 16 16 Creditors turnover ratio 9 9 10 9 10 11 Total assets turn over / return on investment ratio 0.84 0.78 0.87 0.88 0.94 0.97 Fixed assets turn over ratio 2.01 1.75 1.81 1.83 1.97 1.99
Financial Highlights 2019 2018 2017 2016 2015 2014

ANNUAL REPORT 2019 115
Financial Highlights 2019 2018 2017 2016 2015 2014
Investment / Market Ratios: Earning per share - Basic - (Rupees) 5.85 5.64 8.25 7.48 7.32 4.10 Earning per share - Diluted - (Rupees) 5.85 5.64 8.25 7.48 7.32 4.10 Price earning ratio 4.28 9.75 12.75 10.70 8.88 5.79Price to book ratio 25.05 : 56.69 54.99 : 52.86 105.13 : 49.31 80.03 : 45.90 64.96 : 47.59 23.74 : 40.09Dividend yield ratio 20% 28% 50% 40% 10% -Dividend payout ratio (%age) 34.19 48.76 60.63 53.50 13.67 -Dividend cover ratio - (Times) 2.92 2.05 1.65 1.87 7.32 Cash dividend per share - (Rupees) 2 2.75 5 4 1 -Stock dividend per share - - - 15% - -Breakup value per share - (Rupees): - without revaluation surplus 43.85 40.02 35.77 32.44 32.62 25.13 - with revaluation surplus 56.69 52.86 49.31 45.90 47.59 40.09 - with revaluation surplus and investments at fair value 72.26 95.83 158.50 145.35 129.61 65.31Market value per share at the end of the year - (Rupees) 25.05 54.99 105.13 80.03 64.96 23.74 Share Price - High during the year - (Rupees) 57.25 106.00 128.50 82.34 68.28 30.70Share Price - Low during the year - (Rupees) 25.05 54.99 78.95 60.94 21.68 16.80Earning assets to total assets ratio (%age) 72.26 72.8 74.19 68.38 69.35 66.47 Capital Structure Ratios: Financial leverage ratio 0.30 0.40 0.49 0.48 0.51 0.64Weighted average cost of debt (%age) 5.40 4.94 4.16 5.35 9.87 11.11Debt to equity ratio (as per book) 10 : 90 10 : 90 10 : 90 7 : 93 4 : 96 7 : 93Debt to equity ratio (as per market value) 21 : 79 9 : 91 5 : 95 4 : 96 3 : 97 3 : 97Interest cover ratio 6.55 6.95 11.85 8.79 5.90 3.28Average operating working capital to sales ratio 0.19 0.22 0.20 0.20 0.19 0.19Net borrowing to EBITDA ratio 1.51 2.05 1.28 1.25 1.23 2.13 Summary of Cash flows 2019 2018 2017 2016 2015 2014 Net cash flow from operating activities 2,493,699 394,884 1,171,639 1,002,347 1,310,771 228,105 Net cash used in investing activities (572,930) (2,202,943) (196,570) (247,653) (314,592) (228,826)Net cash (used in) / from financing activities (1,866,308) 1,815,029 (1,049,146) (640,497) (982,301) (219,194)Net change in cash and cash equivalents 54,461 6,970 (74,077) 114,197 13,878 (219,915) Quantitative Data Yarn (Kgs “000”) : Production (cont. into 20s) KTM Division 41,751 41,331 39,574 38,473 38,270 32,415 KGM Division 36,994 36,603 34,816 33,299 30,524 25,726
78,745 77,934 74,390 71,772 68,794 58,141 Sales / Tran.for wvg.(actual count) KTM Division 16,699 16,483 12,356 11,017 9,597 10,267 KGM Division 5,858 5,724 5,284 5,106 4,533 5,367
22,557 22,207 17,640 16,123 14,130 15,634 Cloth (Linear meters “000”) : Processing (Rawalpindi Division) Production 14,757 14,613 17,986 19,168 19,747 19,235 Sales 12,967 13,809 17,641 18,355 18,890 17,994 Weaving (Raiwind Division) Production 32,447 29,857 27,533 26,204 21,280 18,883 Sales 32,299 29,817 27,021 26,614 20,501 18,968

KOHINOOR TEXTILE MILLS LIMITED116
Current Ratio
Fixed Asset Turnover
Profitability Ratios
KEY FINANCIAL RATIOS GRAPHICAL PRESENTATION
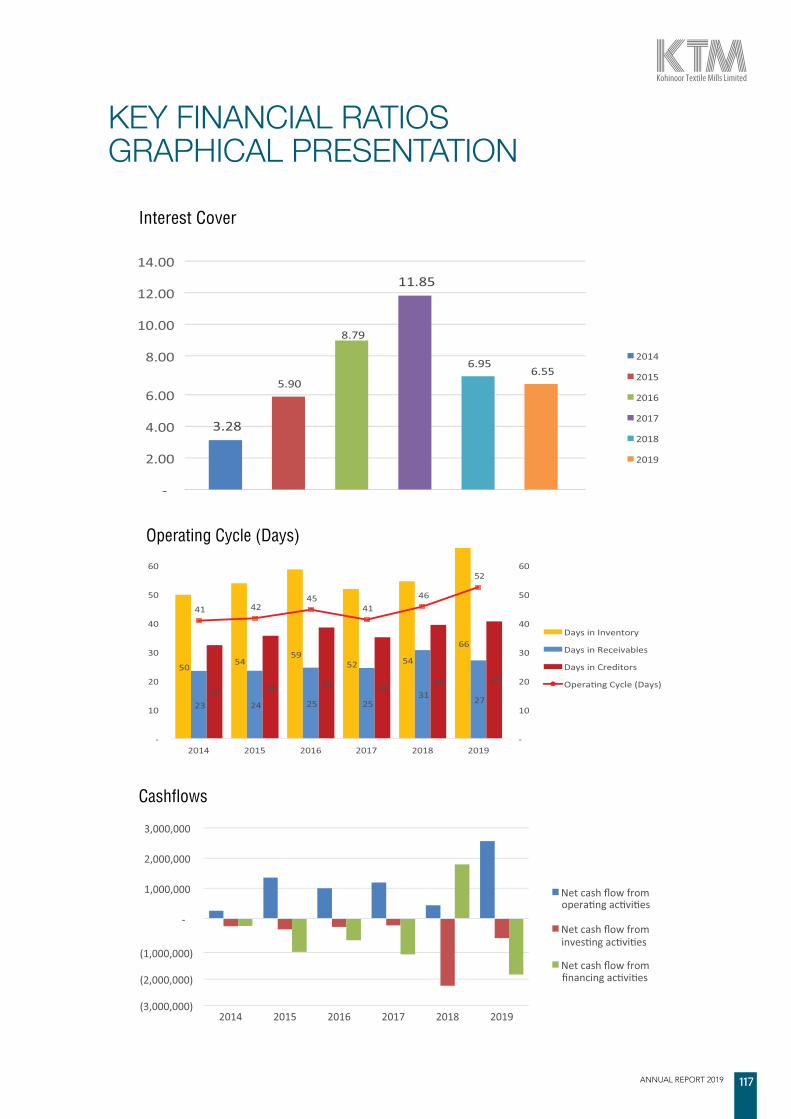
ANNUAL REPORT 2019 117
Cashflows
Operating Cycle (Days)
Interest Cover
KEY FINANCIAL RATIOS GRAPHICAL PRESENTATION

KOHINOOR TEXTILE MILLS LIMITED118
DuPont Analysis
RETURN ON EQUITY (ROE)
Comments: DuPont equation indicates increase in ROE over the period. Key driving factors in increased ROE are total asset turnover and equity multiplier. Profit margin decreased because of decrease in other income. It includes mainly dividend from subsidiary company which decreased by 33% (Rs. 674 million) from previous year. Assets turnover increased as compared with previous year. Investment made by the Company for modernization of production facilities witnessed increased sales volume during the year under review.
Return on Profit Margin = Total Assets Equity Multiplier =Year Equity (ROE) Pre tax profit Turnover = Avg. Assets / / Net Sales Net Sales / Assets Avg. Equity D=A*B*C A B C
2014 13.57% 0.08 0.95 1.70
2015 21.41% 0.15 0.90 1.57
2016 20.47% 0.16 0.84 1.49
2017 20.77% 0.17 0.84 1.48
2018 13.28% 0.12 0.72 1.53
2019 13.73% 0.11 0.83 1.54
ANNUAL REPORT 2019 119
HOW THE INDICATORS AND PERFORMANCE MEASURES HAVE CHANGED OVER THE PERIOD
Kohinoor Textile Mills Limited has an established mechanism of performance appraisal. Key Performance Indictors (KPIs), for both financial and non-financial economic activities, are set for each objective or project and then its progress is monitored and evaluated by the management against those KPIs.
Financial Review section of this report enlists and elaborates major KPIs that management of the Company prefers to review on regular basis to access the ‘Operational’ and ‘Financial’ performance of the Company’s economic affairs. Key variances indicated by the KPIs are also explained briefly to help understand the performance of business activities.
Since, there isn’t any change in the Company’s principal business activities and related industry from previous year, except some expansion in fabric digital print and solar power installation, the management believes the set KPIs sufficiently indicates the project performance and didn’t required any change.
METHODS AND ASSUMPTIONS USED IN COMPILING INDICATORS
A performance indicator represents parametersand factors that may caste an impact of decisivenature on a company’s financial position, financialperformance or liquidity position. Following are thekey assumptions in compiling these indicators:
Financial Position
• Appropriateness of capital mix in the company• Proportion of financial leverage in debt equity mix• Change in current ratio
Financial performance
• Maintaining high local sales retention• Monitoring key components of variable cost to be amongst top cost effective players• Initiating and maintaining techniques for optimal
fixed cost absorption and appropriate mix of operational leverage
Liquidity Position
• Keeping an eye on funds used in / generated from operating, investing and financial cash
flow activities• Reviewing funds used in working capital management• Effectively segregating cash and noncash items
All the indicators are devised in the light of these basic assumptions and are periodically reviewed and monitored. Furthermore, Company performance variance analysis from corresponding figures of comparative periods and from budgeted figures as comparability over time provides good basis of Corporate Reporting. These indicators are finally used to report financial information to all users of the financial statements in the form of annual financial statements.

KOHINOOR TEXTILE MILLS LIMITED120
DEFINITIONS AND GLOSSARY OF TERMS
Gross Profit ratioThe relationship of the gross profit made for a specified period and the sales or turnover achieved during that period.
Net Profit Ratio:Net profit ratio is the ratio of net profit (after taxes) to net sales.
Operating Profit Ratio:The Operating profit ratio indicates the ratio of company’s profit before interest and taxes to net sales.
Current Ratio:A company’s current assets divided by its current liabilities. This ratio gives you a sense of a company’s ability to meet short-term liabilities, and is a measure of financial strength in the short term. A ratio of 1 implies adequate current assets to cover current liabilities: the higher above 1, the better.
Debt-Equity Ratio:The ratio of a company’s liabilities to its equity. The higher the level of debt, the more important it is for a company to have positive earnings and steady cash flow. For Comparative purposes, debt-equity is most useful for companies within the same industry.
Earnings Per Share (EPS):The portion of a company’s profit allocated to each outstanding share of common stock. Earnings per share serve as an indicator of a company’s profitability.
Profit Margin:Determined by dividing net income by net sales during a time period and is expressed as a percentage. Net profit margin is a measure of efficiency and the higher the margin, the better. Trends in margin can be attributed to rising/falling production costs or rising / falling price of the goods sold.
Return on Equity (ROE):A percentage that indicates how efficiently common stockholders’ invested money is being used. The percentage is the result of dividing net earnings by common stockholders’ equity. The ROE is used for measuring growth and profitability. You can compare a company’s ROE to the ROE of its industry to determine how a company is doing compared to its competition.
Return on Investment (ROI):Also Known as return on invested capital (ROIC). ROI is a measure of how well management has used the company’s resources. ROI is calculated by dividing earnings by total assets. It is a broader measure than return on equity (ROE) because assets include debt as well as equity. It is a useful to compare a company’s ROI with others in the same industry.
Du Pont Analysis:A type of analysis that examines a company’s Return on Equity (ROE) by splitting it into three main components; profit margin, total asset turnover and equity multiplier. This analysis highlight the main driving factor of ROE and the factor which needs to be addressed to improve the ROE.
ANNUAL REPORT 2019 121
This disclosure is being added as per requirements of Securities and Exchange Commission of Pakistan vide SRO 924(1) / 2015, dated 09
September 2015.

KOHINOOR TEXTILE MILLS LIMITED122
Financial Statementsfor the Year Ended June 30, 2019

ANNUAL REPORT 2019 123
INDEPENDENT AUDITORS’ REPORT To the members of KOHINOOR TEXTILE MILLS LIMITED
Report on the Audit of the Financial Statements Opinion
We have audited the annexed financial statements of Kohinoor Textile Mills Limited (‘the Company’), which comprise the statement of financial position as at 30 June 2019, and the statement of profit or loss, the statement of comprehensive income, the statement of changes in equity, the statement of cash flows for the year then ended, and notes to the financial statements, including a summary of significant accounting policies and other explanatory information, and we state that we have obtained all the information and explanations which, to the best of our knowledge and belief, were necessary for the purposes of the audit.
In our opinion and to the best of our information and according to the explanations given to us, the statement of financial position, the statement of profit or loss, the statement of comprehensive income, the statement of changes in equity and the statement of cash flows together with the notes forming part thereof conform with the accounting and reporting standards as applicable in Pakistan and give the information required by the Companies Act, 2017 (XIX of 2017), in the manner so required and respectively give a true and fair view of the state of the Company’s affairs as at 30 June 2019 and of the profit, other comprehensive income, the changes in equity and its cash flows for the year then ended.
Basis for Opinion
We conducted our audit in accordance with International Standards on Auditing (ISAs) as applicable in Pakistan. Our responsibilities under those standards are further described in the Auditor’s Responsibilities for the Audit of the Financial Statements section of our report. We are independent of the Company in accordance with the International Ethics Standards Board for Accountants’ Code of Ethics for Professional Accountants as adopted by the Institute of Chartered Accountants of Pakistan (‘the Code’) and we have fulfilled our other ethical responsibilities in accordance with the Code. We believe that the audit evidence we have obtained is sufficient and appropriate to provide a basis for our opinion.
Key Audit Matters
Key audit matters are those matters that, in our professional judgment, were of most significance in our audit of the financial statements of the current period. These matters were addressed in the context of our audit of the financial statements as a whole, and in forming our opinion thereon, and we do not provide a separate opinion on these matters.

KOHINOOR TEXTILE MILLS LIMITED124
Following are the key audit matters:
Sr. No.
Key audit matters How the matter was addressed in our audit
1 Inventory existence and valuation:
Inventory as at 30 June 2019 amounted to Rupees 4,379 million and represented a material position in the statement of financial position, break up of which is as follows:
• Stores, spare parts and loose tools Rupees 565 million
• Stock-in-trade Rupees 3,814 million
The business is characterized by high volume serial production and the valuation and existence of inventories are significant to the business. Therefore, considered as one of the key audit matters.
Inventories are stated at lower of cost and net realizable value. Cost is determined as per accounting policy disclosed in Note 2.11 to the financial statements.
At year end, the valuation of inventory is reviewed by management and the cost of inventory is reduced where inventory is forecast to be sold below cost.
Useable stores, spare parts and loose tools are valued at moving average cost, raw materials are valued at annual average cost whereas, costing of work-in-process and finished goods is considered to carry more significant risk as the cost of material, labor and manufacturing overheads is allocated on the basis of complex formulas and involves management judgment.
The determination of whether inventory will be realized for a value less than cost requires management to exercise judgment and apply assumptions. Management undertakes the following procedures for determining the level of write down required:
• Use inventory ageing reports together with historical trends to estimate the likely future saleability of slow moving and older inventory items.
• Perform a line-by-line analysis of remaining inventory to ensure it is stated at the lower of cost and net realizable value and a specific write down is recognized, if required.
Our procedures over existence and valuation of inventory included, but were not limited to:
• To test the quantity of inventories at all locations, we assessed the corresponding inventory observation instructions and participated in inventory counts on sites. Based on samples, we performed test counts and compared the quantities counted by us with the results of the counts of the management.
• For a sample of inventory items, re-performed the weighted average cost calculation and compared the weighted average cost appearing on valuation sheets.
• We tested that the ageing report used by management correctly aged inventory items by agreeing a sample of aged inventory items to the last recorded invoice.
• On a sample basis, we tested the net realizable value of inventory items to recent selling prices and re-performed the calculation of the inventory write down, if any.
• We assessed the percentage write down applied to older inventory with reference to historic inventory write downs and recoveries on slow moving inventory.
• In the context of our testing of the calculation, we analysed individual cost components and traced them back to the corresponding underlying documents. We furthermore challenged changes in unit costs.
• We also made enquiries of management, including those outside of the finance function, and considered the results of our testing above to determine whether any specific write downs were required.
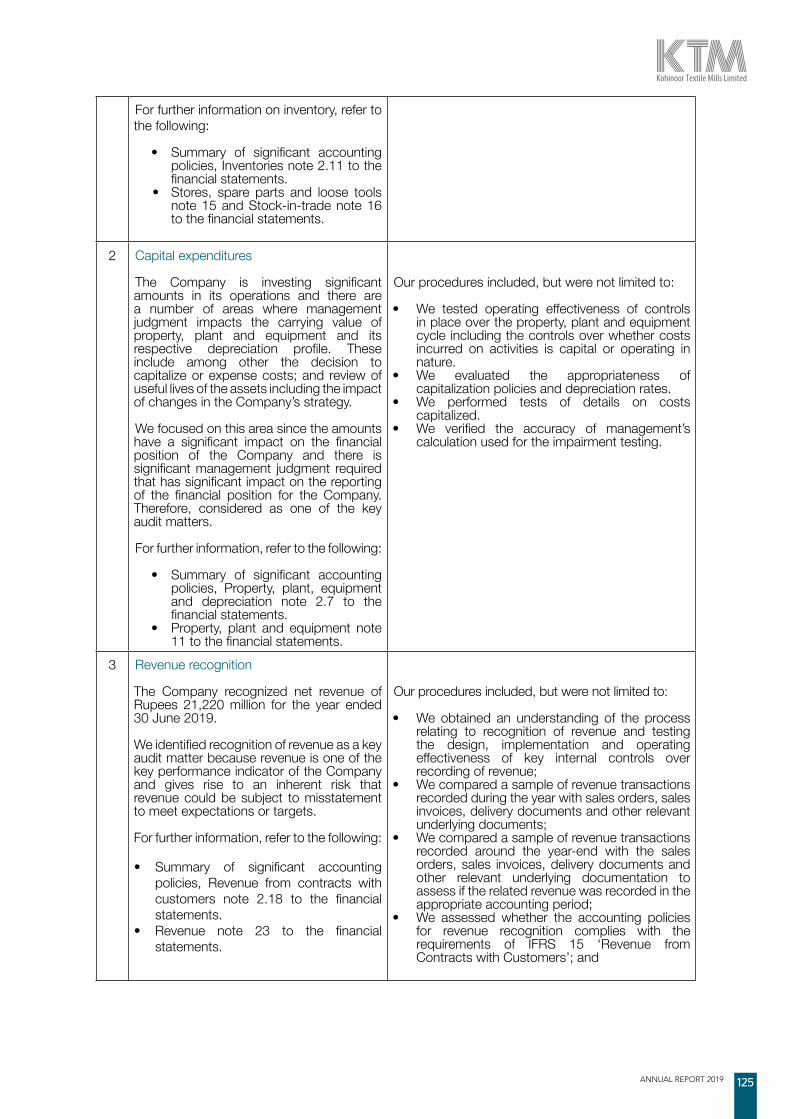
ANNUAL REPORT 2019 125
For further information on inventory, refer to the following:
• Summary of significant accounting policies, Inventories note 2.11 to the financial statements.
• Stores, spare parts and loose tools note 15 and Stock-in-trade note 16 to the financial statements.
2 Capital expenditures
The Company is investing significant amounts in its operations and there are a number of areas where management judgment impacts the carrying value of property, plant and equipment and its respective depreciation profile. These include among other the decision to capitalize or expense costs; and review of useful lives of the assets including the impact of changes in the Company’s strategy.
We focused on this area since the amounts have a significant impact on the financial position of the Company and there is significant management judgment required that has significant impact on the reporting of the financial position for the Company. Therefore, considered as one of the key audit matters.
For further information, refer to the following: • Summary of significant accounting
policies, Property, plant, equipment and depreciation note 2.7 to the financial statements.
• Property, plant and equipment note 11 to the financial statements.
Our procedures included, but were not limited to:
• We tested operating effectiveness of controls in place over the property, plant and equipment cycle including the controls over whether costs incurred on activities is capital or operating in nature.
• We evaluated the appropriateness of capitalization policies and depreciation rates.
• We performed tests of details on costs capitalized.
• We verified the accuracy of management’s calculation used for the impairment testing.
3 Revenue recognition
The Company recognized net revenue of Rupees 21,220 million for the year ended 30 June 2019.
We identified recognition of revenue as a key audit matter because revenue is one of the key performance indicator of the Company and gives rise to an inherent risk that revenue could be subject to misstatement to meet expectations or targets.
For further information, refer to the following:
• Summary of significant accounting policies, Revenue from contracts with customers note 2.18 to the financial statements.
• Revenue note 23 to the financial statements.
Our procedures included, but were not limited to:
• We obtained an understanding of the process relating to recognition of revenue and testing the design, implementation and operating effectiveness of key internal controls over recording of revenue;
• We compared a sample of revenue transactions recorded during the year with sales orders, sales invoices, delivery documents and other relevant underlying documents;
• We compared a sample of revenue transactions recorded around the year-end with the sales orders, sales invoices, delivery documents and other relevant underlying documentation to assess if the related revenue was recorded in the appropriate accounting period;
• We assessed whether the accounting policies for revenue recognition complies with the requirements of IFRS 15 ‘Revenue from Contracts with Customers’; and
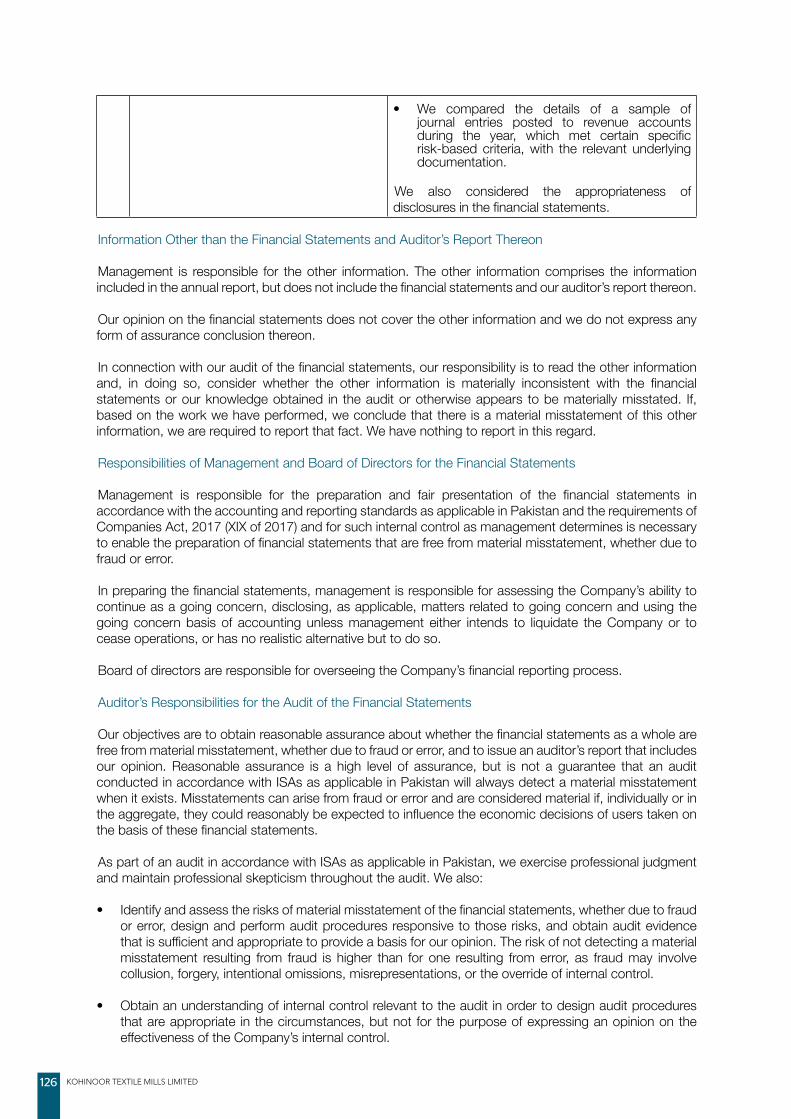
KOHINOOR TEXTILE MILLS LIMITED126
• We compared the details of a sample of journal entries posted to revenue accounts during the year, which met certain specific risk-based criteria, with the relevant underlying documentation.
We also considered the appropriateness of disclosures in the financial statements.
Information Other than the Financial Statements and Auditor’s Report Thereon
Management is responsible for the other information. The other information comprises the information included in the annual report, but does not include the financial statements and our auditor’s report thereon.
Our opinion on the financial statements does not cover the other information and we do not express any form of assurance conclusion thereon.
In connection with our audit of the financial statements, our responsibility is to read the other information and, in doing so, consider whether the other information is materially inconsistent with the financial statements or our knowledge obtained in the audit or otherwise appears to be materially misstated. If, based on the work we have performed, we conclude that there is a material misstatement of this other information, we are required to report that fact. We have nothing to report in this regard.
Responsibilities of Management and Board of Directors for the Financial Statements
Management is responsible for the preparation and fair presentation of the financial statements in accordance with the accounting and reporting standards as applicable in Pakistan and the requirements of Companies Act, 2017 (XIX of 2017) and for such internal control as management determines is necessary to enable the preparation of financial statements that are free from material misstatement, whether due to fraud or error.
In preparing the financial statements, management is responsible for assessing the Company’s ability to continue as a going concern, disclosing, as applicable, matters related to going concern and using the going concern basis of accounting unless management either intends to liquidate the Company or to cease operations, or has no realistic alternative but to do so.
Board of directors are responsible for overseeing the Company’s financial reporting process.
Auditor’s Responsibilities for the Audit of the Financial Statements
Our objectives are to obtain reasonable assurance about whether the financial statements as a whole are free from material misstatement, whether due to fraud or error, and to issue an auditor’s report that includes our opinion. Reasonable assurance is a high level of assurance, but is not a guarantee that an audit conducted in accordance with ISAs as applicable in Pakistan will always detect a material misstatement when it exists. Misstatements can arise from fraud or error and are considered material if, individually or in the aggregate, they could reasonably be expected to influence the economic decisions of users taken on the basis of these financial statements.
As part of an audit in accordance with ISAs as applicable in Pakistan, we exercise professional judgment and maintain professional skepticism throughout the audit. We also:
• Identify and assess the risks of material misstatement of the financial statements, whether due to fraud or error, design and perform audit procedures responsive to those risks, and obtain audit evidence that is sufficient and appropriate to provide a basis for our opinion. The risk of not detecting a material misstatement resulting from fraud is higher than for one resulting from error, as fraud may involve collusion, forgery, intentional omissions, misrepresentations, or the override of internal control.
• Obtain an understanding of internal control relevant to the audit in order to design audit procedures that are appropriate in the circumstances, but not for the purpose of expressing an opinion on the effectiveness of the Company’s internal control.
ANNUAL REPORT 2019 127
• Evaluate the appropriateness of accounting policies used and the reasonableness of accounting estimates and related disclosures made by management.
• Conclude on the appropriateness of management’s use of the going concern basis of accounting and, based on the audit evidence obtained, whether a material uncertainty exists related to events or conditions that may cast significant doubt on the Company’s ability to continue as a going concern. If we conclude that a material uncertainty exists, we are required to draw attention in our auditor’s report to the related disclosures in the financial statements or, if such disclosures are inadequate, to modify our opinion. Our conclusions are based on the audit evidence obtained up to the date of our auditor’s report. However, future events or conditions may cause the Company to cease to continue as a going concern.
• Evaluate the overall presentation, structure and content of the financial statements, including the disclosures, and whether the financial statements represent the underlying transactions and events in a manner that achieves fair presentation.
We communicate with the board of directors regarding, among other matters, the planned scope and timing of the audit and significant audit findings, including any significant deficiencies in internal control that we identify during our audit.
We also provide the board of directors with a statement that we have complied with relevant ethical requirements regarding independence, and to communicate with them all relationships and other matters that may reasonably be thought to bear on our independence, and where applicable, related safeguards.
From the matters communicated with the board of directors, we determine those matters that were of most significance in the audit of the financial statements of the current period and are therefore the key audit matters. We describe these matters in our auditor’s report unless law or regulation precludes public disclosure about the matter or when, in extremely rare circumstances, we determine that a matter should not be communicated in our report because the adverse consequences of doing so would reasonably be expected to outweigh the public interest benefits of such communication.
Report on Other Legal and Regulatory Requirements
Based on our audit, we further report that in our opinion:
a) proper books of account have been kept by the Company as required by the Companies Act, 2017 (XIX of 2017);
b) the statement of financial position, the statement of profit or loss, the statement of comprehensive income, the statement of changes in equity and the statement of cash flows together with the notes thereon have been drawn up in conformity with the Companies Act, 2017 (XIX of 2017) and are in agreement with the books of account and returns;
c) investments made, expenditure incurred and guarantees extended during the year were for the purpose of the Company’s business; and
d) zakat deductible at source under the Zakat and Ushr Ordinance, 1980 (XVIII of 1980), was deducted by the Company and deposited in the Central Zakat Fund established under section 7 of that Ordinance.
The engagement partner on the audit resulting in this independent auditor’s report is Raheel Arshad.
RIAZ AHMAD & COMPANYChartered Accountants Islamabad
DATE: 20 September 2019

KOHINOOR TEXTILE MILLS LIMITED128
STATEMENT OF FINANCIAL POSITION As at June 30, 2019
CHIEF EXECUTIVE OFFICER DIRECTOR CHIEF FINANCIAL OFFICER
2019 2018 Note (Rupees in thousand)
EQUITY AND LIABILITIES SHARE CAPITAL AND RESERVES Authorized share capital 370,000,000 (2018: 370,000,000) ordinary shares of Rupees 10 each 3,700,000 3,700,000 30,000,000 (2018: 30,000,000) preference shares of Rupees 10 each 300,000 300,000 4,000,000 4,000,000 Issued, subscribed and paid-up share capital 3 2,992,964 2,992,964 Reserves 4 Capital reserves Share premium 986,077 986,077 Surplus on revaluation of freehold land and investment properties 3,843,044 3,843,044 4,829,121 4,829,121 Revenue reserves General reserve 1,450,491 1,450,491 Unappropriated profit 7,694,239 6,548,050 9,144,730 7,998,541 Total equity 16,966,815 15,820,626 LIABILITIES NON-CURRENT LIABILITIES Long term financing 5 1,535,299 1,335,099 Deferred income tax liability 6 593,732 515,577 2,129,031 1,850,676 CURRENT LIABILITIES Trade and other payables 7 2,133,377 1,797,734 Accrued mark-up 8 73,815 63,351 Short term borrowings 9 3,141,523 4,635,384 Current portion of non-current liabilities 5 411,419 388,301 Unclaimed dividend 23,584 20,757 Taxation - net 667,014 295,127 6,450,732 7,200,654 TOTAL LIABILITIES 8,579,763 9,051,330 CONTINGENCIES AND COMMITMENTS 10 TOTAL EQUITY AND LIABILITIES 25,546,578 24,871,956 The annexed notes form an integral part of these financial statements.

ANNUAL REPORT 2019 129
CHIEF EXECUTIVE OFFICER DIRECTOR CHIEF FINANCIAL OFFICER
2019 2018 Note (Rupees in thousand)
ASSETS NON-CURRENT ASSETS Property, plant and equipment 11 8,907,570 8,578,713 Investment properties 12 1,792,755 1,792,755 Long term investments 13 7,759,618 7,734,799 Long term deposits 14 52,589 49,624
18,512,532 18,155,891 CURRENT ASSETS Stores, spare parts and loose tools 15 565,437 530,567 Stock-in-trade 16 3,814,347 2,574,838 Trade debts 17 1,455,119 1,699,015 Advances 18 370,271 718,354 Security deposits and short term prepayments 19 24,078 9,564 Other receivables 20 536,987 1,013,780 Short term investments 21 51,441 8,042 Cash and bank balances 22 216,366 161,905
7,034,046 6,716,065
TOTAL ASSETS 25,546,578 24,871,956

KOHINOOR TEXTILE MILLS LIMITED130
2019 2018 Note (Rupees in thousand)
REVENUE 23 21,220,135 17,833,540 COST OF SALES 24 (17,659,063) (15,355,788) GROSS PROFIT 3,561,072 2,477,752 DISTRIBUTION COST 25 (561,181) (495,766)ADMINISTRATIVE EXPENSES 26 (552,220) (494,532)OTHER EXPENSES 27 (364,380) (154,690) (1,477,781) (1,144,988) 2,083,291 1,332,764 OTHER INCOME 28 608,755 1,183,527 PROFIT FROM OPERATIONS 2,692,046 2,516,291 FINANCE COST 29 (411,111) (362,200) PROFIT BEFORE TAXATION 2,280,935 2,154,091 TAXATION 30 (530,291) (489,769) PROFIT AFTER TAXATION 1,750,644 1,664,322 2019 2018 --------------Rupees-------------- EARNINGS PER SHARE - BASIC AND DILUTED 31 5.85 5.64
The annexed notes form an integral part of these financial statements.
STATEMENT OF PROFIT OR LOSS For the year ended June 30, 2019
CHIEF EXECUTIVE OFFICER DIRECTOR CHIEF FINANCIAL OFFICER

ANNUAL REPORT 2019 131
2019 2018 (Rupees in thousand)
PROFIT AFTER TAXATION 1,750,644 1,664,322 OTHER COMPREHENSIVE INCOME Items that will not be reclassified to profit or loss Gain on revaluation of freehold land - 20,591 Items that may be reclassified subsequently to profit or loss - - Other comprehensive income for the year - net of tax - 20,591 TOTAL COMPREHENSIVE INCOME FOR THE YEAR 1,750,644 1,684,913 The annexed notes form an integral part of these financial statements.
STATEMENT OF COMPREHENSIVE INCOME For the year ended June 30, 2019
CHIEF EXECUTIVE OFFICER DIRECTOR CHIEF FINANCIAL OFFICER

KOHINOOR TEXTILE MILLS LIMITED132
STAT
EMEN
T O
F CH
ANG
ES IN
EQ
UITY
Fo
r the
yea
r end
ed J
une
30, 2
019
Re
serv
es
Cap
ital r
eser
ves
Reve
nue
rese
rves
S
hare
Surp
lus
on
Unap
prop
riate
d
Tota
l To
tal
ca
pita
l Sh
are
reva
luat
ion
of
Sub
- Tot
al G
ener
al
Sub
- Tot
al re
serv
es
equi
ty
pr
emiu
m
freeh
old
land
re
serv
e pr
ofit
and
inve
stm
ent
pr
oper
ties
…
.……
……
……
...…
..……
( Ru
pees
in th
ousa
nd )
….…
……
……
…...
…..…
…
Balan
ce a
s at
30
June
201
7 2
,823
,551
1
44,9
19
3,8
22,4
53
3,9
67,3
72
1,4
50,4
91
5,6
81,3
82
7,1
31,8
73
11,
099,
245
13
,922
,796
Tr
ansa
ctio
ns w
ith o
wne
rs:
- fina
l divi
dend
for t
he y
ear e
nded
30
June
201
7
@ R
upee
s 1.
50 p
er s
hare
-
-
-
-
-
(4
23,5
33)
(423
,533
) (4
23,5
33)
(423
,533
)- i
nter
im d
ivide
nd fo
r the
yea
r end
ed 3
0 Ju
ne 2
018
@
Rup
ees
1.25
per
sha
re
-
-
-
-
-
(374
,121
) (3
74,1
21)
(374
,121
) (3
74,1
21)
- iss
uanc
e of
righ
t sha
res
169
,413
8
41,1
58
-
841
,158
-
-
-
8
41,1
58
1,0
10,5
71
1
69,4
13
841
,158
-
8
41,1
58
-
(797
,654
) (7
97,6
54)
43,
504
2
12,9
17
Pr
ofit f
or th
e ye
ar
-
-
-
-
-
1,6
64,3
22
1,6
64,3
22
1,6
64,3
22
1,6
64,3
22
Oth
er c
ompr
ehen
sive
inco
me
for t
he y
ear
-
-
20,
591
2
0,59
1
-
-
-
20,
591
2
0,59
1 To
tal c
ompr
ehen
sive
inco
me
for t
he y
ear
-
-
20,
591
2
0,59
1
-
1,6
64,3
22
1,6
64,3
22
1,6
84,9
13
1,6
84,9
13
Balan
ce a
s at
30
June
201
8
2,9
92,9
64
986
,077
3
,843
,044
4
,829
,121
1
,450
,491
6
,548
,050
7
,998
,541
1
2,82
7,66
2
15,8
20,6
26
Adju
stm
ent o
n ad
optio
n of
IFRS
9 (N
ote
2.9)
-
-
-
-
-
(5
,863
) (5
,863
) (5
,863
) (5
,863
)Ad
just
ed to
tal e
quity
as
at 0
1 Ju
ly 20
18
2,9
92,9
64
986
,077
3
,843
,044
4
,829
,121
1
,450
,491
6
,542
,187
7
,992
,678
1
2,82
1,79
9
15,8
14,7
63
Tran
sact
ions
with
ow
ners
:
- fi
nal d
ivide
nd fo
r the
yea
r end
ed 3
0 Ju
ne 2
018
@
Rup
ee 1
.00
per s
hare
-
-
-
-
-
(2
99,2
96)
(299
,296
) (2
99,2
96)
(299
,296
)- i
nter
im d
ivide
nd fo
r the
yea
r end
ed 3
0 Ju
ne 2
019
@
Rup
ee 1
.00
per s
hare
-
-
-
-
-
(2
99,2
96)
(299
,296
) (2
99,2
96)
(299
,296
)
-
-
-
-
-
(598
,592
) (5
98,5
92)
(598
,592
) (5
98,5
92)
Pr
ofit f
or th
e ye
ar
-
-
-
-
-
1,7
50,6
44
1,7
50,6
44
1,7
50,6
44
1,7
50,6
44
Oth
er c
ompr
ehen
sive
inco
me
for t
he y
ear
-
-
-
-
-
-
-
-
-
Tota
l com
preh
ensiv
e in
com
e fo
r the
yea
r -
-
-
-
-
1
,750
,644
1
,750
,644
1
,750
,644
1
,750
,644
Ba
lance
as
at 3
0 Ju
ne 2
019
2,9
92,9
64
986
,077
3
,843
,044
4
,829
,121
1
,450
,491
7
,694
,239
9
,144
,730
1
3,97
3,85
1
16,9
66,8
15
Th
e an
nexe
d no
tes
form
an
inte
gral
part
of th
ese
finan
cial s
tate
men
ts.
CHIE
F EX
ECUT
IVE
OFF
ICER
DIRE
CTO
R C
HIEF
FIN
ANCI
AL O
FFIC
ER

ANNUAL REPORT 2019 133
2019 2018 Note (Rupees in thousand)
CASH FLOWS FROM OPERATING ACTIVITIES Cash generated from operations 32 2,975,165 891,663 Finance cost paid (400,647) (343,077)Income tax paid (77,854) (160,757)Net (increase) / decrease in long term deposits (2,965) 7,055 Net cash generated from operating activities 2,493,699 394,884 CASH FLOWS FROM INVESTING ACTIVITIES Capital expenditure on property, plant and equipment (880,261) (851,614)Proceeds from sale of property, plant and equipment 41,752 19,529 Long term investments made (24,819) (2,367,710)Short term investments made (1,103,118) (2,663,941)Proceeds from sale of short term investments 1,051,322 2,646,341 Interest received 14,355 12,037 Dividend received 327,839 1,002,415 Net cash used in investing activities (572,930) (2,202,943) CASH FLOWS FROM FINANCING ACTIVITIES Proceeds from long term financing 596,883 441,988 Repayment of long term financing (373,565) (272,328)Proceeds from issue of right shares - 1,010,571 Repayment of liabilities against assets subject to finance lease - (20,717)Short term borrowings - net (1,493,861) 1,447,518 Dividend paid (595,765) (792,003) Net cash (used in) / from financing activities (1,866,308) 1,815,029
Net increase in cash and cash equivalents 54,461 6,970 Cash and cash equivalents at the beginning of the year 161,905 154,935 Cash and cash equivalents at the end of the year 216,366 161,905
The annexed notes form an integral part of these financial statements.
STATEMENT OF CASH FLOWSFor the year ended June 30, 2019
CHIEF EXECUTIVE OFFICER DIRECTOR CHIEF FINANCIAL OFFICER

KOHINOOR TEXTILE MILLS LIMITED134
1. THE COMPANY AND ITS OPERATIONS 1.1 Kohinoor Textile Mills Limited is a public limited company incorporated in Pakistan under the
Companies Act, 1913 (now the Companies Act, 2017) and listed on Pakistan Stock Exchange Limited. The registered office of the Company is situated at 42-Lawrence Road, Lahore. The principal activity of the Company is manufacturing of yarn and cloth, processing and stitching the cloth and trade of textile products.
1.2 Geographical location and addresses of all business units are as follows:
Sr. No. Manufacturing units and office Address Manufacturing units: 1 Spinning and Home textile units Peshawar Road, Rawalpindi. 2 Spinning unit Gulyana Road, Gujar Khan, District Rawalpindi. 3 Weaving unit 8 K.M. Manga Raiwind Road, District Kasur. Head office 42-Lawrence Road, Lahore. 1.3 These financial statements are the separate financial statements of the Company. Consolidated
financial statements of the Company are prepared separately. Details of the Company’s investment in subsidiaries are stated in note 13.1 to these financial statements.
2. SUMMARY OF SIGNIFICANT ACCOUNTING POLICIES The significant accounting policies applied in the preparation of these financial statements are set out
below. These policies have been consistently applied to all years presented, unless otherwise stated:
2.1 Basis of preparation a) Statement of compliance These financial statements have been prepared in accordance with the accounting and reporting
standards as applicable in Pakistan. The accounting and reporting standards applicable in Pakistan comprise of:
- International Financial Reporting Standards (IFRSs) issued by the International Accounting
Standards Board (IASB) as notified under the Companies Act, 2017; and
- Provisions of and directives issued under the Companies Act, 2017. Where provisions of and directives issued under the Companies Act, 2017 differ from the IFRSs,
the provisions of and directives issued under the Companies Act, 2017 have been followed.
b) Accounting convention These financial statements have been prepared under the historical cost convention, except for certain
financial instruments, investment properties and freehold land which are carried at their fair values. c) Critical accounting estimates and judgments The preparation of financial statements in conformity with the approved accounting standards
requires the use of certain critical accounting estimates. It also requires the management to exercise its judgment in the process of applying the Company’s accounting policies. Estimates
NOTES TO THE FINANCIAL STATEMENTS For the year ended June 30, 2019

ANNUAL REPORT 2019 135
and judgments are continually evaluated and are based on historical experience and other factors, including expectations of future events that are believed to be reasonable under the circumstances. The areas where various assumptions and estimates are significant to the Company’s financial statements or where judgments were exercised in application of accounting policies are as follows:
Useful lives, patterns of economic benefits and impairments Estimates with respect to residual values, useful lives and pattern of flow of economic benefits
are based on the analysis of the management of the Company. Further, the Company reviews the value of assets for possible impairment on an annual basis. Any change in the estimates in the future might affect the carrying amount of respective item of property, plant and equipment, with a corresponding effect on the depreciation charge and impairment.
Inventories Net realizable value of inventories is determined with reference to currently prevailing selling
prices less estimated expenditure to make sales. Income tax In making the estimates for income tax currently payable by the Company, the management
takes into account the current income tax law and the decisions of appellate authorities on certain issues in the past.
Allowance for expected credit losses The allowance for expected credit losses assessment requires a degree of estimation and
judgment. It is based on the lifetime expected credit loss, grouped based on days overdue, and makes assumptions to allocate an overall expected credit loss rate for each group. These assumptions include recent sales experience and historical collection rates.
Impairment of investment in subsidiary companies In making an estimate of recoverable amount of the Company’s investment in subsidiary
companies, the management considers future cash flows. Revenue from contracts with customers involving sale of goods When recognizing revenue in relation to the sale of goods to customers, the key performance
obligation of the Company is considered to be the point of delivery of the goods to the customer, as this is deemed to be the time that the customer obtains control of the promised goods and therefore, the benefits of unimpeded access.
d) Standards, interpretations and amendments to published approved accounting standards that
are effective in current year and are relevant to the Company Following standards, interpretations and amendments to published approved accounting
standards are mandatory for the Company’s accounting periods beginning on or after 01 July 2018:
· IFRS 9 ‘Financial Instruments’ · IFRS 15 ‘Revenue from Contracts with Customers’ · IFRS 15 (Amendments), ‘Revenue from Contracts with Customers’ · IAS 40 (Amendments), ‘Investment Property’ · IFRIC 22 ‘Foreign Currency Transactions and Advance Consideration’ · Annual Improvements to IFRSs: 2014 – 2016 Cycle

KOHINOOR TEXTILE MILLS LIMITED136
The Company had to change its accounting policies and make certain adjustments without restating prior year results following the adoption of IFRS 9 and IFRS 15. These are disclosed in note 2.9 and note 2.18. Most of the other amendments listed above did not have any impact on the amounts recognized in prior periods and are not expected to significantly affect the current or future periods.
e) Standards, interpretations and amendments to published approved accounting standards that
are not yet effective but relevant to the Company Following standards, interpretations and amendments to existing standards have been published
and are mandatory for the Company’s accounting periods beginning on or after 01 July 2019 or later periods:
IFRS 16 ‘Lease’ (effective for annual periods beginning on or after 01 January 2019). IFRS 16
specifies how an entity will recognize, measure, present and disclose leases. The standard provides a single lessee accounting model, requiring lessees to recognize assets and liabilities for all leases unless the lease term is 12 months or less or the underlying asset has a low value. Lessors continue to classify leases as operating or finance, with IFRS 16 approach to lessor accounting substantially unchanged from its predecessor, IAS 17 ‘Leases’. IFRS 16 replaces IAS 17, IFRIC 4 ‘Determining Whether an Arrangement Contains a Lease’, SIC-15 ‘Operating Leases–Incentives’ and SIC-27 ‘Evaluating the Substance of Transactions Involving the Legal Form of a Lease’. The management of the Company is in the process of evaluating the impacts of the aforesaid standard on the Company’s financial statements.
Amendments to IFRS 9 (effective for annual periods beginning on or after 01 January 2019) clarify
that for the purpose of assessing whether a prepayment feature meets the solely payments of principal and interest (‘SPPI’) condition, the party exercising the option may pay or receive reasonable compensation for the prepayment irrespective of the reason for prepayment. In other words, prepayment features with negative compensation do not automatically fail SPPI. The amendments are not likely to have significant impact on the Company’s financial statements.
IFRIC 23 ‘Uncertainty over Income Tax Treatments’ (effective for annual periods beginning on
or after 01 January 2019). The interpretation addresses the determination of taxable profit (tax loss), tax bases, unused tax losses, unused tax credits and tax rates, when there is uncertainty over income tax treatments under IAS 12 ‘Income Taxes’. It specifically considers: whether tax treatments should be considered collectively; assumptions for taxation authorities’ examinations; the determination of taxable profit (tax loss), tax bases, unused tax losses, unused tax credits and tax rates; and the effect of changes in facts and circumstances. The interpretation is not expected to have a material impact on the Company’s financial statements.
Amendments to IFRS 10 ‘Consolidated Financial Statements’ and IAS 28 (deferred indefinitely)
to clarify the treatment of the sale or contribution of assets from an investor to its associates or joint venture, as follows: require full recognition in the investor’s financial statements of gains and losses arising on the sale or contribution of assets that constitute a business (as defined in IFRS 3 ‘Business Combinations’); require the partial recognition of gains and losses where the assets do not constitute a business, i.e. a gain or loss is recognized only to the extent of the unrelated investors’ interests in that associate or joint venture. These requirements apply regardless of the legal form of the transaction, e.g. whether the sale or contribution of assets occur by an investor transferring shares in a subsidiary that holds the assets (resulting in loss of control of the subsidiary), or by the direct sale of the assets themselves. The management of the Company is in the process of evaluating the impacts of the aforesaid amendments on the Company’s financial statements.
Amendments to IFRS 3 ‘Business Combinations’ (effective for annual periods beginning on
or after 01 January 2020). The International Accounting Standards Board (IASB) has issued ‘Definition of Business’ aimed at resolving the difficulties that arise when an entity determines whether it has acquired a business or a group of assets. The amendments clarify that to be

ANNUAL REPORT 2019 137
considered a business, an acquired set of activities and assets must include, at a minimum, an input and a substantive process that together significantly contribute to the ability to create outputs. The amendments include an election to use a concentration test. The standard is effective for transactions in the future and therefore, would not have an impact on past financial statements.
Amendments to IAS 1 ‘Presentation of Financial Statements’ and IAS 8 ‘Accounting Policies,
Changes in Accounting Estimates and Errors’ (effective for annual periods beginning on or after 01 January 2020). The amendments are intended to make the definition of material in IAS 1 easier to understand and are not intended to alter the underlying concept of materiality in IFRS. In addition, the IASB has also issued guidance on how to make materiality judgments when preparing general purpose financial statements in accordance with IFRS.
On 12 December 2017, IASB issued Annual Improvements to IFRSs: 2015 – 2017 Cycle,
incorporating amendments to four IFRSs more specifically in IFRS 3 ‘Business Combinations’, IFRS 11 ‘Joint Arrangements’, IAS 12 ‘Income Taxes’ and IAS 23 ‘Borrowing Costs’. The amendments are effective for annual periods beginning on or after 01 January 2019. The amendments have no significant impact on the Company’s financial statements and have therefore not been analyzed in detail.
On 29 March 2018, the International Accounting Standards Board (the IASB) has issued
a revised Conceptual Framework. The new Framework: re-introduces the terms stewardship and prudence; introduces a new asset definition that focuses on rights and a new liability definition that is likely to be broader than the definition it replaces, but does not change the distinction between a liability and an equity instrument; removes from the asset and liability definitions references to the expected flow of economic benefits–this lowers the hurdle for identifying the existence of an asset or liability and puts more emphasis on reflecting uncertainty in measurement; discusses historical cost and current value measures, and provides some guidance on how the IASB would go about selecting a measurement basis for a particular asset or liability; states that the primary measure of financial performance is profit or loss, and that only in exceptional circumstances will the IASB use other comprehensive income and only for income or expenses that arise from a change in the current value of an asset or liability; and discusses uncertainty, derecognition, unit of account, the reporting entity and combined financial statements. The Framework is not an IFRS standard and does not override any standard, so nothing will change in the short term. The revised Framework will be used in future standardsetting decisions, but no changes will be made to current IFRS. Preparers might also use the Framework to assist them in developing accounting policies where an issue is not addressed by an IFRS. It is effective for annual periods beginning on or after 01 January 2020 for preparers that develop an accounting policy based on the Framework.
f) Standards and amendments to approved published standards that are not yet effective and not
considered relevant to the Company There are other standards and amendments to published standards that are mandatory for
accounting periods beginning on or after 01 July 2019 but are considered not to be relevant or do not have any significant impact on the Company’s financial statements and are therefore, not detailed in these financial statements.
2.2 Employee benefit The Company operates an approved funded provident fund scheme covering all permanent
employees. Equal monthly contributions are made both by the Company and employees at the rate of 8.33 percent of basic salary and cost of living allowance to the fund. The Company’s contributions to the fund are charged to statement of profit or loss.
KOHINOOR TEXTILE MILLS LIMITED138
2.3 Taxation Current Provision for current tax is based on the taxable income for the year determined in accordance
with the prevailing law for taxation of income. The charge for current tax is calculated using prevailing tax rates or tax rates expected to apply to the profit for the year, if enacted. The charge for current tax also includes adjustments, where considered necessary, to provision for tax made in previous years arising from assessments framed during the year for such years.
Deferred Deferred tax is accounted for using the liability method in respect of all temporary differences
arising from differences between the carrying amount of assets and liabilities in the financial statements and the corresponding tax bases used in the computation of the taxable profit. Deferred tax liabilities are generally recognized for all taxable temporary differences and deferred tax assets to the extent that it is probable that taxable profits will be available against which the deductible temporary differences, unused tax losses and tax credits can be utilized.
Deferred tax is calculated at the rates that are expected to apply to the period when the
differences reverse based on tax rates that have been enacted or substantively enacted by the reporting date. Deferred tax is charged or credited in the statement of profit or loss, except to the extent that it relates to items recognized in other comprehensive income or directly in equity. In this case the tax is also recognized in other comprehensive income or directly in equity, respectively.
2.4 Functional and presentation currency Items included in the financial statements of the Company are measured using the currency of
the primary economic environment in which the Company operates (the functional currency). The financial statements are presented in Pak Rupees, which is the Company’s functional and presentation currency. Figures are rounded off to the nearest thousand of Pak Rupees.
2.5 Foreign currency transactions and translation All monetary assets and liabilities in foreign currencies are translated into Pak Rupees at exchange
rates prevailing at the reporting date. Transactions in foreign currencies are translated into Pak Rupees at exchange rates prevailing at the dates of the transactions. Foreign exchange gains and losses resulting from the settlement of such transactions and from the translation at year end exchange rates of monetary assets and liabilities denominated in foreign currencies are charged or credited to statement of profit or loss. Non-monetary assets and liabilities that are measured in terms of historical cost in a foreign currency are translated into Pak Rupees at exchange rates prevailing at the date of transaction. Non-monetary assets and liabilities denominated in foreign currency that are stated at fair value are translated into Pak Rupees at exchange rates prevailing at the date when fair values are determined.
2.6 Provisions Provisions are recognized when the Company has a legal or constructive obligation as a result
of past events and it is probable that an outflow of resources embodying economic benefits will be required to settle the obligations and a reliable estimate of the amount can be made.
2.7 Property, plant, equipment and depreciation Owned Property, plant and equipment except freehold land and capital work-in-progress are stated
at cost less accumulated depreciation and accumulated impairment losses (if any). Cost of

ANNUAL REPORT 2019 139
property, plant and equipment consists of historical cost, borrowing cost pertaining to erection / construction period of qualifying assets and other directly attributable cost of bringing the asset to working condition. Freehold land is stated at revalued amount less any identified impairment loss. Capital work-in-progress is stated at cost less any recognized impairment loss.
Subsequent costs are included in the asset’s carrying amount or recognized as a separate
asset, as appropriate, only when it is probable that future economic benefits associated with the item will flow to the Company and the cost of the item can be measured reliably. All other repair and maintenance costs are charged to statement of profit or loss during the period in which they are incurred.
Increases in the carrying amounts arising on revaluation of freehold land are recognized, in other
comprehensive income and accumulated in revaluation surplus in shareholders’ equity. To the extent that increase reverses a decrease previously recognized in the statement of profit or loss, the increase is first recognized in the statement of profit or loss. Decreases that reverse previous increases of the same asset are first recognized in other comprehensive income to the extent of the remaining surplus attributable to the asset; all other decreases are charged to the statement of profit or loss.
Leased Leases where the Company has substantially all the risks and rewards of ownership are classified
as finance lease. Assets subject to finance lease are capitalized at the commencement of the lease term at the lower of present value of minimum lease payments under the lease agreements and the fair value of the leased assets, each determined at the inception of the lease.
The related rental obligation net of finance cost, is included in liabilities against assets subject to
finance lease. The liabilities are classified as current and long term depending upon the timing of payments.
Each lease payment is allocated between the liability and finance cost so as to achieve a constant
rate on the balance outstanding. The finance cost is charged to statement of profit or loss over the lease term.
Depreciation of assets subject to finance lease is recognized in the same manner as for owned
assets. Depreciation of the leased assets is charged to statement of profit or loss. Depreciation Depreciation on property, plant and equipment is charged to the statement of profit or loss
applying the reducing balance method so as to write off the cost / depreciable amount of the asset over their estimated useful lives at the rates given in Note 11.1. Depreciation on additions is charged from the month the assets are available for use while no depreciation is charged in the month in which the assets are disposed of. The residual values and useful lives of assets are reviewed by the management, at each financial year end and adjusted if impact on depreciation is significant.
De-recognition An item of property, plant and equipment is de-recognized upon disposal or when no future
economic benefits are expected from its use or disposal. Any gain or loss arising on derecognition of the asset is included in the statement of profit or loss in the year the asset is derecognized.
2.8 Investment properties Land and buildings held for capital appreciation or to earn rental income are classified as
investment properties. Investment properties are carried at fair value which is based on active

KOHINOOR TEXTILE MILLS LIMITED140
market prices, adjusted, if necessary, for any difference in the nature, location or condition of the specific asset. The valuation of the properties is carried out with sufficient regularity.
Gain or loss arising from a change in the fair value of investment properties is recognized in the
statement of profit or loss for the year in which it arises. 2.9 IFRS 9 “Financial instruments” The Company has adopted IFRS 9 “Financial Instruments” from 01 July 2018. The standard
introduced new classification and measurement models for financial assets. A financial asset shall be measured at amortized cost if it is held within a business model whose objective is to hold assets in order to collect contractual cash flows which arise on specified dates and that are solely principal and interest. A debt investment shall be measured at fair value through other comprehensive income if it is held within a business model whose objective is to both hold assets in order to collect contractual cash flows which arise on specified dates that are solely principal and interest as well as selling the asset on the basis of its fair value. All other financial assets are classified and measured at fair value through profit or loss unless the Company makes an irrevocable election on initial recognition to present gains and losses on equity instruments in other comprehensive income. Despite these requirements, a financial asset may be irrevocably designated as measured at fair value through profit or loss to reduce the effect of, or eliminate, an accounting mismatch. For financial liabilities designated at fair value through profit or loss, the standard requires the portion of the change in fair value that relates to the Company’s own credit risk to be presented in other comprehensive income (unless it would create an accounting mismatch). New simpler hedge accounting requirements are intended to more closely align the accounting treatment with the risk management activities of the Company. New impairment requirements use an ‘expected credit loss’ (‘ECL’) model to recognize an allowance. Impairment is measured using a 12-month ECL method unless the credit risk on a financial instrument has increased significantly since initial recognition in which case the lifetime ECL method is adopted. For receivables, a simplified approach to measuring expected credit losses using a lifetime expected loss allowance is available.
The Company has adopted IFRS 9 without restating the prior year results. Key changes in
accounting policies resulting from application of IFRS 9 are as follows: i. Recognition of financial instruments The Company initially recognizes financial assets on the date when they are originated. Financial
liabilities are initially recognized on the trade date when the entity becomes a party to the contractual provisions of the instrument.
ii. Classification and measurement of financial instruments IFRS 9 largely retains the existing requirements in IAS 39 “Financial Instruments: Recognition
and Measurement” for the classification and measurement of financial liabilities. However, it replaces the previous IAS 39 categories for financial assets i.e. loans and receivables, fair value through profit or loss (FVTPL), available for sale and held to maturity with the categories such as amortized cost, fair value through profit or loss (FVTPL) and fair value through other comprehensive income (FVTOCI).
Investments and other financial assets a) Classification From 01 July 2018, the Company classifies its financial assets in the following measurement
categories:

ANNUAL REPORT 2019 141
· those to be measured subsequently at fair value (either through other comprehensive income, or through profit or loss), and
· those to be measured at amortized cost The classification depends on the Company’s business model for managing the financial assets
and the contractual terms of the cash flows. For assets measured at fair value, gains and losses will either be recorded in profit or loss or other
comprehensive income. For investments in debt instruments, this will depend on the business model in which the investment is held. For investments in equity instruments, this will depend on whether the Company has made an irrevocable election at the time of initial recognition to account for the equity investment at fair value through other comprehensive income. The Company reclassifies debt investments when and only when its business model for managing those assets changes.
b) Measurement At initial recognition, the Company measures a financial asset at its fair value plus, in the case
of a financial asset not at fair value through profit or loss, transaction costs that are directly attributable to the acquisition of the financial asset. Transaction costs of financial assets carried at fair value through profit or loss are expensed in profit or loss.
Financial assets with embedded derivatives are considered in their entirety when determining
whether their cash flows are solely payment of principal and interest. Debt instruments Subsequent measurement of debt instruments depends on the Company’s business model for
managing the asset and the cash flow characteristics of the asset. There are three measurement categories into which the Company classifies its debt instruments:
Amortized cost Financial assets that are held for collection of contractual cash flows where those cash flows
represent solely payments of principal and interest are measured at amortized cost. Interest income from these financial assets is included in other income using the effective interest rate method. Any gain or loss arising on derecognition is recognized directly in profit or loss and presented in other income / (other expenses) together with foreign exchange gains and losses. Impairment losses are presented as separate line item in the statement of profit or loss.
Fair value through other comprehensive income (FVTOCI) Financial assets that are held for collection of contractual cash flows and for selling the financial
assets, where the assets’ cash flows represent solely payments of principal and interest, are measured at FVTOCI. Movements in the carrying amount are taken through other comprehensive income, except for the recognition of impairment losses (and reversal of impairment losses), interest income and foreign exchange gains and losses which are recognized in profit or loss. When the financial asset is de-recognized, the cumulative gain or loss previously recognized in other comprehensive income is reclassified from equity to profit or loss and recognized in other income / (other expenses). Interest income from these financial assets is included in other income using the effective interest rate method. Foreign exchange gains and losses are presented in other income / (other expenses) and impairment losses are presented as separate line item in the statement of profit or loss.

KOHINOOR TEXTILE MILLS LIMITED142
Fair value through profit or loss Assets that do not meet the criteria for amortized cost or FVTOCI are measured at FVTPL. A
gain or loss on a debt instrument that is subsequently measured at FVTPL is recognized in profit or loss and presented net within other income / (other expenses) in the period in which it arises.
Equity instruments The Company subsequently measures all equity investments at fair value for financial instruments
quoted in an active market, the fair value corresponds to a market price (level 1). For financial instruments that are not quoted in an active market, the fair value is determined using valuation techniques including reference to recent arm’s length market transactions or transactions involving financial instruments which are substantially the same (level 2), or discounted cash flow analysis including, to the greatest possible extent, assumptions consistent with observable market data (level 3).
Fair value through other comprehensive income (FVTOCI) Where the Company’s management has elected to present fair value gains and losses on equity
investments in other comprehensive income, there is no subsequent reclassification of fair value gains and losses to profit or loss. Impairment losses (and reversal of impairment losses) on equity investments measured at FVTOCI are not reported separately from other changes in fair value.
Fair value through profit or loss Changes in the fair value of equity investments at fair value through profit or loss are recognized
in other income / (other expenses) in the statement of profit or loss as applicable. Dividends from such investments continue to be recognized in profit or loss as other income
when the Company’s right to receive payments is established. Financial liabilities a) Classification and measurement Financial liabilities are classified as measured at amortized cost or FVTPL. A financial liability is
classified as at FVTPL if it is classified as held-for-trading, it is a derivative or it is designated as such on initial recognition. Financial liabilities at FVTPL are measured at fair value and net gains and losses, including any interest expense, are recognized in profit or loss. Other financial liabilities are subsequently measured at amortized cost using the effective interest method. Interest expense and foreign exchange gains and losses are recognized in statement of profit or loss. Any gain or loss on de-recognition is also included in profit or loss.
iii. Impairment of financial assets From 01 July 2018, the Company assesses on a forward looking basis the expected credit losses
associated with its debt instruments carried at amortized cost and FVTOCI. The impairment methodology applied depends on whether there has been a significant increase in credit risk.
For trade debts and other receivables, the Company applies the simplified approach permitted
by IFRS 9, which requires expected lifetime losses to be recognized from initial recognition of the receivables.

ANNUAL REPORT 2019 143
iv. De-recognition a) Financial assets The Company derecognizes a financial asset when the contractual rights to the cash flows from
the asset expire, or it transfers the rights to receive the contractual cash flows in a transaction in which substantially all of the risks and rewards of ownership of the financial asset are transferred, or it neither transfers nor retains substantially all of the risks and rewards of ownership and does not retain control over the transferred asset. Any interest in such de-recognized financial assets that is created or retained by the Company is recognized as a separate asset or liability.
b) Financial liabilities The Company derecognizes a financial liability (or a part of financial liability) from its statement
of financial position when the obligation specified in the contract is discharged or cancelled or expires.
v. Offsetting of financial instruments Financial assets and financial liabilities are set off and the net amount is reported in the financial
statements when there is a legal enforceable right to set off and the Company intends either to settle on a net basis or to realize the assets and to settle the liabilities simultaneously.
vi. Hedge accounting IFRS 9 requires that hedge accounting relationships are aligned with its risk management
objectives and strategy and to apply a more qualitative and forward-looking approach to assessing hedge effectiveness.
There is no impact of the said change on these financial statements as there is no hedge activity
carried on by the Company during the year ended 30 June 2019. vii. Impacts of adoption of IFRS 9 on these financial statements as on 01 July 2018 On 01 July 2018, the Company’s management has assessed which business models apply to
the financial assets held by the Company at the date of initial application of IFRS 9 (01 July 2018) and has classified its financial instruments into appropriate IFRS 9 categories. The main effects resulting from this reclassification are as follows:
Trade debts categorized as Deferred Loans and Amortized tax receivables cost
RUPEES IN THOUSAND
Opening balance (before reclassification) 1,699,015 - 515,577 Reclassification of trade debts (1,699,015) 1,699,015 - Recognition of expected credit losses on trade debts - (8,258) (2,395)
Opening balance (after reclassification) - 1,690,757 513,182

KOHINOOR TEXTILE MILLS LIMITED144
The impact of these changes on the Company’s reserves and equity is as follows:
Effect on total equity as a result of adjustment on adoption of IFRS 9 due to recognition of expected life time credit losses on trade debts is Rupees 5.863 million net of deferred income tax.
Reclassifications of financial instruments on adoption of IFRS 9 As on 01 July 2018, the classification and measurement of financial instruments of the Company
were as follows:Measurement category Carrying amounts
Original New Original New Difference
(IAS 39) (IFRS 9) RUPEES IN THOUSAND
Non-current financial assets Long term deposits Loans and receivables Amortized cost 49,624 49,624 - Current financial assets Trade debts Loans and receivables Amortized cost 1,699,015 1,690,757 8,258 Advances Loans and receivables Amortized cost 1,883 1,883 - Security deposits Loans and receivables Amortized cost 71 71 - Other receivables Loans and receivables Amortized cost 267,380 267,380 - Short term investments FVTPL FVTPL 8,042 8,042 - Cash and bank balances Loans and receivables Amortized cost 161,905 161,905 - Non-current financial liabilities Long term financing Amortized cost Amortized cost 1,335,099 1,335,099 - Current financial liabilities Trade and other payables Amortized cost Amortized cost 1,433,253 1,433,253 - Accrued mark-up Amortized cost Amortized cost 63,351 63,351 - Short term borrowings Amortized cost Amortized cost 4,635,384 4,635,384 - Current portion of long term financing Amortized cost Amortized cost 388,301 388,301 - Unclaimed dividend Amortized cost Amortized cost 20,757 20,757 - 2.10 Investment in subsidiaries Investments in subsidiaries are stated at cost less impairment loss, if any, in accordance with the
provisions of IAS 27 ‘Separate Financial Statements’. 2.11 Inventories Inventories, except for stock in transit and waste stock / rags, are stated at lower of cost and
net realizable value. Cost is determined as follows: Stores, spare parts and loose tools Useable stores, spare parts and loose tools are valued principally at moving average cost, while
items considered obsolete are carried at nil value. Items in transit are valued at cost comprising invoice value plus other charges paid thereon.
Stock-in-trade Cost of raw materials, work-in-process and finished goods is determined as follows: (i) For raw materials: Annual average basis. (ii) For work-in-process and finished goods: Average manufacturing cost including a portion of production overheads.

ANNUAL REPORT 2019 145
Materials in transit are valued at cost comprising invoice value plus other charges paid thereon. Waste stock / rags are valued at net realizable value.
Net realizable value signifies the estimated selling price in the ordinary course of business less
the estimated costs of completion and the estimated costs necessary to make a sale. 2.12 Trade and other receivables Trade receivables are initially recognized at fair value and subsequently measured at amortized
cost using the effective interest method, less any allowance for expected credit losses. Trade receivables generally do not include amounts over due by 365 days.
The Company has applied the simplified approach to measuring expected credit losses, which
uses a lifetime expected loss allowance. To measure the expected credit losses, trade receivables have been grouped based on days overdue.
Other receivables are recognized at amortized cost, less any allowance for expected credit
losses. 2.13 Borrowings Financing and borrowings are recognized initially at fair value and are subsequently stated at
amortized cost. Any difference between the proceeds and the redemption value is recognized in the statement of profit or loss over the period of the borrowings using the effective interest method.
2.14 Borrowing cost Interest, mark-up and other charges on long-term finances are capitalized up to the date of
commissioning of respective qualifying assets acquired out of the proceeds of such long-term finances. All other interest, mark-up and other charges are recognized in statement of profit or loss.
2.15 Trade and other payables Liabilities for trade and other amounts payable are initially recognized at fair value, which is
normally the transaction cost. 2.16 Cash and cash equivalents Cash and cash equivalents comprise cash in hand, cash at banks on current, saving and deposit
accounts and other short term highly liquid instruments that are readily convertible into known amounts of cash and which are subject to insignificant risk of changes in values.
2.17 Share capital Ordinary shares are classified as share capital. Incremental costs directly attributable to the issue
of new shares are shown in equity as a deduction, net of tax. 2.18 Revenue from contracts with customers The Company has adopted IFRS 15 from 01 July 2018. The standard provides a single
comprehensive model for revenue recognition. The core principle of the standard is that an entity shall recognize revenue to depict the transfer of promised goods or services to customers at an amount that reflects the consideration to which the entity expects to be entitled in exchange for those goods or services. The standard introduced a new contract-based revenue recognition
KOHINOOR TEXTILE MILLS LIMITED146
model with a measurement approach that is based on an allocation of the transaction price. This is described further in the accounting policies below. Credit risk is presented separately as an expense rather than adjusted against revenue. Contracts with customers are presented in Company’s statement of financial position as a contract liability, a contract asset, or a receivable, depending on the relationship between the Company’s performance and the customer’s payment. Customer acquisition costs and costs to fulfill a contract can, subject to certain criteria, be capitalized as an asset and amortized over the contract period.
The Company has adopted IFRS 15 by applying the modified retrospective approach according
to which the Company is not required to restate the prior year results. Key changes in accounting policies resulting from application of IFRS 15 are as follows:
i) Revenue recognition Revenue is recognized at an amount that reflects the consideration to which the Company
is expected to be entitled in exchange for transferring goods or services to a customer. For each contract with a customer, the Company: identifies the contract with a customer; identifies the performance obligations in the contract; determines the transaction price which takes into account estimates of variable consideration and the time value of money; allocates the transaction price to the separate performance obligations on the basis of the relative standalone selling price of each distinct good or service to be delivered; and recognizes revenue when or as each performance obligation is satisfied in a manner that depicts the transfer to the customer of the goods or services promised.
Variable consideration within the transaction price, if any, reflects concessions provided to the
customer such as discounts, rebates and refunds, any potential bonuses receivable from the customer and any other contingent events. Such estimates are determined using either the ‘expected value’ or ‘most likely amount’ method. The measurement of variable consideration is subject to a constraining principle whereby revenue will only be recognized to the extent that it is highly probable that a significant reversal in the amount of cumulative revenue recognized will not occur. The measurement constraint continues until the uncertainty associated with the variable consideration is subsequently resolved. Amounts received that are subject to the constraining principle are initially recognized as deferred revenue in the form of a separate refund liability.
Sale of goods Revenue from the sale of goods is recognized at the point in time when the customer obtains
control of the goods, which is generally at the time of delivery. Interest Interest income is recognized as interest accrues using the effective interest method. This is a
method of calculating the amortized cost of a financial asset and allocating the interest income over the relevant period using the effective interest rate, which is the rate that exactly discounts estimated future cash receipts through the expected life of the financial asset to the net carrying amount of the financial asset.
Dividend Dividend on equity investments is recognized when right to receive the dividend is
established. Other revenue Other revenue is recognized when it is received or when the right to receive payment is
established.

ANNUAL REPORT 2019 147
ii) Contract assets Contract assets arise when the Company performs its performance obligations by transferring
goods to a customer before the customer pays its consideration or before payment is due. Contract assets are treated as financial assets for impairment purposes.
iii) Customer acquisition costs Customer acquisition costs are capitalized as an asset where such costs are incremental to
obtaining a contract with a customer and are expected to be recovered. Customer acquisition costs are amortized on a straight-line basis over the term of the contract.
Costs to obtain a contract that would have been incurred regardless of whether the contract
was obtained or which are not otherwise recoverable from a customer are expensed as incurred to profit or loss. Incremental costs of obtaining a contract where the contract term is less than one year is immediately expensed to profit or loss.
iv) Customer fulfillment costs Customer fulfillment costs are capitalized as an asset when all the following are met: (i) the
costs relate directly to the contract or specifically identifiable proposed contract; (ii) the costs generate or enhance resources of the Company that will be used to satisfy future performance obligations; and (iii) the costs are expected to be recovered. Customer fulfillment costs are amortized on a straight-line basis over the term of the contract.
v) Right of return assets Right of return assets represents the right to recover inventory sold to customers and is based
on an estimate of customers who may exercise their right to return the goods and claim a refund. Such rights are measured at the value at which the inventory was previously carried prior to sale, less expected recovery costs and any impairment.
vi) Contract liabilities Contract liability is the obligation of the Company to transfer goods to a customer for which the
Company has received consideration from the customer. If a customer pays consideration before the Company transfers goods, a contract liability is recognized when the payment is made. Contract liabilities are recognized as revenue when the Company performs its performance obligations under the contract.
vii) Refund liabilities Refund liabilities are recognized where the Company receives consideration from a customer
and expects to refund some, or all, of that consideration to the customer. A refund liability is measured at the amount of consideration received or receivable for which the Company does not expect to be entitled and is updated at the end of each reporting period for changes in circumstances. Historical data is used across product lines to estimate such returns at the time of sale based on an expected value methodology.
viii) Impacts of adoption of IFRS 15 on these financial statements as on 01 July 2018 The Company has applied IFRS 15 using the modified retrospective approach for transition. This
approach requires entities to recognize the cumulative effect of initially applying IFRS 15 as an adjustment to the opening balance of unappropriated profit in the period of initial application. Comparative prior year periods would not be adjusted. The application of IFRS 15 does not have any significant impact on the revenue recognition of the Company and therefore, the

KOHINOOR TEXTILE MILLS LIMITED148
cumulative effect of initially applying this standard as an adjustment to the opening balance of unappropriated profit in the period of initial application is Rupees Nil.
2.19 Derivative financial instruments Derivatives are initially recognized at fair value. Any directly attributable transaction costs are
recognized in the statement of profit or loss as incurred. They are subsequently remeasured at fair value on regular basis and at each reporting date as a minimum, with all their gains and losses, realized and unrealized, recognized in the statement of profit or loss.
2.20 Segment reporting Segment reporting is based on the operating (business) segments of the Company. An operating
segment is a component of the Company that engages in business activities from which it may earn revenues and incur expenses, including revenues and expenses that relate to the transactions with any of the Company’s other components. An operating segment’s operating results are reviewed regularly by the chief executive officer to make decisions about resources to be allocated to the segment and assess its performance, and for which discrete financial information is available.
Segment results that are reported to the chief executive officer include items directly attributable
to a segment as well as those that can be allocated on a reasonable basis. Those incomes, expenses, assets, liabilities and other balances which can not be allocated to a particular segment on a reasonable basis are reported as unallocated.
The Company has three reportable business segments. Spinning (Producing different quality of
yarn using natural and artificial fibers), Weaving (Producing different quality of greige fabric using yarn) and Processing and Home Textile (Processing greige fabric for production of printed and dyed fabric and manufacturing of home textile articles).
Transaction among the business segments are recorded at arm’s length prices using admissible
valuation methods. Inter segment sales and purchases are eliminated from the total. 2.21 Impairment of non-financial assets The carrying amounts of the Company’s non-financial assets are reviewed at each reporting
date to determine whether there is any indication of impairment. If such indication exists, the recoverable amount of such asset is estimated. An impairment loss is recognized wherever the carrying amount of the asset exceeds its recoverable amount. Impairment losses are recognized in statement of profit or loss except for impairment loss on revalued assets, which is adjusted against the related revaluation surplus to the extent that the impairment loss does not exceed the surplus on revaluation of that asset.
2.22 Government grants Government grants are recognized when there is reasonable assurance that entity will comply
with the conditions attached to it and grant will be received. 2.23 Earnings per share The Company presents earnings per share (EPS) data for its ordinary shares. EPS is calculated
by dividing the profit or loss attributable to ordinary shareholders of the Company by the weighted average number of ordinary shares outstanding during the year.

ANNUAL REPORT 2019 149
2.24 Contingent assets Contingent assets are disclosed when the Company has a possible asset that arises from past
events and whose existence will only be confirmed by the occurrence or non-occurrence of one or more uncertain future events not wholly within the control of the Company. Contingent assets are not recognized until their realization becomes certain.
2.25 Contingent liabilities Contingent liability is disclosed when the Company has a possible obligation as a result of past
events whose existence will only be confirmed by the occurrence or non-occurrence of one or more uncertain future events not wholly within the control of the Company. Contingent liabilities are not recognized, only disclosed, unless the possibility of a future outflow of resources is considered remote. In the event that the outflow of resources associated with a contingent liability is assessed as probable, and if the size of the outflow can be reliably estimated, a provision is recognized in the financial statements.
2.26 Dividend and other appropriations Dividend distribution to the Company’s shareholders is recognized as a liability in the Company’s
financial statements in the period in which the dividends are declared and other appropriations are recognized in the period in which these are approved by the Board of Directors.
3. ISSUED, SUBSCRIBED AND PAID-UP SHARE CAPITAL 2019 2018 2019 2018 (Number of Shares) (Rupees in thousand)
1,596,672 1,596,672 Ordinary shares of Rupees 10 each allotted on reorganization of Kohinoor Industries Limited 15,967 15,967 26,156,000 26,156,000 Ordinary shares allotted under scheme of arrangement of merger of Part II of Maple Leaf Electric Company Limited 261,560 261,560 26,858,897 26,858,897 Ordinary shares allotted under scheme of arrangement of merger of Kohinoor Raiwind Mills Limited and Kohinoor Gujar Khan Mills Limited 268,589 268,589 75,502,560 75,502,560 Ordinary shares of Rupees 10 each issued as fully paid bonus shares 755,025 755,025 169,182,327 169,182,327 Ordinary shares of Rupees 10 each issued as fully paid in cash 1,691,823 1,691,823 299,296,456 299,296,456 2,992,964 2,992,964

KOHINOOR TEXTILE MILLS LIMITED150
2019 2018 Note (Rupees in thousand)4. RESERVES Composition of reserves is as follows: Capital reserves Share premium 4.1 986,077 986,077 Surplus on revaluation of freehold land and investment properties: Freehold land As at 01 July 2,579,452 2,558,861 Increase due to revaluation to fair value 11.1 - 20,591 As at 30 June 2,579,452 2,579,452 Investment properties 1,263,592 1,263,592 3,843,044 3,843,044 4,829,121 4,829,121 Revenue reserves General reserve 1,450,491 1,450,491 Unappropriated profit 7,694,239 6,548,050 9,144,730 7,998,541 13,973,851 12,827,662 4.1 This reserve can be utilized by the Company only for the purposes specified in section 81 of the
Companies Act, 2017. 2019 2018 Note (Rupees in thousand)
5. LONG TERM FINANCING From banking companies and other financial institutions - secured Long term loans 5.1 1,946,718 1,723,400 Less: Current portion shown under current liabilities 411,419 388,301 1,535,299 1,335,099

ANNUAL REPORT 2019 151
Askari Bank Limited
The Bank of Punjab
The Bank of Punjab
The Bank of Punjab
MCB Bank Limited
National Bank of Pakistan
National Bank of Pakistan
PAIR Investment Company Limited
Askari Bank Limited
25,000
277,310
391,915
54,006
131,928
452,772
163,500
214,973
235,314
1,946,718
75,000
426,380
142,605
-
184,875
417,989
-
209,859
266,692
1,723,400
150,000
600,000
400,000
500,000
350,000
500,000
218,000
300,000
350,000
3,368,000
Quarterly
-
-
-
-
-
-
-
-
Quarterly
Quarterly
Quarterly
Quarterly
Quarterly
Half yearly
Half yearly
Quarterly
Quarterly
3 Month KIBOR + 1.50%
SBP LTFF rate + 2.50%
SBP LTFF rate + 1%
SBP LTFF rate + 1%
SBP LTFF rate + 2.5%
SBP LTFF rate + 1.25%
SBP SOLAR LTFF rate +
1.25%
SBP LTFF rate + 1.5%
SBP LTFF rate + 1.25%
Twelve equal quarterly installments commenced from 28 February 2017 and ending on 30 November 2019.
Sixteen equal quarterly installments commenced from 09 September 2016 and ending on 07 November 2021.
Thirty six equal quarterly installments after expiry of grace period of one year for every tranche from its date of disbursement.
Twenty four equal quarterly installments after expiry of grace period of one year for every tranche from its date of disbursement.
Twenty four equal quarterly installments after expiry of grace period of one year commenced from 25 November 2015 and ending on 10 December 2021.
Twelve equal half yearly installments after expiry of grace period of one and a half year commenced from 30 June 2018 and ending on 10 February 2025.
Twelve equal half yearly installments after expiry of grace period of one and a half year commencing from 27 June 2020 and ending on 24 June 2026.
Twenty four equal quarterly installments after expiry of grace period of sixteen months commenced from 17 July 2018 and ending on 23 August 2025.
Thirty six equal quarterly installments commenced from 28 January 2018 and ending on 31 October 2026.
First joint pari passu hypothecation charge of Rupees 200 million on all present and future fixed assets (excluding land and building) of the Company and personal guarantees of the sponsor directors.
Joint pari passu charge amounting to Rupees 1,333 million (inclusive of 25% margin) on all the fixed assets (excluding land and building) of the Company.
Joint pari passu charge amounting to Rupees 1,333 million (inclusive of 25% margin) on all the fixed assets (excluding land and building) of the Company.
Ranking charge amounting to Rupees 667 million (inclusive of 25% margin) on all the fixed assets (excluding land and building) of the Company.
First pari passu charge over land and building of Raiwind Division amounting to Rupees 467 million, and plant and machinery of the Company and personal guarantees of the sponsor directors.
Joint pari passu charge amounting to Rupees 667 million (inclusive of 25% margin) over plant and machinery of the Company.
Ranking charge amounting to Rupees 291 million (inclusive of 25% margin) over plant and machinery of the Company.
Joint pari passu charge over fixed assets (excluding land and building) amounting to Rupees 400 million of Rawalpindi and Gujar Khan Divisions and personal guarantees of the sponsor directors.
First pari passu charge over land and building of Raiwind Division amounting to Rupees 467 million, and plant and machinery of the Company and personal guarantees of the sponsor directors.
LENDER 2019 2018 TOTALFACILITY
INTERESTREPRICING
INTERESTPAYABLE
RATE OFINTEREST PER
ANNUMNUMBER OF
INSTALLMENTSSECURITY
.....Rupees in thousand.....5.1 Long term loans
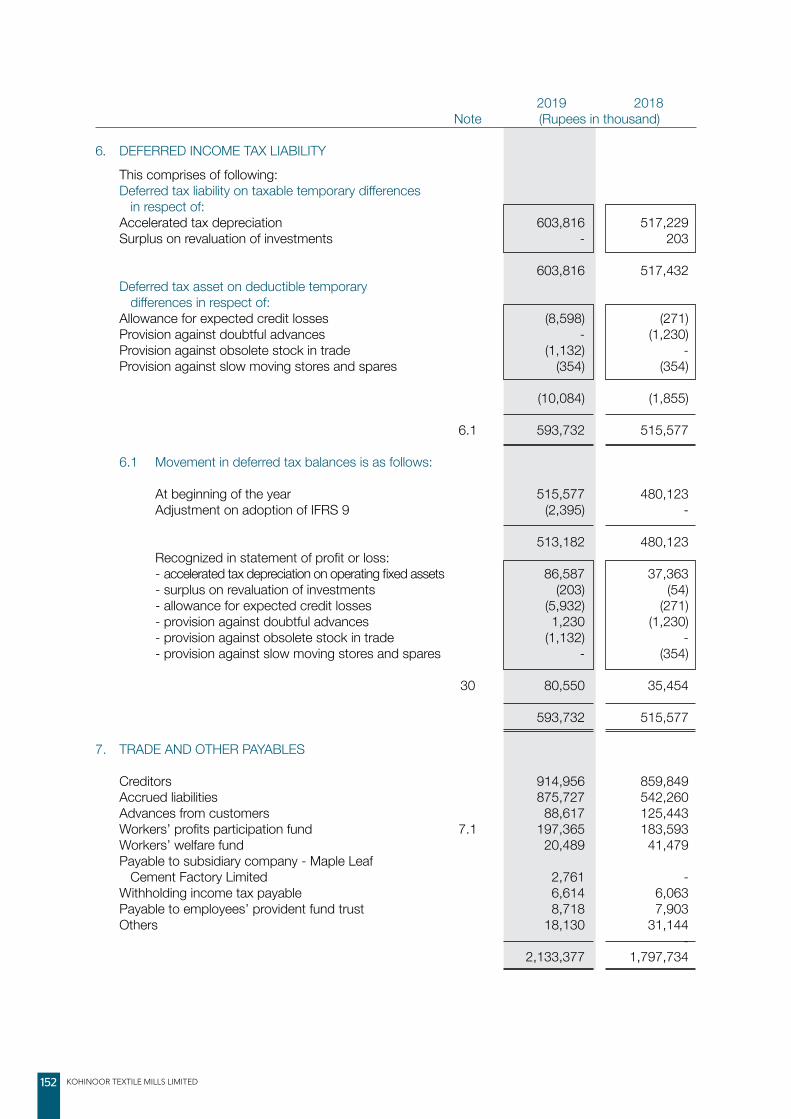
KOHINOOR TEXTILE MILLS LIMITED152
2019 2018 Note (Rupees in thousand)
6. DEFERRED INCOME TAX LIABILITY This comprises of following: Deferred tax liability on taxable temporary differences in respect of: Accelerated tax depreciation 603,816 517,229 Surplus on revaluation of investments - 203 603,816 517,432 Deferred tax asset on deductible temporary differences in respect of: Allowance for expected credit losses (8,598) (271) Provision against doubtful advances - (1,230) Provision against obsolete stock in trade (1,132) - Provision against slow moving stores and spares (354) (354) (10,084) (1,855) 6.1 593,732 515,577 6.1 Movement in deferred tax balances is as follows: At beginning of the year 515,577 480,123 Adjustment on adoption of IFRS 9 (2,395) - 513,182 480,123 Recognized in statement of profit or loss: - accelerated tax depreciation on operating fixed assets 86,587 37,363 - surplus on revaluation of investments (203) (54) - allowance for expected credit losses (5,932) (271) - provision against doubtful advances 1,230 (1,230) - provision against obsolete stock in trade (1,132) - - provision against slow moving stores and spares - (354) 30 80,550 35,454 593,732 515,577
7. TRADE AND OTHER PAYABLES Creditors 914,956 859,849 Accrued liabilities 875,727 542,260 Advances from customers 88,617 125,443 Workers’ profits participation fund 7.1 197,365 183,593 Workers’ welfare fund 20,489 41,479 Payable to subsidiary company - Maple Leaf Cement Factory Limited 2,761 - Withholding income tax payable 6,614 6,063 Payable to employees’ provident fund trust 8,718 7,903 Others 18,130 31,144 - 2,133,377 1,797,734

ANNUAL REPORT 2019 153
2019 2018 Note (Rupees in thousand)
7.1 Workers’ profits participation fund Balance as on 01 July 183,593 192,514 Interest for the period 29 9,896 27,132 Provision for the year 27 114,371 104,202 307,860 323,848 Less: Payments during the year (110,495) (140,255) 197,365 183,593 7.1.1 The Company retains workers’ profits participation fund for its business operations till the date of
allocation to workers. Interest is paid at prescribed rate under the Companies Profits (Workers’ Participation) Act, 1968 on funds utilized by the Company till the date of allocation to workers.
2019 2018 Note (Rupees in thousand)
8. ACCRUED MARK-UP
Long term loans 20,120 18,853 Short term borrowings: From banking companies 51,079 34,793 From Maple Leaf Capital Limited - subsidiary company 2,616 9,705 53,695 44,498 73,815 63,351 9. SHORT TERM BORROWINGS From banking companies - secured Short term running finances 9.1 & 9.2 640,023 803,676 Other short term finances 9.1 & 9.3 - 825,178 State Bank of Pakistan (SBP) refinances 9.1 & 9.4 2,501,500 2,575,000 3,141,523 4,203,854 From subsidiary company - unsecured Maple Leaf Capital Limited 9.5 - 431,530 3,141,523 4,635,384
9.1 These finances are obtained from banking companies under mark up arrangements and are secured by pledge of raw materials, charge on current assets of the Company including hypothecation of work-in-process, stores and spares, letters of credit, firm contracts, book debts and personal guarantees of the sponsor directors. These form part of total credit facilities of Rupees13,630 million (2018: Rupees 8,065 million).
9.2 The rates of mark-up range from 7.16% to 21.90% (2018: 7.09% to 8.92% ) per annum on
balance outstanding.

KOHINOOR TEXTILE MILLS LIMITED154
9.3 The rates of mark-up range from 7.92 % to 13.99% (2018: 2.50 % to 8.26%) per annum on balance outstanding.
9.4 The rate of mark-up is 3.0% (2018: 3.0%) per annum on balance outstanding. 9.5 During the year ended 30 June 2018, the Company obtained unsecured loan from Maple
Leaf Capital Limited carrying mark-up @ 1% above 3 month KIBOR and was repayable within one year from the date of disbursement. On 30 July 2018 the Company entered into a loan / advance agreement with Maple Leaf Capital Limited to meet working capital requirements of the Company upto the extent of Rupees 1,000 million carrying mark up at the rate of 2% above 3 month KIBOR. Tenure of this facility is one year from 16 August 2018 to 15 August 2019. The maximum aggregate amount outstanding at the end of any month during the year was Rupees 434 million (2018: Rupees 1,250 million).
10. CONTINGENCIES AND COMMITMENTS
10.1 Contingencies a) The Company filed an appeal before Appellate Tribunal Inland Revenue, Lahore for the tax year
2003 against order of Commissioner Inland Revenue (Appeals) (CIR(A)) dated 18 September 2008 passed under section 122 (5A) of the Income Tax Ordinance, 2001 wherein the order of the Assessing Officer creating demand of Rupees 20.780 million was upheld. In addition to above, another appeal for the tax year 2003 was filed by the tax department before Appellate Tribunal Inland Revenue against the order of CIR (A) passed under section 221, through which order of the assessing officer regarding disallowance of depreciation expense amounting to Rupees 62.666 million and penalty levied amounting to Rupees 17.484 million had been annulled. No provision has been made in these financial statements as the Company is hopeful of favorable outcome of these cases.
b) The Company filed an appeal before Appellate Tribunal Inland Revenue, Lahore for the tax
year 2004. The loss for the tax year 2004 was assessed at Rupees 255.684 million reducing refund to Rupees 7.499 million vide order dated 22 May 2009. The matter was decided in favor of the Company. However, department filed an appeal in the Honorable Lahore High Court, Lahore against the decision. No provision has been made in these financial statements since the Company is confident about favorable outcome of the case.
c) Tax department filed an appeal before Appellate Tribunal Inland Revenue against the order of
Commissioner Inland Revenue (Appeals) dated 13 May 2015, by which the demand amounting to Rupees 54.010 million created by assessing officer under section 122(5A) of the Income Tax Ordinance, 2001 for the tax year 2009 was annulled. No provision has been made in these financial statements as the Company is hopeful of a favorable outcome.
d) Tax department filed an appeal before Appellate Tribunal Inland Revenue against the order
of Commissioner Inland Revenue (Appeals) dated 06 September 2014, by which the demand amounting to Rupees 22.110 million created by assessing officer under section 122(5A) of the Income Tax Ordinance, 2001 for the tax year 2010 was annulled. No provision has been made in these financial statements as the Company is hopeful of a favorable outcome.
e) The Company filed income tax return for the tax year 2011 having tax loss amounting to
Rupees 957.623 million and creating a refund of Rupees 107.808 million. An assessment dated 12 May 2017 under section 122(5A) of the Income Tax Ordinance, 2001 has been finalized by restricting loss to Rupees 435.435 million and reducing refund to Rupees Nil. The Company has filed an appeal before Commissioner Inland Revenue (Appeals) which is pending for hearing. No provision has been made in these financial statements as the Company is hopeful of a favorable outcome.

ANNUAL REPORT 2019 155
f) The Company filed income tax return for Tax Year 2016 having taxable income amounting to Rupees 762.669 million and creating a refund of Rupees 30.721 million. An assessment under section 122(5A) of the Income Tax Ordinance, 2001 dated 31 May 2018 has been finalized and taxable income has been assessed at Rupees 1,167.832 million by creating demand of Rupees 231.109 million. The Company filed an appeal before Commissioner Inland Revenue (Appeals) who, vide its order dated 14 November 2018, granted relief on major issues, while upheld the order on various other issues. The Company filed appeal before the Honorable Appellate Tribunal Inland Revenue where the case is still pending. No provision has been made in these financial statements as the Company is hopeful of a favorable outcome.
g) The Company and tax authorities filed appeals before different appellate authorities regarding
sales tax and custom duty matters. Pending the outcome of appeals filed by the Company and tax authorities, no provision has been made in these financial statements which on the basis adopted by the authorities would amount to Rupees 184.700 million (2018: Rupees 87.996 million), since the Company has strong grounds against the assessments framed by the relevant authorities.
h) The Company filed recovery suits in Civil Courts amounting to Rupees 14.683 million
(2018: Rupees 15.164 million) against various suppliers and customers for goods supplied by / to them. Pending the outcome of the cases, no provision has been made in these financial statements since the Company is confident about favorable outcome of the cases.
i) The Company filed suits before Civil Court, Rawalpindi and Lahore High Court, against
demands raised by Sui Northern Gas Pipelines Limited (SNGPL) amounting to Rupees 84.057 million (2018: Rupees 72.811 million). No provision has been made in these financial statements, since the Company is confident about favorable outcome.
j) The Company filed an appeal before Supreme Court of Pakistan against an order of Lahore High
Court, Rawalpindi Bench on an appeal filed by supplier for non-payment by the Company. The Company has provided a guarantee of Rupees 4.254 million on the directions of Supreme Court of Pakistan. Appeal is pending adjudication and the Company expects a favorable outcome.
k) Guarantees issued by various commercial banks, in respect of financial and operational
obligations of the Company, to various institutions and corporate bodies aggregate to Rupees 299.257 million (2018: Rupees 279.257 million).
10.2 Commitments in respect of: a) Letters of credit for capital expenditure amounting to Rupees 91.627 mi l l ion
(2018: Rupees 111.231 million). b) Letters of credit other than for capital expenditure amounting to Rupees 707.031 million
(2018: Rupees 156.753 million). c) Con t rac ts f o r cap i t a l expend i tu re amoun t i ng to Rupees 54 .550 m i l l i on
(2018: Rupees 6.661 million). d) Future contracts - shares in respect of which the settlement is outstanding amounting to
Rupees Nil (2018: Rupees 181.745 million).
2019 2018 (Rupees in thousand) 11. PROPERTY, PLANT AND EQUIPMENT Operating fixed assets - owned assets (Note 11.1) 8,831,769 8,367,262 Capital work-in-progress (Note 11.2) 75,801 211,451
8,907,570 8,578,713
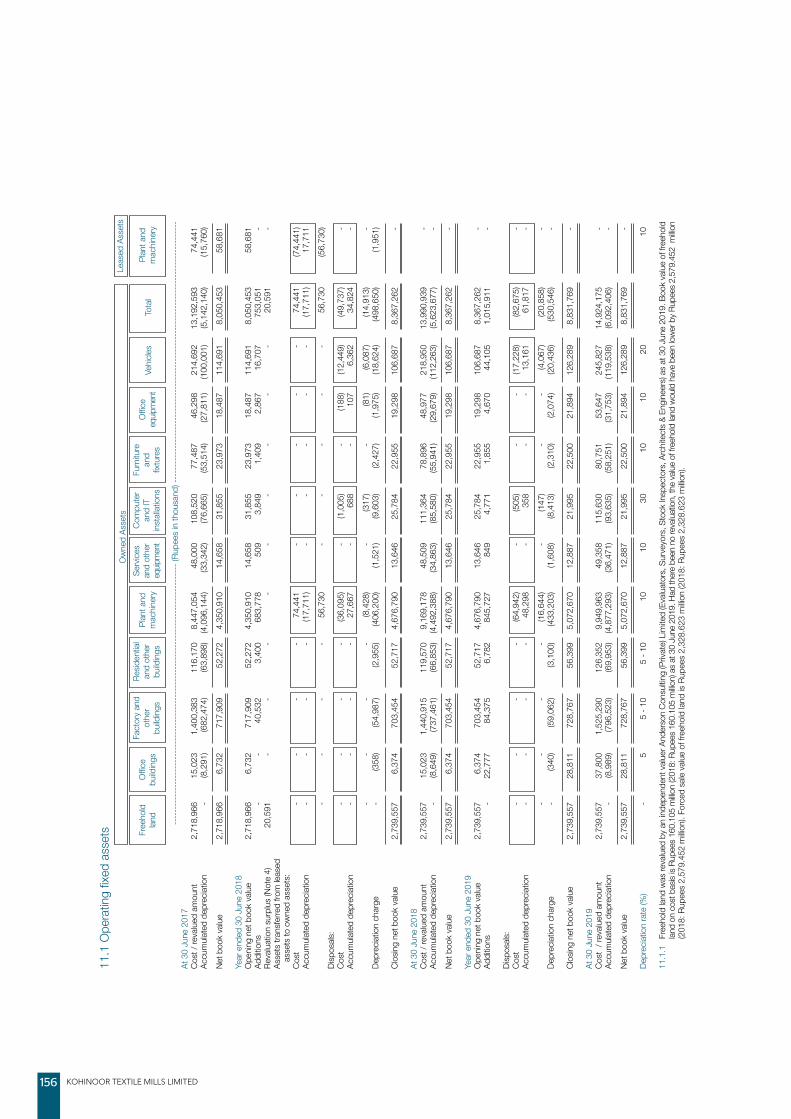
KOHINOOR TEXTILE MILLS LIMITED156
O
wne
d As
sets
Le
ased
Ass
ets
Free
hold
O
ffice
Fact
ory
and
Resid
entia
l Pl
ant a
nd
Serv
ices
Com
pute
r Fu
rnitu
re
Offic
e Ve
hicle
s To
tal
Plan
t and
land
build
ings
ot
her
and
othe
r m
achi
nery
an
d ot
her
and
IT
and
equip
men
t
m
achi
nery
bu
ildin
gs
build
ings
equip
men
t in
stall
atio
ns
fixtu
res
--
----
----
----
----
----
----
----
----
----
----
----
----
----
----
----
----
----
----
----
----
-- (R
upee
s in
thou
sand
) ---
----
----
----
----
----
----
----
----
----
----
----
----
----
----
----
----
----
----
----
----
- At
30
June
201
7
Cost
/ re
valu
ed a
mou
nt
2,7
18,9
66
15,
023
1
,400
,383
1
16,1
70
8,4
47,0
54
48,
000
1
08,5
20
77,
487
4
6,29
8
214
,692
1
3,19
2,59
3
74,
441
Accu
mul
ated
dep
recia
tion
-
(8,2
91)
(682
,474
) (6
3,89
8)
(4,0
96,1
44)
(33,
342)
(7
6,66
5)
(53,
514)
(2
7,81
1)
(100
,001
) (5
,142
,140
) (1
5,76
0)
Net b
ook
valu
e 2
,718
,966
6
,732
7
17,9
09
52,
272
4
,350
,910
1
4,65
8
31,
855
2
3,97
3
18,
487
1
14,6
91
8,0
50,4
53
58,
681
Year
end
ed 3
0 Ju
ne 2
018
O
peni
ng n
et b
ook
valu
e
2,7
18,9
66
6,7
32
717
,909
5
2,27
2
4,3
50,9
10
14,
658
3
1,85
5
23,
973
1
8,48
7
114
,691
8
,050
,453
5
8,68
1 Ad
ditio
ns
-
-
40,
532
3
,400
6
83,7
78
509
3
,849
1
,409
2
,867
1
6,70
7
753
,051
-
Re
valu
atio
n su
rplu
s (N
ote
4)
20,
591
-
-
-
-
-
-
-
-
-
2
0,59
1
-
Asse
ts tr
ansf
erre
d fro
m le
ased
asse
ts to
ow
ned
asse
ts:
Co
st
-
-
-
-
74,
441
-
-
-
-
-
7
4,44
1
(74,
441)
Accu
mul
ated
dep
recia
tion
-
-
-
-
(17,
711)
-
-
-
-
-
(1
7,71
1)
17,
711
-
-
-
-
5
6,73
0
-
-
-
-
-
56,
730
(5
6,73
0)Di
spos
als:
Co
st
-
-
-
-
(36,
095)
-
(1
,005
) -
(1
88)
(12,
449)
(4
9,73
7)
-
Accu
mul
ated
dep
recia
tion
-
-
-
-
27,
667
-
6
88
-
107
6
,362
3
4,82
4
-
-
-
-
-
(8
,428
) -
(3
17)
-
(81)
(6
,087
) (1
4,91
3)
-
Depr
eciat
ion
char
ge
-
(358
) (5
4,98
7)
(2,9
55)
(406
,200
) (1
,521
) (9
,603
) (2
,427
) (1
,975
) (1
8,62
4)
(498
,650
) (1
,951
)
Clos
ing
net b
ook
valu
e
2,7
39,5
57
6,3
74
703
,454
5
2,71
7
4,6
76,7
90
13,
646
2
5,78
4
22,
955
1
9,29
8
106
,687
8
,367
,262
-
At 3
0 Ju
ne 2
018
Co
st /
reva
lued
am
ount
2
,739
,557
1
5,02
3
1,4
40,9
15
119
,570
9
,169
,178
4
8,50
9
111
,364
7
8,89
6
48,
977
2
18,9
50
13,
990,
939
-
Ac
cum
ulat
ed d
epre
ciatio
n -
(8
,649
) (7
37,4
61)
(66,
853)
(4
,492
,388
) (3
4,86
3)
(85,
580)
(5
5,94
1)
(29,
679)
(1
12,2
63)
(5,6
23,6
77)
-
Net b
ook
valu
e 2
,739
,557
6
,374
7
03,4
54
52,
717
4
,676
,790
1
3,64
6
25,
784
2
2,95
5
19,
298
1
06,6
87
8,3
67,2
62
-
Year
end
ed 3
0 Ju
ne 2
019
O
peni
ng n
et b
ook
valu
e
2,7
39,5
57
6,3
74
703
,454
5
2,71
7
4,6
76,7
90
13,
646
2
5,78
4
22,
955
1
9,29
8
106
,687
8
,367
,262
-
Ad
ditio
ns
-
22,
777
8
4,37
5
6,7
82
845
,727
8
49
4,7
71
1,8
55
4,6
70
44,
105
1
,015
,911
-
Di
spos
als:
Co
st
-
-
-
-
(64,
942)
-
(5
05)
-
-
(17,
228)
(8
2,67
5)
-
Accu
mul
ated
dep
recia
tion
-
-
-
-
48,
298
-
3
58
-
-
13,
161
6
1,81
7
-
-
-
-
-
(1
6,64
4)
-
(147
) -
-
(4
,067
) (2
0,85
8)
-
Depr
eciat
ion
char
ge
-
(340
) (5
9,06
2)
(3,1
00)
(433
,203
) (1
,608
) (8
,413
) (2
,310
) (2
,074
) (2
0,43
6)
(530
,546
) -
Clos
ing
net b
ook
valu
e
2,7
39,5
57
28,
811
7
28,7
67
56,
399
5
,072
,670
1
2,88
7
21,
995
2
2,50
0
21,
894
1
26,2
89
8,8
31,7
69
-
At 3
0 Ju
ne 2
019
Co
st /
reva
lued
am
ount
2
,739
,557
3
7,80
0
1,5
25,2
90
126
,352
9
,949
,963
4
9,35
8
115
,630
8
0,75
1
53,
647
2
45,8
27
14,
924,
175
-
Ac
cum
ulat
ed d
epre
ciatio
n -
(8
,989
) (7
96,5
23)
(69,
953)
(4
,877
,293
) (3
6,47
1)
(93,
635)
(5
8,25
1)
(31,
753)
(1
19,5
38)
(6,0
92,4
06)
-
Net b
ook
valu
e 2
,739
,557
2
8,81
1
728
,767
5
6,39
9
5,0
72,6
70
12,
887
2
1,99
5
22,
500
2
1,89
4
126
,289
8
,831
,769
-
De
prec
iatio
n ra
te (%
) -
5
5
- 10
5
- 10
1
0
10
3
0
10
1
0
20
10
11
.1.1
Fr
eeho
ld la
nd w
as re
valu
ed b
y an
inde
pend
ent v
aluer
And
erso
n Co
nsul
ting
(Priv
ate)
Lim
ited
(Eva
luat
ors,
Sur
veyo
rs, S
tock
Insp
ecto
rs, A
rchi
tect
s &
Engi
neer
s) a
s at
30
June
201
9. B
ook
valu
e of
free
hold
lan
d on
cos
t bas
is is
Rupe
es 1
60.1
05 m
illion
(201
8: R
upee
s 16
0.10
5 m
illion)
as
at 3
0 Ju
ne 2
019.
Had
ther
e be
en n
o re
valua
tion,
the
value
of f
reeh
old la
nd w
ould
hav
e be
en lo
wer
by R
upee
s 2,
579.
452
millio
n (2
018:
Rup
ees
2,57
9.45
2 m
illion
). Fo
rced
sale
valu
e of
free
hold
land
is R
upee
s 2,
328.
623
milli
on (2
018:
Rup
ees
2,32
8.62
3 m
illion
).
11.1
Ope
ratin
g fix
ed a
sset
s

ANNUAL REPORT 2019 157
11.1
.2
Det
ail o
f ope
ratin
g fix
ed a
sset
s, e
xcee
ding
the
book
valu
e of
Rup
ees
500,
000
disp
osed
of d
urin
g th
e ye
ar is
as
follo
ws:
Desc
riptio
n
Accu
mul
ated
N
et b
ook
S
ale
Gain
/ M
ode
of
Pa
rticu
lars
of p
urch
aser
s
Cost
de
prec
iatio
n
valu
e pr
ocee
ds
(Los
s)
disp
osal
--
----
----
----
- (Rup
ees
in th
ousa
nd) -
----
----
----
--Pl
ant a
nd M
achi
nery
Sing
eing
mac
hine
Poo
ng
6,4
24
5,4
94
930
6
93
(237
) Ne
gotia
tion
Met
allic
Engi
neer
ing
and
Serv
ices,
Tha
tha
Khud
ayar
Mac
hine
car
ding
cro
srol
4
,148
3
,639
5
09
2,8
40
2,3
31
Nego
tiatio
n Ly
allpu
r Tex
tiles,
Fais
alaba
dAu
toco
ne w
inde
r 1
0,78
9
8,2
74
2,5
15
3,3
60
845
Ne
gotia
tion
HAR
Text
ile M
ills, F
aisala
bad
Mac
hine
aut
ocon
e m
urat
ec
34,
856
2
4,20
1
10,
655
1
8,00
0
7,3
45
Nego
tiatio
n Co
lony
Tex
tile M
ills L
imite
d, M
ulta
nCo
oper
com
pres
sor
2,5
00
1,2
27
1,2
73
1,2
88
15
In
sura
nce
claim
EF
U G
ener
al In
sura
nce
Lim
ited,
Lah
ore
58,
717
4
2,83
5
15,
882
2
6,18
1
10,
299
Ve
hicle
s
Hond
a Ci
vic (R
IA-1
319)
1
,950
1
,439
5
11
1,1
15
604
Ne
gotia
tion
Mr.
Zahi
d Id
rees
, Raw
alpin
diHo
nda
City
(LEE
-12-
8136
) 1
,675
1
,158
5
17
909
3
92
Nego
tiatio
n M
r. Sh
ahid
Far
ooq
(em
ploy
ee),
Laho
re
3
,625
2
,597
1
,028
2
,024
9
96
Ag
greg
ate
of o
ther
item
s of
op
erat
ing
fixed
ass
ets
with
in
divid
ual b
ook
valu
es n
ot
exce
edin
g Ru
pees
500
,000
2
0,33
3
16,
385
3
,948
1
3,54
7
9,5
99
Nego
tiatio
n
82,
675
6
1,81
7
20,
858
4
1,75
2
20,
894
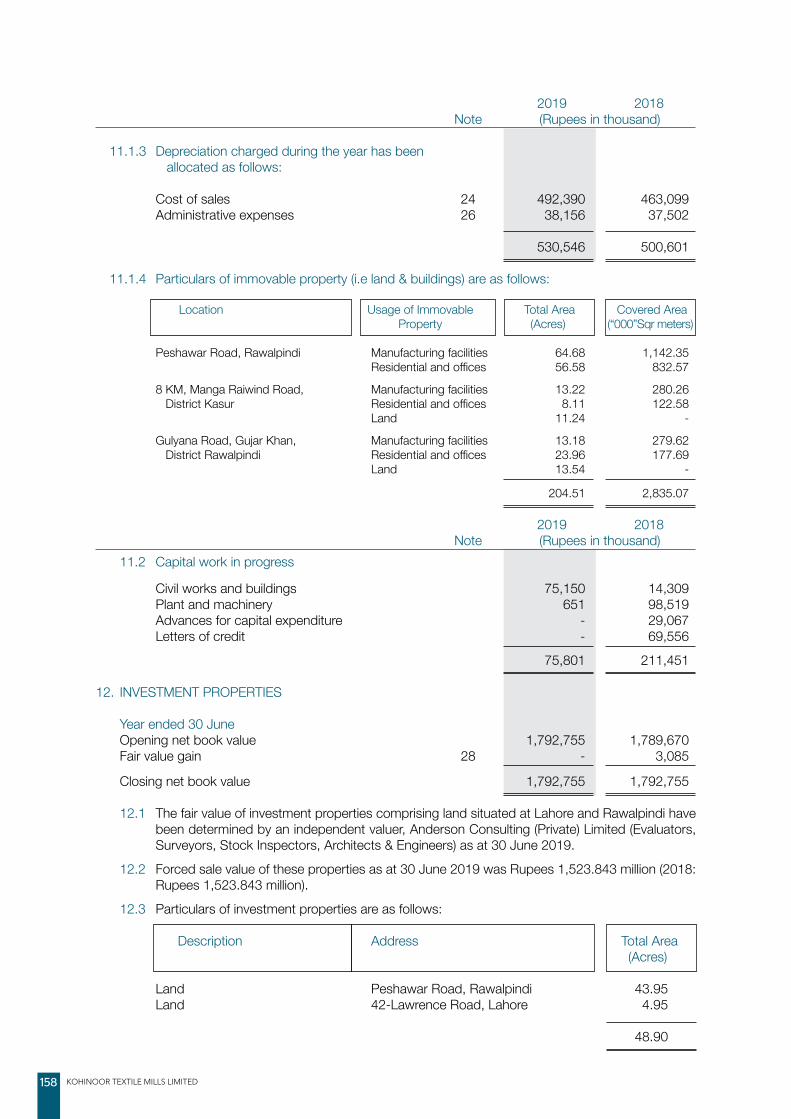
KOHINOOR TEXTILE MILLS LIMITED158
2019 2018 Note (Rupees in thousand)
11.1.3 Depreciation charged during the year has been allocated as follows: Cost of sales 24 492,390 463,099 Administrative expenses 26 38,156 37,502 530,546 500,601 11.1.4 Particulars of immovable property (i.e land & buildings) are as follows: Location Usage of Immovable Total Area Covered Area Property (Acres) (“000”Sqr meters) Peshawar Road, Rawalpindi Manufacturing facilities 64.68 1,142.35 Residential and offices 56.58 832.57 8 KM, Manga Raiwind Road, Manufacturing facilities 13.22 280.26 District Kasur Residential and offices 8.11 122.58 Land 11.24 - Gulyana Road, Gujar Khan, Manufacturing facilities 13.18 279.62 District Rawalpindi Residential and offices 23.96 177.69 Land 13.54 - 204.51 2,835.07
2019 2018 Note (Rupees in thousand) 11.2 Capital work in progress Civil works and buildings 75,150 14,309 Plant and machinery 651 98,519 Advances for capital expenditure - 29,067 Letters of credit - 69,556 75,801 211,451
12. INVESTMENT PROPERTIES
Year ended 30 June Opening net book value 1,792,755 1,789,670 Fair value gain 28 - 3,085 Closing net book value 1,792,755 1,792,755 12.1 The fair value of investment properties comprising land situated at Lahore and Rawalpindi have
been determined by an independent valuer, Anderson Consulting (Private) Limited (Evaluators, Surveyors, Stock Inspectors, Architects & Engineers) as at 30 June 2019.
12.2 Forced sale value of these properties as at 30 June 2019 was Rupees 1,523.843 million (2018: Rupees 1,523.843 million).
12.3 Particulars of investment properties are as follows:
Description Address Total Area (Acres) Land Peshawar Road, Rawalpindi 43.95 Land 42-Lawrence Road, Lahore 4.95
48.90
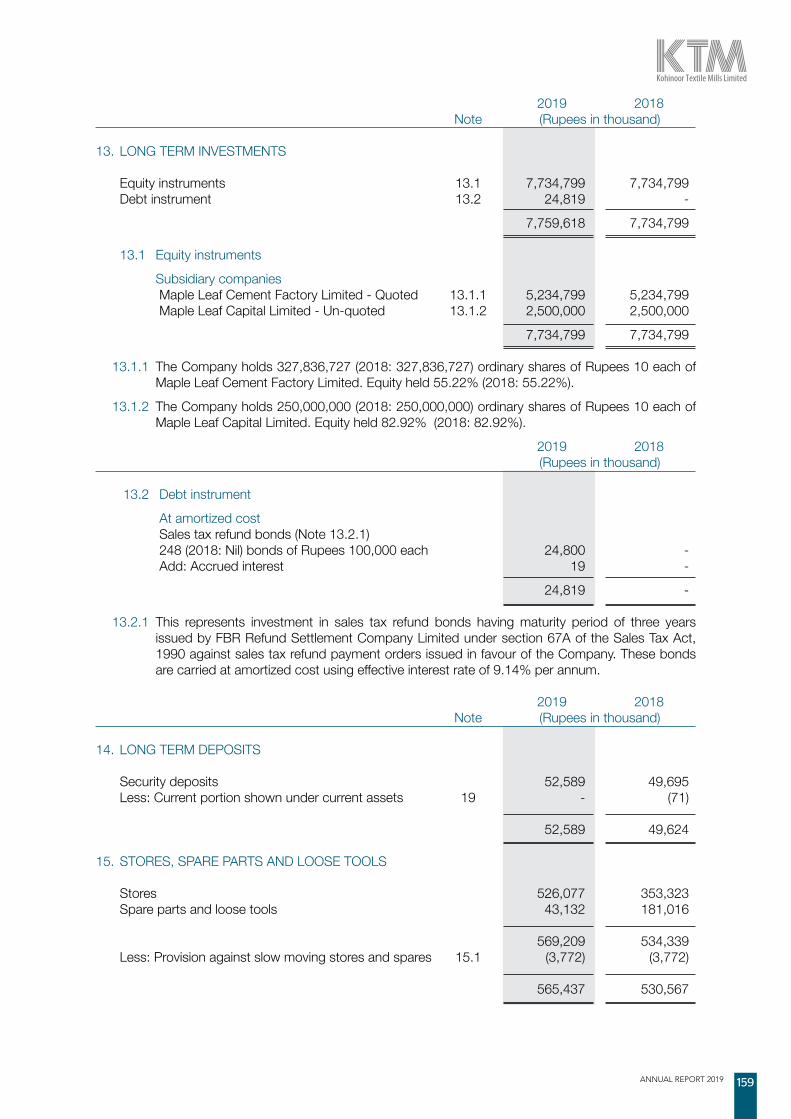
ANNUAL REPORT 2019 159
2019 2018 Note (Rupees in thousand)
13. LONG TERM INVESTMENTS Equity instruments 13.1 7,734,799 7,734,799 Debt instrument 13.2 24,819 - 7,759,618 7,734,799
13.1 Equity instruments Subsidiary companies Maple Leaf Cement Factory Limited - Quoted 13.1.1 5,234,799 5,234,799 Maple Leaf Capital Limited - Un-quoted 13.1.2 2,500,000 2,500,000 7,734,799 7,734,799 13.1.1 The Company holds 327,836,727 (2018: 327,836,727) ordinary shares of Rupees 10 each of
Maple Leaf Cement Factory Limited. Equity held 55.22% (2018: 55.22%). 13.1.2 The Company holds 250,000,000 (2018: 250,000,000) ordinary shares of Rupees 10 each of
Maple Leaf Capital Limited. Equity held 82.92% (2018: 82.92%). 2019 2018 (Rupees in thousand)
13.2 Debt instrument At amortized cost Sales tax refund bonds (Note 13.2.1) 248 (2018: Nil) bonds of Rupees 100,000 each 24,800 - Add: Accrued interest 19 - 24,819 - 13.2.1 This represents investment in sales tax refund bonds having maturity period of three years
issued by FBR Refund Settlement Company Limited under section 67A of the Sales Tax Act, 1990 against sales tax refund payment orders issued in favour of the Company. These bonds are carried at amortized cost using effective interest rate of 9.14% per annum.
2019 2018 Note (Rupees in thousand)
14. LONG TERM DEPOSITS Security deposits 52,589 49,695 Less: Current portion shown under current assets 19 - (71) 52,589 49,624 15. STORES, SPARE PARTS AND LOOSE TOOLS Stores 526,077 353,323 Spare parts and loose tools 43,132 181,016 569,209 534,339 Less: Provision against slow moving stores and spares 15.1 (3,772) (3,772) 565,437 530,567

KOHINOOR TEXTILE MILLS LIMITED160
2019 2018 Note (Rupees in thousand)
15.1 Provision against slow moving stores and spares As at 01 July 3,772 2,552 Add: Provision for the year 27 - 1,220 As at 30 June 3,772 3,772
16. STOCK-IN-TRADE Raw materials 16.1 2,277,487 1,430,755 Work-in-process 800,016 597,872 Finished goods 16.4 740,748 546,211 3,818,251 2,574,838 Less: Provision against obsolete stock in trade 16.5 3,904 - 3,814,347 2,574,838 16.1 Raw materials include stock in transit of Rupees 22.631 million (2018: Rupees 270.613 million). 16.2 Stock in trade of Rupees 89.737 million (2018: Rupees 45.678 million) is being carried at net
realizable value. 16.3 Stock in trade includes stock of Rupees 75.628 million (2018: Rupees 41.245 million) with
external parties for processing. 16.4 Finished goods include stock in transit of Rupees 36.272 million (2018: Rupees Nil).
2019 2018 Note (Rupees in thousand) 16.5 Provision against obsolete stock in trade As at 01 July - - Add: Provision for the year 27 3,904 - As at 30 June 3,904 -
17. TRADE DEBTS Considered good: Secured (against letters of credit) 478,253 513,156 Unsecured 1,006,512 1,186,791 1,484,765 1,699,947 Less: Allowance for expected credit losses 17.1 (29,646) (932) 1,455,119 1,699,015

ANNUAL REPORT 2019 161
2019 2018 Note (Rupees in thousand)
17.1 Allowance for expected credit losses Opening balance under IAS 39 932 - Effect of change in accounting policy due to adoption of IFRS 9 8,258 - Opening balance under IFRS 9 9,190 -
Recognized during the year 27 21,388 932 Bad debts written off during the year (932) - Balance at end of year 29,646 932 17.2 As at 30 June 2019, trade debts of Rupees 626.130 million (2018: Rupees 1,226.847 million)
were past due but not impaired. These relate to a number of independent customers from whom there is no recent history of default. The ageing analysis of these trade debts is as follows:
2019 2018 Note (Rupees in thousand) Upto 1 month 284,857 815,924 1 to 6 months 337,964 364,682 More than 6 months 3,309 46,241 626,130 1,226,847
18. ADVANCES Considered good: Employees - interest free - Executives 3,244 74 - Other employees 2,836 1,809 6,080 1,883 Advances to suppliers 345,265 180,706 Letters of credit 18,926 540,008 370,271 722,597 Less: Provision against doubtful advances 18.1 - 4,243 370,271 718,354
18.1 Movement in provision against doubtful advances As at 01 July 4,243 - Add: Provision for the year 27 - 4,243 Less: Written off during the year (4,243) - As at 30 June - 4,243
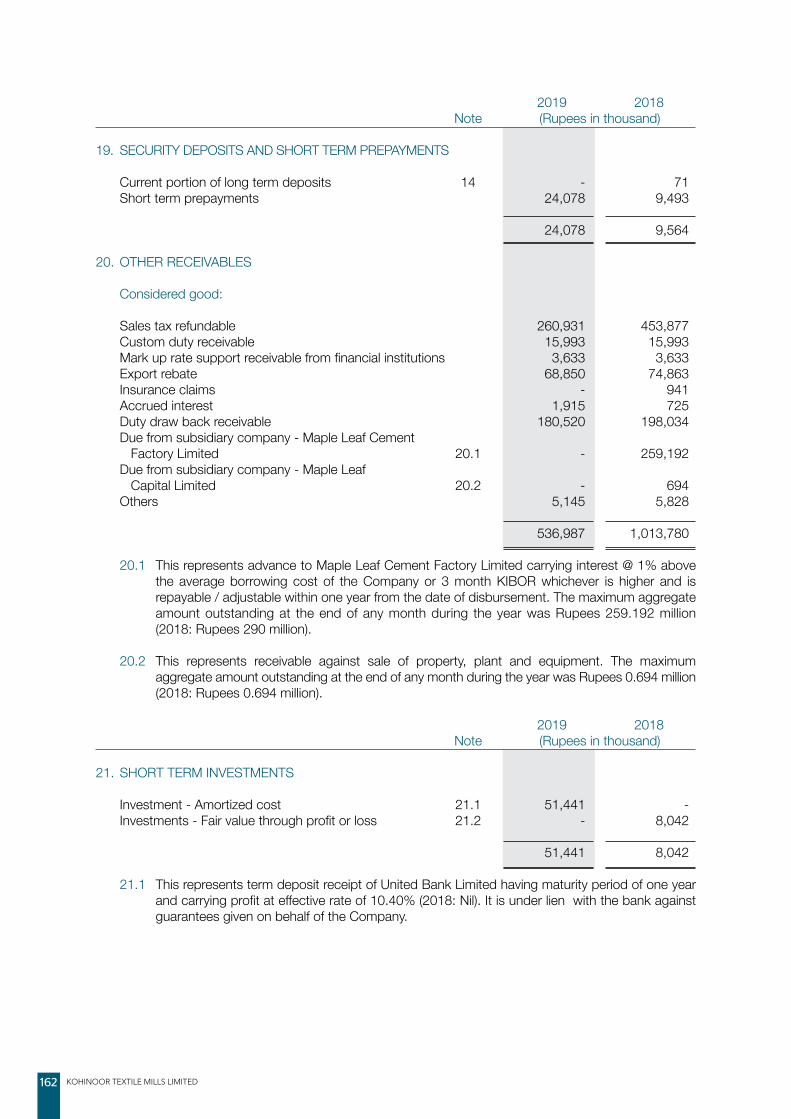
KOHINOOR TEXTILE MILLS LIMITED162
2019 2018 Note (Rupees in thousand)
19. SECURITY DEPOSITS AND SHORT TERM PREPAYMENTS Current portion of long term deposits 14 - 71 Short term prepayments 24,078 9,493 24,078 9,564 20. OTHER RECEIVABLES Considered good: Sales tax refundable 260,931 453,877 Custom duty receivable 15,993 15,993 Mark up rate support receivable from financial institutions 3,633 3,633 Export rebate 68,850 74,863 Insurance claims - 941 Accrued interest 1,915 725 Duty draw back receivable 180,520 198,034 Due from subsidiary company - Maple Leaf Cement Factory Limited 20.1 - 259,192 Due from subsidiary company - Maple Leaf Capital Limited 20.2 - 694 Others 5,145 5,828 536,987 1,013,780 20.1 This represents advance to Maple Leaf Cement Factory Limited carrying interest @ 1% above
the average borrowing cost of the Company or 3 month KIBOR whichever is higher and is repayable / adjustable within one year from the date of disbursement. The maximum aggregate amount outstanding at the end of any month during the year was Rupees 259.192 million (2018: Rupees 290 million).
20.2 This represents receivable against sale of property, plant and equipment. The maximum aggregate amount outstanding at the end of any month during the year was Rupees 0.694 million (2018: Rupees 0.694 million).
2019 2018 Note (Rupees in thousand)
21. SHORT TERM INVESTMENTS Investment - Amortized cost 21.1 51,441 - Investments - Fair value through profit or loss 21.2 - 8,042 51,441 8,042 21.1 This represents term deposit receipt of United Bank Limited having maturity period of one year
and carrying profit at effective rate of 10.40% (2018: Nil). It is under lien with the bank against guarantees given on behalf of the Company.
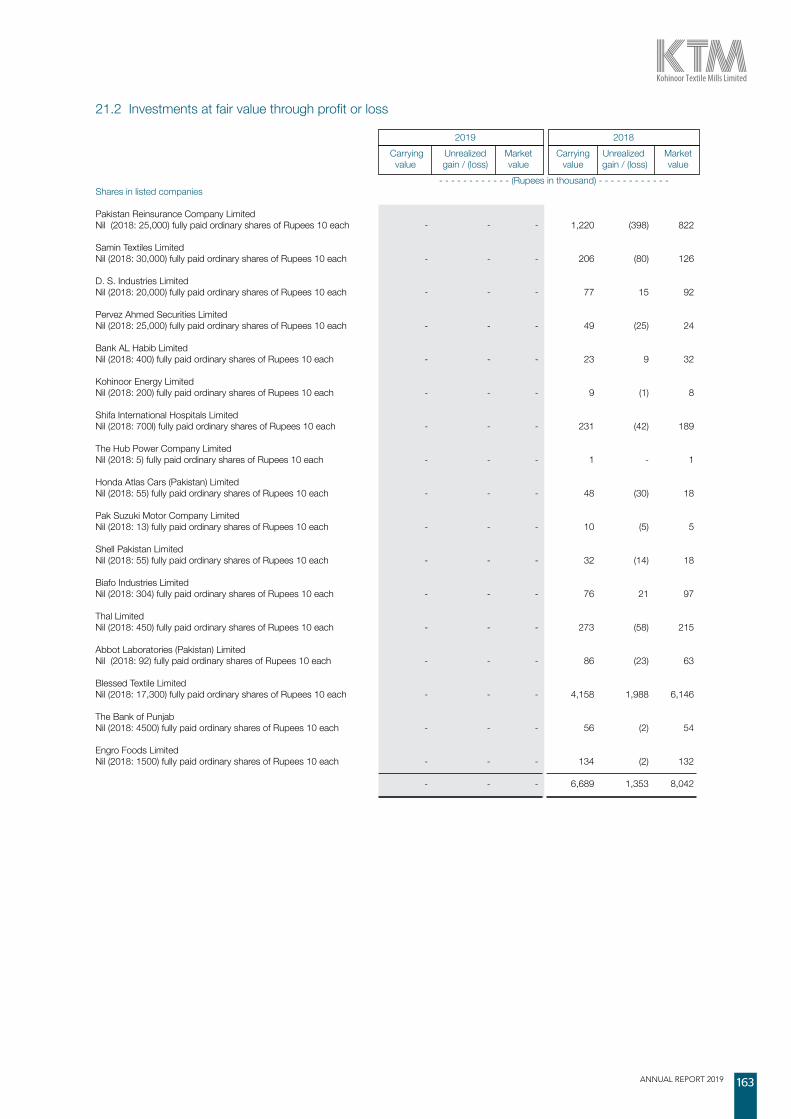
ANNUAL REPORT 2019 163
21.2 Investments at fair value through profit or loss 2019 2018 Carrying Unrealized Market Carrying Unrealized Market value gain / (loss) value value gain / (loss) value - - - - - - - - - - - - (Rupees in thousand) - - - - - - - - - - - -Shares in listed companies Pakistan Reinsurance Company LimitedNil (2018: 25,000) fully paid ordinary shares of Rupees 10 each - - - 1,220 (398) 822 Samin Textiles LimitedNil (2018: 30,000) fully paid ordinary shares of Rupees 10 each - - - 206 (80) 126 D. S. Industries LimitedNil (2018: 20,000) fully paid ordinary shares of Rupees 10 each - - - 77 15 92 Pervez Ahmed Securities LimitedNil (2018: 25,000) fully paid ordinary shares of Rupees 10 each - - - 49 (25) 24 Bank AL Habib LimitedNil (2018: 400) fully paid ordinary shares of Rupees 10 each - - - 23 9 32 Kohinoor Energy LimitedNil (2018: 200) fully paid ordinary shares of Rupees 10 each - - - 9 (1) 8 Shifa International Hospitals LimitedNil (2018: 700l) fully paid ordinary shares of Rupees 10 each - - - 231 (42) 189 The Hub Power Company LimitedNil (2018: 5) fully paid ordinary shares of Rupees 10 each - - - 1 - 1 Honda Atlas Cars (Pakistan) Limited Nil (2018: 55) fully paid ordinary shares of Rupees 10 each - - - 48 (30) 18 Pak Suzuki Motor Company LimitedNil (2018: 13) fully paid ordinary shares of Rupees 10 each - - - 10 (5) 5 Shell Pakistan LimitedNil (2018: 55) fully paid ordinary shares of Rupees 10 each - - - 32 (14) 18 Biafo Industries LimitedNil (2018: 304) fully paid ordinary shares of Rupees 10 each - - - 76 21 97 Thal LimitedNil (2018: 450) fully paid ordinary shares of Rupees 10 each - - - 273 (58) 215 Abbot Laboratories (Pakistan) LimitedNil (2018: 92) fully paid ordinary shares of Rupees 10 each - - - 86 (23) 63 Blessed Textile LimitedNil (2018: 17,300) fully paid ordinary shares of Rupees 10 each - - - 4,158 1,988 6,146 The Bank of PunjabNil (2018: 4500) fully paid ordinary shares of Rupees 10 each - - - 56 (2) 54 Engro Foods LimitedNil (2018: 1500) fully paid ordinary shares of Rupees 10 each - - - 134 (2) 132 - - - 6,689 1,353 8,042

KOHINOOR TEXTILE MILLS LIMITED164
2019 2018 Note (Rupees in thousand)
22. CASH AND BANK BALANCES Cash in hand 15,237 1,898 Cash at bank: - On current accounts 67,932 85,145 - On saving accounts 22.1 133,197 74,862 201,129 160,007 216,366 161,905
22.1 The balances in saving accounts carry rate of profit ranging from 0.16% to 5.85% (2018: 0.16% to 5.75 %) per annum.
22.2 The balances in current and saving accounts include USD 58,222 (2018: USD 57,087).
2019 2018 Note (Rupees in thousand)
23. REVENUE Export sales 6,954,870 6,334,385 Local sales 23.1 14,127,004 11,285,473 Export rebate 46,550 40,074 Duty draw back 91,711 173,608 21,220,135 17,833,540
23.1 Local sales 14,176,460 11,332,294 Less: Sales tax 49,456 46,821 14,127,004 11,285,473
24. COST OF SALES Raw materials consumed 24.1 11,592,064 9,452,232 Salaries, wages and other benefits 24.2 1,551,377 1,481,034 Processing charges 37,113 26,232 Stores, spare parts and loose tools consumed 1,241,406 1,140,938 Packing materials consumed 503,698 498,291 Fuel and power 2,383,419 2,003,884 Repair and maintenance 160,200 175,235 Insurance 32,102 31,756 Other factory overheads 61,975 58,709 Depreciation 11.1.3 492,390 463,099 18,055,744 15,331,410 Work-in-process Opening stock 597,872 575,961 Closing stock (800,016) (597,872) (202,144) (21,911) Cost of goods manufactured 17,853,600 15,309,499 Finished goods Opening stock 546,211 592,500 Closing stock (740,748) (546,211) (194,537) 46,289 Cost of sales 17,659,063 15,355,788

ANNUAL REPORT 2019 165
2019 2018 (Rupees in thousand) 24.1 Raw materials consumed Opening stock 1,430,755 841,118 Add: Purchased during the year 12,438,796 10,041,869 13,869,551 10,882,987 Less: Closing stock (2,277,487) (1,430,755) 11,592,064 9,452,232 24.2 Salaries, wages and other benefits include provident fund contribution of Rupees 40.170 million
(2018: Rupees 38.455 million) by the Company.
2019 2018 Note (Rupees in thousand)
25. DISTRIBUTION COST
Salaries and other benefits 25.1 71,998 65,813 Outward freight and handling 27,207 25,959 Clearing and forwarding 292,723 255,806 Commission to selling agents 111,114 101,888 Travelling and conveyance 13,767 12,144 Insurance 530 191 Vehicles’ running 2,836 2,518 Electricity, gas and water 2,132 2,639 Postage, telephone and fax 2,895 2,297 Sales promotion and advertisement 28,442 22,093 Miscellaneous 7,537 4,418 561,181 495,766 25.1 Salaries and other benefits include provident fund contribution of Rupees 2.952 million
(2018: Rupees 2.683 million) by the Company. 2019 2018 Note (Rupees in thousand)
26. ADMINISTRATIVE EXPENSES Salaries and other benefits 26.1 302,245 280,548 Travelling and conveyance 25,276 22,935 Repair and maintenance 23,943 14,396 Rent, rates and taxes 5,844 5,563 Insurance 6,631 13,680 Vehicles’ running 17,774 15,998 Printing, stationery and periodicals 7,733 4,265 Electricity, gas and water 6,797 5,227 Postage, telephone and fax 8,579 7,853 Legal and professional 38,984 29,036 Security, gardening and sanitation 38,396 35,216 Depreciation 11.1.3 38,156 37,502 Miscellaneous 31,862 22,313 552,220 494,532

KOHINOOR TEXTILE MILLS LIMITED166
26.1 Salaries and other benefits include provident fund contribution of Rupees 9.909 million (2018: Rupees 9.356 million) by the Company.
26.2 The Company has shared expenses aggregating to Rupees 30.064 million (2018: Rupees 15.179 million)
on account of combined offices with the subsidiary company. These expenses have been recorded in respective accounts.
2019 2018 Note (Rupees in thousand)
27. OTHER EXPENSES Auditor’s remuneration 27.1 2,200 2,157 Donations 27.2 & 27.3 33,868 246 Loss on disposal of short term investments - net 8,397 10,413 Unrealized loss on remeasurement of future contracts - shares - 6,996 Intangible asset under development written off - 11,974 Allowance for expected credit losses 17.1 21,388 932 Provision against doubtful advances 18.1 - 4,243 Provision against slow moving stores and spares 15.1 - 1,220 Provision against obsolete stock in trade 16.5 3,904 - Sales tax on packing material written off 154,311 - Workers’ profits participation fund 7.1 114,371 104,202 Workers’ welfare fund 20,489 12,307 Loss on sale of stores and spares 5,452 - 364,380 154,690 27.1 Auditors’ remuneration
Audit fee 1,900 1,750 Reimbursable expenses 300 300 Certifications - 107 2,200 2,157 27.2 It represents donation to Gulab Devi Chest Hospital, Lahore.
27.3 None of the directors and their spouses have any interest in the donee’s fund.

ANNUAL REPORT 2019 167
2019 2018 Note (Rupees in thousand)28. OTHER INCOME Income from financial assets: Exchange gain - net 194,788 112,755 Gain on remeasurement of short term investments - net 21.2 - 1,353 Interest income on sales tax refund bonds 19 - Return on bank deposits 12,196 12,762 Return on term deposit receipts 3,349 - Interest income on loans and advances to Maple Leaf Cement Factory Limited 2,116 4,592 Dividend income from Maple Leaf Cement Factory Limited 327,836 1,001,724 Dividend income from others 3 691 540,307 1,133,877 Income from non-financial assets: Scrap sales 47,061 41,949 Gain on disposal of operating fixed assets 11.1.2 20,894 4,616 Gain on remeasurement of fair value of investment properties 12 - 3,085 Long outstanding liabilities written back 493 - 68,448 49,650 608,755 1,183,527 29. FINANCE COST Mark-up / finance charges / interest on: Long term financing 80,884 80,800 Short term borrowings 265,557 191,981 Liabilities against assets subject to finance lease - 230 Workers’ profits participation fund 7.1 9,896 27,132 Short term borrowings from Maple Leaf Capital Limited 14,495 37,604 370,832 337,747 Bank charges and commission 40,279 24,453 411,111 362,200 30. TAXATION For the year Current tax 449,741 454,315 Deferred tax 6.1 80,550 35,454 30.1 530,291 489,769
30.1 Reconciliation of tax charge for the year Profit before tax 2,280,935 2,154,091 Tax on profit @ 29% (2018: 30%) 661,471 646,227 Tax effect of lower rate on certain income / expenses (149,718) (205,881) Tax effect of super tax 34,076 54,869 Others (15,538) (5,446) 530,291 489,769

KOHINOOR TEXTILE MILLS LIMITED168
31. EARNINGS PER SHARE - BASIC AND DILUTED
31.1 There is no dilutive effect on the basic earnings per share which is based on:
2019 2018 Profit attributable to ordinary shares Rupees in thousand 1,750,644 1,664,322 Weighted average number of ordinary shares Numbers 299,296,456 295,080,469 Earnings per share Rupees 5.85 5.64
2019 2018 Note (Rupees in thousand)
32. CASH GENERATED FROM OPERATIONS Profit before taxation 2,280,935 2,154,091 Adjustment for non-cash charges and other items: Depreciation 530,546 500,601 Intangible asset under development written off - 11,974 Finance cost 411,111 362,200 Gain on disposal of operating fixed assets (20,894) (4,616) Return on term deposit receipts (3,349) - Loss on disposal of short term investments 8,397 10,413 Unrealized loss on remeasurement of future contracts - shares - 6,996 Gain on remeasurement of short term investments - (1,353) Gain on remeasurement of fair value of investment properties - (3,085) Dividend income from Maple Leaf Cement Factory Limited (327,836) (1,001,724) Dividend income from others (3) (691) Return on bank deposits (12,196) (12,762) Allowance for expected credit losses 21,388 932 Provision against doubtful advances - 4,243 Provision against slow moving stores and spares - 1,220 Provision against obsolete stock in trade (3,904) - Sales tax on packing material written off 154,311 - Working capital changes 32.1 (63,341) (1,136,776) 2,975,165 891,663
32.1 Working capital changes (Increase) / decrease in current assets: Stores, spare parts and loose tools (34,870) 20,777 Stock-in-trade (1,235,605) (565,259) Trade debts 214,250 (400,979) Advances 348,083 (577,117) Security deposits and short term prepayments (14,514) 25,382 Other receivables 323,672 81,383 (398,984) (1,415,813) Increase in trade and other payables 335,643 279,037 (63,341) (1,136,776)

ANNUAL REPORT 2019 169
32.2 Reconciliation of movement of liabilities to cash flows arising from financing activities
Liabilities from financing activities
Long term Short term Unclaimed financing borrowings dividend Total ------------ (Rupees in thousand) ------------
Balance as at 01 July 2018 1,723,400 4,635,384 20,757 6,379,541 Proceeds from long term financing 596,883 - - 596,883 Repayment of long term financing (373,565) - - (373,565) Short term borrowings - net - (1,493,861) - (1,493,861) Dividend declared - - 598,592 598,592 Dividend paid - - (595,765) (595,765) Balance as at 30 June 2019 1,946,718 3,141,523 23,584 5,111,825
33. REMUNERATION OF CHIEF EXECUTIVE OFFICER, DIRECTORS AND EXECUTIVES
The aggregate amounts charged in these financial statements in respect of remuneration including certain benefits to the Chief Executive Officer, Directors and Executives of the Company are given below:
Chief Executive Officer Directors Executives 2019 2018 2019 2018 2019 2018 -----------------( Rupees in Thousand )----------------
Managerial remuneration 19,800 18,920 9,900 9,460 77,483 69,161
Allowances
House rent 3,960 1,320 1,980 660 14,330 12,598 Medical - - - - 7,637 6,774 Utilities 6,430 2,960 3,070 1,415 20,107 17,489 Special allowance 5,940 5,660 3,150 2,890 21,658 19,385 Contribution to provident fund 1,649 1,576 825 788 6,447 5,765 37,779 30,436 18,925 15,213 147,662 131,172 Number of persons 1 1 2 2 32 32
Chief Executive Officer and Directors are provided with the Company’s maintained vehicles, free medical facilities and residential telephone facilities for both business and personal use. Chief Executive Officer is also provided with free furnished accommodation along with utilities.
Executives are provided with the Company’s maintained vehicles in accordance with the Company’s
policy. The aggregate amount charged in these financial statements in respect of directors’ meeting fee paid
to 1 (2018: 1) non-executive director was Rupees 76,666 (2018: Rupees 116,666). No remuneration was paid to non-executive directors of the Company.

KOHINOOR TEXTILE MILLS LIMITED170
34. TRANSACTIONS WITH RELATED PARTIES 34.1 The related parties comprise of subsidiary companies, associated undertakings, directors of the
Company and their close relatives, key management personnel and staff retirement fund. Detail of transactions with related parties, other than those which have been specifically disclosed elsewhere in these financial statements are as follows:
2019 2018 (Rupees in thousand)
Subsidiary companies Maple Leaf Cement Factory Limited Purchase of goods and services 107,894 50,361 Purchase of property, plant and equipment - 1,785 Dividend income 327,836 1,001,724 Investment made - 2,367,710 Loans and advances paid - 290,000 Mark up on loans 2,116 4,592 Maple Leaf Capital Limited Purchase of property, plant and equipment - 665 Sale of property, plant and equipment - 1,359 Loan obtained 100,000 1,250,000 Loan repaid 531,530 818,470 Mark-up on loans 14,495 37,604 Post employment benefit plan Contribution to provident fund 53,031 50,494 34.2 The related party status of outstanding balances as at 30 June 2019 are included in short
term borrowings (note 9), Long term investments (note 13) and other receivables (note 20). The receivables and payables are primarily unsecured in nature.
34.3 Following are the related parties with whom the Company had entered into transactions or have arrangements / agreements in place.
Company name Basis of relationship
Transactions entered or agreements and / or arrangements in place during the financial year ended
Aggregate % of shareholding
2019 2018
Maple Leaf Capital Limited Subsidiary Yes Yes 82.92% Kohinoor Capital Limited Sub - subsidiary No No 82.92% Maple Leaf Cement Factory Limited Subsidiary Yes Yes 55.22% Maple Leaf Power Limited Sub - subsidiary No No 55.22%

ANNUAL REPORT 2019 171
2019 201835. PLANT CAPACITY AND ACTUAL PRODUCTION SPINNING: (Numbers) - Rawalpindi Division Spindles (average) installed / worked 85,680 85,680 (Kilograms in thousand) 100% plant capacity converted into 20s count based on 3 shifts per day for 1,094 shifts (2018: 1,094 shifts) 46,185 45,811 Actual production converted into 20s count based on 3 shifts per day for 1,094 shifts (2018: 1,094 shifts) 41,751 41,331 (Numbers) Rotors (average) installed / worked 1,848 1,848 (Kilograms in thousand) 100% plant capacity converted into 20s count based on 3 shifts per day for 1,095 shifts (2018: 1,095 shifts) 3,702 3,548 Actual production converted into 20s count based on 3 shifts per day for 1,095 shifts (2018: 1,095 shifts) 3,192 3,075 (Numbers) - Gujar Khan Division Spindles (average) installed / worked 71,808 71,808 (Kilograms in thousand) 100% plant capacity converted into 20s count based on 3 shifts per day for 1,095 shifts (2018: 1,095 shifts ) 41,221 40,821 Actual production converted into 20s count based on 3 shifts per day for 1,095 shifts (2018: 1,095 shifts) 36,994 36,603 WEAVING: (Numbers) - Raiwind Division Looms installed / worked 288 288 (Square meters in thousand) 100% plant capacity at 60 picks based on 3 shifts per day for 1,095 shifts (2018: 1,095 shifts) 104,909 104,909
Actual production converted to 60 picks based on 3 shifts per day for 1,095 shifts (2018: 1,095 shifts) 96,355 95,710

KOHINOOR TEXTILE MILLS LIMITED172
2019 2018 PROCESSING OF CLOTH : - Rawalpindi Division (Meters in thousand) Capacity at 3 shifts per day for 1,095 shifts (2018: 1,095 shifts) 42,090 42,090 Actual production at 3 shifts per day for 1,095 shifts (2018: 1,095 shifts) 14,757 14,613 POWER PLANT: - Rawalpindi Division (Mega watts) Annual rated capacity based on 365 days (2018: 365 days) 224,186 163,987 Actual generation Main engines 29,556 30,595 Gas engines 18,190 27,763 Solar 1,937 - - Raiwind Division Annual rated capacity based on 365 days (2018: 365 days) 96,360 96,360 Actual generation 42,122 38,098 Stitching The plant capacity of this division is indeterminable due to multi-product plant involving varying
processes of manufacturing and run length of order lots. REASONS FOR LOW PRODUCTION - Due to stoppage for normal maintenance, doffing, change of spin plans and cloth quality.
- Cloth processing units working capacity was limited to actual export / local orders in hand.
- The generation of power was limited to actual demand.

ANNUAL REPORT 2019 173
Spin
ning
Wea
ving
Proc
essin
g an
d
Elim
inat
ion
of in
ter-
Com
pany
ho
me
text
ile
seg
men
t tra
nsac
tions
20
19
2018
20
19
2018
20
19
2018
20
19
2018
20
19
2018
----
----
----
----
----
----
----
----
----
----
----
--- (
R u
p e
e s
in
t h
o u
s a
n d
) ---
----
----
----
----
----
----
----
----
----
----
----
--RE
VENU
E:
EXT
ERNA
L 1
0,93
6,43
1
9,0
18,7
57
4,1
53,7
05
3,4
61,8
76
6,1
29,9
99
5,3
52,9
07
-
-
21,
220,
135
17,
833,
540
IN
TER-
SEG
MEN
T 5
87,0
69
500
,504
1
,395
,099
1
,242
,489
-
-
(1
,982
,168
) (1
,742
,993
) -
-
11,
523,
500
9
,519
,261
5
,548
,804
4
,704
,365
6
,129
,999
5
,352
,907
(1
,982
,168
) (1
,742
,993
) 2
1,22
0,13
5 1
7,83
3,54
0 CO
ST O
F SA
LES
(9,4
88,8
46)
(8,1
53,8
53)
(5,1
24,5
50)
(4,4
15,8
30)
(5,0
27,8
35)
(4,5
29,0
98)
1,9
82,1
68
1,7
42,9
93
(17,
659,
063)
(15,
355,
788)
GRO
SS P
ROFI
T 2
,034
,654
1
,365
,408
4
24,2
54
288
,535
1
,102
,164
8
23,8
09
-
-
3,5
61,0
72
2,4
77,7
52
DIST
RIBU
TIO
N CO
ST
(45,
308)
(3
9,55
3)
(79,
645)
(7
4,15
2)
(436
,228
) (3
82,0
61)
-
-
(561
,181
) (4
95,7
66)
ADM
INIS
TRAT
IVE
EXPE
NSES
(2
24,1
24)
(184
,137
) (1
37,9
17)
(150
,741
) (1
90,1
79)
(159
,654
) -
-
(5
52,2
20)
(494
,532
)
(269
,432
) (2
23,6
90)
(217
,562
) (2
24,8
93)
(626
,407
) (5
41,7
15)
-
-
(1,1
13,4
01)
(990
,298
)
PR
OFI
T BE
FORE
TAX
AND
UNA
LLO
CATE
D
INCO
ME
AND
EXPE
NSES
1
,765
,222
1
,141
,718
2
06,6
92
63,
642
4
75,7
57
282
,094
-
-
2
,447
,671
1
,487
,454
UN
ALLO
CATE
D IN
COM
E AN
D EX
PENS
ES
O
THER
EXP
ENSE
S
(3
64,3
80)
(154
,690
)O
THER
INCO
ME
608
,755
1
,183
,527
FI
NANC
E CO
ST
(411
,111
) (3
62,2
00)
TAXA
TIO
N
(5
30,2
91)
(489
,769
)
(697
,027
) 1
76,8
68
PRO
FIT
AFTE
R TA
XATI
ON
1,7
50,6
44
1,6
64,3
22
Spin
ning
Wea
ving
Pro
cess
ing
and
Co
mpa
ny
hom
e te
xtile
20
19
2018
20
19
2018
20
19
2018
20
19
2018
--
----
----
----
----
----
----
----
--- (
R u
p e
e s
in
t h
o u
s a
n d
) ---
----
----
----
----
----
----
----
----
----
TOTA
L AS
SETS
FOR
REP
ORTA
BLE
SEGM
ENT
6,0
12,7
72
5,9
10,0
38
3,0
06,5
23
3,4
04,3
94
2,7
94,2
90
3,1
12,5
06
11,8
13,5
85
12,
426,
938
UNAL
LOCA
TED
ASSE
TS
13,7
32,9
93
12,
445,
018
TOTA
L AS
SETS
AS
PER
STAT
EMEN
T O
F FI
NANC
IAL
POSI
TIO
N
25,5
46,5
78
24,
871,
956
All s
egm
ent a
sset
s ar
e all
ocat
ed to
repo
rtabl
e se
gmen
ts o
ther
than
thos
e di
rect
ly re
latin
g to
cor
pora
te a
nd ta
x as
sets
.
TOTA
L LI
ABIL
ITIE
S FO
R RE
PORT
ABLE
SEG
MEN
T 1
,343
,255
1
,194
,478
1
,068
,196
1
,387
,908
3
,495
,460
4
,177
,132
5
,906
,911
6
,759
,518
UN
ALLO
CATE
D LI
ABIL
ITIE
S
2
,672
,852
2
,291
,812
TO
TAL
LIAB
ILIT
IES
AS P
ER S
TATE
MEN
T O
F FI
NANC
IAL
POSI
TIO
N
8,5
79,7
63
9,0
51,3
30
All s
egm
ent l
iabilit
ies a
re a
lloca
ted
to re
porta
ble
segm
ents
oth
er th
an tr
ade
and
othe
r pay
ables
and
def
erre
d ta
x lia
biliti
es.
36. S
EGM
ENT
INFO
RMAT
ION
36.1
Rec
oncil
iatio
n of
repo
rtabl
e se
gmen
t ass
ets
and
liabi
lities

KOHINOOR TEXTILE MILLS LIMITED174
36.2 Geographical Information 36.2.1 The Company’s revenue from external customers by geographical location is detailed below:
2019 2018 (Rupees in thousand) Europe 1,762,049 2,664,714 United States of America and Canada 4,714,368 3,423,634 Asia, Africa, Australia 616,714 459,719 Pakistan 14,127,004 11,285,473 21,220,135 17,833,540 36.2.2 All non-current assets as at reporting date are located and operated in Pakistan.
36.3 Revenue from major customers Revenue from major customers whose revenue accounts for more than 10% of the segment’s
revenue in Weaving segment was Rupees Nil (2018: Rupees 361 million ) whereas in the Processing and home textile segment was Rupees 3,091 million (2018: Rupees 2,190 million).
36.4 Based on the judgment made by the management printing, dyeing and home textile operating segments of the Company have been aggregated into a single operating segment namely ‘Processing and home textile’ as these segments have similar economic characteristics in respect of nature of the products, nature of production process, type of customers, method of distribution and nature of regulatory environment.
37. PROVIDENT FUND As at the reporting date, the provident fund trusts are in the process of regularizing investments in
accordance with section 218 of the Companies Act, 2017 and the regulations formulated for this purpose by the Securities and Exchange Commission of Pakistan, which allows transition period of three years for bringing the trusts in conformity with the requirements of regulations
2019 201838. NUMBER OF EMPLOYEES Number of employees as on 30 June 4,725 4,824 Average number of employees during the year 4,740 4,781 39. FINANCIAL RISK MANAGEMENT 39.1 Financial risk factors The Company’s activities expose it to a variety of financial risks: market risk (including currency
risk, other price risk and interest rate risk), credit risk and liquidity risk. The Company’s overall risk management programme focuses on the unpredictability of financial markets and seeks to minimize potential adverse effects on the Company’s financial performance. The Company uses derivative financial instruments to hedge certain risk exposures.

ANNUAL REPORT 2019 175
Risk management is carried out by the Company’s finance department under policies approved by the Board of Directors. The Company’s finance department evaluates and hedges financial risks. The Board provides principles for overall risk management, as well as policies covering specific areas such as currency risk, other price risk, interest rate risk, credit risk, liquidity risk, use of derivative financial instruments and non-derivative financial instruments and investment of excess liquidity.
(a) Market risk (i) Currency risk Currency risk is the risk that the fair value or future cash flows of a financial instrument will
fluctuate because of changes in foreign exchange rates. Currency risk arises mainly from future commercial transactions or receivables and payables that exist due to transactions in foreign currencies.
The Company is exposed to currency risk arising from various currency exposures, primarily
with respect to the United States Dollar (USD). Currently, the Company’s foreign exchange risk exposure is restricted to bank balances and the amounts receivable / payable from / to the foreign entities. The Company’s exposure to currency risk was as follows:
2019 2018 Cash at banks - USD 58,222 57,087 Trade debts - USD 4,120,525 4,525,798 Trade and other payables - USD 29,000 12,000 Net exposure - USD 4,149,747 4,570,885 The following significant exchange rates were applied during the year: Rupees per US Dollar Average rate 135.96 109.40 Reporting date rate 164.00 121.40 Sensitivity analysis If the functional currency, at reporting date, had weakened / strengthened by 5% against the USD
with all other variables held constant, the impact on profit after taxation for the year would have been Rupees 31.989 million (2018: Rupees 26.083 million) respectively higher / lower, mainly as a result of exchange gains / losses on translation of foreign exchange denominated financial instruments. Currency risk sensitivity to foreign exchange movements has been calculated on a symmetric basis. In management’s opinion, the sensitivity analysis is unrepresentative of inherent currency risk as the year end exposure does not reflect the exposure during the year.
(ii) Other price risk Other price risk represents the risk that the fair value or future cash flows of a financial instrument
will fluctuate because of changes in market prices (other than those arising from interest rate risk or currency risk), whether those changes are caused by factors specific to the individual financial instrument or its issuer, or factors affecting all similar financial instruments traded in the market. The Company is not exposed to commodity price risk.

KOHINOOR TEXTILE MILLS LIMITED176
Sensitivity analysis The table below summarizes the impact of increase / decrease in the Pakistan Stock Exchange
(PSX) Index on the Company’s profit after taxation for the year. The analysis is based on the assumption that the equity index had increased / decreased by 5% with all other variables held constant and all the Company’s equity instruments moved according to the historical correlation with the index:
Index Impact on profit after taxation 2019 2018 (Rupees in thousand)
PSX 100 (5% increase) - 402 PSX 100 (5% decrease) - (402)
(iii) Interest rate risk This represents the risk that the fair value or future cash flows of a financial instrument will
fluctuate because of changes in market interest rates. The Company’s interest rate risk arises from long term financing, short term borrowings and
bank balances in saving accounts. Financial instruments at variable rates expose the Company to cash flow interest rate risk. Financial instruments at fixed rate expose the Company to fair value interest rate risk.
At the reporting date the interest rate profile of the Company’s interest bearing financial
instruments was: 2019 2018 (Rupees in thousand)
Fixed rate instruments Financial assets Sales tax refund bonds 24,819 - Financial liabilities Long term financing 1,921,718 1,648,400 Short term borrowings 2,501,500 2,575,000 Floating rate instruments Financial assets Bank balances - saving accounts 133,197 74,862 Term deposit receipts 51,441 - Financial liabilities Long term financing 25,000 75,000 Short term borrowings 640,023 2,060,384
Fair value sensitivity analysis for fixed rate instruments The Company does not account for any fixed rate financial assets and liabilities at fair value
through profit or loss. Therefore, a change in interest rate at reporting date would not affect profit or loss of the Company.

ANNUAL REPORT 2019 177
Cash flow sensitivity analysis for variable rate instruments If interest rate at the year end date, fluctuates by 1% higher / lower with all other variables
held constant, profit after taxation for the year would have been Rupees 3.234 million (2018: Rupees 15.304 million) lower / higher, mainly as a result of higher / lower interest on floating rate financial instruments. This analysis is prepared assuming the amounts of financial instruments outstanding at reporting date were outstanding for the whole year.
(b) Credit risk Credit risk represents the risk that one party to a financial instrument will cause a financial loss
for the other party by failing to discharge an obligation. The carrying amount of financial assets represents the maximum credit exposure. The maximum exposure to credit risk at the reporting date was as follows:
2019 2018 (Rupees in thousand)
Investments 76,260 8,042 Deposits 52,589 49,695 Trade debts 1,455,119 1,699,015 Advances 6,080 1,883 Other receivables 7,060 267,380 Bank balances 201,129 160,007 1,798,237 2,186,022 The credit quality of financial assets that are neither past due nor impaired can be assessed by
reference to external credit ratings (if available) or to historical information about counterparty default rate:
Rating 2019 2018
Short term Long term Agency (Rupees in thousand)
Banks Al-Baraka Bank (Pakistan) Limited A1 A PACRA 19,230 13,547 Allied Bank Limited A1+ AAA PACRA 1,628 370 Askari Bank Limited A1+ AA+ PACRA 5,821 6,711 Bank Alfalah Limited A1+ AA+ PACRA 4,998 3,228 Bank Al-Habib Limited A1+ AA+ PACRA 49,545 11,990 Bank Islami Pakistan Limited A1 A+ PACRA 29 29 Faysal Bank Limited A1+ AA PACRA 13,626 888 Habib Bank Limited A-1+ AAA JCR-VIS 9,221 5,066 MCB Bank Limited A1+ AAA PACRA 47,708 40,590 Meezan Bank Limited A-1+ AA+ JCR-VIS 30,801 9,789 National Bank of Pakistan A1+ AAA PACRA 2,283 10,255 MCB Islamic Bank Limited A1 A PACRA 2,739 8,263 Silkbank Limited A-2 A- JCR-VIS 48 51 Standard Chartered Bank (Pakistan) Limited A+ AAA PACRA - 10 The Bank of Punjab A1+ AA PACRA 6,517 8,747 Habib Metropolitan Bank Limited A1+ AA+ PACRA 3,114 - United Bank Limited A-1+ AAA JCR-VIS 3,821 40,473 201,129 160,007 Investments Sales tax refund bonds Unknown 24,819 - United Bank Limited - term deposit receipt A-1+ AAA JCR-VIS 51,441 - 76,260 -
The Company’s exposure to credit risk and allowance for expected credit losses related to trade debts is disclosed in Note 17.2.
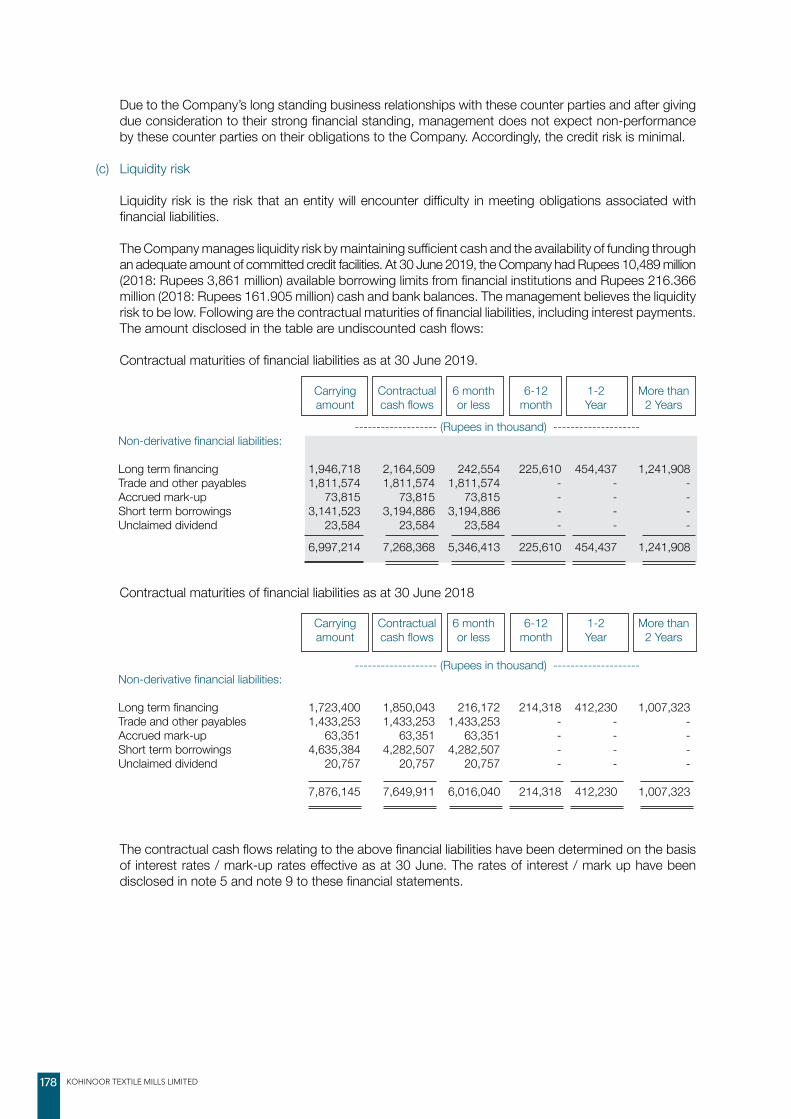
KOHINOOR TEXTILE MILLS LIMITED178
Due to the Company’s long standing business relationships with these counter parties and after giving due consideration to their strong financial standing, management does not expect non-performance by these counter parties on their obligations to the Company. Accordingly, the credit risk is minimal.
(c) Liquidity risk Liquidity risk is the risk that an entity will encounter difficulty in meeting obligations associated with
financial liabilities. The Company manages liquidity risk by maintaining sufficient cash and the availability of funding through
an adequate amount of committed credit facilities. At 30 June 2019, the Company had Rupees 10,489 million (2018: Rupees 3,861 million) available borrowing limits from financial institutions and Rupees 216.366 million (2018: Rupees 161.905 million) cash and bank balances. The management believes the liquidity risk to be low. Following are the contractual maturities of financial liabilities, including interest payments. The amount disclosed in the table are undiscounted cash flows:
Contractual maturities of financial liabilities as at 30 June 2019.
Carrying Contractual 6 month 6-12 1-2 More than amount cash flows or less month Year 2 Years
------------------- (Rupees in thousand) -------------------- Non-derivative financial liabilities: Long term financing 1,946,718 2,164,509 242,554 225,610 454,437 1,241,908 Trade and other payables 1,811,574 1,811,574 1,811,574 - - - Accrued mark-up 73,815 73,815 73,815 - - - Short term borrowings 3,141,523 3,194,886 3,194,886 - - - Unclaimed dividend 23,584 23,584 23,584 - - - 6,997,214 7,268,368 5,346,413 225,610 454,437 1,241,908
Contractual maturities of financial liabilities as at 30 June 2018
Carrying Contractual 6 month 6-12 1-2 More than amount cash flows or less month Year 2 Years
------------------- (Rupees in thousand) -------------------- Non-derivative financial liabilities: Long term financing 1,723,400 1,850,043 216,172 214,318 412,230 1,007,323 Trade and other payables 1,433,253 1,433,253 1,433,253 - - - Accrued mark-up 63,351 63,351 63,351 - - - Short term borrowings 4,635,384 4,282,507 4,282,507 - - - Unclaimed dividend 20,757 20,757 20,757 - - -
7,876,145 7,649,911 6,016,040 214,318 412,230 1,007,323
The contractual cash flows relating to the above financial liabilities have been determined on the basis of interest rates / mark-up rates effective as at 30 June. The rates of interest / mark up have been disclosed in note 5 and note 9 to these financial statements.

ANNUAL REPORT 2019 179
39.2 Financial instruments by categories Amortized FVTPL Total cost -------------(Rupees in thousand)-------------
As at 30 June 2019 Assets as per statement of financial position Investments 76,260 - 76,260 Deposits 52,589 - 52,589 Trade debts 1,455,119 - 1,455,119 Advances 6,080 - 6,080 Other receivables 7,060 - 7,060 Cash and bank balances 216,366 - 216,366 1,813,474 - 1,813,474
Financial liabilities at amortized cost (Rupees in thousand) Liabilities as per statement of financial position Long term financing 1,946,718 Trade and other payables 1,811,574 Accrued mark-up 73,815 Short term borrowings 3,141,523 Unclaimed dividend 23,584 6,997,214
Loans and FVTPL Total receivables -------------(Rupees in thousand)------------- As at 30 June 2018 Assets as per statement of financial position Investments - 8,042 8,042 Deposits 49,695 - 49,695 Trade debts 1,699,015 - 1,699,015 Advances 1,883 - 1,883 Other receivables 267,380 - 267,380 Cash and bank balances 161,905 - 161,905 2,179,878 8,042 2,187,920

KOHINOOR TEXTILE MILLS LIMITED180
Financial liabilities at amortized cost (Rupees in thousand) Liabilities as per statement of financial position Long term financing 1,723,400 Trade and other payables 1,433,253 Accrued mark-up 63,351 Short term borrowings 4,635,384 Unclaimed dividend 20,757
7,876,145
39.3 Offsetting financial assets and liabilities
As on reporting date, recognized financial instruments are not subject to offsetting as there are no enforceable master netting arrangements and similar agreements.
39.4 Capital risk management The Company’s objectives when managing capital are to safeguard the Company’s ability to
continue as a going concern in order to provide returns for shareholders and benefits for other stakeholders and to maintain an optimal capital structure to reduce the cost of capital. In order to maintain or adjust the capital structure, the Company may adjust the amount of dividend paid to shareholders, issue new shares or sell assets to reduce debt. Consistent with others in the industry and the requirements of the lenders, the Company monitors the capital structure on the basis of gearing ratio. This ratio is calculated as borrowings divided by total capital employed. Borrowings represent long term financing and short term borrowings obtained by the Company as referred to in note 5 and note 9 respectively. Total capital employed includes ‘total equity’ as shown in the statement of financial position plus ‘borrowings’. The gearing ratio as at 30 June 2019 and 30 June 2018 is as follows:
2019 2018 (Rupees in thousand)
Borrowings 5,088,241 6,358,784 Total equity 16,966,815 15,820,626 Total capital employed 22,055,056 22,179,410 Gearing ratio 23% 29%

ANNUAL REPORT 2019 181
40. RECOGNIZED FAIR VALUE MEASUREMENTS - FINANCIAL INSTRUMENTS (i) Fair value hierarchy Judgments and estimates are made in determining the fair values of the financial instruments that are
recognized and measured at fair value in these financial statements. To provide an indication about the reliability of the inputs used in determining fair value, the Company has classified its financial instruments into the following three levels. An explanation of each level follows underneath the table.
30 June 2019 Recurring fair value measurements Level 1 Level 2 Level 3 Total --------- ( Rupees in thousand ) -------- Financial assets Financial assets at fair value through profit or loss - - - - Total financial assets - - - -
30 June 2018 Level 1 Level 2 Level 3 Total --------- ( Rupees in thousand ) -------- Financial assets Financial assets at fair value through profit or loss 8,042 - - 8,042 Total financial assets 8,042 - - 8,042
The above table does not include fair value information for financial assets and financial liabilities not
measured at fair value if the carrying amounts are a reasonable approximation of fair value. Due to short term nature, carrying amounts of certain financial assets and financial liabilities are considered to be the same as their fair value.
There were no transfers between levels 1 and 2 for recurring fair value measurements during the year.
Further, there was no transfer in and out of level 3 measurements as the Company has no investments which are classified under level 3 of fair value hierarchy table.
The Company’s policy is to recognize transfers into and transfers out of fair value hierarchy levels as at
the end of the reporting period. Level 1: The fair value of financial instruments traded in active markets (such as publicly traded
derivatives, and trading and equity securities) is based on quoted market prices at the end of the reporting period. The quoted market price used for financial assets held by the Company is the current bid price. These instruments are included in level 1.
Level 2: The fair value of financial instruments that are not traded in an active market (for example,
over-the-counter derivatives) is determined using valuation techniques which maximize the use of observable market data and rely as little as possible on entity-specific estimates. If all significant inputs required to fair value an instrument are observable, the instrument is included in level 2.
Level 3: If one or more of the significant inputs is not based on observable market data, the instrument
is included in level 3. This is the case for unlisted equity securities.

KOHINOOR TEXTILE MILLS LIMITED182
(ii) Valuation techniques used to determine fair values
Specific valuation techniques used to value financial instruments include the use of quoted market prices.
41. RECOGNIZED FAIR VALUE MEASUREMENTS - NON-FINANCIAL ASSETS
(i) Fair value hierarchy
The judgments and estimates made in determining the fair values of the non-financial assets that are recognized and measured at fair value in the financial statements. To provide an indication about the reliability of the inputs used in determining fair value, the Company has classified its non-financial assets into the following three levels.
At 30 June 2019 Level 1 Level 2 Level 3 Total --------- ( Rupees in thousand ) -------- Investment properties - 1,792,755 - 1,792,755 Freehold land - 2,739,557 - 2,739,557 Total non-financial assets - 4,532,312 - 4,532,312
At 30 June 2018 Level 1 Level 2 Level 3 Total --------- ( Rupees in thousand ) -------- Investment properties - 1,792,755 - 1,792,755 Freehold land - 2,739,557 - 2,739,557 Total non-financial assets - 4,532,312 - 4,532,312
The Company’s policy is to recognize transfers into and transfers out of fair value hierarchy levels as at the end of the reporting period.
There were no transfers between levels 1 and 2 for recurring fair value measurements during the year.
Further, there was no transfer in and out of level 3 measurements. (ii) Valuation techniques used to determine level 2 fair values The Company obtains independent valuations for its investment properties and freehold land (classified
as property, plant and equipment) at least annually. The management updates the assessment of the fair value of each property, taking into account the most recent independent valuations. The management determine a property’s value within a range of reasonable fair value estimates. The best evidence of fair value of land is current prices in an active market for similar lands. The best evidence of fair value of buildings is to calculate fair depreciated market value by applying an appropriate annual rate of depreciation on the new construction / replacement value of the same building.

ANNUAL REPORT 2019 183
Valuation processes The Company engages external, independent and qualified valuers to determine the fair value of the
Company’s investment properties and freehold land at the end of every financial year. As at 30 June 2019, the fair values of the investment properties and freehold land have been determined by Anderson Consulting (Private) Limited.
Changes in fair values are analyzed at each reporting date during the annual valuation discussion
between the Chief Financial Officer and the valuers. As part of this discussion the team presents a report that explains the reason for the fair value movements.
42. DISCLOSURES BY COMPANY LISTED ON ISLAMIC INDEX
2019 2018 Description Note (Rupees in thousand)
Loans / advances obtained as per Islamic mode: Loans - - Advances 7 88,617 125,443 Shariah compliant bank deposits / bank balances: Bank balances 22 52,799 21,839 Profit earned from shariah compliant bank deposits / bank balances 3,906 - Revenue earned from shariah compliant business 23 21,220,135 17,833,540 Gain / (loss) or dividend earned from shariah compliant investments: Dividend income 28 327,839 1,002,415 Realized loss on disposal of short term investments 27 (3,117) (10,413) Unrealized gain on investments at fair value 28 - 1,353 Exchange gain earned 28 194,788 112,755 Mark-up paid on islamic mode of financing - - Profits earned or interest paid on any conventional loan / advance: Interest income on sales tax refund bonds 19 - Profit earned on deposits with banks 8,290 12,762 Interest paid on loans 346,441 272,781 Short term borrowings from Maple Leaf Capital Limited 14,495 37,604 Relationship with shariah compliant banks Name Relationship at reporting date Al-Baraka Bank (Pakistan) Limited Bank balance Bank Islami Pakistan Limited Bank balance MCB Islamic Bank Limited Bank balance Meezan Bank Limited Bank balance

KOHINOOR TEXTILE MILLS LIMITED184
43. DATE OF AUTHORIZATION FOR ISSUE These financial statements were authorized for issue on 20 September 2019 by the Board of Directors
of the Company. 44. NON-ADJUSTING EVENTS AFTER THE STATEMENT OF FINANCIAL POSITION DATE 44.1 The Board of Directors of the Company in their meeting held on 20 September 2019 has proposed
a final cash dividend of Rupees 0.75 per share (7.5%) amounting to Rupees 224.472 million (2018: Rupees 299.296 million) for the year ended 30 June 2019 for approval of the members at the Annual General Meeting to be held on 26 October 2019. The financial statements for the year ended 30 June 2019 do not include the effect of the proposed final cash dividend which will be accounted for in the period ending 30 June 2020.
44.2 Under section 5A of the Income Tax Ordinance, 2001, a tax shall be imposed at the rate of 5%
of accounting profit before tax of the Company if it does not distribute at least 20% of its after tax profit for the year within six months of the end of the year ended 30 June 2019 through cash. The requisite cash dividend has been proposed by the Board of Directors of the Company in their meeting held on 20 September 2019 and will be distributed within the prescribed time limit. Therefore, the recognition of any income tax liability in this respect is not considered necessary.
45. CORRESPONDING FIGURES Corresponding figures have been re-arranged, wherever necessary, for the purpose of comparison. No
significant rearrangements have been made. 46. GENERAL Figures have been rounded off to the nearest thousand of Rupees unless stated otherwise.
CHIEF EXECUTIVE OFFICER DIRECTOR CHIEF FINANCIAL OFFICER
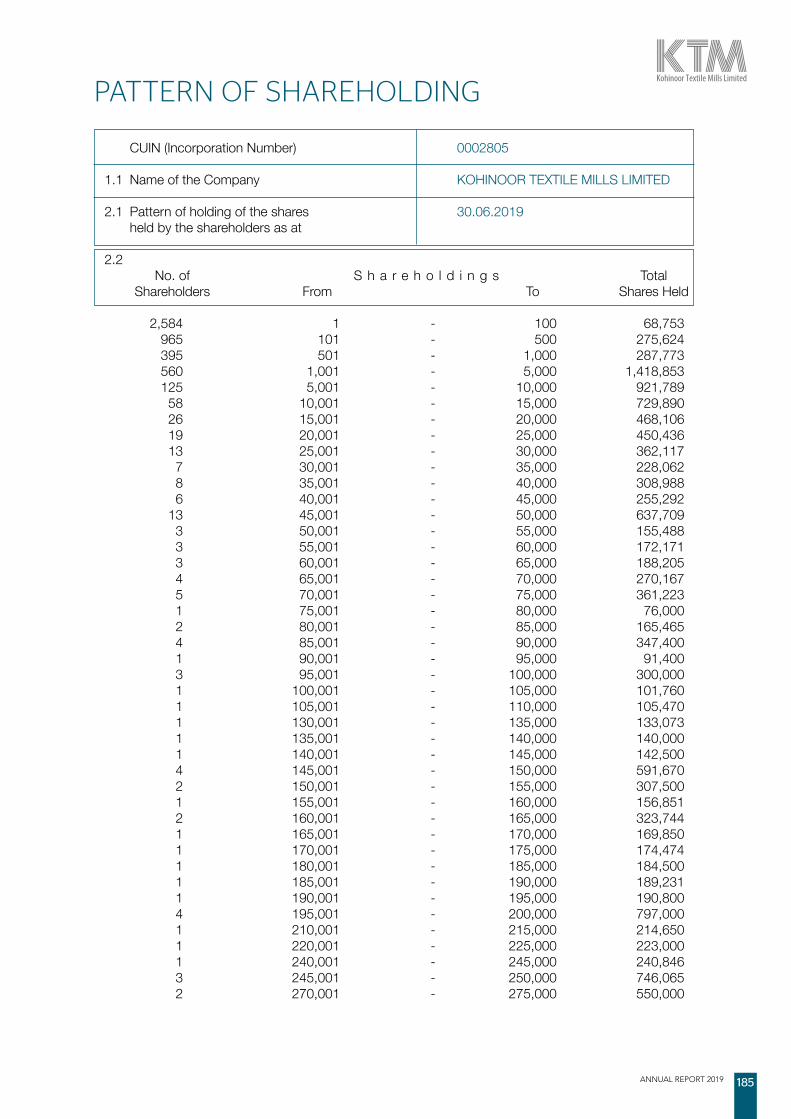
ANNUAL REPORT 2019 185
CUIN (Incorporation Number) 0002805 1.1 Name of the Company KOHINOOR TEXTILE MILLS LIMITED 2.1 Pattern of holding of the shares 30.06.2019 held by the shareholders as at
2.2 No. of S h a r e h o l d i n g s Total Shareholders From To Shares Held
2,584 1 - 100 68,753 965 101 - 500 275,624 395 501 - 1,000 287,773 560 1,001 - 5,000 1,418,853 125 5,001 - 10,000 921,789 58 10,001 - 15,000 729,890 26 15,001 - 20,000 468,106 19 20,001 - 25,000 450,436 13 25,001 - 30,000 362,117 7 30,001 - 35,000 228,062 8 35,001 - 40,000 308,988 6 40,001 - 45,000 255,292 13 45,001 - 50,000 637,709 3 50,001 - 55,000 155,488 3 55,001 - 60,000 172,171 3 60,001 - 65,000 188,205 4 65,001 - 70,000 270,167 5 70,001 - 75,000 361,223 1 75,001 - 80,000 76,000 2 80,001 - 85,000 165,465 4 85,001 - 90,000 347,400 1 90,001 - 95,000 91,400 3 95,001 - 100,000 300,000 1 100,001 - 105,000 101,760 1 105,001 - 110,000 105,470 1 130,001 - 135,000 133,073 1 135,001 - 140,000 140,000 1 140,001 - 145,000 142,500 4 145,001 - 150,000 591,670 2 150,001 - 155,000 307,500 1 155,001 - 160,000 156,851 2 160,001 - 165,000 323,744 1 165,001 - 170,000 169,850 1 170,001 - 175,000 174,474 1 180,001 - 185,000 184,500 1 185,001 - 190,000 189,231 1 190,001 - 195,000 190,800 4 195,001 - 200,000 797,000 1 210,001 - 215,000 214,650 1 220,001 - 225,000 223,000 1 240,001 - 245,000 240,846 3 245,001 - 250,000 746,065 2 270,001 - 275,000 550,000
PATTERN OF SHAREHOLDING
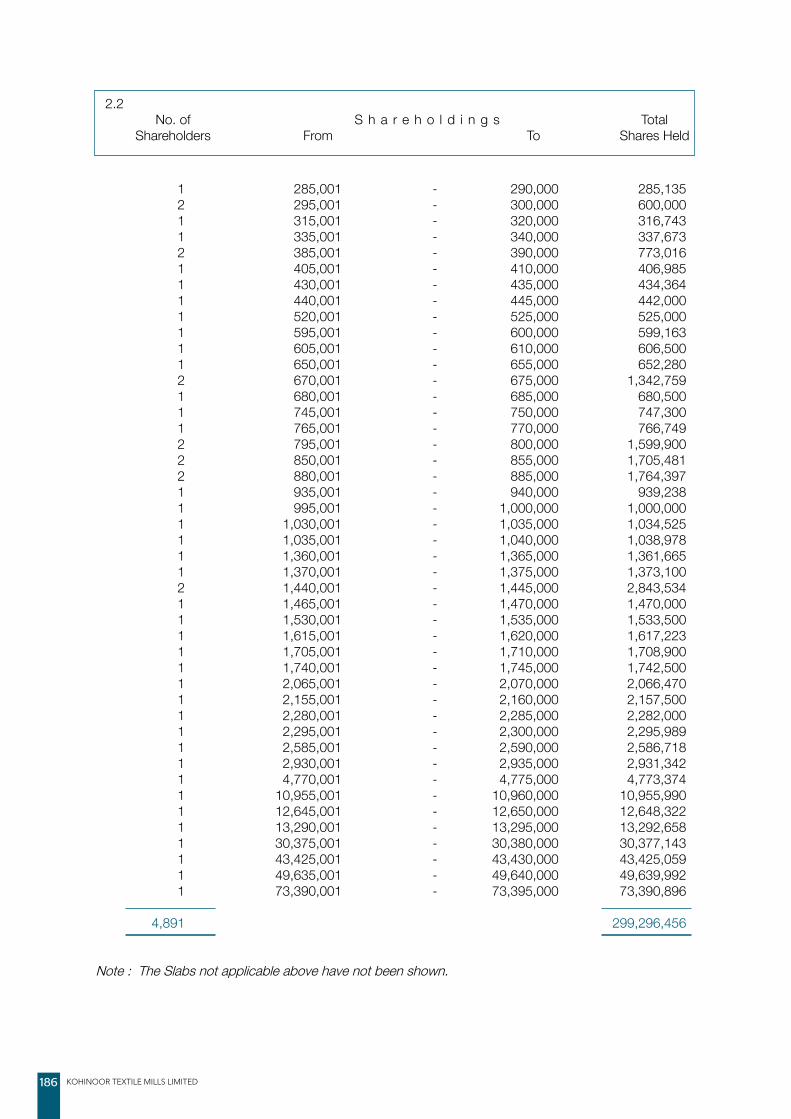
KOHINOOR TEXTILE MILLS LIMITED186
2.2 No. of S h a r e h o l d i n g s Total Shareholders From To Shares Held
1 285,001 - 290,000 285,135 2 295,001 - 300,000 600,000 1 315,001 - 320,000 316,743 1 335,001 - 340,000 337,673 2 385,001 - 390,000 773,016 1 405,001 - 410,000 406,985 1 430,001 - 435,000 434,364 1 440,001 - 445,000 442,000 1 520,001 - 525,000 525,000 1 595,001 - 600,000 599,163 1 605,001 - 610,000 606,500 1 650,001 - 655,000 652,280 2 670,001 - 675,000 1,342,759 1 680,001 - 685,000 680,500 1 745,001 - 750,000 747,300 1 765,001 - 770,000 766,749 2 795,001 - 800,000 1,599,900 2 850,001 - 855,000 1,705,481 2 880,001 - 885,000 1,764,397 1 935,001 - 940,000 939,238 1 995,001 - 1,000,000 1,000,000 1 1,030,001 - 1,035,000 1,034,525 1 1,035,001 - 1,040,000 1,038,978 1 1,360,001 - 1,365,000 1,361,665 1 1,370,001 - 1,375,000 1,373,100 2 1,440,001 - 1,445,000 2,843,534 1 1,465,001 - 1,470,000 1,470,000 1 1,530,001 - 1,535,000 1,533,500 1 1,615,001 - 1,620,000 1,617,223 1 1,705,001 - 1,710,000 1,708,900 1 1,740,001 - 1,745,000 1,742,500 1 2,065,001 - 2,070,000 2,066,470 1 2,155,001 - 2,160,000 2,157,500 1 2,280,001 - 2,285,000 2,282,000 1 2,295,001 - 2,300,000 2,295,989 1 2,585,001 - 2,590,000 2,586,718 1 2,930,001 - 2,935,000 2,931,342 1 4,770,001 - 4,775,000 4,773,374 1 10,955,001 - 10,960,000 10,955,990 1 12,645,001 - 12,650,000 12,648,322 1 13,290,001 - 13,295,000 13,292,658 1 30,375,001 - 30,380,000 30,377,143 1 43,425,001 - 43,430,000 43,425,059 1 49,635,001 - 49,640,000 49,639,992 1 73,390,001 - 73,395,000 73,390,896
4,891 299,296,456
Note : The Slabs not applicable above have not been shown.

ANNUAL REPORT 2019 187
2.3 Categories of Shares Percentage Shareholders Held of Capital 2.3.1 Directors, Chief Executive Officer and their spouses & minor children
Mr. Tariq Sayeed Saigol, Chairman 12,648,322 4.226 Mr. Taufique Sayeed Saigol, Chief Executive Officer 43,425,059 14.509 Mr. Sayeed Tariq Saigol 385,016 0.129 Mr. Waleed Tariq Saigol 33,471 0.011 Mr. Danial Taufique Saigol 3,046 0.001 Mr. Shafiq Ahmed Khan 3,046 0.001 Mr. Arif Ijaz 3,027 0.001 Mrs. Shehla Tariq Saigol, Spouse of Mr. Tariq Sayeed Saigol 30,377,143 10.150
86,878,130 29.028 2.3.2 Associated Companies, undertakings and related parties - -2.3.3 NIT and ICP National Bank of Pakistan, Trustee Deptt. 10,583 0.004 Industrial Development Bank of Pakistan (IDBP) 13,914 0.005
24,497 0.0092.3.4 Banks, Development Financial Institutions, Non-Banking Financial Institutions 13,295,139 4.442 2.3.5 Insurance Companies 3,684,899 1.231 2.3.6 Modarabas, Leasing and Mutual Funds 21,272,835 7.107 2.3.7 Share holders holding 10% or more refer 2.3.8 b 2.3.8 General Public a) Local 38,586,223 12.892 b) Foreign 133,539,447 44.618 2.3.9 Others Artal Restaurant Int Ltd Employees Provident Fund 2,073 Bps Group Companies Employees Provident Fund 25,000 Bristol-Myers Squibb Pak (Pvt) Ltd Employees Provident Fund 2,500 CDC - Trustee NAFA Islamic Pension Fund Equity Account 133,073 CDC - Trustee NAFA Pension Fund Equity Sub-Fund Account 38,279 CDC - Trustee Pakistan Pension Fund - Equity Sub Fund 190,800 CDC-Trustee Alhamra Islamic Pension Fund - Equity Sub Fund 105,470 Descon Oxychem Ltd. Employees Provident Fund 60 Descon Power Solutions Pvt Ltd Staff Provident Fund Trust 1,500 Federal Board of Revenue 161,269 Feroze1888 Mills Limited Employees Provident Fund Trust 25,000 Fikree Development Corp. (Pvt.) Limited 50 Hajiani Hanifa Bai Memorial Society 766,749 Hussain Trustees Limited. 297 Official Assignee of Karachi 14,535

KOHINOOR TEXTILE MILLS LIMITED188
Pakistan Stock Exchange Limited 70,178 Thal Limited Employees Provident Fund 4,320 Thal Limited Employees Retirement Benefit Fund 176 The Crescent Textile Mills Ltd. Employees Provident Fund 3,307 The Deputy Administrator Abandoned Properties 193 The Ida Rieu Poor Welfare Association 405 The Okhai Memon Madressah Association 1 Trustee National Bank Of Pakistan Employees Benevolent Fund Trust 11,848 Trustee National Bank of Pakistan Employees Pension Fund 337,673 Trustee of Telenor Shared Services (Pvt.) LTD Gratuity Fund 7,500 Trustee Pak Herald Publications (Pvt) Ltd Staff GratuityFund 3,000 Trustee Pak Herald Publications (Pvt) Ltd Staff Pension Fund 12,500 Trustees Moosa Lawai Foundation 4,285 Trustees of FFC Employees Provident Fund 26,500 Trustees of Philip Morris (Pakistan) Limited E.C.P.F Trust 19,000 Trustees of Philip Morris (Pakistan) Limited Employees Gratuity Fund Trust 11,500 Trustees of Sulaimaniyah Trust 401 Trustees of Telenor Pakistan Pvt Ltd Employees Provident Fund 500 Trustees Telenor Employees Gratuity Fund 6,000 United Executers & Trustee Company Limited 164 University of Sindh 680 Wellcome Pakistan Limited Provident Fund 28,500
2,015,286 0.673 Grand Total : 299,296,456 100.000
2.3 Categories of Shares Percentage Shareholders Held of Capital
ANNUAL REPORT 2019 189
ConsolidatedFinancial Statements
for the Year Ended June 30, 2019
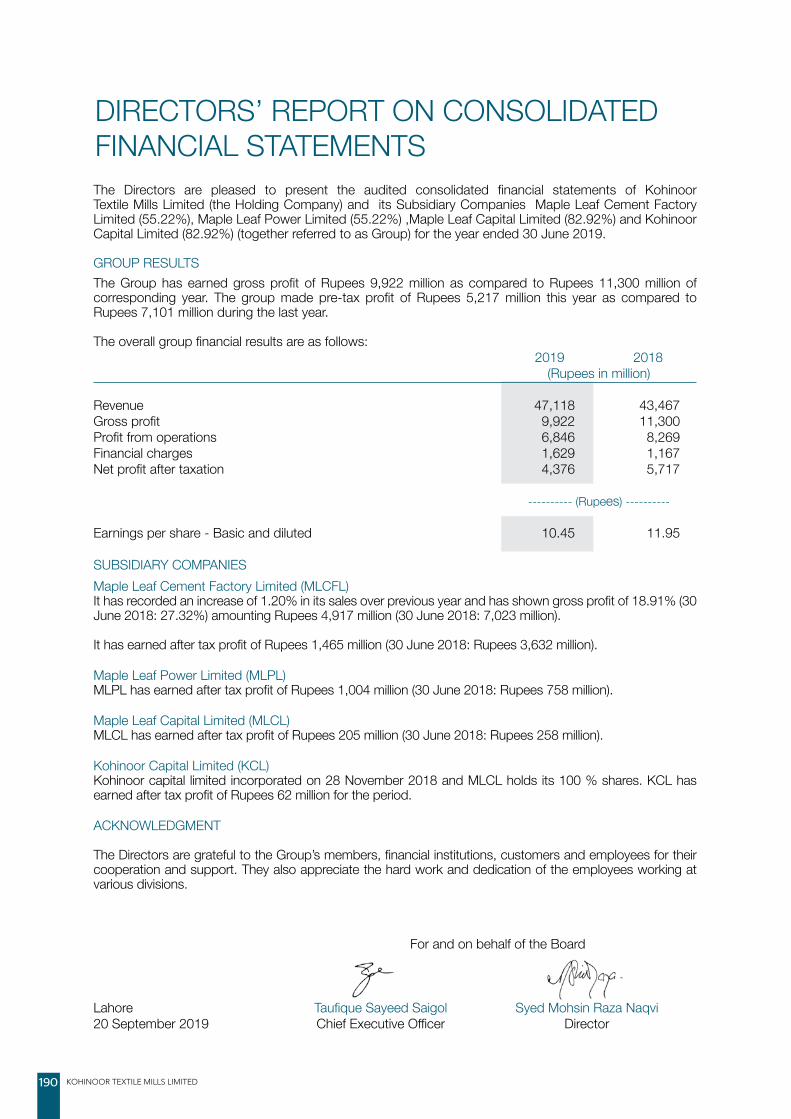
KOHINOOR TEXTILE MILLS LIMITED190
The Directors are pleased to present the audited consolidated financial statements of Kohinoor Textile Mills Limited (the Holding Company) and its Subsidiary Companies Maple Leaf Cement Factory Limited (55.22%), Maple Leaf Power Limited (55.22%) ,Maple Leaf Capital Limited (82.92%) and Kohinoor Capital Limited (82.92%) (together referred to as Group) for the year ended 30 June 2019.
GROUP RESULTS The Group has earned gross profit of Rupees 9,922 million as compared to Rupees 11,300 million of corresponding year. The group made pre‐tax profit of Rupees 5,217 million this year as compared to Rupees 7,101 million during the last year.
The overall group financial results are as follows: 2019 2018 (Rupees in million)
Revenue 47,118 43,467Gross profit 9,922 11,300Profit from operations 6,846 8,269Financial charges 1,629 1,167Net profit after taxation 4,376 5,717
---------- (Rupees) ----------
Earnings per share - Basic and diluted 10.45 11.95
SUBSIDIARY COMPANIES Maple Leaf Cement Factory Limited (MLCFL) It has recorded an increase of 1.20% in its sales over previous year and has shown gross profit of 18.91% (30 June 2018: 27.32%) amounting Rupees 4,917 million (30 June 2018: 7,023 million).
It has earned after tax profit of Rupees 1,465 million (30 June 2018: Rupees 3,632 million).
Maple Leaf Power Limited (MLPL) MLPL has earned after tax profit of Rupees 1,004 million (30 June 2018: Rupees 758 million).
Maple Leaf Capital Limited (MLCL) MLCL has earned after tax profit of Rupees 205 million (30 June 2018: Rupees 258 million).
Kohinoor Capital Limited (KCL) Kohinoor capital limited incorporated on 28 November 2018 and MLCL holds its 100 % shares. KCL has earned after tax profit of Rupees 62 million for the period.
ACKNOWLEDGMENT
The Directors are grateful to the Group’s members, financial institutions, customers and employees for their cooperation and support. They also appreciate the hard work and dedication of the employees working at various divisions.
For and on behalf of the Board
Lahore Taufique Sayeed Saigol Syed Mohsin Raza Naqvi 20 September 2019 Chief Executive Officer Director
DIRECTORS’ REPORT ON CONSOLIDATED FINANCIAL STATEMENTS

ANNUAL REPORT 2019 191
INDEPENDENT AUDITOR’S REPORT To the members of KOHINOOR TEXTILE MILLS LIMITED
Opinion
We have audited the annexed consolidated financial statements of Kohinoor Textile Mills Limited and its subsidiaries (the Group), which comprise the consolidated statement of financial position as at 30 June 2019, and the consolidated statement of profit or loss, the consolidated statement of comprehensive income, the consolidated statement of changes in equity and the consolidated statement of cash flows for the year then ended, and notes to the consolidated financial statements, including a summary of significant accounting policies and other explanatory information.
In our opinion, consolidated financial statements give a true and fair view of the consolidated financial position of the Group as at 30 June 2019, and of its consolidated financial performance and its consolidated cash flows for the year then ended in accordance with the accounting and reporting standards as applicable in Pakistan.
Basis for Opinion
We conducted our audit in accordance with International Standards on Auditing (ISAs) as applicable in Pakistan. Our responsibilities under those standards are further described in the Auditor’s Responsibilities for the Audit of the Consolidated Financial Statements section of our report. We are independent of the Group in accordance with the International Ethics Standards Board for Accountants’ Code of Ethics for Professional Accountants as adopted by the Institute of Chartered Accountants of Pakistan (the Code), and we have fulfilled our other ethical responsibilities in accordance with the Code. We believe that the audit evidence we have obtained is sufficient and appropriate to provide a basis for our opinion.
Key Audit Matters
Key audit matters are those matters that, in our professional judgment, were of most significance in our audit of the consolidated financial statements of the current period. These matters were addressed in the context of our audit of the consolidated financial statements as a whole, and in forming our opinion thereon, and we do not provide a separate opinion on these matters.

KOHINOOR TEXTILE MILLS LIMITED192
Following are the key audit matters:
Sr. No.
Key audit matters How the matter was addressed in our audit
1 Inventory existence and valuation:
Inventory of the textile business of the Group as at 30 June 2019 represented a material position in the consolidated statement of financial position.
The textile business of the Group is characterized by high volume serial production and the valuation and existence of inventories are significant to the Group. Therefore, considered as one of the key audit matters.
Inventories are stated at lower of cost and net realizable value. Cost is determined as per accounting policy disclosed in note 2.14 to the consolidated financial statements.
At year end, the valuation of inventory is reviewed by management and the cost of inventory is reduced where inventory is forecast to be sold below cost.
Useable stores, spare parts and loose tools are valued at moving average cost, raw materials are valued at annual average cost whereas, costing of work-in-process and finished goods is considered to carry more significant risk as the cost of material, labor and manufacturing overheads is allocated on the basis of complex formulas and involves management judgment.
The determination of whether inventory will be realized for a value less than cost requires management to exercise judgment and apply assumptions. Management undertakes the following procedures for determining the level of write down required:
• Use inventory ageing reports together with historical trends to estimate the likely future saleability of slow moving and older inventory items.
• Perform a line-by-line analysis of remaining inventory to ensure it is stated at the lower of cost and net realizable value and a specific write down is recognized, if required.
Our procedures over existence and valuation of inventory included, but were not limited to:
• To test the quantity of inventories at all locations, we assessed the corresponding inventory observation instructions and participated in inventory counts on sites. Based on samples, we performed test counts and compared the quantities counted by us with the results of the counts of the management.
• For a sample of inventory items, re-performed the weighted average cost calculation and compared the weighted average cost appearing on valuation sheets.
• Tested that the ageing report used by management correctly aged inventory items by agreeing a sample of aged inventory items to the last recorded invoice.
• On a sample basis, we tested the net realizable value of inventory items to recent selling prices and re-performed the calculation of the inventory write down, if any.
• Assessed the percentage write down applied to older inventory with reference to historic inventory write downs and recoveries on slow moving inventory.
• In the context of our testing of the calculation, we analyzed individual cost components and traced them back to the corresponding underlying documents. We furthermore challenged changes in unit costs.
• Made enquiries of management, including those outside of the finance function, and considered the results of our testing above to determine whether any specific write downs were required.

ANNUAL REPORT 2019 193
For further information on inventory, refer to the following:
- Summary of significant accounting policies, Inventories note 2.14 to the consolidated financial statements.
- Stores, spare parts and loose tools note 21 and Stock-in-trade note 22 to the consolidated financial statements.
2 Capital expenditures
The Group is investing significant amounts in its operations and there are a number of areas where management judgment impacts the carrying value of property, plant and equipment and its respective depreciation profile. These include among other the decision to capitalize or expense costs; and review of useful life of the assets including the impact of changes in the Group’s strategy.
We focused on this area since the amounts have a significant impact on the financial position of the Group and there is significant management judgment required that has significant impact on the reporting of the financial position for the Group. Therefore, considered as one of the key audit matters.
For further information, refer to the following: - Summary of significant accounting
policies, Property, plant, equipment and deprecation note 2.8 to the consolidated financial statements.
- Property, plant and equipment note 15 to the consolidated financial statements.
Our procedures included, but were not limited to:
• We tested operating effectiveness of controls in place over the property, plant and equipment cycle including the controls over whether costs incurred on activities is capital or operating in nature.
• We evaluated the appropriateness of capitalization policies and depreciation rates.
• We performed tests of details on costs capitalized.
• We verified the accuracy of management’s calculation used for the impairment testing.
3 Revenue recognition
The Group recognized net revenue of Rupees 47,118 million for the year ended 30 June 2019.
We identified recognition of revenue as a key audit matter because revenue is one of the key performance indicator of the Group and gives rise to an inherent risk that revenue could be subject to misstatement to meet expectations or targets.
For further information, refer to the following:
- Summary of significant accounting policies, Revenue from contracts with customers note 2.21 to the consolidated financial statements.
- Revenue note 29 to the consolidated financial statements.
Our procedures included, but were not limited to:
• We obtained an understanding of the process relating to recognition of revenue and testing the design, implementation and operating effectiveness of key internal controls over recording of revenue.
• We compared a sample of revenue transactions recorded during the year with sales orders, sales invoices, delivery documents and other relevant underlying documents.
• We compared a sample of revenue transactions recorded around the year-end with the sales orders, sales invoices, delivery documents and other relevant underlying documentation to assess if the related revenue was recorded in the appropriate accounting period.
• We assessed whether the accounting policies for revenue recognition complies with the requirements of IFRS 15 ‘Revenue from Contracts with Customers’; and

KOHINOOR TEXTILE MILLS LIMITED194
• We compared the details of a sample of journal entries posted to revenue accounts during the year, which met certain specific risk-based criteria, with the relevant underlying documentation.
• We also considered the appropriateness of disclosures in the financial statements.
4 Borrowings and finance costs
The cement and power segments of the Group have obtained range of financing facilities from different financial institutions with varying terms and tenures.
This was considered to be a key audit matter as these affects Group’s gearing, liquidity and solvency.Further, compliance with debt covenants is a key requirement of these financing arrangements.
For further information, refer to the following:
- Summary of significant accounting policies, Borrowings note 2.16 and Borrowing cost note 2.17 to the consolidated financial statements.
- Long term financing note 6 and finance cost note 35 to the consolidated financial statements.
Our audit procedures included the following:
• We assessed the design and operating effectiveness of the Group’s internal controls over recording the terms and conditions of borrowings from financial institutions, including their classification as either current or non-current and associated costs.
• We obtained confirmations of borrowings as at 30 June 2019 directly from the financial institutions.
• We tested the calculation of markup recognized as an expense and markup capitalized during the year to assess whether these were accounted for in accordance with approved accounting standards as applicable in Pakistan.
• We assessed whether loans maturing within twelve months were classified as current liabilities.
• We assessed the adequacy of the Group’s compliance with the loan covenants and the disclosure in the consolidated financial statements.
5 Valuation of trade debts
Pursuant to adoption of IFRS 9 ‘Financial Instruments’ and using the modified retrospective approach the Group has recognized Expected Credit Losses (“ECL”) of Rupees 95.323 million in opening retained earnings as at 01 July 2018 and Rupees 31.577 million for the year ended 30 June 2019.
IFRS 9 requires the Group to make provision for financial assets (trade debts) using Expected Credit Losses approach as against the Incurred Loss Model previously applied by the Group.
Determination of ECL provision for trade debts requires significant judgment and assumptions including consideration of factors such as historical credit loss experience and forward-looking macro-economic information.
For further information, refer to the following:
- Summary of significant accounting policies, note 2.12 to the consolidated financial statements.
- Trade debts note 23 to the consolidated financial statements.
Our audit procedures to assess valuation of trade debts included, but were not limited to:
• Reviewing the methodology developed and applied by the management to estimate the ECL in relation to trade debts, evaluating the key assumptions used (historical and forward looking), the policies applied to assess ECL in respect of trade debts and testing the mathematical accuracy of the ECL model by reperforming calculations on test basis;
• Involving our specialists to assess the ECL model and significant estimates, assumptions and judgments applied in developing ECL;
• Assessing, on a sample basis, the accuracy of the data used for ECL computation; and
• Assessing the adequacy of disclosure made in the consolidated financial statements in accordance with the requirements of the applicable accounting and reporting standards.

ANNUAL REPORT 2019 195
6 Investments in quoted securities
Investment segment of the Group invests significant portion of its portfolio in quoted securities. Due to requirements of applicable accounting and reporting standards relating to classification, measurement and disclosures of investments, it is considered as one of the key audit matter. Further, the value of the quoted investments is a significant input to confirm the amount of unrealized gain / (loss) on remeasurement of investments recognized in the consolidated statement of profit or loss.For further information, refer to the following:- Summary of significant accounting policies,
note 2.12 to the consolidated financial statements.
- Short term investments note 27 to the consolidated financial statements.
Our audit procedures included, but were not limited to:
• Documenting and assessing the processes and controls in place to record investment transactions and to value the portfolio.
• Agreeing the valuation of all of quoted investments from prices quoted on the Pakistan Stock Exchange Limited and redemption price in case of open-end mutual funds.
• Agreeing holding of all quoted investments from the Account Balance Report of Central Depository Company of Pakistan Limited and Statement of Account, in case of open-end mutual funds.
• Verifying the accuracy of management’s judgment used in classification of investments.
• Assuring the completeness and accuracy of gains / (losses) recognized in the consolidated statement of profit or loss of quoted investments.
7 Investment in gold
Investment segment of the Group has investment in 8,786 tola of gold as at the reporting date. The existence of investment in gold is a matter of most significance for the audit as the attendance of the physical metal count is impracticable due to security protocols. Further, the value of investment in gold is a significant input to confirm the amount of unrealized gain on remeasurement recognized in the consolidated statement of profit or loss. Therefore, it is considered as important and key audit matter because of its overall significance to the consolidated financial statements.For further information, refer to the following:- Summary of significant accounting
policies, Investment in gold note 2.13 to the consolidated financial statements.
- Investment in gold note 27 to the consolidated financial statements.
Our procedures over the existence,
• Completeness and valuation of investment in gold included, but were not limited to:
• Checked the quantity of gold held as at the reporting date from confirmation of physical gold holding under the custody of Pakistan Mercantile Exchange Limited (PMEX).
• Agreed the Group’s accounting records with the confirmation of investment in gold from PMEX.
• Verified transactions of gold purchased and sold during the year from supporting information and records.
• Recalculated the value of investment in gold using the rate quoted on PMEX as at the reporting date.
Information Other than the Financial Statements and Auditor’s Report Thereon
Management is responsible for the other information. The other information comprises the information included in the annual report, but does not include the consolidated financial statements and our auditor’s report thereon.
Our opinion on the consolidated financial statements does not cover the other information and we do not express any form of assurance conclusion thereon.
In connection with our audit of the consolidated financial statements, our responsibility is to read the

KOHINOOR TEXTILE MILLS LIMITED196
other information and, in doing so, consider whether the other information is materially inconsistent with the consolidated financial statements or our knowledge obtained in the audit or otherwise appears to be materially misstated. If, based on the work we have performed, we conclude that there is a material misstatement of this other information, we are required to report that fact. We have nothing to report in this regard.
Responsibilities of Management and Board of Directors for the Consolidated Financial Statements
Management is responsible for the preparation and fair presentation of the consolidated financial statements in accordance with the accounting and reporting standards as applicable in Pakistan and Companies Act, 2017 and for such internal control as management determines is necessary to enable the preparation of consolidated financial statements that are free from material misstatement, whether due to fraud or error.
In preparing the consolidated financial statements, management is responsible for assessing the Group’s ability to continue as a going concern, disclosing, as applicable, matters related to going concern and using the going concern basis of accounting unless management either intends to liquidate the Group or to cease operations, or has no realistic alternative but to do so.
Board of directors is responsible for overseeing the Group’s financial reporting process.
Auditor’s Responsibilities for the Audit of the Consolidated Financial Statements
Our objectives are to obtain reasonable assurance about whether the consolidated financial statements as a whole are free from material misstatement, whether due to fraud or error, and to issue an auditor’s report that includes our opinion. Reasonable assurance is a high level of assurance, but is not a guarantee that an audit conducted in accordance with ISAs as applicable in Pakistan will always detect a material misstatement when it exists. Misstatements can arise from fraud or error and are considered material if, individually or in the aggregate, they could reasonably be expected to influence the economic decisions of users taken on the basis of these consolidated financial statements.
As part of an audit in accordance with ISAs as applicable in Pakistan, we exercise professional judgment and maintain professional skepticism throughout the audit. We also:
• Identify and assess the risks of material misstatement of the consolidated financial statements, whether due to fraud or error, design and perform audit procedures responsive to those risks, and obtain audit evidence that is sufficient and appropriate to provide a basis for our opinion. The risk of not detecting a material misstatement resulting from fraud is higher than for one resulting from error, as fraud may involve collusion, forgery, intentional omissions, misrepresentations, or the override of internal control.
• Obtain an understanding of internal control relevant to the audit in order to design audit procedures that are appropriate in the circumstances, but not for the purpose of expressing an opinion on the effectiveness of the Group’s internal control.
• Evaluate the appropriateness of accounting policies used and the reasonableness of accounting estimates and related disclosures made by management.
• Conclude on the appropriateness of management’s use of the going concern basis of accounting and, based on the audit evidence obtained, whether a material uncertainty exists related to events or conditions that may cast significant doubt on the Group’s ability to continue as a going concern. If we conclude that a material uncertainty exists, we are required to draw attention in our auditor’s report to the related disclosures in the consolidated financial statements or, if such disclosures are inadequate, to modify our opinion. Our conclusions are based on the audit evidence obtained up to the date of our auditor’s report. However, future events or conditions may cause the Group to cease to continue as a going concern.
• Evaluate the overall presentation, structure and content of the consolidated financial statements,

ANNUAL REPORT 2019 197
including the disclosures, and whether the consolidated financial statements represent the underlying transactions and events in a manner that achieves fair presentation.
• Obtain sufficient appropriate audit evidence regarding the financial information of the entities or business activities within the Group to express an opinion on the consolidated financial statements. We are responsible for the direction, supervision and performance of the group audit. We remain solely responsible for our audit opinion.
We communicate with the Board of Directors regarding, among other matters, the planned scope and timing of the audit and significant audit findings, including any significant deficiencies in internal control that we identify during our audit.
We also provide the Board of Directors with a statement that we have complied with relevant ethical requirements regarding independence, and to communicate with them all relationships and other matters that may reasonably be thought to bear on our independence, and where applicable, related safeguards.
From the matters communicated with the Board of Directors, we determine those matters that were of most significance in the audit of the consolidated financial statements of the current period and are therefore the key audit matters. We describe these matters in our auditor’s report unless law or regulation precludes public disclosure about the matter or when, in extremely rare circumstances, we determine that a matter should not be communicated in our report because the adverse consequences of doing so would reasonably be expected to outweigh the public interest benefits of such communication.
The engagement partner on the audit resulting in this independent auditor’s report is Raheel Arshad.
RIAZ AHMAD & COMPANYChartered Accountants Islamabad
DATE: 20 September 2019

KOHINOOR TEXTILE MILLS LIMITED198
CONSOLIDATED STATEMENT OF FINANCIAL POSITION As at June 30, 2019
CHIEF EXECUTIVE OFFICER DIRECTOR CHIEF FINANCIAL OFFICER
2019 2018 Note (Rupees in thousand)
EQUITY AND LIABILITIES SHARE CAPITAL AND RESERVES Authorized share capital 370,000,000 (2018: 370,000,000) ordinary shares of Rupees 10 each 3,700,000 3,700,000 30,000,000 (2018: 30,000,000) preference shares of Rupees 10 each 300,000 300,000 4,000,000 4,000,000 Issued, subscribed and paid-up share capital 3 2,992,964 2,992,964 Reserves 4 Capital reserves . Share premium 986,077 986,077 Surplus on revaluation of freehold land and investment properties 4,036,717 4,036,717 5,022,794 5,022,794 Revenue reserves General reserve 1,450,491 1,450,491 Unappropriated profit 19,940,200 17,480,368 21,390,691 18,930,859 Equity attributable to equity holders of the Holding Company 29,406,449 26,946,617 Non-controlling interest 5 13,801,463 12,869,953 Total equity 43,207,912 39,816,570 LIABILITIES NON-CURRENT LIABILITIES Long term financing 6 17,525,526 14,277,179 Long term deposits 7 8,664 8,715 Retirement benefits 8 205,354 183,764 Retention money payable 9 368,499 310,735 Deferred income tax liability 10 3,106,416 2,850,450 21,214,459 17,630,843 CURRENT LIABILITIES Trade and other payables 11 9,618,449 7,079,339 Accrued mark-up 12 654,226 339,808 Unclaimed dividend 64,148 131,500 Short term borrowings 13 7,834,559 9,988,756 Current portion of non-current liabilities 6 1,726,554 1,198,917 19,897,936 18,738,320 TOTAL LIABILITIES 41,112,395 36,369,163 CONTINGENCIES AND COMMITMENTS 14 TOTAL EQUITY AND LIABILITIES 84,320,307 76,185,733 The annexed notes form an integral part of these consolidated financial statements.

ANNUAL REPORT 2019 199 CHIEF EXECUTIVE OFFICER DIRECTOR CHIEF FINANCIAL OFFICER
2019 2018 Note (Rupees in thousand)
ASSETS NON-CURRENT ASSETS Property, plant and equipment 15 56,312,808 50,049,675 Investment properties 16 1,792,755 1,792,755 Intangibles 17 13,530 16,811 Long term loans to employees 18 19,824 9,472 Long term investments 19 24,819 - Long term deposits 20 109,469 106,178 58,273,205 51,974,891 CURRENT ASSETS Stores, spare parts and loose tools 21 8,006,508 7,554,693 Stock-in-trade 22 5,553,361 3,768,345 Trade debts 23 4,227,634 2,977,474 Loans and advances 24 1,187,272 3,253,082 Security deposits and short term prepayments 25 214,114 133,919 Other receivables 26 855,204 972,861 Taxation - net 542,137 564,605 Short term investments 27 4,467,921 3,881,120 Cash and bank balances 28 992,951 1,104,743 26,047,102 24,210,842
TOTAL ASSETS 84,320,307 76,185,733
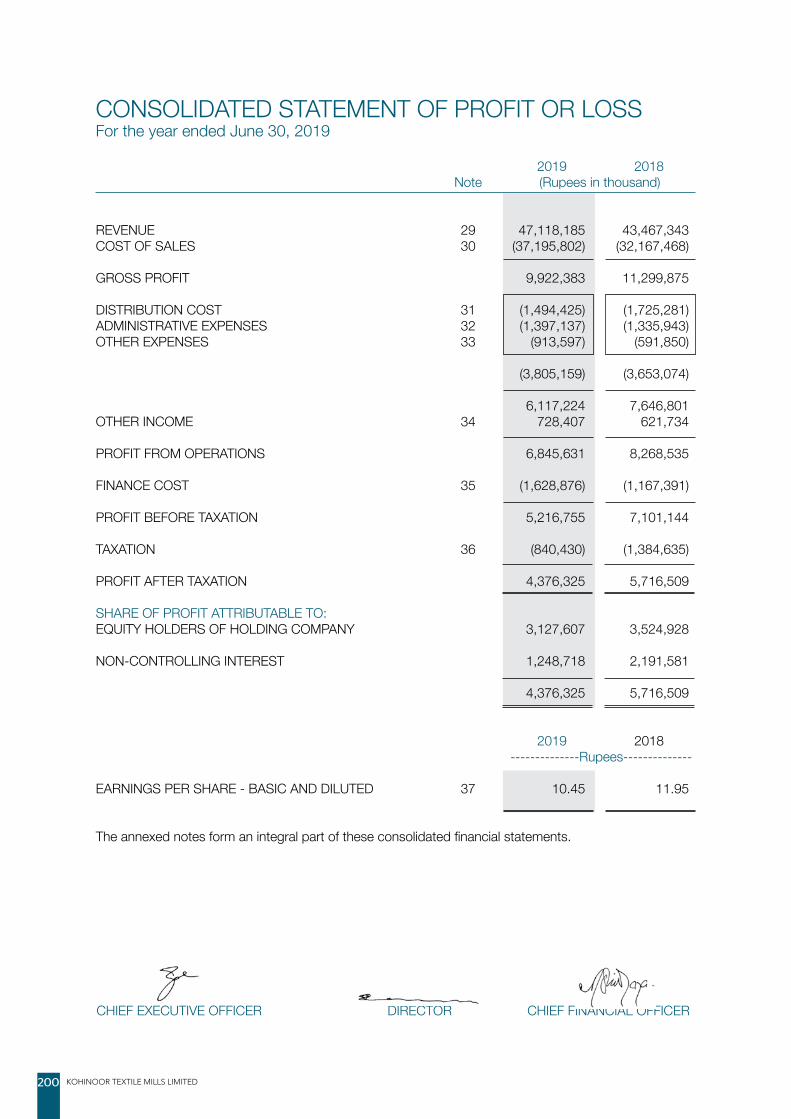
KOHINOOR TEXTILE MILLS LIMITED200
2019 2018 Note (Rupees in thousand)
REVENUE 29 47,118,185 43,467,343 COST OF SALES 30 (37,195,802) (32,167,468) GROSS PROFIT 9,922,383 11,299,875 DISTRIBUTION COST 31 (1,494,425) (1,725,281)ADMINISTRATIVE EXPENSES 32 (1,397,137) (1,335,943)OTHER EXPENSES 33 (913,597) (591,850) (3,805,159) (3,653,074) 6,117,224 7,646,801 OTHER INCOME 34 728,407 621,734 PROFIT FROM OPERATIONS 6,845,631 8,268,535 FINANCE COST 35 (1,628,876) (1,167,391) PROFIT BEFORE TAXATION 5,216,755 7,101,144 TAXATION 36 (840,430) (1,384,635) PROFIT AFTER TAXATION 4,376,325 5,716,509 SHARE OF PROFIT ATTRIBUTABLE TO: EQUITY HOLDERS OF HOLDING COMPANY 3,127,607 3,524,928 NON-CONTROLLING INTEREST 1,248,718 2,191,581 4,376,325 5,716,509 2019 2018 --------------Rupees-------------- EARNINGS PER SHARE - BASIC AND DILUTED 37 10.45 11.95
The annexed notes form an integral part of these consolidated financial statements.
CONSOLIDATED STATEMENT OF PROFIT OR LOSS For the year ended June 30, 2019
CHIEF EXECUTIVE OFFICER DIRECTOR CHIEF FINANCIAL OFFICER

ANNUAL REPORT 2019 201
2019 2018 (Rupees in thousand)
PROFIT AFTER TAXATION 4,376,325 5,716,509 OTHER COMPREHENSIVE INCOME / (LOSS) Items that will not be reclassified to profit or loss Re-measurement of defined benefit liability (33,620) (27,012) Related deferred income tax 8,411 6,737
(25,209) (20,275) Gain on revaluation of land - 20,591 (25,209) 316 Items that may be reclassified subsequently to profit or loss - - Other comprehensive (loss) / income for the year - net of tax (25,209) 316 TOTAL COMPREHENSIVE INCOME FOR THE YEAR 4,351,116 5,716,825 SHARE OF TOTAL COMPREHENSIVE INCOME ATTRIBUTABLE TO:
EQUITY HOLDERS OF HOLDING COMPANY 3,113,687 3,534,323 NON-CONTROLLING INTEREST 1,237,429 2,182,502 4,351,116 5,716,825 The annexed notes form an integral part of these consolidated financial statements.
CONSOLIDATED STATEMENT OF COMPREHENSIVE INCOME For the year ended June 30, 2019
CHIEF EXECUTIVE OFFICER DIRECTOR CHIEF FINANCIAL OFFICER

KOHINOOR TEXTILE MILLS LIMITED202
CONS
OLI
DATE
D ST
ATEM
ENT
OF
CHAN
GES
IN E
QUI
TY
For t
he y
ear e
nded
Jun
e 30
, 201
9
CHIE
F EX
ECUT
IVE
OFF
ICER
DIRE
CTO
R C
HIEF
FIN
ANCI
AL O
FFIC
ER
Re
serv
es
Cap
ital r
eser
ves
Reve
nue
rese
rves
Non-
S
hare
Surp
lus
on
Tota
l To
tal
cont
rollin
g To
tal
ca
pita
l Sh
are
reva
luat
ion
of
Sub
- To
tal
Gen
eral
Unap
prop
riated
Su
b-To
tal
rese
rves
inte
rest
eq
uity
prem
ium
fre
ehol
d lan
d
rese
rves
pr
ofit
and
inve
stm
ent
pr
oper
ties
….…
……
……
….…
…...
…..…
……
….…
…...
…..…
..…..…
… (
Rupe
es in
thou
sand
) …
.……
……
……
...…
.……
…...
…..…
……
.……
...…
..….…
…
Balan
ce a
s at
30
June
201
7 2
,823
,551
1
44,9
19
4,0
16,1
26
4,1
61,0
45
1,4
50,4
91
14,
743,
113
16
,193
,604
2
0,35
4,64
9
23,
178,
200
9
,600
,270
3
2,77
8,47
0 Tr
ansa
ctio
ns w
ith o
wne
rs:
- Fin
al di
viden
d fo
r the
yea
r end
ed 3
0 Ju
ne 2
017
@
Rup
ees
1.50
per
sha
re
-
-
-
-
-
(423
,533
) (4
23,5
33)
(423
,533
) (4
23,5
33)
-
(423
,533
)- I
nter
im d
ivide
nd fo
r the
yea
r end
ed 3
0 Ju
ne 2
018
@
Rup
ees
1.25
per
sha
re
-
-
-
-
-
(352
,944
) (3
52,9
44)
(352
,944
) (3
52,9
44)
-
(352
,944
)- I
ssua
nce
of ri
ght s
hare
s 1
69,4
13
841
,158
-
8
41,1
58
-
-
-
841
,158
1
,010
,571
1
,899
,522
2
,910
,093
- D
ivide
nd p
aid to
non
-con
trollin
g in
tere
st h
olde
rs
-
-
-
-
-
-
-
-
-
(812
,341
) (8
12,3
41)
Tota
l tra
nsac
tions
with
ow
ners
1
69,4
13
841
,158
-
8
41,1
58
-
(776
,477
) (7
76,4
77)
64,
681
2
34,0
94
1,0
87,1
81
1,3
21,2
75
Pr
ofit f
or th
e ye
ar
-
-
-
-
-
3,5
24,9
28
3,5
24,9
28
3,5
24,9
28
3,5
24,9
28
2,1
91,5
81
5,7
16,5
09
Oth
er c
ompr
ehen
sive
inco
me
/ (lo
ss) f
or th
e ye
ar
-
-
20,
591
2
0,59
1
-
(11,
196)
(1
1,19
6)
9,3
95
9,3
95
(9,0
79)
316
To
tal c
ompr
ehen
sive
inco
me
for t
he y
ear
-
-
20,
591
2
0,59
1
-
3,5
13,7
32
3,5
13,7
32
3,5
34,3
23
3,5
34,3
23
2,1
82,5
02
5,7
16,8
25
Balan
ce a
s at
30
June
201
8
2,9
92,9
64
986
,077
4
,036
,717
5
,022
,794
1
,450
,491
1
7,48
0,36
8
18,9
30,8
59
23,
953,
653
2
6,94
6,61
7
12,
869,
953
3
9,81
6,57
0
Adju
stm
ent o
n ad
optio
n of
IFRS
9 (n
ote
2.12
) -
-
-
-
-
(5
5,26
3)
(55,
263)
(5
5,26
3)
(55,
263)
(4
0,06
0)
(95,
323)
Adju
sted
tota
l equ
ity a
s at
01
July
2018
2
,992
,964
9
86,0
77
4,0
36,7
17
5,0
22,7
94
1,4
50,4
91
17,
425,
105
18
,875
,596
2
3,89
8,39
0
26,
891,
354
1
2,82
9,89
3
39,
721,
247
Tr
ansa
ctio
ns w
ith o
wne
rs:
- Fin
al di
viden
d fo
r the
yea
r end
ed 3
0 Ju
ne 2
018
@
Rup
ee 1
.00
per s
hare
-
-
-
-
-
(2
99,2
96)
(299
,296
) (2
99,2
96)
(299
,296
) -
(2
99,2
96)
- Int
erim
divi
dend
for t
he y
ear e
nded
30
June
201
9
@ R
upee
1.0
0 pe
r sha
re
-
-
-
-
-
(299
,296
) (2
99,2
96)
(299
,296
) (2
99,2
96)
-
(299
,296
)- D
ivide
nd p
aid to
non
-con
trollin
g in
tere
st h
olde
rs
-
-
-
-
-
-
-
-
-
(265
,859
) (2
65,8
59)
To
tal t
rans
actio
ns w
ith o
wne
rs
-
-
-
-
-
(598
,592
) (5
98,5
92)
(598
,592
) (5
98,5
92)
(265
,859
) (8
64,4
51)
Pr
ofit f
or th
e ye
ar
-
-
-
-
-
3,1
27,6
07
3,1
27,6
07
3,1
27,6
07
3,1
27,6
07
1,2
48,7
18
4,3
76,3
25
Oth
er c
ompr
ehen
sive
loss
for t
he y
ear
-
-
-
-
-
(13,
920)
(1
3,92
0)
(13,
920)
(1
3,92
0)
(11,
289)
(2
5,20
9)
Tota
l com
preh
ensiv
e in
com
e fo
r the
yea
r -
-
-
-
-
3
,113
,687
3
,113
,687
3
,113
,687
3
,113
,687
1
,237
,429
4
,351
,116
Balan
ce a
s at
30
June
201
9 2
,992
,964
9
86,0
77
4,0
36,7
17
5,0
22,7
94
1,4
50,4
91
19,
940,
200
21
,390
,691
2
6,41
3,48
5
29,
406,
449
1
3,80
1,46
3
43,
207,
912
Th
e an
nexe
d no
tes
form
an
inte
gral
part
of th
ese
cons
olid
ated
fina
ncial
sta
tem
ents
.
ATTR
IBUT
ABLE
TO
EQ
UITY
HO
LDER
S O
F TH
E HO
LDIN
G C
OM
PANY

ANNUAL REPORT 2019 203
2019 2018 Note (Rupees in thousand)
CASH FLOWS FROM OPERATING ACTIVITIES Cash generated from operations 38 9,932,632 8,735,608 Finance cost paid (1,314,458) (973,276)Employee benefits paid (38,020) (40,084)Income tax paid (559,586) (2,735,805)Increase in retention money payable - 310,735 Net increase in long term loans to employees (10,352) (3,673)Net (increase) / decrease in long term deposits (3,342) 6,975 Net cash generated from operating activities 8,006,874 5,300,480 CASH FLOWS FROM INVESTING ACTIVITIES Capital expenditure on property, plant and equipment (9,280,599) (21,438,841)Intangibles (5,219) - Proceeds from sale of property, plant and equipment 146,619 70,800 Long term investments made (24,819) - Increase in retention money payable 34,796 - Interest received 44,915 52,859 Dividend received 275,663 7,007 Net cash used in investing activities (8,808,644) (21,308,175) CASH FLOWS FROM FINANCING ACTIVITIES Proceeds from long term financing 4,149,549 11,090,924 Repayment of long term financing (373,565) (272,328)Decrease in long term deposits - 16 Short term borrowings - net (2,154,197) 3,662,731 Issue of right shares - 2,910,093 Repayment of liabilities against assets subject to finance lease - (501,332)Dividend paid (931,809) (1,594,840) Net cash from financing activities 689,978 15,295,264 Net decrease in cash and cash equivalents (111,792) (712,431)Cash and cash equivalents at the beginning of the year 1,104,743 1,817,174 Cash and cash equivalents at the end of the year 992,951 1,104,743
The annexed notes form an integral part of these consolidated financial statements.
CONSOLIDATED STATEMENT OF CASH FLOWSFor the year ended June 30, 2019
CHIEF EXECUTIVE OFFICER DIRECTOR CHIEF FINANCIAL OFFICER

KOHINOOR TEXTILE MILLS LIMITED204
NOTES TO THE CONSOLIDATED FINANCIAL STATEMENTS For the year ended June 30, 2019
1. THE GROUP AND ITS OPERATIONS 1.1 Holding Company Kohinoor Textile Mills Limited is a public limited company incorporated in Pakistan under the
Companies Act, 1913 (now the Companies Act, 2017) and listed on Pakistan Stock Exchange Limited. The registered office of the Holding Company is situated at 42-Lawrence Road, Lahore. The principal activity of the Holding Company is manufacturing of yarn and cloth, processing and stitching the cloth and trade of textile products.
1.2 Subsidiary companies 1.2.1 Maple Leaf Cement Factory Limited (MLCFL) Maple Leaf Cement Factory Limited (“the Subsidiary Company”) was incorporated in Pakistan
on 13 April 1960 under the Companies Act, 1913 (now the Companies Act, 2017) as a public company limited by shares. MLCFL is listed on Pakistan Stock Exchange Limited. The registered office of MLCFL is situated at 42-Lawrence Road, Lahore. MLCFL is engaged in production and sale of cement.
1.2.2 Maple Leaf Capital Limited (MLCL) Maple Leaf Capital Limited (“the Subsidiary Company”) was incorporated in Pakistan on 25
April 2014 under the Companies Ordinance, 1984 (now the Companies Act, 2017) as a public company limited by shares. The registered office of MLCL is situated at 42-Lawrence Road, Lahore. The principal objects of MLCL are to buy, sell, hold or otherwise acquire or invest the capital in any sort of financial instruments and commodities.
1.2.3 Maple Leaf Power Limited (MLPL) Maple Leaf Power Limited was incorporated in Pakistan on 15 October 2015 as a public company
limited by shares under the Companies Ordinance, 1984 (now the Companies Act, 2017). It is subsidiary of MLCFL, which is subsidiary of the Holding company. MLPL has been established to set up and operate a 40-megawatt coal fired power generation plant at Iskanderabad, District Mianwali for generation of electricity. The registered office of MLPL is located at 42-Lawrence Road, Lahore. The principal object of MLPL is to develop, design, operate and maintain electric power generation plant and in connection therewith to engage in the business of generation, sale and supply of electricity to MLCFL.
MLPL was granted electricity generation license from National Electric and Power Regulatory
Authority (NEPRA) on 20 December 2016. On 04 July 2017, MLPL has entered into Power Purchase agreement (PPA) with MLCFL which is valid for 20 years.
1.2.4 Kohinoor Capital Limited (KCL) Kohinoor Capital Limited was incorporated in Pakistan on 28 November 2018 as a public
company limited by shares under the Companies Act, 2017. Its registered office and head office is situated at 42-Lawrence Road, Lahore. The principal objects of the Company are to buy, sell, hold or otherwise acquire or invest the capital in any sort of financial instruments and commodities. The KCL is a wholly owned subsidiary of Maple Leaf Capital Limited, which is subsidiary of the Holding company.

ANNUAL REPORT 2019 205
The Holding and Subsidiary companies are collectively referred to as “the Group” in these consolidated financial statements.
1.3 Geographical location and addresses of all business units are as follows:
Sr. No. Manufacturing units and office Address Manufacturing units: 1 Spinning and Home textile units. Peshawar Road, Rawalpindi. 2 Spinning unit. Gulyana Road, Gujar Khan, District Rawalpindi. 3 Weaving unit. 8 K.M. Manga Raiwind Road, District Kasur. 4 Cement and Power plant Iskanderabad, District Mianwali Head office 42-Lawrence Road, Lahore. 2. SUMMARY OF SIGNIFICANT ACCOUNTING POLICIES The significant accounting policies applied in the preparation of these consolidated financial statements
are set out below. These policies have been consistently applied to all years presented, unless otherwise stated:
2.1 Basis of preparation a) Statement of compliance These consolidated financial statements have been prepared in accordance with the accounting
and reporting standards as applicable in Pakistan. The accounting and reporting standards applicable in Pakistan comprise of:
- International Financial Reporting Standards (IFRSs) issued by the International Accounting Standards Board (IASB) as notified under the Companies Act, 2017; and
- Provisions of and directives issued under the Companies Act, 2017. Where provisions of and directives issued under the Companies Act, 2017 differ from the IFRSs,
the provisions of and directives issued under the Companies Act, 2017 have been followed. b) Accounting convention These consolidated financial statements have been prepared under the historical cost
convention, except for certain financial instruments, investment properties and freehold land which are carried at their fair values and certain employee retirement benefits which are carried at their present values.
c) Critical accounting estimates and judgments The preparation of consolidated financial statements in conformity with the approved accounting
standards requires the use of certain critical accounting estimates. It also requires the management to exercise its judgment in the process of applying the Group’s accounting policies. Estimates and judgments are continually evaluated and are based on historical experience and other factors, including expectations of future events that are believed to be reasonable under the circumstances. The areas where various assumptions and estimates are significant to the Group’s consolidated financial statements or where judgments were exercised in application of accounting policies are as follows:

KOHINOOR TEXTILE MILLS LIMITED206
Useful lives, patterns of economic benefits and impairments Estimates with respect to residual values, useful lives and pattern of flow of economic benefits
are based on the analysis of the management of the Group. Further, the Group reviews the value of assets for possible impairment on an annual basis. Any change in the estimates in the future might affect the carrying amount of respective item of property, plant and equipment, with a corresponding effect on the depreciation charge and impairment.
Inventories Net realizable value of inventories is determined with reference to currently prevailing selling
prices less estimated expenditure to make sales. Income tax In making the estimates for income tax currently payable by the Group, the management takes
into account the current income tax law and the decisions of appellate authorities on certain issues in the past.
Allowance for expected credit losses The allowance for expected credit losses assessment requires a degree of estimation and
judgment. It is based on the lifetime expected credit loss, grouped based on days overdue, and makes assumptions to allocate an overall expected credit loss rate for each group. These assumptions include recent sales experience and historical collection rates.
Classification of investments
The management of the Group determines the appropriate classification of its investments at the time of purchase or increase in holding and classifies its investments in accordance with IFRS 9 “Financial Instruments”.
Revenue from contracts with customers involving sale of goods When recognizing revenue in relation to the sale of goods to customers, the key performance
obligation of the Group is considered to be the point of delivery of the goods to the customer, as this is deemed to be the time that the customer obtains control of the promised goods and therefore, the benefits of unimpeded access.
Employee benefits The Subsidiary Companies Maple Leaf Cement Factory Limited (MLCFL) and Maple Leaf Power
Limited (MLPL) operate approved funded gratuity schemes covering all its full time permanent workers who have completed the minimum qualifying period of service as defined under the respective scheme. The gratuity scheme is managed by trustees. The calculation of the benefit requires assumptions to be made of future outcomes, the principal ones being in respect of increase in remuneration and the discount rate used to convert future cash flows to current values. The assumptions used for the plan are determined by independent actuary on annual basis.
The amount of the expected return on plan assets is calculated using the expected rate of
return for the year and the market - related value at the beginning of the year. Gratuity cost primarily represents the increase in actuarial present value of the obligation for benefits earned on employee service during the year and the interest on the obligation in respect of employee service in previous years, net of the expected return on plan assets. Calculations are sensitive to changes in the underlying assumptions.

ANNUAL REPORT 2019 207
Impairment The management of the Group reviews carrying amounts of its assets including receivables and
advances and cash generating units for possible impairment and makes formal estimates of recoverable amount if there is any such indication.
Provisions and contingencies The Group reviews the status of all pending litigations and claims against the Group. Based
on the judgment and the advice of the legal advisors for the estimated financial outcome, appropriate disclosure or provision is made. The actual outcome of these litigations and claims can have an effect on the carrying amounts of the liabilities recognized at the consolidated statement of financial position date.
d) Standards, interpretations and amendments to published approved accounting standards that
are effective in current year and are relevant to the Group Following standards, interpretations and amendments to published approved accounting
standards are mandatory for the Group’s accounting periods beginning on or after 01 July 2018:
· IFRS 9 ‘Financial Instruments’ · IFRS 15 ‘Revenue from Contracts with Customers’ · IFRS 15 (Amendments), ‘Revenue from Contracts with Customers’ · IAS 40 (Amendments), ‘Investment Property’ · IFRIC 22 ‘Foreign Currency Transactions and Advance Consideration’ · Annual Improvements to IFRSs: 2014 – 2016 Cycle The Group had to change its accounting policies and make certain adjustments without restating
prior year results following the adoption of IFRS 9 and IFRS 15. These are disclosed in note 2.12 and note 2.21. Most of the other amendments listed above did not have any impact on the amounts recognized in prior periods and are not expected to significantly affect the current or future periods.
e) Standards, interpretations and amendments to published approved accounting standards that
are not yet effective but relevant to the Group Following standards, interpretations and amendments to existing standards have been published
and are mandatory for the Group’s accounting periods beginning on or after 01 July 2019 or later periods:
IFRS 16 ‘Lease’ (effective for annual periods beginning on or after 01 January 2019). IFRS 16
specifies how an entity will recognize, measure, present and disclose leases. The standard provides a single lessee accounting model, requiring lessees to recognize assets and liabilities for all leases unless the lease term is 12 months or less or the underlying asset has a low value. Lessors continue to classify leases as operating or finance, with IFRS 16 approach to lessor accounting substantially unchanged from its predecessor, IAS 17 ‘Leases’. IFRS 16 replaces IAS 17, IFRIC 4 ‘Determining Whether an Arrangement Contains a Lease’, SIC-15 ‘Operating Leases–Incentives’ and SIC-27 ‘Evaluating the Substance of Transactions Involving the Legal Form of a Lease’. The management of the Group is in the process of evaluating the impacts of the aforesaid standard on the Group’s consolidated financial statements.
Amendments to IAS 19 ‘Employee Benefits’ - Plan Amendment, Curtailment or Settlement
(effective for annual periods beginning on or after 1 January 2019). The amendments clarify that on amendment, curtailment or settlement of a defined benefit plan, a company now uses updated actuarial assumptions to determine its current service cost and net interest for the period; and the effect of the asset ceiling is disregarded when calculating the gain or loss on

KOHINOOR TEXTILE MILLS LIMITED208
any settlement of the plan and is dealt with separately in other comprehensive income. The application of amendments is not likely to have an impact on Group’s consolidated financial statements.
Amendments to IFRS 9 (effective for annual periods beginning on or after 01 January 2019)
clarify that for the purpose of assessing whether a prepayment feature meets the solely payments of principal and interest (‘SPPI’) condition, the party exercising the option may pay or receive reasonable compensation for the prepayment irrespective of the reason for prepayment. In other words, prepayment features with negative compensation do not automatically fail SPPI. The amendments are not likely to have significant impact on the Group’s consolidated financial statements.
IFRIC 23 ‘Uncertainty over Income Tax Treatments’ (effective for annual periods beginning on
or after 01 January 2019). The interpretation addresses the determination of taxable profit (tax loss), tax bases, unused tax losses, unused tax credits and tax rates, when there is uncertainty over income tax treatments under IAS 12 ‘Income Taxes’. It specifically considers: whether tax treatments should be considered collectively; assumptions for taxation authorities’ examinations; the determination of taxable profit (tax loss), tax bases, unused tax losses, unused tax credits and tax rates; and the effect of changes in facts and circumstances. The interpretation is not expected to have a material impact on the Group’s consolidated financial statements.
Amendments to IFRS 10 ‘Consolidated Financial Statements’ and IAS 28 (deferred indefinitely)
to clarify the treatment of the sale or contribution of assets from an investor to its associates or joint venture, as follows: require full recognition in the investor’s financial statements of gains and losses arising on the sale or contribution of assets that constitute a business (as defined in IFRS 3 ‘Business Combinations’); require the partial recognition of gains and losses where the assets do not constitute a business, i.e. a gain or loss is recognized only to the extent of the unrelated investors’ interests in that associate or joint venture. These requirements apply regardless of the legal form of the transaction, e.g. whether the sale or contribution of assets occur by an investor transferring shares in a subsidiary that holds the assets (resulting in loss of control of the subsidiary), or by the direct sale of the assets themselves. The management of the Group is in the process of evaluating the impacts of the aforesaid amendments on the Group’s consolidated financial statements.
Amendments to IFRS 3 ‘Business Combinations’ (effective for annual periods beginning on
or after 01 January 2020). The International Accounting Standards Board (IASB) has issued ‘Definition of Business’ aimed at resolving the difficulties that arise when an entity determines whether it has acquired a business or a group of assets. The amendments clarify that to be considered a business, an acquired set of activities and assets must include, at a minimum, an input and a substantive process that together significantly contribute to the ability to create outputs. The amendments include an election to use a concentration test. The standard is effective for transactions in the future and therefore, would not have an impact on past consolidated financial statements.
Amendments to IAS 1 ‘Presentation of Financial Statements’ and IAS 8 ‘Accounting Policies,
Changes in Accounting Estimates and Errors’ (effective for annual periods beginning on or after 01 January 2020). The amendments are intended to make the definition of material in IAS 1 easier to understand and are not intended to alter the underlying concept of materiality in IFRS. In addition, the IASB has also issued guidance on how to make materiality judgments when preparing general purpose financial statements in accordance with IFRS.
On 12 December 2017, IASB issued Annual Improvements to IFRSs: 2015 – 2017 Cycle,
incorporating amendments to four IFRSs more specifically in IFRS 3 ‘Business Combinations’, IFRS 11 ‘Joint Arrangements’, IAS 12 ‘Income Taxes’ and IAS 23 ‘Borrowing Costs’. The amendments are effective for annual periods beginning on or after 01 January 2019. The amendments have no significant impact on the Group’s consolidated financial statements and have therefore not been analyzed in detail.
ANNUAL REPORT 2019 209
On 29 March 2018, the International Accounting Standards Board (the IASB) has issued a revised Conceptual Framework. The new Framework: re-introduces the terms stewardship and prudence; introduces a new asset definition that focuses on rights and a new liability definition that is likely to be broader than the definition it replaces, but does not change the distinction between a liability and an equity instrument; removes from the asset and liability definitions references to the expected flow of economic benefits this lowers the hurdle for identifying the existence of an asset or liability and puts more emphasis on reflecting uncertainty in measurement; discusses historical cost and current value measures, and provides some guidance on how the IASB would go about selecting a measurement basis for a particular asset or liability; states that the primary measure of financial performance is profit or loss, and that only in exceptional circumstances will the IASB use other comprehensive income and only for income or expenses that arise from a change in the current value of an asset or liability; and discusses uncertainty, derecognition, unit of account, the reporting entity and combined financial statements. The Framework is not an IFRS standard and does not override any standard, so nothing will change in the short term. The revised Framework will be used in future standard-setting decisions, but no changes will be made to current IFRS. Preparers might also use the Framework to assist them in developing accounting policies where an issue is not addressed by an IFRS. It is effective for annual periods beginning on or after 01 January 2020 for preparers that develop an accounting policy based on the Framework.
f) Standards and amendments to approved published standards that are not yet effective and not
considered relevant to the Group There are other standards and amendments to published standards that are mandatory for
accounting periods beginning on or after 01 July 2019 but are considered not to be relevant or do not have any significant impact on the Group’s consolidated financial statements and are therefore, not detailed in these consolidated financial statements.
2.2 Basis of consolidation Subsidiary is an entity over which the Group has control. The Group controls an entity when
the Group is exposed to, or has rights to, variable returns from its involvement with the entity and has the ability to affect those returns through its power to direct the activities of the entity. Subsidiary is fully consolidated from the date on which control is transferred to the Group. It is deconsolidated from the date that control ceases.
The assets and liabilities of the Subsidiary Companies have been consolidated on a line by line
basis and carrying value of investments held by the Holding Company is eliminated against Holding Company’s share in paid up capital of the Subsidiary Companies.
Intra-group balances and transactions have been eliminated. Non-controlling interest is that part of net results of the operations and of net assets of the
Subsidiary Companies attributable to interest which is not owned by the Holding Company. Non-controlling interest is presented as separate item in the consolidated financial statements.
2.3 Employee benefit i) Defined contribution plan The Group operates an approved funded provident fund scheme covering all permanent
employees. Equal monthly contributions are made both by the Group and employees to the fund. The Group’s contributions to the fund are charged to consolidated statement of profit or loss.

KOHINOOR TEXTILE MILLS LIMITED210
ii) Defined benefit plan MLCFL operates approved funded gratuity scheme for all its workers who have completed
the minimum qualifying period of service as defined under the respective scheme. Provision is made annually to cover obligations under the scheme on the basis of actuarial valuation and is charged to consolidated statement of profit or loss.
MLCFL net obligation in respect of defined benefit plan is calculated by estimating the amount
of future benefit that employees have earned in the current and prior periods, discounting that amount and deducting the fair value of any plan assets.
Calculation of defined benefit obligation is performed annually by a qualified actuary using the
projected unit credit method. When the calculation results in a potential asset for the MLCFL, the recognized asset is limited to the present value of economic benefits available in the form of any future refunds from the plan or reductions in future contribution to the plan. To calculate the present value of economic benefits, consideration is given to any applicable minimum funding requirements.
Re-measurement of the net defined benefit liability, which comprise actuarial gains and losses,
the return on plan assets (excluding interest) and the effect of the asset ceiling (if any, excluding interest), are recognized immediately in consolidated statement of comprehensive income. MLCFL determines the net interest expense (income) on the net defined benefit liability (asset) for the period by applying the discount rate used to measure the defined benefit obligation at the beginning of the annual period to the then net defined benefit liability (asset), taking into account any changes in the net defined benefit liability (asset) during the period as a result of contributions and benefit payments. Net interest expense and other expenses related to defined benefit plan is recognized in the consolidated statement of profit or loss.
When the benefits of a plan are changed or when a plan is curtailed, the resulting change in
benefit that relates to past service or the gain or loss on curtailment is recognized immediately in the consolidated statement of profit or loss. MLCFL recognize gains and losses on the settlement of a defined benefit plan when the settlement occurs.
iii) Liability for employees’ compensated absences MLCFL accounts for the liability in respect of employees’ compensated absences in the year
in which these are earned. Provision to cover the obligations is made using the current salary level of employees. The unutilized leaves are accumulated subject to a maximum of 90 days. The unutilized accumulated leaves enchased at the time the employee leaves Group service. The Group uses the actuarial valuations carried out using the projected unit credit method for valuation of its accumulated compensating absences. The latest valuation was carried out on 30 June 2019. Provisions are made annually to cover the obligation for accumulating compensated absences based on actuarial valuation and are charged to the statement of profit or loss. The amount recognized in the statement of the financial position represents the present value of the defined benefit obligations. Actuarial gains and losses are charged to the statement of profit or loss immediately in the period when these occur.
During the year the MLCFL has change its accounting policy and carried out actuarial valuation
as at 30 June 2019 to calculate the compensation charge to consolidated statement of profit or loss. The change of accounting policy is not considered to have material effect on the comparative figures of these consolidated financial statements and accordingly the change in policy has been applied prospectively.
ANNUAL REPORT 2019 211
2.4 Taxation Current Provision for current tax is based on the taxable income for the year determined in accordance
with the prevailing law for taxation of income. The charge for current tax is calculated using prevailing tax rates or tax rates expected to apply to the profit for the year, if enacted. The charge for current tax also includes adjustments, where considered necessary, to provision for tax made in previous years arising from assessments framed during the year for such years.
Deferred Deferred tax is accounted for using the liability method in respect of all temporary differences
arising from differences between the carrying amount of assets and liabilities in the consolidated financial statements and the corresponding tax bases used in the computation of the taxable profit. Deferred tax liabilities are generally recognized for all taxable temporary differences and deferred tax assets to the extent that it is probable that taxable profits will be available against which the deductible temporary differences, unused tax losses and tax credits can be utilized.
Deferred tax is calculated at the rates that are expected to apply to the period when the
differences reverse based on tax rates that have been enacted or substantively enacted by the reporting date. Deferred tax is charged or credited in the consolidated statement of profit or loss, except to the extent that it relates to items recognized in other comprehensive income or directly in equity. In this case the tax is also recognized in other comprehensive income or directly in equity, respectively.
2.5 Functional and presentation currency Items included in the consolidated financial statements of the Group are measured using the
currency of the primary economic environment in which the Group operates (the functional currency). The consolidated financial statements are presented in Pak Rupees, which is the Group’s functional and presentation currency. Figures are rounded off to the nearest thousand of Pak Rupees.
2.6 Foreign currency transactions and translation All monetary assets and liabilities in foreign currencies are translated into Pak Rupees at
exchange rates prevailing at the reporting date. Transactions in foreign currencies are translated into Pak Rupees at exchange rates prevailing at the dates of the transactions. Foreign exchange gains and losses resulting from the settlement of such transactions and from the translation at year end exchange rates of monetary assets and liabilities denominated in foreign currencies are charged or credited to consolidated statement of profit or loss. Non-monetary assets and liabilities that are measured in terms of historical cost in a foreign currency are translated into Pak Rupees at exchange rates prevailing at the date of transaction. Non-monetary assets and liabilities denominated in foreign currency that are stated at fair value are translated into Pak Rupees at exchange rates prevailing at the date when fair values are determined.
2.7 Provisions Provisions are recognized when the Group has a legal or constructive obligation as a result of
past events and it is probable that an outflow of resources embodying economic benefits will be required to settle the obligations and a reliable estimate of the amount can be made.

KOHINOOR TEXTILE MILLS LIMITED212
2.8 Property, plant, equipment and depreciation Owned Property, plant and equipment except freehold land and capital work-in-progress are stated
at cost less accumulated depreciation and accumulated impairment losses (if any). Cost of property, plant and equipment consists of historical cost, borrowing cost pertaining to erection / construction period of qualifying assets and other directly attributable cost of bringing the asset to working condition. Freehold land is stated at revalued amount less any identified impairment loss. Capital work-in-progress is stated at cost less any recognized impairment loss.
Subsequent costs are included in the asset’s carrying amount or recognized as a separate
asset, as appropriate, only when it is probable that future economic benefits associated with the item will flow to the Group and the cost of the item can be measured reliably. All other repair and maintenance costs are charged to consolidated statement of profit or loss during the period in which they are incurred.
Increases in the carrying amounts arising on revaluation of freehold land are recognized,
in consolidated other comprehensive income and accumulated in revaluation surplus in shareholders’ equity. To the extent that increase reverses a decrease previously recognized in the consolidated statement of profit or loss, the increase is first recognized in the consolidated statement of profit or loss. Decreases that reverse previous increases of the same asset are first recognized in consolidated other comprehensive income to the extent of the remaining surplus attributable to the asset; all other decreases are charged to the consolidated statement of profit or loss.
Leased Leases where the Group has substantially all the risks and rewards of ownership are classified as
finance lease. Assets subject to finance lease are capitalized at the commencement of the lease term at the lower of present value of minimum lease payments under the lease agreements and the fair value of the leased assets, each determined at the inception of the lease.
The related rental obligation net of finance cost, is included in liabilities against assets subject to
finance lease. The liabilities are classified as current and long term depending upon the timing of payments.
Each lease payment is allocated between the liability and finance cost so as to achieve a constant
rate on the balance outstanding. The finance cost is charged to consolidated statement of profit or loss over the lease term.
Depreciation of assets subject to finance lease is recognized in the same manner as for owned
assets. Depreciation of the leased assets is charged to consolidated statement of profit or loss. Depreciation Depreciation on property, plant and equipment is charged to the consolidated statement of
profit or loss applying the reducing balance method except that straight-line method is used for the plant and machinery and buildings of MLCFL relating to dry process plant and power plant of MLPL after deducting residual value, so as to write off the cost / depreciable amount of the asset over their estimated useful lives at the rates given in Note 15.1. Depreciation on additions is charged from the month the assets are available for use while no depreciation is charged in the month in which the assets are disposed of. The residual values and useful lives of assets are reviewed by the management, at each financial year end and adjusted if impact on depreciation is significant.

ANNUAL REPORT 2019 213
De-recognition An item of property, plant and equipment is de-recognized upon disposal or when no future
economic benefits are expected from its use or disposal. Any gain or loss arising on de-recognition of the asset is included in the consolidated statement of profit or loss in the year the asset is de-recognized.
2.9 Intangible assets Intangible assets, which are non-monetary assets without physical substance, are recognized
at cost, which comprise purchase price, non-refundable purchase taxes and other directly attributable expenditure relating to their implementation and customization. After initial recognition an intangible asset is carried at cost less accumulated amortization and impairment losses, if any. Intangible assets are amortized from the month, when these assets are available for use, using the straight line method, whereby the cost of the intangible asset is amortized over its estimated useful life over which economic benefits are expected to flow to the Group. The useful life and amortization method is reviewed and adjusted, if appropriate, at each consolidated statement of financial position date.
2.10 Leases Leases are classified as finance lease whenever terms of the lease transfer substantially all risks
and rewards of ownership to the lessee. All other leases are classified as operating leases. The liability to the lessor is included in the consolidated statement of financial position as liabilities
against assets subject to finance lease. The liabilities are classified as current and non-current depending upon the timing of payment. Lease payments are apportioned between finance charges and reduction of the liabilities against assets subject to finance lease so as to achieve a constant rate of interest on the remaining balance of the liability. Finance charges are charged to consolidated statement of profit or loss, unless they are directly attributable to qualifying assets, in which case they are capitalized in accordance with the Group’s general policy on borrowing costs.
Rentals payable under operating leases are charged to consolidated statement of profit or loss
on a straight line basis over the term of the relevant lease. Benefits received and receivable as an incentive to enter into an operating lease are also spread on a straight line basis over the lease term.
2.11 Investment properties Land and buildings held for capital appreciation or to earn rental income are classified as
investment properties. Investment properties are carried at fair value which is based on active market prices, adjusted, if necessary, for any difference in the nature, location or condition of the specific asset. The valuation of the properties is carried out with sufficient regularity.
Gain or loss arising from a change in the fair value of investment properties is recognized in the
consolidated statement of profit or loss for the year in which it arises. 2.12 IFRS 9 “Financial instruments” The Group has adopted IFRS 9 “Financial Instruments” from 01 July 2018. The standard
introduced new classification and measurement models for financial assets. A financial asset shall be measured at amortized cost if it is held within a business model whose objective is to hold assets in order to collect contractual cash flows which arise on specified dates and that are solely principal and interest. A debt investment shall be measured at fair value through other comprehensive income if it is held within a business model whose objective is to both

KOHINOOR TEXTILE MILLS LIMITED214
hold assets in order to collect contractual cash flows which arise on specified dates that are solely principal and interest as well as selling the asset on the basis of its fair value. All other financial assets are classified and measured at fair value through profit or loss unless the Group makes an irrevocable election on initial recognition to present gains and losses on equity instruments in other comprehensive income. Despite these requirements, a financial asset may be irrevocably designated as measured at fair value through profit or loss to reduce the effect of, or eliminate, an accounting mismatch. For financial liabilities designated at fair value through profit or loss, the standard requires the portion of the change in fair value that relates to the Group’s own credit risk to be presented in other comprehensive income (unless it would create an accounting mismatch). New simpler hedge accounting requirements are intended to more closely align the accounting treatment with the risk management activities of the Group. New impairment requirements use an ‘expected credit losses’ (‘ECL’) model to recognize an allowance. Impairment is measured using a 12-month ECL method unless the credit risk on a financial instrument has increased significantly since initial recognition in which case the lifetime ECL method is adopted. For receivables, a simplified approach to measuring expected credit losses using a lifetime expected loss allowance is available.
The Group has adopted IFRS 9 without restating the prior year results. Key changes in accounting
policies resulting from application of IFRS 9 are as follows: i Recognition of financial instruments The Group initially recognizes financial assets on the date when they are originated. Financial
liabilities are initially recognized on the trade date when the entity becomes a party to the contractual provisions of the instrument.
ii. Classification and measurement of financial instruments IFRS 9 largely retains the existing requirements in IAS 39 “Financial Instruments: Recognition
and Measurement” for the classification and measurement of financial liabilities. However, it replaces the previous IAS 39 categories for financial assets i.e. loans and receivables, fair value through profit or loss (FVTPL), available for sale and held to maturity with the categories such as amortized cost, fair value through profit or loss (FVTPL) and fair value through other comprehensive income (FVTOCI).
Investments and other financial assets a) Classification From 01 July 2018, the Group classifies its financial assets in the following measurement
categories: · those to be measured subsequently at fair value (either through other comprehensive
income, or through profit or loss), and
· those to be measured at amortized cost The classification depends on the Group’s business model for managing the financial assets and
the contractual terms of the cash flows. For assets measured at fair value, gains and losses will either be recorded in profit or loss
or other comprehensive income. For investments in debt instruments, this will depend on the business model in which the investment is held. For investments in equity instruments, this will depend on whether the Group has made an irrevocable election at the time of initial recognition to account for the equity investment at fair value through other comprehensive income. The Group reclassifies debt investments when and only when its business model for managing those assets changes.
ANNUAL REPORT 2019 215
b) Measurement At initial recognition, the Group measures a financial asset at its fair value plus, in the case
of a financial asset not at fair value through profit or loss, transaction costs that are directly attributable to the acquisition of the financial asset. Transaction costs of financial assets carried at fair value through profit or loss are expensed in profit or loss.
Financial assets with embedded derivatives are considered in their entirety when determining
whether their cash flows are solely payment of principal and interest. Debt instruments Subsequent measurement of debt instruments depends on the Group’s business model for
managing the asset and the cash flow characteristics of the asset. There are three measurement categories into which the Group classifies its debt instruments:
Amortized cost Financial assets that are held for collection of contractual cash flows where those cash flows
represent solely payments of principal and interest are measured at amortized cost. Interest income from these financial assets is included in other income using the effective interest rate method. Any gain or loss arising on derecognition is recognized directly in profit or loss and presented in other income / (other expenses) together with foreign exchange gains and losses. Impairment losses are presented as separate line item in the consolidated statement of profit or loss.
Fair value through other comprehensive income (FVTOCI) Financial assets that are held for collection of contractual cash flows and for selling the financial
assets, where the assets’ cash flows represent solely payments of principal and interest, are measured at FVTOCI. Movements in the carrying amount are taken through other comprehensive income, except for the recognition of impairment losses (and reversal of impairment losses), interest income and foreign exchange gains and losses which are recognized in profit or loss. When the financial asset is de-recognized, the cumulative gain or loss previously recognized in other comprehensive income is reclassified from equity to profit or loss and recognized in other income / (other expenses). Interest income from these financial assets is included in other income using the effective interest rate method. Foreign exchange gains and losses are presented in other income / (other expenses) and impairment losses are presented as separate line item in the consolidated statement of profit or loss.
Fair value through profit or loss Assets that do not meet the criteria for amortized cost or FVTOCI are measured at FVTPL. A
gain or loss on a debt instrument that is subsequently measured at FVTPL is recognized in profit or loss and presented net within other income / (other expenses) in the period in which it arises.
Equity instruments The Group subsequently measures all equity investments at fair value for financial instruments
quoted in an active market, the fair value corresponds to a market price (level 1). For financial instruments that are not quoted in an active market, the fair value is determined using valuation techniques including reference to recent arm’s length market transactions or transactions involving financial instruments which are substantially the same (level 2), or discounted cash flow analysis including, to the greatest possible extent, assumptions consistent with observable market data (level 3).
KOHINOOR TEXTILE MILLS LIMITED216
Fair value through other comprehensive income (FVTOCI) Where the Group’s management has elected to present fair value gains and losses on equity
investments in other comprehensive income, there is no subsequent reclassification of fair value gains and losses to profit or loss. Impairment losses (and reversal of impairment losses) on equity investments measured at FVTOCI are not reported separately from other changes in fair value.
Fair value through profit or loss Changes in the fair value of equity investments at fair value through profit or loss are recognized
in other income / (other expenses) in the statement of profit or loss as applicable. Dividends from such investments continue to be recognized in profit or loss as other income
when the Group’s right to receive payments is established. Financial liabilities a) Classification and measurement Financial liabilities are classified as measured at amortized cost or FVTPL. A financial liability is
classified as at FVTPL if it is classified as held-for-trading, it is a derivative or it is designated as such on initial recognition. Financial liabilities at FVTPL are measured at fair value and net gains and losses, including any interest expense, are recognized in profit or loss. Other financial liabilities are subsequently measured at amortized cost using the effective interest method. Interest expense and foreign exchange gains and losses are recognized in consolidated statement of profit or loss. Any gain or loss on de-recognition is also included in profit or loss.
iii. Impairment of financial assets From 01 July 2018, the Group assesses on a forward looking basis the expected credit losses
associated with its debt instruments carried at amortized cost and FVTOCI. The impairment methodology applied depends on whether there has been a significant increase in credit risk.
For trade debts and other receivables, the Group applies the simplified approach permitted by
IFRS 9, which requires expected lifetime losses to be recognized from initial recognition of the receivables.
iv. De-recognition a) Financial assets The Group derecognizes a financial asset when the contractual rights to the cash flows from
the asset expire, or it transfers the rights to receive the contractual cash flows in a transaction in which substantially all of the risks and rewards of ownership of the financial asset are transferred, or it neither transfers nor retains substantially all of the risks and rewards of ownership and does not retain control over the transferred asset. Any interest in such de-recognized financial assets that is created or retained by the Group is recognized as a separate asset or liability.
b) Financial liabilities The Group derecognizes a financial liability (or a part of financial liability) from its consolidated
statement of financial position when the obligation specified in the contract is discharged or cancelled or expires.

ANNUAL REPORT 2019 217
v. Offsetting of financial instruments Financial assets and financial liabilities are set off and the net amount is reported in the
consolidated financial statements when there is a legal enforceable right to set off and the Group intends either to settle on a net basis or to realize the assets and to settle the liabilities simultaneously.
vi. Hedge accounting IFRS 9 requires that hedge accounting relationships are aligned with its risk management
objectives and strategy and to apply a more qualitative and forward-looking approach to assessing hedge effectiveness.
There is no impact of the said change on these consolidated financial statements as there is no
hedge activity carried on by the Group during the year ended 30 June 2019. vii. Impacts of adoption of IFRS 9 on these consolidated financial statements as on 01 July 2018 On 01 July 2018, the Group’s management has assessed which business models apply to
the financial assets held by the Group at the date of initial application of IFRS 9 (01 July 2018) and has classified its financial instruments into appropriate IFRS 9 categories. The main effects resulting from this reclassification are as follows:
Trade debts categorized as Deferred Loans and Amortized tax receivables cost
RUPEES IN THOUSAND
Opening balance (before reclassification) 2,977,474 - 2,850,450 Reclassification of trade debts (2,977,474) 2,977,474 - Recognition of expected credit losses on trade debts - (134,258) (38,935) Opening balance (after reclassification) - 2,843,216 2,811,515
Effect on total equity as a result of adjustment on adoption of IFRS 9 due to recognition of expected life time credit losses on trade debts is Rupees 95.323 million net of deferred income tax.
Reclassifications of financial instruments on adoption of IFRS 9 As on 01 July 2018, the classification and measurement of financial instruments of the Group
were as follows:
Measurement category Carrying amounts
Original New Original New Difference
(IAS 39) (IFRS 9) RUPEES IN THOUSAND
Non-current financial assets Long term deposits Loans and receivables Amortized cost 106,178 106,178 - Long term loans to employees Loans and receivables Amortized cost 9,472 9,472 -

KOHINOOR TEXTILE MILLS LIMITED218
Measurement category Carrying amounts
Original New Original New Difference
(IAS 39) (IFRS 9) RUPEES IN THOUSAND
Current financial assets Trade debts Loans and receivables Amortized cost 2,977,474 2,843,216 134,258 Accrued interest Loans and receivables Amortized cost 2,454 2,454 - Advances Loans and receivables Amortized cost 30,099 30,099 - Security deposits Loans and receivables Amortized cost 107,719 107,719 - Other receivables Loans and receivables Amortized cost 213,862 213,862 - Other receivables FVTPL FVTPL 10,145 10,145 - Short term investments FVTPL FVTPL 3,480,826 3,480,826 - Cash and bank balances Loans and receivables Amortized cost 1,104,743 1,104,743 - Non-current financial liabilities Long term financing Amortized cost Amortized cost 15,476,096 15,476,096 - Long term deposits Amortized cost Amortized cost 8,714 8,714 - Retention money payable Amortized cost Amortized cost 310,735 310,735 - Current financial liabilities Trade and other payables Amortized cost Amortized cost 5,075,679 5,075,679 - Unrealized loss on re-measurement of future contracts – shares FVTPL FVTPL 12,680 12,680 - Accrued mark-up Amortized cost Amortized cost 339,808 339,808 - Short term borrowings Amortized cost Amortized cost 9,988,756 9,988,756 - Unclaimed dividend Amortized cost Amortized cost 131,500 131,500 - 2.13 Investment in gold Investment in gold is initially recognized at fair value less cost to sell. Subsequent to initial
recognition, these are measured at fair value using spot rate fixed by the Pakistan Mercantile Exchange Limited (PMEX). Gain or loss arising from changes in fair value less cost to sell are recognized in the consolidated statement of profit or loss in the period of change.
2.14 Inventories Inventories, except for stock in transit and waste stock / rags, are stated at lower of cost and
net realizable value. Cost is determined as follows: Stores, spare parts and loose tools Useable stores, spare parts and loose tools are valued principally at moving average cost, while
items considered obsolete are carried at nil value. Items in transit are valued at cost comprising invoice value plus other charges paid thereon.
Stock-in-trade
Cost of raw materials, work-in-process and finished goods is determined as follows: (i) For raw materials: Annual average basis. (ii) For work-in-process and finished goods: Average manufacturing cost including a portion of production overheads. Materials in transit are valued at cost comprising invoice value plus other charges paid thereon.
Waste stock / rags are valued at net realizable value.

ANNUAL REPORT 2019 219
Net realizable value signifies the estimated selling price in the ordinary course of business less the estimated costs of completion and the estimated costs necessary to make a sale.
2.15 Trade and other receivables Trade receivables are initially recognized at fair value and subsequently measured at amortized
cost using the effective interest method, less any allowance for expected credit losses. Trade receivables generally do not include amounts over due by 365 days.
The Group has applied the simplified approach to measuring expected credit losses, which uses
a lifetime expected loss allowance. To measure the expected credit losses, trade receivables have been grouped based on days overdue.
Other receivables are recognized at amortized cost, less any allowance for expected credit
losses. 2.16 Borrowings Financing and borrowings are recognized initially at fair value and are subsequently stated at
amortized cost. Any difference between the proceeds and the redemption value is recognized in the consolidated statement of profit or loss over the period of the borrowings using the effective interest method.
2.17 Borrowing cost Interest, mark-up and other charges on long-term finances are capitalized up to the date of
commissioning of respective qualifying assets acquired out of the proceeds of such long-term finances. All other interest, mark-up and other charges are recognized in consolidated statement of profit or loss.
2.18 Trade and other payables Liabilities for trade and other amounts payable are initially recognized at fair value, which is
normally the transaction cost. 2.19 Cash and cash equivalents Cash and cash equivalents comprise cash in hand, cash at banks on current, saving and deposit
accounts and other short term highly liquid instruments that are readily convertible into known amounts of cash and which are subject to insignificant risk of changes in values.
2.20 Share capital Ordinary shares of the Holding Company are classified as share capital. 2.21 Revenue from contracts with customers The Group has adopted IFRS 15 from 01 July 2018. The standard provides a single
comprehensive model for revenue recognition. The core principle of the standard is that an entity shall recognize revenue to depict the transfer of promised goods or services to customers at an amount that reflects the consideration to which the entity expects to be entitled in exchange for those goods or services. The standard introduced a new contract-based revenue recognition model with a measurement approach that is based on an allocation of the transaction price. This is described further in the accounting policies below. Credit risk is presented separately as an expense rather than adjusted against revenue. Contracts with customers are presented in Group’s statement of financial position as a contract liability, a contract asset, or a receivable,

KOHINOOR TEXTILE MILLS LIMITED220
depending on the relationship between the Group’s performance and the customer’s payment. Customer acquisition costs and costs to fulfill a contract can, subject to certain criteria, be capitalized as an asset and amortized over the contract period.
The Group has adopted IFRS 15 by applying the modified retrospective approach according
to which the Group is not required to restate the prior year results. Key changes in accounting policies resulting from application of IFRS 15 are as follows:
i) Revenue recognition Revenue is recognized at an amount that reflects the consideration to which the Group is expected
to be entitled in exchange for transferring goods or services to a customer. For each contract with a customer, the Group: identifies the contract with a customer; identifies the performance obligations in the contract; determines the transaction price which takes into account estimates of variable consideration and the time value of money; allocates the transaction price to the separate performance obligations on the basis of the relative stand-alone selling price of each distinct good or service to be delivered; and recognizes revenue when or as each performance obligation is satisfied in a manner that depicts the transfer to the customer of the goods or services promised.
Variable consideration within the transaction price, if any, reflects concessions provided to the
customer such as discounts, rebates and refunds, any potential bonuses receivable from the customer and any other contingent events. Such estimates are determined using either the ‘expected value’ or ‘most likely amount’ method. The measurement of variable consideration is subject to a constraining principle whereby revenue will only be recognized to the extent that it is highly probable that a significant reversal in the amount of cumulative revenue recognized will not occur. The measurement constraint continues until the uncertainty associated with the variable consideration is subsequently resolved. Amounts received that are subject to the constraining principle are initially recognized as deferred revenue in the form of a separate refund liability.
Sale of goods Revenue from the sale of goods is recognized at the point in time when the customer obtains
control of the goods, which is generally at the time of delivery. Interest Interest income is recognized as interest accrues using the effective interest method. This is a
method of calculating the amortized cost of a financial asset and allocating the interest income over the relevant period using the effective interest rate, which is the rate that exactly discounts estimated future cash receipts through the expected life of the financial asset to the net carrying amount of the financial asset.
Dividend Dividend on equity investments is recognized when right to receive the dividend is established. Other revenue Other revenue is recognized when it is received or when the right to receive payment is
established.
Realized gain a) Realized capital gains / (losses) arising on sale of investments are included in the consolidated
statement of profit or loss on the date at which the transaction takes place.
ANNUAL REPORT 2019 221
b) Realized gains / (losses) arising on sale of gold are included in the consolidated statement of profit or loss on the date at which the transaction takes place.
Unrealised gain a) Unrealized capital gains / (losses) arising on changes in the fair value of investments classified
as “Fair value through profit or loss” are included in the consolidated statement of profit or loss in the period in which they arise.
b) Unrealized gains / (losses) arising on revaluation of gold are included in the consolidated
statement of profit or loss in the period in which they arise. ii) Contract assets Contract assets arise when the Group performs its performance obligations by transferring
goods to a customer before the customer pays its consideration or before payment is due. Contract assets are treated as financial assets for impairment purposes.
iii) Customer acquisition costs Customer acquisition costs are capitalized as an asset where such costs are incremental to
obtaining a contract with a customer and are expected to be recovered. Customer acquisition costs are amortized on a straight-line basis over the term of the contract.
Costs to obtain a contract that would have been incurred regardless of whether the contract
was obtained or which are not otherwise recoverable from a customer are expensed as incurred to profit or loss. Incremental costs of obtaining a contract where the contract term is less than one year is immediately expensed to profit or loss.
iv) Customer fulfillment costs Customer fulfillment costs are capitalized as an asset when all the following are met: (i) the costs
relate directly to the contract or specifically identifiable proposed contract; (ii) the costs generate or enhance resources of the Group that will be used to satisfy future performance obligations; and (iii) the costs are expected to be recovered. Customer fulfillment costs are amortized on a straight-line basis over the term of the contract.
v) Right of return assets Right of return assets represents the right to recover inventory sold to customers and is based
on an estimate of customers who may exercise their right to return the goods and claim a refund. Such rights are measured at the value at which the inventory was previously carried prior to sale, less expected recovery costs and any impairment.
vi) Contract liabilities Contract liability is the obligation of the Group to transfer goods to a customer for which the
Group has received consideration from the customer. If a customer pays consideration before the Group transfers goods, a contract liability is recognized when the payment is made. Contract liabilities are recognized as revenue when the Group performs its performance obligations under the contract.
vii) Refund liabilities Refund liabilities are recognized where the Group receives consideration from a customer and
expects to refund some, or all, of that consideration to the customer. A refund liability is measured
KOHINOOR TEXTILE MILLS LIMITED222
at the amount of consideration received or receivable for which the Group does not expect to be entitled and is updated at the end of each reporting period for changes in circumstances. Historical data is used across product lines to estimate such returns at the time of sale based on an expected value methodology.
viii) Impacts of adoption of IFRS 15 on these consolidated financial statements as on 01 July 2018 The Group has applied IFRS 15 using the modified retrospective approach for transition. This
approach requires entities to recognize the cumulative effect of initially applying IFRS 15 as an adjustment to the opening balance of unappropriated profit in the period of initial application. Comparative prior year periods would not be adjusted. The application of IFRS 15 does not have any significant impact on the revenue recognition of the Group and therefore, the cumulative effect of initially applying this standard as an adjustment to the opening balance of unappropriated profit in the period of initial application is Rupees Nil.
2.22 Derivative financial instruments Derivatives are initially recognized at fair value. Any directly attributable transaction costs are
recognized in the consolidated statement of profit or loss as incurred. They are subsequently remeasured at fair value on regular basis and at each reporting date as a minimum, with all their gains and losses, realized and unrealized, recognized in the consolidated statement of profit or loss.
2.23 Segment reporting Segment reporting is based on the operating (business) segments of the Group. An operating
segment is a component of the Group that engages in business activities from which it may earn revenues and incur expenses, including revenues and expenses that relate to the transactions with any of the Group’s other components. An operating segment’s operating results are reviewed regularly by the chief executive officer to make decisions about resources to be allocated to the segment and assess its performance, and for which discrete financial information is available.
Segment results that are reported to the chief executive officer include items directly attributable
to a segment as well as those that can be allocated on a reasonable basis. Those incomes, expenses, assets, liabilities and other balances which can not be allocated to a particular segment on a reasonable basis are reported as unallocated.
The Group has six reportable business segments. Spinning (Producing different quality of yarn
using natural and artificial fibers), Weaving (Producing different quality of greige fabric using yarn), Processing and Home Textile (Processing greige fabric for production of printed and dyed fabric and manufacturing of home textile articles), Power (generation of electricity), Investment (invest the capital in ant sort of financial instruments and commodities) and Cement.
Transaction among the business segments are recorded at arm’s length prices using admissible
valuation methods. Inter segment sales and purchases are eliminated from the total. 2.24 Impairment of non-financial assets The carrying amounts of the Group’s non-financial assets are reviewed at each reporting
date to determine whether there is any indication of impairment. If such indication exists, the recoverable amount of such asset is estimated. An impairment loss is recognized wherever the carrying amount of the asset exceeds its recoverable amount. Impairment losses are recognized in consolidated statement of profit or loss except for impairment loss on revalued assets, which is adjusted against the related revaluation surplus to the extent that the impairment loss does not exceed the surplus on revaluation of that asset.

ANNUAL REPORT 2019 223
2.25 Government grants Government grants are recognized when there is reasonable assurance that entity will comply
with the conditions attached to it and grant will be received. 2.26 Earnings per share The Group presents earnings per share (EPS) data for its ordinary shares. EPS is calculated
by dividing the profit or loss attributable to ordinary shareholders of the Group by the weighted average number of ordinary shares outstanding during the year.
2.27 Contingent assets Contingent assets are disclosed when the Group has a possible asset that arises from past
events and whose existence will only be confirmed by the occurrence or non-occurrence of one or more uncertain future events not wholly within the control of the Group. Contingent assets are not recognized until their realization becomes certain.
2.28 Contingent liabilities Contingent liability is disclosed when the Group has a possible obligation as a result of past
events whose existence will only be confirmed by the occurrence or non-occurrence of one or more uncertain future events not wholly within the control of the Group. Contingent liabilities are not recognized, only disclosed, unless the possibility of a future outflow of resources is considered remote. In the event that the outflow of resources associated with a contingent liability is assessed as probable, and if the size of the outflow can be reliably estimated, a provision is recognized in the consolidated financial statements.
2.29 Dividend and other appropriations Dividend distribution to the Group’s shareholders is recognized as a liability in the Group’s consolidated
financial statements in the period in which the dividends are declared and other appropriations are recognized in the period in which these are approved by the Board of Directors.
3. ISSUED, SUBSCRIBED AND PAID-UP SHARE CAPITAL 2019 2018 2019 2018 (Number of Shares) (Rupees in thousand)
1,596,672 1,596,672 Ordinary shares of Rupees 10 each allotted on reorganization of Kohinoor Industries Limited 15,967 15,967 26,156,000 26,156,000 Ordinary shares allotted under scheme of arrangement of merger of Part II of Maple Leaf Electric Company Limited 261,560 261,560 26,858,897 26,858,897 Ordinary shares allotted under scheme of arrangement of merger of Kohinoor Raiwind Mills Limited and Kohinoor Gujar Khan Mills Limited 268,589 268,589 75,502,560 75,502,560 Ordinary shares of Rupees 10 each issued as fully paid bonus shares 755,025 755,025 169,182,327 169,182,327 Ordinary shares of Rupees 10 each issued as fully paid in cash 1,691,823 1,691,823 299,296,456 299,296,456 2,992,964 2,992,964

KOHINOOR TEXTILE MILLS LIMITED224
2019 2018 Note (Rupees in thousand)4. RESERVES Composition of reserves is as follows: Capital reserves Share premium 4.1 986,077 986,077 Surplus on revaluation of freehold land and investment properties: Freehold land As at 01 July 2,773,125 2,752,534 Increase due to revaluation to fair value 15.1 - 20,591 As at 30 June 2,773,125 2,773,125 Investment properties 1,263,592 1,263,592 4,036,717 4,036,717 5,022,794 5,022,794 Revenue reserves General reserve 1,450,491 1,450,491 Unappropriated profit 19,940,200 17,480,368 21,390,691 18,930,859 26,413,485 23,953,653 4.1 This reserve can be utilized by the Group only for the purposes specified in section 81 of the
Companies Act, 2017. 2019 2018 Note (Rupees in thousand)
5. NON-CONTROLLING INTEREST Opening balance 12,869,953 9,600,270 Add / (less): Share during the year: Share in right issue - 1,899,522 Effect of change in accounting policy due to adoption of IFRS 9 (40,060) - Other comprehensive loss for the year (11,289) (9,079) Profit for the year 1,248,718 2,191,581 1,197,369 4,082,024 Less : Dividend paid (265,859) (812,341) 13,801,463 12,869,953
6. LONG TERM FINANCING From banking companies and other financial institutions - secured Holding Company 6.1 1,946,718 1,723,400 Subsidiary Company - MLCFL 6.2 17,305,362 13,752,696 19,252,080 15,476,096 Less: Current portion shown under current liabilities 1,726,554 1,198,917 17,525,526 14,277,179

ANNUAL REPORT 2019 225
Askari Bank Limited
The Bank of Punjab
The Bank of Punjab
The Bank of Punjab
MCB Bank Limited
National Bank of Pakistan
National Bank of Pakistan
PAIR Investment Company Limited
Askari Bank Limited
25,000
277,310
391,915
54,006
131,928
452,772
163,500
214,973
235,314
1,946,718
75,000
426,380
142,605
-
184,875
417,989
-
209,859
266,692
1,723,400
150,000
600,000
400,000
500,000
350,000
500,000
218,000
300,000
350,000
3,368,000
Quarterly
-
-
-
-
-
-
-
-
Quarterly
Quarterly
Quarterly
Quarterly
Quarterly
Half yearly
Half yearly
Quarterly
Quarterly
3 Month KIBOR + 1.50%
SBP LTFF rate + 2.50%
SBP LTFF rate + 1%
SBP LTFF rate + 1%
SBP LTFF rate + 2.5%
SBP LTFF rate + 1.25%
SBP SOLAR LTFF rate +
1.25%
SBP LTFF rate + 1.5%
SBP LTFF rate + 1.25%
Twelve equal quarterly installments commenced from 28 February 2017 and ending on 30 November 2019.
Sixteen equal quarterly installments commenced from 09 September 2016 and ending on 07 November 2021.
Thirty six equal quarterly installments after expiry of grace period of one year for every tranche from its date of disbursement.
Twenty four equal quarterly installments after expiry of grace period of one year for every tranche from its date of disbursement.
Twenty four equal quarterly installments after expiry of grace period of one year commenced from 25 November 2015 and ending on 10 December 2021.
Twelve equal half yearly installments after expiry of grace period of one and a half year commenced from 30 June 2018 and ending on 10 February 2025.
Twelve equal half yearly installments after expiry of grace period of one and a half year commencing from 27 June 2020 and ending on 24 June 2026.
Twenty four equal quarterly installments after expiry of grace period of sixteen months commenced from 17 July 2018 and ending on 23 August 2025.
Thirty six equal quarterly installments commenced from 28 January 2018 and ending on 31 October 2026.
First joint pari passu hypothecation charge of Rupees 200 million on all present and future fixed assets (excluding land and building) of the Company and personal guarantees of the sponsor directors.
Joint pari passu charge amounting to Rupees 1,333 million (inclusive of 25% margin) on all the fixed assets (excluding land and building) of the Company.
Joint pari passu charge amounting to Rupees 1,333 million (inclusive of 25% margin) on all the fixed assets (excluding land and building) of the Company.
Ranking charge amounting to Rupees 667 million (inclusive of 25% margin) on all the fixed assets (excluding land and building) of the Company.
First pari passu charge over land and building of Raiwind Division amounting to Rupees 467 million, and plant and machinery of the Company and personal guarantees of the sponsor directors.
Joint pari passu charge amounting to Rupees 667 million (inclusive of 25% margin) over plant and machinery of the Company.
Ranking charge amounting to Rupees 291 million (inclusive of 25% margin) over plant and machinery of the Company.
Joint pari passu charge over fixed assets (excluding land and building) amounting to Rupees 400 million of Rawalpindi and Gujar Khan Divisions and personal guarantees of the sponsor directors.
First pari passu charge over land and building of Raiwind Division amounting to Rupees 467 million, and plant and machinery of the Company and personal guarantees of the sponsor directors.
LENDER 2019 2018 TOTALFACILITY
INTERESTREPRICING
INTERESTPAYABLE
RATE OFINTEREST PER
ANNUMNUMBER OF
INSTALLMENTSSECURITY
.....Rupees in thousand.....6.1 Holding Company
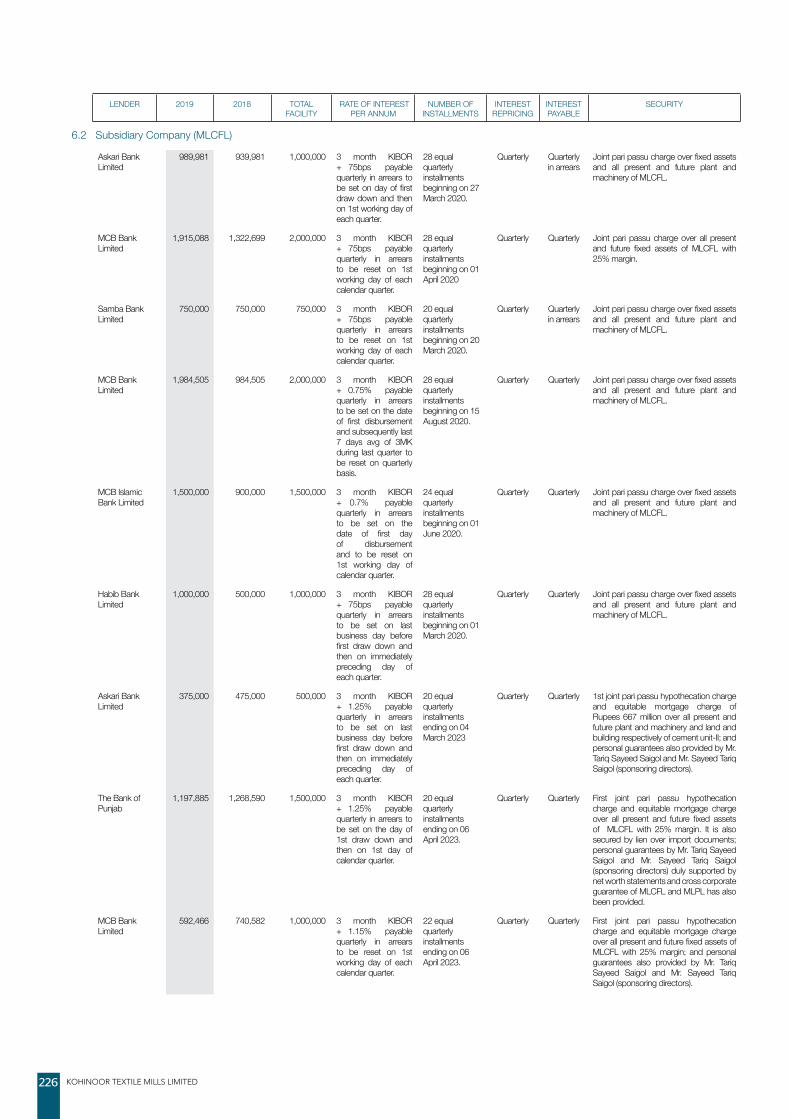
KOHINOOR TEXTILE MILLS LIMITED226
LENDER 2019 2018 TOTAL FACILITY
RATE OF INTEREST PER ANNUM
NUMBER OF INSTALLMENTS
INTEREST REPRICING
INTEREST PAYABLE
SECURITY
Askari Bank Limited
989,981 939,981 1,000,000 3 month KIBOR + 75bps payable quarterly in arrears to be set on day of first draw down and then on 1st working day of each quarter.
28 equal quarterly installments beginning on 27 March 2020.
Quarterly Quarterly in arrears
Joint pari passu charge over fixed assets and all present and future plant and machinery of MLCFL.
MCB Bank Limited
1,915,088 1,322,699 2,000,000 3 month KIBOR + 75bps payable quarterly in arrears to be reset on 1st working day of each calendar quarter.
28 equal quarterly installments beginning on 01 April 2020
Quarterly Quarterly Joint pari passu charge over all present and future fixed assets of MLCFL with 25% margin.
Samba Bank Limited
750,000 750,000 750,000 3 month KIBOR + 75bps payable quarterly in arrears to be reset on 1st working day of each calendar quarter.
20 equal quarterly installments beginning on 20 March 2020.
Quarterly Quarterly in arrears
Joint pari passu charge over fixed assets and all present and future plant and machinery of MLCFL.
MCB Bank Limited
1,984,505 984,505 2,000,000 3 month KIBOR + 0.75% payable quarterly in arrears to be set on the date of first disbursement and subsequently last 7 days avg of 3MK during last quarter to be reset on quarterly basis.
28 equal quarterly installments beginning on 15 August 2020.
Quarterly Quarterly Joint pari passu charge over fixed assets and all present and future plant and machinery of MLCFL.
MCB Islamic Bank Limited
1,500,000 900,000 1,500,000 3 month KIBOR + 0.7% payable quarterly in arrears to be set on the date of first day of disbursement and to be reset on 1st working day of calendar quarter.
24 equal quarterly installments beginning on 01 June 2020.
Quarterly Quarterly Joint pari passu charge over fixed assets and all present and future plant and machinery of MLCFL.
Habib Bank Limited
1,000,000 500,000 1,000,000 3 month KIBOR + 75bps payable quarterly in arrears to be set on last business day before first draw down and then on immediately preceding day of each quarter.
28 equal quarterly installments beginning on 01 March 2020.
Quarterly Quarterly Joint pari passu charge over fixed assets and all present and future plant and machinery of MLCFL.
Askari Bank Limited
375,000 475,000 500,000 3 month KIBOR + 1.25% payable quarterly in arrears to be set on last business day before first draw down and then on immediately preceding day of each quarter.
20 equal quarterly installments ending on 04 March 2023
Quarterly Quarterly 1st joint pari passu hypothecation charge and equitable mortgage charge of Rupees 667 million over all present and future plant and machinery and land and building respectively of cement unit-II; and personal guarantees also provided by Mr. Tariq Sayeed Saigol and Mr. Sayeed Tariq Saigol (sponsoring directors).
The Bank of Punjab
1,197,885 1,268,590 1,500,000 3 month KIBOR + 1.25% payable quarterly in arrears to be set on the day of 1st draw down and then on 1st day of calendar quarter.
20 equal quarterly installments ending on 06 April 2023.
Quarterly Quarterly First joint pari passu hypothecation charge and equitable mortgage charge over all present and future fixed assets of MLCFL with 25% margin. It is also secured by lien over import documents; personal guarantees by Mr. Tariq Sayeed Saigol and Mr. Sayeed Tariq Saigol (sponsoring directors) duly supported by net worth statements and cross corporate guarantee of MLCFL and MLPL has also been provided.
MCB Bank Limited
592,466 740,582 1,000,000 3 month KIBOR + 1.15% payable quarterly in arrears to be reset on 1st working day of each calendar quarter.
22 equal quarterly installments ending on 06 April 2023.
Quarterly Quarterly First joint pari passu hypothecation charge and equitable mortgage charge over all present and future fixed assets of MLCFL with 25% margin; and personal guarantees also provided by Mr. Tariq Sayeed Saigol and Mr. Sayeed Tariq Saigol (sponsoring directors).
6.2 Subsidiary Company (MLCFL)

ANNUAL REPORT 2019 227
LENDER 2019 2018 TOTAL FACILITY
RATE OF INTEREST PER ANNUM
NUMBER OF INSTALLMENTS
INTEREST REPRICING
INTEREST PAYABLE
SECURITY
National Bank of Pakistan
800,000 876,497 1,000,000 3 month KIBOR + 1.25% payable quarterly in arrears to be set on the date of first disbursement and subsequently at the beginning of each calendar quarter.
22 equal quarterly installments ending on 06 April 2023.
Quarterly Quarterly First joint pari passu hypothecation charge and equitable mortgage charge over all present and future fixed assets of MLCFL amounting to Rupees 1,334 million; and personal guarantees also provided by Mr. Tariq Sayeed Saigol and Mr. Sayeed Tariq Saigol (sponsoring directors).
MCB Islamic Bank Limited
437,500 500,000 500,000 3 month KIBOR + 0.7% payable quarterly in arrears to be set on the date of first disbursement and subsequently at the beginning of each calendar quarter.
24 equal quarterly installments ending on 13 September 2024.
Quarterly Quarterly First joint pari passu hypothecation charge and equitable mortgage charge over all present and future fixed assets of MLCFL amounting to Rupees 667 million; and personal guarantees also provided by Mr. Tariq Sayeed Saigol and Mr. Sayeed Tariq Saigol (sponsoring directors).
Pair Investment Company Limited
300,000 - 300,000 3 months KIBOR +1 % p.a. payable quarterly with the first payment falling due at the end of the 3rd month from the first disbursement date and subsequently every three months there after.
16 equal quarterly installments beginning on 28 September 2019.
Quarterly Quarterly Joint Pari Passu Charge over present and future fixed assets of the Company.
The Bank of Punjab
1,754,367 1,415,704 2,000,000 3 month KIBOR + 75bps payable quarterly in arrears to be reset on first working day of each calendar quarter.
28 equal quarterly installments beginning on 31 December 2019
Quarterly Quarterly Joint pari passu charge over all present and future fixed assets of MLCFL with 25% margin.
National Bank of Pakistan
3,708,570 3,079,138 5,500,000 3 month KIBOR + 75bps payable quarterly in arrears to be set on last business day before first draw down and then on immediately preceding day of each quarter.
28 equal quarterly installments beginning on 30 June 2020
Quarterly Quarterly Joint pari passu charge over fixed assets and all present and future plant and machinery of MLCFL.
Total 17,305,362 13,752,696 20,550,000
6.2.1 As per the financing document the Group is required to comply with certain financial covenants which mainly include minimum current ratio, minimum debt service coverage ratio, minimum interest coverage ratio, gearing ratio and maximum leverage ratio. Further, the Group is required to comply with certain conditions imposed by the providers of finance to make dividend payment.
6.2.2 MLCFL has un-availed long term facilities amounting to Rupees 4,647.49 million (2018: Rupees 4,997.30 million).

KOHINOOR TEXTILE MILLS LIMITED228
7. LONG TERM DEPOSITS These represent deposits received from dealers and are being utilized by the Subsidiary Company -
MLCFL in accordance with the terms of dealership agreements.
2019 2018 Note (Rupees in thousand)
8. RETIREMENT BENEFITS Subsidiary Company - MLCFL Accumulated compensated absences 8.1 106,184 102,396 Gratuity 8.2 99,170 81,368 205,354 183,764
8.1 Accumulated compensated absences The actuarial valuation of the MLCFL’s accumulated compensated absences was conducted on
30 June 2019 using projected unit credit method .The change of accounting policy did not have material effect on the comparative figures of these consolidated financial statements. Detail of obligation for accumulated compensated absences is as follows:
8.1.1 Movement in the present value of defined benefit obligations is as follows:
2019 (Rupees in thousand)
Present value of defined benefit obligations at beginning of the year 102,396 Current service cost 9,842 Reversal of prior year’s service cost due to actuarial valuation during the year (10,981) Interest cost for the year 8,618 Actuarial losses on present value of defined benefit obligations 6,784 Less: Benefits paid during the year (10,475)
106,184 8.1.2 Charge for the year Statement of profit or loss: Current service cost for the year 9,842 Reversal of prior year’s service cost due to actuarial valuation during the year (10,981) Interest cost for the year 8,618 Actuarial losses on present value of defined benefit obligations 6,784 14,263
8.1.3 Sensitivity analysis If the significant actuarial assumptions used to estimate the liability of compensated absences at
the reporting date, had fluctuated by 100 bps with all other variables held constant, the present value of the defined benefit obligation as at 30 June 2019 would have been as follows:

ANNUAL REPORT 2019 229
Compensated absences Impact on present value of defined benefit obligation Increase Decrease (Rupees in thousand)
Discount rate + 100 bps 96,350 117,784 Future salary increase + 100 bps 117,580 96,374 The sensitivity analysis of the defined benefit obligation to the significant actuarial assumptions
has been performed using the same calculation techniques as applied for calculation of defined benefit obligation reported in the statement of financial position.
8.1.4 Actuarial assumptions The following are the principal actuarial assumptions as at 30 June 2019:
Percentage Discount rate used for year end obligations 14.50% Expected rate of growth per annum in future salaries 13.50% Expected mortality rate SLIC 2001 - 2005 Setback 1 Year Retirement assumptions 60 Years
8.2 Gratuity The latest actuarial valuation of the Subsidiary Company’s (MLCFL) defined benefit plan, was
conducted on 30 June 2019 using projected unit credit method. Detail of obligation for defined benefit plan is as follows:
2019 2018 Note (Rupees in thousand)
The amounts recognized in the consolidated statement of financial position are as follows: Present value of defined benefit obligation 8.2.1 167,576 146,800 Less: Fair value of plan assets 8.2.2 (69,263) (65,432) Plus: Payable to ex-employees 857 - Net liability at end of the year 99,170 81,368 Net liability at beginning of the year 81,368 74,418 Charge to statement of profit or loss for the year 8.2.3 11,727 10,451 Charge to other comprehensive income for the year 8.2.3 33,620 27,012 Contributions made during the year (27,545) (30,513) Net liability at end of the year 99,170 81,368
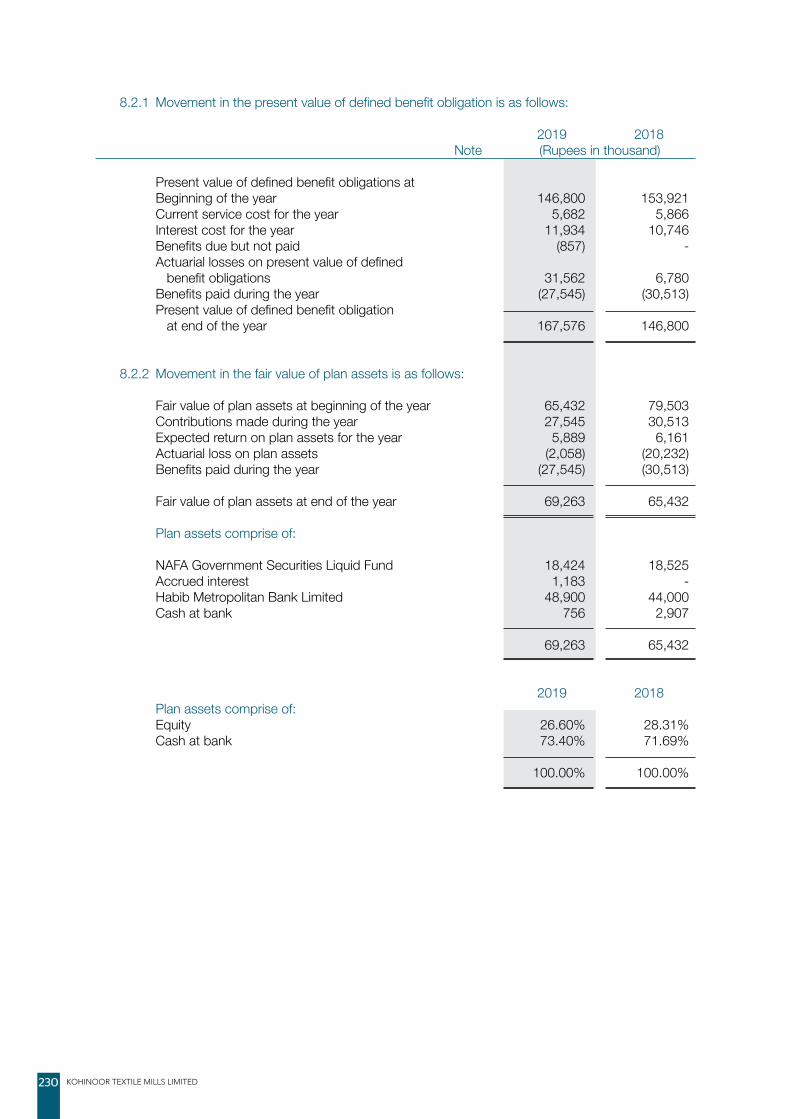
KOHINOOR TEXTILE MILLS LIMITED230
8.2.1 Movement in the present value of defined benefit obligation is as follows:
2019 2018 Note (Rupees in thousand)
Present value of defined benefit obligations at Beginning of the year 146,800 153,921 Current service cost for the year 5,682 5,866 Interest cost for the year 11,934 10,746 Benefits due but not paid (857) - Actuarial losses on present value of defined benefit obligations 31,562 6,780 Benefits paid during the year (27,545) (30,513) Present value of defined benefit obligation at end of the year 167,576 146,800 8.2.2 Movement in the fair value of plan assets is as follows:
Fair value of plan assets at beginning of the year 65,432 79,503 Contributions made during the year 27,545 30,513 Expected return on plan assets for the year 5,889 6,161 Actuarial loss on plan assets (2,058) (20,232) Benefits paid during the year (27,545) (30,513) Fair value of plan assets at end of the year 69,263 65,432 Plan assets comprise of: NAFA Government Securities Liquid Fund 18,424 18,525 Accrued interest 1,183 - Habib Metropolitan Bank Limited 48,900 44,000 Cash at bank 756 2,907 69,263 65,432 2019 2018 Plan assets comprise of: Equity 26.60% 28.31% Cash at bank 73.40% 71.69% 100.00% 100.00%

ANNUAL REPORT 2019 231
2019 2018 Note (Rupees in thousand)
8.2.3 Charge for the year: In statement of profit or loss Current service cost 5,682 5,866 Interest cost 11,934 10,746 Expected return on plan assets (5,889) (6,161) 11,727 10,451 In statement of comprehensive income Actuarial loss on retirement benefits - net 33,620 27,012 45,347 37,463
Actuarial assumptions: The following are the principal actuarial assumptions at 30 June: Discount rate used for year end obligation 14.25% 9.00% Expected return on plan assets 9.00% 7.75% Expected rate of growth per annum in future salaries 13.25% 8.00% Expected mortality rate SLIC 2001 SLIC 2001 - 2005 -2005 Setback 1 Year Setback 1 Year Retirement assumptions 60 Years 60 years 8.2.4 MLCFL expects to charge Rupees 18.74 million to consolidated statement of profit or loss on
account of defined benefit plan in the year ending 30 June 2020.
8.2.5 Sensitivity analysis If the significant actuarial assumptions used to estimate the defined benefit obligation at the
reporting date, had fluctuated by 100 bps with all other variables held constant, the present value of the defined benefit obligation as at 30 June 2019 would have been as follows:
Gratuity Impact on present value of defined benefit obligation Increase Decrease (Rupees in thousand)
Discount rate + 100 bps 160,495 175,192 Future salary increase + 100 bps 175,192 160,375
The sensitivity analysis of the defined benefit obligation to the significant actuarial assumptions has been performed using the same calculation techniques as applied for calculation of defined benefit obligation reported in the consolidated statement of financial position.
8.2.6 At 30 June 2019, the average duration of the defined benefit obligation was 4 years (2018: 6 years).
9. RETENTION MONEY PAYABLE This represents retention money payable by MLCFL to M/s FLS Smidth amounting to Euro 3.801
million (equivalent to Rupees 421.841 million at the exchange rate prevailing on the date of signing of contract, i.e. 16 January 2017) on purchase of plant and machinery. The amount is payable after two years from the date of commencement of commercial production of new cement plant under construction at Iskanderabad, District Mianwali and has been accounted for at present value using discount rate of 7% per annum.
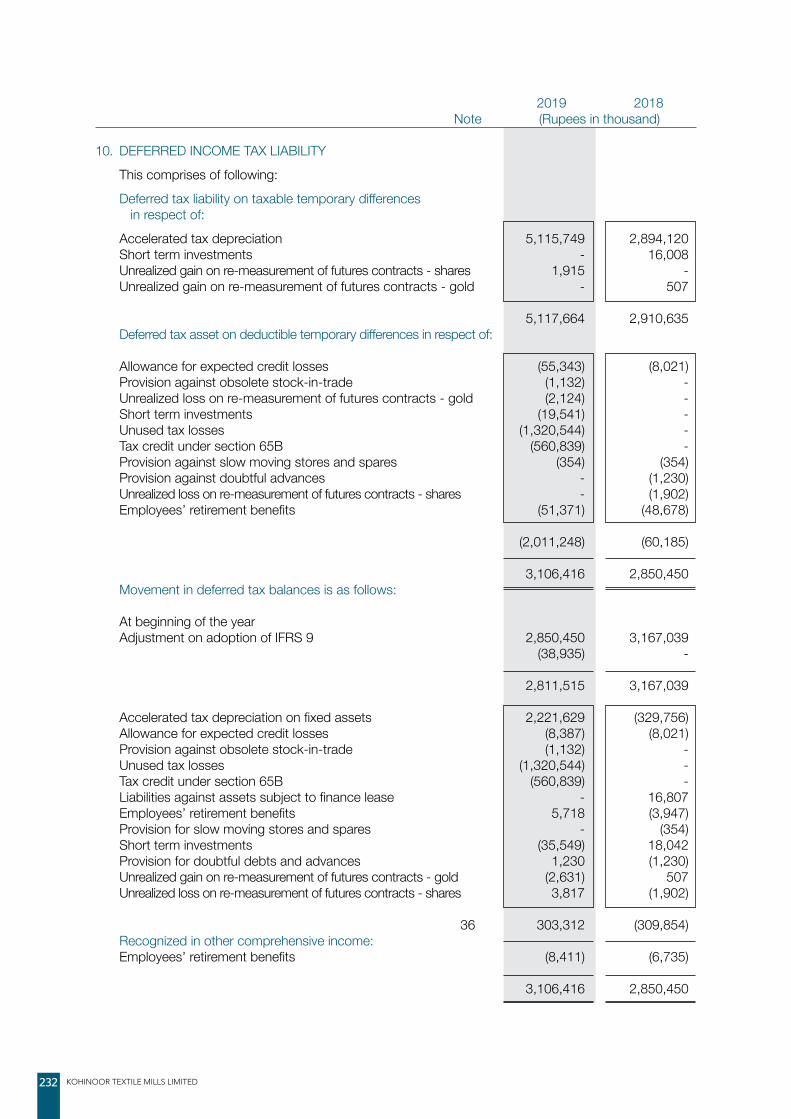
KOHINOOR TEXTILE MILLS LIMITED232
2019 2018 Note (Rupees in thousand)
10. DEFERRED INCOME TAX LIABILITY This comprises of following: Deferred tax liability on taxable temporary differences in respect of: Accelerated tax depreciation 5,115,749 2,894,120 Short term investments - 16,008 Unrealized gain on re-measurement of futures contracts - shares 1,915 - Unrealized gain on re-measurement of futures contracts - gold - 507
5,117,664 2,910,635 Deferred tax asset on deductible temporary differences in respect of:
Allowance for expected credit losses (55,343) (8,021) Provision against obsolete stock-in-trade (1,132) - Unrealized loss on re-measurement of futures contracts - gold (2,124) - Short term investments (19,541) - Unused tax losses (1,320,544) - Tax credit under section 65B (560,839) - Provision against slow moving stores and spares (354) (354) Provision against doubtful advances - (1,230) Unrealized loss on re-measurement of futures contracts - shares - (1,902) Employees’ retirement benefits (51,371) (48,678) (2,011,248) (60,185) 3,106,416 2,850,450 Movement in deferred tax balances is as follows: At beginning of the year Adjustment on adoption of IFRS 9 2,850,450 3,167,039 (38,935) -
2,811,515 3,167,039 Accelerated tax depreciation on fixed assets 2,221,629 (329,756) Allowance for expected credit losses (8,387) (8,021) Provision against obsolete stock-in-trade (1,132) - Unused tax losses (1,320,544) - Tax credit under section 65B (560,839) - Liabilities against assets subject to finance lease - 16,807 Employees’ retirement benefits 5,718 (3,947) Provision for slow moving stores and spares - (354) Short term investments (35,549) 18,042 Provision for doubtful debts and advances 1,230 (1,230) Unrealized gain on re-measurement of futures contracts - gold (2,631) 507 Unrealized loss on re-measurement of futures contracts - shares 3,817 (1,902) 36 303,312 (309,854) Recognized in other comprehensive income: Employees’ retirement benefits (8,411) (6,735)
3,106,416 2,850,450
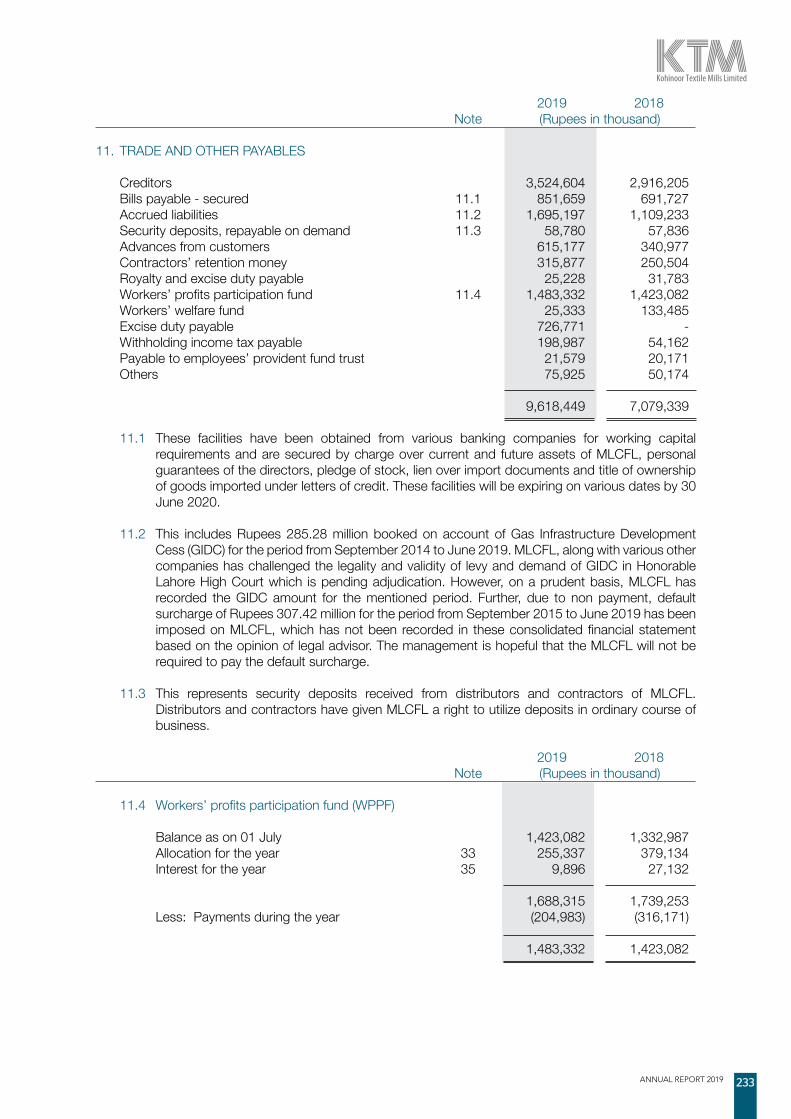
ANNUAL REPORT 2019 233
2019 2018 Note (Rupees in thousand)
11. TRADE AND OTHER PAYABLES Creditors 3,524,604 2,916,205 Bills payable - secured 11.1 851,659 691,727 Accrued liabilities 11.2 1,695,197 1,109,233 Security deposits, repayable on demand 11.3 58,780 57,836 Advances from customers 615,177 340,977 Contractors’ retention money 315,877 250,504 Royalty and excise duty payable 25,228 31,783 Workers’ profits participation fund 11.4 1,483,332 1,423,082 Workers’ welfare fund 25,333 133,485 Excise duty payable 726,771 - Withholding income tax payable 198,987 54,162 Payable to employees’ provident fund trust 21,579 20,171 Others 75,925 50,174 9,618,449 7,079,339
11.1 These facilities have been obtained from various banking companies for working capital requirements and are secured by charge over current and future assets of MLCFL, personal guarantees of the directors, pledge of stock, lien over import documents and title of ownership of goods imported under letters of credit. These facilities will be expiring on various dates by 30 June 2020.
11.2 This includes Rupees 285.28 million booked on account of Gas Infrastructure Development
Cess (GIDC) for the period from September 2014 to June 2019. MLCFL, along with various other companies has challenged the legality and validity of levy and demand of GIDC in Honorable Lahore High Court which is pending adjudication. However, on a prudent basis, MLCFL has recorded the GIDC amount for the mentioned period. Further, due to non payment, default surcharge of Rupees 307.42 million for the period from September 2015 to June 2019 has been imposed on MLCFL, which has not been recorded in these consolidated financial statement based on the opinion of legal advisor. The management is hopeful that the MLCFL will not be required to pay the default surcharge.
11.3 This represents security deposits received from distributors and contractors of MLCFL.
Distributors and contractors have given MLCFL a right to utilize deposits in ordinary course of business.
2019 2018 Note (Rupees in thousand)
11.4 Workers’ profits participation fund (WPPF) Balance as on 01 July 1,423,082 1,332,987 Allocation for the year 33 255,337 379,134 Interest for the year 35 9,896 27,132 1,688,315 1,739,253 Less: Payments during the year (204,983) (316,171)
1,483,332 1,423,082
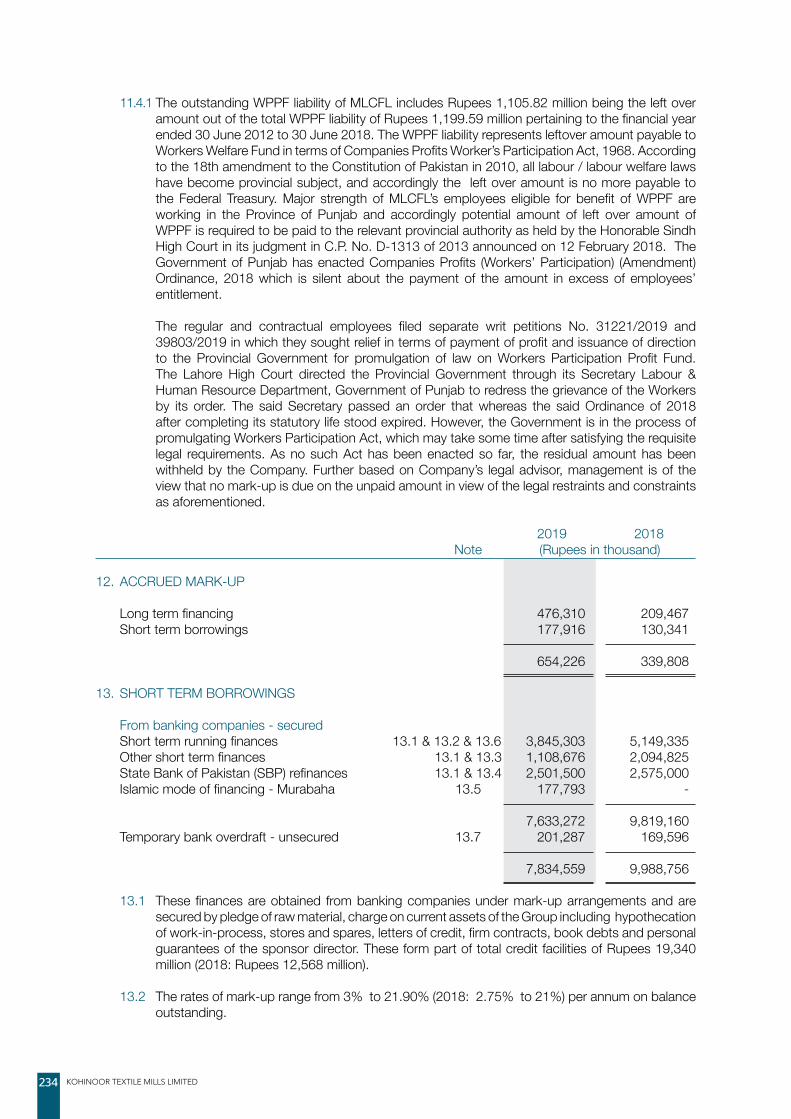
KOHINOOR TEXTILE MILLS LIMITED234
11.4.1 The outstanding WPPF liability of MLCFL includes Rupees 1,105.82 million being the left over amount out of the total WPPF liability of Rupees 1,199.59 million pertaining to the financial year ended 30 June 2012 to 30 June 2018. The WPPF liability represents leftover amount payable to Workers Welfare Fund in terms of Companies Profits Worker’s Participation Act, 1968. According to the 18th amendment to the Constitution of Pakistan in 2010, all labour / labour welfare laws have become provincial subject, and accordingly the left over amount is no more payable to the Federal Treasury. Major strength of MLCFL’s employees eligible for benefit of WPPF are working in the Province of Punjab and accordingly potential amount of left over amount of WPPF is required to be paid to the relevant provincial authority as held by the Honorable Sindh High Court in its judgment in C.P. No. D-1313 of 2013 announced on 12 February 2018. The Government of Punjab has enacted Companies Profits (Workers’ Participation) (Amendment) Ordinance, 2018 which is silent about the payment of the amount in excess of employees’ entitlement.
The regular and contractual employees filed separate writ petitions No. 31221/2019 and
39803/2019 in which they sought relief in terms of payment of profit and issuance of direction to the Provincial Government for promulgation of law on Workers Participation Profit Fund. The Lahore High Court directed the Provincial Government through its Secretary Labour & Human Resource Department, Government of Punjab to redress the grievance of the Workers by its order. The said Secretary passed an order that whereas the said Ordinance of 2018 after completing its statutory life stood expired. However, the Government is in the process of promulgating Workers Participation Act, which may take some time after satisfying the requisite legal requirements. As no such Act has been enacted so far, the residual amount has been withheld by the Company. Further based on Company’s legal advisor, management is of the view that no mark-up is due on the unpaid amount in view of the legal restraints and constraints as aforementioned.
2019 2018 Note (Rupees in thousand)
12. ACCRUED MARK-UP
Long term financing 476,310 209,467 Short term borrowings 177,916 130,341 654,226 339,808 13. SHORT TERM BORROWINGS From banking companies - secured Short term running finances 13.1 & 13.2 & 13.6 3,845,303 5,149,335 Other short term finances 13.1 & 13.3 1,108,676 2,094,825 State Bank of Pakistan (SBP) refinances 13.1 & 13.4 2,501,500 2,575,000 Islamic mode of financing - Murabaha 13.5 177,793 - 7,633,272 9,819,160 Temporary bank overdraft - unsecured 13.7 201,287 169,596 7,834,559 9,988,756
13.1 These finances are obtained from banking companies under mark-up arrangements and are secured by pledge of raw material, charge on current assets of the Group including hypothecation of work-in-process, stores and spares, letters of credit, firm contracts, book debts and personal guarantees of the sponsor director. These form part of total credit facilities of Rupees 19,340 million (2018: Rupees 12,568 million).
13.2 The rates of mark-up range from 3% to 21.90% (2018: 2.75% to 21%) per annum on balance
outstanding.

ANNUAL REPORT 2019 235
13.3 The rates of mark-up range from 7.33% to 13.99% (2018: 2.5% to 8.26% ) per annum on balance outstanding.
13.4 The rate of mark-up was 3% (2018: 3% ) per annum on balance outstanding. 13.5 This represents utilized amount of Murabaha facility of Rupees 350 million (2018: Rupees Nil)
from MCB Islamic Bank Limited and carry mark-up at the rate of 3 month KIBOR plus 1.25% (30 June 2018: Rupees Nil) per annum, payable quarterly. This facility is secured against charge over all current assets of the Subsidiary Company with a margin of 25% and will expire on 31 July 2019.
13.6 This includes utilized amount of finance against trust receipt facilities aggregating to Rupees 1,300 million
(2018: Rupees 500 million). These carry mark-up rates ranging form 3 month KIBOR plus 0.50% to 3 month KIBOR plus 1.5% (30 June 2018: 3 month KIBOR plus 1.50%) per annum, payable quarterly. These facilities are secured against first pari passu charge over all current assets and fixed assets (excluding land and building) of MLPL, Corporate guarantee of the MLCFL, personal guarantees of sponsored directors of the MLPL and assignment of receivables of MLCFL. These facilities are expiring on various dates (Latest by 28 September 2019 and maximum by 31 December 2019).
13.7 This represents temporary overdraft due to cheques issued in excess of balance with banks
which will be presented for payment in subsequent period. 14. CONTINGENCIES AND COMMITMENTS
14.1 Contingencies Holding Company a) The Company filed an appeal before Appellate Tribunal Inland Revenue, Lahore for the tax year
2003 against order of Commissioner Inland Revenue (Appeals) (CIR(A)) dated 18 September 2008 passed under section 122 (5A) of the Income Tax Ordinance, 2001 wherein the order of the Assessing Officer creating demand of Rupees 20.780 million was upheld. In addition to above, another appeal for the tax year 2003 was filed by the tax department before Appellate Tribunal Inland Revenue against the order of CIR (A) passed under section 221, through which order of the assessing officer regarding disallowance of depreciation expense amounting to Rupees 62.666 million and penalty levied amounting to Rupees 17.484 million had been annulled. No provision has been made in these consolidated financial statements as the Company is hopeful of favorable outcome of these cases.
b) The Company filed an appeal before Appellate Tribunal Inland Revenue, Lahore for the tax year
2004. The loss for the tax year 2004 was assessed at Rupees 255.684 million reducing refund to Rupees 7.499 million vide order dated 22 May 2009. The matter was decided in favor of the Company. However, department filed an appeal in the Honorable Lahore High Court, Lahore against the decision. No provision has been made in these consolidated financial statements since the Company is confident about favorable outcome of the case.
c) Tax department filed an appeal before Appellate Tribunal Inland Revenue against the order of
Commissioner Inland Revenue (Appeals) dated 13 May 2015, by which the demand amounting to Rupees 54.010 million created by assessing officer under section 122(5A) of the Income Tax Ordinance, 2001 for the tax year 2009 was annulled. No provision has been made in these consolidated financial statements as the Company is hopeful of a favorable outcome.
d) Tax department filed an appeal before Appellate Tribunal Inland Revenue against the order
of Commissioner Inland Revenue (Appeals) dated 06 September 2014, by which the demand amounting to Rupees 22.110 million created by assessing officer under section 122(5A) of the Income Tax Ordinance, 2001 for the tax year 2010 was annulled. No provision has been made in these consolidated financial statements as the Company is hopeful of a favorable outcome.

KOHINOOR TEXTILE MILLS LIMITED236
e) The Company filed income tax return for the tax year 2011 having tax loss amounting to Rupees 957.623 million and creating a refund of Rupees 107.808 million. An assessment dated 12 May 2017 under section 122(5A) of the Income Tax Ordinance, 2001 has been finalized by restricting loss to Rupees 435.435 million and reducing refund to Rupees Nil. The Company has filed an appeal before Commissioner Inland Revenue (Appeals) which is pending for hearing. No provision has been made in these consolidated financial statements as the Company is hopeful of a favorable outcome.
f) The Company filed income tax return for Tax Year 2016 having taxable income amounting to
Rupees 762.669 million and creating a refund of Rupees 30.721 million. An assessment under section 122(5A) of the Income Tax Ordinance, 2001 dated 31 May 2018 has been finalized and taxable income has been assessed at Rupees 1,167.832 million by creating demand of Rupees 231.109 million. The Company filed an appeal before Commissioner Inland Revenue (Appeals) who, vide its order dated 14 November 2018, granted relief on major issues, while upheld the order on various other issues. The Company filed appeal before the Honorable Appellate Tribunal Inland Revenue where the case is still pending. No provision has been made in these consolidated financial statements as the Company is hopeful of a favorable outcome.
g) The Company and tax authorities filed appeals before different appellate authorities
regarding sales tax and custom duty matter. Pending the outcome of appeals filed by the Company and tax authorities, no provision has been made in these consolidated financial statements which on the basis adopted by the authorities would amount to Rupees 184.700 million (2018: Rupees 87.996 mill ion), since the Company has strong grounds against the assessments framed by the relevant authorities.
h) The Company filed recovery suits in Civil Courts amounting to Rupees 14.683 million (2018:
Rupees 15.164 million) against various suppliers and customers for goods supplied by / to them. Pending the outcome of the cases, no provision has been made in these consolidated financial statements since the Company is confident about favorable outcome of the cases.
i) The Company filed suits before Civil Court, Rawalpindi and Lahore High Court, against demands
raised by Sui Northern Gas Pipelines Limited (SNGPL) amounting to Rupees 84.057 million (2018: Rupees 72.811 million). No provision has been made in these consolidated financial statements, since the Company is confident about favorable outcome.
j) The Company filed an appeal before Supreme Court of Pakistan against an order of Lahore
High Court, Rawalpindi Bench on an appeal filed by supplier for non-payment by the Company. The Company has provided a guarantee of Rupees 4.254 million on the directions of Supreme Court of Pakistan. Appeal is pending adjudication and the Company expects a favorable outcome.
k) Guarantees issued by various commercial banks, in respect of financial and operational obligations of the Company, to various institutions and corporate bodies aggregate to Rupees 299.257 million (2018: Rupees 279.257 million).
Subsidiary Company - Maple Leaf Cement Factory Limited a) The Company has filed writ petitions before the Honorable Lahore High Court against the
legality of judgment passed by the Customs, Excise and Sales Tax Appellate Tribunal in 2004 whereby the Company was held liable on account of wrongful adjustment of input sales tax on raw materials. The amount involved pending adjudication before the Honorable Lahore High Court is Rupees 10.01 million. No provision has been made in these consolidated financial statements in respect of the matter as the management and the Company’s legal advisor are confident that the ultimate outcome of this case will be in favor of the Company.
b) The Company has filed an appeal before the Customs, Central Excise and Sales Tax Appellate
Tribunal, Karachi against the order of the Deputy Collector Customs whereby the refund claim of the Company amounting to Rupees 12.35 million was rejected and the Company was held

ANNUAL REPORT 2019 237
liable to pay an amount of Rupees 37.05 million by way of 10% customs duty allegedly leviable in terms of SRO 584(I)/95 and 585(I)/95 dated 01 July 1995. The impugned demand was raised by the department on the alleged ground that the Company was not entitled to exemption from payment of customs duty and sales tax in terms of SRO 279(I)/94 dated 02 April 1994.
The Honorable Lahore High Court, upon the Company’s appeal, vide its order dated 06
November 2001 has decided the matter in favor of the Company; however, the Collector of Customs has preferred a petition before the Honorable Sindh High Court, which is pending adjudication. No provision has been made in these consolidated financial statements in respect of the above stated amount as the management and the Company’s legal advisor are confident that the ultimate outcome of this case will be in favor of the Company.
c) The Federal Board of Revenue (FBR) has filed an appeal before the Honorable Supreme
Court of Pakistan against the judgment delivered by the Honorable Lahore High Court in favor of the Company in a writ petition. The Company, through the said writ petition, had challenged the demand raised by the FBR for payment of duties and taxes on the plant and machinery imported by the Company pursuant to the exemption granted in terms of SRO 484 (I) / 92 dated 14 May 1992. The FBR, however, alleged that the said plant and machinery could be locally manufactured and duties and taxes were therefore not exempted. A total demand of Rupees 1,386.72 million was raised by the FBR out of which an amount of Rupees 269.33 million was deposited by the Company as undisputed liability. No provision has been made in these consolidated financial statements in respect of the above stated amount as the management and the Company’s legal advisor are confident that the ultimate outcome of this case will be in favor of the Company.
d) The Company has filed an appeal before the Honorable Supreme Court of Pakistan against
the judgment of the Division Bench of the Honorable High Court of Sindh at Karachi. The Division Bench, by judgment dated 15 September 2008, has partly accepted the appeal by declaring that the levy and collection of infrastructure cess / fee prior to 28 December 2006 was illegal and ultra vires and after 28 December 2006, it was legal and the same was collected by the Excise Department in accordance with the law. The appeal has been filed against the declaration that after 28 December 2006, the Excise Department has collected the infrastructure cess / fee in accordance with law. The Province of Sindh and Excise and Taxation Department has also preferred an appeal against the judgment decided against them. The Honorable Supreme Court consolidated both the appeals and were set aside. Thereafter, law has been challenged in constitution petition in the Honorable Sindh High Court Karachi. Stay has been granted by the Honorable High Court on 31 May 2011 on payment of 50% of the cess to the Excise Department and on furnishing of bank guarantee for remaining 50% to them. The petition is pending for hearing and stay is continuing. The management and the Company’s legal advisor are confident that the ultimate outcome of this case will be in favor of the Company.
e)The Company has filed an appeal before the Honorable Sindh High Court to challenge Sindh
Development and Maintenance on levy and collection of infrastructure cess under Infrastructure Cess Act 2017. Stay has been granted by the Honorable High Court on 27 November 2017 in line with earlier petitions explained in note (d) of these consolidated financial statements, i.e. on payment of 50% of the cess to the Excise Department and on furnishing of bank guarantee for remaining 50% to them. The petition is pending for hearing and stay is continuing.
f) Competition Commission of Pakistan, vide order dated 27 August 2009, has imposed penalty
on twenty cement factories of Pakistan at the rate of 7.5% of the turnover value. The Commission has imposed penalty amounting to Rupees 586.19 million on the Company. The Commission has alleged that provisions of section 4(1) of the Competition Commission Ordinance, 2007 have been violated. However, after the abeyance of Honorable Islamabad High Court pursuant to the judgment of Honorable Supreme Court of Pakistan dated 31 July 2009, the titled petition has become infructuous and the Company has filed a writ petition No. 15618/2009 before the Honorable Lahore High Court. No provision has been made in these consolidated financial statements as the management and the Company’s legal advisor are confident that the ultimate outcome of this case will be in favor of the Company.
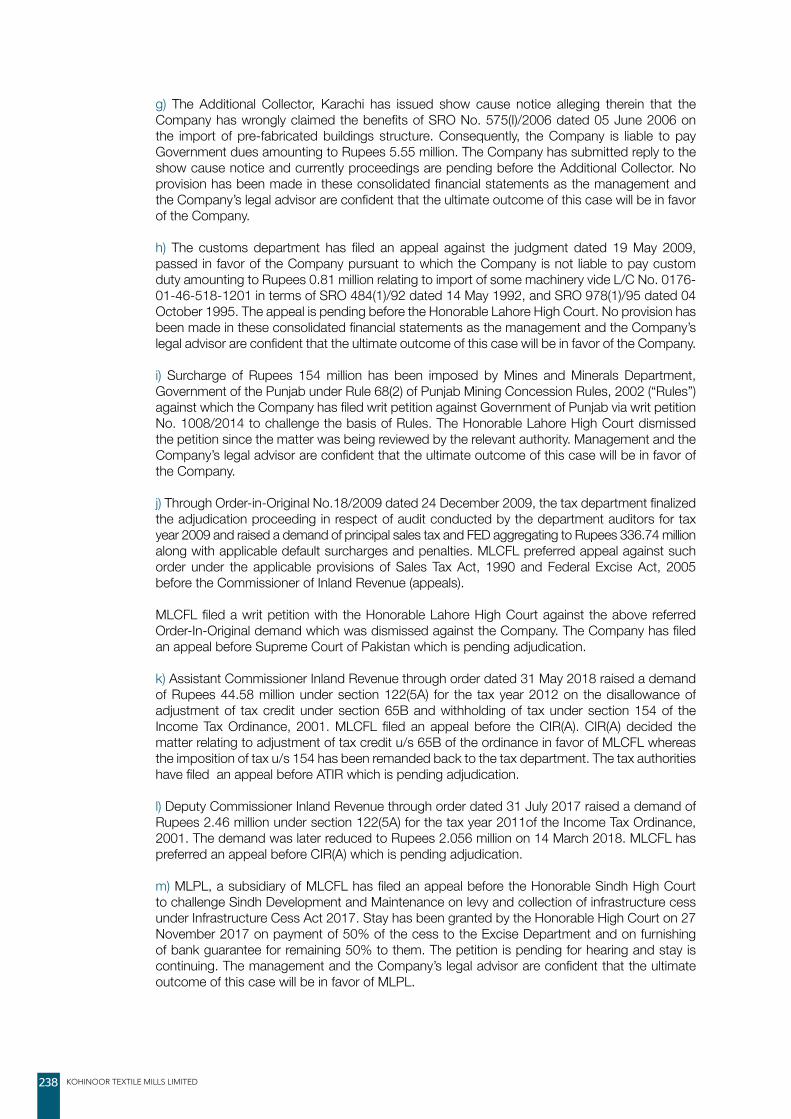
KOHINOOR TEXTILE MILLS LIMITED238
g) The Additional Collector, Karachi has issued show cause notice alleging therein that the Company has wrongly claimed the benefits of SRO No. 575(I)/2006 dated 05 June 2006 on the import of pre-fabricated buildings structure. Consequently, the Company is liable to pay Government dues amounting to Rupees 5.55 million. The Company has submitted reply to the show cause notice and currently proceedings are pending before the Additional Collector. No provision has been made in these consolidated financial statements as the management and the Company’s legal advisor are confident that the ultimate outcome of this case will be in favor of the Company.
h) The customs department has filed an appeal against the judgment dated 19 May 2009,
passed in favor of the Company pursuant to which the Company is not liable to pay custom duty amounting to Rupees 0.81 million relating to import of some machinery vide L/C No. 0176-01-46-518-1201 in terms of SRO 484(1)/92 dated 14 May 1992, and SRO 978(1)/95 dated 04 October 1995. The appeal is pending before the Honorable Lahore High Court. No provision has been made in these consolidated financial statements as the management and the Company’s legal advisor are confident that the ultimate outcome of this case will be in favor of the Company.
i) Surcharge of Rupees 154 million has been imposed by Mines and Minerals Department, Government of the Punjab under Rule 68(2) of Punjab Mining Concession Rules, 2002 (“Rules”) against which the Company has filed writ petition against Government of Punjab via writ petition No. 1008/2014 to challenge the basis of Rules. The Honorable Lahore High Court dismissed the petition since the matter was being reviewed by the relevant authority. Management and the Company’s legal advisor are confident that the ultimate outcome of this case will be in favor of the Company.
j) Through Order-in-Original No.18/2009 dated 24 December 2009, the tax department finalized the adjudication proceeding in respect of audit conducted by the department auditors for tax year 2009 and raised a demand of principal sales tax and FED aggregating to Rupees 336.74 million along with applicable default surcharges and penalties. MLCFL preferred appeal against such order under the applicable provisions of Sales Tax Act, 1990 and Federal Excise Act, 2005 before the Commissioner of Inland Revenue (appeals).
MLCFL filed a writ petition with the Honorable Lahore High Court against the above referred Order-In-Original demand which was dismissed against the Company. The Company has filed an appeal before Supreme Court of Pakistan which is pending adjudication.
k) Assistant Commissioner Inland Revenue through order dated 31 May 2018 raised a demand of Rupees 44.58 million under section 122(5A) for the tax year 2012 on the disallowance of adjustment of tax credit under section 65B and withholding of tax under section 154 of the Income Tax Ordinance, 2001. MLCFL filed an appeal before the CIR(A). CIR(A) decided the matter relating to adjustment of tax credit u/s 65B of the ordinance in favor of MLCFL whereas the imposition of tax u/s 154 has been remanded back to the tax department. The tax authorities have filed an appeal before ATIR which is pending adjudication.
l) Deputy Commissioner Inland Revenue through order dated 31 July 2017 raised a demand of Rupees 2.46 million under section 122(5A) for the tax year 2011of the Income Tax Ordinance, 2001. The demand was later reduced to Rupees 2.056 million on 14 March 2018. MLCFL has preferred an appeal before CIR(A) which is pending adjudication.
m) MLPL, a subsidiary of MLCFL has filed an appeal before the Honorable Sindh High Court to challenge Sindh Development and Maintenance on levy and collection of infrastructure cess under Infrastructure Cess Act 2017. Stay has been granted by the Honorable High Court on 27 November 2017 on payment of 50% of the cess to the Excise Department and on furnishing of bank guarantee for remaining 50% to them. The petition is pending for hearing and stay is continuing. The management and the Company’s legal advisor are confident that the ultimate outcome of this case will be in favor of MLPL.

ANNUAL REPORT 2019 239
n) Guarantees given by banks on behalf of the MLCFL are of Rupees 1,332.589 million (2018: Rupees 602.994 million) in favor of Sui Northern Gas Pipeline Limited and Government Institutions.
14.2 Commitments: a) Letters of credi t for capi ta l expendi ture amount to Rupees 621.626 mi l l ion
(2018: Rupees 5,284.011 million).
b) Letters of credit other than for capital expenditure amounting to Rupees 1,033.108 million (2018: Rupees 1,549.443 million).
c) Contracts for capital expenditure amounting to Rupees 54.550 million (2018: Rupees 747.312 million).
d) Future contracts - shares in respect of which the settlement is outstanding amounting to Rupees 1,830.274 million (2018: Rupees 593.208 million).
e) Future contracts - gold in respect of which the settlement is outstanding amounting to Rupees 909.750 million (2018: Rupees 328.888 million).
2019 2018 (Rupees in thousand) 15. PROPERTY, PLANT AND EQUIPMENT Operating fixed assets - Owned (Note 15.1) 55,748,674 31,760,197 Capital work in progress (Note 15.1.5) 504,217 17,085,181 Stores held for capitalization 59,917 1,204,297 56,312,808 50,049,675

KOHINOOR TEXTILE MILLS LIMITED240
15.1
O
PERA
TING
FIX
ED A
SSET
S
Ow
ned
Asse
ts
Le
ased
Ass
ets
Fr
eeho
ld
Offic
e Fa
ctor
y an
d Re
siden
tial
Plan
t and
Se
rvice
s Co
mpu
ters
Fu
rnitu
re
Offic
e Ve
hicle
s Q
uarry
Sh
are
of
Pl
ant a
nd
lan
d bu
ildin
gs
othe
r an
d ot
her
mac
hine
ry
and
othe
r an
d IT
an
d eq
uipm
ent
eq
uipm
ent
join
t ass
ets
Tota
l m
achi
nery
bu
ildin
gs
build
ings
equi
pmen
t in
stall
atio
ns
fixtu
res
(Rup
ees
in th
ousa
nd)
At
30
June
201
7
Cost
/ re
valu
ed a
mou
nt
3,1
34,8
14
33,
668
6
,546
,151
1
21,3
87
34,
678,
354
6
1,10
4
110
,328
4
85,5
42
46,
605
4
64,1
91
185
,023
6
,000
4
5,87
3,16
7
673
,053
Ac
cum
ulat
ed d
epre
ciatio
n -
(8
,291
) (2
,908
,660
) (7
1,01
5)
(17,
545,
921)
(3
3,00
1)
(77,
475)
(2
47,4
92)
(28,
005)
(2
07,4
98)
(160
,362
) (4
,661
) (2
1,29
2,38
1)
(254
,761
)
Net b
ook
valu
e 3
,134
,814
2
5,37
7
3,6
37,4
91
50,
372
1
7,13
2,43
3
28,
103
3
2,85
3
238
,050
1
8,60
0
256
,693
2
4,66
1
1,3
39
24,
580,
786
4
18,2
92
Year
end
ed 3
0 Ju
ne 2
018
O
peni
ng n
et b
ook
valu
e
3,1
34,8
14
25,
377
3
,637
,491
5
0,37
2
17,
132,
433
2
8,10
3
32,
853
2
38,0
50
18,
600
2
56,6
93
24,
661
1
,339
2
4,58
0,78
6
418
,292
Ad
ditio
ns
-
-
2,1
17,9
83
41,
537
7
,003
,992
5
09
4,8
82
61,
782
2
,867
1
39,5
99
-
-
9,3
73,1
51
-
Reva
luat
ion
surp
lus
(Not
e 4)
2
0,59
1
-
-
-
-
-
-
-
-
-
-
-
20,
591
-
As
sets
tran
sfer
red
from
leas
e
asse
ts to
ow
ned
asse
ts:
Co
st
-
-
-
-
673
,053
-
-
-
-
-
-
-
6
73,0
53
(673
,053
)Ac
cum
ulat
ed d
epre
ciatio
n -
-
-
-
(2
72,3
25)
-
-
-
-
-
-
-
(272
,325
) 2
72,3
25
-
-
-
-
400
,728
-
-
-
-
-
-
-
4
00,7
28
(400
,728
)Di
spos
als:
Co
st /
reva
lued
am
ount
-
(645
)
(107
,716
)
(1,0
71)
(91)
(1
88)
(55,
883)
(1
4,71
2)
-
(180
,306
) -
Ac
cum
ulat
ed d
epre
ciatio
n -
245
58,
883
710
5
6
107
3
6,57
8
14,
510
-
1
11,0
89
-
-
-
(400
) -
(4
8,83
3)
-
(361
) (3
5)
(81)
(1
9,30
5)
(202
) -
(6
9,21
7)
-
Depr
eciat
ion
char
ge
-
(358
) (3
50,6
92)
(7,2
94)
(1,9
97,5
72)
(3,2
27)
(10,
063)
(1
14,4
09)
(1,9
94)
(55,
998)
(3
,090
) (1
,145
) (2
,545
,842
) (1
7,56
4)
Clos
ing
net b
ook
valu
e
3,1
55,4
05
25,
019
5
,404
,382
8
4,61
5
22,
490,
748
2
5,38
5
27,
311
1
85,3
88
19,
392
3
20,9
89
21,
369
1
94
31,
760,
197
-
At
30
June
201
8
Co
st /
reva
lued
am
ount
3
,155
,405
3
3,66
8
8,6
63,4
89
162
,924
4
2,24
7,68
3
61,
613
1
14,1
39
547
,233
4
9,28
4
547
,907
1
70,3
11
6,0
00
55,
759,
656
-
Ac
cum
ulat
ed d
epre
ciatio
n -
(8
,649
) (3
,259
,107
) (7
8,30
9)
(19,
756,
935)
(3
6,22
8)
(86,
828)
(3
61,8
45)
(29,
892)
(2
26,9
18)
(148
,942
) (5
,806
) (2
3,99
9,45
9)
-
Net b
ook
valu
e 3
,155
,405
2
5,01
9
5,4
04,3
82
84,
615
2
2,49
0,74
8
25,
385
2
7,31
1
185
,388
1
9,39
2
320
,989
2
1,36
9
194
3
1,76
0,19
7
-
Year
end
ed 3
0 Ju
ne 2
019
Ope
ning
net
boo
k va
lue
3
,155
,405
2
5,01
9
5,4
04,3
82
84,
615
2
2,49
0,74
8
25,
385
2
7,31
1
185
,388
1
9,39
2
320
,989
2
1,36
9
194
3
1,76
0,19
7
-
Addi
tions
7
67,1
36
22,
777
7
,493
,956
8
,566
1
8,53
7,90
7
849
5
,825
2
6,16
6
5,7
13
129
,967
7
,080
-
2
7,00
5,94
2
-
Reva
luat
ion
surp
lus
(Not
e 4)
-
-
-
-
-
-
-
-
-
-
-
-
-
-
Di
spos
als:
Cost
/ re
valu
ed a
mou
nt
-
-
(256
,118
)
(563
) -
-
(5
5,78
1)
-
-
(312
,462
) -
Ac
cum
ulat
ed d
epre
ciatio
n -
-
1
41,9
08
3
88
-
-
34,
390
-
-
1
76,6
86
-
-
-
-
-
(114
,210
) -
(1
75)
-
-
(21,
391)
-
-
(1
35,7
76)
-
Depr
eciat
ion
char
ge
-
(340
) (3
97,0
09)
(8,7
31)
(2,3
47,7
46)
(1,6
08)
(8,9
30)
(40,
617)
(2
,185
) (6
7,79
1)
(6,7
32)
-
(2,8
81,6
89)
-
Clos
ing
net b
ook
valu
e
3,9
22,5
41
47,
456
12,
501,
329
8
4,45
0
38,
566,
699
2
4,62
6
24,
031
1
70,9
37
22,
920
3
61,7
74
21,
717
1
94
55,
748,
674
-
At
30
June
201
9
Co
st /
reva
lued
am
ount
3
,922
,541
5
6,44
5 1
6,15
7,44
5
171
,490
6
0,52
9,47
2
62,
462
1
19,4
01
573
,399
5
4,99
7
622
,093
1
77,3
91
6,0
00
82,
453,
136
-
Ac
cum
ulat
ed d
epre
ciatio
n -
(8
,989
) (3
,656
,116
) (8
7,04
0)
(21,
962,
773)
(3
7,83
6)
(95,
370)
(4
02,4
62)
(32,
077)
(2
60,3
19)
(155
,674
) (5
,806
) (2
6,70
4,46
2)
-
Net b
ook
valu
e 3
,922
,541
4
7,45
6 1
2,50
1,32
9
84,
450
3
8,56
6,69
9
24,
626
2
4,03
1
170
,937
2
2,92
0
361
,774
2
1,71
7
194
5
5,74
8,67
4
-
Depr
eciat
ion
rate
(%)
-
5 -
10
5 -
10
5 -
10
5 -
20
10
3
0
10
1
0
20
2
0
10
10
- 20
15.1.
1 Fr
eeho
ld la
nd o
f the
Hol
ding
Com
pany
was
reva
lued
by a
n in
depe
nden
t valu
er A
nder
son
Cons
ultin
g (P
rivat
e) L
imite
d (E
valu
ator
s, S
urve
yors
, Sto
ck In
spec
tors
, Arc
hite
cts
& En
gine
ers)
as
at 3
0 Ju
ne
2019
. Boo
k va
lue
of fr
eeho
ld la
nd o
n co
st b
asis
is Ru
pees
160
.105
milli
on (2
018:
Rup
ees
160.
105
milli
on) a
s on
30
June
201
9. H
ad th
ere
been
no
reva
luat
ion,
the
valu
e of
free
hold
land
wou
ld
have
bee
n lo
wer
by
Rupe
es 2
,579
.452
milli
on (2
018:
Rup
ees
2,57
9.45
2 m
illion
). Fr
eeho
ld la
nd o
f MLC
FL w
as re
valu
ed b
y Ar
if Ev
aluat
ors
as a
t 30
June
201
5, fo
rced
sale
valu
e at
30
June
201
5 w
as R
upee
s 34
4.07
7 m
illion
.
15.1.
2 Bo
rrow
ing
cost
of R
upee
s 1,
265.
64 m
illion
(201
8: R
upee
s 1.
347
milli
on) w
as c
apita
lized
dur
ing
the
year
usin
g th
e ca
pita
lizat
ion
rate
rang
ing
from
4.5
% to
8%
(201
8: 4
.5%
to 8
%) p
er a
nnum
.
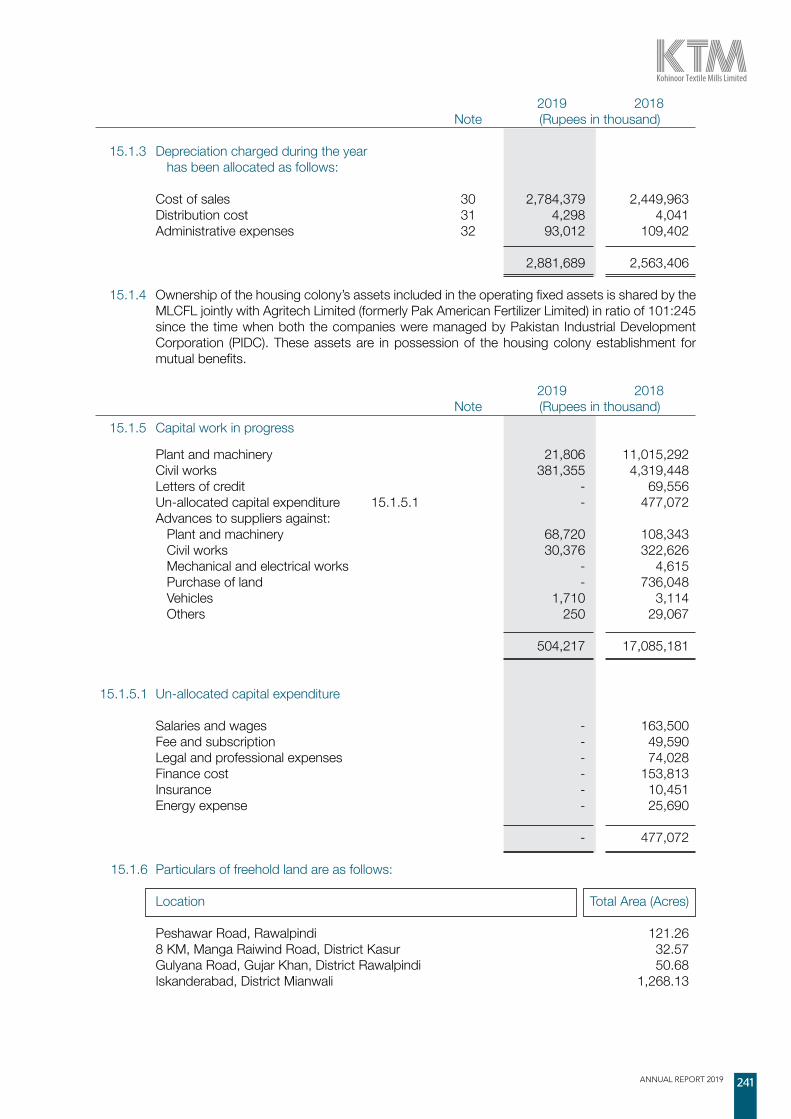
ANNUAL REPORT 2019 241
2019 2018 Note (Rupees in thousand)
15.1.3 Depreciation charged during the year has been allocated as follows: Cost of sales 30 2,784,379 2,449,963 Distribution cost 31 4,298 4,041 Administrative expenses 32 93,012 109,402 2,881,689 2,563,406
15.1.4 Ownership of the housing colony’s assets included in the operating fixed assets is shared by the MLCFL jointly with Agritech Limited (formerly Pak American Fertilizer Limited) in ratio of 101:245 since the time when both the companies were managed by Pakistan Industrial Development Corporation (PIDC). These assets are in possession of the housing colony establishment for mutual benefits.
2019 2018 Note (Rupees in thousand) 15.1.5 Capital work in progress Plant and machinery 21,806 11,015,292 Civil works 381,355 4,319,448 Letters of credit - 69,556 Un-allocated capital expenditure 15.1.5.1 - 477,072 Advances to suppliers against: Plant and machinery 68,720 108,343 Civil works 30,376 322,626 Mechanical and electrical works - 4,615 Purchase of land - 736,048 Vehicles 1,710 3,114 Others 250 29,067 504,217 17,085,181 15.1.5.1 Un-allocated capital expenditure Salaries and wages - 163,500 Fee and subscription - 49,590 Legal and professional expenses - 74,028 Finance cost - 153,813 Insurance - 10,451 Energy expense - 25,690 - 477,072
15.1.6 Particulars of freehold land are as follows:
Location Total Area (Acres) Peshawar Road, Rawalpindi 121.26 8 KM, Manga Raiwind Road, District Kasur 32.57 Gulyana Road, Gujar Khan, District Rawalpindi 50.68 Iskanderabad, District Mianwali 1,268.13
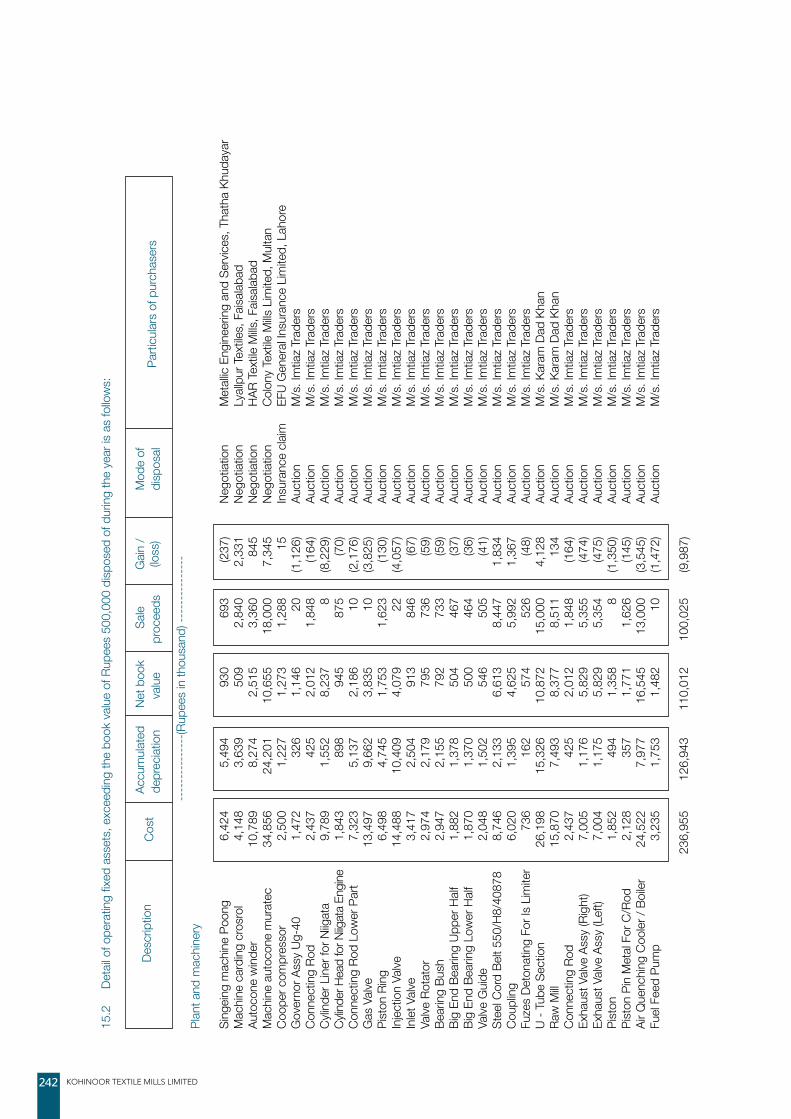
KOHINOOR TEXTILE MILLS LIMITED242
15.2
D
etail
of o
pera
ting
fixed
ass
ets,
exc
eedi
ng th
e bo
ok v
alue
of R
upee
s 50
0,00
0 di
spos
ed o
f dur
ing
the
year
is a
s fo
llow
s:
Desc
riptio
n
Accu
mul
ated
N
et b
ook
S
ale
Gain
/
Mod
e of
Parti
cular
s of
pur
chas
ers
Co
st
depr
eciat
ion
va
lue
proc
eeds
(lo
ss)
disp
osal
--
----
----
----
- (Rup
ees
in th
ousa
nd) -
----
----
----
--Pl
ant a
nd m
achi
nery
Sing
eing
mac
hine
Poo
ng
6,4
24
5,4
94
930
6
93
(237
) Ne
gotia
tion
Met
allic
Engi
neer
ing
and
Serv
ices,
Tha
tha
Khud
ayar
Mac
hine
car
ding
cro
srol
4
,148
3
,639
5
09
2,8
40
2,3
31
Nego
tiatio
n Ly
allpu
r Tex
tiles,
Fais
alaba
dAu
toco
ne w
inde
r 1
0,78
9
8,2
74
2,5
15
3,3
60
845
Ne
gotia
tion
HAR
Text
ile M
ills, F
aisala
bad
Mac
hine
aut
ocon
e m
urat
ec
34,
856
2
4,20
1
10,
655
1
8,00
0
7,3
45
Nego
tiatio
n Co
lony
Tex
tile M
ills L
imite
d, M
ulta
nCo
oper
com
pres
sor
2,5
00
1,2
27
1,2
73
1,2
88
15
In
sura
nce
claim
EF
U G
ener
al In
sura
nce
Lim
ited,
Lah
ore
Gov
erno
r Ass
y Ug
-40
1,4
72
326
1
,146
2
0
(1,1
26)
Auct
ion
M/s
. Im
tiaz
Trad
ers
Conn
ectin
g Ro
d 2
,437
4
25
2,0
12
1,8
48
(164
) Au
ctio
n M
/s. I
mtia
z Tr
ader
sCy
linde
r Lin
er fo
r Niig
ata
9,7
89
1,5
52
8,2
37
8
(8,2
29)
Auct
ion
M/s
. Im
tiaz
Trad
ers
Cylin
der H
ead
for N
iigat
a En
gine
1
,843
8
98
945
8
75
(70)
Au
ctio
n M
/s. I
mtia
z Tr
ader
sCo
nnec
ting
Rod
Low
er P
art
7,3
23
5,1
37
2,1
86
10
(2
,176
) Au
ctio
n M
/s. I
mtia
z Tr
ader
sG
as V
alve
1
3,49
7
9,6
62
3,8
35
10
(3
,825
) Au
ctio
n M
/s. I
mtia
z Tr
ader
sPi
ston
Rin
g
6,4
98
4,7
45
1,7
53
1,6
23
(130
) Au
ctio
n M
/s. I
mtia
z Tr
ader
sIn
jectio
n Va
lve
14,
488
1
0,40
9
4,0
79
22
(4
,057
) Au
ctio
n M
/s. I
mtia
z Tr
ader
sIn
let V
alve
3,4
17
2,5
04
913
8
46
(67)
Au
ctio
n M
/s. I
mtia
z Tr
ader
sVa
lve R
otat
or
2,9
74
2,1
79
795
7
36
(59)
Au
ctio
n M
/s. I
mtia
z Tr
ader
sBe
arin
g Bu
sh
2,9
47
2,1
55
792
7
33
(59)
Au
ctio
n M
/s. I
mtia
z Tr
ader
sBi
g En
d Be
arin
g Up
per H
alf
1,8
82
1,3
78
504
4
67
(37)
Au
ctio
n M
/s. I
mtia
z Tr
ader
sBi
g En
d Be
arin
g Lo
wer
Half
1
,870
1
,370
5
00
464
(3
6)
Auct
ion
M/s
. Im
tiaz
Trad
ers
Valve
Gui
de
2,0
48
1,5
02
546
5
05
(41)
Au
ctio
n M
/s. I
mtia
z Tr
ader
sSt
eel C
ord
Belt
550/
H8/4
0878
8
,746
2
,133
6
,613
8
,447
1
,834
Au
ctio
n M
/s. I
mtia
z Tr
ader
sCo
uplin
g
6,0
20
1,3
95
4,6
25
5,9
92
1,3
67
Auct
ion
M/s
. Im
tiaz
Trad
ers
Fuze
s De
tona
ting
For I
s Li
mite
r 7
36
162
5
74
526
(4
8)
Auct
ion
M/s
. Im
tiaz
Trad
ers
U - T
ube
Sect
ion
2
6,19
8
15,
326
1
0,87
2
15,
000
4
,128
Au
ctio
n M
/s. K
aram
Dad
Kha
nRa
w M
ill 1
5,87
0
7,4
93
8,3
77
8,5
11
134
Au
ctio
n M
/s. K
aram
Dad
Kha
nCo
nnec
ting
Rod
2,4
37
425
2
,012
1
,848
(1
64)
Auct
ion
M/s
. Im
tiaz
Trad
ers
Exha
ust V
alve
Assy
(Rig
ht)
7,0
05
1,1
76
5,8
29
5,3
55
(474
) Au
ctio
n M
/s. I
mtia
z Tr
ader
sEx
haus
t Valv
e As
sy (L
eft)
7,0
04
1,1
75
5,8
29
5,3
54
(475
) Au
ctio
n M
/s. I
mtia
z Tr
ader
sPi
ston
1
,852
4
94
1,3
58
8
(1,3
50)
Auct
ion
M/s
. Im
tiaz
Trad
ers
Pist
on P
in M
etal
For C
/Rod
2
,128
3
57
1,7
71
1,6
26
(145
) Au
ctio
n M
/s. I
mtia
z Tr
ader
sAi
r Que
nchi
ng C
ooler
/ Bo
iler
24,
522
7
,977
1
6,54
5
13,
000
(3
,545
) Au
ctio
n M
/s. I
mtia
z Tr
ader
sFu
el Fe
ed P
ump
3,2
35
1,7
53
1,4
82
10
(1
,472
) Au
ctio
n M
/s. I
mtia
z Tr
ader
s
2
36,9
55
126
,943
1
10,0
12
100
,025
(9
,987
)

ANNUAL REPORT 2019 243
Vehi
cles
Ho
nda
Civic
1
,950
1
,439
5
11
1,1
15
604
Ne
gotia
tion
Mr.
Zahi
d Id
rees
, Raw
alpin
diHo
nda
City
1
,675
1
,158
5
17
909
3
92
Nego
tiatio
n M
r. Sh
ahid
Far
ooq
(em
ploy
ee),
Laho
reSu
zuki
Cultu
s 1
,154
5
26
628
7
00
72
Au
ctio
n M
s. Iq
ra U
mar
(em
ploy
ee)
Suzu
ki Cu
ltus
1,6
03
90
1
,513
1
,583
7
0
Insu
ranc
e cla
im
EFU
Gen
eral
Insu
ranc
e Li
mite
dTo
yota
Cor
olla
1,9
23
641
1
,282
1
,600
3
18
Auct
ion
Mr.
Muh
amm
ad Is
haq
(em
ploy
ee)
Toyo
ta C
orol
la 1
,902
8
16
1,0
86
1,6
25
539
Au
ctio
n M
r. Si
bt e
Has
san
Toyo
ta C
orol
la 1
,886
1
,014
8
72
1,4
00
528
Au
ctio
n M
r. Am
er B
ilal
Toyo
ta C
orol
la 2
,044
1
,060
9
84
1,6
00
616
Au
ctio
n M
r. Ze
esha
n M
alik
Bhut
taTo
yota
Cor
olla
2,3
53
401
1
,952
1
,900
(5
2)
Nego
tiatio
n M
r. M
uham
mad
Sajj
adTo
yota
Cor
olla
2,3
60
293
2
,067
1
,900
(1
67)
Nego
tiatio
n M
r. Na
uman
Ahm
adTo
yota
Cor
olla
1,7
38
1,1
19
619
1
,200
5
81
Nego
tiatio
n M
r. Ta
riq A
hmed
Mir
Suzu
ki Cu
ltus
1,4
19
227
1
,192
1
,300
1
08
Insu
ranc
e cla
im
EFU
Gen
eral
Insu
ranc
e Li
mite
dSu
zuki
Cultu
s
948
4
71
477
7
75
298
Ne
gotia
tion
Mr.
Muh
amm
ad Is
haq,
Lah
ore
Toyo
ta C
orol
la 1
,849
9
75
874
1
,901
1
,027
Ne
gotia
tion
Mr.
Muh
amm
ad N
abee
l, La
hore
24,
804
1
0,23
0
14,
574
1
9,50
8
4,9
34
2
61,7
59
137
,173
1
24,5
86
119
,533
(5
,053
)
Aggr
egat
e of
oth
er it
ems
of
oper
atin
g fix
ed a
sset
s w
ith
indi
vidua
l boo
k va
lues
not
ex
ceed
ing
Rupe
es 5
00,0
00
50,
703
3
9,51
3
11,
190
2
7,08
6
15,
896
312
,462
1
76,6
86
135
,776
1
46,6
19
10,
843
Desc
riptio
n
Accu
mul
ated
N
et b
ook
S
ale
Gain
/
Mod
e of
Parti
cular
s of
pur
chas
ers
Co
st
depr
eciat
ion
va
lue
proc
eeds
(lo
ss)
disp
osal
--
----
----
----
- (Rup
ees
in th
ousa
nd) -
----
----
----
--
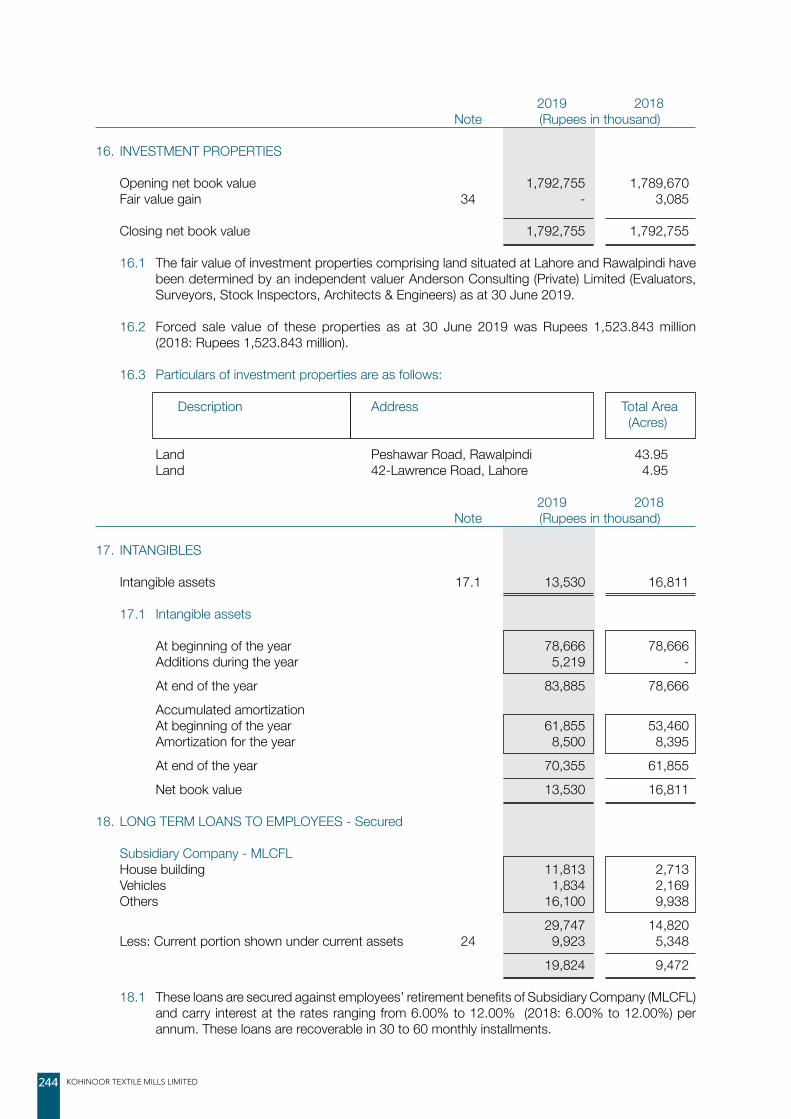
KOHINOOR TEXTILE MILLS LIMITED244
2019 2018 Note (Rupees in thousand)
16. INVESTMENT PROPERTIES
Opening net book value 1,792,755 1,789,670 Fair value gain 34 - 3,085 Closing net book value 1,792,755 1,792,755 16.1 The fair value of investment properties comprising land situated at Lahore and Rawalpindi have
been determined by an independent valuer Anderson Consulting (Private) Limited (Evaluators, Surveyors, Stock Inspectors, Architects & Engineers) as at 30 June 2019.
16.2 Forced sale value of these properties as at 30 June 2019 was Rupees 1,523.843 million
(2018: Rupees 1,523.843 million). 16.3 Particulars of investment properties are as follows:
Description Address Total Area (Acres) Land Peshawar Road, Rawalpindi 43.95 Land 42-Lawrence Road, Lahore 4.95
2019 2018 Note (Rupees in thousand)
17. INTANGIBLES Intangible assets 17.1 13,530 16,811 17.1 Intangible assets At beginning of the year 78,666 78,666 Additions during the year 5,219 - At end of the year 83,885 78,666 Accumulated amortization At beginning of the year 61,855 53,460 Amortization for the year 8,500 8,395 At end of the year 70,355 61,855 Net book value 13,530 16,811
18. LONG TERM LOANS TO EMPLOYEES - Secured Subsidiary Company - MLCFL House building 11,813 2,713 Vehicles 1,834 2,169 Others 16,100 9,938 29,747 14,820 Less: Current portion shown under current assets 24 9,923 5,348 19,824 9,472
18.1 These loans are secured against employees’ retirement benefits of Subsidiary Company (MLCFL) and carry interest at the rates ranging from 6.00% to 12.00% (2018: 6.00% to 12.00%) per annum. These loans are recoverable in 30 to 60 monthly installments.
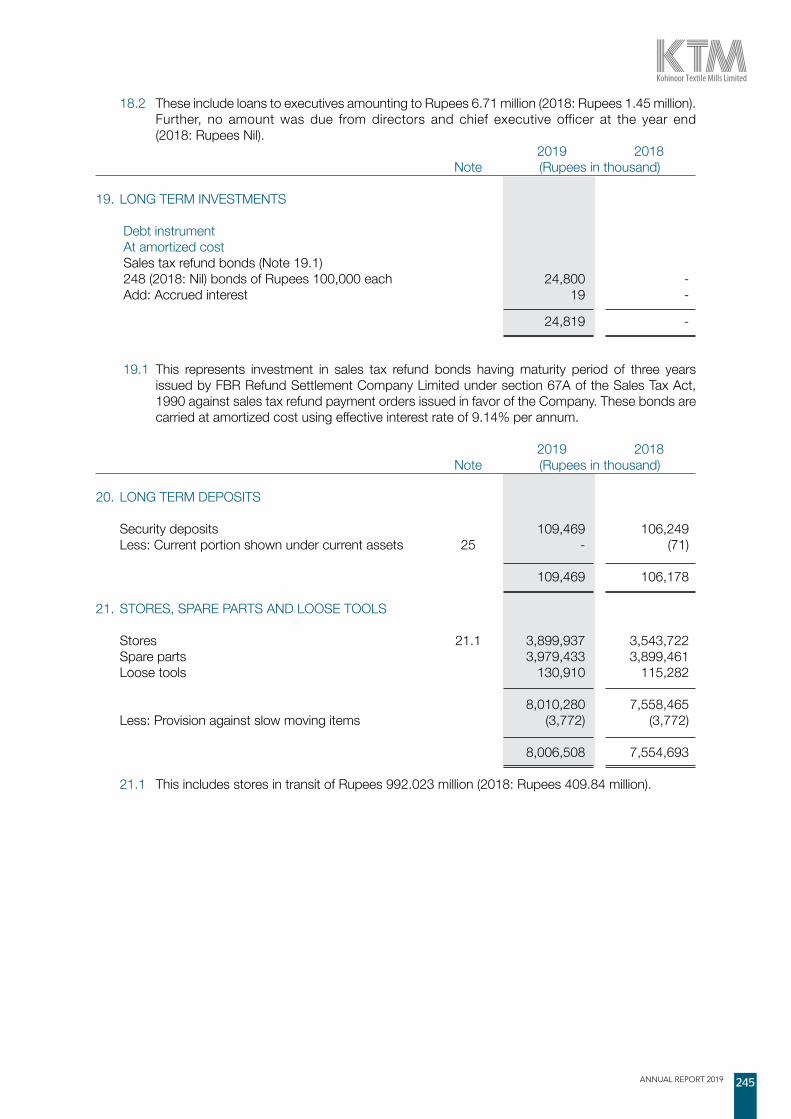
ANNUAL REPORT 2019 245
18.2 These include loans to executives amounting to Rupees 6.71 million (2018: Rupees 1.45 million). Further, no amount was due from directors and chief executive officer at the year end (2018: Rupees Nil).
2019 2018 Note (Rupees in thousand)
19. LONG TERM INVESTMENTS Debt instrument At amortized cost Sales tax refund bonds (Note 19.1) 248 (2018: Nil) bonds of Rupees 100,000 each 24,800 - Add: Accrued interest 19 -
24,819 -
19.1 This represents investment in sales tax refund bonds having maturity period of three years
issued by FBR Refund Settlement Company Limited under section 67A of the Sales Tax Act, 1990 against sales tax refund payment orders issued in favor of the Company. These bonds are carried at amortized cost using effective interest rate of 9.14% per annum.
2019 2018 Note (Rupees in thousand)
20. LONG TERM DEPOSITS Security deposits 109,469 106,249 Less: Current portion shown under current assets 25 - (71) 109,469 106,178 21. STORES, SPARE PARTS AND LOOSE TOOLS Stores 21.1 3,899,937 3,543,722 Spare parts 3,979,433 3,899,461 Loose tools 130,910 115,282 8,010,280 7,558,465 Less: Provision against slow moving items (3,772) (3,772) 8,006,508 7,554,693
21.1 This includes stores in transit of Rupees 992.023 million (2018: Rupees 409.84 million).
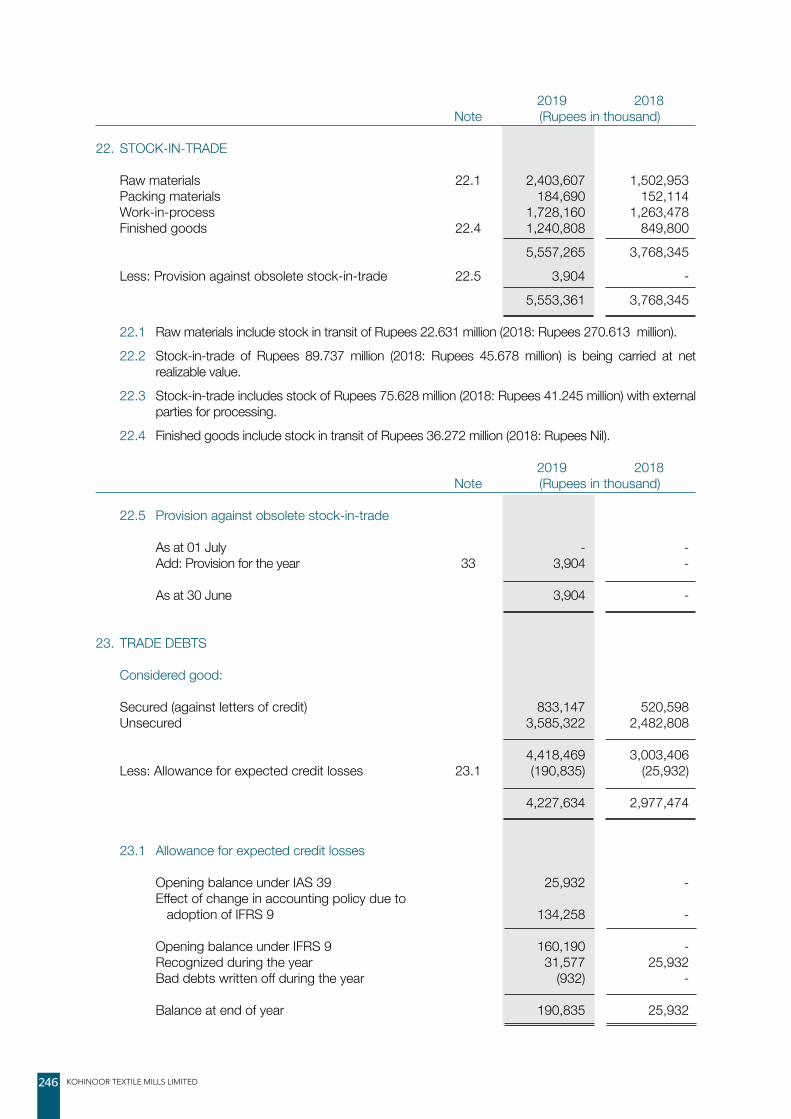
KOHINOOR TEXTILE MILLS LIMITED246
2019 2018 Note (Rupees in thousand)
22. STOCK-IN-TRADE Raw materials 22.1 2,403,607 1,502,953 Packing materials 184,690 152,114 Work-in-process 1,728,160 1,263,478 Finished goods 22.4 1,240,808 849,800 5,557,265 3,768,345 Less: Provision against obsolete stock-in-trade 22.5 3,904 - 5,553,361 3,768,345 22.1 Raw materials include stock in transit of Rupees 22.631 million (2018: Rupees 270.613 million). 22.2 Stock-in-trade of Rupees 89.737 million (2018: Rupees 45.678 million) is being carried at net
realizable value. 22.3 Stock-in-trade includes stock of Rupees 75.628 million (2018: Rupees 41.245 million) with external
parties for processing. 22.4 Finished goods include stock in transit of Rupees 36.272 million (2018: Rupees Nil).
2019 2018 Note (Rupees in thousand) 22.5 Provision against obsolete stock-in-trade As at 01 July - - Add: Provision for the year 33 3,904 - As at 30 June 3,904 -
23. TRADE DEBTS Considered good: Secured (against letters of credit) 833,147 520,598 Unsecured 3,585,322 2,482,808 4,418,469 3,003,406 Less: Allowance for expected credit losses 23.1 (190,835) (25,932) 4,227,634 2,977,474
23.1 Allowance for expected credit losses Opening balance under IAS 39 25,932 - Effect of change in accounting policy due to adoption of IFRS 9 134,258 - Opening balance under IFRS 9 160,190 - Recognized during the year 31,577 25,932 Bad debts written off during the year (932) - Balance at end of year 190,835 25,932

ANNUAL REPORT 2019 247
23.2 As at 30 June 2019, trade debts of Rupees 2,131.329 million (2018: Rupees 2,178.432 million) were past due but not impaired. These relate to a number of independent customers from whom there is no recent history of default. The aging analysis of these trade debts is as follows:
2019 2018 Note (Rupees in thousand) Upto 1 month 1,572,346 1,340,040 1 to 6 months 379,840 635,426 More than 6 months 179,143 202,966 2,131,329 2,178,432
24. LOANS AND ADVANCES - Unsecured, considered good Loans and advances to employees: - Executives 4,360 1,462 - Other employees 31,020 23,289 - Current portion of long term loans to employees 18 9,923 5,348 45,303 30,099 Advances to Government: - Sales tax 2,519 1,271,086 - Excise duty - 269,211 - Collector of customs 24.1 185,462 41,911 - Refunds from Government 24.2 17,399 16,797 205,380 1,599,005 Advances to suppliers 24.3 917,663 1,088,213 Letters of credit 18,926 540,008 Provision against doubtful advances 24.4 - 4,243 1,187,272 3,253,082
24.1 It pertains to advance given for clearance of import shipments. 24.2 This represents amount paid to Government under protest for various cases which have been
decided in favor of MLCFL.
24.3 This includes an amount of Rupees 273.140 million (2018: Rupees 679.13 million) advanced to Ministry of Railways for transportation of coal and cement.
2019 2018 Note (Rupees in thousand)
24.4 Movement in provision against doubtful advances As at 01 July 4,243 - Add: Provision for the year 33 - 4,243 Less: Written off during the year (4,243) - - 4,243

KOHINOOR TEXTILE MILLS LIMITED248
2019 2018 Note (Rupees in thousand)
25. SECURITY DEPOSITS AND SHORT TERM PREPAYMENTS Current portion of long term deposits 20 - 71 Short term deposit Margin against: - Letters of credit 19,555 9,634 - Bank guarantees 135,281 98,014 Prepayments 59,278 26,200
214,114 133,919 26. OTHER RECEIVABLES Considered good: Sales tax refundable 138,747 453,877 Custom duty receivable 15,993 15,993 Mark up rate support receivable from financial institutions 3,633 3,633 Export rebate 68,850 74,863 Insurance claims - 941 Duty draw back receivable 180,520 198,034 Margin deposits with brokers 386,858 158,410 Unrealized gain on re-measurement of future contracts 12,769 - Dividend receivable 4,467 5,149 Accrued interest 4,499 2,454 Others 38,868 59,507 855,204 972,861
27. SHORT TERM INVESTMENTS FINANCIAL INSTRUMENTS Debt instruments Investment - Amortized cost 27.1 255,071 - Equity instruments Investments - Fair value through profit or loss 27.2 3,487,394 3,480,826 NON-FINANCIAL INSTRUMENT Investment in gold 27.3 725,456 400,294 4,467,921 3,881,120
27.1 Debt instruments - amortized cost Holding Company - Term deposit receipts 51,441 Subsidiary Company - MLCL - Term deposit receipts 203,630 255,071 -
27.1.1 This represents term deposit receipt of United Bank Limited having maturity period of one year and carrying profit at effective rate of 10.40% (2018: Nil). It is under lien with the bank against guarantees given on behalf of the Group.
27.1.2 Effective interest on term deposit receipts ranged from 12.00% to 12.50% per annum.

ANNUAL REPORT 2019 249
27.2 Investments-Fair Value through profit or loss 2019 2018 Carrying Unrealized Market Carrying Unrealized Market value gain / (loss) value value gain / (loss) value - - - - - - - - - - - - (Rupees in thousand) - - - - - - - - - - - -Holding CompanyShares in listed companies Pakistan Reinsurance Company LimitedNil (2018: 25,000) fully paid ordinary shares of Rupees 10 each - - - 1,220 (398) 822
Samin Textiles LimitedNil (2018: 30,000) fully paid ordinary shares of Rupees 10 each - - - 206 (80) 126
D. S. Industries LimitedNil (2018: 20,000) fully paid ordinary shares of Rupees 10 each - - - 77 15 92
Pervez Ahmed Securities LimitedNil (2018: 25,000) fully paid ordinary shares of Rupees 10 each - - - 49 (25) 24
Bank AL Habib LimitedNil (2018: 400) fully paid ordinary shares of Rupees 10 each - - - 23 9 32
Kohinoor Energy LimitedNil (2018: 200) fully paid ordinary shares of Rupees 10 each - - - 9 (1) 8
Shifa International Hospitals LimitedNil (2018: 700) fully paid ordinary shares of Rupees 10 each - - - 231 (42) 189
The Hub Power Company LimitedNil (2018: 5) fully paid ordinary shares of Rupees 10 each - - - 1 - 1
Honda Atlas Cars (Pakistan) Limited Nil (2018: 55) fully paid ordinary shares of Rupees 10 each - - - 48 (30) 18
Pak Suzuki Motor Company LimitedNil (2018: 13) fully paid ordinary shares of Rupees 10 each - - - 10 (5) 5
Shell Pakistan LimitedNil (2018: 55) fully paid ordinary shares of Rupees 10 each - - - 32 (14) 18
Biafo Industries LimitedNil (2018: 304) fully paid ordinary shares of Rupees 10 each - - - 76 21 97
Thal LimitedNil (2018: 450) fully paid ordinary shares of Rupees 10 each - - - 273 (58) 215
Abbot Laboratories (Pakistan) LimitedNil (2018: 92) fully paid ordinary shares of Rupees 10 each - - - 86 (23) 63
Blessed Textile LimitedNil (2018: 17,300) fully paid ordinary shares of Rupees 10 each - - - 4,158 1,988 6,146
The Bank of PunjabNil (2018: 4,500) fully paid ordinary shares of Rupees 10 each - - - 56 (2) 54
Engro Foods LimitedNil (2018: 1,500) fully paid ordinary shares of Rupees 10 each - - - 134 (2) 132 - - - 6,689 1,353 8,042 Subsidiary Company - MLCL Mutual funds ABL Cash Fund 37,473,361 (2018: 3,550,685 units) 375,169 5,812 380,981 36,811 814 37,625 Askari Sovereign Cash Fund 1,091,240 (2018: 994,976 units) 109,036 1,006 110,042 100,000 72 100,072 Alfalah GHP Sovereign Fund 1,108 (2018: 1,003 units) 122 (5) 117 106 5 111 Faysal Money Market Fund 1,005,648 (2018: 511,798 units) 101,357 826 102,183 51,948 2,615 54,563 NAFA Money Market Fund 20,294,665 (2018: 127,172,665 units) 159,966 40,184 200,150 1,298,558 24,673 1,323,231 HBL Government Securities Fund 1,130 (2018: 1,010 units) 119 - 119 106 - 106 HBL Cash Fund 530,679 (2018: 11,423,931 units) 53,252 238 53,490 1,177,657 32,862 1,210,519 HBL Money Market Fund 53,256 (2018: 52 units) 5,440 (2) 5,438 5 - 5 Primus Income Fund 1,124 (2018: 996 units) 124 (5) 119 105 6 111 Lakson Money Market Fund Nil (2018: 4,770,700 units) - - - 500,871 2,856 503,727 UBL Liquidity Plus Fund 2,072,441 (2018: 47,530 units) 208,717 (56) 208,661 4,992 56 5,048 UBL Money Market Fund 1,167 (2018: 1,044 units) 123 (5) 118 105 5 110 Cash Management Optimizer Fund 1,057,550 (2018: Nil units) 106,332 - 106,332 - - - First Habib Cash Fund 456 (2018: Nil units) 46 - 46 - - - Alfalah Money Market Fund 3,245,133 (2018: Nil units) 316,237 1,630 317,867 - - - JS Cash Fund 3,102,654 (2018: Nil units) 314,705 617 315,322 - - - 1,750,745 50,240 1,800,985 3,171,264 63,964 3,235,228
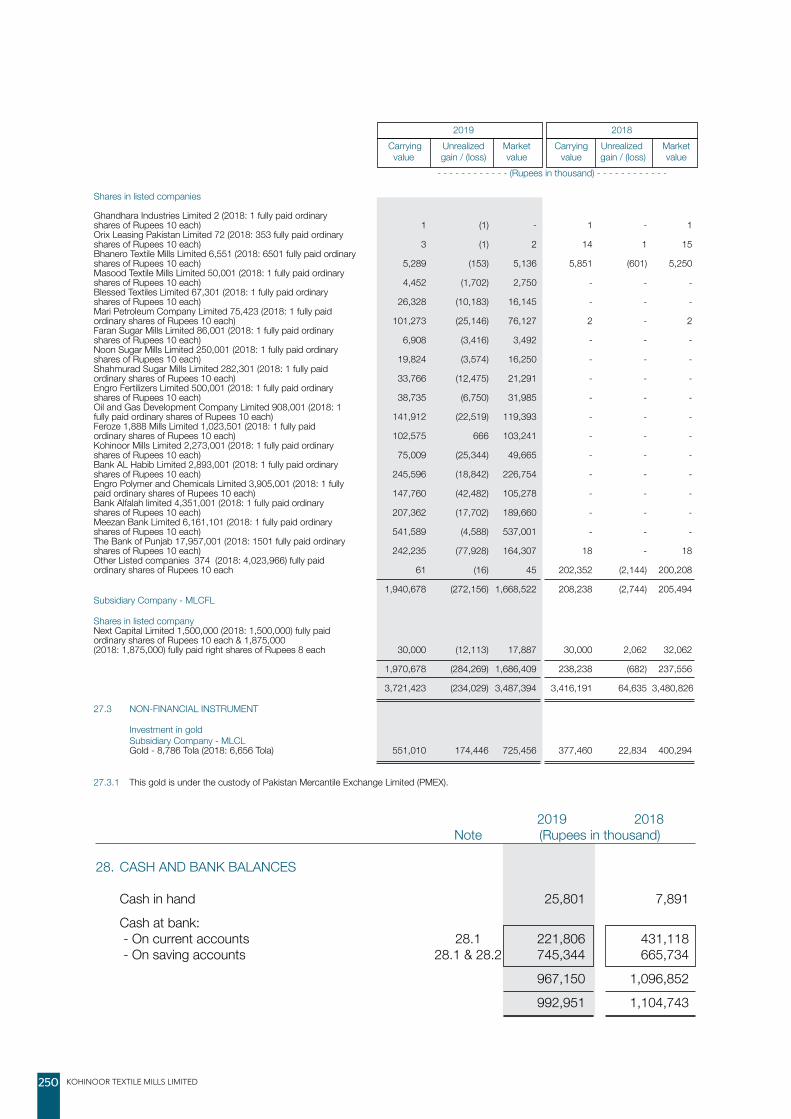
KOHINOOR TEXTILE MILLS LIMITED250
2019 2018 Carrying Unrealized Market Carrying Unrealized Market value gain / (loss) value value gain / (loss) value - - - - - - - - - - - - (Rupees in thousand) - - - - - - - - - - - -
Shares in listed companies Ghandhara Industries Limited 2 (2018: 1 fully paid ordinary shares of Rupees 10 each) 1 (1) - 1 - 1 Orix Leasing Pakistan Limited 72 (2018: 353 fully paid ordinary shares of Rupees 10 each) 3 (1) 2 14 1 15 Bhanero Textile Mills Limited 6,551 (2018: 6501 fully paid ordinary shares of Rupees 10 each) 5,289 (153) 5,136 5,851 (601) 5,250 Masood Textile Mills Limited 50,001 (2018: 1 fully paid ordinary shares of Rupees 10 each) 4,452 (1,702) 2,750 - - - Blessed Textiles Limited 67,301 (2018: 1 fully paid ordinary shares of Rupees 10 each) 26,328 (10,183) 16,145 - - - Mari Petroleum Company Limited 75,423 (2018: 1 fully paid ordinary shares of Rupees 10 each) 101,273 (25,146) 76,127 2 - 2 Faran Sugar Mills Limited 86,001 (2018: 1 fully paid ordinary shares of Rupees 10 each) 6,908 (3,416) 3,492 - - - Noon Sugar Mills Limited 250,001 (2018: 1 fully paid ordinary shares of Rupees 10 each) 19,824 (3,574) 16,250 - - - Shahmurad Sugar Mills Limited 282,301 (2018: 1 fully paid ordinary shares of Rupees 10 each) 33,766 (12,475) 21,291 - - - Engro Fertilizers Limited 500,001 (2018: 1 fully paid ordinary shares of Rupees 10 each) 38,735 (6,750) 31,985 - - - Oil and Gas Development Company Limited 908,001 (2018: 1 fully paid ordinary shares of Rupees 10 each) 141,912 (22,519) 119,393 - - - Feroze 1,888 Mills Limited 1,023,501 (2018: 1 fully paid ordinary shares of Rupees 10 each) 102,575 666 103,241 - - - Kohinoor Mills Limited 2,273,001 (2018: 1 fully paid ordinary shares of Rupees 10 each) 75,009 (25,344) 49,665 - - - Bank AL Habib Limited 2,893,001 (2018: 1 fully paid ordinary shares of Rupees 10 each) 245,596 (18,842) 226,754 - - - Engro Polymer and Chemicals Limited 3,905,001 (2018: 1 fully paid ordinary shares of Rupees 10 each) 147,760 (42,482) 105,278 - - - Bank Alfalah limited 4,351,001 (2018: 1 fully paid ordinary shares of Rupees 10 each) 207,362 (17,702) 189,660 - - - Meezan Bank Limited 6,161,101 (2018: 1 fully paid ordinary shares of Rupees 10 each) 541,589 (4,588) 537,001 - - - The Bank of Punjab 17,957,001 (2018: 1501 fully paid ordinary shares of Rupees 10 each) 242,235 (77,928) 164,307 18 - 18 Other Listed companies 374 (2018: 4,023,966) fully paid ordinary shares of Rupees 10 each 61 (16) 45 202,352 (2,144) 200,208 1,940,678 (272,156) 1,668,522 208,238 (2,744) 205,494 Subsidiary Company - MLCFL Shares in listed company Next Capital Limited 1,500,000 (2018: 1,500,000) fully paid ordinary shares of Rupees 10 each & 1,875,000 (2018: 1,875,000) fully paid right shares of Rupees 8 each 30,000 (12,113) 17,887 30,000 2,062 32,062
1,970,678 (284,269) 1,686,409 238,238 (682) 237,556 3,721,423 (234,029) 3,487,394 3,416,191 64,635 3,480,826
27.3 NON-FINANCIAL INSTRUMENT Investment in gold Subsidiary Company - MLCL Gold - 8,786 Tola (2018: 6,656 Tola) 551,010 174,446 725,456 377,460 22,834 400,294
27.3.1 This gold is under the custody of Pakistan Mercantile Exchange Limited (PMEX).
2019 2018 Note (Rupees in thousand)
28. CASH AND BANK BALANCES Cash in hand 25,801 7,891 Cash at bank: - On current accounts 28.1 221,806 431,118 - On saving accounts 28.1 & 28.2 745,344 665,734 967,150 1,096,852 992,951 1,104,743

ANNUAL REPORT 2019 251
28.1 The balances in current and deposit accounts include US $ 34,388,000 (2018: US $ 87,087) and GBP 1,825,000 (2018: GBP 2,000).
28.2 The balances in saving accounts carry interest ranging from 0.16% to 10.25% (2018: 0.16% to 6.50%) per annum.
2019 2018 Note (Rupees in thousand)
29. REVENUE Export sales 9,162,940 8,023,857 Local sales 29.1 37,816,984 35,229,804 Export rebate 46,550 40,074 Duty draw back 91,711 173,608 47,118,185 43,467,343
29.1 Local sales 48,875,313 45,896,297 Less: Sales tax 5,706,262 5,757,487 Federal excise duty 4,874,102 4,433,636 Commission 335,899 141,565 Discount 142,066 333,805 37,816,984 35,229,804
30. COST OF SALES Raw materials consumed 30.1 12,686,130 10,496,415 Salaries, wages and other benefits 30.2 2,710,629 2,489,812 Processing charges 37,113 26,232 Stores, spare parts and loose tools consumed 2,139,800 2,455,761 Packing materials consumed 2,508,559 2,029,024 Freight Forwarders 872,747 - Fuel and power 13,198,010 11,114,047 Repair and maintenance 545,183 565,362 Insurance 194,940 85,574 Other factory overheads 30.3 369,763 370,988 Amortization 4,239 2,006 Depreciation 15.1.3 2,784,379 2,449,963 38,051,492 32,085,184 Work-in-process Opening stock 1,263,478 1,395,315 Closing stock (1,728,160) (1,263,478) (464,682) 131,837 Cost of goods manufactured 37,586,810 32,217,021 Finished goods Opening stock 849,800 800,247 Closing stock (1,240,808) (849,800) (391,008) (49,553) Cost of sales 37,195,802 32,167,468

KOHINOOR TEXTILE MILLS LIMITED252
2019 2018 (Rupees in thousand) 30.1 Raw materials consumed Opening stock 1,502,953 945,845 Add: Purchased during the year 13,586,784 11,053,523 15,089,737 11,999,368 Less: Closing stock (2,403,607) (1,502,953) 12,686,130 10,496,415 30.2 Salaries, wages and other benefits include provident fund contribution of Rupees 97.940 million
(2018: Rupees 86.745 million), gratuity and compensated absences amounting to Rupees 23.05 million (2018: Rupees 35.22 million).
30.3 Other factory overheads include housing colony expenses aggregating to Rupees 76.41 million (2018: Rupees 71.32 million).
2019 2018 Note (Rupees in thousand)
31. DISTRIBUTION COST Salaries and other benefits 31.1 244,425 224,216 Outward freight and handling 27,207 25,959 Clearing and forwarding 292,723 749,179 Commission to selling agents 28,442 101,888 Travelling and conveyance 211,390 101,705 Insurance 13,767 191 Vehicles’ running 22,761 20,422 Electricity, gas and water 2,836 2,639 Postage, telephone and fax 9,140 9,899 Sales promotion and advertisement 536,476 391,837 Depreciation 15.1.3 4,298 4,041 Miscellaneous 100,960 93,305 1,494,425 1,725,281 31.1 Salaries and other benefits include provident fund contribution of Rupees 9.402 million
(2018: Rupees 8.273 million), gratuity and compensated absences amounting to Rupees 0.45 million (2018: Rupees 4.21 million).
2019 2018 Note (Rupees in thousand)
32. ADMINISTRATIVE EXPENSES Salaries and other benefits 32.1 673,837 595,603 Travelling and conveyance 111,235 100,837 Repair and maintenance 48,748 40,734 Rent, rates and taxes 14,197 11,487 Insurance 10,258 14,193 Vehicles’ running 43,941 36,476 Printing, stationery and periodicals 40,965 50,794 Electricity, gas and water 6,797 5,227 Postage, telephone and fax 30,026 25,239 Legal and professional 138,325 82,832 Security, gardening and sanitation 38,396 35,216 Amortization 4,261 6,389 Depreciation 15.1.3 93,012 109,402 Miscellaneous 143,139 221,514 1,397,137 1,335,943
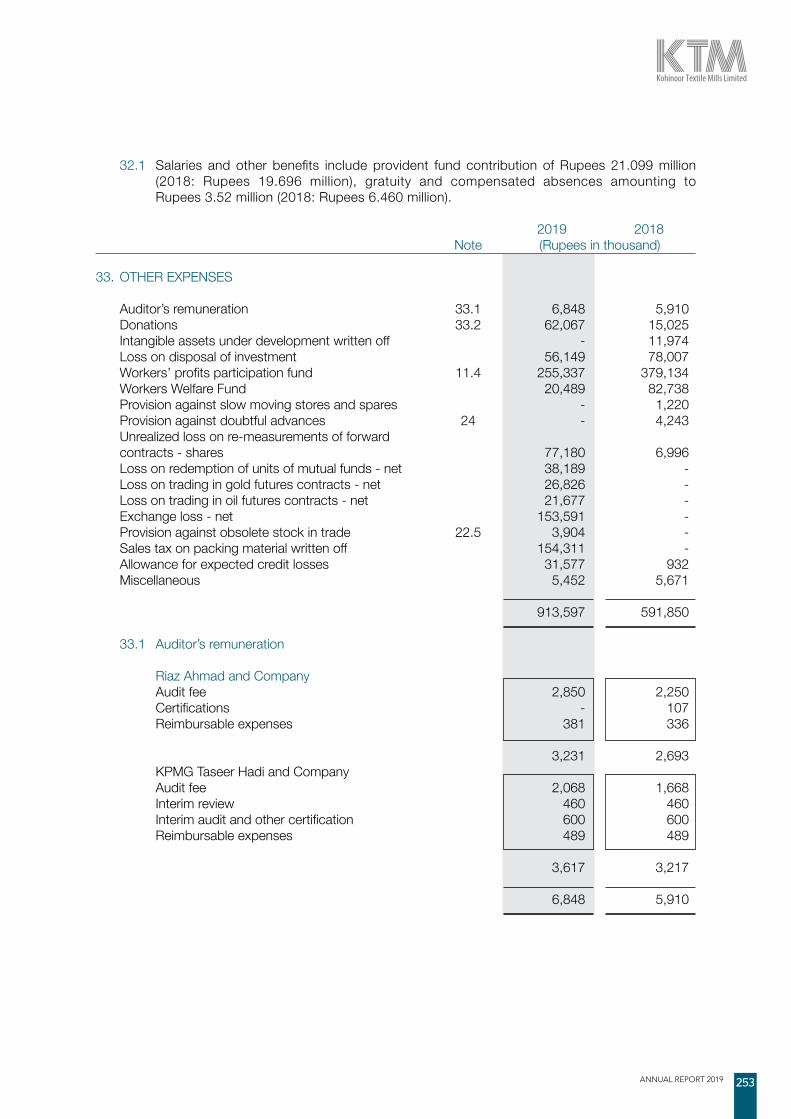
ANNUAL REPORT 2019 253
32.1 Salaries and other benefits include provident fund contribution of Rupees 21.099 million (2018: Rupees 19.696 million), gratuity and compensated absences amounting to Rupees 3.52 million (2018: Rupees 6.460 million).
2019 2018 Note (Rupees in thousand)
33. OTHER EXPENSES Auditor’s remuneration 33.1 6,848 5,910 Donations 33.2 62,067 15,025 Intangible assets under development written off - 11,974 Loss on disposal of investment 56,149 78,007 Workers’ profits participation fund 11.4 255,337 379,134 Workers Welfare Fund 20,489 82,738 Provision against slow moving stores and spares - 1,220 Provision against doubtful advances 24 - 4,243 Unrealized loss on re-measurements of forward contracts - shares 77,180 6,996 Loss on redemption of units of mutual funds - net 38,189 - Loss on trading in gold futures contracts - net 26,826 - Loss on trading in oil futures contracts - net 21,677 - Exchange loss - net 153,591 - Provision against obsolete stock in trade 22.5 3,904 - Sales tax on packing material written off 154,311 - Allowance for expected credit losses 31,577 932 Miscellaneous 5,452 5,671 913,597 591,850 33.1 Auditor’s remuneration
Riaz Ahmad and Company Audit fee 2,850 2,250 Certifications - 107 Reimbursable expenses 381 336 3,231 2,693 KPMG Taseer Hadi and Company Audit fee 2,068 1,668 Interim review 460 460 Interim audit and other certification 600 600 Reimbursable expenses 489 489 3,617 3,217 6,848 5,910

KOHINOOR TEXTILE MILLS LIMITED254
2019 2018 Note (Rupees in thousand)
33.2 Donations for the year have been given to: Gulab Devi Chest Hospital, Lahore 33,868 216 Miscellaneous donations in the form of cement - 1,010 Bushra Shaheen 325 300 Jamia Masjid, Iskanderabad - 2,135 Founder Group - 30 Police Welfare Middle School - 2,500 Daud Khel Health Care Centre - 6,518 Jahanara Memorial Trust - 1,000 Icare Foundation - 500 Police station, Daud khel - 216 Labor office, Mianwali - 38 Beacon House National University 644 562 Shaukat Khanum Memorial Trust 300 - District Police Office Mianwali 6,028 - Daud Khel water supply project 17,215 - District Management Mianwali 1,687 - Mosque Lower Dir 1,000 - Mr. Liaqat Qadri 1,000 - 62,067 15,025 33.2.1 None of the directors and their spouses have any interest in the donee’s fund.
2019 2018 Note (Rupees in thousand)
34. OTHER INCOME Income from financial assets: Exchange gain - net - 112,755 Gain on disposal of investments at fair value through profit or loss - net - 252,499 Gain on re-measurement of fair value of investments at fair value through profit or loss - 49,893 Amortization of held-to-maturity investment - 29,858 Return on bank deposits 43,611 52,685 Gain on trading in physical gold - net 803 - Gain on re-measurement of investments - through profit or loss 13,358 - Gain on trading in shares futures contracts - net 306,041 - Interest income on sales tax refund bonds 10,697 - Return on term deposit receipts 3,349 - Interest on loans to employees 381 - Dividend income 275,824 12,156 654,064 509,846 Income from non-financial assets: Scrap sales 52,141 70,520 Long outstanding liabilities written back 493 - Gain on disposal of property, plant and equipment 15.2 10,843 1,583 Gain on re-measurement of investment property 16 - 3,085 Unrealized gain on re-measurement of future contracts - gold - 10,145 Unrealized gain on re-measurement of gold at fair value less cost to sell - 22,834 Miscellaneous 10,866 3,721 74,343 111,888 728,407 621,734

ANNUAL REPORT 2019 255
2019 2018 Note (Rupees in thousand)
35. FINANCE COST Mark-up / finance charges / interest on: Long term financing 652,132 297,412 Short term borrowings 869,486 520,328 Unwinding interest - Retention money payable 22,968 - Liabilities against assets subject to finance lease - 3,071 Workers’ profits participation fund 11.4 9,896 27,132
1,554,482 847,943 Exchange loss - net - 257,372 Bank charges and commission 74,394 62,076 74,394 319,448 1,628,876 1,167,391 36. TAXATION Current Current year 523,602 1,730,539 Prior year 13,516 (36,050) 537,118 1,694,489 Deferred tax 10 303,312 (309,854) 840,430 1,384,635
36.1 Reconciliation of tax charge for the year Profit before tax 5,216,755 7,101,144 Tax on profit @ 29% (2018: 30%) 1,512,859 2,130,343 Tax effect of lower rate on certain income / expenses (453,102) (867,741) Tax effect of exempt income / permanent differences (288,542) (95,156) Tax effect of super tax 34,076 184,854 Tax effect on prior year adjustment 2,964 (36,050) Others 32,175 68,385 840,430 1,384,635
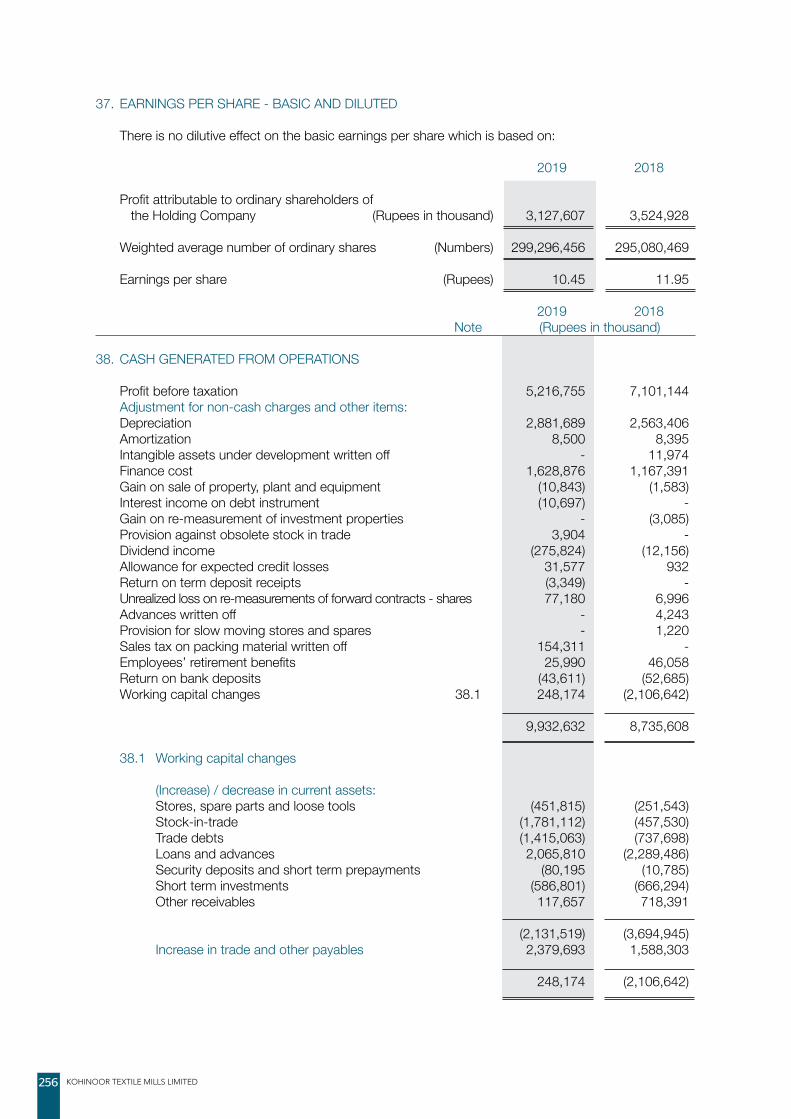
KOHINOOR TEXTILE MILLS LIMITED256
37. EARNINGS PER SHARE - BASIC AND DILUTED
There is no dilutive effect on the basic earnings per share which is based on:
2019 2018 Profit attributable to ordinary shareholders of the Holding Company (Rupees in thousand) 3,127,607 3,524,928 Weighted average number of ordinary shares (Numbers) 299,296,456 295,080,469 Earnings per share (Rupees) 10.45 11.95
2019 2018 Note (Rupees in thousand)
38. CASH GENERATED FROM OPERATIONS Profit before taxation 5,216,755 7,101,144 Adjustment for non-cash charges and other items: Depreciation 2,881,689 2,563,406 Amortization 8,500 8,395 Intangible assets under development written off - 11,974 Finance cost 1,628,876 1,167,391 Gain on sale of property, plant and equipment (10,843) (1,583) Interest income on debt instrument (10,697) - Gain on re-measurement of investment properties - (3,085) Provision against obsolete stock in trade 3,904 - Dividend income (275,824) (12,156) Allowance for expected credit losses 31,577 932 Return on term deposit receipts (3,349) - Unrealized loss on re-measurements of forward contracts - shares 77,180 6,996 Advances written off - 4,243 Provision for slow moving stores and spares - 1,220 Sales tax on packing material written off 154,311 - Employees’ retirement benefits 25,990 46,058 Return on bank deposits (43,611) (52,685) Working capital changes 38.1 248,174 (2,106,642) 9,932,632 8,735,608
38.1 Working capital changes (Increase) / decrease in current assets: Stores, spare parts and loose tools (451,815) (251,543) Stock-in-trade (1,781,112) (457,530) Trade debts (1,415,063) (737,698) Loans and advances 2,065,810 (2,289,486) Security deposits and short term prepayments (80,195 (10,785) Short term investments (586,801) (666,294) Other receivables 117,657 718,391 (2,131,519) (3,694,945) Increase in trade and other payables 2,379,693 1,588,303 248,174 (2,106,642)

ANNUAL REPORT 2019 257
38.2 Reconciliation of movement of liabilities to cash flows arising from financing activities
Liabilities from financing activities Issued, Share Long term Liabilities Short term Unclaimed subscribed premium financing against borrowings dividend Total
and paid- assets up capital subject to finance lease -------------------------------- (Rupees in thousand) --------------------------------
Balance as at 01 July 2018 2,992,964 986,077 15,476,096 - 9,988,756 131,500 29,575,393 Proceeds from long term financing - - 4,149,549 - - - 4,149,549 Repayment of long term financing - - (373,565) - - - (373,565) Short term borrowings - net - - - - (2,154,197) - (2,154,197) Dividend declared - - - - - 864,457 864,457 Dividend paid - - - - - (931,809) (931,809) Balance as at 30 June 2019 2,992,964 986,077 19,252,080 - 7,834,559 64,148 31,129,828
39. REMUNERATION OF CHIEF EXECUTIVE OFFICERS, DIRECTORS AND EXECUTIVES
The aggregate amounts charged in these consolidated financial statements in respect of remuneration including certain benefits to the Chief Executive Officers, Directors and Executives of the Group are given below:
Chairman Chief Executive Officer Directors Executives
2019 2018 2019 2018 2019 2018 2019 2018 --------------------------( Rupees in Thousand )------------------------
Managerial remuneration 28,275 26,273 65,700 47,704 47,255 44,317 228,665 187,805 Allowances - - - - - - 13 - House rent 6,435 4,641 13,860 5,816 6,990 4,889 65,056 46,105 Conveyance - - 2,049 2,303 1,924 1,500 17,164 10,999 Medical - - 1,980 794 566 409 11,118 9,804 Utilities - 1,456 10,390 4,400 5,575 3,758 33,778 28,104 Special allowance - - 12,240 8,106 3,150 2,890 23,471 20,272 Bonus - - - Contribution to provident fund 2,145 2,109 3,629 3,372 3,754 3,521 18,749 15,872 36,855 34,479 109,848 72,495 69,214 61,284 398,014 318,961 Number of persons 1 1 3 3 6 6 106 89
The Chief Executive Officers, Directors and some of the Executives are provided with the Group’s maintained vehicles, free medical facilities and residential telephone facilities for both business and personal use.
Executives are provided with the vehicles in accordance with the Group’s policy. The aggregate amount charged in these consolidated financial statements in respect of directors’
meeting fee paid to 4 (2018: 4) non-executive directors was Rupees 386,666 (2018: Rupees 496,666). No remuneration was paid to non-executive directors of the Group.
2019 2018 (Rupees in thousand)
40. TRANSACTIONS WITH RELATED PARTIES
Post employment benefit plan Contribution to provident fund 228,281 187,441 Contribution to gratuity fund 27,545 30,513
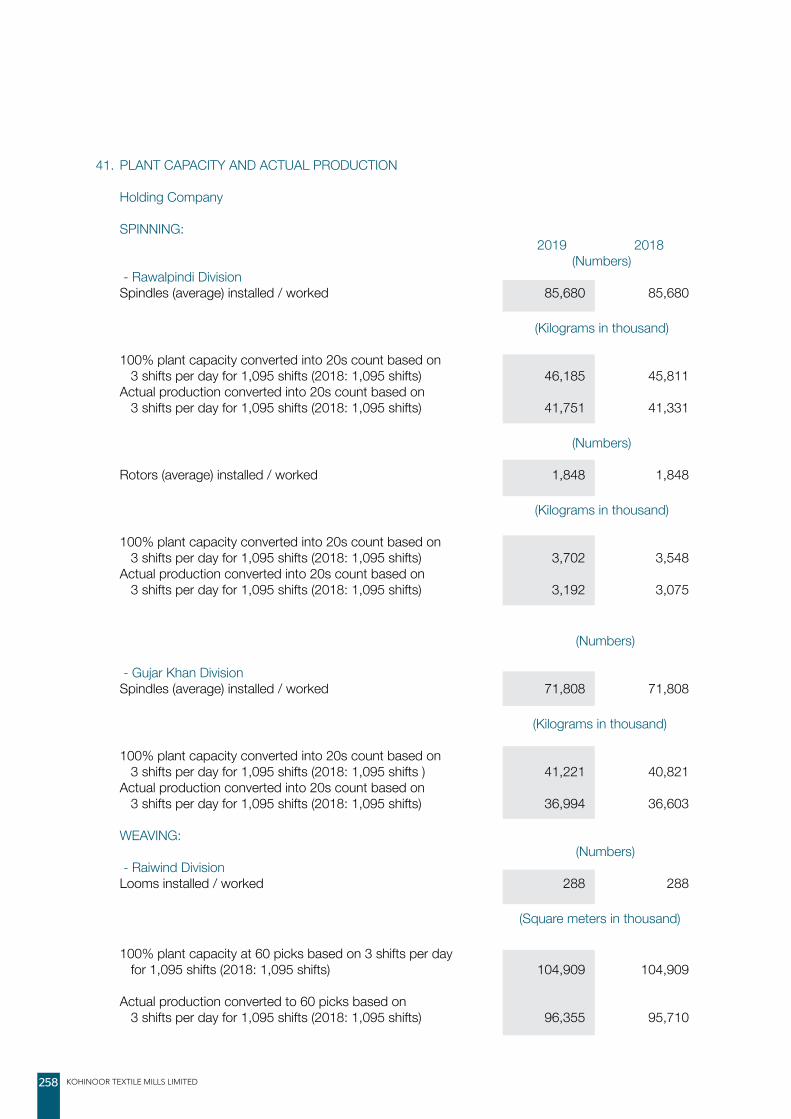
KOHINOOR TEXTILE MILLS LIMITED258
41. PLANT CAPACITY AND ACTUAL PRODUCTION Holding Company
SPINNING: 2019 2018 (Numbers) - Rawalpindi Division Spindles (average) installed / worked 85,680 85,680 (Kilograms in thousand) 100% plant capacity converted into 20s count based on 3 shifts per day for 1,095 shifts (2018: 1,095 shifts) 46,185 45,811 Actual production converted into 20s count based on 3 shifts per day for 1,095 shifts (2018: 1,095 shifts) 41,751 41,331 (Numbers) Rotors (average) installed / worked 1,848 1,848 (Kilograms in thousand) 100% plant capacity converted into 20s count based on 3 shifts per day for 1,095 shifts (2018: 1,095 shifts) 3,702 3,548 Actual production converted into 20s count based on 3 shifts per day for 1,095 shifts (2018: 1,095 shifts) 3,192 3,075 (Numbers) - Gujar Khan Division Spindles (average) installed / worked 71,808 71,808 (Kilograms in thousand) 100% plant capacity converted into 20s count based on 3 shifts per day for 1,095 shifts (2018: 1,095 shifts ) 41,221 40,821 Actual production converted into 20s count based on 3 shifts per day for 1,095 shifts (2018: 1,095 shifts) 36,994 36,603 WEAVING: (Numbers) - Raiwind Division Looms installed / worked 288 288 (Square meters in thousand) 100% plant capacity at 60 picks based on 3 shifts per day for 1,095 shifts (2018: 1,095 shifts) 104,909 104,909
Actual production converted to 60 picks based on 3 shifts per day for 1,095 shifts (2018: 1,095 shifts) 96,355 95,710

ANNUAL REPORT 2019 259
2019 2018 PROCESSING OF CLOTH : - Rawalpindi Division (Meters in thousand) Capacity at 3 shifts per day for 1,095 shifts (2018: 1,095 shifts) 42,090 42,090 Actual production at 3 shifts per day for 1,095 shifts (2018: 1,095 shifts) 14,757 14,613 POWER PLANT: - Rawalpindi Division (Mega watts) Annual rated capacity based on 365 days (2018: 365 days) 224,186 163,987 Actual generation Main engines 29,556 30,595 Gas engines 18,190 27,763 Solar 1,937 - - Raiwind Division Annual rated capacity based on 365 days (2018: 365 days) 96,360 96,360 Actual generation 42,122 38,098 Stitching The plant capacity of this division is indeterminable due to multi-product plant involving varying
processes of manufacturing and run length of order lots. REASONS FOR LOW PRODUCTION - Due to stoppage for normal maintenance, doffing, change of spin plans and cloth quality.
- Cloth processing units working capacity was limited to actual export / local orders in hand.
- The generation of power was limited to actual demand.
Subsidiary Company - MLCFL CEMENT: (Metric tons in thousand) Clinker: Annual rated capacity (Based on 300 days) 3,600 3,360 Annual production for the year 3,542 3,530
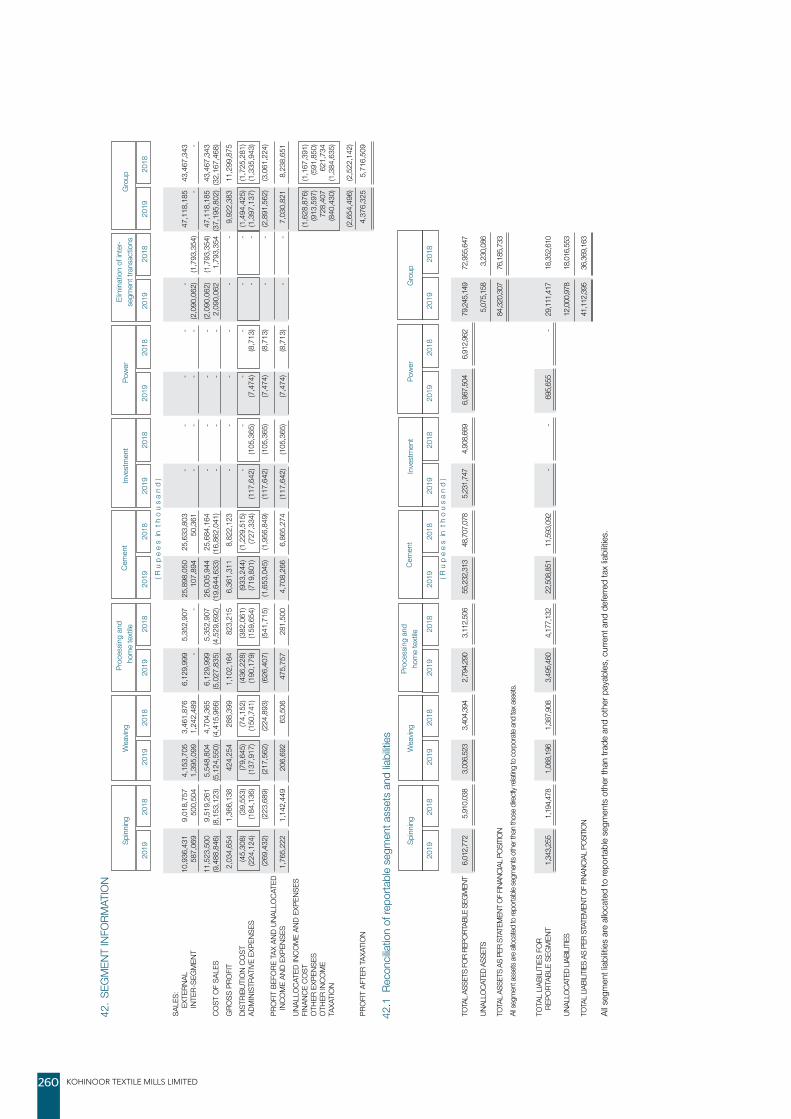
KOHINOOR TEXTILE MILLS LIMITED260
Sp
inni
ng
W
eavin
g
Pro
cess
ing
and
E
limin
atio
n of
inte
r-
Gro
up
h
ome
text
ile
Ce
men
t
Inve
stm
ent
Pow
er
segm
ent t
rans
actio
ns
20
19
2018
20
19
2018
20
19
2018
20
19
2018
20
19
2018
20
19
2018
20
19
2018
20
19
2018
( R u
p e
e s
in
t h
o u
s a
n d
)
SALE
S:
EXT
ERNA
L 1
0,93
6,43
1
9,0
18,7
57
4,1
53,7
05
3,4
61,8
76
6,1
29,9
99
5,3
52,9
07
25,
898,
050
2
5,63
3,80
3
-
-
-
-
-
4
7,11
8,18
5
43,4
67,3
43
IN
TER-
SEG
MEN
T 5
87,0
69
500
,504
1
,395
,099
1
,242
,489
-
-
1
07,8
94
50,
361
-
-
-
-
(2
,090
,062
) (1
,793
,354
) -
-
1
1,52
3,50
0
9,5
19,2
61
5,5
48,8
04
4,7
04,3
65
6,1
29,9
99
5,3
52,9
07
26,
005,
944
2
5,68
4,16
4
-
-
-
-
(2,0
90,0
62)
(1,7
93,3
54)
47,
118,
185
43
,467
,343
CO
ST O
F SA
LES
(9,4
88,8
46)
(8,1
53,1
23)
(5,1
24,5
50)
(4,4
15,9
66)
(5,0
27,8
35)
(4,5
29,6
92)
(19,
644,
633)
(1
6,86
2,04
1)
-
-
-
-
2,0
90,0
62
1,7
93,3
54 (
37,1
95,8
02)
(32,
167,
468)
GRO
SS P
ROFI
T 2
,034
,654
1
,366
,138
4
24,2
54
288
,399
1
,102
,164
8
23,2
15
6,3
61,3
11
8,8
22,1
23
-
-
-
-
-
-
9,9
22,3
83
11,
299,
875
DIST
RIBU
TIO
N CO
ST
(45,
308)
(3
9,55
3)
(79,
645)
(7
4,15
2)
(436
,228
) (3
82,0
61)
(933
,244
) (1
,229
,515
) -
-
-
-
-
-
(1
,494
,425
) (1
,725
,281
)AD
MIN
ISTR
ATIV
E EX
PENS
ES
(224
,124
) (1
84,1
36)
(137
,917
) (1
50,7
41)
(190
,179
) (1
59,6
54)
(719
,801
) (7
27,3
34)
(117
,642
) (1
05,3
65)
(7,4
74)
(8,7
13)
-
-
(1,3
97,1
37)
(1,3
35,9
43)
(2
69,4
32)
(223
,689
) (2
17,5
62)
(224
,893
) (6
26,4
07)
(541
,715
) (1
,653
,045
) (1
,956
,849
) (1
17,6
42)
(105
,365
) (7
,474
) (8
,713
) -
-
(2
,891
,562
) (3
,061
,224
)PR
OFI
T BE
FORE
TAX
AND
UNA
LLO
CATE
D
INCO
ME
AND
EXPE
NSES
1
,765
,222
1
,142
,449
2
06,6
92
63,
506
4
75,7
57
281
,500
4
,708
,266
6
,865
,274
(1
17,6
42)
(105
,365
) (7
,474
) (8
,713
) -
-
7
,030
,821
8
,238
,651
UNAL
LOCA
TED
INCO
ME
AND
EXPE
NSES
FINA
NCE
COST
(1
,628
,876
) (1
,167
,391
)O
THER
EXP
ENSE
S
(9
13,5
97)
(591
,850
)O
THER
INCO
ME
728
,407
6
21,7
34
TAXA
TIO
N
(8
40,4
30)
(1,3
84,6
35)
(2
,654
,496
) (2
,522
,142
)
PRO
FIT
AFTE
R TA
XATI
ON
4,3
76,3
25
5,7
16,5
09
Sp
inni
ng
W
eavin
g
Proc
essin
g an
d
G
roup
ho
me
text
ile
Ce
men
t
In
vest
men
t
Pow
er
20
19
2018
20
19
2018
20
19
2018
20
19
2018
20
19
2018
20
19
2018
20
19
2018
( R u
p e
e s
in
t h
o u
s a
n d
)
TOTA
L AS
SETS
FOR
REP
ORTA
BLE
SEGM
ENT
6,0
12,7
72
5,9
10,0
38
3,0
06,5
23
3,4
04,3
94
2,7
94,2
90
3,1
12,5
06
55,
232,
313
4
8,70
7,07
8
5,2
31,7
47
4,9
08,6
69
6,9
67,5
04
6,9
12,9
62
79,
245,
149
7
2,95
5,64
7
UN
ALLO
CATE
D AS
SETS
5
,075
,158
3
,230
,086
TO
TAL
ASSE
TS A
S PE
R ST
ATEM
ENT
OF F
INAN
CIAL
POS
ITION
84,
320,
307
7
6,18
5,73
3 Al
l seg
men
t ass
ets a
re al
locat
ed to
repo
rtable
segm
ents
othe
r tha
n th
ose d
irect
ly re
lating
to co
rpor
ate a
nd ta
x ass
ets.
TOTA
L LI
ABIL
ITIE
S FO
R
REPO
RTAB
LE S
EGM
ENT
1,3
43,2
55
1,1
94,4
78
1,0
68,1
96
1,3
87,9
08
3,4
95,4
60
4,1
77,1
32
22,
508,
851
1
1,59
3,09
2
-
-
695
,655
-
2
9,11
1,41
7
18,
352,
610
UNAL
LOCA
TED
LIABI
LITIE
S
1
2,00
0,97
8
18,
016,
553
TOTA
L LIA
BILIT
IES
AS P
ER S
TATE
MEN
T OF
FIN
ANCI
AL P
OSITI
ON
4
1,11
2,39
5
36,
369,
163
All s
egm
ent l
iabilit
ies a
re a
lloca
ted
to re
porta
ble
segm
ents
oth
er th
an tr
ade
and
othe
r pay
ables
, cur
rent
and
def
erre
d ta
x lia
biliti
es.
42. S
EGM
ENT
INFO
RMAT
ION
42.1
Rec
oncil
iatio
n of
repo
rtabl
e se
gmen
t ass
ets
and
liabi
lities
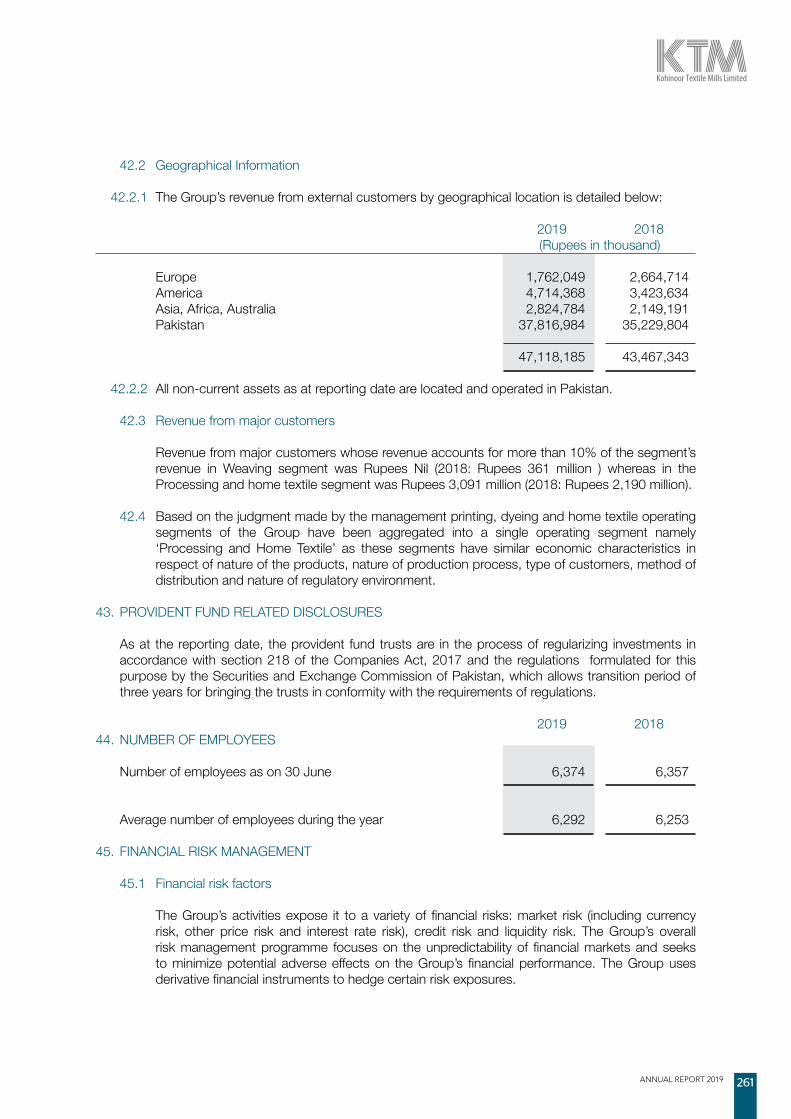
ANNUAL REPORT 2019 261
42.2 Geographical Information 42.2.1 The Group’s revenue from external customers by geographical location is detailed below:
2019 2018 (Rupees in thousand) Europe 1,762,049 2,664,714 America 4,714,368 3,423,634 Asia, Africa, Australia 2,824,784 2,149,191 Pakistan 37,816,984 35,229,804 47,118,185 43,467,343 42.2.2 All non-current assets as at reporting date are located and operated in Pakistan.
42.3 Revenue from major customers Revenue from major customers whose revenue accounts for more than 10% of the segment’s
revenue in Weaving segment was Rupees Nil (2018: Rupees 361 million ) whereas in the Processing and home textile segment was Rupees 3,091 million (2018: Rupees 2,190 million).
42.4 Based on the judgment made by the management printing, dyeing and home textile operating segments of the Group have been aggregated into a single operating segment namely ‘Processing and Home Textile’ as these segments have similar economic characteristics in respect of nature of the products, nature of production process, type of customers, method of distribution and nature of regulatory environment.
43. PROVIDENT FUND RELATED DISCLOSURES As at the reporting date, the provident fund trusts are in the process of regularizing investments in
accordance with section 218 of the Companies Act, 2017 and the regulations formulated for this purpose by the Securities and Exchange Commission of Pakistan, which allows transition period of three years for bringing the trusts in conformity with the requirements of regulations.
2019 201844. NUMBER OF EMPLOYEES Number of employees as on 30 June 6,374 6,357 Average number of employees during the year 6,292 6,253 45. FINANCIAL RISK MANAGEMENT 45.1 Financial risk factors The Group’s activities expose it to a variety of financial risks: market risk (including currency
risk, other price risk and interest rate risk), credit risk and liquidity risk. The Group’s overall risk management programme focuses on the unpredictability of financial markets and seeks to minimize potential adverse effects on the Group’s financial performance. The Group uses derivative financial instruments to hedge certain risk exposures.

KOHINOOR TEXTILE MILLS LIMITED262
Risk management is carried out by the Group’s finance department under policies approved by the Board of Directors. The Group’s finance department evaluates and hedges financial risks. The Board provides principles for overall risk management, as well as policies covering specific areas such as currency risk, other price risk, interest rate risk, credit risk, liquidity risk, use of derivative financial instruments and non derivative financial instruments and investment of excess liquidity.
(a) Market risk (i) Currency risk Currency risk is the risk that the fair value or future cash flows of a financial instrument will fluctuate
because of changes in foreign exchange rates. Currency risk arises mainly from future commercial transactions or receivables and payables that exist due to transactions in foreign currencies.
The Group is exposed to currency risk arising from various currency exposures, primarily with
respect to the United States Dollar (USD), Euro, CHF and Yen. Currently, the Group’s foreign exchange risk exposure is restricted to bank balances and the amounts receivable / payable from / to the foreign entities. The Group’s exposure to currency risk was as follows:
2019 2018 (Amounts in thousand)
Cash at banks - USD 93 87 Cash at banks - GBP 2 2 Trade debts - USD 6,285 4,587 Trade and other payables - USD 4,077 6,600 Trade and other payables - Euro 12 - Outstanding letters of credit - USD 244 9,964 Outstanding letters of credit - Euro 1,678 18,991 Outstanding letters of credit - CHF - 18 Outstanding letters of credit - Yen - - Net exposure - USD 2,057 (11,890) Net exposure - Euro (1,690) (18,991) Net exposure - CHF - (18) Net exposure - GBP 2 2
The following significant exchange rates were applied during the year: 2019 2018 Rupees per US Dollar Average rate 135.96 110.01 Reporting date rate 164.00 121.60 Rupees per Euro Average rate 157.07 132.06 Reporting date rate 186.37 141.57 Rupees per Yen Average rate 1.24 1.01 Reporting date rate 1.52 1.10 Rupees per CHF Average rate 138.74 113.88 Reporting date rate 168.03 122.32
Rupees per GBP Average rate 177.85 149.12 Reporting date rate 207.79 159.14

ANNUAL REPORT 2019 263
Sensitivity analysis If the functional currency, at reporting date, had weakened / strengthened by 5% against the
USD, EURO, YEN and GBP with all other variables held constant, the impact on profit after taxation for the year would have been Rupees 47.003 million, Rupees 14.961 million, Rupees Nil, and Rupees 0.018 million (2018: Rupees 11.405 million, Rupees Nil, Rupees Nil and Rupees 0.01 million) respectively higher / lower, mainly as a result of exchange gains / losses on translation of foreign exchange denominated financial instruments. Currency risk sensitivity to foreign exchange movements has been calculated on a symmetric basis. In management’s opinion, the sensitivity analysis is unrepresentative of inherent currency risk as the year end exposure does not reflect the exposure during the year.
(ii) Other price risk Other price risk represents the risk that the fair value or future cash flows of a financial instrument
will fluctuate because of changes in market prices (other than those arising from interest rate risk or currency risk), whether those changes are caused by factors specific to the individual financial instrument or its issuer, or factors affecting all similar financial instruments traded in the market. The Group is also exposed to commodity price risk as it hold financial instruments based commodity prices.
Sensitivity analysis The table below summarizes the impact of increase / decrease in the Pakistan Stock Exchange
Limited (PSX) Index and Pakistan Mercantile Exchange Limited (PMEX) Index on the Group’s profit after taxation for the year and on equity (fair value reserve). The analysis is based on the assumption that the indices had increased / decreased by 5% with all other variables held constant and all the Group’s financial instruments moved according to the historical correlation with the indices:
Index Impact on profit after taxation 2019 2018 (Rupees in thousand)
PSX 100 (5% increase) 71,672 10,438 PSX 100 (5% decrease) (71,672) (10,438) PMEX (5% increase) 2,017 482 PMEX (5% decrease) (2,017) (482)
The Group’s investment in mutual fund amounting to Rupees 1,800.985 million (2018: Rupees 3,235.229 million) is exposed to price risk due to change in Net Asset Value (NAV) of such fund.
As at 30 June 2019, if fair value (NAV) had been 1% higher / lower with all other variables held
constant, profit before tax for the year would have been higher / lower by Rupees 15.308 million (2018: Rupees 27.499 million).
(iii) Interest rate risk This represents the risk that the fair value or future cash flows of a financial instrument will
fluctuate because of changes in market interest rates. The Group has no significant long-term interest-bearing assets. The Group’s interest rate risk
arises from long term financing and short term borrowings. Financial instruments at variable rates expose the Group to cash flow interest rate risk. Financial instruments at fixed rate expose the Group to fair value interest rate risk.

KOHINOOR TEXTILE MILLS LIMITED264
At the reporting date the interest rate profile of the Group’s interest bearing financial instruments was:
2019 2018 (Rupees in thousand)
Fixed rate instruments Financial Assets Sales tax refund bonds 24,819 - Short term investment - term deposit receipt 203,630 - Bank balances at PLS account 360,424 333,001 Financial liabilities Long term financing 1,921,718 1,648,400 Short term borrowings 2,501,500 6,496,178 Floating rate instruments Financial assets Short term investment - term deposit receipt 51,441 - Bank balances - saving accounts 384,920 332,733 Financial liabilities Long term financing 17,330,362 13,827,696 Short term borrowings 5,333,059 3,754,512
Fair value sensitivity analysis for fixed rate instruments The Group does not account for any fixed rate financial assets and liabilities at fair value through
statement of profit or loss. Therefore, a change in interest rate at the reporting date would not affect statement of profit or loss of the Group.
Cash flow sensitivity analysis for variable rate instruments
If interest rate at the year end date, fluctuates by 1% higher / lower with all other variables held constant, profit after taxation for the year would have been Rupees 165.830 million (2018: Rupees 125.522 million) lower / higher, mainly as a result of higher / lower interest expense / income on floating rate financial instruments. This analysis is prepared assuming the amounts of financial instruments outstanding at reporting dates were outstanding for the whole year.
(b) Credit risk
Credit risk represents the risk that one party to a financial instrument will cause a financial loss for the other party by failing to discharge an obligation. The carrying amount of financial assets represents the maximum credit exposure. The maximum exposure to credit risk at the reporting date was as follows:
2019 2018 (Rupees in thousand)
Investments 3,742,465 3,480,826 Deposits 264,305 213,897 Trade debts 4,227,634 2,977,474 Other receivables 434,692 226,461 Loans and advances 65,127 39,571 Bank balances 967,150 1,096,852 9,701,373 8,035,081

ANNUAL REPORT 2019 265
The credit quality of financial assets that are neither past due nor impaired can be assessed by reference to external credit ratings (If available) or to historical information about counterparty default rate.
Rating 2019 2018
Short term Long term Agency (Rupees in thousand)
Banks Allied Bank Limited A1+ AAA PACRA 1,785 632 Askari Bank Limited A1+ AA+ PACRA 64,005 133,639 Bank Al-Habib Limited A1+ AA+ PACRA 82,876 133,982 Bank Alfalah Limited A1+ AA+ PACRA 5,019 6,276 Bank Islami Pakistan Limited A1 A+ PACRA 211,617 214,161 The Bank of Punjab A1+ AA PACRA 8,665 33,665 Burj Bank Limited PACRA - 9 Dubai Islamic Bank Pakistan Limited A1+ AA JCR-VIS 2,581 2,669 Faysal Bank Limited A1+ AA PACRA 13,662 25,018 Habib Bank Limited A1+ AAA JCR-VIS 18,468 44,097 Habib Metropolitan Bank Limited A1+ AA+ PACRA 32,218 59,546 Meezan Bank Limited A1+ AA+ JCR-VIS 31,464 10,452 MCB Bank Limited A1+ AAA PACRA 227,653 230,961 National Bank of Pakistan A1+ AAA PACRA 26,126 21,420 MCB Islamic Bank Limited A1 AA- PACRA 197,611 33,392 Samba Bank Limited A1 A JCR-VIS 2,580 10,149 Silkbank Limited A2 A- JCR-VIS 58 61 Soneri Bank Limited A1+ AA- PACRA 101 127 Standard Chartered Bank (Pakistan) Limited A1+ AAA PACRA 2,508 2,515 Summit Bank Limited not available JCR-VIS 25 - United Bank Limited A1+ AAA JCR-VIS 11,375 119,635 U Microfinance Bank Limited A1 A JCR-VIS 899 899 Al-Baraka Bank (Pakistan) Limited A1 A+ PACRA 19,239 13,547 NRSP Microfinance Bank Limited A1 A PACRA 3,280 - FINCA Microfinance Bank Limited A1 A PACRA 3,335 - 967,150 1,096,852
The Group’s exposure to credit risk and impairment losses related to trade debts is disclosed in Note 23 to these consolidated financial statements.
Due to the Group’s long standing business relationships with these counter parties and after giving
due consideration to their strong financial standing, management does not expect non-performance by these counter parties on their obligations to the Company. Accordingly the credit risk is minimal.
(c) Liquidity risk Liquidity risk is the risk that an entity will encounter difficulty in meeting obligations associated with
financial liabilities. The Group manages liquidity risk by maintaining sufficient cash and the availability of funding through
an adequate amount of committed credit facilities. At 30 June 2019, the Group had Rupees 18,288 million (2018: Rupees 8,364 million) available borrowing limits from financial institutions and Rupees 992.951 million (2018: Rupees 1,104.743 million) cash and bank balances. The management believes the liquidity risk to be low. Following are the contractual maturities of financial liabilities, including interest payments. The amount disclosed in the table are undiscounted cash flows:
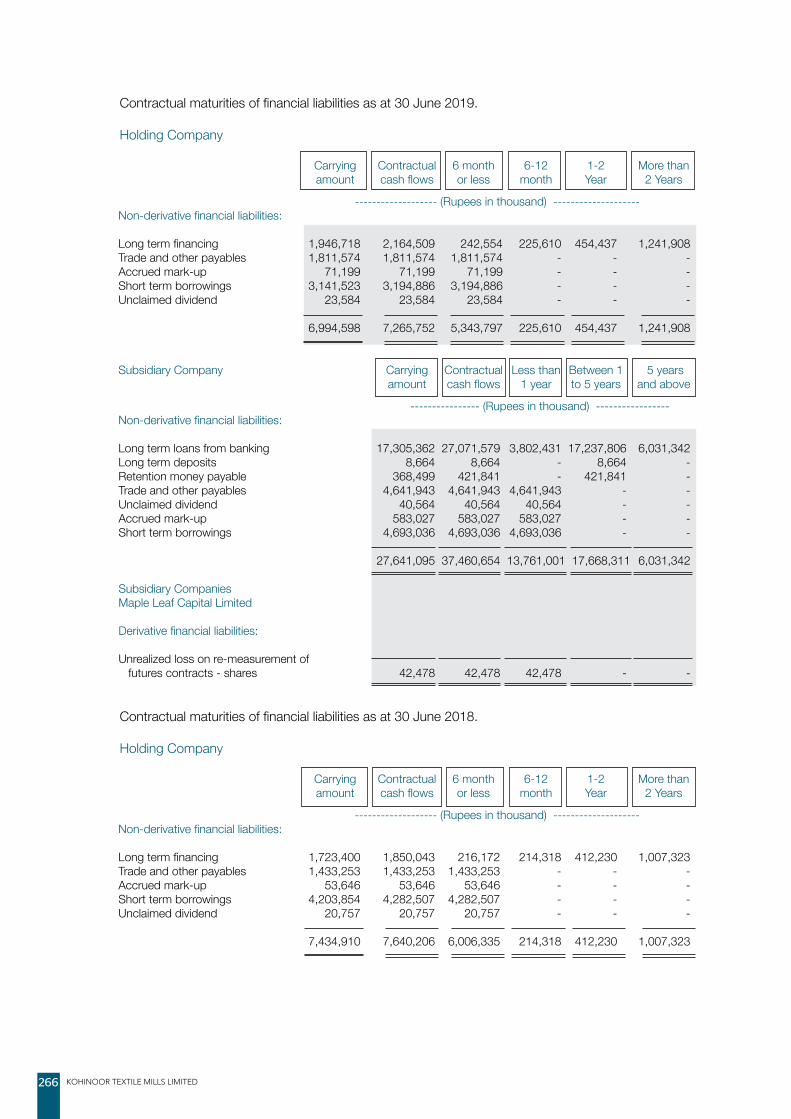
KOHINOOR TEXTILE MILLS LIMITED266
Contractual maturities of financial liabilities as at 30 June 2019. Holding Company
Carrying Contractual 6 month 6-12 1-2 More than amount cash flows or less month Year 2 Years
------------------- (Rupees in thousand) -------------------- Non-derivative financial liabilities: Long term financing 1,946,718 2,164,509 242,554 225,610 454,437 1,241,908 Trade and other payables 1,811,574 1,811,574 1,811,574 - - - Accrued mark-up 71,199 71,199 71,199 - - - Short term borrowings 3,141,523 3,194,886 3,194,886 - - - Unclaimed dividend 23,584 23,584 23,584 - - - 6,994,598 7,265,752 5,343,797 225,610 454,437 1,241,908
Subsidiary Company Carrying Contractual Less than Between 1 5 years amount cash flows 1 year to 5 years and above
---------------- (Rupees in thousand) ----------------- Non-derivative financial liabilities: Long term loans from banking 17,305,362 27,071,579 3,802,431 17,237,806 6,031,342 Long term deposits 8,664 8,664 - 8,664 - Retention money payable 368,499 421,841 - 421,841 - Trade and other payables 4,641,943 4,641,943 4,641,943 - - Unclaimed dividend 40,564 40,564 40,564 - - Accrued mark-up 583,027 583,027 583,027 - - Short term borrowings 4,693,036 4,693,036 4,693,036 - - 27,641,095 37,460,654 13,761,001 17,668,311 6,031,342 Subsidiary Companies Maple Leaf Capital Limited Derivative financial liabilities: Unrealized loss on re-measurement of futures contracts - shares 42,478 42,478 42,478 - -
Contractual maturities of financial liabilities as at 30 June 2018.
Holding Company
Carrying Contractual 6 month 6-12 1-2 More than amount cash flows or less month Year 2 Years
------------------- (Rupees in thousand) -------------------- Non-derivative financial liabilities: Long term financing 1,723,400 1,850,043 216,172 214,318 412,230 1,007,323 Trade and other payables 1,433,253 1,433,253 1,433,253 - - - Accrued mark-up 53,646 53,646 53,646 - - - Short term borrowings 4,203,854 4,282,507 4,282,507 - - - Unclaimed dividend 20,757 20,757 20,757 - - - 7,434,910 7,640,206 6,006,335 214,318 412,230 1,007,323

ANNUAL REPORT 2019 267
Subsidiary Company Carrying Contractual Less than Between 1 5 years amount cash flows 1 year to 5 years and above
---------------- (Rupees in thousand) ----------------- Non-derivative financial liabilities: Long term loans from banking 13,752,696 20,391,834 1,934,266 11,792,200 6,665,369 Long term deposits 8,714 8,714 - 8,714 - Retention money payable 310,735 388,660 - 388,660 - Trade and other payables 3,642,426 3,642,426 3,642,426 - - Unclaimed dividend 110,743 110,743 110,743 - - Accrued mark-up 286,162 286,162 286,162 - - Short term borrowings 5,784,902 5,784,902 5,784,902 - - 23,896,378 30,613,441 11,758,499 12,189,574 6,665,369 Subsidiary Companies Maple Leaf Capital Limited Derivative financial liabilities: Unrealized loss on re-measurement of futures contracts - shares 12,680 12,680 12,680 - -
The contractual cash flows relating to the above financial liabilities have been determined on the basis of interest rates / mark-up rates effective as at 30 June. The rates of interest / mark up have been disclosed in note 6, note 12 and note 13 to these financial statements.
45.2 Financial instruments by categories Amortized At fair value Held to Total cost through maturity profit or loss -------------(Rupees in thousand)------------- As at 30 June 2019 Assets as per consolidated statement of financial position
Investments 255,071 3,487,394 - 3,742,465 Deposits 264,305 - - 264,305 Trade debts 4,227,634 - - 4,227,634 Other receivables 421,924 12,768 - 434,692 Loans and advances 65,127 - - 65,127 Cash and bank balances 992,951 - - 992,951 6,227,012 3,500,162 - 9,727,174

KOHINOOR TEXTILE MILLS LIMITED268
Financial liabilities at fair Financial liabilities value through profit or loss at amortized cost
-------------(Rupees in thousand)------------- Liabilities as per consolidated statement of financial position Long term financing - 19,252,080 Long term deposits - 8,664 Retention money payable - 368,499 Short term borrowings - 7,834,559 Trade and other payables - 6,453,517 Accrued mark-up - 654,226 Unclaimed dividend - 64,148 Unrealized loss on re-measurement of futures contracts - gold 42,478 - 42,478 34,635,693
Loans At fair value Held to Total & through maturity receivables profit or loss -------------(Rupees in thousand)------------- As at 30 June 2018 Assets as per consolidated statement of financial position
Investments - 3,480,826 - 3,480,826 Deposits 213,897 - - 213,897 Trade debts 2,977,474 - - 2,977,474 Other receivables 216,316 10,145 - 226,461 Loans and advances 39,571 - - 39,571 Cash and bank balances 1,104,743 - - 1,104,743
4,552,001 3,490,971 - 8,042,972
Financial liabilities at fair Financial liabilities value through profit or loss at amortized cost
-------------(Rupees in thousand)------------- Liabilities as per consolidated statement of financial position Long term financing - 15,476,096 Long term deposits - 8,714 Retention money payable - 310,735 Short term borrowings - 9,988,756 Trade and other payables - 5,075,679 Accrued mark-up - 339,808 Unclaimed dividend - 131,500 Unrealised loss on re-measurement of futures contracts - shares 12,680 -
12,680 31,331,288

ANNUAL REPORT 2019 269
45.3 Capital risk management The Group’s objectives when managing capital are to safeguard the Group’s ability to continue as
a going concern in order to provide returns for shareholders and benefits for other stakeholders and to maintain an optimal capital structure to reduce the cost of capital. In order to maintain or adjust the capital structure, the Group may adjust the amount of dividends paid to shareholders, issue new shares or sell assets to reduce debt. Consistent with others in the industry and the requirements of the lenders, the Group monitors the capital structure on the basis of gearing ratio. This ratio is calculated as borrowings divided by total capital employed. Borrowings represent long term financing and short term borrowings obtained by the Group as referred to in Note 6 and Note 13 respectively. Total capital employed includes ‘total equity’ as shown in the statement of financial position plus ‘borrowings’. The gearing ratio as at year ended 30 June 2019 and 30 June 2018 is as follows:
2019 2018 (Rupees in thousand)
Borrowings 27,086,639 25,464,852 Total equity 43,207,912 39,816,570 Total capital employed 70,294,551 65,281,422 Gearing ratio 38.53% 39.01% 46. RECOGNIZED FAIR VALUE MEASUREMENTS - FINANCIAL INSTRUMENTS (i) Fair value hierarchy Judgments and estimates are made in determining the fair values of the financial instruments that are
recognized and measured at fair value in these financial statements. To provide an indication about the reliability of the inputs used in determining fair value, the Group has classified its financial instruments into the following three levels. An explanation of each level follows underneath the table.
30 June 2019 Recurring fair value measurements Level 1 Level 2 Level 3 Total --------- ( Rupees in thousand ) -------- Financial assets Financial assets at fair value through profit or loss 3,487,394 - - 3,487,394 Unrealized gain on re-measurement of futures contracts - shares 12,768 - - 12,768 Total financial assets 3,500,162 - - 3,500,162 Financial liabilities Unrealized loss on re-measurement of futures contracts - gold 42,478 - - 42,478 Total financial liabilities 42,478 - - 42,478

KOHINOOR TEXTILE MILLS LIMITED270
30 June 2018 Level 1 Level 2 Level 3 Total --------- ( Rupees in thousand ) -------- Financial assets Financial assets at fair value through profit or loss 3,480,826 - - 3,480,826 Unrealised gain on re-measurement of futures contracts - gold 10,145 - - 10,145 Total financial assets 3,490,971 - - 3,490,971
Financial liabilities Unrealised loss on re-measurement of futures contracts - shares 12,680 - - 12,680 Total financial liabilities 12,680 - - 12,680
The above table does not include fair value information for financial assets and financial liabilities not
measured at fair value if the carrying amounts are a reasonable approximation of fair value. Due to short term nature, carrying amounts of certain financial assets and financial liabilities are considered to be the same as their fair values.
There were no transfers between levels 1 and 2 for recurring fair value measurements during the year.
Further, there was no transfer in and out of level 3 measurements as the Group has no investments which are classified under level 3 of fair value hierarchy table.
The Group’s policy is to recognize transfers into and transfers out of fair value hierarchy levels as at the
end of the reporting period. Level 1: The fair value of financial instruments traded in active markets (such as publicly traded
derivatives, and trading and available-for-sale securities) is based on quoted market prices at the end of the reporting period. The quoted market price used for financial assets held by the Group is the current bid price. These instruments are included in level 1.
Level 2: The fair value of financial instruments that are not traded in an active market (for example,
over-the-counter derivatives) is determined using valuation techniques which maximize the use of observable market data and rely as little as possible on entity-specific estimates. If all significant inputs required to fair value an instrument are observable, the instrument is included in level 2.
Level 3: If one or more of the significant inputs is not based on observable market data, the instrument
is included in level 3. This is the case for unlisted equity securities. (ii) Valuation techniques used to determine fair values Specific valuation techniques used to value financial instruments include the use of quoted market
prices.
47. RECOGNIZED FAIR VALUE MEASUREMENTS - NON-FINANCIAL ASSETS
(i) Fair value hierarchy
The judgments and estimates made in determining the fair values of the non-financial assets that are recognized and measured at fair value in the financial statements. To provide an indication about the reliability of the inputs used in determining fair value, the Group has classified its non-financial assets into the following three levels.

ANNUAL REPORT 2019 271
At 30 June 2019 Level 1 Level 2 Level 3 Total --------- ( Rupees in thousand ) -------- Investment properties - 1,792,755 - 1,792,755 Freehold land - 2,725,309 430,096 3,155,405 Investment in gold 725,456 - - 725,456 Total non-financial assets 725,456 4,518,064 430,096 5,673,616
At 30 June 2018 Level 1 Level 2 Level 3 Total --------- ( Rupees in thousand ) -------- Investment properties - 1,792,755 - 1,792,755 Freehold land - 2,725,309 430,096 3,155,405 Investment in gold 400,294 - - 400,294 Total non-financial assets 400,294 4,518,064 430,096 5,348,454
The Group’s policy is to recognize transfers into and transfers out of fair value hierarchy levels as at the end of the reporting period.
There were no transfers between levels 1 and 2 for recurring fair value measurements during the year.
Further, there was no transfer in and out of level 3 measurements. (ii) Valuation techniques used to determine level 1 & 2 fair values The Group obtains independent valuations for its investment properties and freehold land (classified
as property, plant and equipment) after regular intervals. The management updates the assessment of the fair value of each property, taking into account the most recent independent valuations. The management determines a property’s value within a range of reasonable fair value estimates. The best evidence of fair value of land is current prices in an active market for similar lands. The best evidence of fair value of buildings is to calculate fair depreciated market value by applying an appropriate annual rate of depreciation on the new construction / replacement value of the same building.
Investment in gold is non-financial asset. Its fair value is based on the quoted market price in active
markets. Valuation processes The Group engages external, independent and qualified valuers to determine the fair value of the
Group’s investment properties and freehold land after regular intervals. As at 30 June 2019, the fair values of the investment properties and freehold land of the Holding Company have been determined by Anderson Consulting (Private) Limited. MLCFL’s freehold land was revalued by Arif Evaluators, an independent valuer approved by Pakistan Banks’ Association (PBA) in “any amount” category, at 22 June 2015.
Changes in fair values are analyzed at each reporting date during the annual valuation discussion between the Chief Financial Officer and the valuers. As part of this discussion the team presents a report that explains the reason for the fair value movements.

KOHINOOR TEXTILE MILLS LIMITED272
48. INTEREST IN OTHER ENTITIES
The Group’s principal subsidiaries as at 30 June 2019 are set out below. Unless otherwise stated, they have share capital consisting solely of ordinary shares that are held directly by the Group, and the proportion of ownership interest held equals the voting rights held by the Group. The country of the incorporation or registration is also their principal place of business.
Name of the entity
Place of business / country of
incorporation
Ownership interest held by the Group
Owner ship interest held by non-controlling
interests
Principal Activities
2019 2018 2019 2018
Maple Leaf Cement Factory Limited Pakistan 55.22% 55.22% 44.78% 44.78% Production and sale of cement Maple Leaf Capital Limited Pakistan 82.92% 82.92% 17.08% 17.08% To buy, sell, hold, or otherwise acquire or invest capital in financial instruments Maple Leaf Power Limited Pakistan 55.22% 55.22% 44.78% 44.78% Generation, sale and supply of electricity Kohinoor Capital Limited Pakistan 82.92% - 17.08% - To buy, sell, hold, or otherwise acquire or invest capital in financial instruments48.1 Non controlling interests (NCI)
Set out below is summarized financial information for each subsidiary that has non-controlling interests that are material to the group. The amounts disclosed for each subsidiary are before inter-company eliminations.
Maple Leaf Cement Factory Maple Leaf Capital Maple Leaf Power Kohinoor Capital Limited Limited Limited Limited 2019 2018 2019 2018 2019 2018 2019 2018 ------------------------------ (Rupees in thousand) ---------------------------------
Summarized statement of financial position Current assets 14,206,878 12,731,681 5,067,389 4,904,755 1,671,984 1,507,513 196,787 - Current liabilities 14,164,518 11,953,924 160,533 130,852 1,214,667 1,164,110 85,084 - Current net assets 42,360 777,757 4,906,856 4,773,903 457,317 343,403 111,703 - Non-current assets 51,750,897 45,996,847 75,668 3,915 6,295,520 5,405,449 267 - Non-current liabilities 21,278,671 16,863,465 - - - - - - Non-current net assets 30,472,226 29,133,382 75,668 3,915 6,295,520 5,405,449 267 - Net assets 30,514,586 29,911,139 4,982,524 4,777,818 6,752,837 5,748,852 111,970 - Summarized statement of comprehensive income Revenue 26,005,944 25,699,113 417,542 340,608 3,918,083 2,591,719 81,949 - Profit for the year 1,465,299 3,632,201 204,707 258,341 1,003,985 758,040 61,969 - Other comprehensive loss (25,209) (20,275) - - - - - - Profit allocated to NCI 656,161 1,626,500 34,964 44,125 449,584 339,450 10,584 - Dividend paid to NCI 265,859 812,341 - - - - - - Summarized statement of cash flows Cash generated from / (used in) operating activities 6,280,960 5,771,557 (41,077) (990,225) 961,592 356,097 5,185 - Cash (used in) / from investing activities (8,105,101) (19,736,988) (20,867) 35,353 (1,183,342) (1,113,810) 655 - Cash from / (used in) financing activities 1,815,157 13,170,378 - - 199,865 774,481 50,000 - Net (decrease) / increase in cash and cash equivalents (8,984) (795,053) (61,944) (954,872) (21,885) 16,768 55,840 -

ANNUAL REPORT 2019 273
2019 2018 (Rupees in thousand)
49. DISCLOSURES BY COMPANY LISTED ON ISLAMIC INDEX Description Holding Company Loans / advances obtained as per Islamic mode: Loans Advances 88,617 125,443 Shariah compliant bank deposits / bank balances Bank balances 52,799 21,839 Profit earned from shariah compliant bank deposits / bank balances 3,906 - Revenue earned from shariah compliant business 21,220,135 17,833,540 Gain / (loss) or dividend earned from shariah compliant investments Dividend income 327,839 1,002,415 Realized gain on disposal of short term investments (3,117) (10,413) Unrealized gain on investments at fair value - 1,353 Exchange gain earned 194,788 112,755 Mark-up paid on islamic mode of financing - - Profits earned or interest paid on any conventional loan / advance Interest income on sales tax refund bonds 19 - Profit earned on deposits with banks 8,290 12,762 Interest paid on loans 346,441 272,781 Relationship with shariah compliant banks Name Relationship at reporting date Al-Baraka Bank (Pakistan) Limited Bank balance Bank Islami Pakistan Limited Bank balance MCB Islamic Bank Limited Bank balance Meezan Bank Limited Bank balance Subsidiary company (MLCFL) Loans / advances obtained as per Islamic mode: Loans 2,115,293 1,400,000 Advances - 215,534 Shariah compliant bank deposits / bank balances Bank balances 217,905 220,535 Profit earned from shariah compliant bank deposits / bank balances 8,780 5,630 Revenue earned from shariah compliant business 26,005,944 25,699,113 Gain / (loss) or dividend earned from shariah compliant investments Dividend income 844 - Realized gain on disposal of short term investments 13,358 - Profits earned or interest paid on any conventional loan / advance 19 - Profit earned on deposits with banks 12,330 25,112 Relationship with shariah compliant banks Name Relationship at reporting date MCB Islamic Bank Limited Bank balance and financing Bank Islami Pakistan Limited Bank balance Dubai Islamic Bank Pakistan Limited Bank balance Al-Baraka Bank (Pakistan) Limited Bank balance

KOHINOOR TEXTILE MILLS LIMITED274
CHIEF EXECUTIVE OFFICER DIRECTOR CHIEF FINANCIAL OFFICER
50. DATE OF AUTHORIZATION FOR ISSUE These consolidated financial statements were authorized for issue on 20 September 2019 by the
Board of Directors of the Holding Company. 51. NON ADJUSTING EVENTS AFTER THE BALANCE SHEET DATE
51.1 The Board of Directors of the Holding Company in their meeting held on 20 September 2019
has proposed a final cash dividend of Rupees 0.75 per share (7.5%) amounting to Rupees 224.472 million (2018: Rupees 299.296 million) for the year ended 30 June 2019.
The Board of Directors of the Subsidiary Company (MLCFL) in their meeting held on 19 September 2019, has proposed a final cash dividend of Rupees 0.5 per share (5%) amounting to Rupees 296.850 million (2018: Rupee 593.701 million) for the year ended 30 June 2019. The Board also proposed to issue 85% right shares at premium of Rupees 2 per share in proportion of 85 shares for every 100 shares.
Approval of the Members of both the Companies for the final dividend shall be obtained at
Annual General Meeting to be held on 26 October 2019. The consolidated financial statements for the year ended 30 June 2019 do not include the effect of the proposed final cash dividend which shall be accounted for in the period ending 30 June 2020.
51.2 Under section 5A of the Income Tax Ordinance, 2001, a tax shall be imposed at the rate of 5%
of accounting profit before tax of the Holding Company and MLCFL, if it does not distribute at least 20% of its after tax profit for the year within six months of the end of the year ended 30 June 2019 through cash. The requisite cash dividend has been proposed by the Board of Directors of the Holding Company and MLCFL in their meetings held on 20 September 2019 and 19 September 2019 respectively, which will be distributed within the prescribed time limit. Therefore, the recognition of any income tax liability in this respect is not considered necessary.
52. CORRESPONDING FIGURES Corresponding figures have been re-arranged, wherever necessary, for the purpose of comparison. No
significant rearrangements have been made. 53. GENERAL Figures have been rounded off to the nearest thousand of Rupees unless stated otherwise.

ANNUAL REPORT 2019 275
KOHINOOR TEXTILE MILLS LIMITED42-LAWRENCE ROAD, LAHORE
PROXY FORMI/We___________________________________________________________________________________
of __________________________________________________________________________________________ being a member of KOHINOOR TEXTILE MILLS LIMITED hereby appoint ______________________________
____________________________________________________________________________________________ Name (Folio / CDC A/c No. if Member)
of __________________________________________________________________________________________
or failing him/her _____________________________________________________________________________ Name (Folio / CDC A/c No. if Member)
of __________________________________________________________________________________________as my/our proxy to attend, speak and vote for and on my/our behalf at the 51st Annual General Meeting of the Company to be held at its Registered Office, 42-Lawrence Road, Lahore, on Saturday, October 26, 2019 at 12:00 Noon and/or any adjournment thereof.
As witnessed given under my/our hand(s) _________________ day of October, 2019.
1. Witness: 2. Witness:
Signature : _______________________ Signature : _______________________
Name : _______________________ Name : _______________________
CNIC : _______________________ CNIC : _______________________
Address : _______________________ Address : _______________________
: _______________________ : _______________________
Shares Held: __________________________
AffixRevenue
Stamp of Rs. 5/-
Signature of Member / Attorney
Folio No.
CNIC No.
CDC Account No.Participant
I.D.Account
No.
Notes: 1. Proxies, in order to be effective, must be received
at the Company’s Registered Office not later than 48 hours before the time for holding the meeting and must be duly stamped, signed and witnessed.
2. CDC beneficial owners and Proxy Holder must bring with them their Computerized National Identity Cards (CNIC)/Passports in original to prove his/her identity and in case of Proxy, CDC beneficial owners and Proxy Holder must enclose an attested copy of their CNIC/Passport with Proxy Form.
3. In case of corporate entity, the Board of Directors’
resolution / power of attorney with specimen signature of the nominee (unless it has been provided earlier) should be attached with the proxy form or may be provided at the time of meeting.

KOHINOOR TEXTILE MILLS LIMITED276
AFFIX
CORRECT
POSTAGE
The Company Secretary
KOHINOOR TEXTILE MILLS LIMITED42-LAWRENCE ROAD, LAHORETel: 042-36302261-62
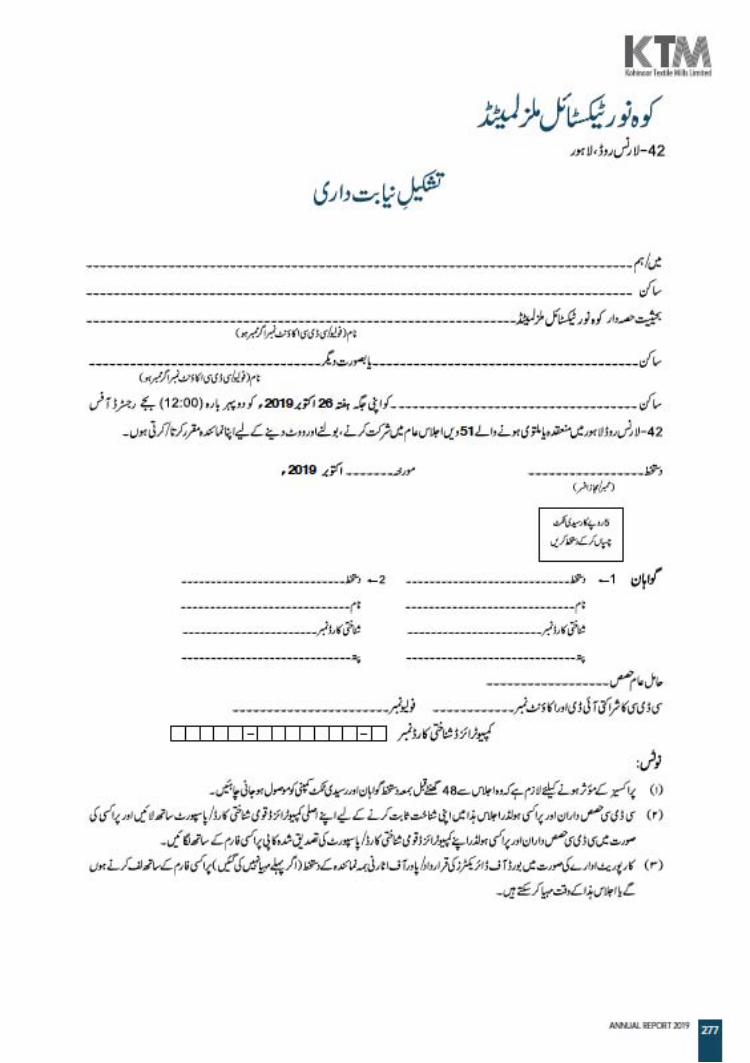
KOHINOOR TEXTILE MILLS LIMITED278
AFFIX
CORRECT
POSTAGE
The Company Secretary
KOHINOOR TEXTILE MILLS LIMITED42-LAWRENCE ROAD, LAHORETel: 042-36302261-62