Embed Size (px)
Citation preview

Annual Report 2017
LENDINVEST LIMITED Registered number 08146929

1
2
3ContentsStrategic Report
Governance
Financial Statements
LendInvest at a glance
Chief Executive Officer’s Review
Chief Investment Officer’s Review
Strategic Initiatives
Chief Financial Officer’s Review
Our People & Corporate Social Responsibility
Our expanding borrower product range
The LendInvest Property Development Academy
Officers & Professional Advisers
Governance & Conduct Report
Directors Report
Director’s responsibilities statement
Independent auditor’s report
Statements of profit or loss and other comprehensive income
Statements of financial position
Statements of cashflows
Statements of changes in equity
Notes forming part of the financial statements
04
07
09
11
12
15
20
21
24
25
27
29
30
31
32
34
36
37

Strategic Report

4 LendInvest 2017 Annual Report
LendInvest at a glance
Performance overview*
Year ended 31 March 2017 2016 2015
Gross revenues £40m £32m £14m
Profit from operations £0.1m £3.4m £3.3m
Total funds lent in the year £357m £320m £174m
Total loss rate 0.3% 0.1% 0.0%
Our lending by region (as in March 2017)
Regional reach
RegionLending (%) (by value)
London 62.7%
South East 20.8%
East England 6.3%
West Midlands 2.7%
Scotland 2.0%
South West 2.0%
North West 1.0%
Wales 0.9%
North East 0.9%
East Midlands 0.4%
Yorkshire and The Humber
0.2%
*Performance of on and off balance sheet assets managed by the Group

Strategic Report 5
Recent awards Estimated total properties funded**
4,000+
Montello Real Estate Opportunity Fund*
Online investment platform
Assets under management
*a subfund of LFP1 SICAV SIF SA
**as at 31 March 2017
Assets under management
£100m
£75m
£50m
£25m
£0m20162015 20172014
2016 20152017
£120.7m £80.2m £31.4m

“We are pleased to report a fourth year of growth during what has been a period of unprecedented national events.”

Strategic Report 7
Chief Executive Officer’s Review
Christian FaesCo-Founder & Chief Executive Officer
A backdrop of political uncertainty
The introduction of nationwide stamp duty tax changes in April 2016 accounted for many accelerated purchases in March 2016. A consequence of this was a notable reduction in property investment transactions in the first quarter of our financial year. This subdued appetite to borrow was exacerbated by the anticipation of the Brexit referendum vote, the subsequent result and the unexpected change of government. As a bellwether for the country’s economic sentiment, the UK property market recorded low transaction volumes throughout the second and third quarters; in the specialist lending sector more specifically, a larger than normal number of professional investors and developers deferred purchases while they waited for the political and economic dust to settle on the new normal.
Investing in executionUndeterred by the challenges this
deflated funding environment posed, we nevertheless made a strategic decision to pursue the development initiatives we had planned for this year. These projects would create a stronger, more resilient business with the capacity to lend more at scale and at pace when the external market conditions improved. We doubled down to invest heavily in both people and processes, and to make operational improvements across the breadth of our business. We were confident that the UK property market is fundamentally resilient and when conditions became more favourable, we would be well placed to capitalise on our strengthened position.
A record fourth quarter
In the three months to 31 March 2017, we recorded our strongest quarter to date for originations as the market saw a resurgence in confidence and productivity among prospective borrowers. During the quarter we received more than 270 signed applications and completed over 120 loans worth £100m. The year ended with a very strong pipeline and the run-rate since year-end has been promising. At the time of publication, it looked likely that the first quarter of the new financial year would be even stronger again.
We have been implementing a range of strategies to re-accelerate growth after 2016, and after a year of investment these are coming to fruition.
Growth across all metrics The operational efficiencies we drove
helped us record growth across every area of the business (see highlights below). We have consolidated our position, future-proofed our processes and won market share in the increasingly competitive short-term mortgage lending space.
Strengthening our leadership In June 2016, Stephan Wilcke, formerly
of OneSavings Bank and the Treasury’s Asset Protection Agency, joined the business as a Senior Adviser to our Board. Given his experience as Executive Chairman of one of the UK’s largest and most successful challengers banks in the run-up to and at the point of its stock
market listing, Stephan is a trusted and expert sounding board to our senior management team.
In September 2016, we were pleased to welcome Niall Wass as a Board Observer. Having overseen the rollout of Uber in 50 countries, affected transformational change at FinTech startup Wonga and been one of the first employees at Betfair, Niall brings to LendInvest a wealth of experience of implementing strategies that enable companies to scale responsibly and at pace.
Championing our borrowersOne of the highlights of the year
was the launch of the first LendInvest Property Development Academy in September. Discussed in more detail on page 22, the non-profit Academy aims to equip more aspiring and novice small-scale house builders with the skills they need to secure funding and get their schemes built. By year-end 75 ‘students’ had completed the course, we had announced new course dates in four key regional cities, and the Academy had won endorsement from both the University of Reading and the Home Builders’ Federation.
“In the three months to 31 March 2017, we recorded our strongest quarter to date for originations.”
Growth highlights
• Total assets under management grew by 42%
• Online platform investments grew by 50%
• Our flagship discretionary fund doubled in size, surpassing £100m shortly after year-end
• We doubled the number of dedicated institutional funding lines
• Our loan product range expanded from two to seven specially designed and targeted products
• We opened for business outside of the capital, recruiting local dealmakers to originate loans in Scotland and Northern England

8 LendInvest 2017 Annual Report
We supplemented the efforts and successes of the Academy with the publication of “Starting Small to Build More Homes: A blueprint for better policymaking in the property SME market” in March 2017. This report, launched by a senior Conservative MP in the company of senior housebuilding industry executives and government funders, paves the way for a long-term strategy to advocate for better incentives and benefits for aspiring small-scale housebuilders around the UK.
Regulatory reassuranceOperating in financial services is a
serious business. Our customers are trusting us to look after their money. Shortly after year-end we took the decision to tailor our online investment platform to sophisticated or high net worth investors and investment professionals. In doing so, the loans into which these eligible investors now invest are managed under the terms of our existing alternative investment fund management permissions granted to us by the Financial Conduct Authority in 2010. We expect that the majority of existing platform investors will be eligible to continue investing with us and the response has been hugely positive to date.
Shaping the future of property finance
As the company has grown, our mission has become clearer and more relevant than ever. We created LendInvest because we want to shape the future of property finance. Unsatisfied by the norm, we think differently about the products we bring to market and the processes we use to create seamless customer experiences. And we are doing this well. Financial year 2017 was successful for LendInvest and coming into the new financial year we are gaining significant momentum. We have worked hard to mitigate external issues, focused on our core business priorities, and set the business up well for the year ahead.
Christian FaesCo-Founder & Chief Executive Officer22 June 2017
“We have consolidated our position, future-proofed our processes and won market share.”
Conor Burns MP launching our Property SMEs report in the company of senior property and housebuilding executives, March 2017

Strategic Report 9
Chief Investment Officer’s Review
Ian ThomasCo-Founder & Chief Investment Officer
“By focusing on the execution of our five long-term strategic objectives, LendInvest performed strongly over the financial year.”
An attractive and resilient asset class
Property remains an attractive asset class, and one where demand continually outstrips supply. While it’s possible that we will see some downward movement in house prices, particularly in London and the Southeast, it is our firm belief that the UK property market remains fundamentally resilient. Brexit may also provide an opportunity for the UK housing market to cool and reset in areas where rising houses prices are stifling first time buyers and others that want to buy property. Added to this, the possibility of some interest rate fluctuation and the lower value of the pound against other currencies should go a long way to offsetting selling pressure. Over the year we diversified our funding base in all areas in order to increase our resilience to negative changes in the market.
Fundamental to our success in the past year has been our control of risk, and this will always remain a focus for a lending business. We will continue to develop our industry best practice underwriting and credit monitoring in order to reduce credit risk, while ensuring that we minimise exposure to currency and interest rate risk.
Focused on executionWe invested heavily in people,
premises, technology and partnerships this year to deliver first class systems that make online lending and investing a superior experience and help our business be continually productive. In particular, this year we took a transformative and tailored approach to serving the end-to-end borrower journey (see this in practice on page 20). This was underpinned with further customer-facing improvements and we made operational efficiencies internally, expanding the staff to match borrower demand. By year-end our 30-strong team of experienced dealmakers, case managers, underwriters and loan servicers was capable of processing twice as many applications than a year before from prospective borrowers attracted to our speed and flexibility.
Consistent investor inflowsIn such a consistently low-yield interest
rate environment, the hunt for returns has never been so strong and we saw investment inflows rise significantly over the year. Despite the hurdles created by stamp duty tax changes, the Brexit referendum and an unexpected change in government, investors continued to recognise that UK property is fundamentally resilient. Consequently, as Christian outlines in his review, inflows grew strongly across all three of our main investment products.
Most notably our flagship discretionary fund, the Montello Real Estate Opportunities Fund, doubled in size over the course of the year as private debt strategies continue to win market share from hedge funds and other non-bank incumbents in investment managers’ portfolios. The fund hit its three-year anniversary in January 2017 and gained £30 million of new investment in the
final quarter of the year. Within a month after year-end, the fund was managing £100 million of assets on behalf of European and Asian clients. This is an important milestone that opens up a new category of investors with higher fund-size threshold requirements for future fundraising.
We added a number of bank credit lines to our overall capital mix, including a £40 million warehouse funding line from Macquarie Group, that allow us to make longer, larger funding commitments. In January, we syndicated a £12 million loan against a Canary Wharf mixed-purpose development with Merseyside Pension Fund, opening the door to further local authority investment agreements in the future.
Having relaunched our online investment platform during the year to incorporate new services and innovative functionality, by year-end platform investors had more than £120 million invested in live loans. We took the decision after year-end to tailor the platform specifically for categories of investors that use it most actively and often. We are confident that this is an effective strategy to help eligible investors invest in our loans while offering the best possible customer experience.
Regional spreadLendInvest has historically been a
London and Southeast lender due to a combination of our expertise and property market liquidity in these areas. However, as part of our strategy to increase significantly our loanbook of short-term mortgages, by the third
“We invested heavily in people, premises, technology and partnerships”

10 LendInvest 2017 Annual Report
quarter of the year we had extended our reach to Northern England and Scotland. In particular, we are targeting areas with increasing levels of liquidity, resilient property prices, and appetite from professional investors in cities championed by the government’s Northern Powerhouse initiative and towns in the ‘central belt’ that lies between Edinburgh and Glasgow.
By year-end multiple deals had completed in both regions, and locally appointed business development managers in Manchester and Edinburgh were leveraging their networks to build healthy pipelines of new deals. We expect these to be two sizeable growth areas for our business in the year to come.
Market-leading loan servicingIn June 2016, we received the highest
possible rating from ARC Ratings, a regulated European credit agency for the second consecutive year. The agency renewed its SQ1 Servicer Quality Rating for LendInvest having assessed how we originate, underwrite and service
high-quality property loans. Corporate governance, internal controls, due diligence and data disaster mitigation are highly contingent factors.
At year-end we completed a year-long process to integrate our loan servicing operations with Pepper UK, one of the country’s leading specialist loan servicing companies. Pepper UK now services all new loans that we originate and will take responsibility for existing loans by autumn 2017 for continuity of service. Customer feedback has been roundly supportive. Borrowers value the access to a deeply experienced and dedicated team of servicers throughout the term of their loans. Investors are reassured that our loans are serviced by a market-leading servicer; in particular it makes it easier for institutions wishing to invest in whole portfolios of loans.
Helping our investors understand the loans in which they invest is a critical component of our responsible lending policy. During the year we refreshed our online content that guides investors through the lifecycle of the loans, explaining for instance what happens if, as is common in short-term lending,
a loan is authorised for extension. By year-end we had introduced a traffic light system that indicates to platform investors how the new loans in their individual portfolios are performing.
We’re on trackIn the face of unpredicted market
turbulence and corrections, Financial Year 2017 was the year that we demonstrated our resilience and stability. The sustainability and responsible lending we’ve built our business on were truly tested this year, and I am proud of the outcome. We didn’t batten down the hatches. Instead we protected our customers, our systems and ourselves while continuing to grow. The execution of our mission remains on track and we look forward to the new financial year with positive expectations.
Ian ThomasCo-Founder & Chief Investment Officer22 June 2017

Strategic Report 11
Strategic Initiatives
Strategic objectives Developments in FY2017 Future priorities
Lend more, sustainablyBe the market leader in short-term property lending
We increased our national coverage by appointing business development managers in Scotland and Northern England, marking the start of a strategy to roll out regionally. Despite heavy buy-to-let tax changes and the headwinds that followed the Brexit referendum vote, our well-diversified funding base allowed us to continue lending confidently.
We will continue to innovate with the products we provide and how we provide them, to lend more , sustainably across the country.
Lender of choiceBe the preferred lender for our target customer
We developed a suite of relevant, competitive and tailored products designed specifically for our borrowers. By year-end we had launched four new products, and each was met by a receptive audience of borrowers and intermediaries (see Our Borrower Journey pg 20). Ensuring that these customers return to us repeatedly was a priority and we worked hard to ensure that each receives an exceptional service from us every time, whether that’s speed of execution or transparency through the application process.
We will constantly assess the needs of our borrowers and evolve our products and processes to fit their demands as these evolve with wider market dynamics.
Build technology solutionsBe technologically innovative and data driven
We continued to create new ways to make the process of applying for a loan all the more efficient. In particular, that meant investing in tools that improve workflow between our in-house teams, our partners (brokers, solicitors, valuers) and our borrowers.
We also integrated more online functionality to help all our investors access information about their investments more easily. We fully re-launched our online investment platform with new or improved online tools.
We will continue to build technology solutions to help us better serve investors and borrowers in what is traditionally an offline and paperheavy industry.
Best investment productsBe the preferred channel for access to mortgage investments
We welcomed a wider range of investors to LendInvest seeking competitive returns from property loan investing. Our platform attracted over 500% more registered users and our flagship discretionary fund, based in Luxembourg, grew over 110% in size. Institutional appetite grew and we began to invest on behalf of a number of new institutional investors, including a public sector pension fund and infrastructure vehicles.
We will launch innovative new products and individual features for our investors, continually improving their access to property finance investment opportunities and their ability to make informed decisions.
Grow & diversify fundingBe funded by diverse, flexible and sustainable capital
We continued to broaden our capital base to provide a sustainable and highly scalable model. Not only does this create flexible funding, but it reduces the cost of capital, enabling us to offer the best possible interest rates to borrowers and rates of return to investors.
We will continue to identify creative new entry points for investors to real estate lending that support a really well diversified capital base and help reduce the cost of funding.

12 LendInvest 2017 Annual Report
excludes those that are “off balance sheet”. “On balance sheet” assets are those held directly by our Group companies and assets financed through bank funding lines. Assets that are “off balance sheet” are those held by our funds (Income Fund and Real Estate Opportunity Fund) and by platform investors.
However, as a business, we treat all assets to the same standard regardless of our IFRS reporting of them. As a result, the same rigorous standards of loan origination, underwriting and servicing apply regardless of whether or not these assets are included in our financial statements. Our Key Performance Indicators noted below do not therefore exclude assets that are owned by our funds or platform investors.
During the period revenue increased by 17% to £22 million on an IFRS basis, and up 27% to £40 million on a gross basis.
Loans (£m)
Our available facilities increased across the board, and at year-end we had over £100 million of available unutilised funding.
We recorded our third year of profit from operations on a consolidated IFRS basis this year. The profit was small this year because we invested heavily in brand awareness, funding capacity and technology in order to position the business for growth in 2017-18. We have already seen the benefit of this coming through; in the year we launched four new loan products: Auction Finance, Refurbishment Finance, Pre-Construction Finance and Development Exit Finance. Additionally, originations have shown significant increases at the end of 2016-17 and the start of 2017-18.
Underlying Profit from Operations, which adjusts reported IFRS results for one-off or exceptional costs or revenues which are non-recurring in nature is shown below.
The significant underlying adjustments between Profit from Operations and Underlying Profit from Operations are as follows:
• Brand creation and advertising campaign costs linked to brand awareness
• Office occupancy and under-occupancy costs and staff benefits implemented in later periods
• Non-utilisation costs on new funding lines as they build up to capacity and provisions for bad and doubtful debts to reflect policies that are revised on a continuing basis, and take into consideration the market volatility seen within the relevant period
• Corporate transaction costs, principally in relation to regulatory approvals and shareholder transactions.
The Company and Group made a loss for the year of £1.1m (2016: £2m profit) and £1.2m (2016: £1.1m profit). This performance reflects the non-recurring items listed above, including finance costs paid to our Series A shareholder of £1.1m (2016: £0.9m) for debt which was repaid before 31 March 2017).
Chief Financial Officer’s Review
Derek MochanChief Financial Officer
“During 2016-17 we restructured our balance sheet to use our capital more efficiently. We placed a number of loans that had been held on our balance sheet with other funding lines, restructured working capital, invested in funding lines, and made our origination and pre-funding processes more efficient. We repaid our Series A investor £22 million while still being able to grow the business significantly (Assets Under Management growth of 42%). We now have a leaner balance sheet focused on ensuring we utilise our capital efficiently.”
2016-17 financial highlights• Repayment of £22 million Series A to
Beijing Kunlun
• Break-even profit from operations, with underlying profit from operations of £2.7 million
• Investment of over £1 million in marketing, funding capacity and technology
• £8.4 million of equity
• Creation of an origination vehicle, in partnership with a private equity funder, to manage the pre-funding of loans
• Increase in loans funded and risk transferred to third parties from 59% to 72%, significantly de-risking our balance sheet
• Significant increase in funding facilities and utilisation, with an overall increase in Assets Under Management of 42%
Group performanceGroup performance as stated in our
IFRS consolidated accounts includes all assets and liabilities that are “on balance sheet” for accounting purposes, but
160
120
80
40
0 2016 2016 20162017 2017
2017
On balance sheet
(incl funding lines)
Off balance sheet
(platform)
Off balance sheet
(LI Capital Funds)
Facilities (£m)
200
150
100
50
0 2016 2016 20162017 2017 2017
On balance sheet
(incl funding lines)
Off balance sheet
(platform)
Off balance sheet
(LI Capital Funds)

Strategic Report 13
performance. While we will continue to work to minimise losses, significant declines in the economic environment or property market could result in higher losses.
Diversified fundingOur three main capital sources as at 31
March 2017 were split as follows:
As shown above, our funding facilities are split between our three principal sources of funds. The online platform and LendInvest Capital funds are highly utilised, as by their nature they are committed and prepaid. Our banking funding lines are a mix of committed and uncommitted facilities and we draw these as and when required. Available facilities at 31 March 2017 were in excess of £100 million.
During the year we improved our process of originating and pre-funding loans. We partnered with a private equity firm to provide the business with a revolving capital pool to pre-funds loans that are then sold on to investors, of all types, to continue to ensure certainty of funding to our professional property borrowers.
Post balance sheet events• From 9 May 2017 any LendInvest
platform investment is an investment in an alternative investment fund. These fund investments take the form of receivables participations, which entitle investors to receive payments from the Group.
• In June 2017 we cancelled our applications to operate a P2P platform, credit broking and consumer credit. While these FCA applications can be reopened at anytime, we currently have no need for these permissions.
• We remain profitable, showing growth while continuing our investment in the business.
The key performance indicators of LendInvest Group are:
2017 2016
Platform investor funds (£m)This represents investor’s funds invested with us at the balance sheet date
120.7 80.2
Lifetime loan originations (£m)This represents all loans ever written by the business
968.7 611.4
Amount of loans outstanding (£m)This represents amounts owed to the business by borrowers at the balance sheet date
325.0 231.0
Proportion of AUM “off balance sheet” (%) 71.6 59.4
Total loan losses (%)*This represents the capital and interest losses in the period as a proportion of loans outstanding
0.3 0.1
Profit from operations (£m)This represents the amount of operating profit of the business
0.1 3.4
Underlying profit from operations (£m) 2.7 3.5
Analysis of Key Performance IndicatorsThe performance of LendInvest Ltd is evaluated as part of the performance of the
consolidated LendInvest Group of companies.
2017 has shown significant growth in many of our key performance indicators. Our loans outstanding and loan originations have grown significantly, with our external funding sources (platform and LendInvest Capital) growing to match these, this leaves us proportionately less exposed within our banking funding lines, which have significant capital available for further lending.
Losses remained modest, but as noted last year we are aware that we have been operating in a favourable economic climate, with little downside volatility in property prices. As a result, historical loan losses alone are only one indicator of future
The key performance indicators of LendInvest Ltd are:
2017 2016
Platform investor funds (£m)This represents investor’s funds invested with us at the balance sheet date
120.7 80.2
Total loan losses (%)*This represents the capital and interest losses as a proportion of loans outstanding
0.0 0.1
Profit/ (loss) from operations (£m)This represents the amount of operating profit of the Company
(0.1) 2.3
2017 2016
Profit from operations (£m) 0.1 3.4
Adjustments to underlying profit as noted above (£m)
2.6 0.1
Underlying profit from operations (£m) 2.7 3.5
Loans Facilities
Our online investment platform
38% 30%
LendInvest Capital funds
33% 26%
Banking funding lines
29% 44%

14 LendInvest 2017 Annual Report
Going ConcernThe directors believe and have
reasonable expectations that the Group has adequate resources, both financial and non-financial, to continue its operational activities for the foreseeable future. Therefore, the financial statements of the Group have been prepared on the going concern basis.
2018 and beyond
We are confident that the Group is well positioned to flourish in the current economic environment. The company is well-capitalised, profitable and has one of the most diverse funding bases of any UK mortgage or alternative lender.
While investment in the areas of technology, infrastructure, people and brand awareness will continue, we will ensure that this is at a pace that ensures we continue to deliver long-term profitability as well as growth. We will not take unnecessary risks for short-term rewards; profitable growth is an integral part of our culture.
Derek MochanChief Financial Officer22 June 2017
“We remain profitable, showing growth while continuing our investment in the business.”
LendInvest Ltd’s statutory results have been prepared in accordance with International Financial Reporting Standards (IFRS) as adopted by the European Union. Certain financial measures disclosed in this report do not have a standardised meaning prescribed by IFRS and may therefore not be comparable to similar measures presented by other issuers. These measures are deemed to be Alternative Performance Measures (“APM”). Where appropriate, certain aspects of our results are presented to reflect the Board’s view of the Group’s underlying performance without distortions caused by non-recurring items that are not reflective of the Group’s ongoing business. These aspects are referred to as “underlying results” for the purposes of the Annual Report. Underlying results should be considered in addition to, and not as a substitute for, the Group’s statutory results and the Group’s presentation of underlying results should not be construed as an indication that future results will be unaffected by exceptional items. In order to ensure equal prominence of both statutory and underlying results, we detail above a comparison of the statutory results to the underlying results.

Our People & Corporate Social
Responsibility

16 LendInvest 2017 Annual Report
Board of Directors & Advisory Board
Christian FaesCo-Founder & Chief Executive Officer
Property lawyer in Australia, and then securitisation and corporate lawyer in London with Clifford Chance and Deutsche Bank.
Mattias LjungmanNon-Executive Director
Partner at Atomico, the multi-billion pound investor that’s backed huge European successful stories like Klarna, Supercell and Rovio.
Ian ThomasCo-Founder & Chief Investment Officer
Chartered surveyor with property development and management with SEGRO Plc and Ballymore Group.
Stephan WilckeSenior Adviser
Niall WassBoard Observer
Stephan was Former Executive Chairman of OneSavings Bank and former CEO of HM Treasury’s Asset Protection Agency. Currently Commissioner of the Jersey Financial Services Commission, and Chairman of Amigo Loans.
Niall Wass is a Partner at Atomico with a focus on helping investee companies execute strategies for long-term scalability. Has held executive roles at Uber, Wonga and Betfair, responsible for significant business transformation or growth strategies.

Strategic Report 17
Christian FaesCo-Founder & Chief Executive Officer
Property lawyer in Australia, and then securitisation and corporate lawyer in London with Clifford Chance and Deutsche Bank.
Rod LockhartManaging Director, LendInvest Capital
A chartered surveyor and former senior director of CBRE Capital Advisors, advising UK and global institutional fund managers and pension scheme clients on real estate investments.
Ruth PearsonGeneral Counsel
Joined LendInvest after 8 years at Simmons & Simmons LLP. As a Managing Associate, Ruth focused on domestic and cross-border corporate, real estate and acquisition financing arrangements.
Derek MochanChief Financial Officer
A KPMG-trained chartered accountant and member of the Institute for Securities and Investment, with 10 years’ experience at GE (including chief financial officer at GE Commercial Finance).
Matthew ToothChief Commercial Officer
Held various senior management positions (including CFO, Head of Business Development and Managing Director) during 15 years at IG Group, the leading online trading business.
Ian ThomasCo-Founder & Chief Investment Officer
Chartered surveyor with property development and management with SEGRO Plc and Ballymore Group.
Johnathan RansomChief Operating Officer
Significant experience in the financial services and real estate lending sectors. Worked in the Real Estate Funds Advisory business at Ernst & Young, and more recently launched a lending business in Barcelona, Spain.
Roy ArmitageHead of Credit
More than 40 years’ experience as a senior mortgage credit executive. Former Head of Risk & Compliance with specialist Buy-to-Let lender, Kensington Mortgages. Previously at JP Morgan and Halifax Mortgages.
Guy EvansChief Technology Officer
A seasoned CTO with senior management experience across a number of innovative technology-enabled businesses serving the financial services sector, including Interactive Investor, Megabuyte and BullionVault.
Executive Team

18 LendInvest 2017 Annual Report
Our Corporate Social Responsibility
As our business grows so does our responsibility to our employees, our community of customers and the industry in which we operate. Over the course of this year we undertook a project to formalise the approach we take, both as a team and a modern business, to fulfilling our social responsibilities, and discover where LendInvest as a company can add real long-term value in our community.
In December 2016, LendInvest was selected to become a 2017 member of Heart Of The City, a non-profit and selective programme that aims to equip companies of all sizes and ages with the tools and incentives they need to build and implement meaningful Corporate Social Responsibility strategies that effect responsible behaviour at every level of the business.
The outcome of our project and the support from Heart of the City is a comprehensive and embedded long-term CSR strategy against which we will monitor and measure our successes over the years to come. The strategy is built on four pillars:
Create an inclusive working environment
We will create a diverse and transparent workplace that strives for, supports and develops all of our employees.
Use our position to advocate and influence positive change
By leveraging our reputation as a responsible and transparent business, we will maintain a meaningful dialogue and collaborate with government, City peers and competitors on the subjects of housing policy and financial innovation.
Support the community we operate and work in
We will use the skills that we have to help people and non-profit organisations in the regions in which we work.
Promote and encourage environmentally responsible behaviour
We aim to minimise our company’s impact on the environment and build our business in a sustainable way.
WORKPLACE
MARKETPLACE
COMMUNITY
ENVIRONMENT

Strategic Report 19
Getting Britain building
Too few homes are built in the UK every year, falling short of ambitious but realistic national targets. Helping to tackle the housing crisis is a fundamental company value, and is a cause that underpins the purpose of our long-term CSR strategy.
Since the last housebuilding boom, the number of small and medium-sized housebuilding companies has fallen by 80%. These property SMEs are key to increasing the supply of new or refurbished homes for both the homebuyer and rental markets. Over the year, we met with and encouraged a series of government stakeholders to reevaluate the treatment of small and medium-sized housebuilding businesses. In particular, through written reports and the work of our Property Development Academy, we actively recommended better policymaking that removes the red-tape hindering smaller developers from getting more homes built on British streets.
Women make up over 40% of the LendInvest team
LendInvest team members regularly raise money for charities that share our values.
Our property SMEs report, campaigning for better policymaking, launched
March 2017

20 LendInvest 2017 Annual Report
Our expanding borrower product range
Since 2008
Bridging Finance
Launched in response to the 2008 financial crisis when short-term finance options for professional property borrowers all but dried up. Bridging Finance is secured against residential and commercial properties located throughout England, Scotland Wales.
November 2016
Development Exit Finance
Tailored to developers whose projects have reached practical completion, but who have not concluded selling the units. Development Exit Finance allows them to switch to short-term, lower-cost funding to maximise the profit opportunity and boost cash flow ahead of beginning their next projects.
February 2017
Refurbishment Finance
Targeted at experienced property professionals who renovate or refit existing properties. Refurbishment Finance is a highly flexible alternative to bridging or development loans. It is lent against a borrower’s gross development value, meaning more leverage for the developer and less capital needed upfront.
June 2017 (after year-end)
3 Year Bridging Finance
Developed as a funding alternative to a conventional buy-to-let loan for experienced borrowers who are looking to raise capital or acquire a lower yielding property. 3-Year Bridging loans were developed in response to customer demand for a longer term product with typical bridging characteristics.
December 2015
Development Finance
Introduced to fill a funding gap for small-scale developers and housebuilders - a market consistently underserved by traditional lenders since the 2008 crash. Development Finance loans lasting up to 24 months are provided to build residential or semi-commercial properties across the UK.
December 2016
Auction Finance
Designed for auction buyers who need loan applications to be fast-tracked by their lender to ensure certainty of funding within tight timeframes. Auction Finance borrowers know that if we say we’ll lend, we’ll be able to do so before the 28-day purchase deadline set by auction houses.
March 2017
Pre-Construction Finance
Designed to support property developers while they apply for planning permissions. Terms last up to 18 months, giving borrowers sufficient time to navigate planning, a process that can be complicated and unpredictable in duration. Having gained planning, we will fast-track Pre-Construction Finance borrowers’ applications for Development Finance.
Short-term property finance is more affordable than ever, but its ability to adapt to a customer’s unique circumstances is still limited. Our strategy this year has been to erase the one-size-fits-all approach to bridging and development finance, bringing to market instead a series of specially designed products, each tailored to suit different categories of borrowers at specific stages of their projects. Instead of directing borrowers to a generic bridging option, we’re fixed on bringing short-term loans to them, in the shapes and sizes that they need it. By year-end we had added four products and since year-end we introduced another, bringing the current total number of loan products in our range to seven. Each new product has been well-received at launch and continues to perform positively.

The LendInvest Property Development Academy

22 LendInvest 2017 Annual Report
The LendInvest Property Development Academy
As recorded in last year’s report, in September 2016 we launched the LendInvest Property Development Academy, the first education course of its kind, as a pragmatic and proactive response to the need to resolve the UK’s growing housing crisis.
As a not-for-profit education centre, our Academy helps aspiring housebuilders to develop the essential knowledge they need to see their developments through to completion on time and on budget. The course covers seven modules, from sourcing land and winning planning permission, to completing construction on time and marketing the end-product.
The first London Academy course in November 2016 was ten times oversubscribed, signalling extraordinary demand for education from the small-scale developer community. By year-end our team had received 400 quality applications from around the country and all London courses were fully subscribed until 2018.
National expansion In response to this overwhelming
demand for our London and Southeast courses, in March 2017 we launched the Academy in four more key cities around the UK. Between May and November 2017, we will host new courses for 100 more ‘students’ at city centre venues in Manchester, Edinburgh, Birmingham and Bristol.
All of our regional courses are carefully designed to resonate with common issues facing developers in their respective regions. The modules for these courses are also taught by industry specialists from the local area who draw on their own highly relevant experience.
Industry support Established in collaboration with
academics from the University of Reading, the leading institution for property education in the country, our Academy has received substantial industry interest and backing from the outset.
By year-end the Academy had been praised by government and we had engaged in a strategic partnership with the UK’s Home Builders’ Federation, who advise on course content and encourage their members to consider applications to future courses.
Additionally we have been able to welcome a wide range of industry figures at the courses, either to run individual modules or give inspiring talks on their own experience. Academy speakers and supporters to date have included: Tom Bloxham MBE (founder of property development firm Urban Splash), Simon Woodroffe (founder of YO!), Pat McAllister (Professor of Real Estate at the University of Reading), and Kirsty Barnes (Head of Banking and Finance at Gowling WLG).
Speakers & supporters include:
Candidate profile
Novice or active developers
Landlord and investors
Others from the property industry
Other sectors
“The Academy is a great initiative in an industry that’s crying out for better education and more help for would-be developers. Perhaps if a course like this had existed when I first started out, I’d have avoided some of the many mistakes I made as I learned on the job.”
Tom Bloxham MBEFounder of UrbanSplash and a past Academy speaker
Academy Highlights (at 15 June 2017)
• 400+ applications from around the UK
• 30+ Industry acclaimed speakers
• 5 cities
• 100+ attendees
44%
25%
28%
3%

Governance

24 LendInvest 2017 Annual Report
Officers and Professional Advisors
Directors Christian Faes
Ian Thomas
Mattias Ljungman
Yahui Zhou (resigned 5 October 2016)
Secretary Christian Faes
Company number 08146929
8 Mortimer Street
Registered Office London
W1T 3JJ
Auditors BDO LLP
Bankers Barclays Bank Plc.

Governance 25
Governance and Conduct
Building an efficient governance and risk management framework is pivotal to the success of our business, whilst ensuring both our people and customers are treated fairly and transparently. Over the year we continued to strengthen and professionalise our approach to corporate and customer governance by ensuring that appropriate risk appetite thresholds are set and establishing greater levels of accountability and better decision-making.
Our approach to corporate governance
We demand the highest business and governance standards throughout the company. As LendInvest grows, so does our approach to corporate governance and its role in delivering our strategic objectives effectively. The Board provides independent assurance on the design, operation and effectiveness of the company’s control framework. The day-to-day responsibility for managing the Group’s business is delegated to the Chief Executive Officer, who is supported by the Executive Committee. The CEO is responsible for ensuring that the Executive Committee implements the decisions and policies approved by the Board and deals with matters within the ordinary course of business. The Board and the Executive Committee are supported by a number of internal committees that meet regularly to ensure excellence is maintained across all functions of the business.
Our approach to risk managementWe operate within a highly competitive
industry and we are driven by our vision to become the leading marketplace for property finance where investors and borrowers benefit from our transparent processes. Our greatest asset is our people, supported by our growing technology base and a mature approach to risk management. Business decisions take into account multiple risks that impact our business, including our conduct and that of our customers, our product governance and suitability, funding diversification, the macroeconomic environment, market regulation, and our reputation. We continue to evolve our processes and build upon a collection of day-to-day tools, processes and methodologies that support our risk appetite, our governance and our people’s ability to identify risk. The following sections give insights into our products, our customers and how we manage those risks.
Online Investment PlatformAs with any investment, investing on our
online platform comes with associated risk. Our priority is ensuring our investors are equipped with sufficient and accurate information about the loans available for investment, and are aware of how the loan may perform throughout its lifecycle. We relaunched the platform interface during the year to clearly present how the different stages
of the loan lifecycle impacts investment performance; we also published easy-to-read educational material on our website, blog and FAQs portal that helps platform investors understand the different stages through which a loan may go in its lifetime.
Since year-end we have implemented a qualification system whereby investors must confirm their eligibility as a sophisticated, high net worth or professional investor before making further investments on the platform. We have introduced this test to ensure our platform customers have the appropriate level of understanding about the risks and conditions that come with the investments they are making. It also ensures there is an appropriate degree of regulatory protection for investors who invest in loans that are managed by our own fund manager, LendInvest Funds Management, which is authorised and regulated by the Financial Conduct Authority.
Discretionary Funds
All investors in the Luxembourg-domiciled SICAV-SIF Real Estate Opportunity Fund receive monthly reports and quarterly updates that offer them detailed insight into the performance of the fund. The monthly report provides a portfolio overview that assesses interest returns and analyses the fund’s performance in the context of the external UK property market. The quarterly update presents a high level, strategic overview of the fund and a comprehensive breakdown of the fund by loan type. The SICAV-SIF is managed by a Luxembourg domiciled fund manager, Luxembourg Fund Partners SA (LFP), which is authorised and regulated by the Commission de Surveillance du Secteur Financiers. LFP adopts stringent risk management practices which are regularly reviewed and assessed by the Luxembourg regulator and by PricewaterhouseCoopers as appointed auditors.
Funding Lines
Our banking funding lines are a mix of committed and uncommitted facilities, and as such we are able to draw these as and when required. Additionally, funds from each credit line are reserved for investment into loans that fully satisfy pre-agreed and specific criteria. Every line is subject to ongoing monitoring and due diligence and the supplier of every funding line requires customised reports and maintains a regular dialogue with
Board of Directors*
Executive Committee*
Disclosure Committee*
Technology Committee*
Risk Committee*
Credit Committee*
*In operation at Year End. The remainder of the committees were formed but had not yet met.
Nomination Committee
Remuneration Committee
Audit Committee

26 LendInvest 2017 Annual Report
us. Funding line investors have access to a portfolio reporting system that reports on key information pertaining to individual loans, including valuations, drawdowns, cumulative loan-to-value ratio and status.
Borrowers
There are many risks associated with property lending and investing, and we take managing such risks with our borrowers very seriously. We identify three main risk areas and employ the highest governance practices to safeguard our customers and the business against all:
Property market riskThe value of UK property can go up as
well as down; if it falls, a borrower may
find it difficult to meet their repayment obligations. We plan for this risk by issuing loans worth no more than 75% of the property’s value, securing all loans against property, understanding the market dynamics of the property’s local area, and obtaining a professional and independent valuation by a RICS registered valuer.
Borrower riskLoan repayments are contingent on
a borrower’s successful exit from the underlying property project. Before committing to a loan, we examine the viability of the borrower’s payment schedule and the intended exit route; during the term of the loan, we monitor carefully the borrower’s ability to service the loan on time and in full.
Financial crimeFinancial crime is a constant threat
in UK property lending. We carry out comprehensive searches on (and continually monitor) all our loan applicants and the validity and suitability of their property projects. We adopt data analytics from industry leading data providers and two of the UK’S leading fraud detection agencies to perform initial and ongoing due diligence of our customers, and also regularly meet our customers face-to-face.

Governance 27
Directors Report
The directors present their Report together with the audited annual financial statements of LendInvest Limited (the ‘Group’) for the year ended 31 March 2017. The Company was incorporated on the 17 July 2012. It commenced developing a platform to facilitate financing property related loans, which became operational in September 2013.
The Company paid no dividends during the year to ordinary shareholders (2016: nil).
The Company and Group made £3,000 of political donations to the Conservative and Unionist Party during the year (2016: £2,000 to the Conservative and Unionist Party).
Post balance sheet events of the Company are noted within the Strategic Report section: Chief Financial Officer’s review.
We review our approach to the management of financial, credit, liquidity and other related risks within the Strategic Report section: Governance & Conduct
Going ConcernOn the basis of their assessment of the
Group and Company’s financial position of the enquiries made of the directors of LendInvest Limited, the Company’s directors have a reasonable expectation that the Group will be able to continue in operational existence for the foreseeable future.
Further information supporting the going concern basis may be found in note 1 to the financial statements.
DirectorsThe directors of the Company during
the year and for the period up to the date of this report were:
— Christian Faes
— Ian Thomas
— Mattias Ljungman
— Yahui Zhou (resigned 5 October 2016)
AuditorsEach of the persons who is a director
at the date of approval of this report confirms that:
— so far as the director is aware, there is no relevant audit information of which The Group and Company’s auditor is unaware; and
— the director has taken all the steps that he/she ought to have taken as a director in order to make himself/herself aware of any relevant audit information and to establish that the Group and Company’s auditor is aware of that information.
This confirmation is given and should be interpreted in accordance with the provisions of s418 of the Companies Act 2006.
BDO LLP have expressed their willingness to continue as auditor.
Approved by the Board of Directors
Ian ThomasDirector22 June 2017

28 LendInvest 2017 Annual Report
Financial Statements
Financial Statements 29
Directors’ responsibilities statement
The directors are responsible for preparing the strategic report, the directors’ report and the financial statements in accordance with applicable law and regulations.
Company law requires the directors to prepare financial statements for each financial year. Under that law the directors have elected to prepare the financial statements in accordance with International Financial Reporting Standards (IFRS) as adopted by the European Union. Under Company law the directors must not approve the financial statements unless they are satisfied that they give a true and fair view of the state of affairs of the Group and Company and of the profit or loss of the Group and Company for that period.
In preparing these financial statements, the directors are required to:
— select suitable accounting policies and then apply them consistently;
— make judgements and accounting estimates that are reasonable and prudent;
— state whether they have been prepared in accordance with IFRSs as adopted by the European Union, subject to any material departures disclosed and explained in the financial statements;
— prepare the Group and Company financial statements on the going concern basis unless it is inappropriate to presume that the Group and Company will continue in business.
The directors are responsible for keeping adequate accounting records that are sufficient to show and explain the Group and Company’s transactions and disclose with reasonable accuracy at any time the financial position of the Group and Company and enable them to ensure that the financial statements comply with the Companies Act 2006. They are also responsible for safeguarding the assets of the Group and Company’s and hence for taking reasonable steps for the prevention and detection of fraud and other irregularities.

30 LendInvest 2017 Annual Report
standards require us to comply with the Financial Reporting Council’s (FRC’s) Ethical Standards for Auditors. Scope of the audit of the financial statements
A description of the scope of an audit of financial statements is provided on the FRC’s website at www.frc.org.uk/auditscopeukprivate.
Opinion on financial statementsIn our opinion:- the financial statements give a true
and fair view of the state of the group’s and the parent company’s affairs as at 31 March 2017 and of the group’s loss for the year then ended;
- the group financial statements have been properly prepared in accordance with IFRSs as adopted by the European Union;
- the parent company financial statements have been properly prepared in accordance with IFRSs as adopted by the European Union and as applied in accordance with the provisions of the Companies Act 2006; and
- the financial statements have been prepared in accordance with the requirements of the Companies Act 2006.
Opinion on other matters prescribed by the Companies Act 2006
In our opinion, based on the work undertaken in the course of the audit:
- the information given in the strategic report and directors’ report for the financial year for which the financial statements are prepared is consistent with the financial statements; and
- the strategic report and directors’ report have been prepared in accordance with applicable legal requirements.
Matters on which we are required to report by exception
In the light of the knowledge and understanding of the group and the parent company and its environment obtained in the course of the audit, we have not identified material misstatements in the strategic report or the directors’ report.
We have nothing to report in respect of the following matters where the Companies Act 2006 requires us to report to you if, in our opinion:
- adequate accounting records have not been kept by the parent company, or
returns adequate for our audit have not been received from branches not visited by us; or
- the parent company financial statements are not in agreement with the accounting records and returns; or
- certain disclosures of directors’ remuneration specified by law are not made; or
- we have not received all the information and explanations we require for our audit.
Matthew Hopkins (Senior Statutory Auditor)For and on behalf of BDO LLP, Statutory Auditor,London, United Kingdom22 June 2017
Independent Auditor’s Report to the Members of LendInvest Limited
We have audited the financial statements of LendInvest Limited for the year ended 31 March 2017 which comprise the consolidated and company Statement of Comprehensive Income, the consolidated and company Statement of Financial Position, the consolidated and company Statement of Cash Flows, the consolidated Statement of Changes in Equity and the related notes. The financial reporting framework that has been applied in their preparation is applicable law and International Financial Reporting Standards as adopted by the European Union (IFRS) as regards the parent company financial statements, as applied in accordance with the provisions of the Companies Act 2006.
This report is made solely to the company’s members, as a body, in accordance with Chapter 3 of Part 16 of the Companies Act 2006. Our audit work has been undertaken so that we might state to the company’s members those matters we are required to state to them in an auditor’s report and for no other purpose. To the fullest extent permitted by law, we do not accept or assume responsibility to anyone other than the company and the company’s members as a body, for our audit work, for this report, or for the opinions we have formed.
Respective responsibilities of directors and auditors
As explained more fully in the statement of directors’ responsibilities, the directors are responsible for the preparation of the financial statements and for being satisfied that they give a true and fair view. Our responsibility is to audit and express an opinion on the financial statements in accordance with applicable law and International Standards on Auditing (UK and Ireland). Those
BDO LLP is a limited liability partnership registered in England and Wales (with registered number OC305127).

Financial Statements 31
Company Statement of Profit and Loss and Other Comprehensive Income for the year ended 31 March 2017
Consolidated Statement of Profit and Loss and Other Comprehensive Income for the year ended 31 March 2017
Note Year ended 31 March 2017
Year ended 31 March 2016
£’000 £’000
Revenue 6 15,029 12,380
Cost of sales (2,037) (1,940)
Gross profit 12,992 10,440
Administrative expenses 8 (13,106) (8,133)
(Loss) / Profit from operations (114) 2,307
Finance expense* 11 (1,102) (932)
Finance income 11 35 12
(Loss) / Profit before tax (1,181) 1,387
Tax credit / (expense) 12 18 (261)
(Loss) / Profit for the period (1,163) 1,126
Other comprehensive income:
There were no items that will or may be reclassified subsequently to profit or loss
- -
Other comprehensive income for the year, net of tax - -
Total comprehensive (loss) / income for the year (1,163) 1,126
Note Year ended 31 March 2017
Year ended 31 March 2016
£’000 £’000
Revenue 6 22,111 18,691
Cost of sales (8,685) (6,812)
Gross profit 13,426 11,879
Administrative expenses 8 (13,374) (8,485)
Profit from operations 52 3,394
Finance expense* 11 (1,102) (932)
Finance income 11 35 12
(Loss) / Profit before tax (1,015) 2,474
Tax expense 12 (45) (479)
(Loss) / Profit for the period (1,060) 1,995
Other comprehensive income:
There were no items that will or may be reclassified subsequently to profit or loss
- -
Other comprehensive income for the year, net of tax - -
Total comprehensive (loss) / income for the year (1,060) 1,995
*Finance expense represents dividends and interest paid to preference shareholders.All amounts relate to continuing activities and to owners of the Group.
*Finance expense represents dividends and interest paid to preference shareholders.All amounts relate to continuing activities and to owners of the Group.

32 LendInvest 2017 Annual Report
Consolidated Statement of financial position as at 31 March 2017
Note Year Ended March 2017 Year ended March 2016
£’000 £’000
Assets
Cash and cash equivalents 17 12,714 17,447
Trade and other receivables 16 5,518 4,304
Loans and advances 18 92,847 93,724
Property, plant and equipment 14 1,034 980
Deferred taxation 12 37 -
Total assets 112,150 116,455
Liabilities
Trade and other payables 19 (12,269) (9,241)
Interest bearing liabilities 20 (91,504) (97,774)
Deferred taxation 12 - (36)
Total liabilities (103,773) (107,051)
Net Assets 8,377 9,404
Equity
Employee Share Reserve 50 27
Share Capital 21 - -
Share Premium 6,441 6,414
Retained earnings 23 1,886 2,963
Total Equity 8,377 9,404
The financial statements on pages 31 to 56 were approved and authorised for Issue by the Board of Directors on 22 June 2017 and were signed on its behalf by:
Ian ThomasDirectorCompany Registration No. 08146929

Financial Statements 33
Company Statement of financial position as at 31 March 2017
Note Year Ended March 2017 Year ended March 2016
£’000 £’000
Assets
Cash and cash equivalents 17 8,572 14,268
Trade and other receivables 16 7,280 2,676
Loans and advances 18 - 18,356
Property, plant and equipment 14 1,034 980
Investment in subsidiaries 15 5,110 5,010
Deferred taxation 12 68 -
Total assets 22,064 41,290
Liabilities
Trade and other payables 19 (14,617) (12,936)
Interest bearing liabilities 20 - (19,758)
Deferred taxation 12 - (36)
Total liabilities (14,617) (32,730)
Net Assets 7,447 8,560
Equity
Employee Share Reserve 50 27
Share Capital 21 - -
Share Premium 6,441 6,414
Retained earnings 23 956 2,119
Total Equity 7,447 8,560
The financial statements on pages 31 to 56 were approved and authorised for Issue by the Board of Directors on 22 June 2017 and were signed on its behalf by:
Ian ThomasDirectorCompany Registration No. 08146929

34 LendInvest 2017 Annual Report
Consolidated statement of cash flows for the year ended 31 March 2017
Note Year ended 31 March 2017
Year ended 31 March 2016
£’000 £’000
Cash flows from operating activities
(Loss) / profit for the period (1,060) 1,995
Adjusted for:
Depreciation of property, plant and equipment 14 134 174
Company share and share option schemes 25 50 27
Finance income 11 (35) (12)
Distribution of profits (17) (136)
Income tax expense 12 45 479
Change in working capital
Decrease/ (increase) in gross loans and advances 877 (47,524)
(Increase) in trade and other receivables (1,133) (2,020)
Increase in trade and other payables 3,248 6,450
Income Taxes Paid (419) (578)
Cash from operations 1,690 (41,145)
Cash flow from investing activities
(Purchase) of property, plant and equipment 14 (187) (1,139)
Interest received 11 35 12
Net cash from financing activities (152) (1,127)
Cash flow from financing activities
Issue of shares - 6,414
(Repaying) / Proceeds from raising interest bearing liabilities (6,270) 50,049
Net cash from financing activities (6,270) 56,463
Net (decrease) / increase in cash and cash equivalents (4,733) 14,190
Cash and cash equivalents at beginning of period 17 17,447 3,257
Cash and cash equivalents at end of period 17 12,714 17,447

Financial Statements 35
Company statement of cash flows for the year ended 31 March 2017
Note Year ended 31 March 2017
Year ended 31 March 2016
£’000 £’000
Cash flows from operating activities
(Loss) / profit for the period (1,163) 1,126
Adjusted for:
Depreciation of property, plant and equipment 14 134 174
Company share and share option schemes 25 50 27
Finance income 11 (35) (12)
Income tax (credit) / expense 12 (18) 261
Change in working capital
Decrease/ (increase) in gross loans and advances 18,356 (18,356)
(Increase) in trade and other receivables (4,523) (1,335)
Increase in trade and other payables 1,677 10,828
Income Taxes Paid (200) (199)
Cash from operations 14,278 (7,486)
Cash flow from investing activities
(Purchase) of property, plant and equipment 14 (187) (1,162)
Increase in other investments 11 (100) (5,010)
Interest received 35 12
Net cash from financing activities (252) (6,172)
Cash flow from financing activities
Issue of shares - 6,414
(Repaying) / Proceeds from raising interest bearing liabilities (19,722) 19,724
Net cash from financing activities (19,722) 26,138
Net (decrease) / increase in cash and cash equivalents (5,696) 12,480
Cash and cash equivalents at beginning of period 17 14,268 1,788
Cash and cash equivalents at end of period 17 8,572 14,268

36 LendInvest 2017 Annual Report
Consolidated statement of changes in equity for the year ended 31 March 2017
Ordinary Share capital
Preference share capital
Ordinary Share Premium
Preference share premium
Share based payment reserve
Retained earnings
Total
£’000 £’000 £’000 £’000 £’000 £’000 £’000
Balance at 31 March 20151,104 1,104
Profit for the period - - - - - 1,995 1,995
Share of LLP profits - - - - - (136) (136)
Recognition of employee share options scheme - - - - 27 - 27
Issues of shares - - - 6,414 - - 6,414
Balance as at 31 March 2016 - - - 6,414 27 2,963 9,404
Profit/ (loss) for the period - - - - - (1,060) (1,060)
Share of LLP profits - - - - - (17) (17)
Recognition of employee share options schemes - - - 27 23 - 50
Balance at 31 March 2017 - - - 6,441 50 1,886 8,377

Financial Statements 37
Notes forming part of the financial statements for the year ended 31 March 2017
1. Basis of preparation and significant accounting policies
General informationLendInvest Limited is a private Company
incorporated on 17 July 2012 in the United Kingdom under the Companies Act. The address of its registered office is given on page 24.
These consolidated financial statements have been approved for issue by the Board of Directors on 22 June 2017.
Going concernThe Group’s business activities together
with the factors likely to affect its future development and position are set out in the Chief Executive Officer’s review, Chief Investment Officer’s review and Chief Financial Officer’s review sections of the Strategic Report on pages 7 to 14. It is on this basis that the directors have continued to prepare the accounts on the going concern basis.
Basis of preparationThe Group maintains its books and
records in pound sterling (“£”). The Group presents its annual accounts in conformity with United Kingdom laws and regulations.
These annual financial statements have been prepared in accordance with International Financial Reporting Standards (“IFRS”) as adopted by the European Union.
The financial statements have been prepared on the historical cost basis. The preparation of financial statements in conformity with IFRS requires the use of certain critical accounting estimates. It also requires management to exercise its judgement in the process of applying the Group’s accounting policies. The areas involving a higher degree of judgment or complexity, or areas where assumptions and estimates are significant to the financial statements are disclosed in note 1.
The Company has consistently applied the accounting policies used in the preparation of its IFRS statement of financial position throughout all periods presented.
Critical accounting estimates and judgements
The preparation of financial statements in accordance with IFRS requires the use of estimates. It also requires management to exercise judgement in applying the accounting policies. The judgements and assumptions that are considered to be the most important to the portrayal of the Group’s financial condition are those relating to loan impairment provisions, conduct risk, legal provisions, deferred tax and revenue and interest recognition.
Foreign currencyIn terms included in the financial statements are measured using the currency of the primary economic environment in which they operate (their “functional currency”) are recorded at the rates ruling when the transactions occur. Foreign currency monetary assets and liabilities are translated at the rates ruling at the reporting date. Exchange differences arising on the retranslation of unsettled monetary assets and liabilities are recognised immediately in profit or loss. The financial statements are presented in pounds sterling, which is the Group’s functional currency.
Investments in subsidiariesInvestments held as fixed assets are
stated at cost less any provision for impairment. Where the recoverable amount of the investment is less than the carrying amount, impairment is recognised.
Basis of consolidationSubsidiary companies and other controlled entities
The consolidated financial statements incorporate the financial statements of the Company and entities controlled by the Company.
Where the company has control over an investee, it is classified as a subsidiary. The company controls an investee if all three of the following elements are present: power over the investee, exposure to variable returns from the investee, and the ability of the investor to use its power to affect those variable returns. Control is reassessed whenever facts and circumstances indicate that there may be a change in any of these elements of control.
The subsidiaries listed in note 15 are consolidated as the Group controls 100%
of the voting share capital of each, is subject to variable returns of each and has the power to influence those variable returns. LendInvest Trading Partners LLP is controlled by LendInvest Capital Manangement Ltd, who owns the equity in the LLP, whose returns are variable and are controlled by the Group.
Intra-Group transactions, balances and unrealised gains or losses are eliminated on consolidation.
Business combinationsThe consolidation that occurred in
July 2015 is of a combination of entities under common control. Business combinations under common control are excluded from the scope of IFRS 3 and accordingly merger accounting was applied to the consolidation. Subsidiaries were consolidated from inception of the respective subsidiaries and the acquisition method of consolidation was not applied.
A business combination involving entities or businesses under common control is a business combination in which all of the combining entities or businesses are ultimately controlled by the same party or parties both before and after the business combination, and that control is not transitory.
Revenue recognitionRevenue represents income from
lenders and borrowers and for the provision of finance.
Revenues recognised on loans held by related and third parties are recognised as follows:
- Arrangement fees earned from borrowers are amortised over the life of the loan or recognised immediately upon sale of the loan.
- Service revenue, representing introduction and other broker fees, is recognised evening over the life of the loan or recognised immediately upon sale of the loan.
Revenue comprises the fair value of the consideration received or receivable in the ordinary course of the Group’s activities.
Interest income on loans recognised on balance sheet will be accounted for under IAS 39 on an EIR basis, inclusive of directly attributable incremental transaction costs and fees including arrangement and broker fees, valuation and solicitor costs, discounts and premiums where appropriate.
The EIR basis spreads the interest

38 LendInvest 2017 Annual Report
income over the expected life of each instrument. The EIR is the rate that, at the inception of the instrument, exactly discounts expected future cash payments and receipts through the expected life of the instrument back to the initial carrying amount.
When calculating the EIR, the Group estimates cash flows considering all contractual terms of the instrument (for example, prepayment options) but does not consider assets’ future credit losses.
All revenue recorded in the financial statements is generated in the UK and sourced from transactions relating to property loans. Fees on these transactions are calculated based on the above revenue recognition policy.
The Group considers its provisioning policy in accordance with IAS 39 – Financial instruments: Recognition and Measurement on a specific and collective basis based on the incurred loss experience of the Group or the transferred/acquired portfolio.
Property, plant and equipmentItems of property, plant and equipment
are initially recognised at cost. As well as the purchase price, cost includes directly attributable costs and the estimated present value of any future unavoidable costs of dismantling and removing items. The corresponding liability is recognised within provisions.
Depreciation is provided on all other items of property, plant and equipment so as to write off their carrying value over their expected useful economic life. It is provided at the following rates:
Computer equipment 33%-50% per annum straight line
Fixtures and fittings 20%-50% per annum straight line
Leasehold improvements lesser of lease period or useful life
Computer and telephony software 20%-50% per annum straight line
Interest ReceivableInterest receivable on bank deposits is recognised on an accrual basis within “Finance Income” in the statement of comprehensive income.
ExpensesExpenses are recognised as an expense
in the statement of comprehensive income in the period in which they are incurred (on an accruals basis).
Operating leasesRentals payable under operating leases are charged to income on a straight- line basis over the term of the relevant lease. Contingent rentals arising under operating leases are recognised as an expense in the period in which they are incurred.In the event that lease incentives are received to enter into operating leases, such incentives are recognised as a liability. The aggregate benefit of incentives is recognised as a reduction of rental expense on a straight-line basis, except where another systematic basis is more representative of the time pattern in which economic benefits from the leased asset are consumed.
Financial instrumentsFinancial assets
Financial assets are categorised under IAS 39 as financial assets at fair value through profit or loss, loans and receivables financial assets, and available-for sale financial assets as appropriate. The Group determines the classification of its financial assets at initial recognition.
Financial assets are derecognised only when the contractual rights to the cash flows from the financial assets expire or the Group transfers substantially all risks and rewards of ownership.
Financial assets recognised in the statement of financial position as trade and other receivables are classified as loans and receivables. They are recognised at fair value and subsequently measured at amortised cost less provision for impairment.
A provision for impairment is made when there is objective evidence (such as the probability of insolvency or significant financial difficulties of the debtor) that the Group will not be able to collect all of the amounts due under the original terms of the contract. The Group considers evidence of impairment at both a specific asset and collective level. All individually significant financial assets are assessed for specific impairment. Assets that are not individually significant are then collectively assessed for impairment by grouping together financial assets (carried at amortised cost) with similar credit risk characteristics, taking into account
asset type, industry, geographic location, collateral type, past-due status, historical loss experience and other relevant factors.
Impaired debts are derecognised when they are assessed as uncollectible. If in a subsequent period the amount of the impairment loss decreases and the decrease can be related objectively to an event occurring after the impairment was recognised, the previously recognised impairment loss is reversed, to the extent that the carrying value of the asset does not exceed its amortised cost at the reversal date. Any subsequent reversal of an impairment loss is recognised in the Statement of Comprehensive Income.
Cash and cash equivalents are also classified as financial assets. Cash and cash equivalents includes cash in hand, deposits held at call with banks and other short-term highly liquid investments with original maturities of three months or less. The carrying amount of these assets approximates their fair value.
The Group assesses at each financial position date whether there is objective evidence that a financial asset or group of financial assets is impaired. If there is objective evidence (such as significant financial difficulty of the obligor, breach of contract, or it becomes probable that the debtor will enter bankruptcy), the asset is tested for impairment. The amount of the loss is measured as the difference between the asset’s carrying amount and the present value of estimated future cash flows (excluding future expected credit losses that have not been incurred) discounted at the financial asset’s original effective interest rate (that is, the effective interest rate computed at initial recognition).
Financial liabilitiesA financial liability is derecognised
when the obligation under the liability is discharged or cancelled or expires. Financial liabilities included in trade and other payables and interest bearing liabilities are recognised initially at fair value and subsequently at amortised cost. The fair value of a non- interest bearing liability is its discounted repayment amount. If the due date of the liability is less than one year, discounting is omitted.
The Group’s financial assets and financial liabilities are disclosed in note 26.

Financial Statements 39
Provisions, contingent liabilities and contingent assets
Provisions are liabilities of uncertain timing or amount and contingent liabilities and contingent assets are dependent on one or more uncertain future events. Provisions are recognised when the Group has a present legal or constructive obligation as a result of a past event, it is probable that an outflow of resources embodying economic benefits will be required to settle the obligation and a reliable estimate can be made of the amount of the obligation. The amount recognised as provisions is the best estimate of the consideration required to settle the present obligation at the end of the reporting period taking into account the risks and uncertainties surrounding the obligation.
Share capitalFinancial instruments issued by the
Group are classified as equity only to the extent that they do not meet the definition of a financial liability or financial asset.
Other long-term service benefitsOther employee benefits that are
expected to be settled wholly within 12 months after the end of the reporting period are presented as current liabilities.
Other employee benefits that are not expected to be settled wholly within 12 months after the end of the reporting period are presented as non- current liabilities and calculated using the projected unit credit method and then discounted using yields available on high quality corporate bonds that have maturity dates approximating to the expected remaining period to settlement.
Share-based paymentsWhere the issuance of shares or rights
to shares are awarded to employees, the fair value of the shares or the fair value of the options at the date of grant is charged to the statement of comprehensive income over the vesting period. Non-market vesting conditions are taken into account by adjusting the number of equity instruments expected to vest at each reporting date so that, ultimately, the cumulative amount recognised over the vesting period is based on the number of shares or options that eventually vest. Non-vesting conditions and market vesting conditions are factored into the fair value of the shares or options granted.
As long as all other vesting conditions are satisfied, a charge is made irrespective of whether the market vesting conditions are satisfied. The cumulative expense is not adjusted for failure to achieve a market vesting condition or where a non-vesting condition is not satisfied.
Where the terms and conditions of options are modified before they vest, the increase in the fair value of the options, measured immediately before and after the modification, is also charged to the statement of comprehensive income over the remaining vesting period.
Leased assetsWhere substantially all of the risks and
rewards incidental to ownership of a leased asset have been transferred to the Group (a “finance lease”), the asset is treated as if it had been purchased outright. The amount initially recognised as an asset is the lower of the fair value of the leased property and the present value of the minimum lease payments payable over the term of the lease. The corresponding lease commitment is shown as a liability. Lease payments are analysed between capital and interest. The interest element is charged to the statement of comprehensive income over the period of the lease and is calculated so that it represents a constant proportion of the lease liability. The capital element reduces the balance owed to the lessor. Where substantially all of the risks and rewards incidental to ownership are not transferred to the Group (an “operating lease”), the total rentals payable under the lease are charged to the statement of comprehensive income on a straight-line basis over the lease term. The aggregate benefit of lease incentives is recognised as a reduction of the rental expense over the lease term on a straight-line basis
Current and deferred taxThe tax expense for the period comprises
current and deferred tax. Current tax is provided at amounts expected to be paid (or recovered) using the tax rates and laws that have been enacted or substantively enacted by the year end date.
Deferred income tax is provided in full, using the liability method, on temporary differences arising between the tax bases of assets and liabilities and their carrying amounts in the financial statements. However, deferred tax is not accounted for if it arises from initial recognition of
an asset or liability in a transaction other than a business combination that at the time of the transaction affect neither accounting nor taxable profit and loss. Deferred tax is determined using tax rates and laws that have been enacted or substantially enacted at the year-end date and are expected to apply when the related deferred tax asset is realised or the deferred tax liability is settled. Deferred tax balances are not discounted. Deferred tax assets are recognised to the extent that it is probable that future taxable profit will be available against which the temporary differences can be utilised.
DividendsDividends are recognised when they
become legally payable. In the case of interim dividends to ordinary share shareholders, this is when declared by the directors. In the case of final dividends to ordinary share shareholders, this is when declared by directors and approved by the shareholders at the AGM. In the case of preferred shares, dividends are accrued over the period to which they relate.
2. Changes in accounting policies and disclosures
New standards and amendmentsThere have been no new standards
having a material impact on the financial statements for the year.
The following standards and amendments to existing standards have been published, but in some cases, not yet adopted by the EU. They are mandatory from the financial period beginning on or after the effective dates shown below but are not currently relevant to the Company (although they may affect the accounting for future transactions and events).
The Company’s assessment of the impact of these new standards and interpretations is set out below.
IFRS 9 – Financial instrumentsIFRS 9 Financial Instruments issued on
24 July 2014 is the IASB’s replacement of IAS 39 Financial Instruments: Recognition and Measurement. The standard includes requirements for recognition and measurement, impairment, de-recognition and general hedge accounting.
The key changes relate to:- Financial assets: Financial assets will

40 LendInvest 2017 Annual Report
be held at either fair value or amortised cost, except for equity investments not held for trading and certain debt instruments, which may be held at fair value through other comprehensive income;
- Financial liabilities: Gains and losses arising from changes in own credit on non-derivative financial liabilities designated at fair value through profit or loss will be excluded from the income statement and instead taken to other comprehensive income;
- Impairment: Credit losses expected at the balance sheet date (rather than only losses incurred in the year) on loans, debt securities and loan commitments not held at fair value through profit or loss will be reflected in impairment allowances; and
- Hedge accounting: Hedge accounting will be more closely aligned with financial risk management.
Adoption is not mandatory until periods beginning on or after 1 January 2018. The directors have undertaken work to develop the Group’s approach to implementation. IFRS 9 adoption will result in impairment being recognised earlier than is the case under IAS 39 because it requires expected losses to be recognised before the loss event arises. Measurement will involve increased complexity and judgement including estimation of probabilities of default, loss given default, a range of unbiased future economic scenarios, estimation of exposure at default and assessing increase in credit risk. The directors are also currently considering the impact of IFRS 9 on Group’s risk appetite and stress testing assumptions. At present it is not practical to disclose reliable financial impact estimates until the implementation programme is further advanced, but the Directors’ of the Group anticipate that IFRS 9’s impact on the Group will be in line with the industry, and considerably less significant compared to traditional lending institutions.
IFRS 15 – Revenue from contracts with customers
IFRS 15 Revenue will replace IAS 18 Revenue and IAS 11 Construction Contracts. It applies to all contracts with customers except leases, financial instruments and insurance contracts.
IFRS 15 establishes the principles that an entity shall apply to report useful information to users of financial
statements about the nature, amount, timing, and uncertainty of revenue and cash flows arising from a contract with a customer.
Adoption is not mandatory until periods beginning on or after 1 January 2018.
The directors of the Group do not anticipate that the application of this standard will have a material impact on the Group’s financial statements.
IFRS 16 - Leases IFRS 16 sets out the principles for the
recognition, measurement, presentation and disclosure of leases for both parties to a contract, i.e. the customer (‘lessee’) and the supplier (‘lessor’).
All leases result in a company (the lessee) obtaining the right to use an asset at the start of the lease and, if lease payments are made over time, also obtaining financing.
Accordingly, IFRS 16 eliminates the classification of leases as either operating leases or finance leases as is required by IAS 17 and, instead, introduces a single lessee accounting model. Applying that model, a lessee is required to recognise:
a) assets and liabilities for all leases with a term of more than 12 months, unless the underlying asset is of low value; and
b) depreciation of lease assets separately from interest on lease liabilities in the income statement.
IFRS 16 substantially carries forward the lessor accounting requirements in IAS 17. Accordingly, a lessor continues to classify its leases as operating leases or finance leases, and to account for those two types of leases differently.
Adoption is not mandatory until periods beginning on or after 1 January 2019.
IFRS 16 replaces the previous leases Standard, IAS 17 Leases, and related Interpretations.
The directors of the Group do not anticipate that the application of this standard will have a material impact on the Group’s financial statements.
Amendments to IFRS 2 (Classification and Measurement of Share-based Payment Transactions)
The amendments provide clarification on the accounting for:
• The effects of vesting and non-vesting conditions on the measurement of cash-settled share-based payments – guidance now requires the same approach used for equity settled share based payments
to be followed for cash settled share based payments.
• Share-based payment transactions with a net settlement feature for withholding tax obligations.
- An exception has now been added to IFRS 2 so that a share-based payment where the entity settles the share-based payment arrangement net is classified as equity-settled in its entirety provided the share-based payment would have been classified as equity-settled had it not included the net settlement feature.- A modification to the terms and conditions of a share-based payment that changes the classification of the transaction from cash-settled to equity-settled - Guidance now added to clarify that:- On such modifications, the original liability recognised in respect of the cash-settled share-based payment is derecognised and the equity-settled share-based payment is recognised at the modification date fair value to the extent services have been rendered up to the modification date.- Any difference between the carrying amount of the liability as at the modification date and the amount recognised in equity at the same date would be recognised in profit and loss immediately.
The amendments are to be applied prospectively, retrospective application is allowed if this is possible without the use of hindsight. If an entity applies the amendments retrospectively, it must do so for all of the amendments.
Adoption is not mandatory until periods beginning on or after 1 January 2018.
The directors of the Group do not anticipate that the application of these amendments will have a material impact on the Group’s financial statements.
3. Financial instruments
Principal financial instrumentsThe principal financial instruments
used by the Group, from which financial instrument risk arises, are: loans and advances, trade and other receivables,

Financial Statements 41
cash and cash equivalents, loans and borrowings and trade and other payables.
Categorisation of financial assets and financial liabilities
All financial assets of the Group are carried at amortised cost as at 31 March 2017 and 31 March 2016 due to the nature of the asset. All financial liabilities of the Group are carried at amortised cost as at 31 March 2017 and 31 March 2016 due to the nature of the liability.
Financial instruments not measured at fair value
Financial instruments measured at amortised cost, rather than fair value, include cash and cash equivalents, trade and other receivables, mortgage loans, trade and other payables and loans and borrowings. Due to their short- term nature, the carrying value of cash and cash equivalents, trade and other receivables, loans and advances, trade and other payables and interest bearing liabilities approximates their fair value.
4. Financial risk management
General objectives, policies and processes
The board of directors have overall responsibility for the establishment and oversight of the Group’s risk management framework. The risk management policies are established to identify and analyse the risks faced by the Group, to set appropriate risk limits and controls, and to monitor risks and ensure any limits are adhered to. The Group’s activities are reviewed regularly and potential risks are considered.
The overall objective of the Board is to set policies that seek to reduce risk as far as possible without unduly affecting the business’s competitiveness and flexibility.
Risk factorsThe Group has exposure to the following
risks from its use of financial instruments: credit risk, liquidity risk, market risk (including collateral quality risk, interest rate risk and other price risk).
Further details regarding these policies are set out below:
Credit risk managementCredit risk is the risk of financial loss to
the Group if a customer or counterparty to a financial instrument fails to meet
its contractual obligations, and arises principally from the Group’s receivables from customers and cash and cash equivalents held at banks.
The Group’s maximum exposure to credit risk by class of financial asset is as follows:
31 March 2017 31 March 2016
£’000 £’000
Assets
Loans and advances 92,847 93,724
Trade and other receivables
1,805 2,422
Cash and cash equivalents
12,714 17,447
107,366 113,595
Other receivables principally comprise of amounts due from related companies. The recoverability of these amounts is reviewed on an ongoing basis.
The fair value of cash and cash equivalents at 31 March 2017 and 31 March 2016 approximates the carrying value. Further details regarding cash and cash equivalents can be found in note 17. The company manages its exposure to credit losses by assessing borrower’s affordability of repayment of loans and advances, borrower’s risk profile, and stability during our underwriting process. Impairments are monitored and provided for using various techniques The credit policy is designed to ensure that the credit process is efficient for the applicant while providing the Group with the necessary details to make an informed credit decision. Credit risk relating to cash and cash equivalents is mitigated as cash and cash equivalents are held with reputable institutions.
Liquidity risk managementLiquidity risk is the risk that the Group
will not be able to meet its financial obligations as they fall due. The Group’s approach to managing liquidity is to ensure, as far as possible, that it will always have sufficient liquidity to meet its liabilities when due, under both normal and stressed conditions, without incurring unacceptable losses or risking damage to the Group’s position.
The Group’s liquidity position is monitored and reviewed on an ongoing basis by the directors and the executive committee.
The amounts disclosed in the below
tables are the contractual undiscounted cash flows.
The maturity analysis of financial assets and liabilities at 31 March 2017 and 31 March 2016 is as follows:
31 March 2017 31 March 2016
£’000 £’000
Financial assets – due within one year
Loans and advances 72,158 78,119
Trade and other receivables
1,805 2,422
Cash and cash equivalents*
9,145 13,253
Financial assets – due post one year
Loans and receivables
20,689 15,605
103,797 109,399
Financial liabilities – due within one year
Trade and other payables
12,269 9,205
Interest bearing liabilities
55,254 80,740
Financial liabilities – due post one year
Interest bearing liabilities
36,250 17,000
103,773 106,945
*Does not include trustee account bal-ances. See note 17. Market risk management
Market risk is the risk that the fair value of future cash flows of a financial instrument will fluctuate because of changes in market prices
a) Loan price and interest rate riskThe Group is exposed to market risk
with respect to financial instruments when either retained by the Group, or for the period between originating the instrument and selling it to investors. Due to the speed with which the Group sells originated loans to investors, there is not significant exposure from such activities. All interest rates on loans are fixed, and matched with fixed borrowings from investors or banks. The Group does not use interest rate swaps.
b) Collateral price riskThe risk of movements in the price
of the underlying collateral secured by the Group against loans to borrowers is actively managed by the Group. Security over the property is registered with the
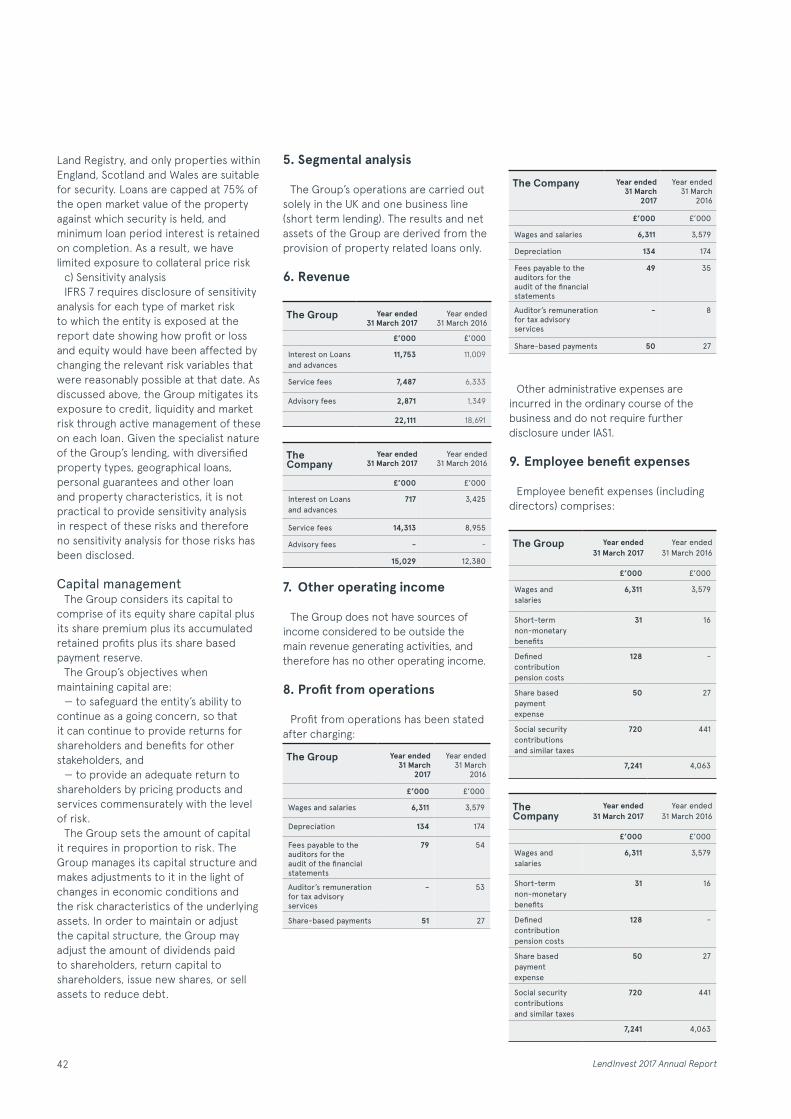
42 LendInvest 2017 Annual Report
Land Registry, and only properties within England, Scotland and Wales are suitable for security. Loans are capped at 75% of the open market value of the property against which security is held, and minimum loan period interest is retained on completion. As a result, we have limited exposure to collateral price risk
c) Sensitivity analysisIFRS 7 requires disclosure of sensitivity
analysis for each type of market risk to which the entity is exposed at the report date showing how profit or loss and equity would have been affected by changing the relevant risk variables that were reasonably possible at that date. As discussed above, the Group mitigates its exposure to credit, liquidity and market risk through active management of these on each loan. Given the specialist nature of the Group’s lending, with diversified property types, geographical loans, personal guarantees and other loan and property characteristics, it is not practical to provide sensitivity analysis in respect of these risks and therefore no sensitivity analysis for those risks has been disclosed.
Capital managementThe Group considers its capital to
comprise of its equity share capital plus its share premium plus its accumulated retained profits plus its share based payment reserve.
The Group’s objectives when maintaining capital are:
— to safeguard the entity’s ability to continue as a going concern, so that it can continue to provide returns for shareholders and benefits for other stakeholders, and
— to provide an adequate return to shareholders by pricing products and services commensurately with the level of risk.
The Group sets the amount of capital it requires in proportion to risk. The Group manages its capital structure and makes adjustments to it in the light of changes in economic conditions and the risk characteristics of the underlying assets. In order to maintain or adjust the capital structure, the Group may adjust the amount of dividends paid to shareholders, return capital to shareholders, issue new shares, or sell assets to reduce debt.
5. Segmental analysis
The Group’s operations are carried out solely in the UK and one business line (short term lending). The results and net assets of the Group are derived from the provision of property related loans only.
6. Revenue
The Group Year ended 31 March 2017
Year ended 31 March 2016
£’000 £’000
Interest on Loans and advances
11,753 11,009
Service fees 7,487 6,333
Advisory fees 2,871 1,349
22,111 18,691
The Company
Year ended 31 March 2017
Year ended 31 March 2016
£’000 £’000
Interest on Loans and advances
717 3,425
Service fees 14,313 8,955
Advisory fees - -
15,029 12,380
7. Other operating income
The Group does not have sources of income considered to be outside the main revenue generating activities, and therefore has no other operating income.
8. Profit from operations
Profit from operations has been stated after charging:
The Group Year ended 31 March
2017
Year ended31 March
2016
£’000 £’000
Wages and salaries 6,311 3,579
Depreciation 134 174
Fees payable to the auditors for the audit of the financial statements
79 54
Auditor’s remuneration for tax advisory services
- 53
Share-based payments 51 27
The Company Year ended 31 March
2017
Year ended31 March
2016
£’000 £’000
Wages and salaries 6,311 3,579
Depreciation 134 174
Fees payable to the auditors for the audit of the financial statements
49 35
Auditor’s remuneration for tax advisory services
- 8
Share-based payments 50 27
Other administrative expenses are incurred in the ordinary course of the business and do not require further disclosure under IAS1.
9. Employee benefit expenses
Employee benefit expenses (including directors) comprises:
The Group Year ended 31 March 2017
Year ended 31 March 2016
£’000 £’000
Wages and salaries
6,311 3,579
Short-term non-monetary benefits
31 16
Defined contribution pension costs
128 -
Share based payment expense
50 27
Social security contributions and similar taxes
720 441
7,241 4,063
The Company
Year ended 31 March 2017
Year ended 31 March 2016
£’000 £’000
Wages and salaries
6,311 3,579
Short-term non-monetary benefits
31 16
Defined contribution pension costs
128 -
Share based payment expense
50 27
Social security contributions and similar taxes
720 441
7,241 4,063

Financial Statements 43
10. Employees
Number of employeesThe average monthly number of
employees during the year/period were:
The Group Year ended 31 March 2017
Year ended 31 March 2016
Number Number
IT 27 15
Operations and administration
47 18
Sales and marketing 28 24
102 57
The Company Year ended 31 March 2017
Year ended 31 March 2016
Number Number
IT 27 15
Operations and administration
47 18
Sales and marketing 28 24
102 57
Key management personnel compensation
Key management personnel are those persons having authority and responsibility for planning, directing and controlling the activities of the Group, including the directors of the company listed on page 24.
The Group Year ended 31 March 2017
Year ended 31 March 2016
£’000 £’000
Salary 240 234
Short-term non-monetary benefits
6 -
Other long term benefits
- -
Defined contribution pension costs
5 -
Share based payment expense
- -
251 234
The Company Year ended 31 March 2017
Year ended 31 March 2016
£’000 £’000
Salary 240 234
Short-term non-monetary benefits
6 -
Other long term benefits
- -
Defined contribution pension costs
5 -
Share based payment expense
- -
251 234
Two directors were employed and remunerated by the Company during the year. Two other directors received no remuneration for services to the Company during the year or, if shorter, during the period of the directorship.
11. Finance Income and expense
The Group Year ended 31 March 2017
Year ended 31 March 2016
£’000 £’000
Interest on bank deposits
35 12
35 12
Preference share dividends and shareholder interest payments
(1,102) (932)
(1,102) (932)
The Company Year ended 31 March 2017
Year ended 31 March 2016
£’000 £’000
Interest on bank deposits
35 12
35 12
Preference share dividends and shareholder interest payments
(1,102) (932)
(1,102) (932)

44 LendInvest 2017 Annual Report
12. Taxation on profit on ordinary activities
The Company is subject to all taxes applicable to a commercial company in the United Kingdom. The UK business profits of the Group are subject to UK income tax at the prevailing basic rate of 20% (2016: 20%).
The tax charge/(credit) for the year is as follows:
The Group Year ended 31 March 2017
Year ended 31 March 2016
£’000 £’000
Income tax
Current tax charge 118 443
Deferred tax charge (73) 36
Total tax charge for the year 45 479
Factors affecting the tax charge/(credit) for the year:
Profit/(loss) on operating activities at 20% (2016: 20%) (203) 495
Effects of:
— Non-deductible expenses 303 240
— Research and development tax credit (237) (179)
— Prior period adjustment to current tax 118 -
— Prior period adjustment to deferred tax 80 -
— Impact of reduction in tax rates (17) -
— Capital allowances - (77)
45 479
The tax charge/(credit) for the year is as follows:
The Company Year ended 31 March 2017
Year ended 31 March 2016
£’000 £’000
Income tax
Current tax charge 86 225
Deferred tax charge (104) 36
Total tax charge for the year (18) 261
Factors affecting the tax charge/(credit) for the year:
Profit/(loss) on operating activities at 20% (2016: 20%) (236) 277
Effects of:
— Non-deductible expenses 303 240
— Research and development tax credit (237) (179)
— Prior period adjustment to current tax 86 -
— Prior period adjustment to deferred tax 80 -
— Impact of reduction in tax rates (15) -
— Capital allowances - (77)
(18) 261

Financial Statements 45
Deferred taxationDeferred tax is presented on the statement of financial position as follows:
The Group Year ended 31 March 2017
Year ended 31 March 2016
£’000 £’000
Deferred tax assets 37 -
Deferred tax liabilities - (36)
Net deferred tax assets/ (liabilities) 37 (36)
The movements during the year are analysed as follows:
Net deferred tax assets (liabilities) at the beginning of the year (36) -
Charge to profit or loss for the year (note 12) 73 (36)
Charge to other comprehensive income - -
Net deferred tax assets (liabilities) at the end of the year 37 (36)
Deferred tax is presented on the statement of financial position as follows:
The Company Year ended 31 March 2017
Year ended 31 March 2016
£’000 £’000
Deferred tax assets 68 -
Deferred tax liabilities - (36)
Net deferred tax assets liability 68 (36)
The movements during the year are analysed as follows:
Net deferred tax assets (liabilities) at the beginning of the year (36) -
Charge to profit or loss for the year (note 12) 104 (36)
Charge to other comprehensive income - -
Net deferred tax assets liability at the end of the year 68 (36)
The Group Opening Balance Credit (Charge) to income - CY
Charged to equity Credit (Charge) to income - PY
Closing Balance
Category of deferred tax £’000 £’000 £’000 £’000 £’000
2017
Property, plant and equipment (41) (108) - - (149)
Share and share option schemes 5 9 - - 14
Assessed loss - 171 - - 171
(36) 73 - - 37
2016
Property, plant and equipment - (41) - - (41)
EMI share option scheme - 5 - - 5
- (36) - - (36)

46 LendInvest 2017 Annual Report
At 31 March 2017, the Group had unrecognised deferred taxation assets of nil (2016: nil) as the directors anticipate future profits to utilise the deferred tax assets.
The Company Opening Balance Credit (Charge) to income - CY
Charged to equity Credit (Charge) to income - PY
Closing Balance
Category of deferred tax £’000 £’000 £’000 £’000 £’000
2017
Property, plant and equipment (41) (108) - - (149)
Share and share option schemes 5 9 - - 14
Assessed loss - 203 - - 203
(36) 104 - - 68
2016
Property, plant and equipment - (41) - - (41)
EMI share option scheme - 5 - - 5
- (36) - - (36)
At 31 March 2017, the Company had unrecognised deferred taxation assets of nil (2016:nil) as the directors anticipate future profits to utilise the deferred tax assets.
13. Dividends
The Company paid no ordinary dividends during the year (2016: nil). The Company paid preference share dividends of £590,000 (2016: £898,000)
14. Property, plant and equipment
The Group Computer equipment
Furniture and fittings
Leasehold improvements
Intangible assets Total
Cost £’000 £’000 £’000 £’000 £’000
Balance as at 31 March 2015 23 - - - 23
Additions 127 321 637 53 1,139
Disposals - - - - -
Balance as at 31 March 2016 150 321 637 53 1,162
Additions 85 13 89 - 187
Disposals (1) - - - (1)
Transfer of assets - (79) 79 - -
Balance as at 31 March 2017 235 255 806 53 1,349
Accumulated depreciation and impairment
Balance as at 31 March 2015 8 - - - 8
Charge for the year 42 105 21 7 174
Disposals - - - - -
Balance as at 31 March 2016 50 105 21 7 182
Charge for the year 52 - 56 26 134
Disposals (1) - - - (1)
Transfer of assets - (24) 24 - -
Balance as at 31 March 2017 101 80 101 33 315
Net carrying value at 31 March 2017 134 176 704 20 1,034
Net carrying value at 31 March 2016 100 217 617 46 980

Financial Statements 47
The Company Computer equipment
Furniture and fittings
Leasehold improvements
Intangible assets Total
Cost £’000 £’000 £’000 £’000 £’000
Balance as at 31 March 2015 23 - - - 23
Additions 127 321 637 53 1,139
Disposals - - - - -
Balance as at 31 March 2016 150 321 637 53 1,162
Additions 85 13 89 - 187
Disposals (1) - - - (1)
Transfer of assets - (79) 79 - -
Balance as at 31 March 2017 235 255 806 53 1,349
Accumulated depreciation and impairment
Balance as at 31 March 2015 8 - - - 8
Charge for the year 42 105 21 7 174
Disposals - - - - -
Balance as at 31 March 2016 50 105 21 7 182
Charge for the year 52 - 56 26 134
Disposals (1) - - - (1)
Transfer of assets - (24) 24 - -
Balance as at 31 March 2017 101 80 101 33 182
Net carrying value at 31 March 2017 134 176 704 20 1,034
Net carrying value at 31 March 2016 100 217 617 46 980
The Group and Company held no assets under finance losses as at 31 March 2016 and 31 March 2017.
Operating lease commitmentsFuture minimum payments under non-cancellable operating leases
Year Ended March 2017 Year Ended March 2016
Premises £’000 £’000
Due within a year 1,282 320
Due between 1 - 5 years 5,126 5,126
Due later than 5 4,568 5,778
10,976 11,224
The Company and Group have no significant contingent liabilities at year end.

48 LendInvest 2017 Annual Report
15. Investments in subsidiaries
The Company Year ended 31 March 2016
Year ended 31 March 2015
£’000 £’000
Ordinary Shares 5,110 5,010
5,110 5,010
The Company owned 100% of the ordinary share capital the following subsidiaries as at 31 March 2017;
Entity Name Principal Activities
LendInvest Loans Limited Dormant
LendInvest Capital Management Limited Intermediary Holding Company
LendInvest Capital Advisors Limited Advisor to Montello Capital Real Estate Opportunity Fund
LendInvest Finance No. 2 Limited Provides secured lending to third party lenders
LendInvest Finance No. 4 Limited Provides secured lending to third party lenders
LendInvest Funds Management Limited Fund Management Company
LendInvest Private Finance General Partners Limited General Partner to LendInvest Income LP
LendInvest Finance No. 1 Limited Provides secured lending to third party lenders
LendInvest Finance No. 3 Hold Co. Limited Intermediate Holding Company
LendInvest Finance No. 3 Limited Provides secured lending to third party lenders
LendInvest Security Trustees Limited Dormant
LendInvest Finance No. 5 Limited Provides secured lending to third party lenders
LendInvest Secured Income Plc Dormant
The registered address of all these subsidiaries is 8 Mortimer Street, London W1T 3JJ.
The Group consolidates LendInvest Trading Partners LLP whose registerd address is 18 Swithin’s Lane, London EC4N 8AD, as the directors consider that the Group exercises control over the entity.
16. Trade and other receivables
The Group Year Ended March 2017 Year ended March 2016
£’000 £’000
Trade receivables 1,336 1,128
Other receivables:
— Prepayments and accrued income 3,584 1,882
— Corporation tax receivable 81 -
— Other receivables 517 1,294
5,518 4,304

Financial Statements 49
The Company Year Ended March 2017 Year ended March 2016
£’000 £’000
Trade receivables 490 530
Other receivables:
— Prepayments and accrued income 2,736 1,615
— Corporation tax receivable 81 -
— Other receivables 3,973 531
7,280 2,676
The carrying value of trade and other receivables approximates fair value, and represents the maximum exposure to credit losses. The company has no non-current trade and other receivables.
The maximum exposure to credit risk at the reporting date is the carrying value of each class of receivables mentioned above. During the current year (and prior period) the Company had no trade receivables that are past due but not impaired.
17. Cash at bank in hand
The Group Year Ended March 2017 Year ended March 2016
£’000 £’000
Cash and cash equivalents 9,145 13,253
Trustees account 3,569 4,194
12,714 17,447
The Company Year Ended March 2017 Year ended March 2016
£’000 £’000
Cash and cash equivalents 5,003 10,074
Trustees account 3,569 4,194
8,572 14,268
Operationally the Company does not treat the Trustee’s balances as available funds. An equal and opposite payables balance is included within trade payables (see note 19)
18. Loans and advances
The Group Year Ended March 2017 Year ended March 2016
£’000 £’000
Gross loans and advances 92,847 93,724
Impairment provision - -
92,847 93,724
The Company Year Ended March 2017 Year ended March 2016
£’000 £’000
Gross loans and advances - 18,356
Impairment provision - -
- 18,356

50 LendInvest 2017 Annual Report
Maturity analysis of loans and advances
The Group Year Ended March 2017 Year ended March 2016
£’000 £’000
Amounts up to one year 85,719 87,362
Amounts between one and five years 7,128 6,362
Amounts in excess of five years - -
Gross loans and advances 92,847 93,724
The Company Year Ended March 2017 Year ended March 2016
£’000 £’000
Amounts up to one year - 17,138
Amounts between one and five years - 1,218
Amounts in excess of five years - -
Gross loans and advances - 18,356
Related credit risk exposure and enhancements
The Group Year Ended March 2017 Year ended March 2016
£’000 £’000
Maximum exposure to credit losses of loans and advances 92,847 93,724
Credit risk exposure is mitigated through properties held as collateral. The aggregate achievable resale value less costs to sell of collateral held is: 280,426 200,518
Related specifically to:
Impaired financial assets - -
Financial assets past due but not specifically impaired 5,743 16,167
Credit risk exposure on financial assets past due but not specifically impaired is mitigated through properties held as collateral. The aggregate achievable resale values less cost to sell of collateral held is:
7,774 31,301
Financial assets neither past due nor impaired 84,304 77,557
The Company Year Ended March 2017 Year ended March 2016
£’000 £’000
Maximum exposure to credit losses of loans and advances - 18,356
Credit risk exposure is mitigated through properties held as collateral. The aggregate achievable resale value less costs to sell of collateral held is: - 38,397
Related specifically to:
Impaired financial assets - -
Financial assets past due but not specifically impaired - 3,121
Financial assets neither past due nor impaired - 15,235
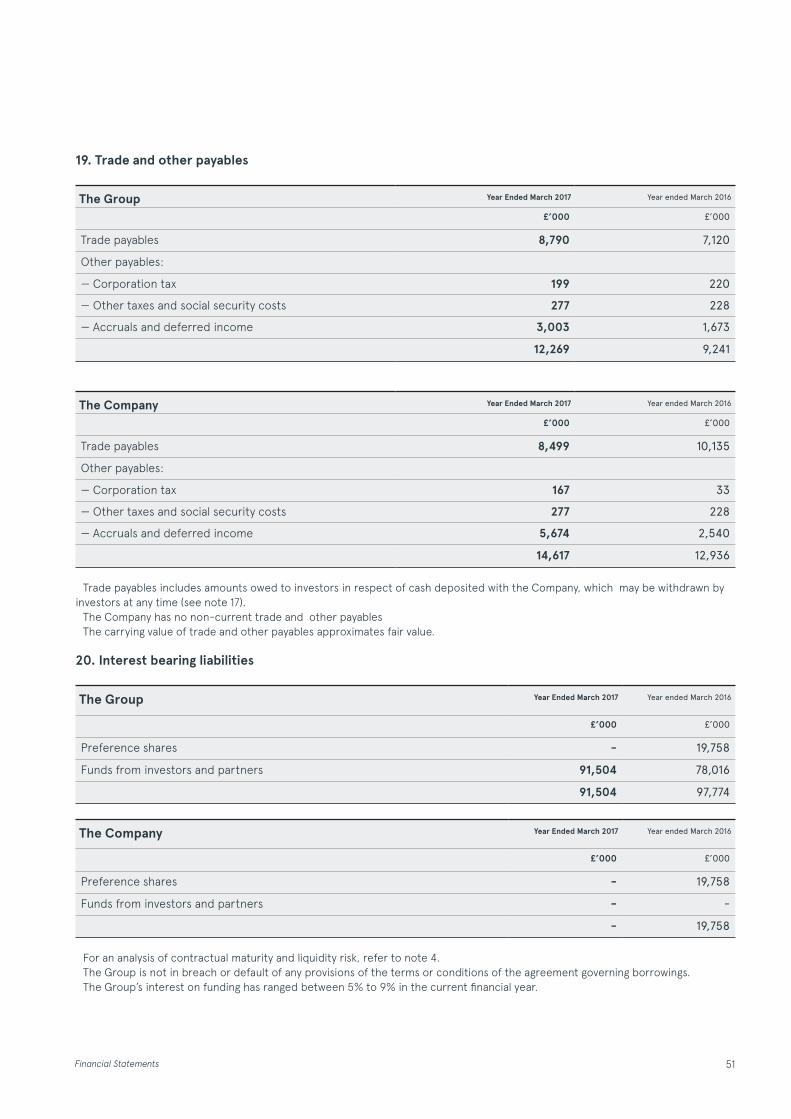
Financial Statements 51
19. Trade and other payables
The Group Year Ended March 2017 Year ended March 2016
£’000 £’000
Trade payables 8,790 7,120
Other payables:
— Corporation tax 199 220
— Other taxes and social security costs 277 228
— Accruals and deferred income 3,003 1,673
12,269 9,241
The Company Year Ended March 2017 Year ended March 2016
£’000 £’000
Trade payables 8,499 10,135
Other payables:
— Corporation tax 167 33
— Other taxes and social security costs 277 228
— Accruals and deferred income 5,674 2,540
14,617 12,936
Trade payables includes amounts owed to investors in respect of cash deposited with the Company, which may be withdrawn by investors at any time (see note 17).
The Company has no non-current trade and other payablesThe carrying value of trade and other payables approximates fair value.
20. Interest bearing liabilities
The Group Year Ended March 2017 Year ended March 2016
£’000 £’000
Preference shares - 19,758
Funds from investors and partners 91,504 78,016
91,504 97,774
The Company Year Ended March 2017 Year ended March 2016
£’000 £’000
Preference shares - 19,758
Funds from investors and partners - -
- 19,758
For an analysis of contractual maturity and liquidity risk, refer to note 4.The Group is not in breach or default of any provisions of the terms or conditions of the agreement governing borrowings.The Group’s interest on funding has ranged between 5% to 9% in the current financial year.

52 LendInvest 2017 Annual Report
21. Share capital and share premium
Share capital Year Ended March 2017 Year ended March 2016
Issued and fully paid up number number
Ordinary Shares of £0.000001 each 20,973,850 20,973,850
"A" Ordinary shares of £0.000001 each 821,749 283,287
Series A Preferred shares of £0.000001 each - 5,998,739
Series B1 Preferred shares of £0.000001 each 1,615,881 1,615,881
Series B2 Preferred shares of £0.000001 each 2,308,402 2,308,402
Total 25,719,882 31,180,159
Year Ended March 2017 Year ended March 2016
Issued and fully paid up £ £
Ordinary Shares of £0.000001 each 21 21
"A" Ordinary shares of £0.000001 each 1 0
Series A Preferred shares of £0.000001 each - 6
Series B1 Preferred shares of £0.000001 each 2 2
Series B2 Preferred shares of £0.000001 each 2 2
Total 26 31
On 5 October 2016 the Company redeemed 5,998,739 A Preferred shares of £0.000001 each at issue price.On 14 November 2016 the Company issued an additional 538,462 “A” Ordinary shares of £0.000001 at nominal value.During the year and to the date of these accounts, the Company issued Ordinary share options to employees totalling 548,233 as
detailed in note 25.During the year and to the date of these accounts, the Company cancelled Ordinary share options issued to employees totalling
277,714 as detailed in note 25.
Share premium Year Ended March 2017 Year ended March 2016
£’000 £’000
Balance as at 31 March 6,441 6,414
During the year the Company issued 538,462 “A” Ordinary Shares to employees, as noted in note 25, at a premium of £27,000.
22. Reserves
Reserves comprise of retained earnings and share based payments reserve only as detailed in note 23. Retained earning representing all net gains and losses of the Group.

Financial Statements 53
23. Retained Earnings
The Group The Company
£’000 £’000
Balance as at 31 March 2015 1,104 993
Profit for the period 1,995 1,126
Share of limited liability partnership profits (136) -
Balance as at 31 March 2016 2,963 2,119
Profit for the period (1,060) (1,163)
Share of limited liability partnership profits (17) -
Balance as at 31 March 2017 1,886 956
24. Notes to the cash flow statement
The Group Year Ended March 2017 Year ended March 2016
Cash and cash equivalents for purposes of the statement of cash flows comprises:
£’000 £’000
Cash at bank available on demand 12,714 17,447
Total cash and cash equivalents 12,714 17,447
Included within cash are Trustee balances that are held for investors. There were no material non-cash transactions during the year.
25. Share-based payments
Enterprise Management Incentives share option scheme.During the 2016 financial year the Company issued share options to employees under an Enterprise Management Incentives
share option scheme. The Company issued both Ordinary and A Ordinary Share options. The A Ordinary shares were immediately exercised at nominal value. The grant of share options will be made on an annual or on an ad hoc basis. The following information is relevant in the determination of the fair value of options granted during the year under the equity-settled share based remuneration schemes operated by the Group.
Option pricing model used Maintainable earnings valuation model
Valuation of Ordinary Share Options at Grant Date £0.30 per share actual market value
Amortisation Period 3 years
Strike Price £1. 35
Expiry Date December 2019
Grant Date June 2015

54 LendInvest 2017 Annual Report
The movement in options is as follows
Balance at 1 April 2016 407,825
Granted during the year -
Options exercised during the year -
Cancelled during the year (122,350)
Balance at 31 March 2017 285,475
Company Share Option PlanDuring the current financial year the Company issued a Company Share Option Plan (CSOP) share options to employees. The
Company issued Ordinary Share options. The grant of share options will be made on an annual or on an ad hoc basis. The following information is relevant in the determination of the fair value of options granted during the year under the equity-settled share based remuneration schemes operated by the Group.
Option pricing model used Maintainable earnings valuation model
Valuation of Ordinary Share Options at Grant Date £0.05 per share actual market value
Amortisation Period 3 years
Strike Price £0.05
Expiry Date September 2026
Grant Date September 2016
The movement in options is as follows
Granted during the year 548,233
Options exercised during the year -
Cancelled during the year (155,364)
Balance at 31 March 2017 392,869
Share options expense recognised
Year Ended March 2017 Year ended March 2016
£’000 £’000
The expense is included in administrative expenses, as part of employee expenses. 23 27
Company Shares Issued to EmployeesOn 14 November 2016 the Company issued an additional 538,462 “A” Ordinary shares of £0.000001 at nominal value to employees.
These shares had an actual market value of £0.05 each at date of issue.

Financial Statements 55
26. Financial assets and financial liabilities
The Group Year Ended March 2017 Year ended March 2016
£’000 £’000
Financial assets
Cash and cash equivalents 12,714 17,447
Trade and other receivables 1,805 2,422
Loans and advances 92,847 93,724
Total financial assets 107,366 113,593
Financial Liabilities
Trade and other payables 12,269 9,241
Interest bearing liabilities 91,504 97,774
Total financial liabilities 103,773 107,015
The Company Year Ended March 2017 Year ended March 2016
£’000 £’000
Financial assets
Cash and cash equivalents 8,572 14,268
Trade and other receivables 4,463 1,061
Loans and advances - 18,356
Investments at cost 5,110 5,010
Total financial assets 18,145 38,695
Financial Liabilities
Trade and other payables 14,617 12,935
Interest bearing liabilities - 19,758
Total financial liabilities 14,617 32,693
Management consideration of the fair value of financial investments is documented in note 3.
27. Related party transactions
A listing of the Group’s subsidiaries and directors can be found in the Directors’ Report. The directors’ emoluments are included in Note 10, Indirect Costs.
During the year the Company entered into the following transactions with related parties who are not members of the Group:
Fees Year Ended March 2017
Fees Year Ended March 2016
Amounts owed by related party 2017
Amounts owed by related party 2016
Amounts owed to related party 2017
Amounts owed to related party 2016
£’000 £’000 £’000 £’000 £’000 £’000
LendInvest Income LP 2,754 2,199 701 1,260 131 8,267
Montello Capital LLP - - - 15 - -
Directors loan accounts - - 37 37 - -

56 LendInvest 2017 Annual Report
28. Controlling party
In the opinion of the directors, the Company does not have a single controlling party.
29. Events after reporting date
Following some legal changes to LendInvest’s online investment platform, from 9 May 2017 any investment will take the form of an investment in one of a number of alternative investment funds managed by LendInvest Funds Management Limited. These fund investments take the form of receivables participations, which entitle investors to receive payments from the Group.
In June 2017 we cancelled our applications to operate a P2P platform, credit broking and consumer credit. While these FCA applications can be reopened at anytime, we currently have no need for these permissions.