Embed Size (px)
Citation preview

You with us?
AnnualReport2017
AGL 2017 Annual Report
Shaping a sustainable energy futureAt AGL, we’re embracing innovation and technology to foster new and sustainable energy solutions for our customers. Today, we invite you to read our 2017 Annual Report, which provides comprehensive analysis of our performance over the year.
Nyngan Solar Plant

About this Report
This report is intended to provide AGL shareholders with information on your company, for the financial year ended 30 June 2017. Our 2017 Annual Report includes the concise Financial Report of AGL and its consolidated entities for the year. This year, AGL has also produced an online Annual Report which is available on our website agl.com.au/2017AnnualReport
A printed copy of our Full Financial Annual Report is also available free of charge upon request.
Annual General Meeting Details
AGL’s Annual General Meeting will be held at the Melbourne Recital Centre, commencing at 10:30am on Wednesday 27 September 2017. Full details are available in the Notice of Meeting or on AGL’s website agl.com.au/agm
AGL also publishes an annual Sustainability Report which provides an account of our performance in relation to the social, environmental and economic challenges facing AGL and the energy industry. This report is available on our website agl.com.au/2017SustainabilityReport
AGL’s Corporate Governance Statement discloses the extent to which AGL has complied with the ASX Corporate Governance Council’s ‘Corporate Governance Principles & Recommendations – 3rd edition’. This statement is available at agl.com.au/CorporateGovernance
Included in this year’s report is a Corporate Governance Summary which outlines key aspects of AGL’s corporate governance arrangements.
Contents
Chairman’s Letter 2Managing Director & CEO’s Report 4Five Year Summary 7Executive Team 8Corporate Governance Summary 10Directors’ Report 12Concise Financial Report 59Shareholding Information 74Investor Information 76Directory and Financial Calendar 77
AGL Energy Limited ABN 74 115 061 375

2 AGL Energy Limited
Chairman’s Letter
It gives me great pleasure to present AGL’s annual report for the financial year ended 30 June 2017.It has been a significant year for AGL – represented by the refresh of the AGL brand.
Our new look and the “You with us?” campaign we launched in April – as featured on the front cover of this year’s annual report – reflect the transformation journey we began in 2015.
Our message reflects our support for the Paris climate accord to reduce carbon emissions – and emphasises our commitment to close our coal-fired assets at the end of their lives.
This is a major responsibility for AGL given our position as the largest generator in the National Electricity Market.
A priority for the Board is ensuring AGL, as a major emitter of carbon through its coal-fired electricity assets, is managing its economic, environmental and social responsibilities and risks.
That’s why the relaunch of our brand this year was so important.
Amid concerns about energy stability, sustainability and affordability, the level of scrutiny of our industry is greater than at any time during my 11-year tenure as an AGL director.
This follows the South Australian blackout of September 2016, rising prices for gas and coal, the abrupt closure of several non-AGL coal-fired power stations (including Hazelwood in Victoria in March 2017 just five months after its owner announced its intention to do so) and continued uncertainty in relation to government policy.
Against this backdrop, there are no simple answers.
Nonetheless, the recent energy system review by Chief Scientist Alan Finkel offers a powerful blueprint to deliver an affordable, orderly and reliable transition.
It’s too important to cherry-pick and if it is fully implemented, AGL believes it will unleash the wave of investment our market needs.
Despite the challenging policy environment, AGL, with its partners, is now developing more than 850 MW of lower emissions electricity generation capacity in Australia, as well as assessing options to increase supply to the wholesale gas market through importing liquified natural gas and expanding our storage capability.
We’re also investing in our customers, through our $300 million Customer Experience Transformation program and in accelerating innovation through strategic investments in our New Energy business.
It is essential that all our stakeholders can recognise that AGL is operating responsibly and sustainably – and is ready and willing to invest in long-term solutions that make long-term economic sense.
We began investment programs valued at more than $1 billion during FY17 and the total value of new energy supply projects AGL and its partners are developing or proposing is more than $2 billion.
In addition, we have returned $1.1 billion directly to shareholders through FY17 via our on-market share buy-back and new policy to target a higher dividend payout ratio.
As we look to the 2018 financial year and beyond, we have a strong financial position with more than $2 billion of funding headroom on our balance sheet and an investment grade credit rating.
The AGL Board continues to assess how and where to deploy shareholders’ capital responsibly in this changing world, while balancing our broader responsibilities to our customers and the community.
Strategic imperatives driving performanceThe transformation of AGL is in response to two strategic imperatives: prospering in a carbon constrained future, and building customer advocacy.
Those two imperatives are driving our agenda, informing our strategic objectives and the way we deploy capital as the company evolves.
Our Managing Director & CEO, Andy Vesey, provides a detailed update on our progress against these objectives in his report, overleaf.
I am pleased to say that, to date, AGL’s transformation journey has been delivering strong returns for shareholders.
In the 2017 financial year, total shareholder return was considerably higher than for the broader Australian share-market, at 42 percent, compared with 15 percent on the S&P/ASX100 Index.
Over five years, AGL’s total shareholder return is 117 percent compared with 77 percent for the Index.
In FY17, Statutory Profit after tax was $539 million, compared with a Statutory Loss after tax of $(408) million in FY16.
The improvement represented an increase in underlying earnings as well as the absence of asset impairments that affected the FY16 result, which we treated as Significant Items.
Underlying Profit after tax in FY17 was $802 million, up 14 percent, the third consecutive year of growth in this metric of more than 10 percent.
AGL continues to use Underlying Profit as the reference point for the company’s earnings as it removes the impact on Statutory Profit associated with non-cash changes in the value of certain financial hedging contracts used to manage risk associated with wholesale electricity costs.
Underlying Profit also removes Significant Items – although AGL did not record any such items in FY17.
The strong FY17 financial performance was enabled by AGL’s development or acquisition over many years of a first-class generation electricity portfolio – combining coal-fired, gas, hydro-electric, wind and solar energy.
This portfolio is performing strongly amid an environment of rising wholesale electricity prices, augmented by the discipline with which we have been running the business.

Annual Report 2017 3
Consistent with our strategic framework of embracing transformation, driving productivity and unlocking growth, over FY16 and FY17, AGL has reduced business as usual operating expenditure and sustaining capital expenditure while divesting non-core assets.
Our continued strong performance enabled a change to our dividend policy during FY17, to pay out 75 percent of Underlying Profit after tax.
This resulted in our highest ever dividend, at 91 cents per share for the year, including the 50 cents per share final dividend declared with the FY17 full-year result.
Return on equity increased to 10.2 percent, from 8.3 percent in FY16, reflecting profit growth and the benefit of the share buy-back. (We exclude the buy-back benefit from return on equity when considering remuneration outcomes.)
RemunerationThe Board is committed to delivering continued improvements in shareholder returns and will continue to incentivise management appropriately.
AGL is a 180-year old company, which must embrace transformation, act swiftly to drive productivity in its existing operations and unlock new growth streams as it seeks to define the business models of the future.
This change is a once-in-a-generation challenge.
It requires strong leadership and remuneration policies to attract and retain high-calibre talent and drive executives to deliver true transformation and new growth options while maintaining the stability of the business.
A major area of focus for myself, the Chairman of our People & Performance Committee, Les Hosking, and the rest of the Board, has been responding to the “strike” AGL received against its remuneration report at last year’s AGM.
A strike occurs when more than 25 percent of the shares voted in relation to the adoption of a company’s remuneration report are voted against that remuneration report.
The Board takes the 2016 AGM outcome very seriously and has acted on the concerns raised in a considered manner.
Details of how we have listened to and address concerns raised by investors and proxy advisors are contained in the Remuneration Report section of this annual report.
In summary, we have enhanced disclosure in relation to how we set and benchmark the Managing Director & CEO’s fixed remuneration; reduced the size of his target short-term incentive (STI); increased disclosure in relation to STI metrics and outcomes for all Key Management Personnel; provided more detail about the workings of the transitional grants made to compensate executives for the closure of the old long-term incentive (LTI) plan; increased disclosure in relation to our ongoing LTI targets; and restructured the Remuneration Report to increase transparency, readability and clarity.
We have also determined that the Managing Director & CEO will receive no further increase in fixed remuneration in FY18.
We trust that these changes – and the ongoing strong performance of the company – will enable shareholders to make a considered assessment of this year’s remuneration outcomes.
Board renewalIt has also been a significant year for Board renewal.
At last year’s AGM, I signalled my intent to retire at this year’s AGM.
On 21 June 2017, we confirmed that I would not stand for re-election, after 11 years on the AGL Board and seven as Chairman, and that Graeme Hunt would succeed me.
This is the culmination of a rigorous succession planning process, which we foreshadowed at the 2016 AGM.
I am delighted that process enabled us to review several strong candidates and to select someone of Graeme’s calibre and experience.
Graeme has been on the Board since September 2012 and has a deep understanding of our strategy and of the governance, policy and broader stakeholder priorities affecting the company.
His appointment supports continuity of strategy for AGL at this time of transformation in the energy sector.
In addition to the appointment of Diane Smith-Gander at the 2016 AGM, the Board was further strengthened during FY17 by the appointment of Peter Botten, Managing Director of Oil Search Limited, one of Australia’s largest oil and gas companies.
Peter brings deep expertise in global energy markets to the AGL Board, and will stand for election at this year’s AGM.
The Board will continue to review its collective skills and experience on an ongoing basis to provide AGL with strong governance and the oversight necessary to deal with the challenges of today and the future.
A copy of the Board’s current skills matrix is included in the Corporate Governance Summary section of this annual report.
Further details are online in our annual Corporate Governance Statement.
Also published online alongside this year’s annual report is our Sustainability Report, as well as two supplementary reports: in relation to rehabilitation of our main assets, and economic and social inclusion.
I encourage you to review these reports, which reflect the great importance that the Board attributes to the broader – and increasingly long-term – environmental, social and governance issues affecting AGL.
ConclusionIn conclusion, I would like to take this opportunity to thank AGL’s shareholders for the opportunity to have served as your Chairman.
It has been a privilege – and I will stand down at this year’s AGM with great confidence in the company’s future under the leadership of its very capable Executive Team, underpinned by the talent and hard work of its 3,500-plus employees.
Jerry MaycockChairman

4 AGL Energy Limited
It is my pleasure to report on another year of strong returns for AGL shareholders and to give an update on our strategy at this exciting time.
Managing Director & CEO’s Report
Our best-in-class portfolio of generation assets, more than 3.6 million customer accounts and robust financial position give a strong foundation.
The energy sector is undergoing profound change.
Evolving dynamics and expectations coupled with rapidly changing technology and consumer demands continue to create both uncertainty and opportunity.
AGL is well-placed to succeed in this environment – because we are building from a strong base.
Our best-in-class portfolio of generation assets, more than 3.6 million customer accounts and robust financial position give a strong foundation. And our adoption of sophisticated scenario planning techniques is allowing us to develop our anticipatory mindset and assess and respond to risks and opportunities in an agile manner.
That’s why, despite the uncertainty in our sector, we are investing confidently in Australia’s energy future.
Highlights include:
• In New South Wales, the $450 million, 200 MW Silverton Wind Farm, which is under construction following financial close with our partners in the Powering Australian Renewables Fund (PARF) in January 2017;
• In Queensland, the 453 MW Coopers Gap Wind Farm, a $850 million project, which we also expect to develop with PARF, and the potential $250 million expansion of our Silver Springs storage facility;
• In South Australia, the $295 million, 210 MW Barker Inlet Power Station, a gas-fired generation project, which we are building for operation during FY19;
• In Victoria, we have selected a preferred site at Crib Point’s Western Port for the construction of our proposed $250 million import jetty and pipeline to transport liquefied natural gas (LNG) from interstate and overseas to increase supply to Australia’s gas market; and
• In Western Australia, we are investing an estimated $50 million launching our gas retail operations, with an objective of securing 100,000 customers by the end of FY19.
The above projects amount to more than $2 billion of investment in new energy supply that AGL and its partners are developing throughout Australia.
We are also undertaking a detailed state-by-state assessment, starting with NSW and Victoria, of Australia’s potential energy generation supply and capacity requirements from now to 2025.
This will pay particular attention to replacing energy and capacity currently supplied by AGL’s coal-fired power station at Liddell in New South Wales, which will reach the end of its life in 2022.
AGL does not plan to invest new capital in coal plants.
This reflects Australia’s commitment to the Paris climate accord, the expectations of our customers and the broader community, and our assessment of what is economically sustainable given the rapid development of alternative technologies and the likelihood of a long-term carbon constraint in Australia.
Our state-by-state assessment will inform the nature and scale of AGL’s future investment in new low-emissions generation and storage technologies.
It will also offer insight into how AGL should make those investments to ensure we deploy shareholders’ capital responsibly in the context of the significant uncertainties we face in both regulation and technology.
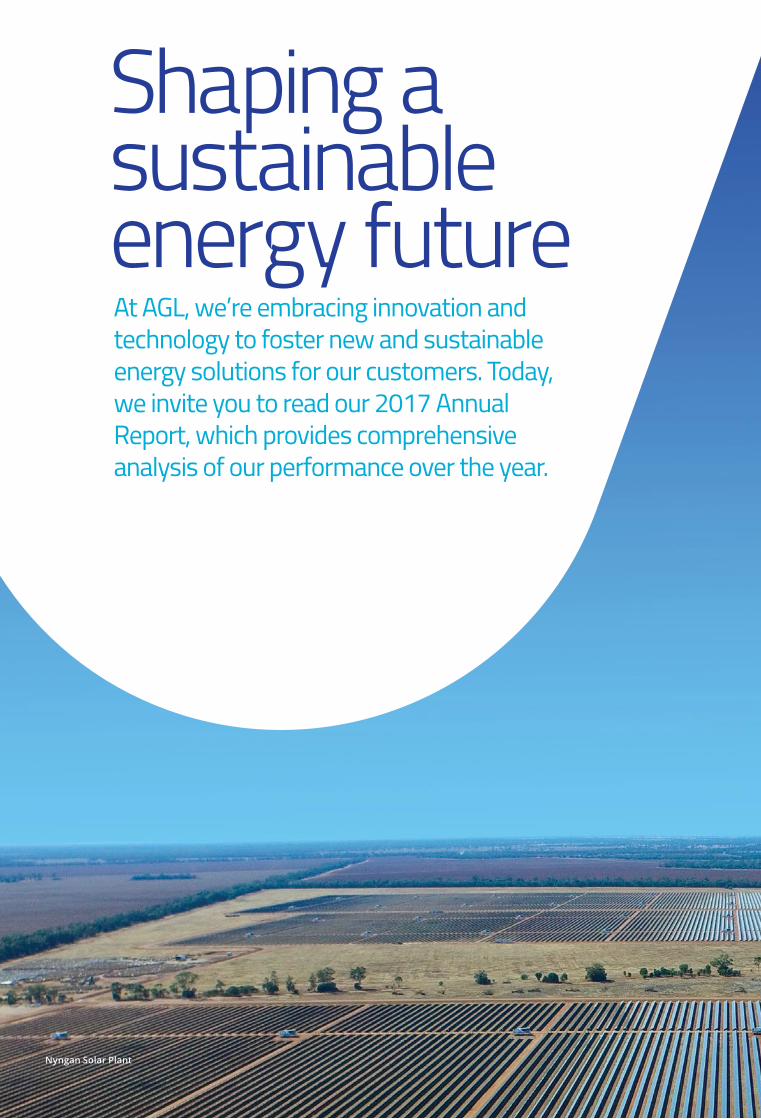
Strategic objectivesAs set out on the following page, our strategic imperatives to prosper in a carbon-constrained future and build customer advocacy drive several key objectives for AGL.
We discussed the first three of these objectives at our investor strategy day in November 2016.
They are moving from being a mass retailer to a more personalised retailer, from being an operator of large-scale generation assets to an orchestrator of both large and small assets, and from reliance on high emissions technology to much lower emissions alternatives.
Annual Report 2017 5
I am pleased to say that we are making considerable progress in all three areas as reflected in the following flagship projects:
• The $300 million Customer Experience Transformation program to deliver a step change in simplicity and digital enablement for customers at key points of their energy experience, while increasing efficiency;
• The $20 million Virtual Power Plant to connect 1,000 residential and small business rooftop solar customers with batteries in the Adelaide region and create a virtual, solar peaking plant; and
• The $2 billion to $3 billion PARF to drive investment in large-scale solar and wind projects (including Silverton and Coopers Gap).
Now, following our expansion into Western Australia, we have added a fourth strategic objective – to move from leveraging business platforms in existing markets to leveraging those platforms in new geographies as well.
This includes an assessment of opportunities to leverage our energy retailing platform in certain select markets overseas.
Our New Energy “innovation accelerator” is already pursuing investment and partnership opportunities consistent with this mindset including through our US$S50 million commitment to the Energy Impact Partners’ Fund, a US-based portfolio of energy technology start-ups, and recent investments in smart home access company August Home and smart storage company Advanced Microgrid Systems.
We intend to continue to innovate and invest in opportunities that have the potential not only to replace our coal-fired generation revenues, but also to create entirely new sources of value.
Financial and operating performanceThe prevailing market conditions during FY17 presented an opportunity for AGL management to create increased value for its shareholders.
Management delivered on this potential by successfully executing strategic initiatives in operations, retail markets, risk management, cost management and stakeholder engagement.
After I became Managing Director & CEO in January 2015, we set a series of financial performance objectives for FY17 in line with our strategic framework to embrace transformation, drive productivity and unlock growth.
The record Underlying Profit and dividends delivered, as well as other capital management undertaken in FY17, reflect the achievement of those financial performance objectives.
We have divested $1 billion of non-strategic and underperforming assets and we reduced operating expenditure and sustaining capital expenditure by more than the $170 million and $100 million respective targets set.
Our safety performance continues to improve. Our total injury frequency rate for employees improved to 2.0 per million man hours over FY17, compared with 4.3 in FY16.
We also reduced several operating uncertainties during the year.
• We secured new enterprise agreements with workers at our two largest power generation plants, AGL Macquarie in New South Wales and AGL Loy Yang in Victoria;
• We secured a new four-year electricity supply contract with the Portland aluminium smelter in Victoria; and
• As reflected in our Rehabilitation Report, we have reviewed and clarified the long-term forecast cash-flows associated with the eventual closure of our thermal power stations.
Now as we enter FY18 and look beyond, we are not standing still.
We will continue to adopt our “agile capital” approach to financial management, including investing more in the operations and maintenance of our existing fleet where it is prudent to ensure reliability and efficiency of operation.
We will continue to seek to embed lean and agile processes to minimise recurring operating costs, to divest assets where ownership no longer drives value and to pursue asset ownership structures that maximise optionality and the ability to pivot.
$300 million Customer
Experience Transformation
program
Virtual power plant in SA
connecting 1,000 home batteries
Powering Australian
Renewables Fund, driving investment
in large scale renewables
WA expansion and review of energy retail
opportunities in select offshore
developed markets
Mass retailing
Operator of large assets
High emissions technology
Leveraging business platforms in existing markets
From From From FromTo To To To
Personal retailing
Orchestrator of large and
small assets
Lower emissions
technology
Leveraging platforms in existing and
new markets
Prosper in a carbon constrained future Build customer advocacy
AGL’s Strategic Imperatives

6 AGL Energy Limited
LeadershipThere were a number of changes in our Executive Team during the year:
• Effective 1 July 2017, we are splitting leadership of Energy Markets into two – Customer Markets and Wholesale Markets – following our announcement in May 2017 that Stephen Mikkelsen would be stepping down as Executive General Manager of Energy Markets after 11 years of service to AGL. We have created the new role of Chief Customer Officer, to which we have appointed Melissa Reynolds, formerly executive general manager of retail banking at National Australia Bank, and promoted Richard Wrightson as Executive General Manager of Wholesale Markets.
• We have given CFO Brett Redman an expanded leadership role driving AGL’s execution of growth at scale as we seek new revenue streams and evolve our business model. As a result, we have split out leadership of IT from under the Finance function and appointed our Chief Information Officer Simon Moorfield to the Executive Team as Executive General Manager of Information Systems & Technology.
• Following Melissa’s appointment and the appointments during the year of Elisabeth Brinton and Lisa Harrington to lead New Energy and Stakeholder Relations respectively, we now have three women on the Executive Team. Improving gender diversity in senior leadership positions is not just ethical; broader perspectives lead to better decision-making.
• We also promoted our General Counsel & Company Secretary, John Fitzgerald, to the Executive Team during the period.
Customer and CommunityAs we invest to deliver value from the transformation of the energy sector for our shareholders, our customers and the community more broadly, we are mindful as ever of our broader social responsibilities.
AGL has some 31,000 customers on our Staying Connected program, through which we provide added support such as tailored advice and protection from disconnection to those customers who are having difficulty paying their bills.
Since December 2014, we have run our Affordability Initiative, investing $6.5 million over three years in areas such as increasing financial counselling services, energy saving partnerships, payment incentives and debt relief programs and community outreach.
And, in March 2017, we launched A Fairer Way for concession card and Staying Connected customers, to deliver fairer outcomes and encourage engagement with the competitive energy market. A Fairer Way entails waiving late fees and offering guaranteed discounts in many cases.
During FY17, the number of customers accessing discount products increased to 80 percent, and the value of those discounts was up by 28%.
We also continue to advocate strongly for broader social issues, including diversity and inclusion. More detail is in our Sustainability Report, but highlights in FY17 included:
• Women now make up 38 percent of our Senior Leadership Pipeline, representing 34 additional positions, as we target 40 percent by FY19;
• We introduced an industry-leading parental leave support program, increasing paid parental leave entitlements to 20 weeks from 14 weeks;
• We achieved gold-tier recognition from the Australian Workplace Equality Index, acknowledging our position as a national leader on inclusion of our lesbian, gay, bisexual, trans and intersex colleagues; and we continued our strong support for marriage equality.
Managing Director & CEO’s Report continued
Early in FY17 we became a signatory to the United Nations Global Compact. We are committed to upholding the Compact’s 10 principles on human rights, labour, environment, and anti-corruption.
I am proud of these initiatives, and of every member of the team I lead at AGL.
I would like to close by acknowledging all their efforts in delivering on behalf of our customers, shareholders and the broader community this year.
Andy VeseyManaging Director & CEO

Annual Report 2017 7
Five Year Summary
FY17 FY16 FY15 FY14 FY13
ProfitabilityRevenue $m 12,584 11,150 10,678 10,445 9,716Underlying EBITDA $m 1,852 1,689 1,505 1,330 1,318 Underlying EBIT $m 1,368 1,211 1,126 1,004 1,031 Statutory Profit/(Loss) after tax $m 539 (408) 218 570 375 Underlying Profit after tax $m 802 701 630 562 585
Financial Position and Cash FlowTotal Assets $m 14,458 14,604 15,833 14,134 13,366Net Debt $m 3,178 2,746 3,560 3,265 2,837 Gearing (Net Debt/Net Debt + Equity) % 29.6 25.7 28.6 29.8 27.9 Operating cashflow before interest, $m tax and significant items
1,362 1,588 1,527 1,149 1,179
Shareholder ValueStatutory earnings per share1 cents 80.5 (60.5) 33.3 98.2 65.5Underlying earnings per share1 cents 119.8 103.9 96.4 96.9 102.2Dividends declared cents 91.0 68.0 64.0 63.0 63.0Total shareholder return % 42.4 22.3 14.8 11.8 (1.1)Return on equity % 10.2 8.3 7.2 7.5 8.0
OperationsTotal injury frequency rate – employee2 2.0 4.3 4.1 2.7 5.2Capital expenditure $m 518 529 794 517 608Generation sent out GWh 45,446 46,476 40,985 20,730 20,545 Generation Capacity (operated and controlled) MW 10,414 10,409 10,508 5,847 5,847
Customer NumbersElectricity ’000 2,250 2,262 2,279 2,316 2,146Gas ‘000 1,403 1,419 1,456 1,484 1,371Total ‘000 3,653 3,681 3,735 3,800 3,517Dual fuel accounts ‘000 2,008 1,962 1,917 1,942 1,676
Electricity Sales VolumesConsumer3 GWh 13,888 14,634 14,857 15,384 15,677 Business GWh 11,198 12,268 12,798 12,963 14,714 Wholesale GWh 14,564 10,937 9,219 2,343 2,654 Total GWh 39,650 37,839 36,874 30,690 33,045
Gas Sales VolumesConsumer PJ 58.5 59.4 63.0 57.6 60.6Business PJ 61.6 73.7 79.1 80.6 85.5Wholesale and Generation PJ 109.7 101.1 92.0 66.0 55.0Total PJ 229.8 234.2 234.1 204.2 201.1
Notes:1. Earnings per share for FY13 – FY14 restated for the bonus element of the one-for-five share rights issue completed in September 2014.2. Per million man hours.3. Restated to reflect recognition of volumes associated with feed-in tariffs from solar customers.
8 AGL Energy Limited8 AGL Energy Limited
Executive Team
Doug Jackson MBA Global Energy
Executive General Manager Group Operations
Doug has over 35 years’ experience in the energy and mining industry. Doug is responsible for leading AGL’s Group Operations businesses including AGL’s power generation portfolio and other key sites and operating facilities. Doug leads a geographically dispersed team of approximately 1,800 employees. Prior to joining AGL in 2013, Doug worked in both the United States and Canada, leading the operations and construction of electricity generation and mining assets.
Stephen Mikkelsen CA, BBS
Stephen has over 20 years’ experience in senior positions in the Australian and New Zealand electricity markets. Stephen has held numerous positions at AGL including Executive General Manager Energy Markets, and Group General Manager Retail Energy where he had overall responsibility for sales, marketing, and servicing AGL’s residential and small business gas and electricity customers. Prior to this, Stephen served as AGL’s Chief Financial Officer for six years. As announced in May 2017, Stephen will be leaving AGL in September 2017.
Simon Moorfield BS CS
Executive General Manager Information Systems and Technology
Simon has over 20 years’ experience in IT, having held several CIO and executive roles both locally and internationally. Simon has spent his entire career in technology and program management having worked with NAB, GE and CBA. His significant IT leadership experience in large retail businesses such as CBA Retail and GE Capital Asia Pacific includes leading numerous innovative change and transformation programs. Simon joined AGL in January 2016 as Chief Information Officer.
Andrew Vesey BA(Econ)(Hons), BSc(MecEng)(Hons), MS
Managing Director and Chief Executive Officer
See page 12.
Brett Redman BCom, FCA, GAICD
Chief Financial Officer
Brett has over 25 years of experience in senior finance roles in large blue chip industrial companies, with expertise in leading group strategy and finance in the Energy and Utilities sector. Prior to joining AGL in 2007, Brett held numerous finance roles at BOC in the South Pacific and North America, Email and CSR, which was complemented by his background in chartered accounting at Deloitte.Brett was appointed AGL’s CFO in 2012 and he is responsible for driving AGL’s key priority - to execute growth at scale as the business seeks new revenue streams. This builds on leading previous successful growth initiatives including the acquisitions of Loy Yang A and Macquarie power stations, as well as the recent creation of the Powering Australian Renewables Fund.
Elisabeth Brinton BA(Hons) (Eng, Chem, Integrated Science, History, Sustainability)
Executive General Manager New Energy
Elisabeth has more than 25 years of experience growing companies and leading innovation across sectors including energy, technology, consumer food products and agriculture.
Elisabeth joined AGL in September 2016 from New York Stock Exchange-listed Pacific Gas and Electric Company (PG&E) where she led Corporate Strategy, launched PG&E’s ground breaking IoT “Grid of Things” business strategy, ran M&A and strategic investments.
Elisabeth also led California’s exploration of new utility business models. She is a science and humanities graduate of Principia College in Illinois, USA and is also a recipient of the prestigious Harry S Truman scholarship and a Lincoln Academy inductee, both in the USA.
Annual Report 2017 9
Dan Cram BCom (HR & IR), M.Bus (IR) GAICD
Executive General Manager People & Culture
Dan has more than 20 years’ experience in human resources at large organisations. This experience encompasses industrial and employee relations, business strategy execution, remuneration and organisational change including merger and acquisition, organisational transformation, leadership development and outsourcing and offshoring activities. Since joining AGL in 2007 he has supported the Merchant Energy, Upstream Gas and Corporate business units as well as leading the employee relations function. After 10 years’ service, Dan will step down from his role in September 2017.
John Fitzgerald BA, LLB, MA
General Counsel and Company Secretary
John Fitzgerald was appointed Company Secretary on 1 October 2015. In December 2007, John was appointed General Counsel and continues to hold that position in addition to his role as Company Secretary. John’s qualifications are a Bachelor of Arts and a Bachelor of Laws from the University of New South Wales and a Masters in Arts from the National University of Ireland (University College Dublin). John is admitted as a Solicitor of the Supreme Court of New South Wales and has been practising in projects, mining and energy law for over 20 years.
Lisa Harrington BA Communications
Executive General Manager Stakeholder Relations
Lisa has 20 years’ experience in stakeholder relations and communications across corporate, government and not-for-profit sectors in Australia.
Lisa joined AGL in 2013 and led the Government Affairs function prior to being appointed Chief of Staff to the Managing Director and CEO in 2015.
In September 2016, Lisa became the EGM of Stakeholder Relations. Lisa is responsible for corporate affairs, government and community relations, policy, sustainability and regulation.
Lisa has a BA Communications from the University of Technology Sydney, attended the Melbourne Business School as part of AGL’s Academy for Senior Leaders and undertook the Advanced Management Program at Harvard Business School.
Alistair Preston BSc Business Administration, PhD Management
Executive General Manager Organisational Transformation
Alistair has over 20 years’ experience in the energy industry as a professor, consultant and executive leader. His experience extends across operations, finance and organisational transformation. Alistair has led transformation programs in generation and distribution companies and corporate and regional support service organisations. Most recently, he was AES’ Chief Financial Officer for Europe, Middle East and Africa.
Melissa Reynolds BEc, MCom, GAICD
Chief Customer Officer
Melissa has over 30 years’ experience in product, marketing, brand, sales and service in consumer and business markets. This includes leading large scale customer and digital change in the financial services and media sectors. Prior to joining AGL, Melissa held senior roles at NAB, as EGM Retail; Sensis where she led the digital transformation of White Pages; Esanda and Westpac. Melissa joined AGL in May 2017.
Richard Wrightson BA (Econ)(Hons)
Executive General Manager Wholesale Markets
Richard has over 22 years’ experience in wholesale energy markets in the UK and Australia. Before commencing at AGL in 2010, Richard was involved in the UK electricity industry in the contract and trading areas of two of the largest generators, PowerGen and British Energy. His significant experience in the Australian energy sector includes consulting on the National Electricity Market commencement, as well as working at the Electricity Trust of South Australia, the State Electricity Commission of Victoria and, Loy Yang Power.

10 AGL Energy Limited10 AGL Energy Limited
AGL is committed to ensuring that its corporate governance framework, policies and practices reflect a high standard of corporate governance. The AGL Board believes that best practice corporate governance standards support sustainable performance by AGL over time.
Corporate Governance Summary
Set out below is a summary of selected aspects of AGL’s corporate governance framework, policies and practices.
Corporate Governance Statement Throughout FY17, AGL’s corporate governance arrangements were consistent with the Corporate Governance Principles and Recommendations (3rd edition) published by the ASX Corporate Governance Council.
AGL’s 2017 Corporate Governance Statement is available at www.agl.com.au/ CorporateGovernance. The Corporate Governance Statement outlines AGL’s arrangements in relation to its Board, Board Committees, Executive Team, risk management framework and financial reporting, diversity and inclusion, key corporate governance policies and shareholder engagement. AGL’s website also contains copies of AGL’s Board and Committee Charters and key policies and documents referred to in the Corporate Governance Statement.
AGL’s BoardAGL’s Board is responsible for the governance of AGL and for reviewing and approving AGL’s strategic direction and for providing effective oversight of AGL’s management. AGL’s current strategy, approved by the Board, is discussed in detail in the Chairman’s Letter, Managing Director & CEO’s Report and Operating & Financial Review, and set out graphically on page 5.
The Board seeks to safeguard AGL’s interests and foster sustainable value creation while taking into account the reasonable interests of shareholders, employees, customers, the communities in which AGL operates and other relevant stakeholders.
Composition and RenewalAs at the date of this report, AGL has nine Directors, comprising eight Non-Executive Directors and the Managing Director & CEO, Andy Vesey. With the exception of the CEO, all of our Directors have been determined by the Board to be independent. Information about our Directors can be found in the Director’s Report on pages 12 to 13.
AGL seeks to maintain a Board which comprises individuals best able to discharge the responsibilities of Directors having regard to the execution of AGL’s strategic objectives, the requirements of the law and to the highest standards of corporate governance.
During FY17, there were a number of changes to AGL’s Board:
• Bruce Phillips resigned as a Non-Executive Director at our 2016 AGM in September 2016.
• Diane Smith-Gander was elected as a Non-Executive Director at our 2016 AGM in September 2016.
• Peter Botten joined the Board as a Non-Executive Director on 21 October 2016.
AGL’s Board will reduce to eight Directors when the existing Chairman, Jerry Maycock, retires at the 2017 AGM to be held on 27 September 2017. As announced on 21 June 2017, Graeme Hunt will become Chairman following the conclusion of the 2017 AGM.
The Board has adopted a skills matrix which sets out the mix of skills and experience that the current Directors possess. A copy of the matrix is provided below and further detail can be found online in AGL’s 2017 Corporate Governance Statement. The Board considers that its current members have an appropriate mix of skills that enable the Board to discharge its responsibilities and deliver AGL’s strategic objectives.
The Board has established an Audit & Risk Management Committee, Nominations Committee, People & Performance Committee and Safety, Sustainability & Corporate Responsibility Committee. Details of each Committee are set out in the 2017 Corporate Governance Statement while Directors’ memberships of relevant Committees are noted on page 12. Each of these Committees assists the Board with specified responsibilities that are set out in the Committee Charters, as delegated and approved by the Board.
AGL’s Managing Director & CEO is responsible for AGL’s day-to-day affairs and has the authority to control AGL’s affairs in relation to all matters other than those responsibilities specifically reserved to the Board.
Performance Evaluation and Remuneration AGL’s policy is to reward executives with a combination of fixed remuneration and short and long-term incentives that are designed to create value for Shareholders. Non-Executive Directors do not receive any performance-based remuneration.
The performance evaluation process for the Board and Board Committees is set out in the 2017 Corporate Governance Statement. Information about the remuneration of AGL’s key management personnel together with the process for performance evaluation is set out in the Remuneration Report, commencing on page 32.
Risk ManagementAGL faces a wide variety of risks due to the nature of its operations. Details of AGL’s material business risks are set out in the Operating & Financial Review on pages 17 to 18. Further, a detailed report about AGL’s economic, environmental and social sustainability risks, including how these risks are managed, is included in AGL’s Sustainability Report which can be found on our website at www.agl.com.au/ 2017SustainabilityReport

Gas Experience: Knowledge of the supply storage and transportation aspects of Australia’s gas energy markets including trading, contracting and wholesale pricing. Electricity Experience: Knowledge of the essential elements of the National Electricity Market including trading, contracting and wholesale and retail pricing. A knowledge of the generation market (renewables, coal and gas) as well as downstream retail and commercial & industrial market dynamics.Operations/ Asset Management: Having led or overseen the management of complex operating assets which require the leadership of a large, skilled workforce.Corporate Finance: Experience leading or overseeing the corporate finance function within a large business or investment banking environment. Experience dealing with a range of funding sources and capital structuring models and financial accounting and reporting.Risk Management: A working knowledge of contemporary risk and compliance management practices. Experience managing business risks and the activities necessary to manage and mitigate risk.Customer/ Retail: Knowledge of customer segmentation models and how to influence customer behavior in an increasingly digital world. This experience would ideally come from a retail environment, however business-to-business sales in the commercial or industrial environment is also highly relevant.Technology/ Industry Transformation: Experience and insights from industries that have been through significant technology/digital disruption or transformation. Experience with new and emerging technology. Large Public Company/ ESG Governance: Experience as a Director of public company Board(s); within the ASX100. Particularly relevant are businesses with large scale industrial assets with a strong track record of environmental and social governance and significant people and performance structures.
Average Tenure
5 yearsFemale
3/9Directors
6
6
8
9
9
8
7
9
Board Skills Matrix
Gas Experience
Electricity Experience
Operations/ Asset Management
Corporate Finance
Risk Management
Customer/ Retail
Technology/ Industry Transformation
Large Public Company/ ESG Governance
Number of Directors with Developed Capability
Annual Report 2017 11Annual Report 2017 11
Diversity and InclusionFor AGL, diversity covers demographic characteristics such as age, gender, sexual orientation, religion or national or social origin and personal characteristics such as disability, medical condition, pregnancy and other individual characteristics.
AGL’s Diversity & Inclusion Policy describes AGL’s approach to diversity and inclusion. AGL has established a Diversity & Inclusion Council to support the achievement of a diverse workforce and an inclusive workplace culture. The Council is chaired by the Managing Director & CEO, and during FY17 comprised 14 other leaders from across AGL’s major businesses, geographies and representing different diversity interests.
AGL’s diversity objectives and progress made during FY17 to achieve those objectives are set out in the 2017 Corporate Governance Statement and in the Sustainability Report.
Shareholder Engagement AGL has an established process to ensure that it complies with its continuous disclosure obligations at all times, including a quarterly confirmation by all members of the Executive Team in relation to compliance with continuous disclosure obligations.
AGL operates an investor relations program to facilitate effective two-way communications with investors. This program seeks to keep shareholders informed about AGL’s activities and to listen to issues or concerns raised by shareholders.
During FY17, AGL’s investor relations program included:
• Encouraging questions in advance of our AGM – AGL encourages shareholders to provide questions ahead of its AGM. This helps the company understand shareholder issues and concerns and address key areas of shareholder feedback.
• Electronic communications – Shareholders may elect to receive all shareholder communications, including dividend statements and announcements, by e-mail and can also communicate with AGL and AGL’s Share Registry electronically.
• Investor briefings – AGL holds regular investor briefings and asset tours, webcasts these events and provides all materials, archived recordings and transcripts via its website. In November 2016, AGL held an investor day in Sydney, which included detailed presentations on AGL’s strategy, operations and growth investments. In March 2017, AGL hosted a site tour of the AGL Torrens power station in South Australia.
• Webcasting important company events – Shareholder meetings are webcast and analyst/media briefings in relation to half-year and full year financial results and other significant events can be heard by teleconference and are also available on AGL’s website.

12 AGL Energy Limited12 AGL Energy Limited
Jeremy MaycockBEng (Mech) (Hons), FAICD, FIPENZ
Non-executive Director since October 2006 and Chairman since October 2010. Age 65.
Current Directorships: Chairman of Port of Brisbane Pty Ltd, Director of The Smith Family and BRW Building Services Pty Limited.
Former Directorships of listed companies over the past 3 years: Jerry was a Director of Arrium Limited from 19 August 2014 until 21 October 2016, and held the position of Chairman from 17 November 2014. Jerry was also a Director of Nuplex Industries Limited from 1 September 2011 until 1 November 2014.
Experience: Jerry has had a long commercial career in senior business roles in Australia, New Zealand and South East Asia, the majority of his experience being in construction materials with Swiss group Holcim Ltd. Latterly, he held CEO and MD positions in Australian listed companies including CSR Ltd. Jerry is a Fellow of the Australian Institute of Company Directors and the Institute of Professional Engineers NZ.
Andy VeseyBA (Econ), BSc (Mec. Eng.), MS
Managing Director and Chief Executive Officer since February 2015. Age 62.
Former Directorships of listed companies over the past 3 years: Nil
Experience: Andy has over 30 years’ experience in the energy industry including strategic and commercial leadership of large energy organisations, and working in complex regulatory and political environments. His experience extends across the energy supply chain including power development, generation, distribution and retail businesses in the Americas, Europe, Africa and Asia.
Jacqueline HeyBCom, Grad Cert (Mgmt), GAICD
Non-executive Director since March 2016. Age 51.
Current Directorships: Director of Qantas Airways Limited (commenced 29 August 2013), Bendigo and Adelaide Bank Limited (commenced 5 July 2011), Australian Foundation Investment Company Ltd (commenced 31 July 2013), Cricket Australia and Melbourne Business School and Member of Brighton Grammar School Council.
Former Directorships of listed companies over the past 3 years: Nil
Experience: Jacqueline has enjoyed a successful executive career prior to becoming a full-time company director in 2011. Jacqueline has extensive experience in the areas of information technology, telecommunications and marketing. Jacqueline worked with Ericsson for more than 20 years in finance, marketing and sales and in leadership roles in Australia, Sweden, the UK and the Middle East.
Composition of Board Committees as at 30 June 2017
Director Status
Audit and Risk Management Committee
People and Performance Committee
Safety, Sustainability and Corporate Responsibility
CommitteeNominations Committee
Jerry Maycock Independent Chair
Andy VeseyManaging Director and Chief Executive Officer
Jacqueline Hey Independent ✔ ✔ ✔
Les Hosking Independent ✔ Chair ✔
Graeme Hunt Independent ✔ Chair ✔
Belinda Hutchinson Independent ✔ ✔ ✔
Peter Botten Independent ✔ ✔
John Stanhope Independent Chair ✔ ✔
Diane Smith-Gander Independent ✔ ✔ ✔
The Directors present their Report, set out on pages 12 to 58, including the Operating & Financial Review (pages 15 to 31), the Remuneration Report (pages 32 to 56) and Other Required Disclosures (pages 56 to 58); together with the annual Financial Report of AGL Energy Limited (AGL) and its consolidated entities, being AGL and its controlled entities, for the year ended 30 June 2017 and the Independent Auditor’s Report thereon.
AGL is the head entity of the AGL Energy Limited Group. Its shares are listed on ASX Limited under the code ‘AGL’.
The names of the persons who have been Directors, or appointed as Directors, during the period since 1 July 2016 and up to the date of this Report are Andy Vesey (Managing Director & CEO), Jerry Maycock (Chairman), Les Hosking, Graeme Hunt, Belinda Hutchinson, Jacqueline Hey, Bruce Phillips (retired 28 September 2016), John Stanhope, Peter Botten (from 21 October 2016) and Diane Smith-Gander (from 28 September 2016).
Details of the skills, qualifications, experience and responsibilities of AGL’s Directors as at the date of this Report are set out below.
Directors’ Report

Annual Report 2017 13Annual Report 2017 13
Les Hosking
Non-executive Director since November 2008. Age 72.
Current Directorships: Chairman of Adelaide Brighton Limited (commenced as a Non Executive Director on 10 June 2003) and an Adjunct Professor of the University of Sydney John Grill Centre for Project Leadership.
Former Directorships of listed companies over the past 3 years: Nil
Experience: Les has over 30 years of experience in trading, broking and management in metals, soft commodities, energy and financial instrument derivatives in the global futures industry. He was previously a Director of The Carbon Market Institute Limited, Innovation Australia Pty Limited, Australian Energy Market Operator Limited (AEMO), and Managing Director and Chief Executive Officer of NEMMCo.
Graeme HuntMBA, BMET
Non-executive Director since September 2012. Age 60.
Current Directorships: Chairman of the National Resources Science Precinct and the Western Australian Energy Research Alliance.
Former Directorships of listed companies over the past 3 years: Graeme was a Director of Broadspectrum Limited (formerly known as Transfield Services Limited) from 7 May 2012 until 31 December 2016, and held the position of Managing Director and Chief Executive Officer from 1 November 2012 until 31 December 2016.
Experience: Graeme has extensive experience in establishing and operating large capital projects. He was previously Managing Director of Broadspectrum Limited and Managing Director of Lihir Gold Limited. He has also held a number of senior executive positions in a 30 year career with the BHP Group.
Belinda HutchinsonAM, BEc, FCA, FAICD
Non-executive Director since December 2010. Age 64.
Current Directorships: Chancellor of the University of Sydney, Chairman of Thales Australia Limited (commenced 27 August 2015) and Future Generation Global Investment Company (commenced 28 May 2015), a Director of Australian Philanthropic Services and a Member of St Vincent’s Health Australia NSW Advisory Council.
Former Directorships of listed companies over the past 3 years: Nil
Experience: Belinda has extensive experience in non-executive roles including as Chairman of QBE Insurance Limited, a Director of Telstra Corporation Limited, Coles Group Limited, Crane Group Limited, Energy Australia Limited, TAB Limited, Snowy Hydro Trading Limited and Sydney Water. Her executive career included her role as an Executive Director of Macquarie Group, a Vice President of Citibank and a senior manager at Andersen Consulting.
Peter BottenCBE, BSc, ARSM
Non-executive Director since 1 October 2016. Age 62.
Current Directorships: Council Member of the Australia PNG Business Council, Chairman of the Oil Search Foundation, Business for Development Australia, Hela Provincial Health Authority, the National Football Stadium Trust in Papua New Guinea and Managing Director of Oil Search Limited (appointed on 28 October 1994).
Former Directorships of listed companies over the past 3 years: Nil
Experience: Peter has been Managing Director of Oil Search Limited since 1994, overseeing its development into a major Australian Securities Exchange-listed company. Peter has extensive worldwide experience in the oil and gas industry, holding various senior technical, managerial and board positions in a number of listed and government-owned bodies.
Diane Smith-GanderBEc, MBA, FAICD, FGIA, Hon. DEc, FAIM, GAICD
Non-executive Director since 28 September 2016. Age 59.
Current Directorships: Chair of Safe Work Australia and the Asbestos Safety and Eradication Council, a Director of Wesfarmers Limited (commenced 27 August 2009), Keystart Loans Limited, Henry Davis York, Councillor of Methodist Ladies College and Member of the UWA Business School Advisory Board.
Former Directorships of listed companies over the past 3 years: Diane was a Director of Broadspectrum Limited (formerly known as Transfield Services Limited) from 22 October 2010 until 16 September 2016, and held the position of Chair from 25 October 2013 until 16 September 2016.
Experience: Diane has extensive Australian and international experience in banking and finance, technology, and strategic and management consulting. This includes a former Partner at McKinsey in Washington DC and New Jersey in the US, and Group Executive IT and Operations, Westpac Banking Corporation.
John Stanhope AMBCom (Economics and Accounting), FCPA, FCA, FAICD, FAIM, FAHRI
Non-executive Director since March 2009. Age 66.
Current Directorships: Chairman of Australia Post, Port of Melbourne, The Bionics Institute of Australia and Melbourne Jazz Limited, Chancellor of Deakin University and a Member of the International Integrated Reporting Council’s Governance and Nominations Committee.
Former Directorships of listed companies over the past 3 years: Nil
Experience: John has many years of experience in senior positions in financial, communications and other commercial roles. He was previously a member of the Financial Reporting Council and a Director of RACV Ltd and of Telstra Corporation Limited.

14 AGL Energy Limited
Directors’ InterestsThe relevant interest of each Director in the share capital of AGL or any of its related bodies corporate, as notified by the Directors to the ASX in accordance with Section 205G of the Corporations Act, at the date of this Report is as follows:
AGL Energy Limited Ordinary Shares
Jerry Maycock 79,831Andy Vesey 267,617Les Hosking 5,001Graeme Hunt 4,000Belinda Hutchinson 9,156John Stanhope 7,717Jacqueline Hey 3,519Peter Botten 2,390Diane Smith-Gander 5,670
Jerry Maycock holds 1,500 Subordinated Notes issued by AGL Energy Limited.
No options have been granted over any securities or interests of AGL or the consolidated entity.
Company SecretariesJohn Fitzgerald was appointed Company Secretary on 1 October 2015. In December 2007, John was appointed General Counsel and continues to hold that position in addition to his role as Company Secretary. John’s qualifications are a Bachelor of Arts and a Bachelor of Laws from the University of New South Wales and a Masters in Arts from the National University of Ireland (University College Dublin). John is admitted as a Solicitor of the Supreme Court of New South Wales and has been practising in projects, mining and energy law for over 20 years.
Melinda Hunter was appointed as an additional Company Secretary on 23 May 2017. Melinda’s qualifications are a Bachelor of Commerce and a Bachelor of Laws from Macquarie University. Melinda is admitted as a Solicitor of the Supreme Court of New South Wales and has been practising corporate law for over 15 years.
DividendsThe annual dividend for the year ended 30 June 2017 was 91.0 cents per share (80% franked) compared with 68.0 cents per share (100% franked) for the prior year. The FY17 dividend includes an interim dividend of 41.0 cents per share paid on 27 March 2017 and a final dividend of 50.0 cents per share payable on 22 September 2017.
For more information on dividends, refer to the Other Required Disclosures on page 57.
Directors’ Meetings The number of Directors’ Meetings (including meetings of Committees of Directors) and number of meetings attended by each of the Directors of AGL during the financial year ended 30 June 2017 were:
Regular Board Meetings Special Board Meetings
Audit and Risk Management Committee
People and Performance Committee
Safety, Sustainability and Corporate Responsibility
CommitteeNominations Committee
Director’s Name A B A B A B A B A B A B
Jerry Maycock 11 11 6 6 5 5Andy Vesey 11 11 6 6Jacqueline Hey 11 11 6 6 5 5 4 4 5 5Les Hosking 11 11 6 6 5 5 6 6 5 5Graeme Hunt 10 11 5 6 6 6 4 4 5 5Belinda Hutchinson 11 11 5 6 5 5 6 6 5 5Peter Botten 8 8 4 4 2 3 3 4Diane Smith-Gander 8 8 4 4 5 5 4 4 4 4John Stanhope 11 11 5 6 5 5 6 6 5 5Bruce Phillips 3 3 1 2 1 1
A – number of meetings attended as a memberB – number of meetings held during the time the Director held office during the yearDuring the year, in aggregate, there were 23 occasions when non-executive Directors also attended some of the meetings of committees, of which they were not members.Directors also participated in informal meetings and telephone conferences. AGL makes extensive use of email between meetings to keep Directors informed of current developments; to provide relevant background and industry information; to settle routine matters and allow formal Board meetings to concentrate on more important matters. Periodically, Directors meet informally outside AGL to discuss matters of interest and travel to visit assets, operations or locations of particular relevance to AGL.
Directors’ Report

Annual Report 2017 15
Operating & Financial ReviewFor the year ended 30 June 2017
Contents
1 About AGL1.1. Operating Segments1.2. Significant Changes to Assets
2. Review of Financial Position2.1. Hedging Position
3. Business Strategies and Future Prospects3.1 Greenhouse Gas Policy and Generation
Investment Review3.2. Material Business Risks and Mitigations
4. Group Results4.1. Reconciliation of Statutory Profit/(Loss) to
Underlying Profit4.2. Underlying Profit Summary4.3. Net Finance Costs4.4. Income Tax (Expense)/Benefit4.5. Significant Items4.6. Powering Australian Renewables Fund (PARF)4.7. Changes in Fair Value of Financial Instruments
5. Review of Operations5.1. Energy Markets Underlying EBIT5.2. Group Operations Underlying EBIT5.3. Investments Underlying EBIT5.4. Centrally Managed Expenses Underlying EBIT5.5. Segment Restatement
6. Portfolio Review6.1. Electricity Portfolio6.2. Gas Portfolio
7. Cash Flow7.1. Reconciliation of Underlying EBITDA to Cash Flow7.2. Capital Expenditure
8. Business Acquisitions and Disposals
1. About AGLAGL is a leading integrated energy company that has been operating for more than 180 years and is committed to helping shape a sustainable energy future for Australia. AGL operates the country’s largest private electricity generation portfolio, its total capacity of 10,246 MW accounted for 25% of total generation within the National Electricity Market in the financial year ended 30 June 2017. AGL is also the largest ASX-listed investor in renewable energy, an active participant in gas and electricity wholesale markets and has more than 3.6 million gas and electricity customer accounts.
1.1 Operating SegmentsAGL manages its business in three key operating segments: Energy Markets, Group Operations and Investments.
• Energy Markets sells electricity, gas and energy-related products and services to consumer, business and wholesale customers and is responsible for managing the wholesale risks associated with servicing those customers.
• Group Operations comprises AGL’s power generation portfolio and other key sites and operating facilities including the Newcastle Gas Storage Facility.
• Investments includes AGL’s interests in the ActewAGL Retail Partnership, Powering Australian Renewables Fund, Energy Impact Partners’ Fund and Sunverge Energy.
In accordance with Australian Accounting Standard AASB 8 Operating Segments, AGL reports segment information on the same basis as its internal management structure. As such, the Energy Markets operating segment reports the majority of the revenue and margin from AGL’s activities, while the Group Operations operating segment reports the majority of the expenses.
AGL manages and reports a number of expense items including information technology under Centrally Managed Expenses to maximise efficiency and optimise service levels. These costs are not formally reallocated to the other operating segments because their management is the responsibility of various corporate functions.
1.1.1 Energy MarketsEnergy Markets comprises three Business Units: Wholesale Markets; Customer (formerly Consumer Market and Business Customers); and New Energy Services.
• Wholesale Markets comprises Wholesale Electricity, Wholesale Gas and Eco Markets and is responsible for managing the price risk associated with procuring electricity and gas for AGL’s customers and for managing AGL’s obligations in relation to renewable energy schemes. Wholesale Markets also controls the dispatch of AGL’s owned and contracted generation assets and an associated portfolio of energy hedging products.
− Wholesale Electricity is responsible for managing the procurement of key fuel inputs and hedging of AGL’s wholesale electricity requirements, for commercial management of the generation portfolio and for wholesale pricing to support AGL’s consumer and business customer bases.

Directors’ Report continued
16 AGL Energy Limited
− Wholesale Gas is responsible for sourcing and managing AGL’s gas supply and transportation portfolio to maximise wholesale price effectiveness for the Customer business unit. Wholesale Gas supplies other retailers, internal and third-party gas-fired generators, and other gas customers. Wholesale Gas is also responsible for the management of the price exposures related to AGL’s oil-linked wholesale gas contracts.
− Eco Markets is responsible for managing AGL’s liabilities relating to both voluntary and mandatory renewable energy schemes, the largest being the Small Scale Renewable Energy Scheme (SRES) and the Large Scale Renewable Energy Target (LRET).
• The Customer business unit services consumers and business customers. It sources its energy from Wholesale Markets at a transfer price calculated based on methodologies that reflect the prevailing wholesale market conditions and other energy costs in each state.
• New Energy Services comprises AGL’s residential and commercial solar and business energy efficiency solutions businesses.
In December 2016, AGL announced that its New Energy operations would no longer comprise a separate operating segment following the decision to refocus New Energy as an innovation accelerator. Consequently, the New Energy Services and Distributed Energy Services businesses were transferred to the Energy Markets and Group Operations operating segments, respectively.
In May 2017, AGL announced it would change its operating segment structure to reflect management reporting changes aligned with the splitting of the Energy Markets operating segment into two new segments, one comprising the Wholesale Markets business unit and one comprising the Customer and New Energy Services business units titled Customer Markets. These changes were effective 1 July 2017 and do not impact FY17 reporting.
1.1.2 Group OperationsGroup Operations comprises four business units: Thermal; Renewables; Natural Gas; and Other Operations.
• Thermal primarily comprises: AGL Macquarie (4,640 MW), comprising the Bayswater and Liddell black coal power plants in New South Wales; AGL Loy Yang (2,210 MW), a brown coal mine and power plant in Victoria; and AGL Torrens (1,280 MW), a gas power plant in South Australia.
• Renewables primarily comprises 924 MW of wind power generation in South Australia and Victoria; 788 MW of hydro-electric power stations in Victoria and New South Wales; and 155 MW of solar power in New South Wales.
• Natural Gas comprises the Newcastle Gas Storage Facility in New South Wales and the Silver Springs underground gas storage facility in Queensland. It also includes the natural gas production assets at Camden in New South Wales and Moranbah in Queensland. Consistent with its February 2016 announcement that it would be exiting gas exploration and production as a core activity, AGL is seeking to divest the Moranbah assets.
• Other Operations primarily comprises the Distributed Energy Services business (including the Active Stream digital metering business, other businesses collectively known as the National Assets; and the solar and storage installation businesses).
1.2 Significant Changes to AssetsIn February 2016, AGL created the Powering Australian Renewables Fund (PARF), of which AGL would own 20% of the equity, to develop and own approximately 1,000 MW of large-scale renewable energy generation assets. During FY17 AGL divested its solar plants at Nyngan and Broken Hill and its wind farm project in Silverton (all in New South Wales) into PARF for $293 million. At 30 June 2017, AGL had invested $14 million of equity in PARF.
In November 2016, AGL announced it would make a US$50 million commitment, over five years, in US-based Energy Impact Partners’ Fund investing in high growth companies optimising energy consumption, improving sustainable energy generation and empowering consumers. Target segments include energy efficiency, sustainable generation, storage, connected devices, big data and software solutions, and energy management. At 30 June 2017, AGL had invested US$12 million (AU$16 million) of this commitment.
2. Review of Financial PositionAGL’s financial position is consistent with the strong profitability of AGL’s operations, the strong conversion of income to cash flow and the relatively essential nature of the services AGL provides to its customers.
AGL maintained its credit rating of Baa2 as provided by Moody’s Investor Services throughout the year. Key metrics consistent with this credit rating at 30 June 2017 and calculated with a similar methodology were as follows:
• Interest cover: 7.5x
• Funds from operation to net debt: 35%
AGL’s gearing (measured as the ratio of net debt to net debt plus equity) at 30 June 2017 was 29.6% compared with 25.7% 30 June 2016.
In September 2016, the Board introduced a change to dividend policy to target a payout ratio of 75% of Underlying Profit after tax and a minimum franking level of 80%, to enable growth in returns to shareholders. The payout ratio had been between 60% and 65% over the prior five financial years and franking had been maintained at 100%. The new policy applied from the interim dividend paid to shareholders in March 2017. Total dividends declared for FY17 of $602 million were 31% higher than FY16.
AGL continued to operate its Dividend Reinvestment Plan (DRP) during the period, at nil discount. During the year, AGL acquired shares for allotment to DRP participants on market, thereby preventing any dilutive effect from the DRP.
In October 2016, AGL began a program to acquire up to 5% of its issued share capital (33.7 million shares, or $596 million at the time of announcement) via an on-market share buyback. At 30 June 2017, AGL had acquired 18.9 million shares under the buyback for a total consideration of $473 million.
At 30 June 2017, AGL’s total assets were $14,458 million, down slightly from $14,604 million at 30 June 2016. There was no significant change to the composition of AGL’s assets during the year.
Total equity at 30 June 2017 was $7,574 million. Return on equity (calculated as Underlying Profit after tax divided by average monthly equity for the year) for the period was 10.2%, an improvement from 8.3% from FY16. This reflected an increase in Underlying Profit (see section 4.2) as well as reduction in average monthly equity from $8,466 million to $7,899 million, mainly as a result of the on-market share buyback.
Annual Report 2017 17
Total liabilities at 30 June 2017 were $6,884 million, up from $6,678 million at 30 June 2016. The primary change to borrowings during FY17 was the issuance in December 2016 of US$395 million of US Private Placement notes in 12, 13 and 15-year tranches, and AU$50 million of notes in a 10-year tranche.
Reflecting the above changes, net debt at 30 June 2017 was $3,178 million, up from $2,746 million at 30 June 2016.
The average tenor of AGL’s borrowings at 30 June 2017 was 5.9 years, up from 4.3 years as at 30 June 2016, reflecting the impact of the notes issuance and the net reduction in bank debt.
2.1 Hedging PositionAGL’s primary hedging activities relate to its wholesale markets risk management. Details of the group’s hedging position at any particular time are not disclosed for reasons of commercial confidence.
AGL has in place a governance framework that establishes the policy guidelines under which energy hedging activities are conducted. Key components of that policy include segregation of duties, independent risk oversight, earnings-at-risk limits, and regular reporting to the Board. The risk policy mandates that the principal purpose of energy trading is to hedge AGL’s market price exposure resulting from operating an integrated energy business.
The policy allows for commercial optimisation of the portfolio provided that overall earnings-at-risk limits are adhered to and AGL’s risk appetite objectives are not endangered.
3. Business Strategies and Future ProspectsAGL believes it has two strategic imperatives: to prosper in a carbon-constrained future as energy markets respond to community expectations in relation to climate change; and to build customer advocacy as changes in distributed energy and mobile technology alter customer expectations.
Consistent with these imperatives, AGL is currently pursuing four key objectives that drive its strategy and decision making:
• To move from being a mass-market retailer to offering customers a more personalised experience. AGL’s flagship initiative in this space is the $300 million Customer Experience Transformation program;
• To move from being an owner and operator of large assets to being an orchestrator of both large and small assets. AGL’s flagship initiative in this space is the $20 million Virtual Power Plant project in South Australia;
• To move from reliance on high emissions technology to much lower emissions alternatives. AGL’s flagship initiative in this space is the Powering Australian Renewables Fund (described in section 1.2 above); and
• To move from leveraging business platforms in existing markets to leveraging those platforms in new geographies as well. AGL’s expansion into the Western Australian gas retail market is consistent with this objective. In addition AGL is exploring opportunities to operate in competitive retail energy markets in certain select markets overseas.
The definition of AGL’s imperatives and objectives is the result of detailed scenario planning and uncertainty analysis undertaken by AGL on an ongoing basis and reviewed periodically by the Board. To support delivery and the creation of value for shareholders, AGL organises its activities using a strategic framework organised in three key streams: embracing transformation, driving productivity and unlocking growth. A diagram detailing AGL’s strategic objectives is set out on page 37.
3.1 Greenhouse Gas Policy and Generation Investment ReviewAGL has committed under its Greenhouse Gas Policy to exit its coal-fired generation assets by 2050 (by closing Liddell, Bayswater and Loy Yang plants in 2022, 2035 and 2048 respectively as they reach end of life) and remains an innovator in renewables investment (for example through the Powering Australian Renewables Fund).
AGL is undertaking a detailed state-by-state assessment of Australia’s potential energy generation supply and capacity requirements until 2025. This project will inform the nature and scale of AGL’s future investment in new low-emissions generation and storage technologies as aging coal-fired generation is withdrawn from the National Electricity Market.
The project will also offer insight into how AGL should make those investments to ensure shareholders’ capital is deployed responsibly in the context of significant uncertainties in relation to regulation and technology.
As a result of the commitment to exit its coal-fired generation assets, AGL has undertaken a detailed review of the expected rehabilitation costs and impact on current provision balances. Further details of this review are contained in the Rehabilitation Report released on 10 August 2017.
3.2 Material Business Risks and MitigationsAGL’s enterprise wide risk program is aligned with the principles and requirements of ISO 31000, the international standard for risk management. This program is supported by AGL’s Risk Management Policy and Risk Management Standard. Consistent with this, AGL’s risk management process identifies factors critical to the successful delivery of its business strategies and future prospects. As at the date of this Report, there were 10 factors identified, as follows:
• Anticipatory culture and human capital;
• Strong and appropriate governance;
• Resilience capability;
• Asset safety and reliability;
• Optimisation of wholesale energy markets;
• Stakeholder advocacy;
• Financial management and value proposition;
• Transition to low emissions technology;
• Data and IT security management; and
• Becoming a customer-led, digital-first retailer.

Directors’ Report continued
18 AGL Energy Limited
At the June 2017 Audit and Risk Management Committee review, it was determined that the highest levels of residual risk (post mitigation) related to the following four critical success factors: asset safety and reliability; optimisation of wholesale energy markets; stakeholder advocacy; and data and IT security management. A description of these factors and current mitigating actions is set out in the following table.
Description of critical success factor Priority focus areas
Asset safety and reliability: management of operational assets throughout their life-cycle whilst enabling optimisation of wholesale market positions
Continued focus on long-term planning process to optimise availability and asset efficiencyImplementation of expanded health, safety and environment monitoring of contractor activitiesDevelopment and approval of rehabilitation programs for all assets including community engagement and financial modelling
Optimisation of wholesale energy markets: to deliver a reliable and competitive energy solution to the customer
Assessment of alternative gas supply opportunities including a potential LNG import facilityProactive management of response to government and regulatory reviewsContinued focus on gas contracting, haulage and transportation strategy
Stakeholder advocacy: identification and engagement of stakeholders in an appropriate, targeted and consistent manner to achieve operational and growth objectives, anticipate political and regulatory outcomes and manage reputational risk
Government engagement in relation to key review processes, including ACCC reviews of electricity and gas marketsPublic policy leadership in relation to energy market reformContinued focus on social and economic inclusion strategies
Data and IT security management: effective, efficient and appropriate creation, collection, management, storage, retrieval, disposal and protection of data integrity
Delivery of cyber security program of work including review of third -party riskRevision of privacy compliance plan and incident management proceduresImplementation of Data & Information Governance Policy
A full description of AGL’s risk management framework is provided in the annual Corporate Governance Statement.
4. Group Results4.1 Reconciliation of Statutory Profit/(Loss) to Underlying Profit4.1.1 Profit/(Loss) after Tax
Year ended30 June 2017
$m
Year ended30 June 2016
$m
Statutory Profit/(Loss) after tax 539 (408)Adjust for:Significant items after tax Impairment charges – 640 Restructuring costs – 60 Asset disposals – (8)Changes in fair value of financial instruments after tax 263 417Underlying Profit after tax 802 701
Statutory Profit/(Loss) after tax attributable to shareholders was $539 million, compared with ($408 million) in the prior year, reflecting the non-recurrence of $692 million of significant items from impairments, restructuring costs and asset disposals, a decrease in the change in fair value of financial instruments to $263 million from $417 million and higher underlying earnings.
Underlying Profit after tax was $802 million, up 14.4% from $701 million in the prior year. A description of the factors driving Underlying Profit is included in Section 4.2.
Year ended30 June 2017
Year ended30 June 2016
Earnings per share on Statutory Profit/(Loss)1 80.5 cents (60.5) centsEarnings per share on Underlying Profit1 119.8 cents 103.9 cents
1. EPS calculations have been based upon a weighted average number of ordinary shares of 669,299,682 (30 June 2016: 674,712,378).

Annual Report 2017 19
4.1.2 Earnings before Interest and Tax (EBIT)Year ended
30 June 2017$m
Year ended30 June 2016
$m
Statutory EBIT 988 (256)Significant items – 868Change in fair value of financial instruments 376 595Finance income included in Underlying EBIT 4 4Underlying EBIT 1,368 1,211
4.2 Underlying Profit SummaryYear ended
30 June 2017$m
Year ended30 June 2016
$m
Revenue 12,584 11,150Underlying EBITDA 1,852 1,689Depreciation and amortisation (484) (478)Underlying EBIT 1,368 1,211 Energy Markets 2,413 2,274 Group Operations (825) (842) Investments 17 25 Centrally Managed Expenses (237) (246)Net finance costs (228) (222)Underlying Profit before tax and non-controlling interest 1,140 989Income tax expense (338) (287)Non-controlling interests – (1)Underlying Profit after tax 802 701
Underlying Profit after tax for the year ended 30 June 2017 was $802 million, up 14.4% compared with $701 million in the prior year. The principal drivers of the increase were: higher wholesale electricity prices, disciplined customer price management and cost reduction initiatives. Offsetting this were higher commodity costs, a decline in consumer electricity volumes and lower gas margin.
A detailed overview of results is provided in Section 5.
4.3 Net Finance CostsYear ended
30 June 2017$m
Year ended30 June 2016
$m
Finance costs (237) (236)Finance income 13 18Less: finance income included in EBIT (4) (4)Net finance costs (228) (222)
Finance costs were $237 million, up 0.4% from $236 million in the prior year. The increase was mainly due to higher rehabilitation interest costs arising from the December 2015 review of natural gas assets. This more than offset a reduction in average net debt to $3,024 million, compared with $3,240 million in the prior year. Finance income reduced by $5 million as a prior year loan to the Diamantina Power Station joint venture ceased during FY16. Capitalised interest for the year ended 30 June 2017 was $5 million.
4.4 Income Tax (Expense)/BenefitYear ended
30 June 2017$m
Year ended30 June 2016
$m
Statutory income tax (expense)/benefit (225) 67Income tax effect from significant items – (176)Income tax effect from changes in fair value of financial instruments (113) (178)Underlying tax expense (338) (287)
Underlying tax expense was $338 million, an increase of 17.8% from $287 million expense in the prior year. The underlying effective tax rate was 29.6% compared with 29.0% for the prior year. The increase in the effective tax rate was mainly due to the divestment of the solar plant assets to PARF.

Directors’ Report continued
20 AGL Energy Limited
4.5 Significant Items4.5.1 Impairment ChargesCurrent YearNil.
Prior YearIn February 2016, AGL announced that following a review of its natural gas assets, exploration and production of natural gas assets will no longer be a core business for AGL due to the volatility of commodity prices and long development lead times. As a result, AGL recognised an impairment charge of $640 million after tax in relation to those natural gas assets.
4.5.2 Restructuring CostsCurrent YearNil.
Prior YearRestructuring costs of $60 million after tax were recognised mainly in relation to labour costs associated with organisational reviews conducted during the year and strategic exiting and downsizing of non-core businesses to focus on growth areas that deliver greater value.
4.5.3 Asset DisposalsCurrent YearNil.
Prior YearAGL sold its 50% interests in the Macarthur Wind Farm joint venture and Diamantina Power Station and recognised a gain on sale of $8 million after tax.
4.6 Powering Australian Renewables Fund (PARF)AGL established PARF in February 2016 and holds a 20% equity interest in the fund. During FY17 AGL divested into PARF the 102 MW Nyngan and 53 MW Broken Hill solar plant assets (14 November 2016) and the 200 MW Silverton wind farm development site (19 January 2017). The financial impact of these divestments is shown in the table below. Refer to section 1.2 for additional information in relation to PARF.
Year ended30 June 2017
$m
Sale proceeds 293Government grant revenue 223Carrying value of assets (475)Transaction costs (19)Gain on divestment (included in Group Operations) 22Other financing costs (4)Underlying profit before tax impact 18Income tax expense (18)Underlying Profit after tax impact –
4.7 Changes in Fair Value of Financial InstrumentsAGL, in large part, uses financial instruments to manage energy and oil price risks (“derivatives”), but also to manage its exposure to interest rates and foreign exchange rates arising in the normal course of business. AGL considers this activity to be hedging in nature.
Australian Accounting Standard AASB 139 Financial Instruments: Recognition and Measurement requires derivatives and certain assets and liabilities, to be reported at their fair value in the financial statements. Changes in the fair value of derivatives between reporting periods for “effective hedges” are recognised in equity as an adjustment to the hedge reserve. AASB 139 considers derivatives to be effective hedges where the change in the fair value of the item being hedged and the change in the fair value of the derivative substantially offset each other. All other hedges are deemed to be ineffective hedges.

Annual Report 2017 21
Changes in the fair value of derivatives between reporting periods for “ineffective hedges” and other assets and liabilities carried at fair value, are recognised in the statement of profit or loss.
In AGL’s view, AASB 139’s definition of an effective hedge results in an appropriate outcome for the interest rate and foreign exchange rate hedging activity currently undertaken by AGL. However, it does not adequately address the more complex exposures from managing energy price risk. This means that a material number of AGL’s energy derivatives are not considered effective hedges under AASB 139.
The change in fair value of financial instruments reported in profit and loss for the year ended 30 June 2017 was a loss of $263 million after tax. For the year ended 30 June 2016, the change in fair value of financial instruments was a loss of $417 million after tax.
A reconciliation of the statement of financial position movement in financial instruments carried at fair value, which balances to the amount included in the statement of profit or loss for the year ended 30 June 2017 is presented in the following table:
Net Assets/(Liabilities)30 June 2017
$m30 June 2016
$mChange
$m
Energy derivative contracts (486) (115) (371)Cross currency and interest rate swap derivative contracts (38) 19 (57)Total net liabilities for financial instruments (524) (96) (428)Change in net liability (428)Premiums paid (122)Premium roll off 134Total change in fair value (416)Recognised in equity hedge reserve 57Recognised in borrowings (97)Recognised in profit and loss – pre tax (376)Total change in fair value (416)
5. Review of OperationsSummary of Underlying EBIT and EBITDA:
Year ended30 June 2017
$m
Year ended30 June 2016
$m
Underlying EBITDA 1,852 1,689Less: depreciation and amortisation (D&A) (484) (478)Underlying EBIT 1,368 1,211
The following table provides a breakdown of underlying EBIT by operating segment:
Year ended30 June 2017
$m
Year ended30 June 2016
$m
Energy Markets 2,413 2,274Group Operations (825) (842)Investments 17 25Centrally Managed Expenses (237) (246)Underlying EBIT 1,368 1,211

Directors’ Report continued
22 AGL Energy Limited
5.1 Energy Markets Underlying EBITIncreased 6.1% to $2,413 million from $2,274 million
The following table provides a breakdown of Gross Margin by business unit:
Year ended30 June 2017
$m
Year ended30 June 2016
$m
Wholesale Markets 1,996 1,859Customer 892 893New Energy Services 11 12Gross margin 2,899 2,764Less: net operating costs excluding D&A (391) (390)Underlying EBITDA 2,508 2,374Less: depreciation and amortisation (95) (100)Underlying EBIT 2,413 2,274
The following table provides a breakdown of underlying EBIT and EBITDA by business unit:
Wholesale Markets 1,975 1,837Customer 534 548New Energy Services (1) (11)Underlying EBITDA 2,508 2,374Wholesale Markets 1,967 1,828Customer 449 458New Energy Services (3) (12)Underlying EBIT 2,413 2,274
Energy Markets Underlying EBIT of $2,413 million was $139 million or 6.1% higher than the prior year due to higher Wholesale Markets gross margin and ongoing discipline in the management of customer pricing and net operating costs.
Gross margin performance was driven by growth in Wholesale Electricity. AGL effectively operated its generation assets to be available to benefit from prevailing market conditions including higher wholesale prices. This significantly outweighed higher coal and gas commodity market prices. Eco Markets margin growth was mainly due to higher market prices for Large-scale Generation Certificates (LGC) and AGL’s ability to meet a significant part of its compliance obligations through renewable generation and utilisation of existing certificates. This was partly offset by a decrease in Wholesale Gas due to additional gas supply purchases that were made at prevailing spot prices as a result of supply curtailment and the impact of the roll-off of higher margin Wholesale customer contracts. Refer to AGL’s ASX announcement on 7 July 2016.
Within Customer, Consumer Electricity margin grew reflecting disciplined and effective price management despite lower customer sales volumes and increased discounting. As expected, Consumer Gas margin was lower as a result of higher commodity costs, lower customer accounts and increased discounting within a highly competitive market. Business customer margins were broadly flat year on year.
Net Operating Costs were flat year on year largely due to ongoing cost savings within labour and contractor services, strategic decisions to exit several small and non-core businesses within New Energy Services, synergies from the integration of the Consumer and Business Customers business units to form Customer, and the benefits from activities to drive higher customer digital billing. These initiatives, combined with activities in other Business Units, contributed to AGL more than achieving the $170 million cost reduction target as announced by AGL to ASX on 26 May 2015. These favourable movements were partly offset by higher costs for AGL rebrand activities and investment associated with entering the Western Australian retail gas market.
5.1.1 Wholesale Markets Underlying EBITIncreased 7.6% to $1,967 million from $1,828 million
Year ended30 June 2017
$m
Year ended30 June 2016
$m
Wholesale Electricity 1,549 1,383Wholesale Gas 302 403Eco Markets 145 73Gross margin 1,996 1,859Less: net operating costs excluding D&A (21) (22)Underlying EBITDA 1,975 1,837Less: depreciation and amortisation (8) (9)Underlying EBIT 1,967 1,828
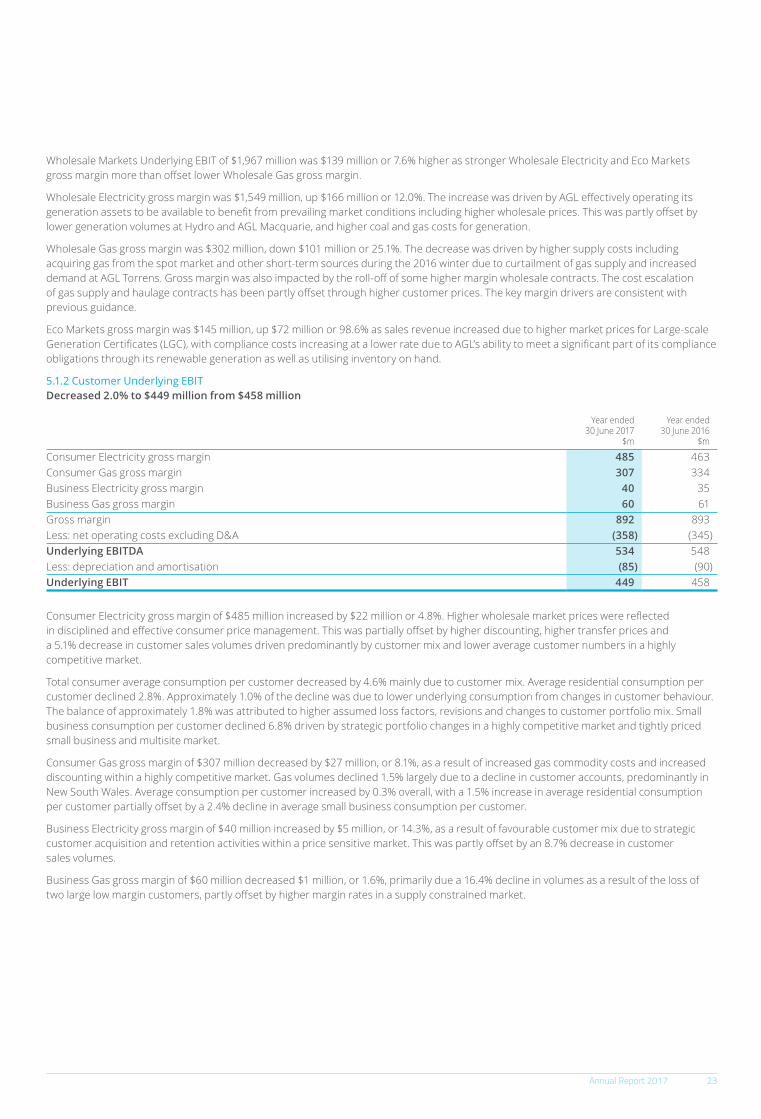
Annual Report 2017 23
Wholesale Markets Underlying EBIT of $1,967 million was $139 million or 7.6% higher as stronger Wholesale Electricity and Eco Markets gross margin more than offset lower Wholesale Gas gross margin.
Wholesale Electricity gross margin was $1,549 million, up $166 million or 12.0%. The increase was driven by AGL effectively operating its generation assets to be available to benefit from prevailing market conditions including higher wholesale prices. This was partly offset by lower generation volumes at Hydro and AGL Macquarie, and higher coal and gas costs for generation.
Wholesale Gas gross margin was $302 million, down $101 million or 25.1%. The decrease was driven by higher supply costs including acquiring gas from the spot market and other short-term sources during the 2016 winter due to curtailment of gas supply and increased demand at AGL Torrens. Gross margin was also impacted by the roll-off of some higher margin wholesale contracts. The cost escalation of gas supply and haulage contracts has been partly offset through higher customer prices. The key margin drivers are consistent with previous guidance.
Eco Markets gross margin was $145 million, up $72 million or 98.6% as sales revenue increased due to higher market prices for Large-scale Generation Certificates (LGC), with compliance costs increasing at a lower rate due to AGL’s ability to meet a significant part of its compliance obligations through its renewable generation as well as utilising inventory on hand.
5.1.2 Customer Underlying EBITDecreased 2.0% to $449 million from $458 million
Year ended30 June 2017
$m
Year ended30 June 2016
$m
Consumer Electricity gross margin 485 463Consumer Gas gross margin 307 334Business Electricity gross margin 40 35Business Gas gross margin 60 61Gross margin 892 893Less: net operating costs excluding D&A (358) (345)Underlying EBITDA 534 548Less: depreciation and amortisation (85) (90)Underlying EBIT 449 458
Consumer Electricity gross margin of $485 million increased by $22 million or 4.8%. Higher wholesale market prices were reflected in disciplined and effective consumer price management. This was partially offset by higher discounting, higher transfer prices and a 5.1% decrease in customer sales volumes driven predominantly by customer mix and lower average customer numbers in a highly competitive market.
Total consumer average consumption per customer decreased by 4.6% mainly due to customer mix. Average residential consumption per customer declined 2.8%. Approximately 1.0% of the decline was due to lower underlying consumption from changes in customer behaviour. The balance of approximately 1.8% was attributed to higher assumed loss factors, revisions and changes to customer portfolio mix. Small business consumption per customer declined 6.8% driven by strategic portfolio changes in a highly competitive market and tightly priced small business and multisite market.
Consumer Gas gross margin of $307 million decreased by $27 million, or 8.1%, as a result of increased gas commodity costs and increased discounting within a highly competitive market. Gas volumes declined 1.5% largely due to a decline in customer accounts, predominantly in New South Wales. Average consumption per customer increased by 0.3% overall, with a 1.5% increase in average residential consumption per customer partially offset by a 2.4% decline in average small business consumption per customer.
Business Electricity gross margin of $40 million increased by $5 million, or 14.3%, as a result of favourable customer mix due to strategic customer acquisition and retention activities within a price sensitive market. This was partly offset by an 8.7% decrease in customer sales volumes.
Business Gas gross margin of $60 million decreased $1 million, or 1.6%, primarily due a 16.4% decline in volumes as a result of the loss of two large low margin customers, partly offset by higher margin rates in a supply constrained market.

Directors’ Report continued
24 AGL Energy Limited
5.1.3 Energy Markets Net Operating CostsDecreased 0.8% to $486 million from $490 million
Year ended30 June 2017
$m
Year ended30 June 2016
$m
Labour and contractor services (159) (176)Bad and doubtful debts (77) (73)Campaigns and advertising (97) (93)Other expenditure (82) (92)Fees, charges and other margin 24 44Net operating costs excluding D&A (391) (390)Less: depreciation and amortisation (95) (100)Net operating costs (486) (490)
Labour and contractor services costs decreased by $17 million, or 9.7%, due to targeted operating cost saving initiatives and restructuring to leverage synergies across the Energy Markets business, which have more than offset inflationary increases.
Bad and doubtful debts increased $4 million as Consumer bad debt expense was $7 million higher due to the impact of customer price changes, which resulted in an increase in overall outstanding debt and higher provisioning. Partly offsetting this was a favourable Business Customers bad debt expense movement of $3 million driven by improved customer risk profile and debt ageing, resulting in lower provisioning.
Campaigns and advertising costs increased by $4 million, or 4.3% due to the AGL rebrand and costs associated with entering the Western Australian gas market from 1 July 2017.
Other expenditure decreased $10 million, or 10.9%, due to the introduction of a customer paper bill and over the counter payment cost recovery, continued growth in the number of digital billing customers and other targeted operating cost saving initiatives.
Fees, charges, and other margin decreased $20 million, or 45.5%, mainly as a result of the cessation of non-core businesses, the transition of retail services previously provided to ActewAGL and lower ConnectNow commission revenue with a higher proportion of ConnectNow customers choosing AGL as their energy provider.
5.1.4 Consumer Customer Profitability and Operating EfficiencyAGL uses EBIT per customer as its primary measure of customer profitability, with gross margin per customer used as a secondary measure. Consumer net operating costs as a percentage of gross margin and net operating costs per customer are the primary measures of operating efficiency, whilst cost to serve and cost to grow are also analysed as secondary measures.
Year ended30 June 2017
Year ended30 June 2016
Movement%
Consumer gross margin $792m $797m (0.6)Consumer net operating costs ($413m) ($398m) 3.8Consumer EBIT $379m $399m (5.0)Average customer accounts 3,655,367 3,692,402 (1.0)Consumer gross margin per customer account $217 $216 0.5Consumer net operating costs per customer account $113 $108 4.6Consumer EBIT per customer account $104 $108 (3.7)Consumer net operating costs as percentage of gross margin 52.1% 49.9% 2.2 pptsCost to Serve ($257m) ($253m) 1.6Cost to Grow ($156m) ($145m) 7.6Cost to Serve per customer account ($70) ($69) 1.4Cost to Grow per customer account ($87) ($89) (2.2)
Consumer gross margin per customer account increased $1 or 0.5% to $217 reflecting disciplined and effective price and discount management within a highly competitive market, a continued focus on high value customers through strategic marketing and the ongoing disconnection of vacant premises and unidentified customers to reduce cost leakage that cannot be billed to an unknown customer.

Annual Report 2017 25
Consumer net operating costs as a percentage of gross margin increased 2.2 ppts to 52.1% and Consumer net operating costs per customer account increased $5 per account or 4.6%. This was mainly due to an increase in Consumer bad debts expense driven by increased customer pricing (driven by higher wholesale market prices), higher advertising spend as a result of our rebranding activities and entry into the Western Australian gas retail market. This was partly offset by the introduction of customer paper bill and over the counter payment cost recoveries which resulted in greater cost recovery during the year, continued growth in the number of digital billing customers and targeted operating cost saving initiatives. These factors resulted in lower Consumer EBIT per customer account, down $4 or 3.7% to $104.
Average customer accounts decreased by 37,035 or 1.0% largely due to the ongoing disconnections of vacant premises and unidentified customers and the increasingly competitive market environment.
Cost to Serve per account includes the costs within consumer operating costs related to serving customers divided by the average number of customers for the year. Cost to Serve per account increased by $1 as a decrease in labour costs was more than offset by higher bad debts expense and increased depreciation costs reflecting further investment in growth initiatives to better serve our customers.
Cost to Grow per account includes the costs within consumer operating costs related to acquiring and retaining customers divided by the number of customers acquired and retained. Cost to Grow per account declined by $2, or $4 excluding the initial costs incurred in entering the Western Australia retail gas market, with higher acquisitions and retentions and the channel mix shifting to internal channels as a result of strategic initiatives. Total acquisitions and retentions increased by 10% driven by increased market activity. Internal acquisitions and retentions increased by 14% with digital acquisitions and retentions increasing 44% driven by AGL’s customer experience transformation.
5.1.5 Customer Numbers and ChurnThe following table provides a breakdown of customer numbers by state.
30 June 2017(’000)
30 June 2016(’000)
Movement(’000)
Movement%
Consumer Electricity 2,237 2,247 (10) (0.4)New South Wales 807 808 (1) (0.1)Victoria 638 636 2 0.3South Australia 388 408 (20) (4.9)Queensland 404 395 9 2.3Consumer Gas 1,402 1,418 (16) (1.1)New South Wales 657 674 (17) (2.5)Victoria 531 533 (2) (0.4)South Australia 132 132 0 (0.0)Queensland 82 79 3 3.8Total Consumer accounts 3,639 3,665 (26) (0.7)Total Business Customer accounts 14 16 (2) (12.5)Total Customer accounts 3,653 3,681 (28) (0.8)
AGL churn increased by 0.7 ppts to 16.4% from 15.7% due to continued strong competition in the market. The Rest of Market churn increased 0.5 ppts to 20.2% from 19.7%, slightly reducing the favourable gap between AGL and the rest of the market. Electricity customer accounts declined 0.4%, largely due to the loss of some multisite accounts. Gas customer accounts declined 1.1% largely as a result of the disconnection of vacant sites and unidentified energy consumers.
5.1.6 New Energy Services Underlying EBITIncreased 75.0% to ($3 million) from ($12 million)
Year ended30 June 2017
$m
Year ended30 June 2016
$m
Gross margin 11 12Less: net operating costs excluding D&A (12) (23)Underlying EBITDA (1) (11)Less: depreciation and amortisation (2) (1)Underlying EBIT (3) (12)
New Energy Services gross margin declined $1 million due to strategic decisions to exit several small and non-core businesses, partly offset by growth in solar and market solutions. This led to significantly lower operating costs, resulting in an Underlying EBIT improvement of $9 million.

Directors’ Report continued
26 AGL Energy Limited
5.2 Group Operations Underlying EBITIncreased 2.0% to ($825 million) from ($842 million)
Group Operations Underlying EBIT of ($825 million) was $17 million higher largely attributed to driving value though a sustained productivity and cost management program leading to labour efficiencies and lower maintenance costs across the generation fleet, and the divestment of renewable assets into PARF. The Natural Gas portfolio continued to be optimised through a disciplined approach to the well workover programs. This was partly offset by higher depreciation, predominantly due to a higher asset base driven by the capital investment program at Loy Yang and Macquarie.
Year ended30 June 2017
$m
Year ended30 June 2016
$m
Thermal (398) (416)Renewables (29) (43)Natural Gas (7) (10)Other Operations (28) (25)Underlying EBITDA (462) (494)Less: depreciation and amortisation (363) (348)Underlying EBIT (825) (842)
The following table provides a breakdown of the contributors to underlying EBIT:
Year ended30 June 2017
$m
Year ended30 June 2016
$m
Thermal (692) (675)Renewables (52) (64)Natural Gas (31) (45)Other Operations (50) (58)Underlying EBIT (825) (842)
5.2.1 Thermal Underlying EBITDecreased 2.5% to ($692 million) from ($675 million)
The decrease in Thermal Underlying EBIT was largely attributed to higher depreciation of $35 million driven by a higher asset base, CPI and wage escalation, and coal stockpile management activities. This was partly offset by higher Loy Yang B cost recovery, and labour and maintenance efficiencies.
A new enterprise bargaining agreement at AGL Macquarie was approved by the Fair Work Commission in November 2016 and a new enterprise bargaining agreement at AGL Loy Yang was approved in June 2017.
5.2.2 Renewables Underlying EBITIncreased 18.8% to ($52 million) from ($64 million)
The increase in Renewables Underlying EBIT was largely due to the divestment of Nyngan and Broken Hill solar plant assets to PARF, partly offset by higher depreciation and wind farm maintenance costs. Refer to section 4.6 for details on the divestment to PARF.
5.2.3 Natural Gas Underlying EBITIncreased 31.1% to ($31 million) from ($45 million)
The increase in Natural Gas Underlying EBIT was primarily a result of higher Spring Gully and Camden revenue, Hunter and Gloucester asset sales including provision review, lower Moranbah depreciation following the impairment recognised in the prior year, and labour optimisation initiatives. This was partly offset by increased operating costs from Moranbah with capital expenditure recognised as operating expense following the impairment.
The following table summarises the natural gas sales volume and associated revenue during the year:
AGL share of operationsYear ended
30 June 2017Year ended
30 June 2016Movement
%
Gas sales volume (PJ) 11.2 10.2 9.8Sales revenue ($m) 45 40 12.5Average gas price ($/PJ) 4.01 3.88 3.4

Annual Report 2017 27
5.2.4 Other Operations Underlying EBITIncreased 13.8% to ($50 million) from ($58 million)
The increase in Other Operations Underlying EBIT was primarily attributed to the discontinuation of Distributed Energy Services depreciation from April 2017 with assets being held-for-sale, and gains from the divestment of development projects. This was partly offset by higher legal costs and the centralisation of labour costs.
5.3 Investments Underlying EBITDecreased 32.0% to $17 million from $25 million
Year ended30 June 2017
$m
Year ended30 June 2016
$m
Underlying EBITDA 17 25Less: depreciation and amortisation – –Underlying EBIT 17 25
The following table provides a further breakdown of the contributors to the Underlying EBIT:
Year ended30 June 2017
$m
Year ended30 June 2016
$m
ActewAGL 24 30New Energy investments (7) (3)Other 0 (2)Underlying EBIT 17 25
5.3.1 ActewAGL Underlying EBITDecreased 20.0% to $24 million from $30 million
ActewAGL Retail partnership contributed an equity share of profits of $24 million for the year compared with $30 million in the prior year. The decrease was due to lower electricity gross margins resulting from higher wholesale prices.
5.3.2 New Energy investments Underlying EBITDecreased 133.3% to ($7 million) from ($3 million)
New Energy investments include Sunverge Energy Inc and Solar Analytics Pty Limited. The operating losses of these investments were consistent with expectations for early stage technology investments.
5.4 Centrally Managed Expenses Underlying EBITIncreased 3.7% to ($237 million) from ($246 million)
Year ended30 June 2017
$m
Year ended30 June 2016
$m
Underlying EBITDA (211) (216)Less: depreciation and amortisation (26) (30)Underlying EBIT (237) (246)
The following table provides a more detailed breakdown of Centrally Managed Expenses.
Year ended30 June 2017
$m
Year ended30 June 2016
$m
Labour (93) (99)Hardware and software costs (64) (55)Consultants and contractor fees (16) (14)Insurance premiums (19) (23)Depreciation and amortisation (26) (30)Other (19) (25)Total (237) (246)
Targeted cost reductions across corporate functions resulted in an Underlying EBIT increase of $9 million, or 3.7%. Underlying labour costs reduced by 8%, more than offsetting wage inflation of 2%, resulting in a net labour reduction of $6 million. Insurance costs reduced reflecting the renegotiation of a number of premiums. Depreciation and amortisation costs were lower in line with reduced capital expenditure relating to technology projects. These reductions more than offset the increase in hardware and software costs that were driven by business volume growth.
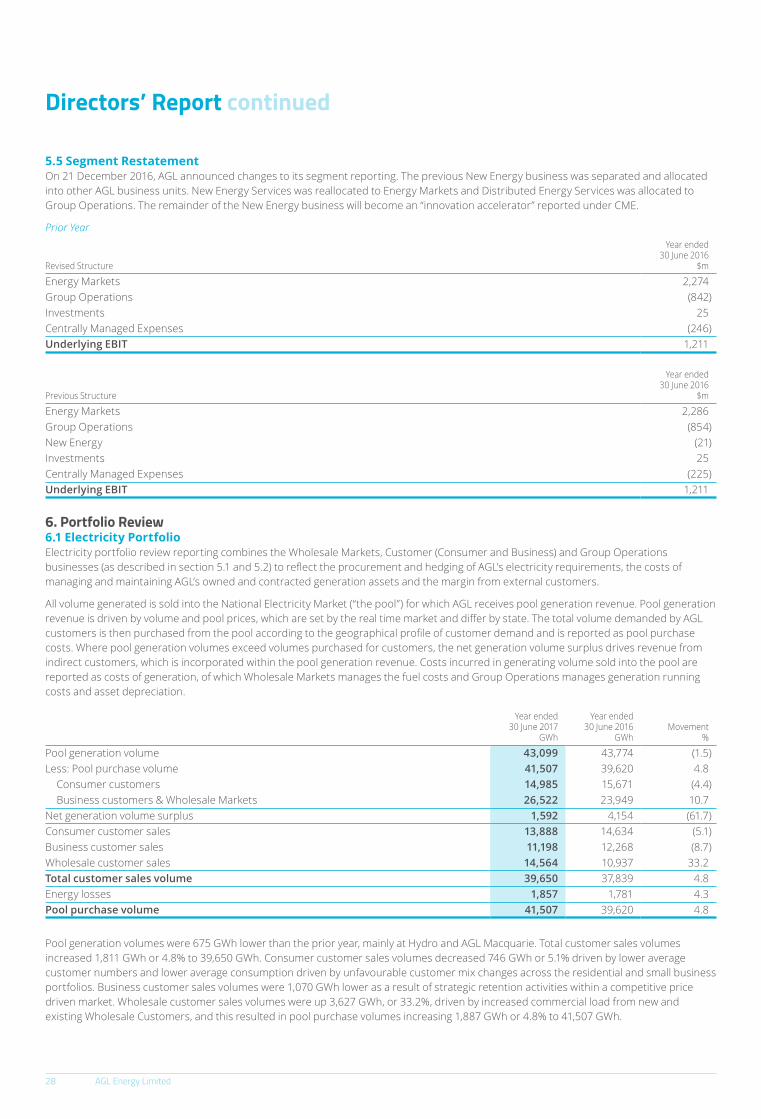
Directors’ Report continued
28 AGL Energy Limited
5.5 Segment RestatementOn 21 December 2016, AGL announced changes to its segment reporting. The previous New Energy business was separated and allocated into other AGL business units. New Energy Services was reallocated to Energy Markets and Distributed Energy Services was allocated to Group Operations. The remainder of the New Energy business will become an “innovation accelerator” reported under CME.
Prior Year
Revised Structure
Year ended30 June 2016
$m
Energy Markets 2,274Group Operations (842)Investments 25Centrally Managed Expenses (246)Underlying EBIT 1,211
Previous Structure
Year ended30 June 2016
$m
Energy Markets 2,286Group Operations (854)New Energy (21)Investments 25Centrally Managed Expenses (225)Underlying EBIT 1,211
6. Portfolio Review6.1 Electricity PortfolioElectricity portfolio review reporting combines the Wholesale Markets, Customer (Consumer and Business) and Group Operations businesses (as described in section 5.1 and 5.2) to reflect the procurement and hedging of AGL’s electricity requirements, the costs of managing and maintaining AGL’s owned and contracted generation assets and the margin from external customers.
All volume generated is sold into the National Electricity Market (“the pool”) for which AGL receives pool generation revenue. Pool generation revenue is driven by volume and pool prices, which are set by the real time market and differ by state. The total volume demanded by AGL customers is then purchased from the pool according to the geographical profile of customer demand and is reported as pool purchase costs. Where pool generation volumes exceed volumes purchased for customers, the net generation volume surplus drives revenue from indirect customers, which is incorporated within the pool generation revenue. Costs incurred in generating volume sold into the pool are reported as costs of generation, of which Wholesale Markets manages the fuel costs and Group Operations manages generation running costs and asset depreciation.
Year ended30 June 2017
GWh
Year ended30 June 2016
GWhMovement
%
Pool generation volume 43,099 43,774 (1.5)Less: Pool purchase volume 41,507 39,620 4.8 Consumer customers 14,985 15,671 (4.4) Business customers & Wholesale Markets 26,522 23,949 10.7Net generation volume surplus 1,592 4,154 (61.7)Consumer customer sales 13,888 14,634 (5.1)Business customer sales 11,198 12,268 (8.7)Wholesale customer sales 14,564 10,937 33.2Total customer sales volume 39,650 37,839 4.8Energy losses 1,857 1,781 4.3Pool purchase volume 41,507 39,620 4.8
Pool generation volumes were 675 GWh lower than the prior year, mainly at Hydro and AGL Macquarie. Total customer sales volumes increased 1,811 GWh or 4.8% to 39,650 GWh. Consumer customer sales volumes decreased 746 GWh or 5.1% driven by lower average customer numbers and lower average consumption driven by unfavourable customer mix changes across the residential and small business portfolios. Business customer sales volumes were 1,070 GWh lower as a result of strategic retention activities within a competitive price driven market. Wholesale customer sales volumes were up 3,627 GWh, or 33.2%, driven by increased commercial load from new and existing Wholesale Customers, and this resulted in pool purchase volumes increasing 1,887 GWh or 4.8% to 41,507 GWh.

Annual Report 2017 29
Portfolio Margin Volume Denominator Per Unit
Year ended30 June 2017
$m
Year ended30 June 2016
$m
Year ended30 June 2017
GWh
Year ended30 June 2016
GWh
Year ended30 June 2017
$/MWh
Year ended30 June 2016
$/MWh
RevenueConsumer customers1 3,810 3,813 13,888 14,634 274.3 260.6Business customers, Wholesale Electricity & Eco Markets1, 7 2,317 2,055 25,762 23,205 89.9 88.6Group Operations (Thermal & Renewables) 108 89Total revenue1 6,235 5,957 39,650 37,839 157.3 157.4Consumer network costs1 (1,777) (1,893) 13,888 14,634 (128.0) (129.4)Consumer other cost of sales1 (486) (450) 13,888 14,634 (35.0) (30.8)Business customers network costs1 (616) (751) 11,198 12,268 (55.0) (61.2)Business customers other cost of sales1 (202) (198) 11,198 12,268 (18.0) (16.1)Wholesale cost of sales2 (1,683) (1,454) 41,507 39,620 (40.5) (36.7) Costs of generation3 (1,601) (1,554) 43,099 43,774 (37.1) (35.5) Fuel3 (760) (731) 43,099 43,774 (17.6) (16.7) Generation running costs3 (523) (543) 43,099 43,774 (12.1) (12.4) Depreciation & amortisation (Group Operations)3 (318) (280) 43,099 43,774 (7.4) (6.4) Net Portfolio Management4 (82) 100 39,650 37,839 (2.1) 2.6 Pool generation revenue5, 7 3,577 2,312 43,099 43,774 83.0 52.8 Pool purchase costs2, 7 (3,645) (2,211) 41,507 39,620 (87.8) (55.8) Net derivative (cost)/revenue5 (14) (1) 43,099 43,774 (0.3) –Total cost of sales6 (4,764) (4,746) 39,650 37,839 (120.2) (125.4)Portfolio margin6 1,471 1,211 39,650 37,839 37.1 32.0
Consumer customers 485 463 Business customers 40 35 Wholesale Electricity 1,549 1,383 Eco Markets 141 69 Group Operations (Thermal & Renewables) (744) (739)
1. Customer sales volume – revenue and cost is driven by customer sales volume, which is utilised to calculate $/MWh for key Consumer and Business Customer metrics.2. Pool purchase volume – as Wholesale Markets manage the purchase of pool volume to meet customer demand, pool purchase volume is utilised to calculate the $/MWh cost.3. Pool generation volume – this is the direct driver of all costs of generation and is used to calculate the $/MWh cost.4. Customer sales volume – excluding generation volumes, which drive generation running costs, the portfolio comprises volumes sold to customers. Sold volumes is utilised to
calculate the net portfolio management $MWh.5. Pool generation volume – pool generation revenue is directly earned on pool generation volume, which is utilised calculate a $/MWh value. Additionally, derivative instruments are
used to manage hedging requirements of the consumer and business customer loads, as well as the long energy position where generation volume is more than the internal AGL portfolio (the net generation volume surplus).
6. Customer sales volume – whilst various drivers exist within total cost of sales metrics and overall portfolio margin, ultimately the volume sold to customers is the key driver of calculating margin and is used to calculate the $/MWh value.
7. Pool generation revenue, Wholesale electricity revenue and pool purchase costs include amounts from certain wholesale contracts that are treated as derivatives for statutory reporting purposes. In the statutory accounts the amounts associated with these contracts are recognised within cost of goods sold.
Electricity portfolio margin increased by $5.1 per MWh to $37.1 per MWh driven by higher wholesale prices, customer pricing discipline, and cost reduction initiatives across the generation portfolio.
Total revenue increased by $278 million mainly due to higher Wholesale customer sales volumes. Revenue from Consumer customers of $3,810 million was broadly flat but increased $13.7 per MWh to $274.3 per MWh driven by price changes reflecting higher wholesale market prices, offset by lower sales volumes and increased customer discounting within a competitive market. Business customer, Wholesale Electricity & Eco Markets revenue increased $262 million but was up only $1.3 per MWh reflecting the 3,627 GWh increase in Wholesale customer sales volumes.
Wholesale cost of sales increased by $229 million, or $3.8 per MWh, driven by pool purchase costs and commodity market prices. Net portfolio management costs increased $182 million or $4.7 per MWh as higher wholesale market prices and price volatility drove pool purchase costs up $32.0 per MWh, exceeding the $30.2 per MWh increase in pool generation revenue. Fuel costs increased $29 million or $0.9 per MWh reflecting higher commodity market prices for coal and gas as well as additional purchases from the spot market largely in response to increased commercial load from new and existing Wholesale customers. However, generation running costs were $20 million or $0.3 per MWh lower reflecting the successful delivery of transformational operating cost initiatives in Group Operations. Lower network rates and customer sales volumes resulted in lower network costs across Consumer customers ($116 million) and Business customers ($135 million), the benefits of which were passed on to customers through price management.
In addition to the commentary above, Electricity portfolio margin is discussed in sections 5.1.1 Wholesale Markets and 5.1.2 Customer.

Directors’ Report continued
30 AGL Energy Limited
6.2 Gas PortfolioThe gas portfolio review reporting combines the Wholesale Markets and Customer (Consumer and Business), as described in section 5.1, to reflect the procurement and hedging of AGL’s gas requirements and the margin from external customers.
Year ended30 June 2017
PJ
Year ended30 June 2016
PJMovement
%
Consumer customers 58.5 59.4 (1.5)Business customers 61.6 73.7 (16.4)Wholesale Markets & generation 109.7 101.1 8.5Total customer sales volume 229.8 234.2 (1.9)Energy losses 3.4 2.7 25.9Gas purchase volume 233.2 236.9 (1.6)
Total customer sales volume decreased 4.4 PJ or 1.9% to 229.8 PJ due to the loss of some large Business Customers, partially offset by increased generation at AGL Torrens, which contributed to the 8.6 PJ increase in Wholesale Markets & Generation.
Portfolio Margin Volume Denominator Per Unit
Year ended30 June 2017
$m
Year ended30 June 2016
$m
Year ended30 June 2017
PJ
Year ended30 June 2016
PJ
Year ended30 June 2017
$/GJ
Year ended30 June 2016
$/GJ
RevenueConsumer customers 1,400 1,417 58.5 59.4 23.9 23.9Business customers, Wholesale Gas & Eco Markets 1,342 1,418 171.3 174.8 7.8 8.1Total revenue 2,742 2,835 229.8 234.2 11.9 12.1Consumer network costs (509) (520) 58.5 59.4 (8.7) (8.8)Consumer other cost of sales (37) (37) 58.5 59.4 (0.6) (0.6)Business customers network costs (53) (68) 61.6 73.7 (0.9) (0.9)Business customers other cost of sales (15) (14) 61.6 73.7 (0.2) (0.2)Wholesale cost of sales (1,455) (1,394) 229.8 234.2 (6.3) (6.0) Gas purchases (1,096) (1,069) 229.8 234.2 (4.8) (4.6) Haulage, storage & other (359) (325) 229.8 234.2 (1.6) (1.4)Total cost of sales (2,069) (2,033) 229.8 234.2 (9.0) (8.7)Portfolio margin 673 802 229.8 234.2 2.9 3.4 Consumer customers 307 334 Business customers 60 61 Wholesale Markets 302 403 Eco Markets 4 4
Gas portfolio margin decreased by $0.5 per GJ to $2.9 per GJ driven by a reduction in wholesale margin and a higher cost of sales.
Total revenue decreased by $93 million to $2,742 million largely due to Business customers, Wholesale Gas & Eco Markets being $76 million lower at $1,342 million. This was driven by the roll-off of a number of high margin wholesale customers and lower business customer sales, partly offset by increased demand at Torrens. Lower revenue drove the $129 million decrease in portfolio margin to $673 million. Consumer revenue decreased $17 million as disciplined customer pricing was more than offset by the combined impact of discounting and lower customer sales volumes.
Total cost of sales increased $36 million due to contractual escalation in haulage and storage as well as the additional purchase at spot market price due to the supplier curtailment. This was partially offset by lower network costs across Consumer ($11 million) and Business customers ($15 million) as a result of a decrease in total customer sales volumes.
In addition to the commentary above, Gas portfolio margin is discussed in sections 5.1.1 Wholesale Markets and 5.1.2 Customer.

Annual Report 2017 31
7. Cash Flow7.1 Reconciliation of Underlying EBITDA to Cash Flow
Year ended30 June 2017
$m
Year ended30 June 2016
$m
Underlying EBITDA 1,852 1,689Equity accounted income (net of dividend received) 2 (8)Accounting for onerous contracts (36) (42)Gain on divestments (23) –Movement in other assets/liabilities and non-cash items (53) 28Working capital movements (Increase)/decrease in receivables 41 138 Increase/(decrease) in creditors (73) (109) (Increase)/decrease in inventories 73 (10) Net derivative premiums paid/roll-offs (58) (82) (Increase)/decrease in other financial assets (margin calls) (431) (52) Net movement in green assets/liabilities 54 25 Other 14 11Total working capital movements (380) (79)Underlying operating cash flow before interest, tax & significant items 1,362 1,588Net finance costs paid (179) (172)Income tax paid (292) (166)Underlying operating cash flow 891 1,250Cash flow relating to significant items – (64)Statutory net cash provided by operating activities 891 1,186Investing cash flow (302) 81Financing cash flow (687) (1,274)Movement in cash and cash equivalents (98) (7)
Underlying operating cash flow before interest, tax & significant items of $1,362 million was down $226 million compared with the prior year.
Movement in other assets/liabilities and non-cash items predominantly related to the timing of employee provisions.
Total working capital movements for the year ended 30 June 2017 was ($380 million), driven by unfavourable movements in margin calls.
Lower cash flow from receivables compared with prior year was driven by higher collections at end of last financial year and a small increase in customer Days Sales Outstanding (DSO).
Creditor movements were broadly in line with the prior year, with the benefit from lower consumer energy volumes and lower spot prices compared to the end of last financial year.
Reduction in inventories were as a result of de-banking of gas.
Higher margin calls were driven by rises in wholesale electricity prices. The benefit of the higher prices is reflected through current and future earnings. Adjusting for margin calls, cash conversion was 97% (97% in prior year).
The increase in income tax paid was largely related to the taxable gain on the sale of the Macarthur wind farm in FY16 (the final tax paid on lodgement of the FY16 return was made in FY17). It also includes the impact of higher tax instalments due during FY17.
Investing cash flow was ($302 million) and whilst capital expenditure was less than prior year, there were lower asset sales in the current year.
Financing cash flow was ($687 million) and reflected the on-market share buy-back.
7.2 Capital ExpenditureTotal capital expenditure was $518 million (FY16: $529 million). Sustaining capital expenditure was $301 million (FY16: $390 million), related primarily to AGL Loy Yang and AGL Macquarie. Capital expenditure on growth initiatives was $217 million (FY16: $139 million) driven by transformation initiatives including the Customer Experience Transformation and metering.
8. Business Acquisitions and DisposalsCurrent YearNil.
Prior YearAGL disposed of its interests in Macarthur Wind Farm in September 2015 and Diamantina Power Station in March 2016.
Directors’ Report continued
32 AGL Energy Limited
Remuneration ReportFor the year ended 30 June 2017This Remuneration Report (pages 32 to 56) is attached to, and forms part of, the Directors’ Report.
Message from the Chairman of the People and Performance Committee
Dear Shareholders
On behalf of the Board, I am pleased to introduce AGL’s FY17 Remuneration Report (Report). At the 2017 Annual General Meeting (AGM) we will seek your support of this Report.
FY17 was a strong year for AGL. Total shareholder return (TSR) was 42.4%, compared with 14.6% for the S&P/ASX100 Accumulation Index. The company continued to deliver against our transformation objectives. We delivered a record profit and returned approximately $1.1 billion to shareholders through capital management initiatives including a 34% increase in dividends to 91.0 cents per share, amounting to total dividends declared for the year of $602 million, and $473 million under the on-market share buyback.
FY17 marked a successful year for AGL’s transformation as the company focused on initiatives that will generate value for shareholders both now and sustainably over the long-term as the energy industry undergoes profound change.
Our strong result reflected prevailing market conditions and past strategic investments, which presented an ongoing opportunity for AGL management to create increased value for shareholders. Management delivered on this potential by executing to a high standard across all areas including operations, retail markets, risk management, industrial relations, cost management and stakeholder engagement. These actions are not only driving strong results today but preserving shareholder value for the long-term.
Key transformation achievements included:
• exceeding our target to deliver a $170 million per annum reduction in operating expenditure and a $100 million reduction in sustaining capital expenditure compared with FY15 levels
• reaching our target of delivering approximately $1 billion in asset sales of non-core or underperforming assets, and
• the modernisation of enterprise agreements at our two largest power generation sites, AGL Macquarie and AGL Loy Yang, providing for significant productivity improvements over time.
In addition to the strong financial performance in the year, AGL is delivering in relation to its key strategic imperatives of prospering in a carbon-constrained future and building customer advocacy as changes in distributed energy and mobile digital technology are profoundly altering consumers’ expectations. Key initiatives progressed in the year consistent with these imperatives included:
• the launch of our $300 million customer experience transformation program and the delivery of our first ‘signature moments’, such as the one-minute move, self-service meter read and one-touch pay
• the creation of the world’s largest Virtual Power Plant (VPP) in South Australia, and
• establishing the investment structure under the Powering Australian Renewables Fund (PARF) to develop and/or own $2-3 billion of renewable energy projects – delivering an efficient capital structure and favourable risk profile for AGL while driving renewables development. We have now completed the sale of the Nyngan and Broken Hill solar plants and Silverton wind farm developments into PARF.
Remuneration outcomesThe starting point for considering remuneration outcomes is Statutory Profit. The Board adjusts Statutory Profit for non-cash fair value movements in financial instruments. The Board considers any significant items which are non-recurring events that materially affect AGL’s financial results, are not related to the ongoing underlying business and are excluded from AGL’s Underlying Profit financial reporting metric.
These adjustments result in a profit after tax metric that the Board uses to determine remuneration outcomes under the company’s short and long-term incentive plans that ensures management are not unfairly advantaged or disadvantaged by items outside their control.
There were no significant items in FY17.
Statutory Profit after tax in FY17 was $539 million, up from a Statutory Loss of $(408) million in FY16 – largely reflecting the absence of the significant items that occurred in FY16. Underlying Profit after tax in FY17 was Statutory Profit less adjustments in fair value and increased by 14% to $802 million.
Further details of remuneration outcomes relative to AGL’s strategic achievements are available in section 3 of this Report, while a detailed discussion of strategy is included in the Operating & Financial Review (OFR) section of the Directors’ Report.
This year, together with AGL’s Chairman, Jerry Maycock, my primary focus as Chair of the People and Performance Committee, has been listening to the concerns of shareholders and their advisors following the first ‘strike’ we received at our AGM in September 2016. A strike occurs when more than 25% of the shares voted in relation to the adoption of a company’s remuneration report are voted against that remuneration report.
The Board takes this outcome very seriously and has acted on the concerns raised in a considered manner, as set out in section 1.1 of this Report. Key actions have included:
• improving disclosure on establishment and setting of fixed remuneration of the Managing Director and Chief Executive Officer (MD/CEO)
• reducing the FY17 target short-term incentive (STI) of the MD/CEO by approximately $460,000
• providing significantly more detail of STI metrics and outcomes
• providing more detail about the workings of the transitional grants made to executives for the closure of the old banking long-term incentive (LTI) plan, and
• reviewing and restructuring the Remuneration Report to increase general transparency, readability and clarity.

Annual Report 2017 33
This brings me to a specific shareholder concern: the remuneration of the MD/CEO, Andy Vesey.
In 2014, the Board conducted a comprehensive global search for the best available talent to lead AGL in tackling challenges confronting the energy industry. These challenges are profound. AGL’s strategic imperatives are to prosper in a carbon-constrained future and to build customer advocacy in response to the changes in distributed energy and mobile digital technology.
Amid this environment, AGL, a 180-year old company, must embrace transformation, act swiftly to drive productivity in its existing operations and unlock new growth streams as it seeks to define the business models of the future.
It is truly a once in a generation challenge and it requires strong leadership.
For that reason, the Board was prepared to offer remuneration designed to attract a leader who could deliver on this challenge. Within a highly competitive global talent market, the Board has increased Mr Vesey’s fixed remuneration annually to reflect fully his skills, experience and effectiveness. Mr Vesey’s fixed remuneration places him at the 73rd percentile (his total remuneration is at the 60th percentile) relative to a peer group of companies that rank 11 to 50 on the ASX by market capitalisation, which the Board believes is appropriate given the performance of the company under his leadership. At 30 June 2017 AGL’s market capitalisation is at the 83rd percentile against the ASX11-50 companies.
Mr Vesey is delivering on this challenging transformation agenda, as detailed in the OFR, and shareholders are benefitting. Whilst external factors always play a part in this highly volatile environment, converting opportunities and managing unforeseen risks has been a feature of AGL’s performance in the past two and a half years. Between Mr Vesey’s commencement on 12 January 2015 and the end of FY17, TSR was 104.2%, exceeding TSR in the S&P/ASX100 Index of 17.6%. The AGL share price increased 86% in the same period, from $13.71 to $25.50 at 30 June 2017.
The Board believes Mr Vesey’s remuneration package is warranted by his skills and experience and his remuneration outcomes during his tenure to date reflect strong strategy delivery and financial performance. Mr Vesey’s fixed remuneration is at the 73rd percentile against the ASX11-50 companies. The Board has determined that Mr Vesey will not receive a fixed remuneration increase in FY18.
AGL’s key management personnel (KMP) achieved remuneration outcomes in FY17 commensurate with the company’s strong shareholder returns and the need to attract and retain a leadership team capable of delivering the complex issues facing the company.
STI outcomes reflect the strong performance of the company and are aligned with financial outcomes at the upper end of our guidance and demonstrated progress against AGL’s strategy. Furthermore, the FY15 banking LTI plan, which vested and closed at the end of FY17, reflected the company’s strong relative and absolute TSR performance.
The Board is confident that AGL executive pay is reflective of performance and the value delivered for shareholders.
I invite you to read this Report and trust that you will find it helpful to understand AGL’s approach to remuneration.
On behalf of the directors, we look forward to welcoming you and your feedback at the 2017 AGM.
Yours sincerely
Les Hosking Chairman, People and Performance Committee
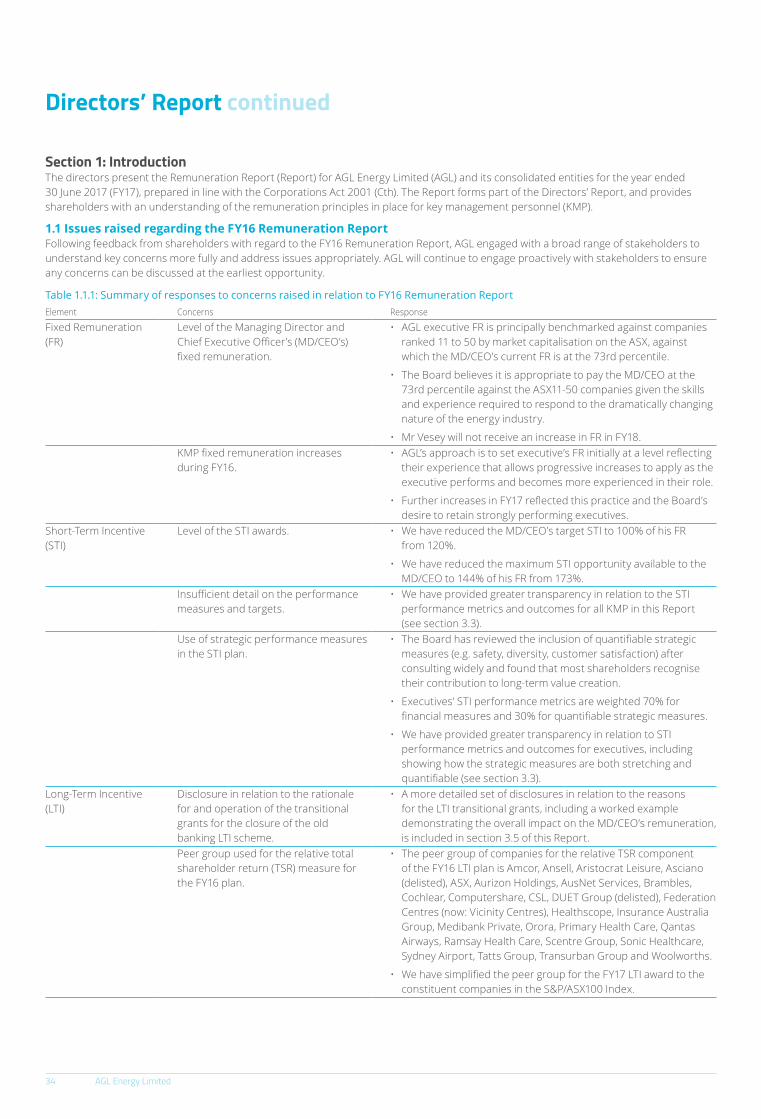
Directors’ Report continued
34 AGL Energy Limited
Section 1: IntroductionThe directors present the Remuneration Report (Report) for AGL Energy Limited (AGL) and its consolidated entities for the year ended 30 June 2017 (FY17), prepared in line with the Corporations Act 2001 (Cth). The Report forms part of the Directors’ Report, and provides shareholders with an understanding of the remuneration principles in place for key management personnel (KMP).
1.1 Issues raised regarding the FY16 Remuneration ReportFollowing feedback from shareholders with regard to the FY16 Remuneration Report, AGL engaged with a broad range of stakeholders to understand key concerns more fully and address issues appropriately. AGL will continue to engage proactively with stakeholders to ensure any concerns can be discussed at the earliest opportunity.
Table 1.1.1: Summary of responses to concerns raised in relation to FY16 Remuneration ReportElement Concerns Response
Fixed Remuneration (FR)
Level of the Managing Director and Chief Executive Officer’s (MD/CEO’s) fixed remuneration.
• AGL executive FR is principally benchmarked against companies ranked 11 to 50 by market capitalisation on the ASX, against which the MD/CEO’s current FR is at the 73rd percentile.
• The Board believes it is appropriate to pay the MD/CEO at the 73rd percentile against the ASX11-50 companies given the skills and experience required to respond to the dramatically changing nature of the energy industry.
• Mr Vesey will not receive an increase in FR in FY18.KMP fixed remuneration increases during FY16.
• AGL’s approach is to set executive’s FR initially at a level reflecting their experience that allows progressive increases to apply as the executive performs and becomes more experienced in their role.
• Further increases in FY17 reflected this practice and the Board’s desire to retain strongly performing executives.
Short-Term Incentive (STI)
Level of the STI awards. • We have reduced the MD/CEO’s target STI to 100% of his FR from 120%.
• We have reduced the maximum STI opportunity available to the MD/CEO to 144% of his FR from 173%.
Insufficient detail on the performance measures and targets.
• We have provided greater transparency in relation to the STI performance metrics and outcomes for all KMP in this Report (see section 3.3).
Use of strategic performance measures in the STI plan.
• The Board has reviewed the inclusion of quantifiable strategic measures (e.g. safety, diversity, customer satisfaction) after consulting widely and found that most shareholders recognise their contribution to long-term value creation.
• Executives’ STI performance metrics are weighted 70% for financial measures and 30% for quantifiable strategic measures.
• We have provided greater transparency in relation to STI performance metrics and outcomes for executives, including showing how the strategic measures are both stretching and quantifiable (see section 3.3).
Long-Term Incentive (LTI)
Disclosure in relation to the rationale for and operation of the transitional grants for the closure of the old banking LTI scheme.
• A more detailed set of disclosures in relation to the reasons for the LTI transitional grants, including a worked example demonstrating the overall impact on the MD/CEO’s remuneration, is included in section 3.5 of this Report.
Peer group used for the relative total shareholder return (TSR) measure for the FY16 plan.
• The peer group of companies for the relative TSR component of the FY16 LTI plan is Amcor, Ansell, Aristocrat Leisure, Asciano (delisted), ASX, Aurizon Holdings, AusNet Services, Brambles, Cochlear, Computershare, CSL, DUET Group (delisted), Federation Centres (now: Vicinity Centres), Healthscope, Insurance Australia Group, Medibank Private, Orora, Primary Health Care, Qantas Airways, Ramsay Health Care, Scentre Group, Sonic Healthcare, Sydney Airport, Tatts Group, Transurban Group and Woolworths.
• We have simplified the peer group for the FY17 LTI award to the constituent companies in the S&P/ASX100 Index.
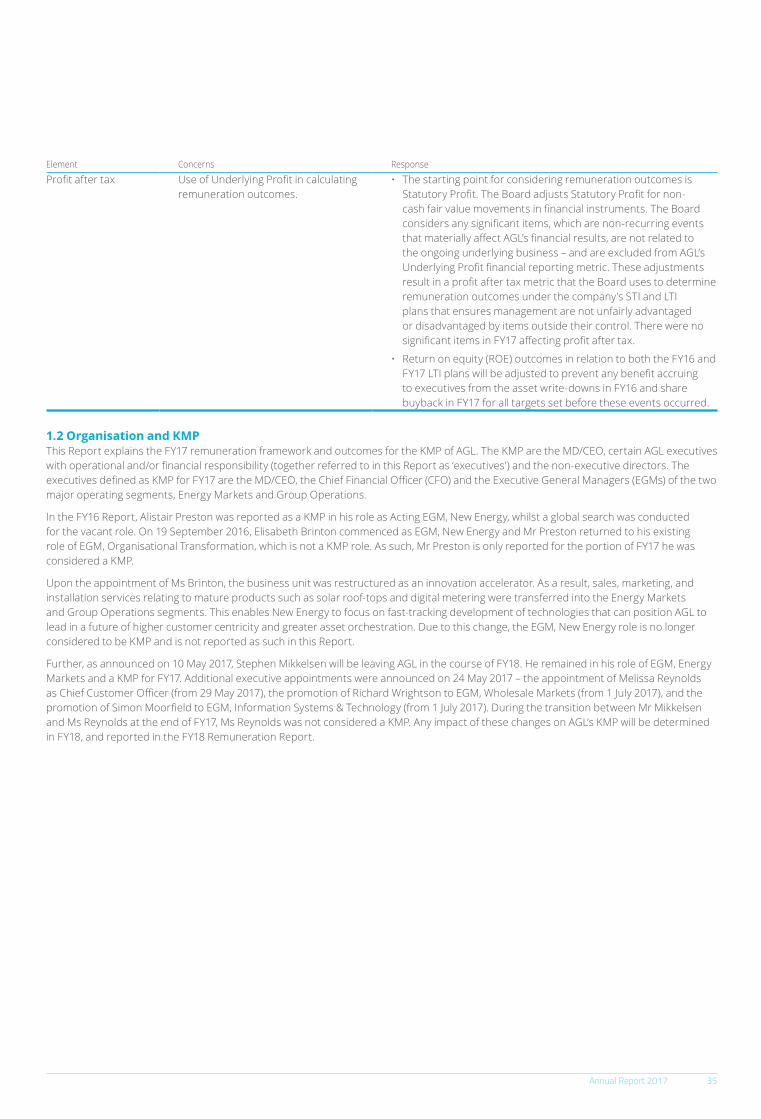
Annual Report 2017 35
Element Concerns Response
Profit after tax Use of Underlying Profit in calculating remuneration outcomes.
• The starting point for considering remuneration outcomes is Statutory Profit. The Board adjusts Statutory Profit for non-cash fair value movements in financial instruments. The Board considers any significant items, which are non-recurring events that materially affect AGL’s financial results, are not related to the ongoing underlying business – and are excluded from AGL’s Underlying Profit financial reporting metric. These adjustments result in a profit after tax metric that the Board uses to determine remuneration outcomes under the company’s STI and LTI plans that ensures management are not unfairly advantaged or disadvantaged by items outside their control. There were no significant items in FY17 affecting profit after tax.
• Return on equity (ROE) outcomes in relation to both the FY16 and FY17 LTI plans will be adjusted to prevent any benefit accruing to executives from the asset write-downs in FY16 and share buyback in FY17 for all targets set before these events occurred.
1.2 Organisation and KMPThis Report explains the FY17 remuneration framework and outcomes for the KMP of AGL. The KMP are the MD/CEO, certain AGL executives with operational and/or financial responsibility (together referred to in this Report as ‘executives’) and the non-executive directors. The executives defined as KMP for FY17 are the MD/CEO, the Chief Financial Officer (CFO) and the Executive General Managers (EGMs) of the two major operating segments, Energy Markets and Group Operations.
In the FY16 Report, Alistair Preston was reported as a KMP in his role as Acting EGM, New Energy, whilst a global search was conducted for the vacant role. On 19 September 2016, Elisabeth Brinton commenced as EGM, New Energy and Mr Preston returned to his existing role of EGM, Organisational Transformation, which is not a KMP role. As such, Mr Preston is only reported for the portion of FY17 he was considered a KMP.
Upon the appointment of Ms Brinton, the business unit was restructured as an innovation accelerator. As a result, sales, marketing, and installation services relating to mature products such as solar roof-tops and digital metering were transferred into the Energy Markets and Group Operations segments. This enables New Energy to focus on fast-tracking development of technologies that can position AGL to lead in a future of higher customer centricity and greater asset orchestration. Due to this change, the EGM, New Energy role is no longer considered to be KMP and is not reported as such in this Report.
Further, as announced on 10 May 2017, Stephen Mikkelsen will be leaving AGL in the course of FY18. He remained in his role of EGM, Energy Markets and a KMP for FY17. Additional executive appointments were announced on 24 May 2017 – the appointment of Melissa Reynolds as Chief Customer Officer (from 29 May 2017), the promotion of Richard Wrightson to EGM, Wholesale Markets (from 1 July 2017), and the promotion of Simon Moorfield to EGM, Information Systems & Technology (from 1 July 2017). During the transition between Mr Mikkelsen and Ms Reynolds at the end of FY17, Ms Reynolds was not considered a KMP. Any impact of these changes on AGL’s KMP will be determined in FY18, and reported in the FY18 Remuneration Report.

Directors’ Report continued
36 AGL Energy Limited
Table 1.2.1: Key management personnelName Position Dates
Non-executive directorsCurrentJerry Maycock Chairman Full yearPeter Botten Non-Executive Director From 21 October 2016Jacqueline Hey Non-Executive Director Full yearLes Hosking Non-Executive Director Full yearGraeme Hunt Non-Executive Director Full yearBelinda Hutchinson Non-Executive Director Full yearDiane Smith-Gander Non-Executive Director From 28 September 2016John Stanhope Non-Executive Director Full yearFormerBruce Phillips Non-Executive Director Until 28 September 2016ExecutivesCurrentAndy Vesey MD/CEO Full yearDoug Jackson EGM, Group Operations Full yearStephen Mikkelsen EGM, Energy Markets Full yearBrett Redman CFO Full yearFormerAlistair Preston Acting EGM, New Energy Until 18 September 2016
Section 2: Remuneration framework2.1 Remuneration strategyThe objective of the remuneration strategy is to support and drive the strategic agenda of AGL as it helps shape a sustainable energy future for Australia and responds to the strategic imperatives of prospering in a carbon-constrained future and building customer advocacy.
In pursuit of these imperatives, we use the strategic framework of embracing transformation, driving productivity and unlocking growth to organise our activities, including the metrics that govern executives’ STI outcomes.
The exact implications on AGL’s business model of the changes taking shape in the energy industry are not yet known – including in relation to decarbonisation, the adoption of distributed energy and the digitisation of how consumers buy services.
The Board believes that if AGL does not act strongly now, then risks to shareholder value in the long term will increase.
For that reason, AGL’s remuneration framework places emphasis on rewarding executives for achieving AGL’s strategic plans and creating shareholder value as follows:
• fixed remuneration that attracts and retains executives with the skills and experience needed to respond to the complex challenges facing the company and industry
• short-term incentives that drive strong action in operational improvement, cultural transformation and the pursuit of new growth opportunities in preparation for the changes ahead, and
• long-term incentives that align executive outcomes over time with the delivery of sustainable shareholder returns.
AGL strives to create an executive remuneration framework that drives a performance culture, ensuring there is a strong link between executive pay and the achievement of company performance and returns to shareholders. This is supported by a minimum shareholding policy that applies to all executives and directors.

Annual Report 2017 37
...which assist in setting our strategic framework to enable delivery...
...are defined by key objectives for strategy and decision making...
...that’s also reflected in the performance measures under AGL’s incentive plans...
...and based on actual outcomes directly drives executive remuneration.
Deliver customer experience
transformation
Embed lean/agile standards
Operating expenditure, working capital and
sustained capital expenditure reductions
Management of asset sale program
PARF new build projects
Develop new technology through New Energy’s innovation accelerator
Continue to grow profit after tax
Embracetransformation
Driveproductivity
Unlockgrowth
The strategic imperatives that drive AGL’s agenda...
Build customer advocacy
Prosper in a carbonconstrained future
personalisedretailing
from: mass retailing
to:orchestrator of large
and small assets
from: operator of large assets
to:leveraging platforms
in existing andnew markets
from: leveraging business platforms in existing markets
to:lower emissions
technology
from: high emissions technology
to:
Fixedremuneration
Short-termincentive
Long-termincentive
Totalremuneration+ + =
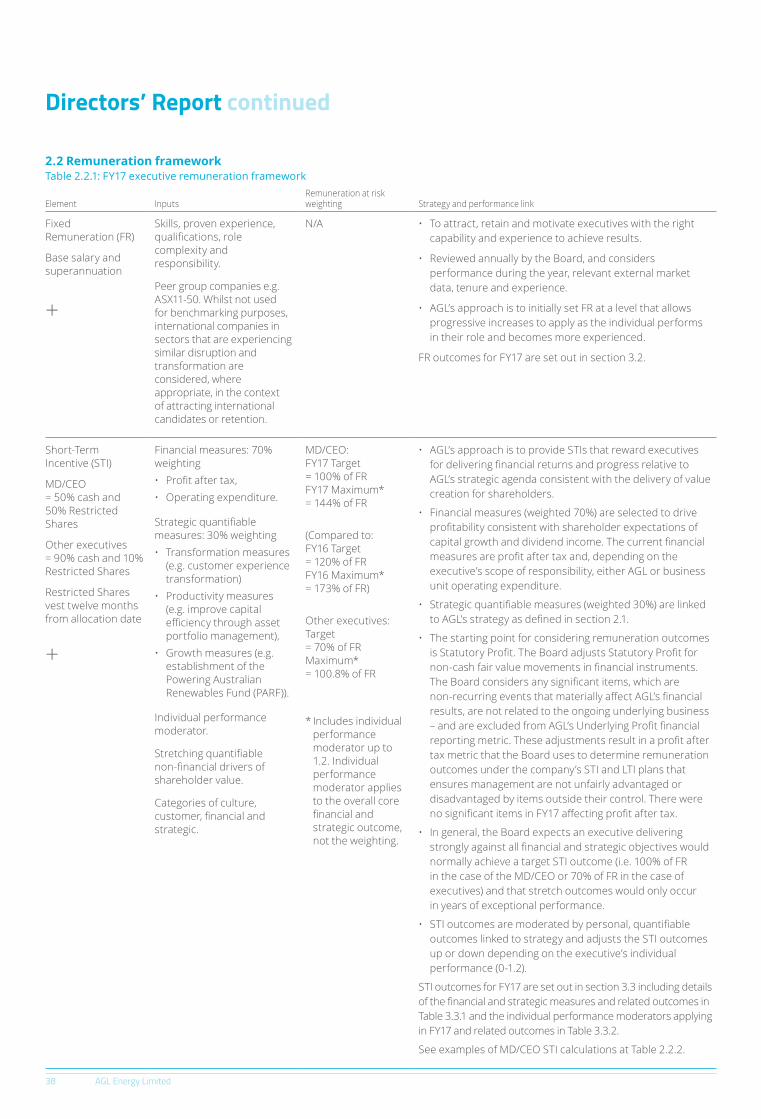
Directors’ Report continued
38 AGL Energy Limited
2.2 Remuneration frameworkTable 2.2.1: FY17 executive remuneration framework
Element InputsRemuneration at risk weighting Strategy and performance link
Fixed Remuneration (FR)
Base salary and superannuation
+
Skills, proven experience, qualifications, role complexity and responsibility.
Peer group companies e.g. ASX11-50. Whilst not used for benchmarking purposes, international companies in sectors that are experiencing similar disruption and transformation are considered, where appropriate, in the context of attracting international candidates or retention.
N/A • To attract, retain and motivate executives with the right capability and experience to achieve results.
• Reviewed annually by the Board, and considers performance during the year, relevant external market data, tenure and experience.
• AGL’s approach is to initially set FR at a level that allows progressive increases to apply as the individual performs in their role and becomes more experienced.
FR outcomes for FY17 are set out in section 3.2.
Short-Term Incentive (STI)
MD/CEO= 50% cash and 50% Restricted Shares
Other executives= 90% cash and 10% Restricted Shares
Restricted Shares vest twelve months from allocation date
+
Financial measures: 70% weighting• Profit after tax,• Operating expenditure.
Strategic quantifiable measures: 30% weighting• Transformation measures
(e.g. customer experience transformation)
• Productivity measures (e.g. improve capital efficiency through asset portfolio management),
• Growth measures (e.g. establishment of the Powering Australian Renewables Fund (PARF)).
Individual performance moderator.
Stretching quantifiable non-financial drivers of shareholder value.
Categories of culture, customer, financial and strategic.
MD/CEO: FY17 Target = 100% of FR FY17 Maximum* = 144% of FR
(Compared to: FY16 Target = 120% of FR FY16 Maximum* = 173% of FR)
Other executives: Target = 70% of FR Maximum* = 100.8% of FR
* Includes individual performance moderator up to 1.2. Individual performance moderator applies to the overall core financial and strategic outcome, not the weighting.
• AGL’s approach is to provide STIs that reward executives for delivering financial returns and progress relative to AGL’s strategic agenda consistent with the delivery of value creation for shareholders.
• Financial measures (weighted 70%) are selected to drive profitability consistent with shareholder expectations of capital growth and dividend income. The current financial measures are profit after tax and, depending on the executive’s scope of responsibility, either AGL or business unit operating expenditure.
• Strategic quantifiable measures (weighted 30%) are linked to AGL’s strategy as defined in section 2.1.
• The starting point for considering remuneration outcomes is Statutory Profit. The Board adjusts Statutory Profit for non-cash fair value movements in financial instruments. The Board considers any significant items, which are non-recurring events that materially affect AGL’s financial results, are not related to the ongoing underlying business – and are excluded from AGL’s Underlying Profit financial reporting metric. These adjustments result in a profit after tax metric that the Board uses to determine remuneration outcomes under the company’s STI and LTI plans that ensures management are not unfairly advantaged or disadvantaged by items outside their control. There were no significant items in FY17 affecting profit after tax.
• In general, the Board expects an executive delivering strongly against all financial and strategic objectives would normally achieve a target STI outcome (i.e. 100% of FR in the case of the MD/CEO or 70% of FR in the case of executives) and that stretch outcomes would only occur in years of exceptional performance.
• STI outcomes are moderated by personal, quantifiable outcomes linked to strategy and adjusts the STI outcomes up or down depending on the executive’s individual performance (0-1.2).
STI outcomes for FY17 are set out in section 3.3 including details of the financial and strategic measures and related outcomes in Table 3.3.1 and the individual performance moderators applying in FY17 and related outcomes in Table 3.3.2.
See examples of MD/CEO STI calculations at Table 2.2.2.

Annual Report 2017 39
Element InputsRemuneration at risk weighting Strategy and performance link
Long-Term Incentive (LTI)
Performance Rights
Relative total shareholder return (TSR): 50% weighting• The TSR calculation is
based on the June volume-weighted average share prices at the start and end of the performance period
• Against AGL’s peer group being the S&P/ASX100,
• Straight line vesting from 50-100% of award for 50th to 75th percentile performance against the peer group.
Return on equity (ROE): 50% weighting• Straight line vesting
from 50-100% of award for 9-10% of three-year average ROE.
Performance period: three years (1 July-30 June).
Allocation methodology: based on the June volume-weighted average AGL share price preceding the start of the relevant performance period.
MD/CEO: At threshold = 60% of FR Maximum = 120% of FR
Other executives: At threshold = 35% of FR Maximum = 70% of FR
• Reward executives for long-term performance, encourage shareholding and deliver long-term value creation for shareholders.
• Relative TSR is chosen because it provides a comparative, external market performance benchmark against the S&P/ASX100 companies.
• ROE is chosen because it provides a measure of the effectiveness with which AGL is deploying shareholders’ funds by dividing profit after tax for a given period by the monthly average of shareholders’ equity during the period in question. To ensure sustained performance, average ROE over the three years is calculated at the end of the performance period.
• Both LTI measures are key to AGL’s long-term success as they clearly link to the creation of shareholder absolute and comparative value.
= TOTAL REMUNERATION (TR)
The remuneration mix is designed to reward for the achievement of both short and longer term objectives which in turn, align executive and shareholder experiences through share ownership and value.
Table 2.2.2: Example STI calculations for the MD/CEOThe following table includes some worked examples of STI calculations for the MD/CEO based on a range of performance-based STI outcomes.
Fixed Remuneration
$ XSTI Target
% X
STI Performance
Outcome (0-120%) X
Individual Performance
Moderator (0-1.2) =
STI Award$ % of FR
At minimum 2,300,000 X 100% X 0% X 0 = – 0%Between minimum and target 2,300,000 X 100% X 80% X 0.9 = 1,656,000 72%At target 2,300,000 X 100% X 100% X 1 = 2,300,000 100%Between target and maximum 2,300,000 X 100% X 110% X 1.05 = 2,656,500 116%At maximum 2,300,000 X 100% X 120% X 1.2 = 3,312,000 144%
STI performance outcomes can range at any level between 0-120%, adjusted by the individual performance moderator, which can also vary at any level between 0-1.2.

Directors’ Report continued
40 AGL Energy Limited
2.3 Remuneration mixThe total remuneration mix intends to attract, retain and motivate appropriately. The FY17 remuneration mix for executives is summarised below.
MD/CEO Other Executives
38%
31%
31%
Fixed Remuneration (FR)
Short-Term Incentive (STI)
Long-Term Incentive (LTI)
29%
29%
42%
Lorem ipsumThe variable/at-risk component of total remuneration is 69% and 58% for the MD/CEO and other executives respectively.
Section 3: FY17 Performance and executive remuneration outcomes3.1 AGL five-year performanceElement FY13 FY14 FY15 FY16 FY17
Statutory Profit/(Loss)1 ($m) 375 570 218 (408) 539Underlying Profit1 ($m) 585 562 630 701 802Statutory EPS1 & 2 (cents) 65.5 98.2 33.3 (60.5) 80.5Underlying EPS1 & 2 (cents) 102.2 96.9 96.4 103.9 119.8Dividends (cents) 63.0 63.0 64.0 68.0 91.0Closing share price at 30 June ($) 14.48 15.48 15.55 19.29 25.50Return on Equity (ROE)3 & 4 (%) 8.0 7.5 7.2 8.3 10.2
1. FY13 restated for adoption of revised accounting standard AASB 119 Employee Benefits.2. FY13 and FY14 have been restated for the bonus element of the one-for-five share rights issue completed in September 2014.3. Used to calculate a portion of executives’ LTI outcome for the FY16 and FY17 grants.4. FY17 ROE includes share buybacks.

Annual Report 2017 41
3.2 Fixed remuneration outcomesExecutive remuneration is reviewed annually. Performance and remuneration, both in Australia and internationally is considered in setting remuneration. Fixed remuneration increases for KMP in FY17 primarily reflected the need to retain executives in a competitive market.
Andy VeseyIn appointing Mr Vesey in November 2014, the Board believed it was right to pay around the market median (which was $1,950,000 based on an analysis of MD/CEO remuneration within the ASX 11-50 at that time), reflecting:
• Mr Vesey’s considerable experience in energy businesses globally, including in the United States, Australia, Asia, Europe, Africa and Latin America
• the need for an incoming MD/CEO to set a new strategic agenda given the changing nature of the energy industry and the challenges arising from technological disruption and the community’s expectation for decarbonisation, and
• the need to consider international comparisons given AGL was recruiting Mr Vesey from the United States and the skills the Board were seeking were not available in Australia at that time.
Increases to Mr Vesey’s fixed remuneration since he joined AGL have reflected his performance in the role and the Board’s view that it is highly desirable to retain him to deliver the transformation of AGL while continuing to drive strong shareholder returns at a time of extensive change in the energy industry. In FY16, the Board increased Mr Vesey’s fixed remuneration by 10.5% to $2,100,000, placing him just above the market median against ASX11-50 companies. The Board determined this increase in the context of company performance, community expectations and retention based on market demand for executive talent.
In FY17, the Board increased Mr Vesey’s fixed remuneration by a further 9.5%, effective 1 September 2016, to $2,300,000. Mr Vesey’s fixed remuneration placed him at the 62nd percentile (as at March 2016) relative to a peer group of companies that ranked 11-50 on the ASX by market capitalisation. This decision preceded the strike against the FY16 Remuneration Report, which occurred on 28 September 2016. The current positioning of Mr Vesey’s fixed remuneration places him at the 73rd percentile (as at March 2017) relative to a peer group of companies that rank 11-50 on the ASX by market capitalisation. At 30 June 2017 AGL’s market capitalisation is at the 83rd percentile of the ASX11-50. Mr Vesey will not receive a fixed remuneration increase in FY18.
The Board reduced Mr Vesey’s target STI award from 120% to 100% of fixed remuneration and his maximum STI opportunity from 173% to 144% of fixed remuneration.
Doug JacksonMr Jackson received a 10.7% increase in his fixed remuneration to $775,000 effective 1 September 2016 to align his remuneration to the market and more appropriately reflect the scale and complexity of the generating assets for which he is accountable. The Board believes Mr Jackson’s remuneration now aligns with his experience and performance.
Stephen MikkelsenMr Mikkelsen received a 2.5% increase in fixed remuneration to $973,750 effective 1 September 2016.
Brett RedmanMr Redman received an 8.3% increase in fixed remuneration to $975,000 effective 1 September 2016. Mr Redman continues to perform strongly in his role. The Board believes Mr Redman’s remuneration relative to market benchmarks now aligns with his experience and performance.
3.3 STI outcomesThe Board is satisfied with the FY17 STI payments to the executives for the following reasons:
• profit outcomes exceeded guidance
• operating expenditure reduction exceeded targets
• strong recurring cash flow
• delivery of financial transformation targets, and
• customer experience transformation program on target (with five signature moments launched).

Directors’ Report continued
42 AGL Energy Limited
Table 3.3.1: STI performance measures and FY17 outcomesA VeseyMD/CEO
D JacksonEGM, Group Operations
S MikkelsenEGM, Energy Markets
B RedmanCFO
Goal Type Performance Measure Weighting Min Target Max Weighting Min Target Max Weighting Min Target Max Weighting Min Target Max Outcome
SCO
RECA
RD
Fina
ncia
l
Gro
wth
Profit after tax 50% 50% 50% 50%
Statutory Profit after tax in FY17 was $539 million, up from a Statutory Loss of $(408) million in FY16 - largely reflecting the absence of the significant items that occurred in FY16. Underlying Profit after tax of $802 million, up 14% on FY16.
Prod
uctiv
ity
AGL/Business unit operating expenditure 15% 20% 20% 20% Targeted reduction of AGL operating expenditure of
$170 million exceeded.
Embed lean processes across AGL to achieve quantifiable efficiency improvements
5%More than $40 million of targeted process efficiency improvement projects to be realised in FY18 following implementation of lean processes in 95% of cost centres.
Stra
tegi
c
Tran
sfor
-m
atio
n Deliver AGL’s customer experience transformation with specific deliverables each financial year
10% 30%Customer experience transformation program on target.Five signature moments launched.
Gro
wth
Establish the Powering Australian Renewables Fund (PARF) and build growth pipelines
10% 30% 30%
PARF: established with QIC/Future Fund signed as partners; Nyngan, Broken Hill and Silverton assets vended in to structure.Silverton wind farm - under construction. Cooper’s Gap wind farm - awaiting financial approval.Growth: Western Australia market entry launched; several New Energy investments executed.*
Facilitate a review of strategic technology investments for generating future growth options
10%Global review of strategic investment opportunities undertaken and several partnerships and/or investments executed.*
Overall
* Due to commercial sensitivity certain initiatives and investments undertaken cannot be disclosed. Similarly, certain initiatives and investments were deliberately not executed reflecting strong discipline.

Annual Report 2017 43
Table 3.3.1: STI performance measures and FY17 outcomesA VeseyMD/CEO
D JacksonEGM, Group Operations
S MikkelsenEGM, Energy Markets
B RedmanCFO
Goal Type Performance Measure Weighting Min Target Max Weighting Min Target Max Weighting Min Target Max Weighting Min Target Max Outcome
SCO
RECA
RD
Fina
ncia
l
Gro
wth
Profit after tax 50% 50% 50% 50%
Statutory Profit after tax in FY17 was $539 million, up from a Statutory Loss of $(408) million in FY16 - largely reflecting the absence of the significant items that occurred in FY16. Underlying Profit after tax of $802 million, up 14% on FY16.
Prod
uctiv
ity
AGL/Business unit operating expenditure 15% 20% 20% 20% Targeted reduction of AGL operating expenditure of
$170 million exceeded.
Embed lean processes across AGL to achieve quantifiable efficiency improvements
5%More than $40 million of targeted process efficiency improvement projects to be realised in FY18 following implementation of lean processes in 95% of cost centres.
Stra
tegi
c
Tran
sfor
-m
atio
n Deliver AGL’s customer experience transformation with specific deliverables each financial year
10% 30%Customer experience transformation program on target.Five signature moments launched.
Gro
wth
Establish the Powering Australian Renewables Fund (PARF) and build growth pipelines
10% 30% 30%
PARF: established with QIC/Future Fund signed as partners; Nyngan, Broken Hill and Silverton assets vended in to structure.Silverton wind farm - under construction. Cooper’s Gap wind farm - awaiting financial approval.Growth: Western Australia market entry launched; several New Energy investments executed.*
Facilitate a review of strategic technology investments for generating future growth options
10%Global review of strategic investment opportunities undertaken and several partnerships and/or investments executed.*
Overall
* Due to commercial sensitivity certain initiatives and investments undertaken cannot be disclosed. Similarly, certain initiatives and investments were deliberately not executed reflecting strong discipline.

Directors’ Report continued
44 AGL Energy Limited
Table 3.3.2: Individual performance moderators and FY17 outcomesThe individual performance moderator has the capacity to increase or decrease within the range of 0–1.2 the outcomes of the scorecard. Moderator applies to the overall core financial and strategic outcome in the scorecard, not the weighting.
A VeseyMD/CEO
D JacksonEGM, Group Operations
S MikkelsenEGM, Energy Markets
B RedmanCFO
Goal Type Performance Measure Weighting Min Target Max Weighting Min Target Max Weighting Min Target Max Weighting Min Target Max Outcome
Cultu
re
Safe
ty
Drive the safety culture through measurable initiatives 15% 15% 15% 15%
Strong improvement in all areas of safety performance as measured by:• Employee Total Injury Frequency Rate improved by 53%
from 4.3 to 2.0.• Contractor Total Injury Frequency Rate improved by 50%
from 10.9 to 5.4.
Improvement of site-specific safety 20% Number of safety hazards reported at sites increased by 29% from FY16 as a result of proactive reporting measures.
Tale
nt Identify and develop potential successors for key roles 15% Structured program undertaken to increase capability within
Senior Leadership Pipeline.
Dive
rsity Increase female representation at senior
levels of the company 15% 15% 15% 15%Senior Leadership Pipeline now 38% females, up from 34% in FY16. Three female EGMs appointed to Executive Team, up from zero.
Cust
omer
Satis
fact
ion Enhance customer experience and net
promoter score 15% 20% Net Promoter Score improved to -18.7 from -19.8 in FY16.
Reduction in customer complaints 20% Customer complaints down 13.4% from FY16.
Valu
e
Grow high value customer base 30% The high value customers increased by 3.8% from FY16.
Fina
ncia
l
Prod
uctiv
ity
Achievement of financial performance measures with regard to broader metrics, i.e. quality of the financial result
25%
High quality financial result reflected by:
• $947 million increase in Statutory Profit• 14% increase in Underlying Profit• absence of significant items• strong recurring cash flows• 34% increase in dividends, and• delivery of financial transformation targets.
Improve capital efficiency through asset management 25% ~$1 billion target for divestment of non-core or
under-performing assets met.
Fleet lost capacity factor 25% Achieved plan for lost capacity factor across AGL’s fleet.
Commercial availability of fleet 25% Achieved more than budgeted commercial availability of AGL’s fleet.
Stra
tegi
c
Gro
wth Enhance reputation and standing of the
company 15%Strong improvement in scores received from confidential third party shareholder confidence surveys. Public leadership in energy policy issues established.
Tran
sfor
mat
ion Develop strategy and roadmap for
systems transformation 25% All transformation projects tracking on budget and on time.
Communicate and clarify strategy with stakeholders 20%
Strong improvement in scores received from confidential third party shareholder confidence surveys relating to strategy and communication following overhaul of investor communication strategy.
Table 3.3.3: Actual FY17 STI outcomes
Executives1
Total STI award
$Cash
$ 2
Restricted Shares
$ 3
Total STI paid as % of target
%
Total STI paid as % of
maximum opportunity
%
A Vesey 2,656,500 1,328,250 1,328,250 115.5 80.2D Jackson 662,393 596,154 66,239 122.1 84.8S Mikkelsen4 780,120 780,120 – 114.5 79.5B Redman 840,840 756,756 84,084 123.2 85.6
1. Table 3.3.3 reports only executives who were KMP at 30 June 2017.2. Cash component will be paid in September 2017.3. Restricted Share component will be allocated once the full-year financial results have been disclosed to the market, generally in August/September 2017.4. Mr Mikkelsen’s FY17 STI award will be delivered 100% in cash due to his pending cessation of employment.

Annual Report 2017 45
Table 3.3.2: Individual performance moderators and FY17 outcomesThe individual performance moderator has the capacity to increase or decrease within the range of 0–1.2 the outcomes of the scorecard. Moderator applies to the overall core financial and strategic outcome in the scorecard, not the weighting.
A VeseyMD/CEO
D JacksonEGM, Group Operations
S MikkelsenEGM, Energy Markets
B RedmanCFO
Goal Type Performance Measure Weighting Min Target Max Weighting Min Target Max Weighting Min Target Max Weighting Min Target Max Outcome
Cultu
re
Safe
ty
Drive the safety culture through measurable initiatives 15% 15% 15% 15%
Strong improvement in all areas of safety performance as measured by:• Employee Total Injury Frequency Rate improved by 53%
from 4.3 to 2.0.• Contractor Total Injury Frequency Rate improved by 50%
from 10.9 to 5.4.
Improvement of site-specific safety 20% Number of safety hazards reported at sites increased by 29% from FY16 as a result of proactive reporting measures.
Tale
nt Identify and develop potential successors for key roles 15% Structured program undertaken to increase capability within
Senior Leadership Pipeline.
Dive
rsity Increase female representation at senior
levels of the company 15% 15% 15% 15%Senior Leadership Pipeline now 38% females, up from 34% in FY16. Three female EGMs appointed to Executive Team, up from zero.
Cust
omer
Satis
fact
ion Enhance customer experience and net
promoter score 15% 20% Net Promoter Score improved to -18.7 from -19.8 in FY16.
Reduction in customer complaints 20% Customer complaints down 13.4% from FY16.
Valu
e
Grow high value customer base 30% The high value customers increased by 3.8% from FY16.
Fina
ncia
l
Prod
uctiv
ity
Achievement of financial performance measures with regard to broader metrics, i.e. quality of the financial result
25%
High quality financial result reflected by:
• $947 million increase in Statutory Profit• 14% increase in Underlying Profit• absence of significant items• strong recurring cash flows• 34% increase in dividends, and• delivery of financial transformation targets.
Improve capital efficiency through asset management 25% ~$1 billion target for divestment of non-core or
under-performing assets met.
Fleet lost capacity factor 25% Achieved plan for lost capacity factor across AGL’s fleet.
Commercial availability of fleet 25% Achieved more than budgeted commercial availability of AGL’s fleet.
Stra
tegi
c
Gro
wth Enhance reputation and standing of the
company 15%Strong improvement in scores received from confidential third party shareholder confidence surveys. Public leadership in energy policy issues established.
Tran
sfor
mat
ion Develop strategy and roadmap for
systems transformation 25% All transformation projects tracking on budget and on time.
Communicate and clarify strategy with stakeholders 20%
Strong improvement in scores received from confidential third party shareholder confidence surveys relating to strategy and communication following overhaul of investor communication strategy.
Table 3.3.3: Actual FY17 STI outcomes
Executives1
Total STI award
$Cash
$ 2
Restricted Shares
$ 3
Total STI paid as % of target
%
Total STI paid as % of
maximum opportunity
%
A Vesey 2,656,500 1,328,250 1,328,250 115.5 80.2D Jackson 662,393 596,154 66,239 122.1 84.8S Mikkelsen4 780,120 780,120 – 114.5 79.5B Redman 840,840 756,756 84,084 123.2 85.6
1. Table 3.3.3 reports only executives who were KMP at 30 June 2017.2. Cash component will be paid in September 2017.3. Restricted Share component will be allocated once the full-year financial results have been disclosed to the market, generally in August/September 2017.4. Mr Mikkelsen’s FY17 STI award will be delivered 100% in cash due to his pending cessation of employment.

Directors’ Report continued
46 AGL Energy Limited
3.4 LTI outcomesFY17 LTI planThe LTI is a Performance Rights plan which assesses AGL’s performance against two key metrics over a three-year period. The metrics for FY17 are relative TSR and ROE and are explained below.
TSR metricFor the FY17 LTI plan, following shareholder feedback, AGL moved to simplify the relative TSR metric to use the constituent companies in the S&P/ASX100 index as the comparator group. (For the FY16 plan, AGL had used a customised peer group (refer Table 1.1.1) selected to reflect similar characteristics to AGL in relation to volatility, industry, size and other factors – but this was deemed too opaque and complicated by many shareholders.)
ROE metricSetting ROE targets is inherently difficult in the rapidly evolving Australian energy market. The Board is always striving to strike a balance between setting goals that are appropriately stretching for management while not being unattainable and that are viewed by shareholders as targeting appropriate levels of returns. While always judged by shareholders with the benefit of hindsight, the Board sets these targets prospectively based on the best information available at the time:
• For FY16, the Board approved LTI ROE targets across a vesting range of 10-15% from a base ROE of 7.2% in FY15. In light of the transformative strategy led by the new MD/CEO, the Board set challenging aspirational targets to drive early outperformance on that plan. At the time, AGL was only in the early phases of forming its view on the direction and shape of its strategy to become an agile, customer focused organisation. With benefit of hindsight, these appear to have been too stretching from the base year. Average ROE across FY16 and FY17 has been 8.6% (excluding share buyback and asset write-downs). At this level there will be no vesting under this grant. ROE would need to increase to 12.8% excluding the benefit of buybacks and write-offs in FY18 (from 9.24% in FY17) for threshold vesting and up to 27.8% for full vesting. With a year to go before these rights are tested management will continue to attempt to maximise opportunities to realise some vesting of these LTIs.
• For FY17, having noted the strong progress being made at transforming AGL and the impact that transformation has had on ROE over the financial year, the Board approved LTI ROE targets across a vesting range of 9-10% from a base ROE of 8.3% in FY16 to re-set expectations of a newly formed executive team and motivate them to deliver on AGL’s strategy. At this time, these were considered challenging as the outlook for wholesale prices and customer margins were expected to be flat and there was considerable uncertainty around the outcome of the Loy Yang enterprise agreement negotiations. Importantly, the targets were also set prior to the announcement of the closure of Engie’s Hazelwood power station which occurred earlier than anticipated and was a contributing factor to the sudden and unexpected rise in wholesale electricity prices. To achieve threshold vesting under the FY17 grant, profit would have increased on average by 6.6% per annum over the three years, requiring average increase of approximately 13% per annum for full vesting. The Board felt these were stretching targets at the time of setting these targets. With the benefit of hindsight, having achieved an increase in ROE to 10.2% including share buyback (9.97% excluding share buyback) in FY17, these appear now to have been set too low. However, management need to continue to manage in an agile manner and innovate ahead of our competitors and market disruptors to ensure vesting when tested in two years’ time. The Board also believes that this is an appropriate result when combined with the aspirational targets set in FY16.
• In further reviewing AGL’s outlook, the Board has approved a vesting range of 11.5% to 14% for the FY18 grant, from a base ROE of 10.2% including share buyback in FY17. The Board took comfort from its internal business plans, understanding of market consensus and consideration of what should constitute an acceptable level of return to its shareholders that these are appropriately robust targets that require strong performance. This takes into account the significant investments required including the customer experience transformation program, development of the Barker Inlet power station in South Australia and potential further significant investment in gas storage, new generation capacity in the National Electricity Market, new energy investments and potential geographical expansion. The company has sought independent advice on the appropriateness of the hurdle range which considered the stretched forecast, extrapolation of historical growth and shareholder expectations as represented in broker reporting. The Board believes that the FY18 targets appropriately strike a balance between driving an outperformance and truly motivating executives to deliver value to shareholders. However, as the company’s recent history attests, setting targets three years out in a rapidly evolving industry is difficult.
In assessing outcomes under the FY16, FY17 and FY18 LTI grants, the Board will assess the quality of the results and the manner in which they were achieved as well as ensuring that those outcomes are aligned with the experience of AGL’s shareholders.
Table 3.4.1: FY17 LTI Performance Rights
Executives1 Grant date Vesting date
Number of awards
granted
Value at grant date
$ 2
Maximum value yet to vest
$ 3
A Vesey4 21 October 2016 30 June 2019 147,068 1,927,326 1,927,326D Jackson 21 October 2016 30 June 2019 28,907 356,708 356,708S Mikkelsen 21 October 2016 30 June 2019 36,320 448,189 448,189B Redman 21 October 2016 30 June 2019 36,367 448,764 448,764
1. Table 3.4.1 reports only executives who were KMP at the grant date.2. The value at grant date is calculated based on the fair values shown in note 34 to the consolidated financial report, being $7.96 for relative TSR and $16.72 for ROE.3. The maximum value is calculated based on the fair values shown in note 34 to the consolidated financial report, being $7.96 for relative TSR and $16.72 for ROE. The minimum value
of the grant is zero.4. As Mr Vesey received his LTI offer after the 2016 AGM, the values at grant and maximum value yet to vest are based on the alternate fair values shown in note 34 to the consolidated
financial report, being $9.10 for relative TSR and $17.11 for ROE. The minimum value of the grant is zero.

Annual Report 2017 47
FY17 performance outcomes under FY15 annual banking LTI plan (pre-FY16 LTI plan)The FY15 Remuneration Report outlined the Board’s decision to replace the previous LTI annual banking plan with the current LTI plan introduced in FY16. Although the pre-FY16 plan was directly linked to share price performance (combining both absolute and relative TSR in testing Performance Rights), the current LTI plan is simpler and more aligned with standard practice among ASX companies. The pre-FY16 LTI plan provided for vesting for the last time in FY17.
In relation to the absolute TSR metric, the closing of the plan means that TSR performance beyond 14% up to 42% will never be taken into account in executive’s future remuneration outcomes but continues to benefit shareholders. The plan has now closed and has aligned executive remuneration outcomes with the significant value delivered to shareholders. This is illustrated in the diagram below.
Potential vesting opportunities for executives under the new plan are materially lower when the company performs well and similar when it under performs. The outcome of these final tests are presented in the next two diagrams.
Absolute TSR: AGL
FY13Actual Growth: (1.1%)
No Allocation
FY14Actual Growth: 11.8%
Deposit: 1.56x
FY15Actual Growth: 14.8%
Deposit: 2.0x
FY16Actual Growth: 22.3%
Deposit: 2.0x
FY17Actual Growth: 42.4%
Deposit: 2.0x
-1.1
11.814.8
22.3
42.4
-10.0
0.0
10.0
20.0
30.0
40.0
50.0
Relative TSR: AGL and ASX100
FY15Percentile Ranking: 47.00th
Deposit: 0.47x
FY14Percentile Ranking: 34.70th
No Allocation
FY16Percentile Ranking: 74.50th
Deposit: 1.36x
FY17Percentile Ranking: 84.78th
Deposit: 1.79x
30 Jun 1730 Jun 1630 Jun 1530 Jun 1430 Jun 12 30 Jun 13
RTSR replaced EBIT/Funds
Employed in FY14
Total Shareholder Return (TSR) Chart for AGL vs. ASX100 IndexFrom 1 July 2012 to 30 June 2017
AGL EnergyASX100 Index
-10%
40%
90%
140%
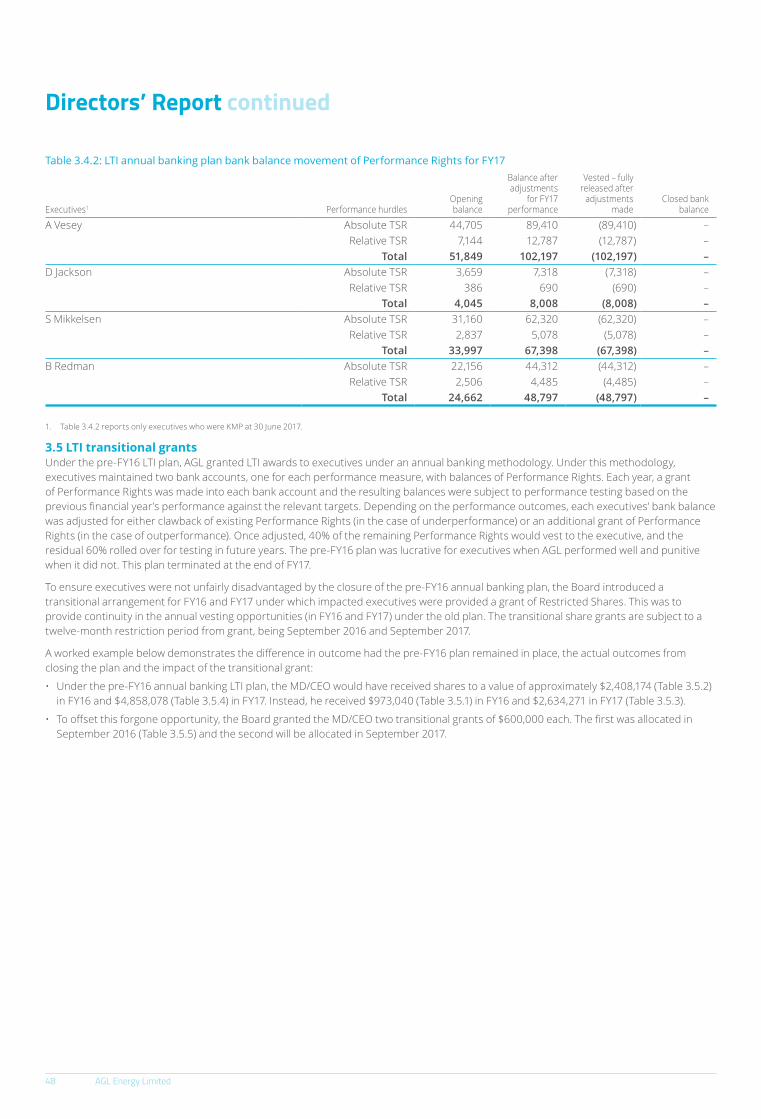
Directors’ Report continued
48 AGL Energy Limited
Table 3.4.2: LTI annual banking plan bank balance movement of Performance Rights for FY17
Executives1 Performance hurdlesOpening balance
Balance after adjustments
for FY17 performance
Vested – fullyreleased after adjustments
madeClosed bank
balance
A Vesey Absolute TSR 44,705 89,410 (89,410) –Relative TSR 7,144 12,787 (12,787) –
Total 51,849 102,197 (102,197) –D Jackson Absolute TSR 3,659 7,318 (7,318) –
Relative TSR 386 690 (690) –Total 4,045 8,008 (8,008) –
S Mikkelsen Absolute TSR 31,160 62,320 (62,320) –Relative TSR 2,837 5,078 (5,078) –
Total 33,997 67,398 (67,398) –B Redman Absolute TSR 22,156 44,312 (44,312) –
Relative TSR 2,506 4,485 (4,485) –Total 24,662 48,797 (48,797) –
1. Table 3.4.2 reports only executives who were KMP at 30 June 2017.
3.5 LTI transitional grantsUnder the pre-FY16 LTI plan, AGL granted LTI awards to executives under an annual banking methodology. Under this methodology, executives maintained two bank accounts, one for each performance measure, with balances of Performance Rights. Each year, a grant of Performance Rights was made into each bank account and the resulting balances were subject to performance testing based on the previous financial year’s performance against the relevant targets. Depending on the performance outcomes, each executives’ bank balance was adjusted for either clawback of existing Performance Rights (in the case of underperformance) or an additional grant of Performance Rights (in the case of outperformance). Once adjusted, 40% of the remaining Performance Rights would vest to the executive, and the residual 60% rolled over for testing in future years. The pre-FY16 plan was lucrative for executives when AGL performed well and punitive when it did not. This plan terminated at the end of FY17.
To ensure executives were not unfairly disadvantaged by the closure of the pre-FY16 annual banking plan, the Board introduced a transitional arrangement for FY16 and FY17 under which impacted executives were provided a grant of Restricted Shares. This was to provide continuity in the annual vesting opportunities (in FY16 and FY17) under the old plan. The transitional share grants are subject to a twelve-month restriction period from grant, being September 2016 and September 2017.
A worked example below demonstrates the difference in outcome had the pre-FY16 plan remained in place, the actual outcomes from closing the plan and the impact of the transitional grant:
• Under the pre-FY16 annual banking LTI plan, the MD/CEO would have received shares to a value of approximately $2,408,174 (Table 3.5.2) in FY16 and $4,858,078 (Table 3.5.4) in FY17. Instead, he received $973,040 (Table 3.5.1) in FY16 and $2,634,271 in FY17 (Table 3.5.3).
• To offset this forgone opportunity, the Board granted the MD/CEO two transitional grants of $600,000 each. The first was allocated in September 2016 (Table 3.5.5) and the second will be allocated in September 2017.

Annual Report 2017 49
Table 3.5.1: Grant made to MD/CEO under the former annual banking plan in FY15, annual testing applied in FY16FY16 (actual)
Performance measure
Opening bank account
balanceAnnual award
granted Multiplier
Awards to be allocated to bank
account after performance
testing
Cumulative bank account
balance
Awards vested(50% of bank
balance after allocation )1
Value of vested shares
$ 2
Absolute TSR 44,705 – 2 x 44,705 89,410 44,705 838,970Relative TSR 10,506 – 1.36 x 3,782 14,288 7,144 134,070Total 55,211 – 48,487 103,698 51,849 973,040
Table 3.5.2: Hypothetical grant to MD/CEO had pre-FY16 annual banking plan remainedFY16 (old)
Performance measure
Opening bank account
balance
Annual award granted
(120% of FR )3 Multiplier
Awards to be allocated to bank
account after performance
testing
Cumulative bank account
balance
Awards vested(40% of bank
balance after allocation)
Value of vested shares
$ 2
Absolute TSR 44,705 79,046 2 x 158,092 202,797 81,118 1,522,325Relative TSR 10,506 79,046 1.36 x 107,502 118,008 47,203 885,849Total 55,211 158,092 265,594 320,805 128,321 2,408,174
1. In closing the plan, the Board determined to vest the bank accounts at 50% over a two-year period, FY16 and FY17.2. Value calculated based on an assumed vesting share price of $18.7668 ( June 2016 volume-weighted average AGL share price).3. Based on FR at 1 September 2015 ($2,100,000) and June 2015 volume-weighted average AGL share price ($15.94).
Table 3.5.3: Grant made to MD/CEO under the former annual banking plan in FY16, annual testing applied in FY17FY17 (actual)
Performance measure
Opening bank account
balanceAnnual award
granted Multiplier
Awards to be allocated to bank
account after performance
testing
Cumulative bank account
balance
Awards vested(remainder of bank balance
after allocation )1
Value of vested shares
$ 2
Absolute TSR 44,705 – 2 x 44,705 89,410 89,410 2,304,668Relative TSR 7,144 – 1.79 x 5,643 12,787 12,787 329,603Total 51,849 – 50,348 102,197 102,197 2,634,271
Table 3.5.4: Hypothetical grant to MD/CEO had pre-FY16 annual banking plan remainedFY17 (old)
Performance measure
Opening bank account
balance
Annual award granted
(120% of FR) 3 Multiplier
Awards to be allocated to bank
account after performance
testing
Cumulative bank account
balance
Awards vested(40% of bank
balance after allocation)
Value of vested shares
$ 2
Absolute TSR 121,679 73,534 2 x 147,068 268,747 107,498 2,770,911Relative TSR 70,805 73,534 1.79 x 131,625 202,430 80,972 2,087,167Total 192,484 147,068 278,693 471,177 188,470 4,858,078
1. Full balance to vest in FY17 as a result of the closure of the annual banking plan.2. Value calculated based on an assumed vesting share price of $25.7764 ( June 2017 volume-weighted average AGL share price).3. Based on FR at 1 September 2016 ($2,300,000) and June 2016 volume-weighted average AGL share price ($18.7668).
Table 3.5.5: FY16 LTI Transitional Restricted Share awards
Executives1 Allocation date
Number of awards
allocated
Value at allocation date
$ 2 Vesting date
A Vesey 30 September 2016 31,971 599,993 30 September 2017D Jackson 30 September 2016 852 15,989 30 September 2017S Mikkelsen 30 September 2016 6,394 119,995 30 September 2017B Redman 30 September 2016 5,594 104,981 30 September 2017
1. Table 3.5.5 reports only executives who were KMP at 30 June 2017.2. Value at allocation date calculated based on allocation price of $18.7668 ( June 2016 volume-weighted average AGL share price).
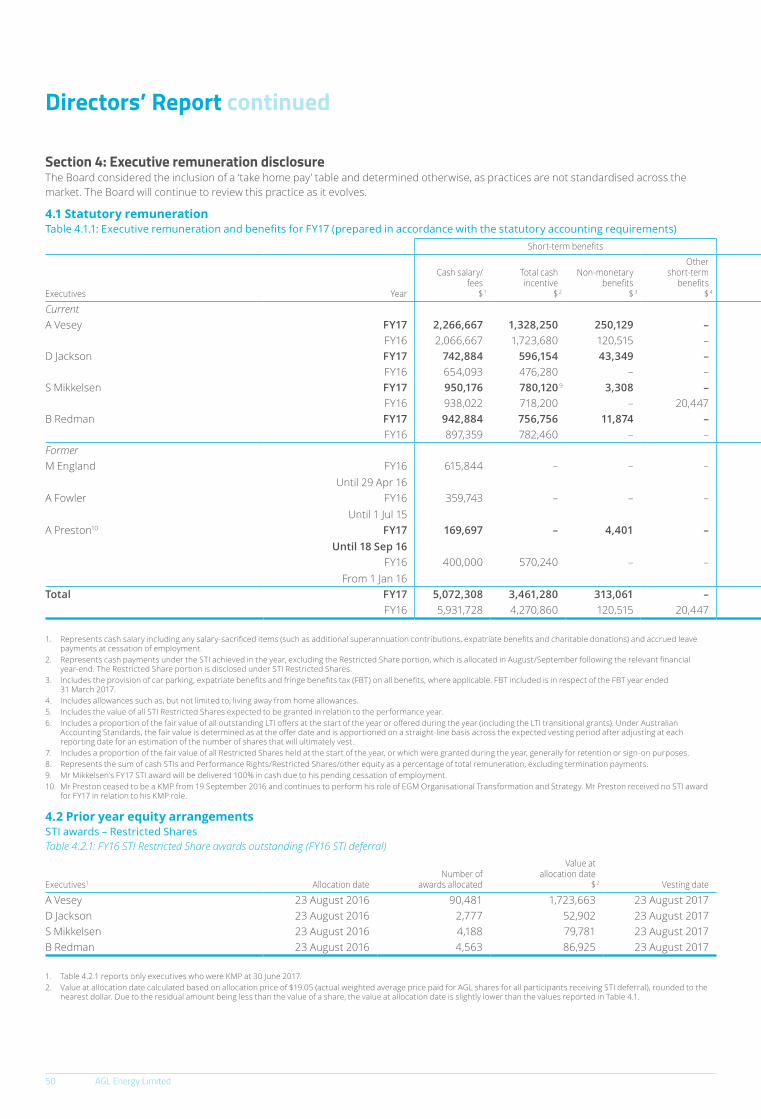
Directors’ Report continued
50 AGL Energy Limited
Section 4: Executive remuneration disclosureThe Board considered the inclusion of a ‘take home pay’ table and determined otherwise, as practices are not standardised across the market. The Board will continue to review this practice as it evolves.
4.1 Statutory remunerationTable 4.1.1: Executive remuneration and benefits for FY17 (prepared in accordance with the statutory accounting requirements)
Short-term benefits Post-employment benefits Share-based payments
Executives Year
Cash salary/fees
$ 1
Total cash incentive
$ 2
Non-monetary benefits
$ 3
Other short-term
benefits$ 4
Superannuation /pension
$
STI Restricted Shares
$ 5
LTI equity
$ 6
Other equity
$ 7Total
$
Performance-related
% 8
Termination benefits
$
CurrentA Vesey FY17 2,266,667 1,328,250 250,129 – – 1,328,250 1,728,310 – 6,901,606 63.5% –
FY16 2,066,667 1,723,680 120,515 – – 1,723,680 1,307,477 – 6,942,019 68.5% –D Jackson FY17 742,884 596,154 43,349 – 19,616 66,239 224,728 – 1,692,970 52.4% –
FY16 654,093 476,280 – – 19,308 52,920 111,922 – 1,314,523 48.8% –S Mikkelsen FY17 950,176 780,120 9 3,308 – 19,616 – 431,219 – 2,184,439 55.5% –
FY16 938,022 718,200 – 20,447 19,308 79,800 326,126 – 2,101,903 53.5% –B Redman FY17 942,884 756,756 11,874 – 19,616 84,084 388,226 – 2,203,440 55.8% –
FY16 897,359 782,460 – – 19,308 86,940 277,426 – 2,063,493 55.6% –FormerM England FY16
Until 29 Apr 16615,844 – – – 16,090 – – – 631,934 0.0% –
A Fowler FY16Until 1 Jul 15
359,743 – – – – – – – 359,743 0.0% 730,052
A Preston10 FY17Until 18 Sep 16
169,697 – 4,401 – – – 64,892 – 238,990 27.2% –
FY16From 1 Jan 16
400,000 570,240 – – – 63,360 106,043 – 1,139,643 64.9% –
Total FY17 5,072,308 3,461,280 313,061 – 58,848 1,478,573 2,837,375 – 13,221,445 –FY16 5,931,728 4,270,860 120,515 20,447 74,014 2,006,700 2,128,994 – 14,553,258 730,052
1. Represents cash salary including any salary-sacrificed items (such as additional superannuation contributions, expatriate benefits and charitable donations) and accrued leave payments at cessation of employment.
2. Represents cash payments under the STI achieved in the year, excluding the Restricted Share portion, which is allocated in August/September following the relevant financial year-end. The Restricted Share portion is disclosed under STI Restricted Shares.
3. Includes the provision of car parking, expatriate benefits and fringe benefits tax (FBT) on all benefits, where applicable. FBT included is in respect of the FBT year ended 31 March 2017.
4. Includes allowances such as, but not limited to, living away from home allowances.5. Includes the value of all STI Restricted Shares expected to be granted in relation to the performance year.6. Includes a proportion of the fair value of all outstanding LTI offers at the start of the year or offered during the year (including the LTI transitional grants). Under Australian
Accounting Standards, the fair value is determined as at the offer date and is apportioned on a straight-line basis across the expected vesting period after adjusting at each reporting date for an estimation of the number of shares that will ultimately vest.
7. Includes a proportion of the fair value of all Restricted Shares held at the start of the year, or which were granted during the year, generally for retention or sign-on purposes.8. Represents the sum of cash STIs and Performance Rights/Restricted Shares/other equity as a percentage of total remuneration, excluding termination payments.9. Mr Mikkelsen’s FY17 STI award will be delivered 100% in cash due to his pending cessation of employment.10. Mr Preston ceased to be a KMP from 19 September 2016 and continues to perform his role of EGM Organisational Transformation and Strategy. Mr Preston received no STI award
for FY17 in relation to his KMP role.
4.2 Prior year equity arrangementsSTI awards – Restricted SharesTable 4.2.1: FY16 STI Restricted Share awards outstanding (FY16 STI deferral)
Executives1 Allocation dateNumber of
awards allocated
Value at allocation date
$ 2 Vesting date
A Vesey 23 August 2016 90,481 1,723,663 23 August 2017D Jackson 23 August 2016 2,777 52,902 23 August 2017S Mikkelsen 23 August 2016 4,188 79,781 23 August 2017B Redman 23 August 2016 4,563 86,925 23 August 2017
1. Table 4.2.1 reports only executives who were KMP at 30 June 2017.2. Value at allocation date calculated based on allocation price of $19.05 (actual weighted average price paid for AGL shares for all participants receiving STI deferral), rounded to the
nearest dollar. Due to the residual amount being less than the value of a share, the value at allocation date is slightly lower than the values reported in Table 4.1.
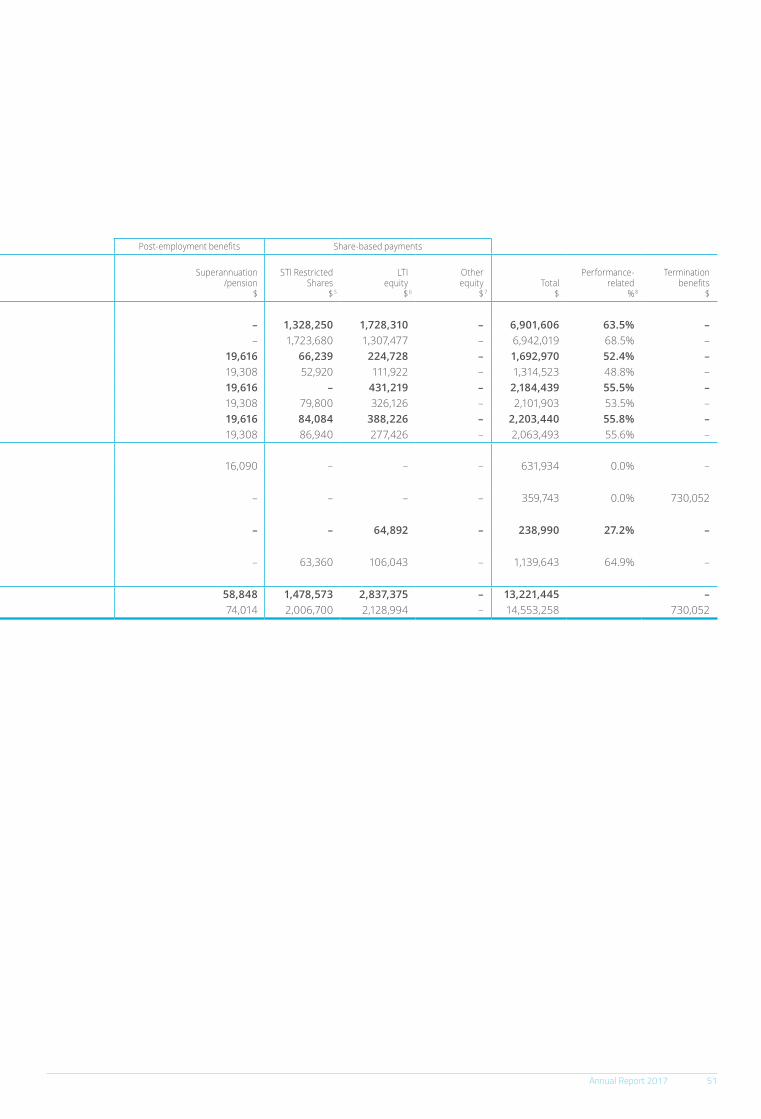
Annual Report 2017 51
Section 4: Executive remuneration disclosureThe Board considered the inclusion of a ‘take home pay’ table and determined otherwise, as practices are not standardised across the market. The Board will continue to review this practice as it evolves.
4.1 Statutory remunerationTable 4.1.1: Executive remuneration and benefits for FY17 (prepared in accordance with the statutory accounting requirements)
Short-term benefits Post-employment benefits Share-based payments
Executives Year
Cash salary/fees
$ 1
Total cash incentive
$ 2
Non-monetary benefits
$ 3
Other short-term
benefits$ 4
Superannuation /pension
$
STI Restricted Shares
$ 5
LTI equity
$ 6
Other equity
$ 7Total
$
Performance-related
% 8
Termination benefits
$
CurrentA Vesey FY17 2,266,667 1,328,250 250,129 – – 1,328,250 1,728,310 – 6,901,606 63.5% –
FY16 2,066,667 1,723,680 120,515 – – 1,723,680 1,307,477 – 6,942,019 68.5% –D Jackson FY17 742,884 596,154 43,349 – 19,616 66,239 224,728 – 1,692,970 52.4% –
FY16 654,093 476,280 – – 19,308 52,920 111,922 – 1,314,523 48.8% –S Mikkelsen FY17 950,176 780,120 9 3,308 – 19,616 – 431,219 – 2,184,439 55.5% –
FY16 938,022 718,200 – 20,447 19,308 79,800 326,126 – 2,101,903 53.5% –B Redman FY17 942,884 756,756 11,874 – 19,616 84,084 388,226 – 2,203,440 55.8% –
FY16 897,359 782,460 – – 19,308 86,940 277,426 – 2,063,493 55.6% –FormerM England FY16
Until 29 Apr 16615,844 – – – 16,090 – – – 631,934 0.0% –
A Fowler FY16Until 1 Jul 15
359,743 – – – – – – – 359,743 0.0% 730,052
A Preston10 FY17Until 18 Sep 16
169,697 – 4,401 – – – 64,892 – 238,990 27.2% –
FY16From 1 Jan 16
400,000 570,240 – – – 63,360 106,043 – 1,139,643 64.9% –
Total FY17 5,072,308 3,461,280 313,061 – 58,848 1,478,573 2,837,375 – 13,221,445 –FY16 5,931,728 4,270,860 120,515 20,447 74,014 2,006,700 2,128,994 – 14,553,258 730,052
1. Represents cash salary including any salary-sacrificed items (such as additional superannuation contributions, expatriate benefits and charitable donations) and accrued leave payments at cessation of employment.
2. Represents cash payments under the STI achieved in the year, excluding the Restricted Share portion, which is allocated in August/September following the relevant financial year-end. The Restricted Share portion is disclosed under STI Restricted Shares.
3. Includes the provision of car parking, expatriate benefits and fringe benefits tax (FBT) on all benefits, where applicable. FBT included is in respect of the FBT year ended 31 March 2017.
4. Includes allowances such as, but not limited to, living away from home allowances.5. Includes the value of all STI Restricted Shares expected to be granted in relation to the performance year.6. Includes a proportion of the fair value of all outstanding LTI offers at the start of the year or offered during the year (including the LTI transitional grants). Under Australian
Accounting Standards, the fair value is determined as at the offer date and is apportioned on a straight-line basis across the expected vesting period after adjusting at each reporting date for an estimation of the number of shares that will ultimately vest.
7. Includes a proportion of the fair value of all Restricted Shares held at the start of the year, or which were granted during the year, generally for retention or sign-on purposes.8. Represents the sum of cash STIs and Performance Rights/Restricted Shares/other equity as a percentage of total remuneration, excluding termination payments.9. Mr Mikkelsen’s FY17 STI award will be delivered 100% in cash due to his pending cessation of employment.10. Mr Preston ceased to be a KMP from 19 September 2016 and continues to perform his role of EGM Organisational Transformation and Strategy. Mr Preston received no STI award
for FY17 in relation to his KMP role.
4.2 Prior year equity arrangementsSTI awards – Restricted SharesTable 4.2.1: FY16 STI Restricted Share awards outstanding (FY16 STI deferral)
Executives1 Allocation dateNumber of
awards allocated
Value at allocation date
$ 2 Vesting date
A Vesey 23 August 2016 90,481 1,723,663 23 August 2017D Jackson 23 August 2016 2,777 52,902 23 August 2017S Mikkelsen 23 August 2016 4,188 79,781 23 August 2017B Redman 23 August 2016 4,563 86,925 23 August 2017
1. Table 4.2.1 reports only executives who were KMP at 30 June 2017.2. Value at allocation date calculated based on allocation price of $19.05 (actual weighted average price paid for AGL shares for all participants receiving STI deferral), rounded to the
nearest dollar. Due to the residual amount being less than the value of a share, the value at allocation date is slightly lower than the values reported in Table 4.1.

Directors’ Report continued
52 AGL Energy Limited
Table 4.2.2: FY15 STI Restricted Share awards vested during FY17 (FY15 STI deferral)
Executives1 Allocation dateNumber of
awards vestedValue vested
$ 2 Vesting date
A Vesey 25 August 2015 33,510 628,313 25 August 2016D Jackson 25 August 2015 2,284 42,825 25 August 2016S Mikkelsen 25 August 2015 2,982 55,913 25 August 2016B Redman 25 August 2015 2,634 49,388 25 August 2016
1. Table 4.2.2 reports only executives who were KMP at 30 June 2017.2. The value vested is calculated based on the closing share price on the vesting date, being $18.75.
LTI awards – Performance RightsTable 4.2.3: FY16 LTI Performance Rights outstanding
Executives1 Grant date Vesting date
Number of awards
granted
Value at grant date
$ 2
Maximum value yet to vest
$ 3
A Vesey 30 September 2015 30 June 2018 158,093 1,827,553 1,827,553D Jackson 30 September 2015 30 June 2018 21,958 253,834 253,834S Mikkelsen 30 September 2015 30 June 2018 29,800 344,488 344,488B Redman 30 September 2015 30 June 2018 28,231 326,348 326,348
1. Table 4.2.3 reports only executives who were KMP at 30 June 2017.2. Value at grant date calculated based on fair values shown in note 34, being $9.00 for relative TSR and $14.12 for ROE.3. Maximum value calculated based on fair values shown in note 34, being $9.00 for relative TSR and $14.12 for ROE. The minimum total value of the grant is zero.
4.3 Movement in Performance RightsTable 4.3.1: FY17 movement in executive Performance Right holdings under the LTI plan
ExecutivesBalance at
start of year
Acquired duringthe year as part
of remuneration
Performance Rights vested but not yet
allocated 1Other changes during the year 2
Balance at end of year
CurrentA Vesey 209,942 147,068 (102,197) 50,348 305,161 D Jackson 26,003 28,907 (8,008) 3,963 50,865 S Mikkelsen 63,797 36,320 (67,398) 33,401 66,120 B Redman 52,893 36,367 (48,797) 24,135 64,598 FormerA Preston3 25,095 – – (25,095) – Total 377,730 248,662 (226,400) 86,752 486,744
1. Includes Performance Rights that have vested under the LTI but will not be allocated as shares to executives until August/September 2017.2. Represents increase/decrease from annual LTI performance testing before any vesting, balance adjustments for executives joining or leaving KMP and any units forfeited during FY17.3. Mr Preston ceased to be a KMP from 19 September 2016. As such, his closing balance has been adjusted to reflect no further holdings as a KMP.
Section 5: Non-executive directors’ remuneration5.1 Fee poolThe maximum aggregate fee pool for non-executive directors is $2.75 million per annum. The fee pool is regularly reviewed by the Board and, if appropriate, adjusted (subject to shareholder approval), having regard to the anticipated time commitment, workload and responsibilities attached and the fees paid by comparable organisations. The current fee pool was approved by shareholders at the 2016 AGM. The Board does not anticipate fee increases in calendar year 2018 to be more than the prevailing consumer price index (CPI) movements.
5.2 Fee policyNon-executive directors receive a base fee. Members of a Committee receive a Committee fee to recognise the associated higher workload and extra responsibilities. Chairing a Committee attracts a higher fee rate. The Chairman of the Board receives a higher base fee in recognition of the added responsibility and time commitment; however the Chairman does not receive any extra remuneration for participating in or chairing any Committees. Fees are inclusive of superannuation. There are no additional committee fees in relation to the Nominations Committee.

Annual Report 2017 53
In setting non-executive directors’ fees, the Board considers the following:
• time commitment
• workload
• risk and responsibility
• individual background, skills and experience, and
• market benchmark data, sourced from companies with a similar market capitalisation.
To ensure independence, non-executive directors do not receive performance-related remuneration. This allows the Board to focus on governance and both short and long-term strategy.
5.3 FY17 feesTable 5.3.1: Non-executive director fees (effective 1 January 2017)
Board/CommitteeChair fee
$Director fee
$
Base fee 546,000 189,300Audit and Risk Management Committee 52,000 26,000Other Committees 40,000 20,000
Table 5.3.2: Non-executive director remuneration for FY17
Non-executive director1 YearCash fees
$Superannuation
$Total
$
CurrentJ Maycock FY17 519,734 19,616 539,350
FY16 506,892 19,308 526,200P Botten FY17
From 21 Oct 2016131,565 12,499 144,064
J Hey FY17 212,084 19,616 231,700 FY16
From 21 Mar 201659,007 5,457 64,464
L Hosking FY17 231,534 19,616 251,150 FY16 224,592 19,308 243,900
G Hunt FY17 227,619 19,381 247,000 FY16 198,995 18,905 217,900
B Hutchinson FY17 212,084 19,616 231,700 FY16 205,903 19,297 225,200
D Smith-Gander FY17From 28 Sep 2016
157,506 14,812 172,318
J Stanhope FY17 237,734 19,616 257,350 FY16 230,892 19,308 250,200
FormerS McPhee FY16 224,592 19,308 243,900B Phillips FY17
Until 28 Sep 201650,542 4,755 55,297
FY16 205,903 19,297 225,200Total FY17 1,980,402 149,527 2,129,929
FY16 1,856,776 140,188 1,996,964
1. During FY17 AGL increased the number of non-executive directors to eight. AGL closed FY16 with only seven non-executive directors. There was crossover between Jacqueline Hey and Sandra McPhee between 21 March 2016 and 30 June 2016.

Directors’ Report continued
54 AGL Energy Limited
Section 6: Remuneration governance6.1 Role of the People and Performance (P&P) CommitteeThe primary purpose of the P&P Committee is to aid the Board in fulfilling its responsibilities to shareholders, customers, employees and the broader community through the recruitment, retention and remuneration of executives with the capabilities and skills necessary to execute AGL’s strategy.
The P&P Committee reviews and makes recommendations to the Board on the remuneration arrangements for the MD/CEO, non-executive directors and executives. More generally, the P&P Committee aids the Board in relation to matters such as monitoring remuneration and employment policies, procedures and programs. In addition to its remuneration responsibilities, the P&P Committee’s duties include overseeing talent/leadership development, providing guidance in respect of employee relations and employee engagement, and other people matters as they may arise. The complete P&P Charter is reviewed at least every two years and is available on AGL’s website: www.agl.com.au/BoardAndCommitteeCharters.
The P&P Committee includes independent members of the Board, which are reviewed periodically. To assist in performing its duties and making recommendations to the Board, the P&P Committee has access to management and independent external consultants to seek advice on various remuneration-related matters as required. The Board’s protocols in respect of the engagement of remuneration advisers are outlined in the next section.
6.2 Remuneration advisersAny recommendations made by consultants in relation to remuneration arrangements of KMP must be made directly to the Board without any influence from management. There are arrangements in place to ensure any advice is independent of management. The Board did not receive any ‘remuneration recommendations’ as defined in the Corporations Act 2001 (Cth) during FY17.
Over the course of FY17, the P&P Committee engaged KPMG – 3dc to act as independent remuneration advisers. KPMG – 3dc provided a broad range of services to AGL during the year, including advice on AGL’s approach to stakeholder engagement and communication post the first strike received in 2016, the provision of market data regarding peer remuneration practices, updates on best practice and market trends and related governance advice. KPMG – 3dc did not provide any remuneration recommendations as defined in the Corporations Act 2001 (Cth) to the P&P Committee during FY17.
6.3 Executive contract termsRemuneration and other terms of employment for executives are formalised in service agreements. The service agreements provide for participation in short and long-term incentives in accordance with the terms of the respective plans. All service agreements are for an unlimited duration.
Table 6.3.1: Information relating to service agreements of executives
Executives1
Notice period2Termination
payment 3Post-employment
restraint periodBy executive By AGL
A Vesey 6 months 4 12 months N/A 12 monthsD Jackson 6 months 5 3 months 9 months FR 12 monthsS Mikkelsen 6 months 5 3 months 6 9 months FR 12 monthsB Redman 6 months 5 3 months 9 months FR 12 months
1. Table reports only executives who were KMP at 30 June 2017.2. AGL can, at its election, make a payment in lieu of part or all of the notice period.3. Maximum termination payment (exclusive of any payment in lieu of notice) payable if AGL terminates the executive’s employment other than for cause.4. Mr Vesey may also terminate his agreement with three months’ notice in the event of a ‘fundamental change’, which includes circumstances where he ceases to hold the most
senior management role within AGL or ceases to report directly to the Chairman, or if the scope of his responsibilities is materially diminished. In this case he will be entitled to a payment equivalent to twelve months’ fixed remuneration.
5. Executives may also terminate their agreement with three months’ notice in the event of a ‘fundamental change’, which includes circumstances where there has been a substantial diminution of role and responsibility of the executive, in which event they will be entitled to a payment equivalent to nine months’ FR.
6. AGL will provide six months’ notice in circumstances of unsatisfactory performance.

Annual Report 2017 55
6.4 Equity plan governanceTable 6.4.1: Key elements of equity plan governanceElement Details
Clawback The Board has discretion to prescribe clawback events in which any unvested equity awards may be clawed back from executives.
Change of control The Board will determine at the time a change of control event occurs how to treat unvested equity in accordance with the plan rules, and ultimately has absolute discretion in determining this treatment, taking into consideration market practice.
Hedging policy AGL has a policy in place that prevents executives from entering into any derivative or other financial product in relation to equity plans.
Cessation of employment
Prior to vesting date: if an executive leaves AGL before the scheduled vesting date, they are generally not entitled to participate in the vesting event. The Board has discretion to determine the relevant treatment at termination in the event of redundancy or other involuntary termination, including bona fide retirement.Post-vesting date: once equity has vested, generally no further employment or other restrictions apply.
Board discretion In relation to assessing equity awards, including treatment at vesting, the Board’s overarching discretion will apply, particularly when determining whether an extraordinary event should be taken into consideration in relation to assessing the performance of AGL for the purposes of the vesting event.
6.5 KMP share ownershipMinimum shareholding policyTo provide for shareholder alignment, AGL operates two minimum shareholding policies for executives and for non-executive directors. All KMP are expected to demonstrate meaningful progress towards meeting their minimum shareholding level across the required period. Tracking against the relevant minimum shareholding policy for each KMP is reported in Table 6.5.1.
The minimum shareholding policies stipulate that:
Non-executive directors Executives
• over a four-year period, directors should accumulate and thereafter maintain AGL securities to the value of 100% of the base annual director’s fee
• half of the above requirement should be accumulated within two years of the adoption of the policy (4 December 2015) or within two years of the date of appointment for new directors, and
• each newly appointed director is encouraged to acquire AGL securities equal to at least 10% of the base annual director’s fee by the financial year-end in which they are appointed.
• the MD/CEO should accumulate and thereafter maintain AGL securities equal to the value of 100% of FR
• the CFO should accumulate and thereafter maintain AGL securities equal to the value of 75% of FR
• remaining executives should accumulate and thereafter maintain in AGL securities equal to the value of 50% of FR, and
• the above requirement should be accumulated within five years of the end of FY16 or up to five years from the date of appointment for new executives.
Movement in AGL sharesThe movement during FY17 in the number of AGL shares, including Restricted Shares, held by each KMP, including their related parties, is shown in Table 6.5.1. Restricted Shares generally relate to the STI deferral, or for attraction/retention purposes in certain circumstances.
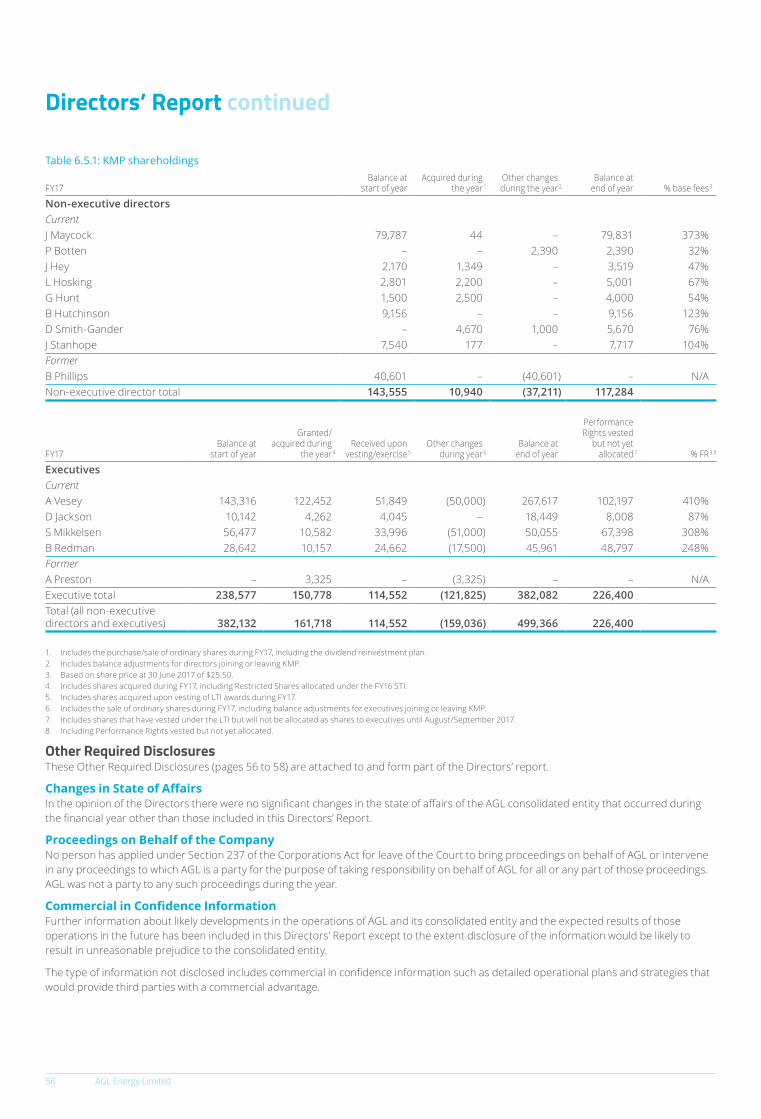
Directors’ Report continued
56 AGL Energy Limited
Table 6.5.1: KMP shareholdings
FY17Balance at
start of yearAcquired during
the year 1Other changes
during the year 2Balance at
end of year % base fees 3
Non-executive directorsCurrentJ Maycock 79,787 44 – 79,831 373%P Botten – – 2,390 2,390 32%J Hey 2,170 1,349 – 3,519 47%L Hosking 2,801 2,200 – 5,001 67%G Hunt 1,500 2,500 – 4,000 54%B Hutchinson 9,156 – – 9,156 123%D Smith-Gander – 4,670 1,000 5,670 76%J Stanhope 7,540 177 – 7,717 104%FormerB Phillips 40,601 – (40,601) – N/ANon-executive director total 143,555 10,940 (37,211) 117,284
FY17Balance at
start of year
Granted/acquired during
the year 4Received upon
vesting/exercise 5Other changes
during year 6Balance at
end of year
Performance Rights vested
but not yet allocated 7 % FR 3,8
ExecutivesCurrentA Vesey 143,316 122,452 51,849 (50,000) 267,617 102,197 410%D Jackson 10,142 4,262 4,045 – 18,449 8,008 87%S Mikkelsen 56,477 10,582 33,996 (51,000) 50,055 67,398 308%B Redman 28,642 10,157 24,662 (17,500) 45,961 48,797 248%FormerA Preston – 3,325 – (3,325) – – N/AExecutive total 238,577 150,778 114,552 (121,825) 382,082 226,400 Total (all non-executive directors and executives) 382,132 161,718 114,552 (159,036) 499,366 226,400
1. Includes the purchase/sale of ordinary shares during FY17, including the dividend reinvestment plan.2. Includes balance adjustments for directors joining or leaving KMP.3. Based on share price at 30 June 2017 of $25.50.4. Includes shares acquired during FY17, including Restricted Shares allocated under the FY16 STI.5. Includes shares acquired upon vesting of LTI awards during FY17.6. Includes the sale of ordinary shares during FY17, including balance adjustments for executives joining or leaving KMP.7. Includes shares that have vested under the LTI but will not be allocated as shares to executives until August/September 2017.8. Including Performance Rights vested but not yet allocated.
Other Required DisclosuresThese Other Required Disclosures (pages 56 to 58) are attached to and form part of the Directors’ report.
Changes in State of AffairsIn the opinion of the Directors there were no significant changes in the state of affairs of the AGL consolidated entity that occurred during the financial year other than those included in this Directors’ Report.
Proceedings on Behalf of the CompanyNo person has applied under Section 237 of the Corporations Act for leave of the Court to bring proceedings on behalf of AGL or intervene in any proceedings to which AGL is a party for the purpose of taking responsibility on behalf of AGL for all or any part of those proceedings. AGL was not a party to any such proceedings during the year.
Commercial in Confidence InformationFurther information about likely developments in the operations of AGL and its consolidated entity and the expected results of those operations in the future has been included in this Directors’ Report except to the extent disclosure of the information would be likely to result in unreasonable prejudice to the consolidated entity.
The type of information not disclosed includes commercial in confidence information such as detailed operational plans and strategies that would provide third parties with a commercial advantage.
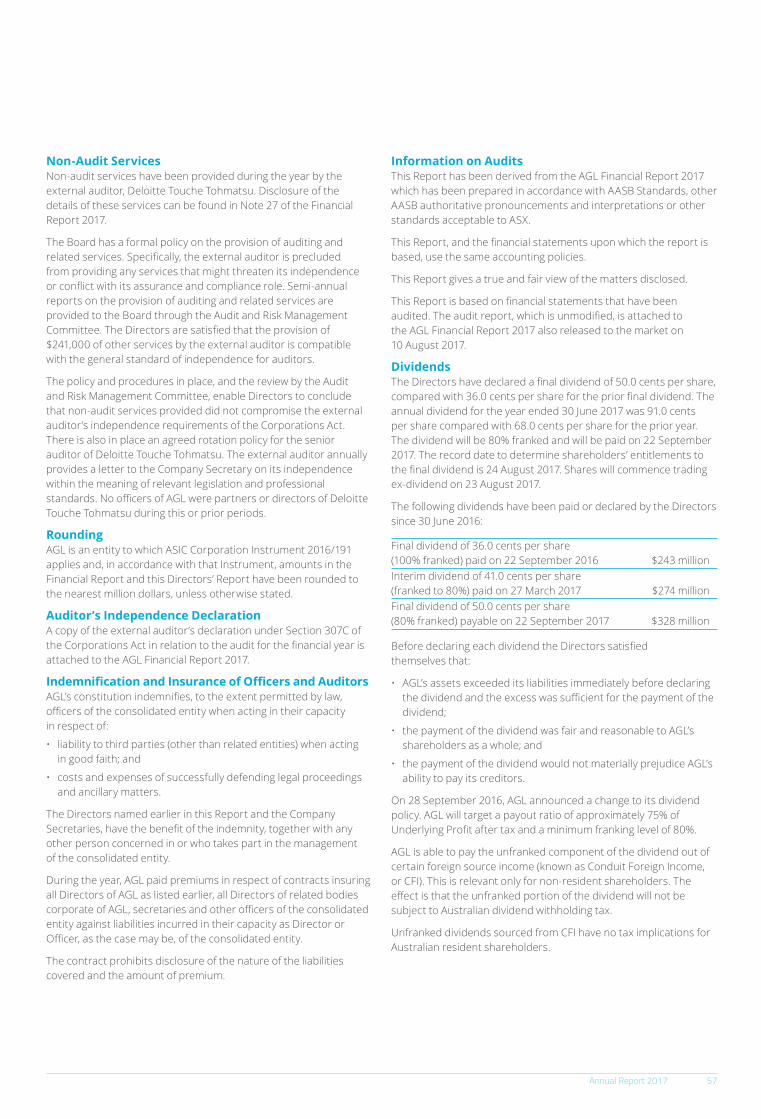
Annual Report 2017 57
Non-Audit ServicesNon-audit services have been provided during the year by the external auditor, Deloitte Touche Tohmatsu. Disclosure of the details of these services can be found in Note 27 of the Financial Report 2017.
The Board has a formal policy on the provision of auditing and related services. Specifically, the external auditor is precluded from providing any services that might threaten its independence or conflict with its assurance and compliance role. Semi-annual reports on the provision of auditing and related services are provided to the Board through the Audit and Risk Management Committee. The Directors are satisfied that the provision of $241,000 of other services by the external auditor is compatible with the general standard of independence for auditors.
The policy and procedures in place, and the review by the Audit and Risk Management Committee, enable Directors to conclude that non-audit services provided did not compromise the external auditor’s independence requirements of the Corporations Act. There is also in place an agreed rotation policy for the senior auditor of Deloitte Touche Tohmatsu. The external auditor annually provides a letter to the Company Secretary on its independence within the meaning of relevant legislation and professional standards. No officers of AGL were partners or directors of Deloitte Touche Tohmatsu during this or prior periods.
RoundingAGL is an entity to which ASIC Corporation Instrument 2016/191 applies and, in accordance with that Instrument, amounts in the Financial Report and this Directors’ Report have been rounded to the nearest million dollars, unless otherwise stated.
Auditor’s Independence DeclarationA copy of the external auditor’s declaration under Section 307C of the Corporations Act in relation to the audit for the financial year is attached to the AGL Financial Report 2017.
Indemnification and Insurance of Officers and AuditorsAGL’s constitution indemnifies, to the extent permitted by law, officers of the consolidated entity when acting in their capacity in respect of:
• liability to third parties (other than related entities) when acting in good faith; and
• costs and expenses of successfully defending legal proceedings and ancillary matters.
The Directors named earlier in this Report and the Company Secretaries, have the benefit of the indemnity, together with any other person concerned in or who takes part in the management of the consolidated entity.
During the year, AGL paid premiums in respect of contracts insuring all Directors of AGL as listed earlier, all Directors of related bodies corporate of AGL, secretaries and other officers of the consolidated entity against liabilities incurred in their capacity as Director or Officer, as the case may be, of the consolidated entity.
The contract prohibits disclosure of the nature of the liabilities covered and the amount of premium.
Information on AuditsThis Report has been derived from the AGL Financial Report 2017 which has been prepared in accordance with AASB Standards, other AASB authoritative pronouncements and interpretations or other standards acceptable to ASX.
This Report, and the financial statements upon which the report is based, use the same accounting policies.
This Report gives a true and fair view of the matters disclosed.
This Report is based on financial statements that have been audited. The audit report, which is unmodified, is attached to the AGL Financial Report 2017 also released to the market on 10 August 2017.
DividendsThe Directors have declared a final dividend of 50.0 cents per share, compared with 36.0 cents per share for the prior final dividend. The annual dividend for the year ended 30 June 2017 was 91.0 cents per share compared with 68.0 cents per share for the prior year. The dividend will be 80% franked and will be paid on 22 September 2017. The record date to determine shareholders’ entitlements to the final dividend is 24 August 2017. Shares will commence trading ex-dividend on 23 August 2017.
The following dividends have been paid or declared by the Directors since 30 June 2016:
Final dividend of 36.0 cents per share (100% franked) paid on 22 September 2016 $243 millionInterim dividend of 41.0 cents per share (franked to 80%) paid on 27 March 2017 $274 millionFinal dividend of 50.0 cents per share (80% franked) payable on 22 September 2017 $328 million
Before declaring each dividend the Directors satisfied themselves that:
• AGL’s assets exceeded its liabilities immediately before declaring the dividend and the excess was sufficient for the payment of the dividend;
• the payment of the dividend was fair and reasonable to AGL’s shareholders as a whole; and
• the payment of the dividend would not materially prejudice AGL’s ability to pay its creditors.
On 28 September 2016, AGL announced a change to its dividend policy. AGL will target a payout ratio of approximately 75% of Underlying Profit after tax and a minimum franking level of 80%.
AGL is able to pay the unfranked component of the dividend out of certain foreign source income (known as Conduit Foreign Income, or CFI). This is relevant only for non-resident shareholders. The effect is that the unfranked portion of the dividend will not be subject to Australian dividend withholding tax.
Unfranked dividends sourced from CFI have no tax implications for Australian resident shareholders.

Directors’ Report continued
58 AGL Energy Limited
The AGL Dividend Reinvestment Plan (DRP) will operate in respect of the 2017 final dividend. AGL will acquire shares on market and allot them to DRP participants at no discount to the simple average of the daily weighted average price at which AGL’s ordinary shares trade during each of the 10 trading days commencing 28 August 2017. The last date for shareholders to elect to participate in the DRP for the 2017 final dividend is 25 August 2017.
Subsequent EventsApart from the matters identified elsewhere in this Directors’ Report and the AGL Financial Report, the Directors are not aware of any other matter or circumstance that has arisen since 30 June 2017 that has significantly affected or may significantly affect the operations of AGL, the results of those operations, or the state of affairs of AGL in the future other than:
On 5 July 2017, AGL invested US$2.2 million in Advanced Microgrid Solutions which sells a distributed energy response management solution.
Non-IFRS Financial InformationThe Operating & Financial Review attached to and forming part of this Directors’ Report includes a number of non-International Financial Reporting Standards (IFRS) financial measures. AGL management uses these non-IFRS financial measures to assess the performance of the business and make decisions on the allocation of resources.
Principal among these non-IFRS financial measures is Underlying Profit. This measure is Statutory Profit/(Loss) adjusted for:
• significant items (which are material items of revenue or expense that are unrelated to the underlying performance of the business); and
• changes in the fair value of financial instruments recognised in the statement of profit or loss (to remove the volatility caused by mismatches in valuing financial instruments and the underlying asset differently).
AGL believes that Underlying Profit provides a better understanding of its financial performance than Statutory Profit/(Loss) and allows for a more relevant comparison of financial performance between financial periods.
Underlying Profit is presented with reference to the Australian Securities & Investment Commission (ASIC) Regulatory Guide 230 “Disclosing non-IFRS financial information”, issued in December 2011. AGL’s policy for reporting Underlying Profit is consistent with this guidance. The Directors have had the consistency of the application of the policy reviewed by the external auditor of AGL.
Corporate GovernanceA copy of AGL’s Corporate Governance Statement can be found on the AGL website at:
agl.com.au/CorporateGovernance
Environmental RegulationAGL’s businesses are subject to a range of environmental laws and regulations as well as project and site-specific environmental permits and approvals issued at both the Federal and State Government levels.
During the financial year ended 30 June 2017, there were no non-compliances that became the subject of environmental and planning regulation under relevant legislation (that is, there were no non-compliances that resulted in regulatory action such as a penalty infringement notice and/or official caution). Certain AGL businesses were subject to non-compliances which did not result in regulatory action. These were notified to the relevant regulator, and reported under the AGL site licence conditions, as required under relevant legislation.
Whilst there were no non-compliances of the nature referred to above during the financial year, in June 2017 the NSW Environment Protection Authority (EPA) commenced a prosecution against AGL, alleging that AGL had contravened a condition of its environment protection licence. The alleged offence relates to a flood event that occurred in early June 2016 and impacted the Camden Gas Project. As at the date of this Report there is no allegation in the proceedings that environmental harm occurred. Proceedings are in progress.
More information on the Group’s environmental performance is published in AGL’s Sustainability Performance Report 2017, available on the AGL website.
Approval of Directors’ ReportThis Directors’ Report is made in accordance with a resolution of the Board of Directors and is signed for and on behalf of the Board this 10th day of August 2017.
Jerry Maycock Chairman

Annual Report 2017 59
Contents PageConcise Financial StatementsConsolidated Statement of Profit or Loss 60Consolidated Statement of Comprehensive Income 61Consolidated Statement of Financial Position 62Consolidated Statement of Changes in Equity 63Consolidated Statement of Cash Flows 64Notes to the Concise Financial Statements 1 – Basis of preparation 65 2 – Adoption of new and revised accounting standards 65 3 – Segment information 65 4 – Revenue 68 5 – Dividends 68 6 – Subsequent events 68Directors’ Declaration 69Auditor’s Independence Declaration 70Independent Auditor’s Report 71
The concise financial statements are an extract from the full financial statements of AGL Energy Limited. The financial statements and specific disclosures included in the concise financial statements have been derived from the full financial statements of AGL Energy Limited, and cannot be expected to provide as full an understanding of the financial performance, financial position and financing and investing activities of the consolidated entity as the full financial statements.
Further financial information can be obtained from AGL Energy Limited’s full financial statements, AGL Financial Report 2017, a copy of which, together with a copy of the independent audit report, is available to all shareholders, and will be sent to shareholders without charge on request. Alternatively, you can access the AGL Financial Report 2017 via the internet by visiting www.agl.com.au and selecting ‘Reports and Presentations’ from the ‘Investor Centre’.
AGL Concise Financial Report 2017

60 AGL Energy Limited
Consolidated Statement of Profit or LossFor the year ended 30 June 2017
Note2017
$m2016
$m
Continuing operationsRevenue 4 12,584 11,150Other income – 25Expenses (11,131) (10,979)Share of profits of associates and joint ventures 19 26Profit before net financing costs, depreciation and amortisation 1,472 222Depreciation and amortisation (484) (478)Profit/(loss) before net financing costs 988 (256)Finance income 13 18Finance costs (237) (236)Net financing costs (224) (218)Profit/(loss) before tax 764 (474)Income tax (expense)/benefit (225) 67Profit/(loss) for the year 539 (407)
Profit/(loss) attributable to:Owners of AGL Energy Limited 539 (408)Non-controlling interests – 1
539 (407)
Earnings per share Basic earnings per share 80.5 cents (60.5 cents)Diluted earnings per share 80.4 cents (60.4 cents)
AGL Energy Limited and controlled entities

Annual Report 2017 61
2017$m
2016$m
Profit/(loss) for the year 539 (407)Other comprehensive incomeItems that will not be reclassified subsequently to profit or lossRemeasurement gain/(loss) on defined benefit plans 107 (111)Income tax relating to items that will not be reclassified subsequently (32) 33
75 (78)Items that may be reclassified subsequently to profit or lossCash flow hedges Gain in fair value of cash flow hedges 72 12 Reclassification adjustments transferred to profit or loss (15) 29Share of other comprehensive income of a joint venture – (1)Reclassification of joint venture losses transferred to profit or loss on disposal of investment – 15Income tax relating to items that may be reclassified subsequently (17) (12)
40 43Other comprehensive income for the year, net of income tax 115 (35)Total comprehensive income for the year 654 (442)
Total comprehensive income attributable to:Owners of AGL Energy Limited 654 (443)Non-controlling interests – 1
654 (442)
Consolidated Statement of Comprehensive IncomeFor the year ended 30 June 2017
AGL Energy Limited and controlled entities

62 AGL Energy Limited
2017$m
2016$m
Current assetsCash and cash equivalents 154 252Trade and other receivables 1,944 1,975Inventories 351 414Other financial assets 744 267Other assets 231 232
3,424 3,140Assets classified as held for sale 201 447Total current assets 3,625 3,587Non-current assetsTrade and other receivables – 44Inventories 20 30Other financial assets 142 147Investments in associates and joint ventures 80 70Property, plant and equipment 6,447 6,482Intangible assets 3,286 3,232Deferred tax assets 792 953Other assets 66 59Total non-current assets 10,833 11,017Total assets 14,458 14,604Current liabilitiesTrade and other payables 1,507 1,519Borrowings 173 22Provisions 201 226Current tax liabilities 13 102Other financial liabilities 827 460Other liabilities 10 –
2,731 2,329Liabilities directly associated with assets classified as held for sale – 224Total current liabilities 2,731 2,553Non-current liabilitiesBorrowings 3,173 3,086Provisions 520 487Other financial liabilities 293 301Other liabilities 167 251Total non-current liabilities 4,153 4,125Total liabilities 6,884 6,678Net assets 7,574 7,926
EquityIssued capital 6,223 6,696Reserves 16 (24)Retained earnings 1,335 1,243Total equity attributable to owners of AGL Energy Limited 7,574 7,915Non-controlling interests – 11Total equity 7,574 7,926
Consolidated Statement of Financial PositionAs at 30 June 2017
AGL Energy Limited and controlled entities
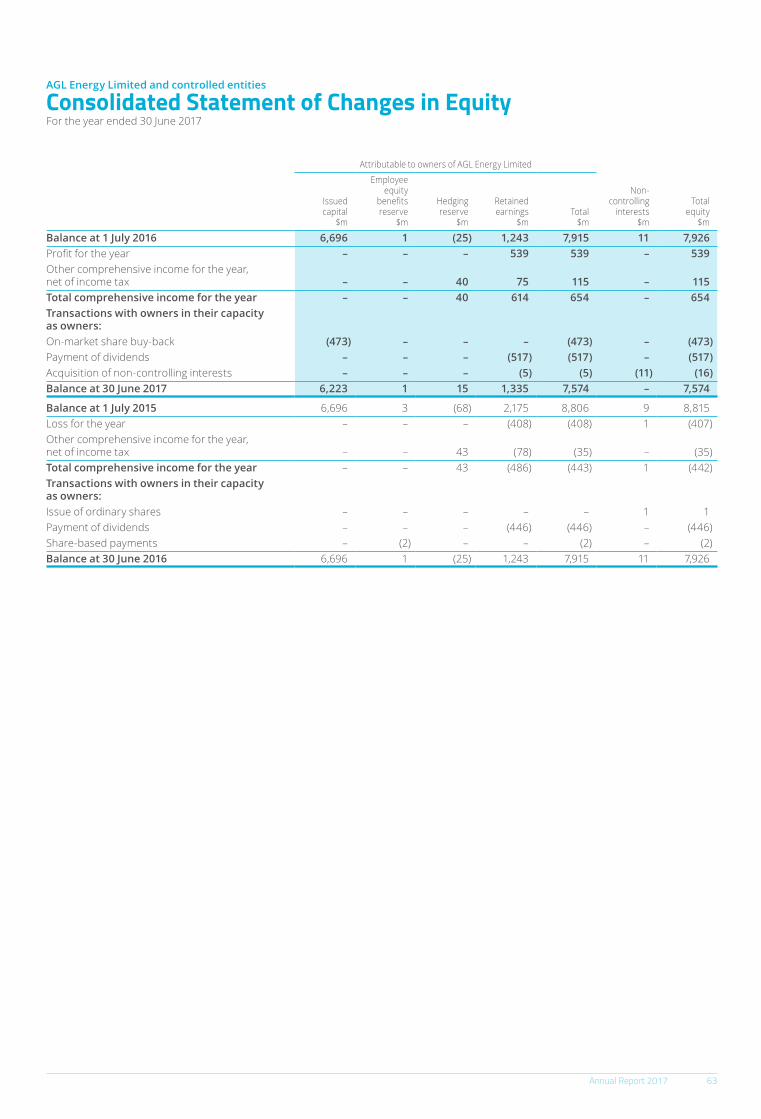
Annual Report 2017 63
Attributable to owners of AGL Energy Limited
Non-controlling
interests$m
Totalequity
$m
Issuedcapital
$m
Employeeequity
benefitsreserve
$m
Hedgingreserve
$m
Retainedearnings
$m Total
$m
Balance at 1 July 2016 6,696 1 (25) 1,243 7,915 11 7,926Profit for the year – – – 539 539 – 539Other comprehensive income for the year, net of income tax – – 40 75 115 – 115Total comprehensive income for the year – – 40 614 654 – 654Transactions with owners in their capacity as owners:On-market share buy-back (473) – – – (473) – (473)Payment of dividends – – – (517) (517) – (517)Acquisition of non-controlling interests – – – (5) (5) (11) (16)Balance at 30 June 2017 6,223 1 15 1,335 7,574 – 7,574
Balance at 1 July 2015 6,696 3 (68) 2,175 8,806 9 8,815Loss for the year – – – (408) (408) 1 (407)Other comprehensive income for the year, net of income tax – – 43 (78) (35) – (35)Total comprehensive income for the year – – 43 (486) (443) 1 (442)Transactions with owners in their capacity as owners:Issue of ordinary shares – – – – – 1 1Payment of dividends – – – (446) (446) – (446)Share-based payments – (2) – – (2) – (2)Balance at 30 June 2016 6,696 1 (25) 1,243 7,915 11 7,926
Consolidated Statement of Changes in EquityFor the year ended 30 June 2017
AGL Energy Limited and controlled entities

64 AGL Energy Limited
Consolidated Statement of Cash FlowsFor the year ended 30 June 2017
2017$m
2016$m
Cash flows from operating activitiesReceipts from customers 13,552 11,903Payments to suppliers and employees (12,216) (10,397)Dividends received 22 19Finance income received 13 13Finance costs paid (188) (186)Income taxes paid (292) (166)Net cash provided by operating activities 891 1,186Cash flows from investing activitiesPayments for property, plant and equipment (498) (533)Payments for other assets (6) (13)Payments for investments in associates and joint ventures (13) (30)Payments for available-for-sale financial assets (31) –Payments for deferred consideration for prior period acquisitions (33) (33)Government grants received 1 8Proceeds from sale of property, plant and equipment 278 8Proceeds from sale of other assets – 1Proceeds from sale of subsidiaries and businesses, net of cash disposed – 673Net cash (used in)/provided by investing activities (302) 81Cash flows from financing activitiesPayments for buy-back of shares (473) –Proceeds from issue of shares to non-controlling interests – 1Purchase of shares on-market for equity based remuneration (7) (8)Proceeds from borrowings 1,472 550Repayment of borrowings (1,146) (1,371)Payments to acquire non-controlling interests (16) –Dividends paid (517) (446)Net cash used in financing activities (687) (1,274)Net decrease in cash and cash equivalents (98) (7)Cash and cash equivalents at the beginning of the financial year 252 259Cash and cash equivalents at the end of the financial year 154 252
AGL Energy Limited and controlled entities

Annual Report 2017 65
Note 1 – Basis of preparation The concise financial statements have been prepared in accordance with the Corporations Act 2001 and Accounting Standard AASB 1039 Concise Financial Reports. The concise financial statements are an extract from the full financial statements. The concise financial statements and specific disclosures included in the concise financial statements have been derived from AGL Energy Limited’s full financial statements, AGL Financial Report 2017. All amounts are presented in Australian dollars.
Note 2 – Adoption of new and revised accounting standardsAGL has applied the required amendments to Standards and Interpretations that are relevant to its operations and effective for the current reporting period.
The application of the amendments to Standards and Interpretations do not have any material impact on the disclosures or on the amounts recognised in AGL’s consolidated financial statements.
Note 3 – Segment informationOperating segmentsAGL reports segment information on the same basis as the internal management reporting structure. The operating segments reflect the manner in which products are sold, whether retail or wholesale, and the nature of the services provided.
On 21 December 2016, AGL announced changes to its segment reporting. The previous New Energy business was separated and allocated into other AGL business units. New Energy Services was reallocated to Energy Markets and Distributed Energy Services was allocated to Group Operations. The remainder of the New Energy business will become an “innovation accelerator” reported under Other.
The previous operating segments were: Energy Markets, Group Operations, New Energy and Investments.
AGL views the business as three interrelated segments collectively servicing our customer’s needs. AGL’s segments are:
• Energy Markets sells electricity, gas, and energy-related products and services to consumer, business and wholesale customers, and is responsible for managing the wholesale risks associated with servicing those customers.
• Group Operations comprises AGL’s power generation portfolio and other key sites and operating facilities including the Newcastle Gas Storage Facility.
• Investments includes AGL’s interests in the ActewAGL Retail Partnership, Powering Australian Renewables Fund, Energy Impact Partners’ Fund and Sunverge Energy.
In the segment financial results, the ‘Other’ category consists of the various Corporate activities which includes the head office and central support functions and the innovation accelerator portion of the previous New Energy segment. These are not considered to be reportable segments.
Segment comparative information has been restated to reflect the changes described above.
Segment financial resultsThe measurement of segment results is in line with the basis of information presented to the Board of Directors for internal management reporting purposes. The performance of each segment is measured based on their ‘Underlying EBIT contribution’ to AGL. Certain items of income and expense are excluded from the segment results to show a measure of underlying performance. These items include changes in fair value of financial instruments and significant items.
AGL operates as an integrated business and uses a portfolio approach to manage the operations and assets to drive value and efficiency. AASB 8 Operating Segments requires AGL to report segment information on the same basis as the internal management structure. As a result, the Energy Markets segment reports the revenue and margin associated with satisfying the gas and electricity requirements of AGL’s wholesale, consumer and business customer portfolio. In contrast, the Group Operations segment reports the majority of expenses associated with these operations and is therefore a cost centre.
For the purposes of reviewing the carrying values of AGL assets via impairment testing, the segments impute a revenue transfer between Energy Markets and Group Operations. Revenues are derived to approximate prices similar to transactions with third parties.
Notes to the Concise Financial StatementsFor the year ended 30 June 2017
AGL Energy Limited and controlled entities

Notes to the Concise Financial Statements continued
66 AGL Energy Limited
Note 3 – Segment information continuedEnergy
Markets$m
Group Operations
$m Investments
$mOther
$m Total
$m
2017RevenueTotal segment revenue 12,210 455 – 1 12,666Inter-segment revenue (16) (66) – – (82)External revenue 12,194 389 – 1 12,584
Underlying earnings before interest, tax, depreciation and amortisation (Underlying EBITDA) 2,508 (462) 17 (211) 1,852Depreciation and amortisation (95) (363) – (26) (484)Underlying EBIT 2,413 (825) 17 (237) 1,368Net financing costs (228)Underlying profit before tax 1,140Income tax expense (338)Underlying profit after tax 802
Segment assets 5,530 7,403 109 121 13,163Segment liabilities 1,472 771 1 161 2,405
Other segment informationShare of profits of associates and joint ventures – 1 18 – 19Investments in associates and joint ventures – 2 78 – 80Additions to non-current assets 115 531 43 46 735Other non-cash expenses (76) – – (7) (83)
2016RevenueTotal segment revenue 10,969 238 – 1 11,208Inter-segment revenue (13) (45) – – (58)External revenue 10,956 193 – 1 11,150
Underlying earnings before interest, tax, depreciation and amortisation (Underlying EBITDA) 2,374 (494) 25 (216) 1,689Depreciation and amortisation (100) (348) – (30) (478)Underlying EBIT 2,274 (842) 25 (246) 1,211Net financing costs (222)Underlying profit before tax 989Income tax expense (287)Non-controlling interests (1)Underlying profit after tax 701
Segment assets 5,196 7,695 68 101 13,060Segment liabilities 1,555 984 – 168 2,707
Other segment informationShare of profits of associates and joint ventures – 1 25 – 26Investments in associates and joint ventures – 2 68 – 70Additions to non-current assets 62 504 30 22 618Other non-cash expenses (73) – – (6) (79)
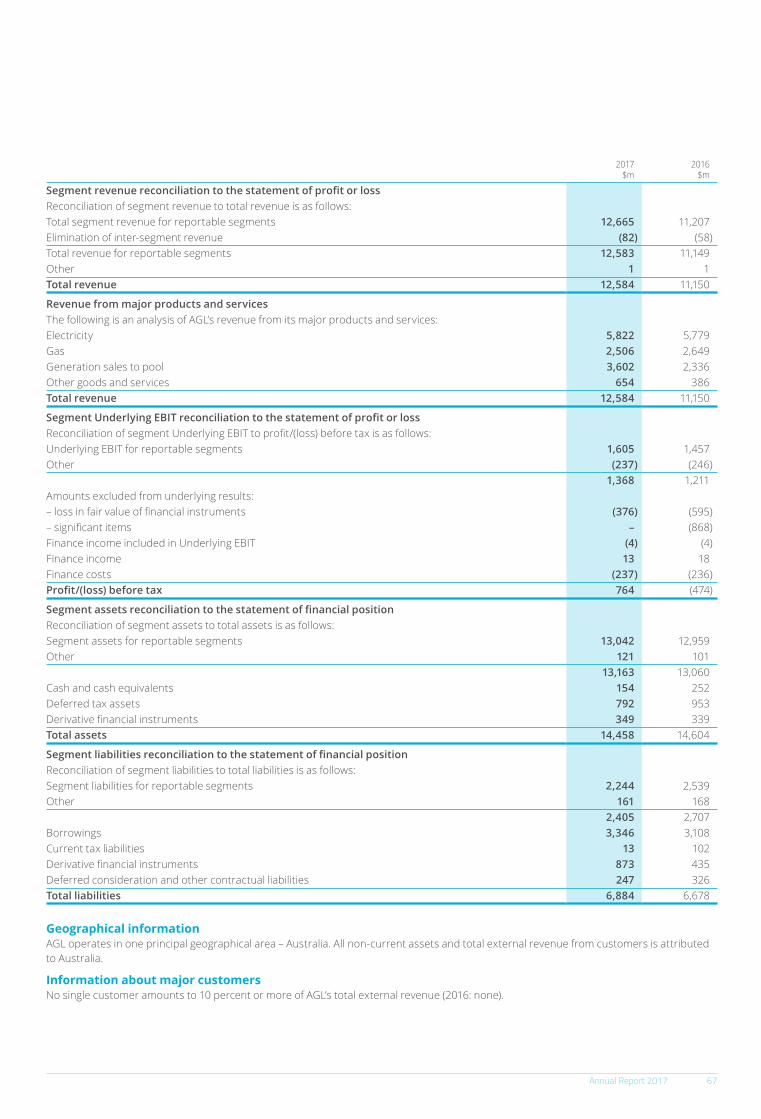
Annual Report 2017 67
2017$m
2016$m
Segment revenue reconciliation to the statement of profit or loss Reconciliation of segment revenue to total revenue is as follows:Total segment revenue for reportable segments 12,665 11,207Elimination of inter-segment revenue (82) (58)Total revenue for reportable segments 12,583 11,149Other 1 1Total revenue 12,584 11,150
Revenue from major products and services The following is an analysis of AGL’s revenue from its major products and services: Electricity 5,822 5,779Gas 2,506 2,649Generation sales to pool 3,602 2,336Other goods and services 654 386Total revenue 12,584 11,150
Segment Underlying EBIT reconciliation to the statement of profit or lossReconciliation of segment Underlying EBIT to profit/(loss) before tax is as follows:Underlying EBIT for reportable segments 1,605 1,457Other (237) (246)
1,368 1,211Amounts excluded from underlying results:– loss in fair value of financial instruments (376) (595)– significant items – (868)Finance income included in Underlying EBIT (4) (4)Finance income 13 18Finance costs (237) (236)Profit/(loss) before tax 764 (474)
Segment assets reconciliation to the statement of financial positionReconciliation of segment assets to total assets is as follows: Segment assets for reportable segments 13,042 12,959Other 121 101
13,163 13,060Cash and cash equivalents 154 252Deferred tax assets 792 953Derivative financial instruments 349 339Total assets 14,458 14,604
Segment liabilities reconciliation to the statement of financial positionReconciliation of segment liabilities to total liabilities is as follows: Segment liabilities for reportable segments 2,244 2,539Other 161 168
2,405 2,707Borrowings 3,346 3,108Current tax liabilities 13 102Derivative financial instruments 873 435Deferred consideration and other contractual liabilities 247 326Total liabilities 6,884 6,678
Geographical informationAGL operates in one principal geographical area – Australia. All non-current assets and total external revenue from customers is attributed to Australia.
Information about major customersNo single customer amounts to 10 percent or more of AGL’s total external revenue (2016: none).

Notes to the Concise Financial Statements continued
68 AGL Energy Limited
2017$m
2016$m
Note 4 – RevenueRevenue from sale of goods 12,207 10,971Revenue from rendering of services 152 174Other revenue – government grants 225 5
12,584 11,150
Note 5 – DividendsRecognised amountsFinal dividendFinal dividend for 2016 of 36.0 cents per share, fully franked, paid 22 September 2016 (2016: Final dividend for 2015 of 34.0 cents per share, fully franked, paid 24 September 2015) 243 230Interim dividendInterim dividend for 2017 of 41.0 cents per share, franked to 80%, paid 27 March 2017 (2016: Interim dividend for 2016 of 32.0 cents per share, fully franked, paid 16 March 2016) 274 216Dividends paid as per the statement of cash flows 517 446
Unrecognised amountsSince the end of the financial year, the Directors have declared a final dividend for 2017 of 50.0 cents per share, franked to 80%, (2016: 36.0 cents per share, fully franked), payable 22 September 2017. 328 243
The financial effect of this dividend has not been recognised as a liability in these financial statements but will be brought to account in the 2018 financial year.Dividend reinvestment planThe AGL Dividend Reinvestment Plan (DRP) will operate in respect of the 2017 final dividend. AGL will acquire shares on market and allot them to DRP participants at no discount to the simple average of the daily weighted average price at which AGL’s ordinary shares trade during each of the 10 trading days commencing 28 August 2017. The last date for shareholders to elect to participate in the DRP for the 2017 final dividend is 25 August 2017.Dividend franking accountAdjusted franking account balance 63 52Impact on franking account balance of dividends proposed after the reporting date but not recognised as a liability (112) (104)
Note 6 – Subsequent eventsThere has not been any other matter or circumstance, other than that referred to in the financial statements or notes thereto, that has arisen since the end of the financial year, that has significantly affected, or may significantly affect, the operations of AGL, the results of those operations, or the state of affairs of AGL in future financial years other than:
Advanced Microgrid SolutionsOn 5 July 2017, AGL invested US$2.2 million in Advanced Microgrid Solutions which sells a distributed energy response management solution.
Final dividend On 10 August 2017, the Directors of AGL resolved to pay a final dividend of 50.0 cents per share, franked to 80% (the unfranked portion will be paid from conduit foreign income). The record date for the final dividend is 24 August 2017 with payment to be made on 22 September 2017. Shares will commence trading ex-dividend on 23 August 2017.
The AGL Dividend Reinvestment Plan (DRP) will operate in respect of the 2017 final dividend. AGL will acquire shares on market and allot them to DRP participants at no discount to the simple average of the daily weighted average price at which AGL’s ordinary shares trade during each of the 10 trading days commencing 28 August 2017. The last date for shareholders to elect to participate in the DRP for the 2017 final dividend is 25 August 2017.
Annual Report 2017 69
The Directors of AGL Energy Limited declare that:
(a) in their opinion, the attached financial statements and notes thereto comply with Accounting Standard AASB 1039 Concise Financial Reports; and
(b) the attached financial statements and notes thereto have been derived from the full financial report of the Company.
Signed in accordance with a resolution of the Directors
Jeremy Maycock Chairman
Sydney, 10 August 2017
Directors’ Declaration For the year ended 30 June 2017
AGL Energy Limited and controlled entities
70 AGL Energy Limited
Auditor’s Independence DeclarationTo the Directors of AGL Energy Limited
The Board of Directors AGL Energy Limited Level 24, 200 George St Sydney NSW 2000
10 August 2017
Dear Board Members
AGL Energy Limited
In accordance with section 307C of the Corporations Act 2001, I am pleased to provide the following declaration of independence to the directors of AGL Energy Limited.
As lead audit partner for the audit of the financial statements of AGL Energy Limited for the financial year ended 30 June 2017, I declare that to the best of my knowledge and belief, there have been no contraventions of:
(i) the auditor independence requirements of the Corporations Act 2001 in relation to the audit; and
(ii) any applicable code of professional conduct in relation to the audit.
Yours sincerely
DELOITTE TOUCHE TOHMATSU
Jason Thorne Partner Chartered Accountants
Deloitte Touche Tohmatsu A.B.N. 74 490 121 060 Grosvenor Place 225 George Street Sydney NSW 2000 PO Box N250 Grosvenor Place Sydney NSW 1220 Australia DX 10307SSE Tel: +61 (0) 2 9322 7000 Fax: +61 (0) 2 9322 7001 www.deloitte.com.au
Liability limited by a scheme approved under Professional Standards Legislation.Member of Deloitte Touche Tohmatsu Limited

Annual Report 2017 71
Independent Auditor’s Report
Report of the Independent Auditor on the Concise Financial Report to the Members of AGL Energy LimitedOpinionWe have audited the concise financial report, of AGL Energy Limited (“AGL” or the “Company”) and its subsidiaries (the “Group”) which comprises the Consolidated Statement of Financial Position as at 30 June 2017, the Consolidated Statement of Profit or Loss, Consolidated Statement of Comprehensive Income, Consolidated Statement of Changes in Equity, Consolidated Statement of Cash Flows for the year then ended, and related notes, derived from the financial report of AGL Energy Limited for the year ended 30 June 2017.
In our opinion, the accompanying concise financial report complies with Accounting Standard AASB 1039 Concise Financial Reports.
Basis for Opinion We conducted our audit in accordance with Australian Auditing Standards. Our responsibilities under those standards are further described in the Auditor’s Responsibilities section of our report. We are independent of the Company in accordance with the auditor independence requirements of the Corporations Act 2001 and the ethical requirements of the Accounting Professional and Ethical Standards Board’s APES 110 Code of Ethics for Professional Accountants (the “Code”) that are relevant to our audit of the concise financial report in Australia. We have also fulfilled our other ethical responsibilities in accordance with the Code.
We believe that the audit evidence we have obtained is sufficient and appropriate to provide a basis for our opinion.
Concise Financial ReportThe concise financial report does not contain all the disclosures required by the Australian Accounting Standards. Reading the concise financial report and the auditor’s report thereon, therefore, is not a substitute for reading the financial report and the auditor’s report thereon.
The Financial Report and Our Report ThereonWe expressed an unmodified audit opinion on the financial report in our report dated 10 August 2017. That report also includes the communication of key audit matters. Key audit matters are those matters that, in our professional judgement, were of most significance in our audit of the financial report for the year ended 30 June 2017. We set out below the matters that were key audit matters. All note references below are to the notes in the audited financial report.
Key Audit Matter How the scope of our audit responded to the Key Audit Matter
Unbilled revenueUnbilled revenue of $889 million disclosed in Note 10 represents the value of electricity and gas supplied to customers between the date of the last meter reading and the reporting date where no bill has been issued by AGL to the customer at the end of the reporting period. Detailed financial models utilising estimates of the electricity and gas consumption of AGL’s customers and applicable pricing are used to determine the estimate of unbilled revenue. We focused on this area as it involves significant management judgment to estimate customer consumption between the last invoice date and the end of the reporting period to determine the gas and electricity unbilled revenue at the reporting date.
Our procedures included but were not limited to:• obtaining an understanding of the key controls management has
in place to determine the estimate of unbilled revenue; • understanding and challenging management’s assumptions
relating to volume and pricing used in determining the level of estimated revenue by:
− on a sample basis agreeing volume data underlying the calculation of the estimated volumes into purchases, sales and other systems having performed sample testing of the key controls in those systems; and
− comparing the prices applied with historical and current data; and
• in conjunction with our data analytics experts we calculated an independent estimate of the expected unbilled revenue on an individual meter basis using AGL’s purchase volumes and pricing data and compared our independent estimate to AGL’s reported unbilled revenue.
We also assessed the adequacy of the Group’s disclosures in respect of unbilled revenue.
Deloitte Touche Tohmatsu A.B.N. 74 490 121 060 Grosvenor Place 225 George Street Sydney NSW 2000 PO Box N250 Grosvenor Place Sydney NSW 1220 Australia DX 10307SSE Tel: +61 (0) 2 9322 7000 Fax: +61 (0) 2 9322 7001 www.deloitte.com.au
Liability limited by a scheme approved under Professional Standards Legislation.Member of Deloitte Touche Tohmatsu Limited

72 AGL Energy Limited
Independent Auditor’s Report continued
Key Audit Matter How the scope of our audit responded to the Key Audit Matter
Unbilled distribution costsAGL recognises distribution costs as gas and electricity is delivered to the customer. Management estimates energy consumption between the date of the last invoice from the distributor to AGL and the end of the reporting period when determining distribution costs for the financial year. Detailed financial models utilising estimates of the electricity and gas consumption of AGL’s customers and applicable distribution tariff rates are used to determine the estimated unbilled distribution costs accrual of $368 million as disclosed in Note 18.We focused on this area as it involves significant management judgement to estimate consumption between the last invoice date from the individual distributors and the end of the reporting period to determine distribution costs payable at the reporting date.
Our procedures included but were not limited to:• obtaining an understanding of the key controls management has
in place to determine the estimate of the unbilled distribution costs accrual;
• understanding and challenging management’s assumptions relating to volume and tariffs used in determining the distribution costs accrual by:
− on a sample basis agreeing volume data underlying the calculation of the estimated volumes into purchases, sales and other systems having performed sample testing of the key controls in those systems; and
− comparing the prices applied by individual distributors with current tariff tables; and
• in conjunction with our data analytics experts we assessed the appropriateness of AGL’s unbilled distribution costs accrual at 30 June 2017 by calculating an independent expectation of the accrual on an individual meter basis utilising information supplied to AGL by individual distributors and compared our independent estimate to AGL’s reported distribution costs payable.
We also assessed the adequacy of the Group’s disclosures in respect of unbilled distribution costs.
Carrying value of property, plant and equipment and intangible assets, including goodwillProperty, plant and equipment totaling $6,447 million as disclosed in Note 15 and intangible assets totaling $3,286 million which includes goodwill of $2,881 million as disclosed in Note 16 represent significant balances recorded in the consolidated statement of financial position.The evaluation of the recoverable amount of these assets requires significant judgement in determining the key assumptions supporting the expected future cash flows of the business and the utilisation of the relevant assets.
Our procedures included but were not limited to:• obtaining an understanding of the key controls associated with the
preparation of the valuation models used to assess the recoverable amount of AGL’s cash generating units;
• critically evaluating management’s methodologies and their documented basis for key assumptions utilised in the valuation models which are described in Note 16;
• in conjunction with our valuation experts we assessed and challenged:
− the identification of cash generating units, including the allocation of goodwill and property, plant and equipment and the associated identification and allocation of cash flows for the purposes of assessing the recoverable amount of the cash generating units;
− the key assumptions for long-term growth rates in the forecast cash flows by comparing them to historical results, economic and industry forecasts; and
− the discount rate applied;• we checked on a sample basis the mathematical accuracy of the
cash flow models, • we agreed forecast cash flows to the latest Board approved
forecasts and • we assessed the historical accuracy of forecasting by AGL;• we performed sensitivity analyses around the key drivers of growth
rates used in the cash flow forecasts and the discount rate used; and
• we assessed management’s consideration of the sensitivity to a change in key assumptions that either individually or collectively would be required for assets to be impaired and considered the likelihood of such a movement in those key assumptions arising.
We have also assessed the appropriateness of the disclosures included in Notes 1, 15 and 16 to the financial report.

Annual Report 2017 73
Key Audit Matter How the scope of our audit responded to the Key Audit Matter
Financial instrumentsAGL enters into various financial instruments including derivative financial instruments to hedge the company’s exposure to variability in interest rates, foreign exchange movements and energy prices. As at 30 June 2017, derivative financial assets totaled $349 million (current assets of $238 million and non-current assets of $111 million as disclosed in Note 12) and derivative financial liabilities totaled $873 million (current liabilities of $767 million and non-current liabilities of $106 million as disclosed in Note 21). These financial instruments are recorded at fair value as required by the relevant accounting standard.We have focused on this area due to the complexities associated with the valuation and accounting for these financial instruments.
Our procedures included but were not limited to:• obtaining an understanding of the internal risk management
procedures and the systems and controls associated with the origination and maintenance of complete and accurate information relating to derivative contracts;
• utilising our treasury experts we also tested on a sample basis the existence and valuation of derivative contracts as at 30 June 2017. Our audit procedures focused on the integrity of the derivative valuation models and the incorporation of the contract terms and the key assumptions, including future price assumptions and discount rates; and
• obtaining an understanding of key financial instrument contract terms to assess the appropriateness of the accounting reflected in the financial report.
We have also assessed the adequacy of the disclosures included in Note 37 to the financial report.
Deferred tax asset relating to tax lossesAs disclosed in Note 8, at 30 June 2017 the Group has recorded a deferred tax asset of $778 million relating to tax losses incurred by the subsidiary AGL Loy Yang. The recoverability of this deferred tax asset is dependent on the generation of sufficient future taxable profit to utilise these tax losses. Significant judgement is required in forecasting future taxable profit.
We have assessed and challenged management’s judgements relating to the forecasts of future taxable profit and evaluated the reasonableness of the assumptions underlying the preparation of these forecasts including the consistency of the assumptions used with those used to evaluate the recoverable amount of AGL’s cash generating units where relevant.We have also assessed the appropriateness of the disclosures included in Note 8 in respect of current and deferred tax balances.
Responsibilities of the directors for the Concise Financial ReportThe directors are responsible for the preparation of the concise financial report in accordance with Accounting Standard AASB 1039 Concise Financial Reports, and the Corporations Act 2001, and for such internal control as the directors determine is necessary to enable the preparation of the concise financial report.
Auditor’s Responsibilities for the Audit of the Concise Financial Report Our responsibility is to express an opinion on whether the concise financial report, complies in all material respects, with AASB 1039 Concise Financial Reports based on our procedures, which were conducted in accordance with Auditing Standard ASA 810 Engagements to Report on Summary Financial Statements.
Report on the Remuneration ReportThe following paragraphs are copies from our Report on the Remuneration Report of AGL Energy Limited for the year ended 30 June 2017.
Opinion on the Remuneration Report We have audited the Remuneration Report included in pages 34 to 56 of the directors’ report for the year ended 30 June 2017.
In our opinion, the Remuneration Report of AGL Energy Limited, for the year ended 30 June 2017, complies with section 300A of the Corporations Act 2001.
ResponsibilitiesThe directors of the Company are responsible for the preparation and presentation of the Remuneration Report in accordance with section 300A of the Corporations Act 2001. Our responsibility is to express an opinion on the Remuneration Report, based on our audit conducted in accordance with Australian Auditing Standards.
DELOITTE TOUCHE TOHMATSU
Jason Thorne Partner Chartered Accountants
Sydney, 10 August 2017

74 AGL Energy Limited
The following information is provided regarding the Issued Capital of AGL as at 31 July 2017:
1. The Issued Capital consisted of 655,825,043 fully-paid ordinary shares. Holders of AGL’s fully paid ordinary shares have, at general meetings, one vote on a show of hands and, upon a poll, one vote for each fully paid ordinary share held by them.
2. There were 103,810 holders of ordinary shares.
3. There were 2,137 holders of less than a marketable parcel of 20 shares.
Distribution Schedule of Ordinary SharesNo. of
holders% of
Ordinary Shares
1 to 1,000 52,298 50.381,001 to 5,000 42,259 40.715,001 to 10,000 6,118 5.8910,001 to 100,000 3,040 2.93100,001 and Over 95 0.09Total 103,810 100.00
Substantial Shareholders of AGLIn a substantial holding notice dated 15 March 2017, BlackRock Inc. and its subsidiaries advised that as of 27 February 2017 they had an interest in 40,935,468 ordinary shares, which represented 6.09% of AGL’s ordinary shares at this time.
Shareholdings by Geographic RegionNo. of holders % No. of shares %
Australia 100,701 97.01 646,070,586 98.51Hong Kong 46 0.04 101,633 0.02New Zealand 2,157 2.08 8,620,855 1.31United Kingdom 300 0.29 403,485 0.06USA And Canada 448 0.43 403,550 0.06Others 158 0.15 224,934 0.03Total 103,810 100.00 655,825,043 100.00
20 Largest Holders of Ordinary Shares
Twenty Largest Holders as at 31 July 2017Fully-Paid
Ordinary Shares% of Total
Issued Shares
HSBC Custody Nominees (Australia) Limited 192,972,987 29.42J P Morgan Nominees Australia Limited 86,052,866 13.12Citicorp Nominees Pty Limited 48,758,255 7.43National Nominees Limited 25,811,209 3.94BNP Paribas Nominees Pty Ltd 12,700,629 1.94BNP Paribas Noms Pty Ltd 9,995,048 1.52Citicorp Nominees Pty Limited 7,471,509 1.14Australian Foundation Investment Company Limited 4,305,000 0.66Custodial Services Limited 3,716,076 0.57Argo Investments Limited 3,642,000 0.56Milton Corporation Limited 2,697,869 0.41HSBC Custody Nominees (Australia) Limited 2,688,258 0.41AMP Life Limited 2,120,884 0.32Pacific Custodians Pty Limited 1,498,914 0.23Carlton Hotel Limited 1,355,356 0.21SBN Nominees Pty Limited 1,316,400 0.20National Nominees Limited 1,283,754 0.20Bond Street Custodians Limited (MACQ HIGH CONV FUND) & Bond Street Custodians Limited 1,269,056 0.19Gwynvill Investments Pty Limited 1,263,150 0.19BKI Investment Company Limited 1,250,708 0.19Total 412,169,928 62.85
Shareholding Information

Annual Report 2017 75
Subordinated Note Holding Information:The following information is provided regarding the Subordinated Notes of AGL as at 31 July 2017:
1. There were 6,500,000 Subordinated Notes. Holders of Subordinated Notes do not have any rights to vote at general meetings of AGL.
2. There were 10,125 holders of Subordinated Notes.
3. There were nine holders of less than a marketable parcel of five Subordinated Notes.
Distribution Schedule of Subordinated Notes
No. of holders% of
Total Notes
1 to 1,000 9,490 93.731,001 to 5,000 581 5.745,001 to 10,000 29 0.2910,001 to 100,000 17 0.17100,001 and Over 8 0.08Total 10,125 100.00
Holdings by Geographic RegionNo. of holders % No. of notes %
Australia 10,051 99.27 6,441,862 99.11Hong Kong 6 0.06 9,798 0.15New Zealand 32 0.32 28,921 0.44United Kingdom 7 0.07 4,104 0.06USA And Canada 12 0.12 4,107 0.06Others 17 0.17 11,208 0.17Total 10,125 100.00 6,500,000 100.00
20 Largest Holders of Subordinated Notes
Twenty Largest Holders as at 31 July 2017Subordinated
Notes% of
Total Notes
HSBC Custody Nominees (Australia) Limited 352,055 5.42Citicorp Nominees Pty Limited 295,182 4.54IOOF Investment Management Limited 235,844 3.63National Nominees Limited 223,591 3.44National Nominees Limited 217,296 3.34Australian Executor Trustees Limited 134,592 2.07BNP Paribas Nominees Pty Ltd HUB24 CUSTODIAL SERV LTD DRP 120,791 1.86BNP Paribas Noms Pty Ltd 113,961 1.75J P Morgan Nominees Australia Limited 80,783 1.24Navigator Australia Ltd 71,825 1.10NULIS Nominees (Australia) Limited 59,728 0.92HSBC Custody Nominees (Australia) Limited – A/C 2 51,979 0.80IOOF Investment Management Limited 47,891 0.74Longhurst Management Services Pty Ltd 36,000 0.55Netwealth Investments Limited 29,641 0.46Sellers Holdings Pty Limited 17,290 0.27Fibora Pty Ltd 14,393 0.22Waterloo Medical Centre Superannuation Fund 13,000 0.20Kittelty Group Pty Ltd 12,920 0.20Trustees of Church Property for the Diocese of Newcastle 12,876 0.20Total 2,141,638 32.95

76 AGL Energy Limited
Investor Information
Website accessBy visiting agl.com.au and selecting ‘Investor Centre’ from the ‘About AGL’ menu you can access AGL’s online Investor Centre.
The Investor Centre provides you with easy access to important information about AGL’s performance, including Annual Reports, investor presentations, share price graphs and general security holder information.
The Shareholder Services section in our Investor Centre also enables you to access and update your share and note holding information online including:
• Checking your holding balance;
• Viewing, saving or printing interest payment summaries, transaction summaries and dividend statements for Shareholders;
• Updating or amending your bank account or DRP Instructions for Shareholders;
• Electing to receive communications electronically; and
• Downloading a variety of forms
Our Share Registry, Link Market Services, also offers Share and Note holders the ability to register and create a portfolio view of their holdings. Registration is free and enables Share and Note holders to view and update multiple holdings in AGL (or other clients Link act as registry for) using a single login. To create a portfolio, please go to linkmarketservices.com.au
Share RegistryShare and Note holders with enquiries about their share and note holdings can also contact AGL’s Share Registry as follows:
AGL Share Registry Link Market Services Limited 1A Homebush Drive Rhodes NSW 2138
(Postal Address: Locked Bag A14, Sydney South NSW 1235)
Telephone: +61 1800 824 513 (free call within Australia) Facsimile: +61 2 9287 0309 Email: [email protected] Website: linkmarketservices.com.au
When communicating with the Share Registry, it will assist if you can quote your current address together with your Security Reference Number (SRN) or Holder Identification Number (HIN) as shown on your Issuer Sponsored/CHESS statements.
Final Share DividendThe final dividend of 50.0 cents per share, 80% franked, will be paid on 22 September 2017. As the final dividend will only be paid via direct credit, Australian and New Zealand Shareholders need to nominate a bank, building society or credit union account within these jurisdictions. Payments are electronically credited on the dividend payment date and confirmed by a mailed or electronic payment advice. Payment instructions can either be lodged online or an appropriate form can be downloaded from the Share Registry’s website.
Dividend Reinvestment PlanAGL offers Shareholders the opportunity to participate in the Dividend Reinvestment Plan. Shares are allocated under the Plan, free of transaction costs. The rate of discount, if any, applied to shares allocated under the Plan will be determined by the Directors at the time each dividend is declared. A zero discount was applied to the 2017 interim dividend and the same will apply to the 2017 final dividend.
Subordinated Note Interest PaymentsAGL makes interest payments quarterly in arrears in respect of the Subordinated Notes on or about the 8th of September, December, March and June of each year. Dates and payment rates are available at AGL’s online Investor Centre.
On-market share buy-back and shares purchased on-marketOn 28 September 2016, AGL announced that it would undertake an on-market buy-back of up to 5% of its issued share capital, representing 33,735,619 AGL Shares.
During FY17, AGL purchased 18,887,335 AGL Shares under the on-market buy-back for a total consideration of $473,016,911.75 at an average price of $25.04. The buy-back program is scheduled to cease no later than 12 October 2017.
During the financial year ended 30 June 2017, 557,216 AGL shares were purchased on-market at an average price of $18.66 per share to satisfy employee entitlements under the AGL Share Reward Plan, AGL Share Purchase Plan, AGL Restricted Equity Plan and the AGL Long-Term Incentive Plan.
Reporting to ShareholdersThe Corporations Act requires AGL to provide Shareholders with access to this Annual Report on AGL’s website, unless a shareholder has specifically requested to be sent a printed or electronic copy. Shareholders seeking a copy of the Annual Report should subscribe online or contact the Share Registry. The Annual Report is also available on AGL’s website.
Change of name, address or banking detailsShareholders who are Issuer Sponsored should advise the Share Registry immediately of a change of name, address or banking details for dividends electronically credited to a bank account. All such changes must be advised online or in writing and cannot be accepted by telephone. For a change of name, supporting documentation must accompany your written advice. Appropriate forms can also be downloaded from the Share Registry’s website.
Shareholders who are CHESS Sponsored should instruct their sponsoring broker in writing to notify the Share Registry of any change.
Tax File Number (TFN)/Australian Business Number (ABN)It is not compulsory to provide a TFN or ABN. However AGL will be required to deduct tax at the top marginal rate from the unfranked portion of any dividend paid to Shareholders who have not provided either a TFN/ABN or details of a relevant TFN exemption. TFN/ABN notification forms can be obtained by contacting the Share Registry, by lodging your details online or by downloading the appropriate form from the Share Registry’s website.
Consolidation of shareholdingsShareholders who wish to consolidate multiple shareholdings into a single shareholding should advise the Share Registry or their sponsoring broker, whichever is applicable, in writing.
Registered OfficeAGL Energy Limited, Level 24, 200 George Street, Sydney NSW 2000, Australia
Telephone 02 9921 2999 (within Australia) +61 2 9921 2999 (international)
Company SecretaryJohn Fitzgerald BA MA LLB

Annual Report 2017 77
DirectoryAGL Energy Limited
Registered Office Level 24, 200 George St Sydney NSW 2000, Australia Locked bag 1837 St Leonards NSW 2065Telephone: 02 9921 2999Fax: 02 9921 2552
Web: agl.com.au
Financial Calendar10 August 2017 2017 full year result and final dividend announced
24 August 2017 Record date of final dividend
25 August 2017 Record date of final DRP
22 September 2017 Payment date of final dividend
27 September 2017 Annual General Meeting
8 February 2018 2018 interim result and interim dividend announced (indicative)
9 August 2018 2018 full year result and final dividend announced (indicative)

AGL 2017 Annual Report
agl.com.au