Embed Size (px)
Citation preview

Sh
are
Fo
od
, Sh
are
Lo
ve
12/CL-6 Claremont Road,Civil Lines, Karachi.UAN: 111-222-282
Email: [email protected]: www.nfoods.com
“Share Food, Share Love”, essentially depicts our underlying ethos, which perpetuates our existence as
National Foods.
We believe in providing the best food in terms of taste, nutrition and convenience, and consequently,
in sharing this happiness with your loved ones.
Our Annual Report 2015-16 is a clear indication that we are on the right track. The hard work,
determination and unity displayed by our employees, is reaping national and global bene�ts in driving, and
achieving various goal posts and milestones that lead us on a prosperous and ful�lling route.
The theme of the report is in perfect harmony with the Vision 20/20 and signi�es the impact our food
can and is having on peoples’ lifestyle and happiness.
About the Report
ContentsAbout the Company04 Our Story
05 Business Pro�le
06 Geographical Presence
08 Founder’s Philosophy
10 Vision and Mission
11 Core Values
12 Code of Ethics and Business
Practices
14 History Timeline
16 Awards and Certi�cates
18 Our People
18 Our Manufacturing Excellence
20 Our Brands
26 Our Marketing Communications
30 Our Technological Developments
32 Our Quality, Research and Development
Stakeholders Information33 Organizational Chart
34 Company Information
36 Calendar of Events
38 CEO’s Message
Business Review52 Directors’ Report
Financial Report71 Statement of Compliance
73 Review Report to the Members
74 Standalone Financial Statements
110 Consolidated Financial Statements
Others146 Notice of Annual General Meeting
151 Glossary
152 Jama Punji Information
153 Form of ProxyFinancial Review62 DuPont Analysis
63 Financial Ratios
64 Horizontal Analysis
65 Vertical Analysis
66 Summary of Cash Flow Statement
67 Six Year Cash Flows Using
Direct Method
68 Statement of Value Added
and its Distribution
69 Pattern of Shareholding
Governance40 Directors’ Pro�le
44 Board Committees
45 Corporate Governance
46 Management Committee
Sustainability48 Corporate Social Responsibility
49 Occupational Health, Safety
and Security
50 Energy Conservation
50 Rural Development Programs (RDP)

National Foods Limited
National FoodsDMCC (UAE)
NationalEpicure Inc.
(Canada)
NationalFoods Pakistan
(UK) Ltd.
National Foods Limited (NFL), founded in 1970, is Pakistan’s leading multi category foods company with over 250 different products in 12 categories. NFL holds ISO 9001, ISO 18001, ISO 22000 and HACCP certi�cations along with SAP Business Technology to drive its strong commitment to quality and management excellence.
In line with NFL’s Vision 20/20 of becoming a Rs. 50 billion company, we are already on our way of being recognized as an internationally renowned brand in over 40 countries across 5 continents worldwide.
NFL is dedicated to improving the well-being of our society through continuous development of innovative food products and a wide range of Corporate Social Responsibility programs.
StoryOurNFL has successfully established itself as a multinational foods company with an independent subsidiary, National Foods DMCC, in 2013, catering to the Middle Eastern market in Dubai. This structure was further expanded with 2 more subsidiaries in Canada, (National Epicure Limited) and United Kingdom, (National Foods Pakistan UK Limited) catering to the North American and European markets respectively.
ProfileBusiness
Annual Report 2016 05Share Food, Share Love04

LIBYA
NIGERIA
ETHIOPIA
KENYA
SOUTH AFRICA
OMAN
UNITED ARAB EMIRATES
QATAR
KUWAIT
IRAQ
SAUDI ARABIA
JAPAN
SOUTH KOREA
CHINA
AFGHANISTAN
IRAN
PAKISTAN
BANGLADESH
HONG KONG
INDIA
SRI LANKA
SINGAPORE
MALAYSIA
AUSTRALIA
NEW ZEALAND
Romania
Greece
Sweden
Norway
Denmark
Netherlands
Belgium
United Kingdom
UNITED STATES OF AMERICA
CANADA
GermanyPresenceGeographical Countries36
Continents05
Offices04
Annual Report 2016 07Share Food, Share Love06

National Foods must focus on customer needs and serve them with quality products at affordable prices.
Our products must be pure and should conform to international standards.
Our research must continuously produce new and adventurous products that are scienti�cally tested and hygienically wrapped in safe and attractive packaging.
We must create an environment in our of�ces and factories where talent is groomed and people have every opportunity to advance in their careers.
We must provide ourselves to be good corporate citizens, support charitable causes and bear our fair share of taxes.
Reserves must be built, new factories created, sound pro�ts made and fair dividend should be paid to our stockholders.
Through building a reliable brand, NFL must get itself recognized as a leader in Pakistan and abroad.
With the help of Almighty God, the company can achieve its targets in times to come.
PhilosophyFounders’
Annual Report 2016 09Share Food, Share Love08

ValuesCore
MissionVision &“Our vision is to be a Rs. 50 billion food company by the year 2020 in the convenience food segment by launching products and services in the domestic and international markets that enhance lifestyle and value for our customers through management excellence at all levels.”
We act with intense positive energy and are not afraid to take risks. We challenge ourselves continuously, we’re good at what we do, and we take pride in who we are.
We put our people �rst. We treat them with respect and actively contribute towards their development.
We see the world through the eyes of our customers. We do everything possible to make them happy.
We are part of the solution, never the problem. We act like owners and have a positive in�uence on others.
Our roles are de�ned, not our responsibilities. We believe in going the extra mile to accomplish our goals. We coach and support each other to ensure everyone wins. We have a “WE versus I” mindset.
We don’t run our business at the cost of human or ethical values.
We say. We do. We deliver. We talk with our actions. We strive for nothing but the best. Execution is the key to winning!
We see. We act. We take full responsibility of our actions and results. We don’t blame others for our mistakes; we analyze them and correct them.
PASSION
PEOPLE-CENTRIC
CUSTOMER FOCUS
LEADERSHIP
TEAMWORK
ETHICS
EXCELLENCEIN EXECUTION
ACCOUNTABILITY
Annual Report 2016 11Share Food, Share Love10

Business PracticesCode of Ethics &
NFL believes in conducting its operations with strong ethical and moral standards. NFL’s Statement of Code of Ethics & Business Practices aims to provide guidance on carrying out its business related decisions and activities. We wish to achieve excellence in all spheres of our operations for which business ethics form the basis. Any party entering any form of contract with NFL is bound to comply with the given guidelines.
NFL’s Statement of Code of Ethics & Business Practices, has the following 7 guidelines:
Unfair Means: Any use of bribery, kickbacks or any form of payment in cash/kind to obtain business related or otherwise gainful bene�t for the company is strictly prohibited. Excessive business gifts and entertainment also hold the same meaning and NFL does not approve of such payments.
Respect and Integrity: NFL believes in giving respect to individuals. We aim to operate in a manner that discourages discrimination, harassment and/or in�uence. Discrimination refers to favoritism based on a particular aspect of an individual’s personality. Harassment includes gender harassment creating an intimidation, hostile or offensive work environment causing interference with work performance. In�uence could be an abuse of authority or the wish to alter personal beliefs.
Con�ict of Interest: NFL prohibits actions that are in con�ict with the company’s business interests. This may include but is not limited to:
• Providing assistance to the competition or holding ownership interests in a customer, supplier, distributor or competitor.
• Making personal gains at the company’s expense.
1
2
3
4
5
6
7
Con�dentiality: NFL believes in con�dentiality of information related to company’s business activities. The company expects employees not to disclose or divulge by any means the con�dential and commercially sensitive information except to the authoritative personnel requiring it. Furthermore, they should use their best endeavors to prevent the disclosure of such information by other people. The obligation of con�dentiality shall survive the expiration or the cessation of contacts with NFL and is equally applicable to intellectual property.
Statutory Compliance: NFL believes in providing total support and cooperation to all the governmental and regulatory bodies irrespective of the extent of prevalent enforcement.
Financial Integrity: NFL believes in complete compliance with the accepted accounting rules and procedures. This includes but is not limited to:
• Transparency: NFL discourages any illegal activity for the purpose of any bene�t to the company or others. All information supplied to the stakeholders and/or auditors must be authentic and transparent. • Disclosure: All transactions must be fully disclosed and must be for the purpose stated for.
Health, Safety and Community Responsibility: NFL is fully committed to health, safety and responsibility towards environment and community. All activities of NFL must portray responsibility towards the community and nation as a whole. NFL seeks to employ procedures that are safe, healthy and environment-friendly.
Annual Report 2016 13Share Food, Share Love12
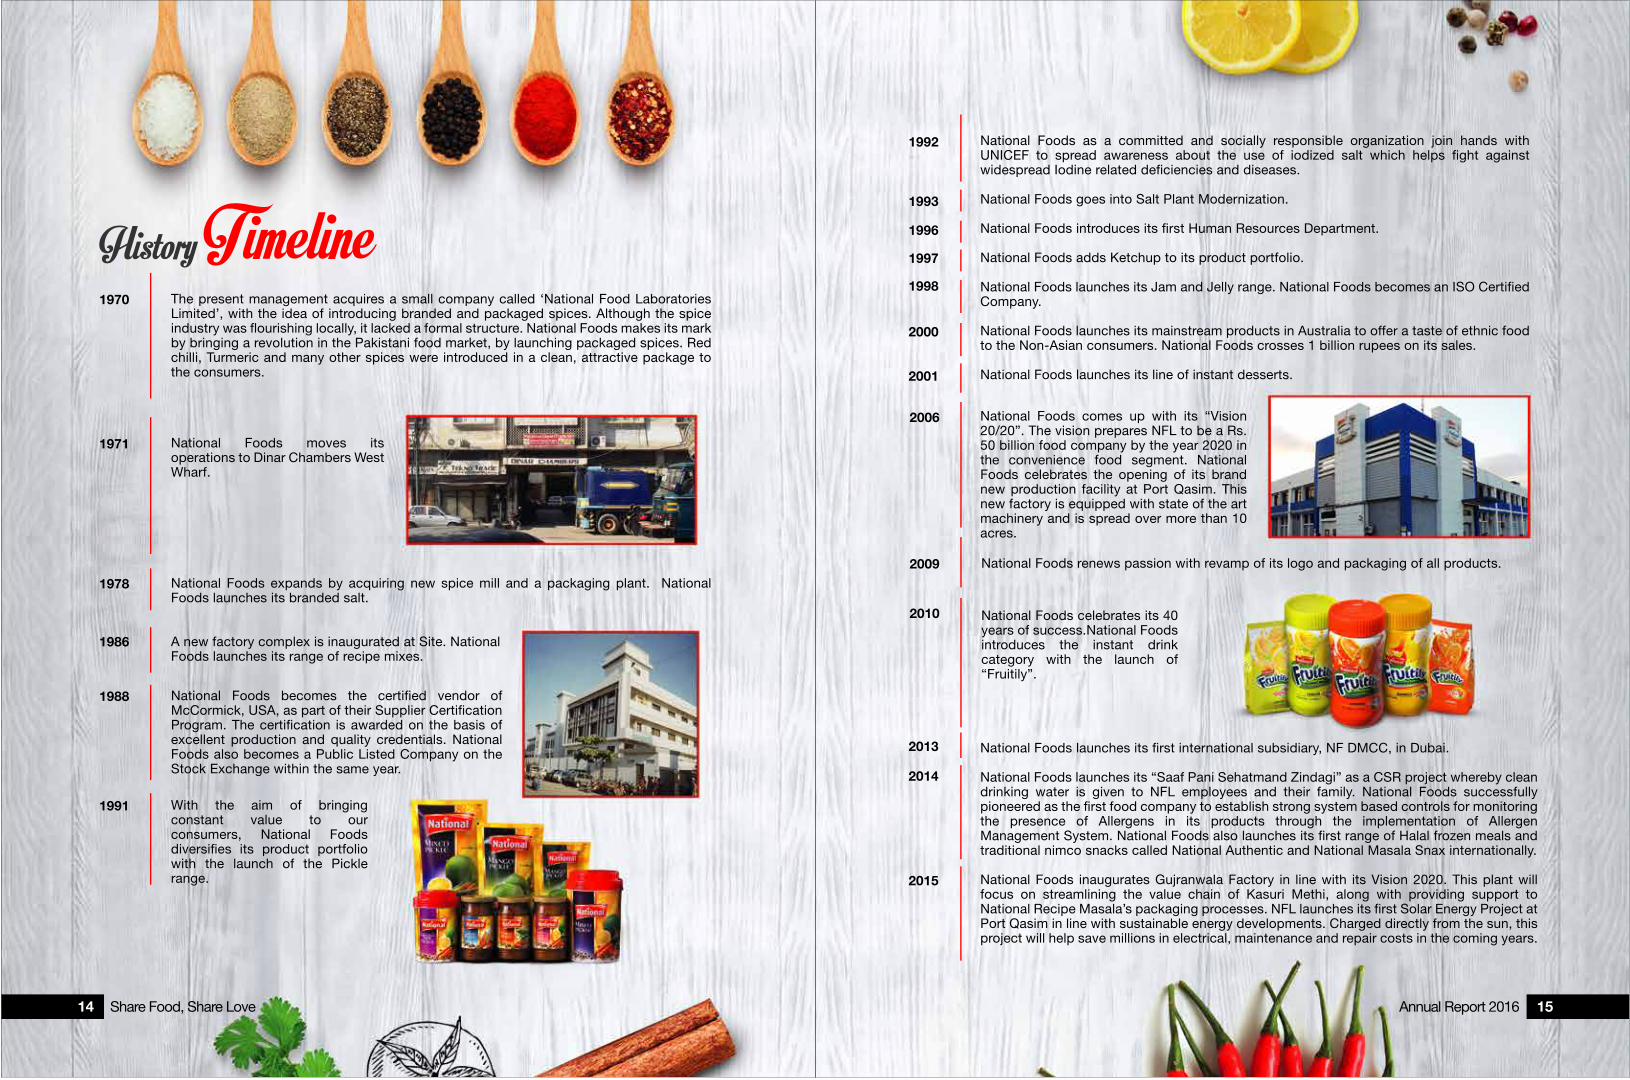
History TimelineThe present management acquires a small company called ‘National Food Laboratories Limited’, with the idea of introducing branded and packaged spices. Although the spice industry was �ourishing locally, it lacked a formal structure. National Foods makes its mark by bringing a revolution in the Pakistani food market, by launching packaged spices. Red chilli, Turmeric and many other spices were introduced in a clean, attractive package to the consumers.
1970
With the aim of bringing constant value to our consumers, National Foods diversi�es its product portfolio with the launch of the Pickle range.
1991
National Foods becomes the certi�ed vendor of McCormick, USA, as part of their Supplier Certi�cation Program. The certi�cation is awarded on the basis of excellent production and quality credentials. National Foods also becomes a Public Listed Company on the Stock Exchange within the same year.
1988
National Foods expands by acquiring new spice mill and a packaging plant. National Foods launches its branded salt.
A new factory complex is inaugurated at Site. NationalFoods launches its range of recipe mixes.
1978
1986
National Foods moves its operations to Dinar Chambers West Wharf.
1971
National Foods as a committed and socially responsible organization join hands with UNICEF to spread awareness about the use of iodized salt which helps �ght against widespread Iodine related de�ciencies and diseases.
National Foods goes into Salt Plant Modernization.
National Foods introduces its �rst Human Resources Department.
National Foods adds Ketchup to its product portfolio.
National Foods launches its Jam and Jelly range. National Foods becomes an ISO Certi�ed Company.
National Foods launches its mainstream products in Australia to offer a taste of ethnic food to the Non-Asian consumers. National Foods crosses 1 billion rupees on its sales.
National Foods launches its line of instant desserts.
1993
1992
1996
1997
1998
2000
2001
National Foods launches its �rst international subsidiary, NF DMCC, in Dubai.
National Foods launches its “Saaf Pani Sehatmand Zindagi” as a CSR project whereby clean drinking water is given to NFL employees and their family. National Foods successfully pioneered as the �rst food company to establish strong system based controls for monitoring the presence of Allergens in its products through the implementation of Allergen Management System. National Foods also launches its �rst range of Halal frozen meals and traditional nimco snacks called National Authentic and National Masala Snax internationally.
National Foods inaugurates Gujranwala Factory in line with its Vision 2020. This plant will focus on streamlining the value chain of Kasuri Methi, along with providing support to National Recipe Masala’s packaging processes. NFL launches its �rst Solar Energy Project at Port Qasim in line with sustainable energy developments. Charged directly from the sun, this project will help save millions in electrical, maintenance and repair costs in the coming years.
2013
2014
2015
National Foods renews passion with revamp of its logo and packaging of all products.2009
National Foods comes up with its “Vision 20/20”. The vision prepares NFL to be a Rs. 50 billion food company by the year 2020 in the convenience food segment. National Foods celebrates the opening of its brand new production facility at Port Qasim. This new factory is equipped with state of the art machinery and is spread over more than 10 acres.
2006
National Foods celebrates its 40 years of success.National Foods introduces the instant drink category with the launch of “Fruitily”.
2010
Annual Report 2016 15Share Food, Share Love14
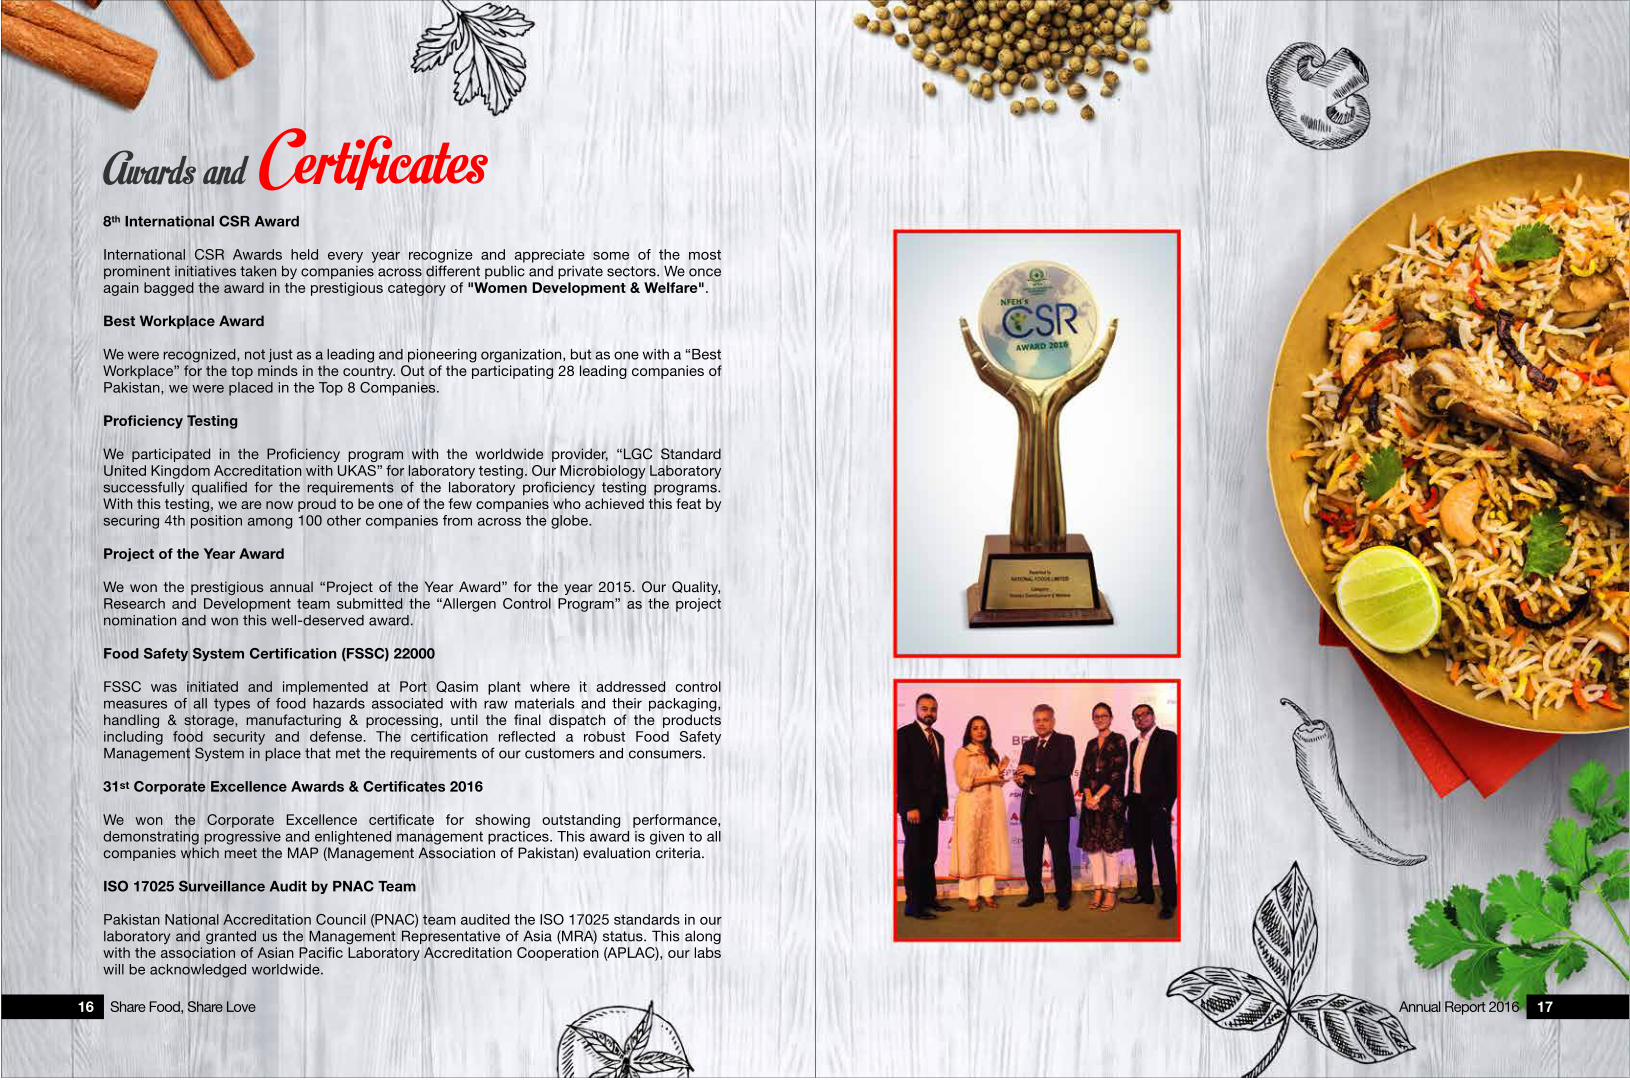
Awards and Certificates8th International CSR Award
International CSR Awards held every year recognize and appreciate some of the most prominent initiatives taken by companies across different public and private sectors. We once again bagged the award in the prestigious category of "Women Development & Welfare".
Best Workplace Award
We were recognized, not just as a leading and pioneering organization, but as one with a “Best Workplace” for the top minds in the country. Out of the participating 28 leading companies of Pakistan, we were placed in the Top 8 Companies.
Proficiency Testing
We participated in the Pro�ciency program with the worldwide provider, “LGC Standard United Kingdom Accreditation with UKAS” for laboratory testing. Our Microbiology Laboratory successfully quali�ed for the requirements of the laboratory pro�ciency testing programs. With this testing, we are now proud to be one of the few companies who achieved this feat by securing 4th position among 100 other companies from across the globe.
Project of the Year Award
We won the prestigious annual “Project of the Year Award” for the year 2015. Our Quality, Research and Development team submitted the “Allergen Control Program” as the project nomination and won this well-deserved award. Food Safety System Certification (FSSC) 22000
FSSC was initiated and implemented at Port Qasim plant where it addressed control measures of all types of food hazards associated with raw materials and their packaging, handling & storage, manufacturing & processing, until the �nal dispatch of the products including food security and defense. The certi�cation re�ected a robust Food Safety Management System in place that met the requirements of our customers and consumers.
31st Corporate Excellence Awards & Certificates 2016
We won the Corporate Excellence certi�cate for showing outstanding performance, demonstrating progressive and enlightened management practices. This award is given to all companies which meet the MAP (Management Association of Pakistan) evaluation criteria.
ISO 17025 Surveillance Audit by PNAC Team
Pakistan National Accreditation Council (PNAC) team audited the ISO 17025 standards in our laboratory and granted us the Management Representative of Asia (MRA) status. This along with the association of Asian Paci�c Laboratory Accreditation Cooperation (APLAC), our labs will be acknowledged worldwide.
Annual Report 2016 17Share Food, Share Love16

Our PeopleFor us, our people de�ne our company. Their energy, vision, devotion and trust are the primary ingredients of National Foods success and we value them immeasurably. We strongly believe that for an organization to realize its optimum potential, it must create an environment where it can nurture values, talent and a high performance culture for its people.
Improving our SystemsWith our belief in transforming traditional work ways, our people and environment to ensure maximum ef�ciency and results, we kick started the year by launching the �rst interactive and customized dashboard called the “Automated Workflow Systems”. This system has provided employees a convenient one-stop solution for processing their business application requests which includes advanced salary requests, leaves, vehicles applications, fuel and maintenance claims etc.
Furthermore, in the pursuit to strengthen our operations, we entered into a strategic partnership with SAP SUCCESS FACTORS and Siemens Pakistan. A game was developed by the name of “Star Quest” in order to familiarize the employees with the system and to get them to enter their goals into the system. The game had two major objectives: one to let each employee enter his/her goals into the system and second, to help each other across departments to put in the goals. The game led to greater team building and cohesion across functions besides ensuring alignment of their goals.
Learning and DevelopmentEffective and inspirational leaders are critical to an organisation’s success, and so it is important to develop leadership capacity in your organisation. In order to develop action plans for growth and development, and also to begin the process of formal leadership development attributes in the Company, we launched the �rst ever “Leadership 360 Feedback” surveys covering over 50 Senior Management individuals.
Team Building RetreatsTo keep employees motivated and to give them opportunities to experience activities beyond the daily job responsibilities and to build the spirit of team work, away days were planned across the company for all departments. Adding to such employee engagement, an annual Eid Milan gathering was also organized following the month of Ramazan across the length and breadth of the Company.
Induction of the FRYMA KROMA, a German machine based on vacuum cooking technology was a great addition to the current �eet and will further open a new world of cold sauces for National Foods. Furthermore, material warehousing was made more ef�cient by partnering with a logistics company by the name of Connect Logistics which provides the latest equipment and modern racking system for warehousing purposes to NFL, allowing for greater business ef�ciencies.
Port Qasim At Port Qasim we inaugurated an independent manufacturing unit for International business at the plant allowing National Foods to cater to various complexities expected in International Business due to numerous packaging and product formulation requirements from different countries and regions. With this expansion, new doors of business opportunities opened up leading to improved shipment timings and availing maximum shelf space against competition.
Muridke In Muridke, we had a productive year by enabling certain modi�cation in existing production lines to increase plant capacity and productivity by nearly 12%. Plant capacity increased from 108,000 units to 120,000 per day. These modi�cations were proposed, developed and implemented by in-house maintenance team. Salt plant also showed good performance in achieving its monthly production compliance targets. Monthly plant compliance was 100% throughout the year.
GujranwalaAfter successful one year of operation, our Gujranwala plant showed remarkable growth in production. Having started with 500,000-1,000,000 units in the beginning, it recorded a monthly production of 2,200,000 units over the last year. In line with its aim to deliver growth and quality along with innovation and technological prowess, NFL inducted a state of the art ketchup and sauce processing line at the plant along with automatized packing unit for ketchup. The project was in continuation to previous year’s expansion of recipe packing and it will allow monitored progressive quality enhancement, time and cost ef�ciencies and major scale �exibility advantage in future.
Nooriabad Completed before the mango cutting season, Nooriabad Project Phase 1 was a substantial step in the area of innovation and expansion towards achieving Vision 20/20. Covering an area of 13.84 acres, the project phase 1 scope included the complete boundary wall of the plant and facilities comprising of 60 brine tanks and a complete mango cutting area. Additionally, four new mango cutting lines were inducted to fully automate the mango cutting process, a signi�cant �rst for the industry through which record production was achieved and the storage facility was fully utilized thereof.
Our Manufacturing ExcellenceWe believe in investing in technical knowledge, state of the art facilities, attention to safety, high performance culture and high standards of process and maintenance at National Foods, which comprehensively de�ne our manufacturing excellence.
SiteIn the recent years, our Paste plant team has successfully implemented several process improvements and production enhancement projects to help grow the business. Capitalizing on the same expertise of NFL’s in-house team, successful improvements in the productivity of 3.25 kg and 100 gm sachet machine were achieved.
Annual Report 2016 19Share Food, Share Love18
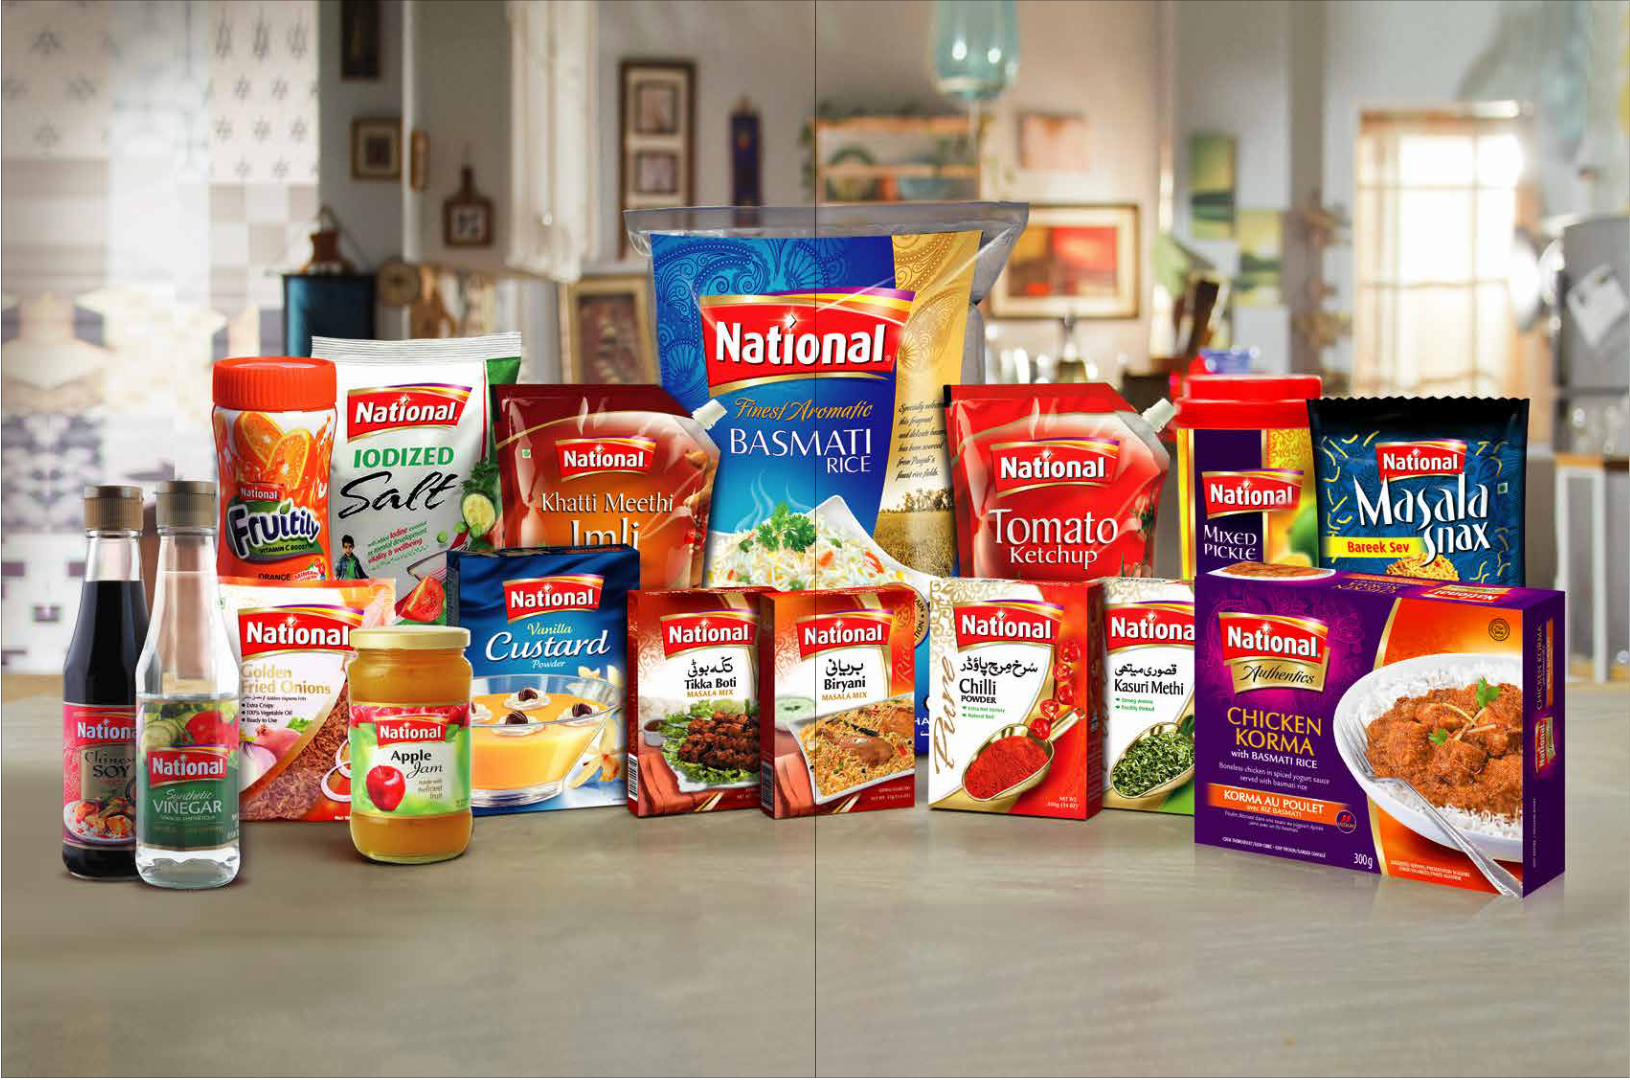

Plain Spices: One of our pioneer brands, plain spices range, represents the true heritage of our Company. National Plain Spices and Ingredients are made from the �nest, high-quality spices used in Pakistani cuisines to enhance taste and �avor of each dish. The consistent delivery of excellent quality has ensured that we maintain leadership in this category.
Recipes: We continue to be a market leader in the recipe category by providing a delicious range of recipes to our consumers. Our brand provides a perfect balance between convenience and good taste thus enriching the �avor of each meal. National Recipe range covers a vast portfolio of rich �avors including Rice, Salan, BBQ, Bhunna, Fried and Vegetable. Through such a diverse offering our brand offers something for everyone.
Jams: Another thriving range, our National Jams is an essential part of the daily breakfast routine of Pakistanis. The appetizing taste of each �avor adds life to the breakfast table making the most important meal of the day full of energy and fruity fun. National Jams range offers a variety of mouthwatering fruity �avors that are a treat for children and adults alike.
Desserts: We offer a complete Dessert solution to consumers by offering a diverse range of modern and traditional desserts. Each product in this range is developed using the �nest ingredients in exactly the right measure to assist consumers to prepare authentic and delicious desserts with ease. The taste palette of the range appeals to a wide target audience where consumption is not limited to special occasions but to satisfy sugar cravings anytime.
Pickles: Our National Pickles range is prepared using the �nest ingredients; freshly picked fruits, succulent vegetables immersed in delectable oils enhanced by our signature spice blend. The wide Pickles range aids in making all meals deliciously exciting. The superb taste, aroma and �avor are enough to add mouth-watering �avor to each bite of the food.
Rice: National Rice is produced from the �elds of Punjab, where Pakistan’s �nest rice grains are grown. The elongated grain, �ne and beautiful texture and pure fragrance of National Rice serve as the perfect base to any rice dish. Pure, premium and aromatic basmati rice is our unique specialty.
Annual Report 2016 23Share Food, Share Love22

Salt: National Foods is the market leader in the Salt category. Although Salt is considered a commodity, National Salt is one of our most trusted and leading brands.Our competitive edge lies in the below attributes:1. Pure and White and Free Flowing2. Bacteria Free3. Power of Iodine
Fruitily: Available in a range of mouth-watering fruity �avors, National Fruitily is a delightful instant drink mix loved by all our consumers. Each glass of Fruitily is bursting with essential nutrients that not only provide energy that the body and mind need, but also leave one refreshed, nourished and perked up!
Pastes: Ginger and garlic are commonly used in the preparation of sub continental food, we provide a range of �avorsome pastes, which include ginger paste, garlic paste and ginger garlic paste. These products make the cooking experience more delightful by adding convenience and a touch of savory �avor to food.
Salt: Although the Salt category is considered a commodity, We have been successful in not only branding the category but also emerging as a clear market leader. National Salt is a trusted brand that stands out from others in the market based on its exceptionally consistent and high quality offering. The free �owing salt enhances the taste of any dish and adds a delicious �avor to each meal.
Snacks: Our National’s Masala Snax range captures the authentic spice �avors of sub continent. Exotic, explosive and exciting, these snacks provide a burst of �avor that dazzle the taste buds and excite the senses. The range offers a variety of tantalizing �avors including Chilli Chips, Chatpatta Mix, Karachi Mix, Moong Dal and Bareek Sev which add a masala twist to your snacking experience.
Frozen Foods (Ready to eat meals): Rich in aroma, texture and �avor, our frozen meals are seasoned to perfection. Prepared with authentic National spices and served with the �nest quality basmati rice, these authentic mouthwatering meals are available in four delicious �avors.
‘National Authentics’ meals (frozen) are microwaveable and ready to serve in 5 minutes, providing convenient solutions for all meal occasions. Experience the tradition with National frozen meals, Halal certi�ed by HMA.
Fried Onions: National Golden Fried Onions, aromatic and �avorsome in taste, make the meals special. Prepared from the �nest onions and through the highest quality processes, give them a sunshine gold color and a deliciously crispy texture.
Whether cooked, seasoned or garnished, our National Golden Fried Onions, make the meals a magical mouthwatering experience.
Chinese: National Chinese range offers a complete solution for our consumers. These sauces enhance the �avor of any Chinese meal and ensure that consumers enjoy a delicious food experience.
Ketchup and Sauces: Our National Ketchup and Sauces range offers an exciting range of tasty and zesty �avors ensuring that National remains a leader in the category year on year. The assortment offered, allows our consumers to use the sauces as meal complements and as dipping sauces, adding a unique twist to the traditional taste of everyday food.
Annual Report 2016 25Share Food, Share Love24

Our Marketing CommunicationsMade Easy Digital Platform
With hundreds of recipes, culinary tips and “Chef Saadat’s” quick meal ideas to choose from, we launched an enhanced version of madeeasy.com.pk as our �rst consumer centric website. The website offers one minute quick meal videos of a variety of dishes offering convenience at every step to the user who wants easy-to-cook recipes. Made Easy application on the App Store and Play Store allows accessibility on mobile and tablets. Looking to the future, “Made Easy” will help us collaborate with E-commerce portals to promote and sell our products online.
National Jams School Program
Titled “National Jamtastic Mornings”, the school program was initiated this year; targeting 127 schools in Karachi, Lahore, Islamabad, Faisalabad, Gujranwala and Sialkot. The objective was to create brand awareness leading to recall of National Jams among the core target group through direct engagement. Positioning National Jams as a breakfast essential, kids from ages 6 to 12 were made to try the product and spoken to about the importance and nutritional value of a healthy National breakfast, as they also played various games that showcased their inner strength.
National Desserts Relaunch
Encompassing the wide range of audience taste and the need for a holistic approach for desserts marketing, we relaunched our modern desserts portfolio with the tagline “Jaisay Dil Chahey” utilizing a comprehensive 360 degrees approach, spanning TV, Radio, Outdoor, Print, Digital, In-store and BTL.
National Pickles Campaign
Complementing the ATL campaign, BTL initiative “Chatkharay Dar Meh�l” allowed us to engage women all over Pakistan via this home gathering initiative, which gave women the experience of “taste of happiness” as they were educated on why branded pickle is healthier and hygienic as compared to unbranded pickles.
Annual Report 2016 27Share Food, Share Love26
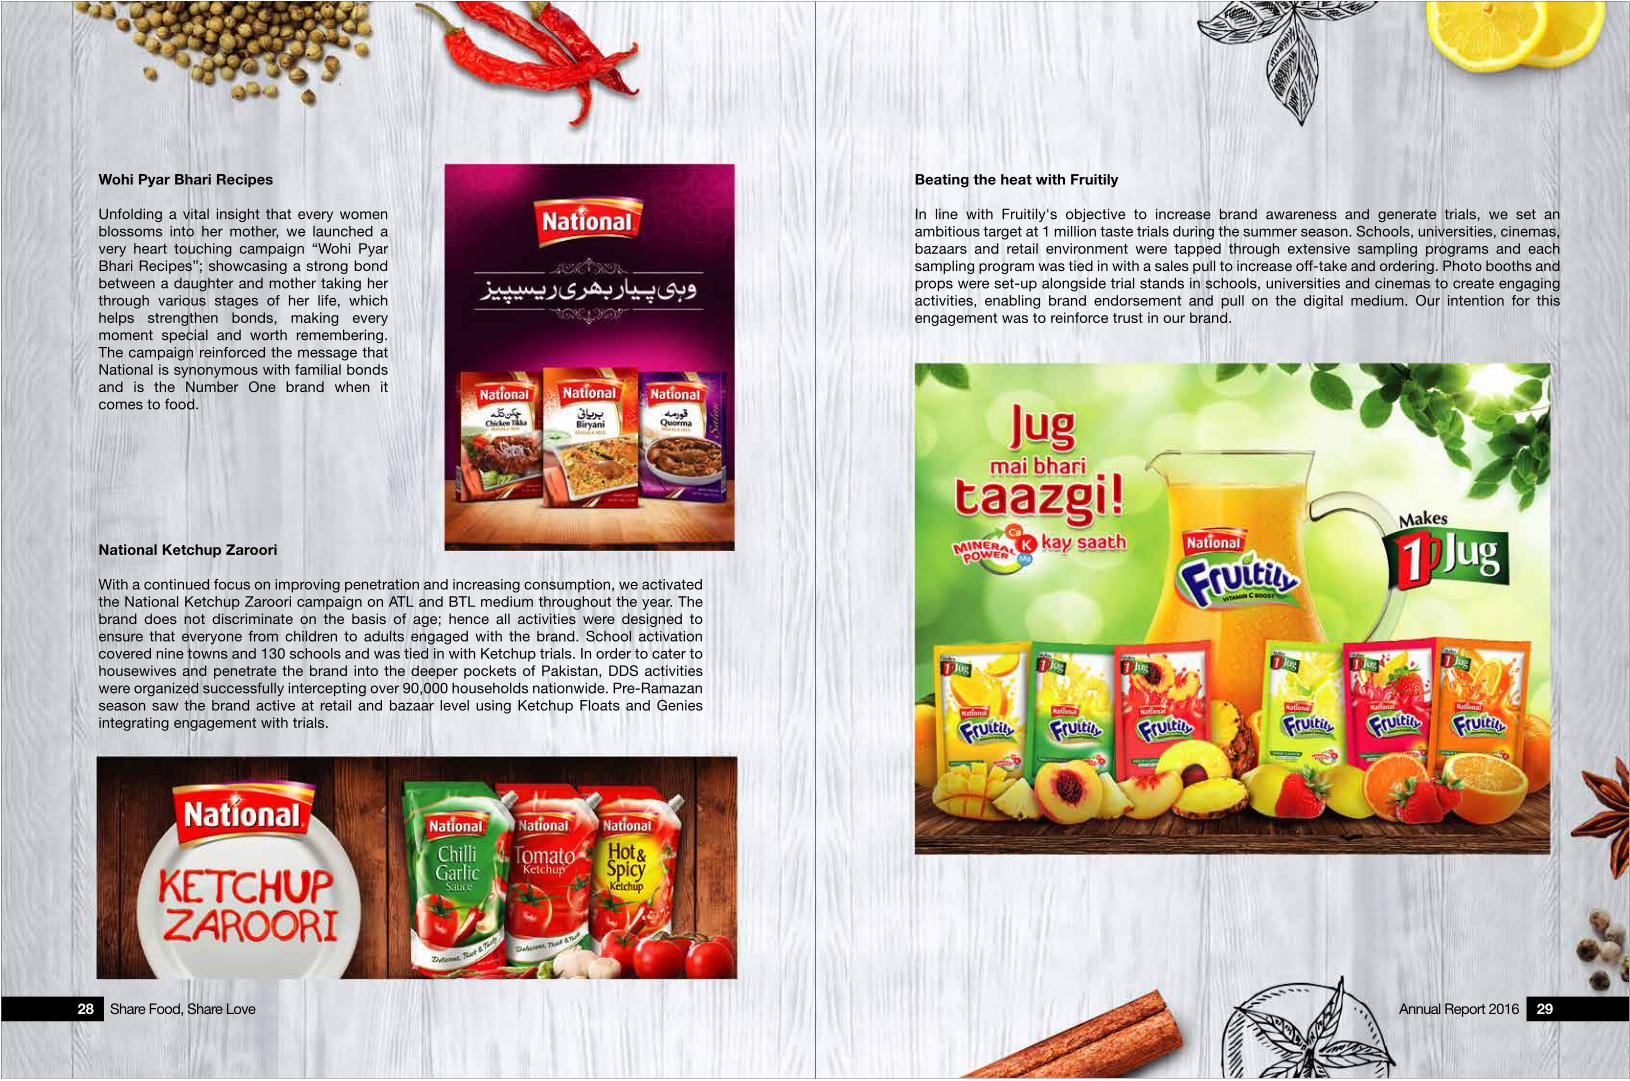
Wohi Pyar Bhari Recipes
Unfolding a vital insight that every women blossoms into her mother, we launched a very heart touching campaign “Wohi Pyar Bhari Recipes”; showcasing a strong bond between a daughter and mother taking her through various stages of her life, which helps strengthen bonds, making every moment special and worth remembering. The campaign reinforced the message that National is synonymous with familial bonds and is the Number One brand when it comes to food.
National Ketchup Zaroori
With a continued focus on improving penetration and increasing consumption, we activated the National Ketchup Zaroori campaign on ATL and BTL medium throughout the year. The brand does not discriminate on the basis of age; hence all activities were designed to ensure that everyone from children to adults engaged with the brand. School activation covered nine towns and 130 schools and was tied in with Ketchup trials. In order to cater to housewives and penetrate the brand into the deeper pockets of Pakistan, DDS activities were organized successfully intercepting over 90,000 households nationwide. Pre-Ramazan season saw the brand active at retail and bazaar level using Ketchup Floats and Genies integrating engagement with trials.
Beating the heat with Fruitily
In line with Fruitily's objective to increase brand awareness and generate trials, we set an ambitious target at 1 million taste trials during the summer season. Schools, universities, cinemas, bazaars and retail environment were tapped through extensive sampling programs and each sampling program was tied in with a sales pull to increase off-take and ordering. Photo booths and props were set-up alongside trial stands in schools, universities and cinemas to create engaging activities, enabling brand endorsement and pull on the digital medium. Our intention for this engagement was to reinforce trust in our brand.
Annual Report 2016 29Share Food, Share Love28

Our Technological DevelopmentsWe apply industry best practices and an innovation mindset to meet the needs of today while envisioning our world of tomorrow. We led transformational growth in a way that enabled speed, agility and empowerment. Process ef�ciencies and target measurement clarity was brought about by IT-Business value mapping activities, customer engagements and change management.
Key project highlights
SAP Server: Our strategic collaboration with Rapid Compute (Pakistan's �rst public cloud platform) led to hosting of SAP PRD on Cloud allowing greater �exibility, agility and speed of access over secure internet for all our users and customers.
Corporate Website: Our corporate website www.nfoods.com was revamped with completely updated information, interactive features, simpler and aesthetically pleasing user interface and deeper linkages with social media and consumer input for content creation and feedback.
Enhancing Systems
Our �rst ever non-SAP based work�ow system was implemented, allowing seamless interaction of entire NFL community with HR and IT. This system (integrated with SAP) signi�cantly reduced paper, ensured transparency and quick decision-making.
Furthermore, we launched the “Success Factors”, a Human Resource Capital Management Solution, which aims to empower employees to better manage their career growth and tracks their goals throughout the year. We also fully automated our end-to-end processes of Sales and Operations Planning within SAP, allowing the establishment of benchmarks for production and sales numbers. The SnOP system was streamlined with demand and production planning using forecasting mechanism by analyzing historical sales trends.
Furthermore, we implemented SAP native release strategy and work�ows for approval/rejection of Purchase Requisitions. Through this dispersed SAP users can create and submit their PRs which can be approved at multi-level either within SAP, or via Email (system and mobile enabled), thus signi�cantly reducing time and cost inef�ciencies.
Being Future Ready
Coping with future challenges, we expanded the PQ data center, ensuring that current and future needs of the plant are addressed with a separate data center and Power Room. Secondly, in order to migrate to latest SAP landscapes such as HANA, we implemented Personas and FIORI, ensuring SAP technical upgradation from EHP 0 to EHP 7. Oracle was similarly upgraded. In order to provide real-time analytics of large quantity of structured and unstructured data, Tableau and Oracle Apex were also implemented.
Annual Report 2016 31Share Food, Share Love30
DevelopmentOur Quality, Research & Innovation has been at the heart of our company since its beginning. Each day we strive to make our products tastier and healthier choices that help consumers care for themselves and their families. This would not have been possible without our unmatched R&D capability, nutrition science and passion for quality in everything we do.
The year turned out to be about numerous new products, line extensions and achieving new global quality recognition and acknowledgements. In the ambit of new product development, we introduced two new exciting �avors of Fruitily, “Peach” and “Pineapple”, which was a big success as per market surveys. Secondly, the custard range was enhanced with the launch of chocolate-coffee �avor, being the �rst in the market to introduce such a �avor in the custard range. The exciting new �avor of custard was launched in three SKUs i.e. 21 gm sachet, 120 gm & 240 gm. Furthermore, the National Jelly range was launched with a new and improved recipe and was also featured in an exciting TVC campaign. Underline extensions, recipe mix of 5 variants was launched for the local market as well as for the International Markets. Keeping up with the spirit of Ramazan, there was another remarkable addition to the range of Sauces. “Khatti Meethi Imli” Sauce was launched with a delightful sweet and sour �avor and in convenient standalone pouches.
For the International markets, new Recipe variants namely Tikka Boti, Seekh Kabab, Lahori Chargha, Chana Chaat and Fried Chops, were added to the recipe mix portfolio, to further strengthen our category’s presence and meet consumer demand for expanded �avors. The products were successfully launched and shipped to most markets. Furthermore, new Rice variants, Golden Sella, Classic Supreme (Steamed), and Everyday Rice were launched in North America and Europe.
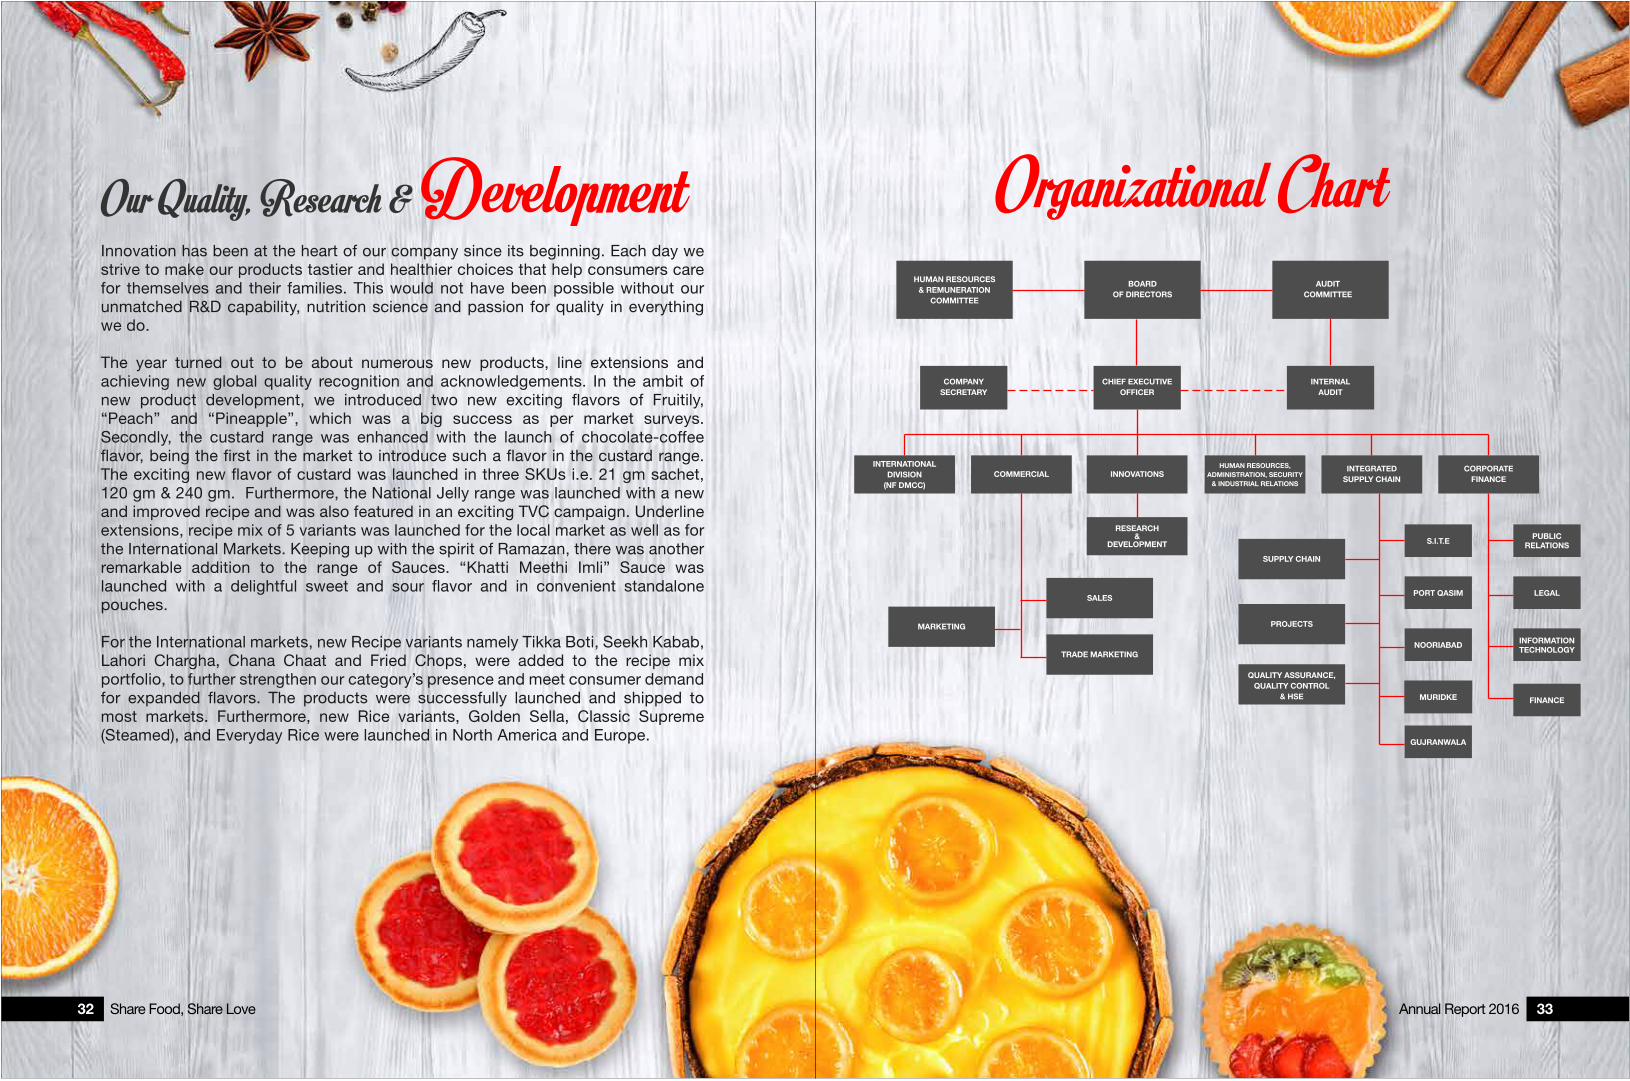
BOARDOF DIRECTORS
AUDITCOMMITTEE
COMPANYSECRETARY
CHIEF EXECUTIVEOFFICER
INTERNATIONALDIVISION
(NF DMCC)
SUPPLY CHAIN
PROJECTS
COMMERCIAL INNOVATIONS
RESEARCH&
DEVELOPMENT
INTEGRATEDSUPPLY CHAIN
CORPORATEFINANCE
HUMAN RESOURCES,ADMINISTRATION, SECURITY
& INDUSTRIAL RELATIONS
INTERNALAUDIT
QUALITY ASSURANCE,QUALITY CONTROL
& HSE
Organizational Chart
NOORIABAD
GUJRANWALA
PORT QASIM
MURIDKE
S.I.T.E
HUMAN RESOURCES& REMUNERATION
COMMITTEE
SALES
TRADE MARKETING
MARKETING
LEGAL
FINANCE
PUBLICRELATIONS
INFORMATIONTECHNOLOGY
Annual Report 2016 33Share Food, Share Love32

Company InformationBOARD OF DIRECTORS
Bank Al-Habib Limited Main Branch, Karachi S.I.T.E. Branch, Karachi New Garden Town Branch, LahoreBank Al Falah Limited(Islamic Banking Group) UTK Main Branch, Karachi
Dubai Islamic Bank Pakistan Limited Clifton Branch, KarachiFaysal Bank Limited 16, Abdullah Haroon Road, KarachiNational Bank of Pakistan PNSC Building Branch, KarachiHabib Bank Limited S.I.T.E. Branch, KarachiHabib Metropolitan Bank Limited Main Branch, KarachiMCB Bank Limited Shaheen Complex Branch, KarachiMeezan Bank Limited M.T. Khan Road Branch, KarachiUnited Bank Limited Main Branch, Karachi
AUDITORS
Mr. Abrar Hasan Chief Executive Of�cer Mr. Gabriel Cravero Director Corporate FinanceMr. Kamal Baig Chief Executive Of�cer NF DMCCMr. Farhan Irfan Siddiqi Director Sales & MarketingMr. Shakaib Arif Director Integrated Supply ChainMs. Saira A. Khan General Manager-HR, Admin, IR & Security
Mr. Zahid Majeed ChairmanMr. Ebrahim Qassim MemberMrs. Saadia Naveed MemberMr. Ehsan A. Malik Member
Mr. Zahid Majeed ChairmanMr. Ebrahim Qassim MemberMrs. Saadia Naveed Member
Mr. Gabriel Cravero
AUDIT COMMITTEE
HUMAN RESOURCE AND REMUNERATION COMMITTEE
CHIEF FINANCIAL OFFICER
Mr. Fazal ur Rehman Hajano
Mr. Shahid Hussain
Messrs. Ernst & Young Ford Rhodes Sidat Hyder & Co., Chartered Accountants
COMPANY SECRETARY
HEAD OF INTERNAL AUDIT AND SECRETARY AUDIT COMMITTEE
INTERNAL AUDITORS
MANAGEMENT COMMITTEE
Messrs. A.F. Ferguson & Co.Chartered Accountants
REGISTERED OFFICE
State Life Building,1-C,I.I. Chundrigar Road, Karachi
12/CL-6 Claremont Road, Civil Lines, Karachi 75530P.O. Box No. 15509Phone: (92-21) 35662687, 35670540, 35670585, 35670793 & 35672268 Fax: (92-21) 35684870
SHARE REGISTRATION OFFICE
Central DepositoryCompany of Pakistan Ltd.
CDC House, 99-B, Block ‘B’, S.M.C.H.S.,Main Shahra-e-Faisal, Karachi-74400Tel: (92-21) 111-111-500Fax: (92-21) 34326031
PRINCIPAL BANKERS
SITE PLANT F-160/ C, F-133, S.I.T.E., Karachi.Phone: 021-3257-7707 – 10, Fax: 021-3257-2217E-Mail Address: [email protected]
PORT QASIM PLANT A-13, North Western Industrial Zone, Bin Qasim, KarachiPhone: 021-3475-0373 – 7
MURIDKE PLANT 5-A/1, New Muslim Town, LahoreFactory Address: G.T. Road, Manooabad Meer Muridke.Phone: 042-798-1427, 798-0808Fax: 042-798-1427, 798-0808
GUJRANWALA PLANT 53-KM G.T. Road, Chainwala Mord Amanabad,Gujranwala near Gujranwala Kamoki Tool PlazaPhone: 055-3409560, 3409660
Web Presence: Updated company information and the latestAnnual Report can be accessed at: www.nfoods.com
Mr. Abdul Majeed ChairmanMr. Abrar Hasan Chief Executive Of�cerMr. Zahid Majeed DirectorMr. Ebrahim Qassim DirectorMrs. Noreen Hasan DirectorMrs. Saadia Naveed DirectorMr. Ehsan A. Malik Director
Annual Report 2016 35Share Food, Share Love34
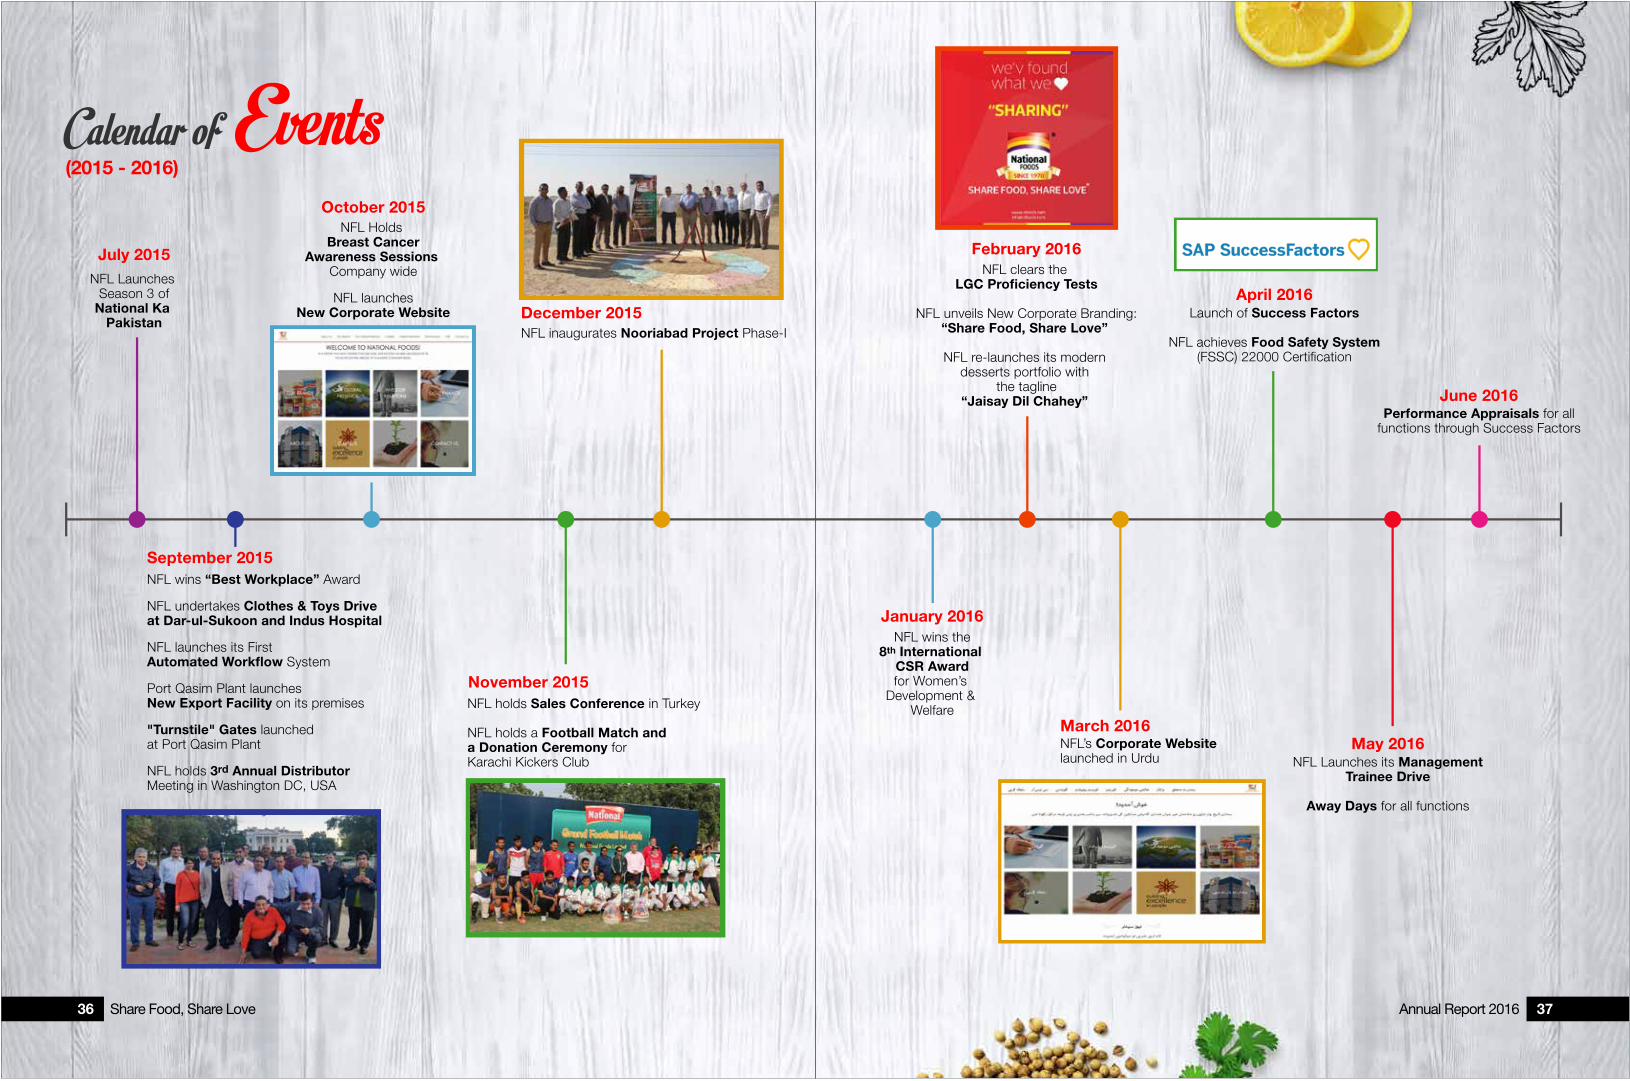
Calendar of Events(2015 - 2016)
December 2015NFL inaugurates Nooriabad Project Phase-I
September 2015NFL wins “Best Workplace” Award
NFL undertakes Clothes & Toys Driveat Dar-ul-Sukoon and Indus Hospital
NFL launches its FirstAutomated Workflow System
Port Qasim Plant launchesNew Export Facility on its premises
"Turnstile" Gates launchedat Port Qasim Plant
NFL holds 3rd Annual DistributorMeeting in Washington DC, USA
July 2015NFL Launches
Season 3 ofNational Ka
Pakistan
October 2015NFL Holds
Breast CancerAwareness Sessions
Company wide
NFL launchesNew Corporate Website
November 2015
NFL holds a Football Match anda Donation Ceremony forKarachi Kickers Club
January 2016NFL wins the
8th International CSR Awardfor Women’s
Development & Welfare
February 2016NFL clears the
LGC Proficiency Tests
NFL unveils New Corporate Branding:“Share Food, Share Love”
NFL re-launches its modern desserts portfolio with
the tagline“Jaisay Dil Chahey”
March 2016NFL’s Corporate Websitelaunched in Urdu
April 2016Launch of Success Factors
NFL achieves Food Safety System(FSSC) 22000 Certi�cation
May 2016NFL Launches its Management
Trainee Drive
Away Days for all functions
June 2016Performance Appraisals for all
functions through Success Factors
NFL holds Sales Conference in Turkey
Annual Report 2016 37Share Food, Share Love36

The year 2015-16 has been a tough year for NFL, strewn with challenging decisions that have paved the way for growth leading to excellent opportunities for the future. The greatest challenge has been in the area of revamping some of our key distributors in both domestic and international markets. As a result, sales achievements were slightly depressed for some time with growth targets not being delivered; mainly due to distributors own limitations. This hard decision to change the distributors has resulted in a temporary supply gap which resulted in the company not meeting its intended budgeted sales targets for the outgoing year. This had become necessary and the change now is expected to realign the potential with the structures thus created. The positive results have already started to come in. Despite this realignment, the company still delivered an excellent revenue growth for the outgoing year.
Sustaining high growth on a year on year basis has resulted in our capacities of various production centers stretched and exhausted on an annual basis. To tackle the increased demand, and in line with our growth plans, a separate plant was inaugurated solely for pickle. This new plant at Nooriabad has three sections: one for pickles, one for salt and the third will act as a centralized warehouse. Similarly, Bhalwal was also launched with the intention of catering to an enhanced product portfolio. With these new plants, comprehensive logistics and supply chain overview has resulted in new arrangements and alignments to drive greater value addition. Existing plants and their performance was augmented in terms of space and processes. An independent export facility was launched at Port Qasim to cater to increasing demand and the need to maintain timely production, for our businesses overseas.
In our quest to implement global best practices, we launched the SAP SUCCESS FACTORS (SF) solutions in order to not only simplify HR management platform but also to aid growth plans through a more robust and integrated performance and support constant technological innovation of processes. With cloud solutions from SAP SF, we expect to drive multifold bene�ts in de�ning an agile process with a focus on driving growth and cost optimization across the business. Efforts to improve operational ef�ciency were further complemented when an automated work�ow system was introduced company-wide which assisted in reducing paper and time when processing any business application or employee related facility such as reimbursements, management leaves, or vehicle requests.
While improvements were continuously made on ground to expedite growth and productivity, similar efforts were made to improve the corporate image of the company. The digital face of National Foods was revamped by introducing a new corporate website, with improved accessibility, speed, content and layout, thus serving as a worthy ambassador of the ever evolving National Foods on the cyber space. We have always believed that product innovation is the lifeblood of our business. We invent brands and products that create and transform lifestyles, and build consumer trial and lead to value creation in those categories for years — often for decades. With rigorous efforts in activating our social media channels we have positively driven our category market growth, creating sustainable image enhancements for our retail customers.
When it comes to giving back to the society, National Foods leaves no stone unturned. This time around, we engaged in community development by providing underprivileged children an opportunity to play football by donating 100 footballs to Karachi Kickers Club. Clothes drives were conducted in old age homes and Indus Hospital to share the festivities of Eid with the old and the forgotten.
This year we would like to dedicate the year’s success of the company solely to the people of National Foods, who have spent their time, effort and energy in bringing this company amongst the top ranked companies of Pakistan and hence closer to achieving our Vision 20/20. We are hopeful and determined to scale newer heights with greater vigor and zest.
To yet another successful year Inshallah…
Abrar HasanCEO
MessageCEO’s
Annual Report 2016 39Share Food, Share Love38

Mr. Abdul Majeed is Co-Founder, Director and Chairman of National Foods Limited and Associated Textile Consultants Private Limited.
As a key leader in NFL, Mr. Abdul Majeed’s experiences have been diverse from the very beginning, adding depth and insight to the culture of the company. After graduating from the F.C. College (a Chartered University), Lahore with a B.Sc. in Physics and Mathematics, he was selected by the British Council for Higher Studies in Textile Engineering. Later on, Mr. Abdul Majeed also completed B.Sc. (Honors) in Technology from Manchester University in 1959.
Today, in addition to playing a vital role in the establishment of NFL as a leading foods company in Pakistan, Mr. Abdul Majeed is also heading Nazaria-e-Pakistan Trust, Sindh and Textile Institute of Pakistan as the Chairman and Chancellor respectively. He is also a Member of the Board of Governors of National Textile University, Faisalabad and has also previously served as a Member of the Federal Textile Board and the Engineering Development Board of the Government of Pakistan.
With a keen interest in continuous innovation, Mr. Abdul Majeed’s contribution has been pivotal in leading the Research & Development team at NFL. He has also been an active member of the Rotary District 3270 in different capacities besides his engagement in other social forums. Moreover, he is also the Vice President Alumni Association of F.C. College, Lahore, Former Board Member of Pakistan Institute of Management and the Society for the Promotion of Arabic, Karachi.
He is a life member of the Arts Council, Karachi and a professional member of World Future Society, Bathesda, USA, along with being a member of the International Geosynthetic Society, USA.
Mr. Abrar Hasan has been with National Foods Limited since 1993, where he was later appointed as Chief Executive by the Board of Directors in the year 2000. Under his inspirational leadership and pro�cient operations management skills, NFL has transformed from a simple recipe producer to a full-�edged foods company. Prior to his joining NFL, Mr. Abrar Hasan was Plant Director at Precision Rubber Products Limited, where he was responsible for overseeing Production and Manufacturing Management.
He was also invited to join the Board of Cherat Packaging Limited as an Independent Director in September 2010.
Mr. Abrar Hasan with his extensive experience and in-depth knowledge has set examples and inspired the NFL team to embrace new technology, discover upcoming marketing trends and invest in human resource development company wide. He is truly the driving force behind his team of skilled professionals at NFL.
Mr. Abrar Hasan graduated with a Bachelor’s Degree in Industrial Management with a minor in Industrial Engineering from Purdue University, Indiana, USA.
Mr. Abrar HasanChief Executive Officer
Mr. Abdul MajeedChairman
ProfileDirectors’Mr. Zahid Majeed joined National Foods Limited in 1987 and pioneered its transformation from a small food enterprise into a leading foods brand in Pakistan. Since then he has served in various capacities at NFL from heading the Corporate Marketing function to most recently establishing the International Business subsidiary, National Foods DMCC. He also introduced the concept of sustainability by establishing a Corporate Social Responsibility (CSR) platform here at NFL. Mr. Zahid Majeed played a signi�cant role in initiating a Public-Private Partnership with UNICEF to launch the �rst Iodized Salt in the mid 1990’s under the CSR umbrella along with various other education, health and nutrition initiatives with focused efforts to address women empowerment.
Mr. Zahid Majeed also heads the Textile, Energy, Environment Business and Investment Divisions within the Associated Textile Consultants Private Limited (ATC).
Mr. Zahid Majeed studied Philosophy, Politics and Economics at Magdalen College, Oxford University and later acquired a Master’s Degree in Textile Technology at University of New South Wales, Australia. Mr. Zahid Majeed also quali�ed for the Certi�cate in Company Direction from the Institute of Directors (IoD), London, an International Certi�cation that proves his commitment to the highest standards of Corporate Governance.
Mr. Zahid MajeedDirector
Mrs. Noreen Hasan graduated in 1991 after completing her Bachelor’s Degree with HONS in “Medieval and Modern World History” from the University of Birmingham, UK; being awarded with two First classes for her dissertation on “The Guatemalan Crisis of 1956 and Anglo American Relations”, it was published by the University.
Mrs. Hasan’s experience is well focused on CSR and philanthropic activities. Her present involvement includes activities for the “Children’s Cancer Foundation Pakistan Trust”. She has actively organized and raised funds on a continuous basis for the Trust which is now af�liated with the Indus Hospital to increase sustainability and awareness. On a smaller scale, Mrs. Hasan has also been involved in various other charity groups some of which include �nancially supporting the Education and Children’s Health Organization (ECHO) Foundations in Gharo and sponsoring underprivileged children for a school in Rashidabad.
Mrs. Noreen HasanDirector
Annual Report 2016 41Share Food, Share Love40

ProfileDirectors’Mrs. Saadia Naveed is the Deputy Managing Director of English Biscuit Manufacturers (Pvt.) Ltd. (EBM). She was also the President of the Management Association of Pakistan (MAP), the �rst ever female President, since June 2013 till March 2015.
Mrs. Saadia Naveed after completing her graduation moved to the �eld of chartered accountancy and was associated with A.F. Ferguson & Co. for over four years, conducting and supervising audits as a senior in various national and multinational organizations.
She joined EBM in the year 2002 and held the challenging position of Director Operations prior to her appointment as Deputy Managing Director in 2008. Under her leadership, EBM has witnessed exponential growth from sales of 11,000 tons in 2001 to 115,000 tons in 2014. The company has also undergone numerous upgrades and expansions in its production capabilities as well as its technical and human resources. Saadia is a true team leader who works closely with Departmental Heads to further improve organizational systems, processes and policies. It is her contribution and sound knowledge of �nance that made EBM a self-suf�cient and debt-free organisation.
As President of MAP also she had contributed signi�cantly to raise the pro�le of what is already one of the most acclaimed management organisations in the country. She focused on creating greater awareness of good management practices, and promoted the recognition of companies who actively engage in them.
Saadia is a great example of a dynamic leader and an inspiration for Pakistani women aspiring to take leadership roles. In 2012, she received Marketing Excellence and Wonder Women of the Year Award for her contributions to business excellence in Pakistan. Soft-spoken and deeply interested in uplifting the lives of those around her, she is a keen supporter of various philanthropic initiatives in addition to her professional role. She is also an active member of several professional organizations including Pakistan Business Council (PBC), Institute of Directors (IOD) London, National Academy of Performing Arts (NAPA), Korangi Association of Trade and Industry, Karachi Chamber of Commerce and Industry, Arts Council of Pakistan and Chairman, AKUH Cancer Society.
Mrs. Saadia NaveedDirector
Mr. Ehsan A. Malik is currently serving as the Chief Executive Of�cer of Pakistan Business Council. From 1st September 2006 to 31 October 2014 Mr. Malik was the Chief Executive Of�cer of Unilever Pakistan Limited and a director of Unilever Pakistan Foods Limited. Prior to this he was Chairman and CEO, Unilever Sri Lanka Limited. His earlier international appointments covered Unilever’s regional business in Egypt, Lebanon, Jordan, Syria and Sudan as well as Unilever’s Head Of�ce in UK. These preceded senior commercial and �nancial roles at Unilever Pakistan. He is also a Member of the Board of Directors of Abbott Laboratories Pakistan Limited and IGI Life Insurance Limited. Mr. Malik is a Fellow of the Institute of Chartered Accountants of England and Wales and alumni of the Wharton and Harvard Business Schools.
Mr. Ehsan Ali MalikDirector
Mr. Ebrahim Qassim joined the Board of Directors of National Foods Limited in 2000. He served at a British Pharmaceutical Company in Pakistan for 3 years at different capacities �nally as Country Manager. Later Mr. Ebrahim Qassim set up his own distribution business by the name of Premier Distributors in 1971, which has now a well-established network throughout Pakistan.
He has also served as a member of the Board of Directors of the Karachi Stock Exchange in the year 2000. Presently, he is on the Board of Directors of English Biscuit Manufacturers (Pvt.) Ltd, Coronet Foods Private Limited and is also the Chairman of Shield Corporation Limited.
A Chartered Accountant by profession, Mr. Ebrahim Qassim has also been part of the National Council of the Institute of Chartered Accountants of Pakistan (ICAP) and the Marketing Association of Pakistan (MAP) in the past.
Mr. Ebrahim QassimDirector
Annual Report 2016 43Share Food, Share Love42

Board CommitteesAudit Committee
The Committee assists the Board in the effective discharge of its responsibilities for corporate governance and �nancial reporting. The Audit Committee comprises of four members, one being independent and all others being Non-Executive Directors. The Chairman of the audit committee is a Non-Executive Director. The brief terms of reference of the audit committee are as follows:
• Review quarterly, half yearly and annual �nancial statements of the company prior to their approval by the Board of Directors;
• Review preliminary announcements of results prior to publication; • At least once a year, meeting external auditors without Director Corporate Finance and
Internal Auditors;• At least once a year, meeting Internal Auditors without Director Corporate Finance and
External Auditors;• Recommend the appointment of external auditors to the Board of Directors and
consider any questions of resignation or removal of external auditors, if any, audit fees, and provision by external auditors of any service in addition to audit of �nancial statements;
• Review management letter issued by the external auditors and management response thereto;
• Determination of appropriate measures to safeguard the Company’s assets; and• Consideration of any other issue or matter as may be assigned to the Committee by the
Board of Directors.
Human Resource and Remuneration Committee
The committee consists of three Non-Executive Directors. The committee is responsible for dealing with matters relating to human resource policies including training, remuneration, performance evaluation and succession planning. The brief term of reference of the Human Resource and Remuneration Committee are as follows:
• Recommending human resource management policies to the board;• Recommending to the board the selection, evaluation, compensation (including
retirement bene�ts) and succession planning of the Chief Executive Of�cer;• Recommending to the board the selection, evaluation, compensation (including
retirement bene�ts) of Director Integrated Supply Chain, Director Corporate Finance, Company Secretary and Head of Internal Audit; and
• Consideration and approval on recommendations of Chief Executive Of�cer on such matters for key management positions who report directly to Chief Executive Of�cer or Director Integrated Supply Chain.
Corporate GovernancePerformance Evaluation of the Board
The Board of Directors’ performance was evaluated by providing all members of the Board with an Evaluation Questionnaire to assess the performance of Board. Furthermore, new members joining the Board were given an orientation pack which included all the necessary information about the Company. The members of the Board were required to �ll an online questionnaire. The evaluation was done on the basis of the effectiveness of the Board’s performance.
CEO Performance Review
The CEO provides an overview of the Company’s performance to the Board and addresses any speci�c questions of the Board members. The performance of the CEO is assessed through the evaluation system set by National Foods Limited. The principle factors of evaluation include �nancial performance, business processes, compliance, business excellence and people management.
Role of Chairman
The Chairman provides leadership and governance to the Board. The Chairman has the responsibility to monitor and ensure the effective functioning of the Board. The Chairman ensures that the Board as a whole plays a full and constructive part in the development and determination of the organization’s strategies and policies. Furthermore, the Chairman also ensures that the organization’s strategies are being implemented effectively. The Chairman conducts the Board meetings and ensures that all directors fully participate in the decision-making procedure of the Board.
Role of Chief Executive
The Chief executive leads the management in the day-to-day running of the organization’s business in accordance with the business plans and within the budgets approved by the Board. The Chief Executive is also responsible for oversight of the directions of the Board, in accordance with the Companies Ordinance, 1984. It is the responsibility of the Chief Executive to ensure that the organization’s resources are allocated ef�ciently.
Annual Report 2016 45Share Food, Share Love44

Mr. Abrar HasanChief Executive Of�cer
Mr. Gabriel CraveroDirector Corporate Finance
CommitteeManagementSitting from left to right
Mr. Farhan Irfan SiddiqiDirector Sales & Marketing
Ms. Saira A. KhanGeneral Manager HR,Admin, IR & Security
Mr. Shakaib ArifDirector Integrated Supply Chain
Standing from left to right
Mr. Kamal BaigChief Executive Of�cer (NF DMCC)

Sustainability We believe in sharing prosperity with all our stakeholders, be it consumers, suppliers, our employees and the society at large. Sustainability at NFL covers our extensive CSR initiatives, our efforts to create a healthy, safe and secure environment for our employees and in protecting our planet.
Football Donation and Match
In collaboration with Mac-Millar and The Rotary International, we donated 100 footballs to the young players of Karachi Kickers Club, who hail from less privileged areas of Karachi and have a passion for playing football. Following the donation, a friendly match was organized between our employees and the young players of Karachi Kickers Club.
Clothes and Toys Drive
Passionate about philanthropy, our employees volunteered to conduct a “Clothes drive” a week before Eid-ul-Fitr and distributed clothes to deserving people residing atDar-ul-Sukoon (an old age home). A total of 20 cartons of clothes were gifted to these people. Similarly, a clothes and toys drive was conducted at Indus Hospital at their Pediatric and General ward where our employees engaged with the patientswholeheartedly.
Let’s Go Pink Again-Breast Cancer Awareness Session
Breast cancer awareness sessions in collaboration with Shaukat Khanum Memorial Cancer Hospital were organized at 3 of our locations raising awareness amongst our employees on breast cancer symptoms, risks and treatment. Dr. Najeeb Niamatullah, a Consultant Oncologist at Liaquat National Hospital, gave a detailed lecture to the participants on the symptoms of breast cancer, importance of doing self-checks and early detection, and maintaining healthy lifestyles.
Blood Drives
Blood drives were conducted at Site plant in collaboration with Indus Hospital. Indus Hospital organized a detailed orientation and sensitization session prior to the blood donation to enlighten all the employees on the bene�ts of giving blood.
ResponsibilityCorporate Social
Medical Facilities
A successful organization knows the value of a positive, safe culture for its employees. Keeping this in mind, we launched a new in-house clinic at Gujranwala plant which is well equipped and has a quali�ed dispenser as well. Furthermore, bene�ts (like Maternity leave, Room Limits etc.) for all employees were signi�cantly improved at all locations. OPD tests such as Malaria tests and Complete Blood Count (CBCs) tests were conducted at a 20% discount for all dependents of NFL family.
Worker’s Canteen
In terms of providing the best services and environment for its workers, we launched a workers canteen in Gujranwala with not only subsidized rates but also healthy and hygienic food for our staff. Worker’s canteen at Site plant was also revamped.
Safety Trainings
We believe and strive for “Zero Injury” in all our operations. Keeping in mind the importance of maintaining safety, we conducted safety trainings for all our employees. A training session on “Emergency Handling & Fire�ghting” was conducted with the help of Rescue 1122 (Emergency Response Service) at the Gujranwala factory. The drill prepared all the employees on the essentials of �re�ghting.
Security
Security of our employees and our premises is of prime importance. Efforts were taken throughout the year to ensure that there were armed security personnel at all plants. Access Control Management System was also established at both PQ Plant and Forum of�ce which was effectively utilized for controlling access, visitor management, time management as well as monitoring headcount during any emergency situation. Furthermore, a centralized monitoring system was established with a Master Control Center which aides in clock monitoring, recording and reporting of all facilities.
Safety and SecurityOccupational Health,
Annual Report 2016 49Share Food, Share Love48
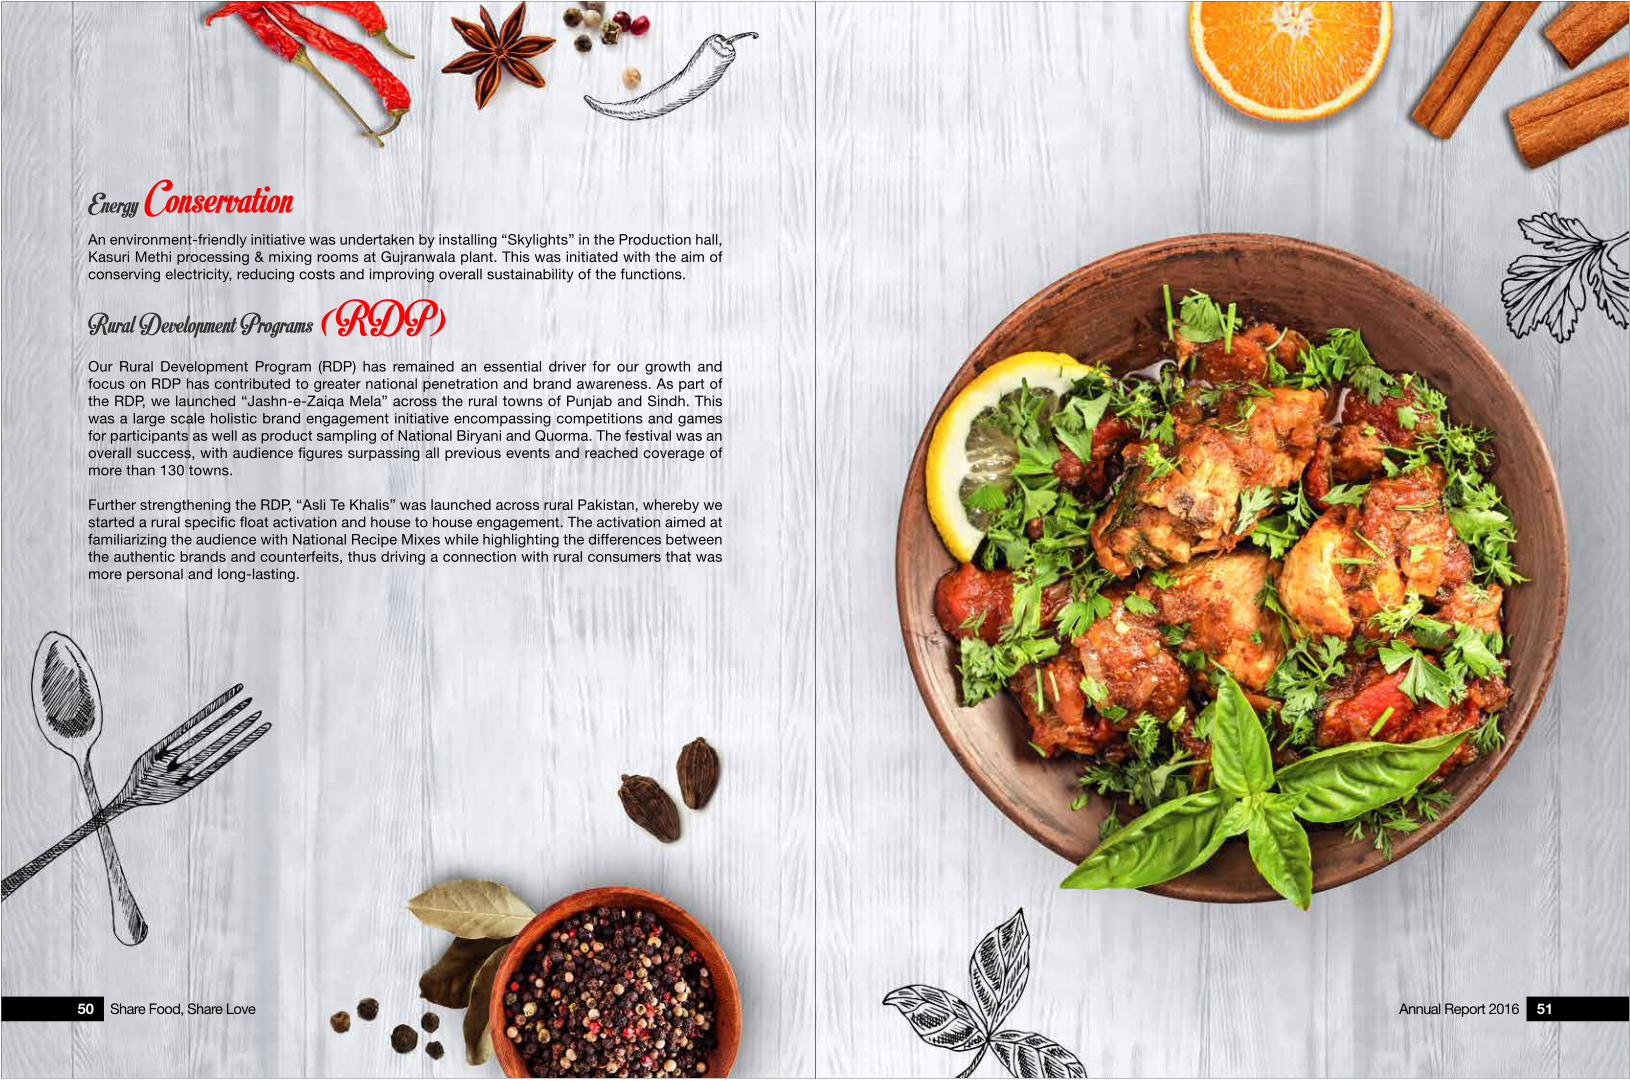
( RDP)Our Rural Development Program (RDP) has remained an essential driver for our growth and focus on RDP has contributed to greater national penetration and brand awareness. As part of the RDP, we launched “Jashn-e-Zaiqa Mela” across the rural towns of Punjab and Sindh. This was a large scale holistic brand engagement initiative encompassing competitions and games for participants as well as product sampling of National Biryani and Quorma. The festival was an overall success, with audience �gures surpassing all previous events and reached coverage of more than 130 towns.
Further strengthening the RDP, “Asli Te Khalis” was launched across rural Pakistan, whereby we started a rural speci�c �oat activation and house to house engagement. The activation aimed at familiarizing the audience with National Recipe Mixes while highlighting the differences between the authentic brands and counterfeits, thus driving a connection with rural consumers that was more personal and long-lasting.
An environment-friendly initiative was undertaken by installing “Skylights” in the Production hall, Kasuri Methi processing & mixing rooms at Gujranwala plant. This was initiated with the aim of conserving electricity, reducing costs and improving overall sustainability of the functions.
Energy Conservation
Rural Development Programs
Annual Report 2016 51Share Food, Share Love50

Directors’ Report
Annual Report 2016 53Share Food, Share Love52

Fellow shareholdersThe Directors of National Foods Limited (NFL) are pleased to present the �nancial statements of the Company for the year ended June 30, 2016.
Economic and Business OverviewThe world economic scenario continued the bearish trend in all major economies, including China. Oil continued losing value from $55/barrel a year ago to $48/barrel in June 2016, hitting lows of around $35/barrel, which has continued to affect the oil dependent economies of the world.
Pakistan is undergoing structural changes to consolidate its economy, largely dominated by IMF terms. It has shown a record growth rate of +4%, with in�ation and discount rates at 2.9% and 6.25% respectively. However, the private sector investments have not shown an encouraging response. This has been largely an effect of �scal measures somewhat detrimental to the business environment. The power generation could not cope with the positive growth in demand and despite the historically low international oil prices, the bene�ts have not been fully passed through, thus affecting not only the cost of doing business but also the purchasing power of the general consumers. The FY16 Pro�t After Tax reached 5.9% of net sales, 2.6pt lower than last year. This was mainly due to higher raw material costs and investments in the commercial structure made to support growth. The material costs increased versus the last year primarily driven by chilli, pepper, garlic and coriander, negatively affected by weather conditions. The competitive landscape did not allow a proportional pass through of these costs, but as in the past further material price �uctuations can be expected that could lead to lower prices.
The commercial structures were engineered for a 25% Revenue growth in FY16, including new staff and new categories. However, the Company managed to grow only by 17.6% and this 7.4% missing sales are allocated as follows:
The Company’s performance was also impacted by changes in distributors both in the local and international markets. During the year, the Company replaced one local regional distributor and two international due to their non-performance against the given targets.
Key Category ReviewThe drive in the volume was sustained through aggressive marketing and trade marketing activities piloted during the year. Various activations, airing and promotions were steered for the key categories of the business like:
- A new TVC for Recipe category was aired during the year that focused on the spirit of brand and its relationship with the consumer;
- The 3rd season of successful series of “National ka Pakistan” was aired during the �rst half of the year.
- Madeeasy.com.pk is NFL’s �rst consumer centric website that offers hundreds of recipes, culinary tips and quick meals ideas to choose from. An airing for the same was done during the �rst half to build the corporate image of the Company while promoting the entire range of categories.
- Airing of the Dessert category “Jaisay Dil Chahey” was done during the third quarter to create the awareness and associations of consumers with National Foods’ Desserts.
- ‘National Ketchup Zarori’ and ‘Chatkharon ki Chakachak’ for Ketchup and Pickle respectively, kept adding
spark of taste and tanginess during the year.
- Rural market development continued with 2nd round of National Jashn-e-Zaiqa Mela which generated a lot of trial and interest to strengthen the brand image in this segment of consumer as well.
ExportsThe past �scal year has revolved around strengthening and investing in human capital and building international structure by deploying resources in key strategic markets. The Company faced some challenges, including distribution transitions in Afghanistan, political elements and currency devaluation in various markets including Australia, Canada and UK. However, with the corrective actions in place, the next Fiscal Year is expected to be an important year for the growth in exports. Overall, the International Division has made a sizeable contribution of 10.5% to the Pro�t After Tax, which originated from sales of over 1.4 billion PKR. During the year new Recipe and Rice variants were launched that were appreciated thoroughly by the consumers. Focused marketing activities were executed in various regions, including USA, UK and UAE to create awareness and trial generation of key categories; Recipe, Pickles and Sauces. During the year, the Company was present in major trade fairs, including Gulf Food 2016 (UAE), National Restaurant Association Show in Chicago and Fancy Foods in New York. These initiatives have allowed the Company to generate new distribution leads and explore potential business opportunities. The Company held the third North American distributor conference in Washington DC, where distributors from the region along with the Senior Management of the Company focused on the current and future outlook of the North American region.
Our PeopleKnowing that our people make all the difference, we endeavor to constantly attract, hire, train, retain, develop and motivate high quality talent. Together we combine our strengths and skills to build our competitive edge and this allows us to continue our legacy of excellence. An important element of our success is the sense of ownership that our employees have. We ensure this by aligning the goals of our organization with those of our workforce. Interactive sessions are held frequently in order to maintain their motivational level. Smooth communication is recognized as an integral element and is therefore encouraged to facilitate smooth �ow of information across the organization. In NFL, we believe in diversity, and have instigated a strict non-discrimination policy that further sets us apart as a company ardent about crafting a progressive and just atmosphere at all levels. These determined efforts have allowed us to continue our focus on creation of a highly passionate and dynamic team which critically contributes to our bottom-line growth with its insistent quest for excellence, and drive for success.
ReportDirectors’
Local sales (5.5)%
Deferment of new category launch, change of one regional distributor, price and volume impacts
International sales (1.9)%
Mainly due to change of distributors (1%) and inaccessibility of some markets in Middle East and Africa (0.5%)
(7.4)%Total revenue shortfall against budget
Annual Report 2016 55Share Food, Share Love54

In line with strengthening our structures, developing employees’ career streams and encouraging multi-generational workforce, that is fully aligned to the external environment, we have been participating and using the Mercer system of evaluation and surveys, to guide and determine our Compensation and Bene�ts Philosophy, leading to a more robust and transparent system of reward and growth. Another key initiative launched in September 2015 was the “Sales Incentive Plan” (SIP) which is closely aligned to our Pay for Performance Philosophy. SIP is designed to recognize, reward and compensate our Field Sales Force in line with the sales objectives and strategy, playing a vital role in highlighting and acknowledging our high performers whilst raising their motivation levels. It is yet another step towards developing rewards and appreciation for individuals based purely on performance.
With many such projects in the pipeline, we are con�dent that NFL will continue to live its purpose-inspired growth strategy to serve its valued customers for years to come.
Corporate SustainabilityNFL has an unshakable commitment towards improving the life of our stakeholders, and above all that of our host communities. We contributed over 10.5 million PKR under our Corporate Social Responsibility (CSR) program. We successfully managed to run various programs with focus on empowering women through education, institutionalizing the importance of health and nutrition and various other community development programs.
Aagahi Adult Literacy Program, since a decade, is one of our pioneer CSR initiatives, which has positively affected the lives of thousands of women across Pakistan. Furthermore, NFL runs various differentawareness drives from time to time highlighting a wide array of health and nutrition related issues, with the recent focus being on Breast and Lung cancer. This year NFL collaborated with Mac-Miller and Rotary International to donate footballs to young players of Karachi Kickers Club to promote young children of less privileged areas. Further, our continual drive of ‘Saaf Pani Sehat Mand Zindagi’ provided over 450,000 liters of clean drinking water to our employees.
Business Ethics and Anti-Corruption MeasuresAlong with good corporate governance, ethical behavior is a fundamental part of NFL. Treating stakeholders fairly is considered as an essential part of our success therefore we follow a strict and unwavering code of ethics and conduct. These codes are reinforced time and again in our employees through the clearly rolled out guidelines provided by the board.
Contribution to National ExchequerDuring the year, the contribution to the National Exchequer has further increased and the Company paid over 3,124 million PKR (2015: 2,428 million PKR) to the government and its various agencies on account ofdifferent government levies, including custom duty, sales tax and income tax. Moreover, foreign exchange of 1,072 million PKR (2015: 1,195 million PKR) was also generated through export of products which further re�ects our contribution in the national economy.
DividendThe Board of Directors has recommended �nal cash dividend of Rs. 2.75 per share. Total pro�t distributed by way of dividend amounts to 37% (2015: 104%) of the corporate pro�t.
COMPLIANCE WITH CODE OF CORPORATE GOVERNANCEThe managerial objective of NFL is good corporate governance and compliance with best practices. As required under the listing rules the Code of Corporate Governance (Code) issued by Securities & Exchange Commission of Pakistan, the Company has adopted the Code in letter and spirit as follows:
• The �nancial statements, present fairly the state of affairs of the Company, the results of its operations, cash �ows and changes in equity.
• Proper books of account of the Company have been maintained.
• Appropriate accounting policies as stated in the notes to the �nancial statements have been consistently applied in preparation of �nancial statements and accounting estimates are based on reasonable and prudent judgment.
• International Financial Reporting standards as applicable in Pakistan have been followed in preparation of �nancial statements and any departure therefrom has been adequately disclosed.
• The system of internal control is sound in design and has been effectively implemented and monitored. The Board has constituted an Audit Committee consisting of four members, including Chairman of the Committee. The Chairman of Audit Committee is a non-executive director and the Committee regularly meets as per requirements of the Code.
• There has been no material departure from the best practices of corporate governance, as detailed
in the listing regulations.
• There are no signi�cant doubts upon the Company’s ability to continue as a going concern.
• The outstanding duties, statutory charges and taxes, if any, have been duly disclosed in the �nancial statements.
• A statement regarding key �nancial data for the last six years is annexed to this report.
• The value of investments of Provident Fund based on unaudited accounts was 251 million PKR.
• During the last business year six meetings of the Board of Directors were held. Attendance by each Director was as follows:
Annual Report 2016 57Share Food, Share Love56

In the past days the Company has received a notice from a shareholder, under section 253(1) of the Companies Ordinance, 1984 proposing the appointment of M/s KPMG Taseer Hadi & Co. Chartered Accountants as external auditors for the �scal year ending June 30, 2017. The Audit Committee and the Board, recognizing the good practice of audit �rms rotation, have endorsed such request with a recommendation to the forthcoming Annual General Meeting of the Company.
The Board of Directors, the Audit Committee and the Managers express their gratitude to M/s A.F. Ferguson & Co. for its substantial contribution in these last twelve years that have witnessed the formidable expansion of National Foods.
FUTURE OUTLOOK
NFL continues to follow a focused approach to aggressively grow the business by driving volumes and reaping the bene�ts of high scale. The results of FY16 evidently show the success of the same enabling a volume driven double digit growth. The management is con�dent that the Company will be able to progress on the growth trajectory in the upcoming years as well. Further, the management is consistently putting in efforts to discover new areas, sectors and markets that can supplement the growth ambitions. We are assertive that National Foods will continue to live its purpose and to bring the affordable and nutritious products that guarantee wholesome goodness to its consumers.
ACKNOWLEDGEMENT
The Board would like to convey its earnest gratitude to all the people involved with NFL for enabling it to �ourish and deliver a consistent performance over the last �ve years. Our people are unswerving to the welfare of the Company and have showed their potential by surmounting the numerous dif�culties posed by the operating environment. We treasure their dedication and feel highly obliged.
On behalf of the Board of Directors
A. MajeedChairman
Karachi
PATTERN OF SHAREHOLDING
The pattern of shareholding of the Company is annexed to the report.
Sale and purchase of shares by Directors and their spouses during the year:
Name Number of shares Date of Sale/Purchase
Mrs. Noreen Hasan 700 (purchase) December 2, 2015Mr. Ehsan Ali Malik 500 (purchase) May 27, 2016
INTERNAL AUDITORSThe Audit Committee suggested to the Board of Directors to reappoint Messrs. Ernst & Young Ford Rhodes Sidat Hyder & Co., Chartered Accountants, as internal auditors of the Company which they did in their meeting held on August 25, 2016.
EXTERNAL AUDITORSNational Foods’ auditors, M/s A.F. Ferguson & Co., have completed their twelfth consecutive engagement for the year ended June 30, 2016 and as in previous years, have once more indicated their consent to continue for another period.
* Retired on October 21, 2015.** Elected on October 21, 2015*** Elected on October 21, 2015 and resigned on May 26, 2016.**** Appointed on the casual vacancy on May 27, 2016.
Mr. A. Majeed 6 6 -
Mr. Abrar Hasan 6 6 -
Mr. Waqar Hasan * 2 0 2
Mr. Zahid Majeed 6 6 -
Mr. Ebrahim Qasim 6 6 -
Mr. Khawaja Munir Mashooqullah * 2 1 1
Mr. Iqbal Alimohamad * 2 0 2
Mrs. Noreen Hasan ** 4 4 -
Mrs. Saadia Naveed ** 4 4 -
Mr. Imran Ali Khan *** 3 1 2
Mr. Ehsan Ali Malik **** 1 1 -
No. of Board Meetings
Entitled to attend Attended Leave GrantedName of DirectorsSr. #
1
2
3
4
5
6
7
8
9
10
11
Annual Report 2016 59Share Food, Share Love58

Financial Review
Annual Report 2016 61Share Food, Share Love60

DuPont Analysis
70% Tax Burden
94% Interest Burden
9% Operating Margin
2.17 Asset Turnover
2.31 Leverage Ratio
30% Return on Equity
2016
69% Tax Burden
97% Interest Burden
13% Operating Margin
2.20 Asset Turnover
2.12 Leverage Ratio
40% Return on Equity
2015
Financial Ratios
Profitability Ratios Gross Pro�t Ratio % 32.21 34.88 35.05 34.61 32.52 28.51 Operating Pro�t to Sale % 8.95 12.69 11.51 12.33 12.66 8.83 Net Pro�t to Sales % 5.87 8.58 7.29 7.88 8.14 4.18 EBITDA Margin to Sales % 10.60 14.37 13.09 13.68 14.02 10.62 Operating Leverage Ratio % (142.80 ) 163.60 45.35 84.10 288.57 385.63 Return on Equity % 29.53 40.02 36.55 43.96 50.28 27.70 Return on Capital Employed % 43.29 56.28 53.82 63.51 67.55 48.17 Return on Assets % 11.77 17.89 14.22 15.84 18.46 8.08 Liquidity Ratios Current Ratio Times 1.11 1.46 1.39 1.28 1.33 1.23 Quick / Acid Test Ratio Times 0.30 0.62 0.54 0.50 0.39 0.20 Cash to Current Liabilities Times (0.21 ) (0.09 ) (0.18 ) 0.01 (0.01 ) (0.18 )Cash Flow from Operations to Sales % 3.31 11.18 5.63 4.21 14.91 7.65 Working Capital Turnover Times 28.83 9.30 9.51 12.32 12.97 14.20 Activity / Operating Performance Ratios No. of Days in Inventory Days 112.41 108.44 119.59 113.32 124.12 149.57 No. of Days in Receivables Days 29.78 30.69 27.19 20.10 14.68 17.88 No. of Days in Payables Days 13.37 17.04 15.33 16.94 24.74 28.89 Operating Cycle Days 128.82 122.08 131.45 116.48 114.07 138.56 Asset Turnover Times 2.17 2.20 2.11 2.31 2.38 2.00 Inventory Turnover Times 3.25 3.37 3.05 3.22 2.94 2.44 Receivables Turnover Times 12.26 11.89 13.43 18.16 24.86 20.42 Payables Turnover Times 27.30 21.42 23.82 21.55 14.75 12.63 Investment / Market Ratios Earnings Per Share Rs. 7.47 9.59 6.84 6.50 5.63 2.23 Price Earning Ratio Times 37.63 35.43 58.60 27.72 17.06 16.85 Dividend Yield Ratio % 0.98 2.94 1.00 2.77 3.12 3.33 Dividend Payout Ratio % 36.83 104.28 58.49 76.88 53.29 56.16 Dividend Cover Ratio Times 2.72 0.96 1.71 1.30 1.88 1.78 Cash Dividend Per Share Rs. 2.75 10.00 8.00 7.50 6.00 2.50 Cash Dividend % 55.00 200.00 80.00 75.00 60.00 25.00 Stock Dividend Per Share Rs. - - - - - - 2.50 - - - - Stock Dividend % - - - - - - 25.00 - - - - Market Value Per Share at the end of the year Rs. 281.00 339.73 801.43 360.65 192.14 75.00 Low during the year Rs. 276.50 318.12 302.25 187.80 57.21 39.01 High during the year Rs. 366.65 433.73 801.43 391.40 220.99 88.00 Breakup Value Per Share without Surplus on Revaluation of Fixed Assets Rs. 23.97 26.61 42.62 40.27 33.72 22.27 Market Capitalisation (in millions) Rs. 29,113.51 35,198.34 41,516.80 14,946.33 7,962.81 3,108.00 Capital Structure Ratios Financial Leverage Ratio % 52.80 13.93 43.20 56.99 36.38 102.33 Weighted Average Cost of Debt % 7.89 5.51 9.02 10.01 9.53 11.12 Debt to Equity Ratio % - - - - - - - - - - 18.39 Interest Coverage Ratio Times 17.51 39.43 12.80 14.08 12.77 3.88 No. of Ordinary Shares (in millions) EA 103.61 103.61 51.80 41.44 41.44 41.44
2011201220132014Unit 20152016
Annual Report 2016 63Share Food, Share Love62

Horizontal Analysis
INCOME STATEMENT Sales 13.83% 19.09% 13.80% 19.21% 29.85% 22.96%Cost of sales 18.51% 19.41% 13.02% 15.53% 22.56% 24.77%Gross pro�t 5.10% 18.49% 15.27% 26.86% 48.11% 18.63%Administrative expenses 10.25% 32.03% 31.94% 29.37% 13.29% 9.39%Distribution costs 19.80% 9.41% 18.32% 36.81% 33.97% -2.61%Other expenses -19.08% 32.40% 9.93% 9.09% 132.04% 89.46%Finance costs 80.68% -57.41% 16.95% 5.33% -43.48% 26.50%Other income -50.12% 57.37% 6.26% 56.47% 254.74% -48.04%Pro�t before taxation -22.36% 38.74% 5.44% 17.08% 131.17% 127.26%Taxation -22.89% 35.47% 6.09% 20.66% 92.88% 80.60%Pro�t after taxation -22.13% 40.24% 5.15% 15.52% 152.94% 166.40% BALANCE SHEET Issued, subscribed and paid-up capital 0.00% 0.00% 25.00% 0.00% 0.00% 0.00%Unappropriated pro�t -12.20% 32.49% 34.73% 27.63% 93.31% 55.22%Share capital and reserves -9.91% 24.86% 32.31% 19.44% 51.41% 24.38%Long term obligations -16.24% -21.95% 3.11% 24.53% -55.59% 140.23%Total long term liabilities and shareholder equities -10.16% 21.99% 30.05% 19.82% 28.34% 38.81% Fixed Assets, CWIP and Intangibles 32.17% 22.05% 19.02% 12.67% 21.47% -4.53%Other Non current assets -5.70% 23.47% 24.02% 647.08% 32.69% -2.86%Current Assets 13.31% 7.63% 16.35% 42.54% 6.55% 11.77%Total Assets 18.37% 11.49% 17.10% 34.65% 10.68% 6.74%less: Current Liabilities and Provisions 48.85% 2.10% 7.53% 48.23% -1.69% -8.13%Net Assets -10.16% 21.99% 30.05% 19.82% 28.34% 38.81%
20112012201320142016%
2015%%%%%
Vertical Analysis
INCOME STATEMENT
Sales 100.00% 100.00% 100.00% 100.00% 100.00% 100.00%Cost of sales 67.79% 65.12% 64.95% 65.39% 67.48% 71.49%Gross pro�t 32.21% 34.88% 35.05% 34.61% 32.52% 28.51%Administrative expenses 3.84% 3.96% 3.57% 3.08% 2.84% 3.26%Distribution costs 19.11% 18.15% 19.76% 19.01% 16.56% 16.05%Other expenses 0.74% 1.04% 0.94% 0.97% 1.06% 0.59%Finance costs 0.51% 0.32% 0.90% 0.88% 0.99% 2.28%Other income 0.42% 0.97% 0.73% 0.78% 0.60% 0.22%Pro�t before taxation 8.43% 12.37% 10.61% 11.46% 11.67% 6.55%Taxation 2.57% 3.79% 3.33% 3.57% 3.53% 2.38%Pro�t after taxation 5.87% 8.58% 7.29% 7.88% 8.14% 4.18%
BALANCE SHEET Issued, subscribed and paid-up capital 20.09% 18.05% 22.02% 22.91% 27.45% 35.23%Unappropriated pro�t 76.24% 78.01% 71.83% 69.34% 65.09% 43.21%Share capital and reserves 96.33% 96.07% 93.85% 92.25% 92.54% 78.44%Long term obligations 3.67% 3.93% 6.15% 7.75% 7.46% 21.56%Total long term liabilities and shareholder equities 100.00% 100.00% 100.00% 100.00% 100.00% 100.00% Fixed Assets, CWIP and Intangibles 79.83% 54.27% 54.24% 59.26% 63.02% 66.58%Other Non current assets 2.43% 2.32% 2.29% 2.40% 0.38% 0.37%Current Assets 172.76% 136.98% 155.25% 173.53% 145.87% 175.70%Total Assets 255.02% 193.57% 211.79% 235.19% 209.28% 242.65%less: Current Liabilities and Provisions 155.02% 93.57% 111.79% 135.19% 109.28% 142.65%Net Assets 100.00% 100.00% 100.00% 100.00% 100.00% 100.00%
2011 2012201320142016%
2015%%%%%
Current Liabilites & Provisions Shareholders' Equity Non Current Liabilities
BALANCE SHEET ANALYSIS - EQUITY & LIABILITIES
2016
2015
2014
2013
2012
2011 1678 923 254
1650 1397 113
2446 1669 140
2630 2208 145
2685 2757 113
3997 2484 95 2016
2015
2014
2013
2012
2011 783 2067 4
951 2202 5
1072 3139 43
1276 3652 54
1557 3931 66
2058 4454 62
BALANCE SHEET ANALYSIS - ASSETSCurrent Assets Fixed Assets & CWIP Other Non current assets
Annual Report 2016 65Share Food, Share Love64

Six Year Cash Flows Using Direct Method
Cash received from customers 10,138,770 11,250,248 9,580,776 8,182,818 7,167,351 5,486,088 Cash paid for goods & services (9,412,323 ) (9,702,456 ) (8,767,930 ) (7,405,406 ) (5,785,854 ) (4,836,013 ) Cash generated from operations 726,447 1,547,792 812,846 777,412 1,381,497 650,075 Financial cost paid (60,884 ) (46,090 ) (99,708 ) (63,287 ) (84,768 ) (128,298 )Net increase in long term deposits 3,789 (12,643 ) (10,429 ) (5,884 ) (1,432 ) 129 Retirement bene�t obligation (23,876 ) (61,382 ) (3,811 ) (4,113 ) (4,536 ) (10,707 )Income tax refund / (paid) (208,625 ) (132,640 ) (151,202 ) (344,466 ) (221,995 ) (88,606 ) Net cash flow from operating activities 436,851 1,295,037 547,696 359,662 1,068,766 422,593 Purchase of property, plant & equipment (684,084 ) (467,720 ) (346,450 ) (216,616 ) (265,585 ) (63,625 )Purchase of intangible assets (46,958 ) (22,740 ) (21,212 ) (21,848 ) (3,525 ) (250 )
Sale proceeds from disposal of property, plant and equipment 21,767 29,988 7,761 4,590 5,932 8,868Sale proceeds of open ended mutual fund units 546,048 884,555 50,000 423,992 253,465 - - Purchased of open ended mutual fund units (150,000 ) (777,988 ) (150,000 ) (460,000 ) (490,000 ) - - Investment in National Foods DMCC, Dubai UAE - - - - - - (31,719 ) - - - - Purchase of treasury bills (147,810 ) - - - - - - - - - - Proceeds from sale of treasury bills 148,731 - - - - - - - - - - Net cash flow from investing activities (312,306 ) (353,905 ) (459,901 ) (301,601 ) (499,713 ) (55,007 ) Short term borrowings obtained 1,000,000 508,696 550,000 655,000 180,000 1,001,788 Repayment of short term borrowings (700,000 ) (808,722 ) (980,000 ) (280,000 ) (131,239 ) (1,150,302 )Decrease in long term �nancing - net - - - - - - - - (214,000 ) 154,000 Decrease in liabilities against assets subject to �nance lease - net - - - - - - - - (2,343 ) (10,155 )Dividend paid (1,031,839 ) (412,814 ) (166,781 ) (390,202 ) (103,239 ) (49,478 ) Net cash flow from financing activities (731,839 ) (712,840 ) (596,781 ) (15,202 ) (270,821 ) (54,147 ) Net cash flows (607,294 ) 228,292 (508,986 ) 42,859 298,232 313,439
2011 2012201320142016 2015(Rupees in thousand)
Summary of Cash Flow Statement
(Rupees in Millions)
Cash �ows from/ (used in) operating activities 437 1,295 548 360 1,069 423
Cash �ows used in investing activities (312 ) (354 ) (460 ) (302 ) (500 ) (55 )
Cash �ows (used in) �nancing activities (732 ) (713 ) (597 ) (15 ) (271 ) (54 )
Net increase / (decrease) in cash and cash equivalents (607 ) 228 (509 ) 43 298 314
Cash and cash equivalents at the beginning of the year (247 ) (475 ) 34 (9 ) (307 ) (621 )
Cash and cash equivalents at the end of the year (854 ) (247 ) (475 ) 34 (9 ) (307 )
2011 2016 2012 20132014 2015
(1,000)
(500)
-
500
1,000
1,500
2016 2015 2014 2013 2012 2011
Cash �ows used in investing activities Cash �ows (used in) �nancing activities Cash �ows from/ (used in) operating activities
Annual Report 2016 67Share Food, Share Love66

Statement of Value Added and its DistributionCombined Pattern of CDC & Physical Shareholdings as at June 30, 2016
Pattern of Shareholding
Categories of Shareholders Shareholders Percentage
Directors and their spouse(s) and minor children Abdul Majeed 1 3,959,974 3.82 Abrar Hasan 1 10,218,262 9.86 Zahid Majeed 1 6,101,662 5.89 Ebrahim Qassim 1 1,763,566 1.70 Noreen Hasan 1 19,700 0.02 Saadia Naveed 1 673,350 0.65 Ehsan Ali Malik 1 500 0.00 Associated Companies, undertakings and related parties Associated Textile Consultants (Pvt) Ltd 1 34,357,724 33.16 Executives - - - - - Public Sector Companies and Corporations 2 1,000,674 0.97 Banks, development finance institutions, non-banking finance companies, insurance companies, takaful, modarabas and pension funds 8 106,574 0.10 Mutual Funds CDC - Trustee Akd Index Tracker Fund 1 10,000 0.01 CDC - Trustee First Capital Mutual Fund 1 3,400 0.00 General Public a. Local 2029 29,243,539 28.23 b. Foreign 1 500 0.00
Foreign Companies 7 16,044,150 15.49 Others 28 103,283 0.10
Totals 2085 103,606,858 100.00
Shares Held
Shareholders holding 5% or more Percentage
Associated Textile Consultants (Pvt) Ltd 34,357,724 33.16 Kingsway Fund-frontier Consumer Franchises 13,675,100 13.20 Khawar M. Butt 12,729,454 12.29 Abrar Hasan 10,218,262 9.86 Zahid Majeed 6,101,662 5.89
Shares Held
Value Addition
Revenue 13,183,185 99.6 11,581,436 99.0
Other Income 55,850 0.4 111,965 1.0
Total 13,239,035 100 11,693,401 100
Value Distribution
Cost of sales 8,187,337 61.8 7,093,902 60.7
Distribution expense 2,070,468 15.6 1,751,175 15.0
Administration, CSR and other
operating expense 357,881 2.7 346,106 3.0
Employees Remuneration 1,444,058 10.9 1,032,696 8.8
Finance cost 67,338 0.5 37,269 0.3
Income tax 338,277 2.6 438,690 3.7
Dividend to shareholders 284,919 2.2 1,036,069 8.9
Pro�t retained for Investment and
future growth 488,757 3.7 (42,506 ) (0.4 )
Total 13,239,035 100.0 11,693,401 100.0
(Rupees in thousand)
2016%
2015(Rupees in thousand) %
2016 2015
Profit retained for Investmentand future growth
Dividend to shareholders
Income tax
Finance cost
Employees Remuneration
Administration, CSR and otheroperating expense
Distribution expense
Cost of sales
Profit retained for Investmentand future growth
Dividend to shareholders
Income tax
Finance cost
Employees Remuneration
Administration, CSR and otheroperating expense
Distribution expense
Cost of sales
60.7%15.0%
3.0%
8.8%0.3%
3.7% 8.9% (0.4)%
61.8%15.6%
2.7%
10.9%2.6%0.5%
2.2% 3.7%
Annual Report 2016 69Share Food, Share Love68

Number of Share Holders
Shareholdings' Slab Total Shares Held
718 1 to 100 32,253 637 101 to 500 182,677 223 501 to 1000 173,381 292 1001 to 5000 710,805 90 5001 to 10000 669,744 40 10001 to 15000 480,686 16 15001 to 20000 291,272 8 20001 to 25000 180,800 3 25001 to 30000 81,674 6 30001 to 35000 195,260 3 35001 to 40000 119,952 3 40001 to 45000 126,954 4 45001 to 50000 191,054 10 50001 to 55000 518,506 1 75001 to 80000 78,700 1 80001 to 85000 81,842 1 150001 to 155000 154,564 1 225001 to 230000 230,000 1 320001 to 325000 321,730 1 405001 to 410000 409,180 3 425001 to 430000 1,288,352 1 435001 to 440000 440,000 1 535001 to 540000 535,040 1 620001 to 625000 624,000 3 670001 to 675000 2,020,050 1 705001 to 710000 706,450 1 745001 to 750000 747,016 1 825001 to 830000 826,740 1 845001 to 850000 846,000 1 995001 to 1000000 1,000,000 1 1115001 to 1120000 1,116,728 1 1175001 to 1180000 1,175,800 1 1215001 to 1220000 1,218,750 1 1250001 to 1255000 1,252,514 1 1760001 to 1765000 1,763,566 1 1770001 to 1775000 1,772,642 1 3955001 to 3960000 3,959,974 1 6100001 to 6105000 6,101,662 1 10215001 to 10220000 10,218,262 1 12725001 to 12730000 12,729,454 1 13675001 to 13680000 13,675,100 1 34355001 to 34360000 34,357,724 2085 103,606,858
FOR THE YEAR ENDED JUNE 30, 2016Pattern of CDC & Physical Shareholdings as at June 30, 2016
Pattern of ShareholdingStatement of Compliance with the Code ofCorporate Governance
This statement is being presented to comply with the Code of Corporate Governance (CCG) contained in regulation No.5.19 of the Pakistan Stock Exchange Limited Regulations, for the purpose of establishing a framework of good governance,whereby a listed company is managed in compliance with the best practices of corporate governance.
The Company has applied the principles contained in the Code in the following manner:
1. The Company encourages representation of independent non-executive directors and directors representing minority interests on its Board of Directors. At present the Board includes:
Independent Director
Mr. Ehsan Malik
Executive Director
Mr. Abrar Hasan
Non-Executive Directors
Mr. Abdul Majeed Mr. Ebrahim Qassim Mr. Zahid Majeed Mrs. Noreen Hassan Mrs. Sadia Naveed
The independent director meet the criteria of independence under clause 5.19.1. (b) of the Code of Corporate Governance.
2. The directors have con�rmed that none of them is serving as a director on more than seven listed companies, including the Company.
3. All the resident directors of the Company are registered as taxpayers and none of them has defaulted in payment of any loan to a banking company, a DFI or an NBFI or, being a member of a stock exchange, has been declared as a defaulter by the stock exchange.
4. A casual vacancy occurred on the Board of Director’s on 26th May 2016, which was �lled on 27th May 2016.
5. The Company has prepared a “Code of Conduct” and has ensured that appropriate steps have been taken to disseminate it throughout the Company along with its supporting policies and procedures.
6. The Board has developed a vision / mission statement, overall corporate strategy and signi�cant policies of the Company prepared by management. A complete record of particulars of signi�cant policies along with the dates on which they were approved or amended has been maintained.
7. All the powers of the Board have been duly exercised and decisions on material transactions, including appointment and determination of remuneration and terms and conditions of employment of the CEO, other executive and non-executive directors, have been taken by the board.
8. The meetings of the Board were presided over by the Chairman and the Board met at least once in every quarter. Written notices of the Board meetings, along with agenda and working papers, were circulated at least seven days before the meetings. The minutes of the meetings were appropriately recorded and circulated.
9. All directors of the Board are fully conversant with their duties and responsibilities as directors of corporate bodies.
10. The board has approved the appointment of Company Secretary, Head of Internal Audit and CFO including their remuneration and terms and conditions of employment.
Annual Report 2016 71Share Food, Share Love70
Review Report to the Members on the Compliance with the Code of Corporate Governance
Statement of Compliance with the Code ofCorporate Governance
11. The directors’ report for this year has been prepared in compliance with the requirements of the Code of Corporate Governance and fully describes the salient matters required to be disclosed.
12. The �nancial statements of the Company were duly endorsed by CEO and CFO before approval of the Board.
13. The directors, CEO and executives do not hold any interest in the shares of the Company other than that disclosed in the pattern of shareholding.
14. The Company has complied with all the corporate and �nancial reporting requirements of the Code of Corporate Governance.
15. The Board has formed an Audit Committee. It comprises of four (04) directors, of whom three are non-executive directors and one is an independent director. The chairman of the committee is a non-executive director.
16. The meetings of the audit committee were held at least once every quarter prior to approval of interim and �nal results of the Company and as required by the Code of Corporate Governance. The terms of reference of the committee have been formulated and advised to the committee for compliance.
17. The Board has formed an HR and Remuneration Committee. It comprises three (03) directors of whom all are non-executive directors and the chairman of the committee is a non-executive director.
18 The Board has outsourced the internal audit function to M/s Ernst & Young Ford Rhodes Sidat Hyder & Company Chartered Accountants, who are considered suitably quali�ed and experienced for the purpose and are conversant with the policies and procedures of the Company.
19. The statutory auditors of the Company have con�rmed that they have been given a satisfactory rating under the quality control review programme of the Institute of Chartered Accountants of Pakistan (ICAP), that they or any of the partners of the �rm, their spouses and minor children do not hold shares of the Company and that the �rm and all its partners are in compliance with International Federation of Accountants (IFAC) guidelines on code of ethics as adopted by the Institute of Chartered Accountants of Pakistan (ICAP).
20. The statutory auditors or the persons associated with them have not been appointed to provide other services except in accordance with the listing regulations and the auditors have con�rmed that they have observed IFAC guidelines in this regard.
21. The ‘closed period’, prior to the announcement of interim/�nal results, and business decisions, which may materially affect the market price of the Company’s securities, was determined and intimated to directors, employees and stock exchange.
22. Material / price sensitive information has been disseminated among all market participants at once through stock exchange.
23. The related party transactions have been placed before the audit committee and approved by the Board of Directors with necessary justi�cation for non arm’s length transactions and pricing methods for transactions that were made on terms equivalent to those that prevail in the arm’s length transactions only if such terms can be substantiated.
24. We con�rm that all other material principles enshrined in the Code of Corporate Governance have been complied with.
Karachi Abrar HasanDated: August 29, 2016 Chief Executive
We have reviewed the enclosed Statement of Compliance with the best practices contained in the Code of Corporate Governance (the Code) prepared by the Board of Directors of National Foods Limited for the year ended June 30, 2016 to comply with the Code contained in regulation No. 5.19 of the Pakistan Stock Exchange Limited Regulations where the Company is listed.
The responsibility for compliance with the Code is that of the Board of Directors of the Company. Our responsibility is to review, to the extent where such compliance can be objectively veri�ed, whether the Statement of Compliance re�ects the status of the Company’s compliance with the provisions of the Code and report if it does not and to highlight any non-compliance with the requirements of the Code. A review is limited primarily to inquiries of the Company’s personnel and review of various documents prepared by the Company to comply with the Code.
As a part of our audit of the �nancial statements we are required to obtain an understanding of the accounting and internal control systems suf�cient to plan the audit and develop an effective audit approach. We are not required to consider whether the Board of Directors’ statement on internal control covers all risks and controls or to form an opinion on the effectiveness of such internal controls, the Company’s corporate governance procedures and risks.
The Code requires the Company to place before the Audit Committee, and upon recommendation of the Audit Committee, place before the Board of Directors for their review and approval its related party transactions distinguishing between transactions carried out on terms equivalent to those that prevail in arm’s length transactions and transactions which are not executed at arm’s length price and recording proper justi�cation for using such alternate pricing mechanism. We are only required and have ensured compliance of this requirement to the extent of the approval of the related party transactions by the Board of Directors upon recommendation of the Audit Committee. We have not carried out any procedures to determine whether the related party transactions were undertaken at arm’s length price or not.
Based on our review, nothing has come to our attention which causes us to believe that the Statement of Compliance does not appropriately re�ect the Company’s compliance, in all material respects, with the best practices contained in the Code as applicable to the Company for the year ended June 30, 2016.
A.F. Ferguson & Co.Chartered AccountantsKarachi
Dated: September 6, 2016
Name of the Engagement Partner: Farrukh Rehman
Annual Report 2016 73Share Food, Share Love72
We have audited the annexed balance sheet of National Foods Limited as at June 30, 2016 and the related pro�t and loss account, cash �ow statement and statement of changes in equity together with the notes forming part thereof, for the year then ended and we state that we have obtained all the information and explanations which, to the best of our knowledge and belief, were necessary for the purposes of our audit.
It is the responsibility of the Company’s management to establish and maintain a system of internal control, and prepare and present the above said statements in conformity with the approved accounting standards and the requirements of the Companies Ordinance, 1984. Our responsibility is to express an opinion on these statements based on our audit.
We conducted our audit in accordance with the auditing standards as applicable in Pakistan. These standards require that we plan and perform the audit to obtain reasonable assurance about whether the above said statements are free of any material misstatement. An audit includes examining on a test basis, evidence supporting the amounts and disclosures in the above said statements. An audit also includes assessing the accounting policies and signi�cant estimates made by management, as well as, evaluating the overall presentation of the above said statements. We believe that our audit provides a reasonable basis for our opinion and, after due veri�cation, we report that:
(a) in our opinion, proper books of accounts have been kept by the Company as required by the Companies Ordinance, 1984;
(b) in our opinion:
(i) the balance sheet and pro�t and loss account together with the notes thereon have been drawn up in conformity with the Companies Ordinance, 1984, and are in agreement with the books of accounts and are further in accordance with accounting policies consistently applied;
(ii) the expenditure incurred during the year was for the purpose of the Company's business; and
(iii) the business conducted, investments made and the expenditure incurred during the year were in accordance with the objects of the Company;
(c) in our opinion and to the best of our information and according to the explanations given to us, the balance sheet, pro�t and loss account, cash �ow statement and statement of changes in equity together with the notes forming part thereof conform with approved accounting standards as applicable in Pakistan, and give the information required by the Companies Ordinance, 1984, in the manner so required and respectively give a true and fair view of the state of the Company's affairs as at June 30, 2016 and of the pro�t, its cash �ows and changes in equity for the year then ended; and
(d) in our opinion, Zakat deductible at source under the Zakat and Ushr Ordinance, 1980 (XVIII of 1980), was deducted by the Company and deposited in the Central Zakat Fund established under section 7 of that Ordinance.
A.F. Ferguson & Co.Chartered AccountantsKarachi
Dated: September 6, 2016
Name of the Engagement Partner: Farrukh Rehman
Auditors' Report to the Members
Annual Report 2016 75
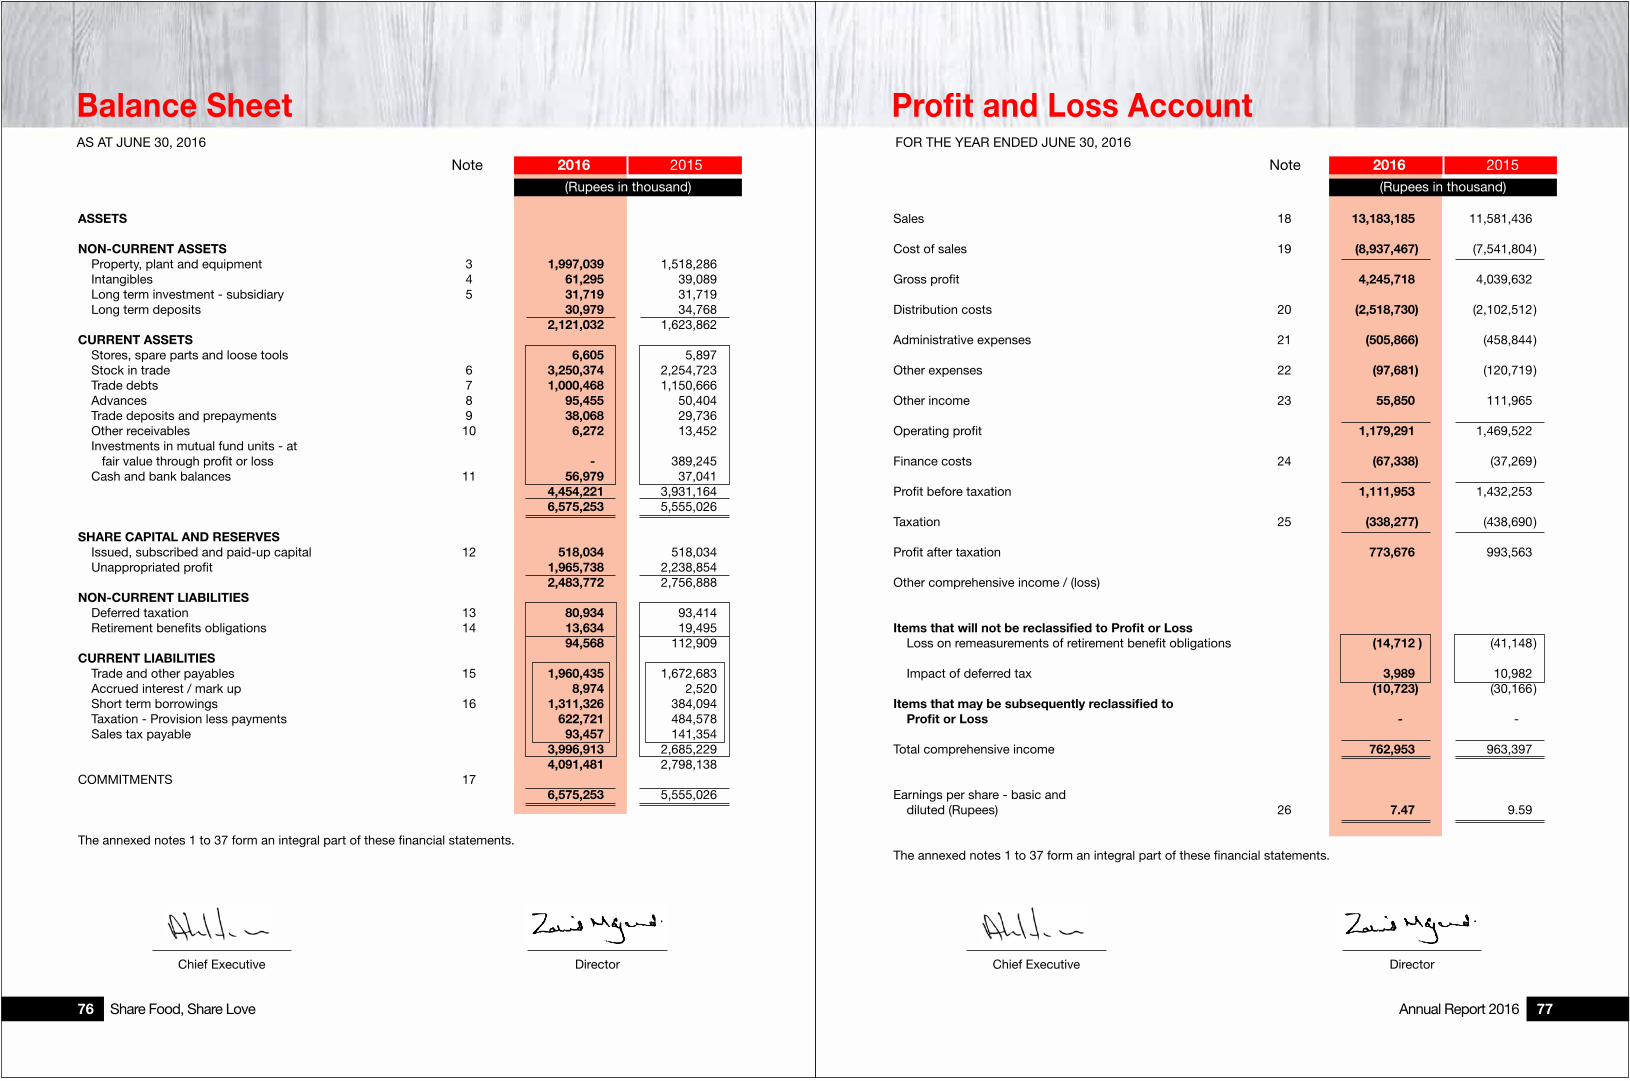
Balance SheetAS AT JUNE 30, 2016
Profit and Loss Account FOR THE YEAR ENDED JUNE 30, 2016
(Rupees in thousand)
2016 2015Note
(Rupees in thousand)
2015Note
ASSETS
NON-CURRENT ASSETS Property, plant and equipment 3 1,997,039 1,518,286 Intangibles 4 61,295 39,089 Long term investment - subsidiary 5 31,719 31,719 Long term deposits 30,979 34,768
2,121,032 1,623,862 CURRENT ASSETS Stores, spare parts and loose tools 6,605 5,897
Stock in trade 6 3,250,374 2,254,723 Trade debts 7 1,000,468 1,150,666 Advances 8 95,455 50,404 Trade deposits and prepayments 9 38,068 29,736 Other receivables 10 6,272 13,452 Investments in mutual fund units - at
fair value through pro�t or loss - - 389,245 Cash and bank balances 11 56,979 37,041 4,454,221 3,931,164 6,575,253 5,555,026
SHARE CAPITAL AND RESERVES Issued, subscribed and paid-up capital 12 518,034 518,034
Unappropriated pro�t 1,965,738 2,238,854 2,483,772 2,756,888
NON-CURRENT LIABILITIES Deferred taxation 13 80,934 93,414 Retirement bene�ts obligations 14 13,634 19,495 94,568 112,909
CURRENT LIABILITIES Trade and other payables 15 1,960,435 1,672,683 Accrued interest / mark up 8,974 2,520 Short term borrowings 16 1,311,326 384,094 Taxation - Provision less payments 622,721 484,578 Sales tax payable 93,457 141,354 3,996,913 2,685,229 4,091,481 2,798,138
COMMITMENTS 17 6,575,253 5,555,026
The annexed notes 1 to 37 form an integral part of these �nancial statements.
Sales 18 13,183,185 11,581,436
Cost of sales 19 (8,937,467 ) (7,541,804 ) Gross pro�t 4,245,718 4,039,632 Distribution costs 20 (2,518,730 ) (2,102,512 ) Administrative expenses 21 (505,866 ) (458,844 ) Other expenses 22 (97,681 ) (120,719 ) Other income 23 55,850 111,965 Operating pro�t 1,179,291 1,469,522 Finance costs 24 (67,338 ) (37,269 ) Pro�t before taxation 1,111,953 1,432,253 Taxation 25 (338,277 ) (438,690 ) Pro�t after taxation 773,676 993,563 Other comprehensive income / (loss)
Items that will not be reclassified to Profit or Loss Loss on remeasurements of retirement bene�t obligations (14,712 ) (41,148 )
Impact of deferred tax 3,989 10,982 (10,723 ) (30,166 )
Items that may be subsequently reclassified to Profit or Loss - - Total comprehensive income 762,953 963,397 Earnings per share - basic and
diluted (Rupees) 26 7.47 9.59
The annexed notes 1 to 37 form an integral part of these �nancial statements.
2016
Chief Executive DirectorChief Executive Director
Annual Report 2016 77Share Food, Share Love76

Cash Flow StatementFOR THE YEAR ENDED JUNE 30, 2016
Statement of Changes in EquityFOR THE YEAR ENDED JUNE 30, 2016
(Rupees in thousand)
2015Note 2016
Chief Executive Director
CASH FLOWS FROM OPERATING ACTIVITIES
Cash generated from operations 27 726,447 1,547,792 Finance cost paid (60,884 ) (46,090 ) Income tax paid (208,625 ) (132,640 ) Retirement bene�ts obligations paid (23,876 ) (61,382 ) Net increase / (decrease) in long term deposits 3,789 (12,643 )
Net cash flow from operating activities 436,851 1,295,037
CASH FLOWS FROM INVESTING ACTIVITIES
Purchase of property, plant and equipment (684,084 ) (467,720 ) Sale proceeds from disposal of property,
plant and equipment 21,767 29,988 Purchase of intangible assets (46,958 ) (22,740 ) Purchase of open ended mutual fund units (150,000 ) (777,988 ) Sale of open ended mutual fund units 546,048 884,555 Purchase of treasury bills (147,810 ) - - Sale proceeds of treasury bills 148,731 - -
Net cash used in investing activities (312,306) (353,905)
CASH FLOWS FROM FINANCING ACTIVITIES
Short term borrowings obtained 1,000,000 508,696 Repayment of short term borrowings (700,000 ) (808,722 ) Dividend paid (1,031,839 ) (412,814 )
Net cash used in financing activities (731,839 ) (712,840 ) Net (decrease) / increase in cash and cash equivalents (607,294 ) 228,292
Cash and cash equivalents at beginning of the year (247,053 ) (475,345 )
Cash and cash equivalents at end of the year 28 (854,347 ) (247,053 )
The annexed notes 1 to 37 form an integral part of these �nancial statements.
(Rupees in thousand)
Unappropriatedprofit
Total
Balance as at June 30, 2014 518,034 1,689,884 2,207,918 Final dividend for the year ended June 30, 2014 @ Rs 8.00 per share - - (414,427 ) (414,427 ) Total comprehensive income for the year ended June 30, 2015 - Pro�t for the year ended June 30, 2015 - - 993,563 993,563 - Other comprehensive loss for the year ended June 30, 2015 - - (30,166 ) (30,166 ) - - 963,397 963,397 Balance as at June 30, 2015 518,034 2,238,854 2,756,888 Final dividend for the year ended June 30, 2015 @ Rs 10.00 per share - - (1,036,069 ) (1,036,069 ) Total comprehensive income for the year ended June 30, 2016 - Profit for the year ended June 30, 2016 - - 773,676 773,676 - Other comprehensive loss for the year ended June 30, 2016 - - (10,723 ) (10,723 )
- - 762,953 762,953 Balance as at June 30, 2016 518,034 1,965,738 2,483,772
The annexed notes 1 to 37 form an integral part of these �nancial statements.
Issued,subscribedand paid-up
capital
Chief Executive Director
Annual Report 2016 79Share Food, Share Love78

Notes to the Financial StatementsFOR THE YEAR ENDED JUNE 30, 2016
Notes to the Financial StatementsFOR THE YEAR ENDED JUNE 30, 2016
1. THE COMPANY AND ITS OPERATIONS
The Company was incorporated in Pakistan on February 19, 1970 as a private limited company under the Companies Act, 1913 and subsequently converted into a public limited company under the Companies Ordinance, 1984 by special resolution passed in the extra ordinary general meeting held on March 30, 1988. The Company is principally engaged in the manufacture and sale of convenience based food products. It is listed on Pakistan Stock Exchange. The registered of�ce of the Company is situated at 12 / CL - 6, Claremont Road, Civil Lines, Karachi.
The Company has a wholly owned subsidiary named National Foods DMCC (NF DMCC). NF DMCC was registered
on 7 November 2012 in Dubai Multi Commodities Centre (“DMCC”) pursuant to Dubai (DMCC) Law No. 4 of 2001 and operates in the United Arab Emirates (“UAE”) under a trade license issued by DMCC. The registered address of the company is Unit No. R30-26, Floor No. 30, R Serviced Of�ces JLT, Reef Tower, Plot No. 01 Jumeirah Lakes Towers Dubai, United Arab Emirates.
The primary objective of NF DMCC is to boost export sales of its parent company through trading in food stuff
and other services. National Foods DMCC also has following two wholly owned subsidiaries: a) National Epicure Inc. National Epicure Inc. was incorporated in Canada on 16 October 2013 under the Canada Business Corporations
Act. The company is principally engaged in the trading of food products. The registered of�ce of the company is situated at 193 Maxome Avenue, Toronto, Ontario, Canada. The company is a wholly owned subsidiary of National Foods DMCC.
b) National Foods Pakistan (UK) Limited National Foods Pakistan (UK) Limited was incorporated in United Kingdom on 29 May 2013 as a private company
under the Companies Act, 2006. The company is principally engaged in the trading of food products. The registered of�ce of the company is situated at 27 Second Floor, Gloucester Place, London, United Kingdom. The company is a wholly owned subsidiary of National Foods DMCC.
2. SUMMARY OF SIGNIFICANT ACCOUNTING POLICIES The principal accounting policies applied in the preparation of these �nancial statements are set out below: 2.1 Basis of preparation 2.1.1 Statement of compliance These �nancial statements have been prepared in accordance with approved accounting standards as applicable
in Pakistan. Approved accounting standards comprise of such International Financial Reporting Standards (IFRS) issued by the International Accounting Standards Board as are noti�ed under the Companies Ordinance, 1984, provisions of and directives issued under the Companies Ordinance, 1984 including Islamic Financial Accounting Standards (IFAS). In case requirements differ, the provisions or directives of the Companies Ordinance, 1984 shall prevail.
2.1.2 Critical accounting estimates and judgements The preparation of �nancial statements in conformity with the above requirements requires the use of certain
critical accounting estimates. It also requires management to exercise its judgement in the process of applying the Company's accounting policies. The matters involving a higher degree of judgement or complexity, or areas where assumptions and estimates are signi�cant to the �nancial statements are as follows: (i) Taxation - notes 13.1 and 25
(ii) Retirement bene�ts obligations - note 14
Estimates and judgements are continually evaluated and are based on historical experience and other factors, including expectations of future events that are believed to be reasonable under the circumstances.
There have been no critical judgements made by the Company's management in applying the accounting policies that would have signi�cant effect on the amounts recognised in the �nancial statements.
2.1.3 Changes in accounting standards, interpretations and pronouncements (a) Standards, interpretations and amendments to published approved accounting standards that are effective and relevant Following amendments to existing standards and interpretations have been published and are mandatory for
accounting periods beginning on or after January 1, 2015 and are considered to be relevant to the Company's operations.
IFRS 10, 'Consolidated �nancial statements' replaces all of the guidance on control and consolidation in IAS 27,
'Consolidated and separate �nancial statements', and SIC-12, 'Consolidation - special purpose entities'. IAS 27 is renamed 'Separate �nancial statements', it continues to be a standard dealing solely with separate �nancial statements. IFRS 10 has the potential to affect all reporting entities (investors) that control one or more investees under the revised de�nition of control. The standard presently does not impact �nancial statements of the Company.
IFRS 11, ‘Joint arrangements’ focuses on the rights and obligations of the parties to the arrangement rather than
its legal form. There are two types of joint arrangements: joint operations and joint ventures. Joint operations arise where the investors have rights to the assets and obligations for the liabilities of an arrangement. A joint operator accounts for its share of the assets, liabilities, revenue and expenses. Joint ventures arise where the investors have rights to the net assets of the arrangement; joint ventures are accounted for under the equity method. Proportional consolidation of joint arrangements is no longer permitted. There are no changes to disclosures on application of the standard on the company's �nancial statements.
IFRS 12, 'Disclosures of interests in other entities' includes the disclosure requirements for all forms of interests
in other entities, including joint arrangement, associates, structured entities and other off balance sheet vehicles. There are no changes to disclosures on application of the standard on the company's �nancial statements.
IFRS 13, 'Fair value measurement', aims to improve consistency and reduce complexity by providing a precise
de�nition of fair value and a single source of fair value measurement and disclosure requirement for use across IFRSs. The requirement does not extend the use of fair value accounting but provides guidance on how it should be applied where its use is already required or permitted by other standards within IFRSs. There are no changes to disclosures on application of the standard on the company's �nancial statements.
(b) Standards, interpretations and amendments to published approved accounting standards that are effective but not relevant Except as stated above, the new standards, amendments and interpretations that are mandatory for accounting
periods beginning on or after January 1, 2015 are considered not to be relevant for Company's �nancial statements and hence have not been detailed here.
(c) Standards, interpretations and amendments to published approved accounting standards that are not yet effective but relevant IAS 1, ‘Presentation of �nancial statements’ aims to improve presentation and disclosure in �nancial reports by
emphasising the importance of understandability, comparability and clarity in presentation.
The amendments provides clari�cation on number of issues, including: - Materiality - an entity should not aggregate or disaggregate information in a manner that obscures useful
information. Where items are material, suf�cient information must be provided to explain the impact on the �nancial position or performance.
- Disaggregation and subtotals – line items speci�ed in IAS 1 may need to be disaggregated where this is relevant
to an understanding of the entity’s �nancial position or performance. There is also new guidance on the use of subtotals.
Annual Report 2016 81Share Food, Share Love80

Notes to the Financial StatementsFOR THE YEAR ENDED JUNE 30, 2016
Notes to the Financial StatementsFOR THE YEAR ENDED JUNE 30, 2016
- Notes – con�rmation that the notes do not need to be presented in a particular order.
- Other Comprehensive Income (OCI) - arising from investments accounted for under the equity method - the share of the OCI arising from equity - accounted investments is grouped based on whether the items will or will not subsequently be reclassi�ed to pro�t or loss. Each group should then be presented as a single line item in the statement of comprehensive income.
The change will impact the disclosures of the Company's �nancial statements. 2.2 Overall valuation policy These �nancial statements have been prepared under the historical cost convention except as disclosed in the
accounting policies below. 2.3 Property, plant and equipment Property, plant and equipment are stated at cost less accumulated impairment and accumulated depreciation
except capital work in progress which is stated at cost. Depreciation on property, plant and equipment is charged to income applying the straight-line method over the
estimated useful lives of related assets. Depreciation on additions is charged from the month in which the assets are put to use and on disposals up to the month of disposal.
Maintenance and normal repairs are charged to income as and when incurred. Major renewals and improvements
are capitalised and assets so replaced, if any, are retired. Pro�t and loss on sale or retirement of property, plant and equipment is included in income currently.
2.4 Intangibles These are stated at cost less accumulated amortisation and impairment, if any. Generally, costs associated with
developing or maintaining computer software programmes are recognised as an expense as incurred. However, costs that are directly associated with identi�able software and have probable economic bene�t exceeding one
year are recognised as intangible assets. Direct costs include the purchase cost of software and related overheadcost.
Amortisation charge is based on the straight-line method whereby the cost of an intangible is written off over its estimated useful life of three years.
2.5 Long term investment - subsidiary Investment in subsidiary is stated at cost.
2.6 Taxation i) Current Charge for current taxation is based on taxable income at the current rates of taxation after taking into account
tax credits and rebates available, if any, and taxes paid under the �nal tax regime. ii) Deferred Deferred tax is accounted for using the balance sheet liability method on all temporary differences arising between
tax base of assets and liabilities and their carrying amounts in the �nancial statements. Deferred tax liability is generally recognised for all taxable temporary differences and deferred tax asset is recognised to the extent that it is probable that future taxable pro�ts will be available against which the deductible temporary differences, unused tax losses and tax credits can be utilised. Deferred tax is charged or credited in the pro�t and loss account.
2.7 Employee retirement benefits Defined benefit plans The Company operates a funded pension scheme and post retirement medical bene�t for chief executive and
two non-executive directors. The liability recognised in the balance sheet in respect of the de�ned bene�t plans is the present value of the de�ned bene�t obligation at the end of the reporting period less the fair value of plan assets. The de�ned bene�t obligation is calculated annually by independent actuary using the projected unit credit method. The latest actuarial valuation of the de�ned bene�t plans was conducted at June 30, 2016.
Past service cost and the amount arising as a result of remeasurements are recognised in the Balance Sheet
immediately, with a charge or credit to Other Comprehensive Income in the periods in which they occur. Defined contribution plan The Company operates an approved contributory provident fund for all employees. Equal monthly contributions
are made, both by the Company and the employees, to the fund at the rate of 10% per annum of the basic salary. 2.8 Stores, spare parts and loose tools These are valued at weighted average cost less provision for slow moving and obsolete stores, spare parts and
loose tools, if any. Items in transit are valued at cost comprising invoice value plus other charges incurred thereon. 2.9 Stock in trade All stocks are stated at the lower of cost and estimated net realisable value. Cost is determined by weighted
average method except for those in transit where it represents invoice value and other charges incurred thereon. Net realisable value signi�es the estimated selling price in the ordinary course of business less cost necessarily to be incurred in order to make the sale. Cost of work in process and �nished goods includes direct cost of materials, direct cost of labour and production overheads.
2.10 Trade and other debts Trade and other debts are recognised at fair value of consideration receivable. Debts considered irrecoverable
are written off and provision is made against those considered doubtful of recovery. 2.11 Investments - at fair value through profit and loss account Investments held for trading are classi�ed at fair value through pro�t and loss account. These are measured at
fair value which is reassessed at each reporting date. In case of investments in open ended mutual funds, fair value is determined on the basis of period end Net Asset Value (NAV) as announced by the Asset Management Company. Changes in fair value are recognised in pro�t and loss account.
2.12 Cash and cash equivalents Cash and cash equivalents are carried at cost. For the purposes of cash �ow statement, cash and cash equivalents
comprise of cash, balances with banks on current and deposit accounts and running �nance under mark up arrangements.
2.13 Impairment losses The carrying amount of the Company's assets are reviewed at each balance sheet date to determine whether
there is any indication of impairment loss. If such indications exist, the assets' recoverable amount is estimated in order to determine the extent of impairment loss, if any. Impairment losses are recognised as expense in the pro�t and loss account.
An impairment loss is reversed if there is a change in the estimates used to determine the recoverable amount.
An impairment loss is reversed only to the extent that the assets' carrying amount does not exceed the carrying amount that would have been determined, net of depreciation or amortisation, if no impairment loss had been recognised.
Annual Report 2016 83Share Food, Share Love82

Notes to the Financial StatementsFOR THE YEAR ENDED JUNE 30, 2016
Notes to the Financial StatementsFOR THE YEAR ENDED JUNE 30, 2016
2.14 Finance leases Leases that transfer substantially all the risks and rewards incidental to ownership of assets are classi�ed as
�nance leases. Finance leases are capitalised at the inception of the lease term at the lower of fair value of the leased assets and the present value of minimum lease payments. The outstanding obligation under the lease less �nance charges allocated to future periods is shown as a liability. Finance charges are allocated to accounting periods in a manner so as to provide a constant periodic rate of charge on the outstanding liability.
2.15 Ijarah In ijarah transactions' signi�cant portion of the risks and rewards of ownership are retained by the lessor. Islamic
Financial Accounting Standard 2 – 'Ijarah' requires the recognition of ‘ujrah payments’ (lease rentals) against ijarah �nancing as an expense in the pro�t and loss account on a straight-line basis over the ijarah term.
2.16 Trade and other payables Trade and other payables are recognised initially at fair value and subsequently measured at amortised cost using
the effective interest rate method.
2.17 Borrowing costs Borrowings are recognised initially at fair value, net of transaction costs incurred and are subsequently measured
at amortised cost using effective interest method. Borrowing costs are recognised as an expense in the period in which these are incurred except to the extent of
borrowing costs that are directly attributable to the acquisition, construction or production of a qualifying asset. Such borrowing costs, if any, are capitalised as part of the cost of that asset.
2.18 Provisions
Provisions are recognised when the Company has a present legal or constructive obligation as a result of past
event, it is probable that an out�ow of resources embodying economic bene�ts will be required to settle the obligation, and a reliable estimate of the amount can be made.
2.19 Financial instruments Financial instruments include deposits, trade and other debts, cash and bank balances, investments, long term
�nance, liabilities against assets subject to �nance lease, trade and other payables, accrued interest / mark up and short term borrowings. The particular recognition methods adopted are disclosed in the respective policy notes.
2.20 Foreign currency transactions and translation These �nancial statements are presented in Pak Rupee which is the functional and presentation currency of the
Company and �gures are rounded off to the nearest thousand of rupees. Foreign currency transactions are translated into Pak Rupee using the exchange rates approximating those
prevailing at the dates of the transactions. All monetary assets and liabilities in foreign currencies are translated into Pak Rupee at the rates of exchange approximating those prevailing at the balance sheet date. Exchange gains / losses on translation are included in income currently.
2.21 Revenue recognition Revenue comprises the fair value of the consideration received or receivable for the sale of goods and services
in the ordinary course of the Company’s activities.
The Company recognises revenue when the amount of revenue can be reliably measured, it is probable that future economic bene�ts will �ow to the Company and speci�c criteria have been met for each of the Company’s activities as described below:
i) Sale of goods - Sales are recognised on despatch of goods to customers. ii) Interest / Mark up income - Income on bank deposits is recognised on accrual basis. iii) Dividend income - Dividend income is recognised when the Company's right to receive payment is established. 2.22 Research and development Research and development expenditure is charged to pro�t and loss account in the period in which it is incurred. 2.23 Offsetting Financial assets and liabilities are offset and the net amount is reported in the balance sheet where there is a
legally enforceable right to set-off the recognised amounts and the Company intends to either settle on a net basis, or to realise the asset and settle the liability simultaneously.
2.24 Dividends Dividend distribution to the Company's shareholders is recognised as liability at the time of their approval.
(Rupees in thousand)
2016 2015
3. PROPERTY, PLANT AND EQUIPMENT
Operating assets - note 3.1 1,227,020 1,210,693 Capital work in progress - at cost - note 3.2 770,019 307,593 1,997,039 1,518,286
Annual Report 2016 85Share Food, Share Love84

Notes to the Financial StatementsFOR THE YEAR ENDED JUNE 30, 2016
Notes to the Financial StatementsFOR THE YEAR ENDED JUNE 30, 2016
3.1 Operating assets
Net carrying value basis Year ended June 30, 2016 Opening net book value (NBV) 210,497 343,910 536,435 22,629 19,929 48,452 10,671 18,170 1,210,693 Additions (at cost) - note - 3.1.1 19 32,462- 131,957 2,610 15,885 20,921 3,556 14,248 221,658 Disposals (at NBV) - - - - - - - - - - (749 ) - - (11,081 ) (11,830 ) Depreciation charge (4,168 ) (27,953 ) (109,417 ) (7,245 ) (5,938) (29,521 ) (2,120 ) (7,139 ) - (193,501 )
Closing net book value 206,348 348,419 558,975 17,994 29,876 39,103 12,107 14,198 1,227,020 Gross carrying value basis At June 30, 2016
Cost 230,606 555,694 1,124,754 63,135 70,727 146,978 25,529 61,137 2,278,560 Accumulated depreciation (24,258 ) (207,275 ) (565,779 ) (45,141 ) (40,851) (107,875 ) (13,422 ) (46,939 ) - (1,051,540 ) Net book value 206,348 348,419 558,975 17,994 29,876 39,103 12,107 14,198 1,227,020
Net carrying value basis Year ended June 30, 2015
Opening net book value (NBV) 192,721 355,022 489,952 21,560 14,885 39,975 8,208 19,126 1,141,449 Additions (at cost) 21,596 17,317 140,831 7,653 9,481 36,191 5,184 20,421 258,674 Disposals (at NBV) - - - - - - - - - - (105 ) - - (14,022 ) (14,127 ) Write offs (at NBV) - - - - - - - - (61 ) - - - - - - (61 ) Depreciation charge (3,820 ) (28,429) (94,348 ) (6,584 ) (4,376 ) (27,609 ) (2,721 ) (7,355 ) (175,242 ) Closing net book value 210,497 343,910 536,435 22,629 19,929 48,452 10,671 18,170 1,210,693
Gross carrying value basis At June 30, 2015
Cost 230,587 523,232 992,797 60,541 55,089 131,599 21,973 62,839 2,078,657 Accumulated depreciation (20,090 ) (179,322 ) (456,362 ) (37,912 ) (35,160 ) (83,147 ) (11,302 ) (44,669 ) (867,964 ) Net book value 210,497 343,910 536,435 22,629 19,929 48,452 10,671 18,170 1,210,693
Useful life (Years) 38 - 99 10 - 52 5 - 10 5 6 - 7 3 10 5
(Rupees in thousand)
Total Laboratory equipments
Of�ce and other
equipments
Furniture and �ttings
Plant and machinery
Leasehold land Computers Vehicles
Building on leasehold
land
(Rupees in thousand)
2016 2015
3.2 Capital work in progress
These comprise of: Civil work in progress 391,176 93,856
Plant and machinery 272,273 145,084 Of�ce equipment 25,146 1,697 Advance against acquisition of land 81,424 66,956
770,019 307,593
3.1.1 This includes Rs. 64.85 million (2015: Rs. 102.2 million) transferred from capital work in progress.
Cost
3.3 The details of property, plant and equipment having net book value of Rs. 50,000 and above sold / disposed of during the year are as follows:
Accumulateddepreciation Net book value Sale proceeds Mode of disposal Particulars of
purchaser
Vehicles " 1,699 85 1,614 1,554 Company Policy Mr. Farhan Latif Executive
" 1,353 23 1,330 1,533 " Mr. Ashraf Ali Executive
" 1,188 79 1,109 1,125 " Mr. SM Umair Executive
" 1,124 37 1,087 960 " Mr. Sarwar-e-Azam Executive
" 1,168 97 1,071 1,200 " Mr. Khurram Riaz Merchant Executive
" 1,080 18 1,062 1,153 " Mr. Ra�q Islam Executive
" 969 16 953 1,136 " Mr. Idrees Executive
" 984 33 951 1,268 " Mr. Adnan Malik Executive
" 1,608 1,045 563 854 " Mr. Syed Waqar Haider Rizivi Executive
" 416 7 409 593 " Mr. Wasi Haider Executive
" 217 4 213 396 " Mr. Adeel Noor Executive
" 150 5 145 286 " Mr. Ali Kazmi Executive
" 87 1 86 415 " Mr. Mumtaz Khaleel Executive
" 70 9 61 60 " Mr. Kamran Ahmed Executive " 61 5 56 58 " Mr. Shakeel Abbas Executive
" 64 8 56 60 " Mr. Shaikh Muhammad Imran Executive
" 64 13 51 58 " Mr. Ghulam Abbas Executive
Total 12,302 1,485 10,817 12,709
(Rupees in thousand)
Annual Report 2016 87Share Food, Share Love86

Notes to the Financial StatementsFOR THE YEAR ENDED JUNE 30, 2016
Notes to the Financial StatementsFOR THE YEAR ENDED JUNE 30, 2016
(Rupees in thousand)
2016 2015
4. INTANGIBLES
Computer softwares and ERP System - note 4.1 56,223 39,089 Systems under development 5,072 - -
61,295 39,089
4.1 Computer softwares and ERP System Net carrying value basis
Opening net book value 39,089 34,962 Additions (at cost) 41,886 23,906 Amortisation for the year (24,752 ) (19,779 ) Closing net book value 56,223 39,089 Gross carrying value basis
Cost 170,752 128,972 Accumulated amortisation (114,529 ) (89,883 ) Net book value 56,223 39,089 5. LONG TERM INVESTMENT
Investment in subsidiary - at cost
National Foods DMCC, Dubai, UAE
1,188 shares of AED 1,000 each 31,719 31,719
5.1 This represents investment in wholly owned subsidiary which was set up in United Arab Emirates in 2012. The subsidiary is formed as a limited liability company. The subsidiary commenced operations from March 2013.
6.1 Stock in trade includes Rs. 1.94 billion (2015: Rs. 1.21 billion) held with third parties.
6.2 The above balances include items costing Rs. 59.75 million (2015: Rs. 30.64 million) valued at net realisable value
of Rs. 51.74 million (2015: Rs. 26.27 million).
6.3 The Company has made a provision of Rs. 67.58 million for obsolescence (2015: Rs. 29.21 million) and has written
off stocks against the provision amounting to Rs. 38.38 million (2015: Rs. 13.25 million) during the year.
(Rupees in thousand)
2016 2015
7. TRADE DEBTS
Considered good - unsecured
Related parties - note 7.2 565,034 719,202
Others
- local 435,434 428,701
- foreign - - 2,763
1,000,468 1,150,666
Considered doubtful 6,093 7,600
1,006,561 1,158,266
Less: Provision for doubtful trade debts (6,093 ) (7,600 )
1,000,468 1,150,666(Rupees in thousand)
2016 2015
6. STOCK IN TRADE
Raw materials (including in transit Rs. 193.83 million; 2015: Rs. 25.05 million) 1,450,684 931,433
Provision for obsolescence (21,489 ) (7,557 ) 1,429,195 923,876
Packing materials (including in transit Rs. 5.06 million; 2015: Rs. Nil) 358,185 270,888 Provision for obsolescence (50,161 ) (37,495 )
308,024 233,393 Work in process 973,140 824,179 Provision for obsolescence (9,360 ) (6,329 )
963,780 817,850 Finished goods 562,659 293,316 Provision for obsolescence (13,284 ) (13,712 )
549,375 279,604
3,250,374 2,254,723
Annual Report 2016 89Share Food, Share Love88
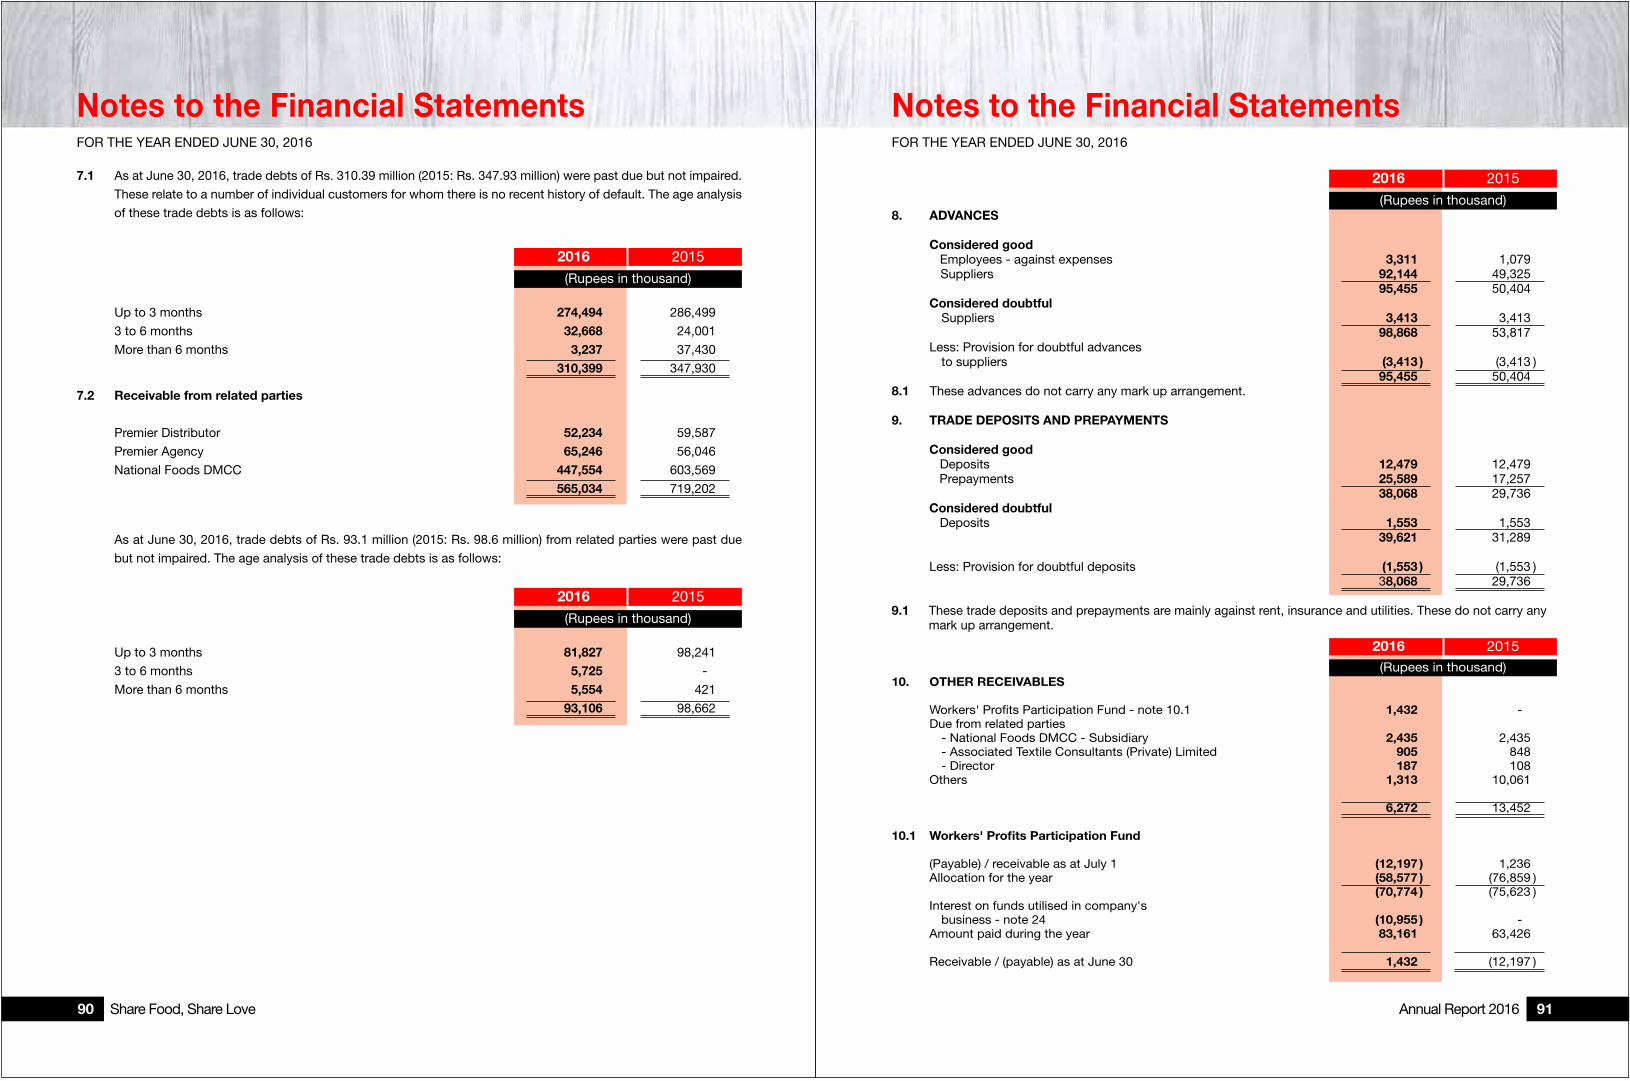
Notes to the Financial StatementsFOR THE YEAR ENDED JUNE 30, 2016
Notes to the Financial StatementsFOR THE YEAR ENDED JUNE 30, 2016
(Rupees in thousand)
2016 2015
8. ADVANCES
Considered good Employees - against expenses 3,311 1,079
Suppliers 92,144 49,325 95,455 50,404
Considered doubtful Suppliers 3,413 3,413
98,868 53,817 Less: Provision for doubtful advances to suppliers (3,413 ) (3,413 )
95,455 50,4048.1 These advances do not carry any mark up arrangement.
9. TRADE DEPOSITS AND PREPAYMENTS
Considered good Deposits 12,479 12,479
Prepayments 25,589 17,257 38,068 29,736
Considered doubtful Deposits 1,553 1,553 39,621 31,289
Less: Provision for doubtful deposits (1,553 ) (1,553 ) 38,068 29,736
9.1 These trade deposits and prepayments are mainly against rent, insurance and utilities. These do not carry any mark up arrangement.
(Rupees in thousand)
2016 2015
10. OTHER RECEIVABLES
Workers' Pro�ts Participation Fund - note 10.1 1,432 - - Due from related parties - National Foods DMCC - Subsidiary 2,435 2,435 - Associated Textile Consultants (Private) Limited 905 848 - Director 187 108 Others 1,313 10,061
6,272 13,452
10.1 Workers' Profits Participation Fund
(Payable) / receivable as at July 1 (12,197 ) 1,236 Allocation for the year (58,577 ) (76,859 )
(70,774 ) (75,623 ) Interest on funds utilised in company's business - note 24 (10,955 ) - - Amount paid during the year 83,161 63,426
Receivable / (payable) as at June 30 1,432 (12,197 )
(Rupees in thousand)
2016 2015
Up to 3 months 274,494 286,499
3 to 6 months 32,668 24,001
More than 6 months 3,237 37,430
310,399 347,930
7.2 Receivable from related parties
Premier Distributor 52,234 59,587
Premier Agency 65,246 56,046
National Foods DMCC 447,554 603,569
565,034 719,202
7.1 As at June 30, 2016, trade debts of Rs. 310.39 million (2015: Rs. 347.93 million) were past due but not impaired.
These relate to a number of individual customers for whom there is no recent history of default. The age analysis
of these trade debts is as follows:
As at June 30, 2016, trade debts of Rs. 93.1 million (2015: Rs. 98.6 million) from related parties were past due
but not impaired. The age analysis of these trade debts is as follows:
(Rupees in thousand)
2016 2015
Up to 3 months 81,827 98,241
3 to 6 months 5,725 - -
More than 6 months 5,554 421
93,106 98,662
Annual Report 2016 91Share Food, Share Love90

Notes to the Financial StatementsFOR THE YEAR ENDED JUNE 30, 2016
Notes to the Financial StatementsFOR THE YEAR ENDED JUNE 30, 2016
(Rupees in thousand)
2016 2015
13. DEFERRED TAXATION
Credit / (debit) balance arising in respect of: Accelerated tax depreciation / amortisation 108,635 115,350
Provision for stock obsolescence (26,552 ) (17,372 ) Provision for doubtful trade debts 1,652 (2,028 ) Provision for retirement bene�ts obligations (2,801 ) (2,536 ) 80,934 93,414
(Rupees in thousand)
2016 2015
14. RETIREMENT BENEFITS OBLIGATIONS
Pension Plan 11,764 17,214 Pensioners' Medical Plan 1,870 2,281 13,634 19,495
13.1 Deferred tax liability is restricted to 90.37% (2015: 88.96%) of the total deferred tax liability based on the following
assumptions:
- Export sales will continue to fall under Final Tax Regime.
- Historical trend of export and local sales ratio will continue to be approximately the same in foreseeable future.
14.1 As stated in note 2.7, the Company operates a funded pension scheme and post retirement medical bene�t for
chief executive and two non-executive directors. Actuarial valuation of these plans is carried out every year and
the latest actuarial valuation was carried out as at June 30, 2016.
14.2 Plan assets held in trust are governed by local regulations which mainly include the Trust Act, 1882, the Companies
Ordinance, 1984, the Income Tax Rules, 2002 and Rules under the Trust deed of the Plans. Responsibility for
governance of the Plans, including investment decisions and contribution schedules, lies with the Board of Trustees.
The Company appoints the trustees and all trustees are employees of the Company.
12.1 Movement in issued, subscribed and paid-up capital Ordinary shares of Rs. 5 (2015: Rs. 5) each
2015Number of Shares
2016 2015
(Rupees in thousand)
2016 2015
103,606,858 51,803,429 Opening shares outstanding - - 51,803,429 Share Split - - - - 103,606,858 103,606,858 518,034 518,034
(Rupees in thousand)
2016 2015
11. CASH AND BANK BALANCES
Cash in hand 1,394 1,285 Cash at bank
- current accounts - note 11.1 - local currency 3,296 26,333 - foreign currency 52,289 9,423
55,585 35,756 56,979 37,041
11.1 This includes current account maintained with Islamic Bank having balance of Rs. 1.33 million (2015: Rs. 1.04 million).
12. SHARE CAPITAL
Authorised share capital
2016Number of Shares
2016 2015
(Rupees in thousand)
2016 2015
Ordinary shares of 150,000,000 150,000,000 Rs. 5 (2015: Rs. 5) each 750,000 750,000
Issued, subscribed and paid-up capital Ordinary shares of Rs. 5 (2015: Rs. 5) each
(Rupees in thousand)
2016 2015
Number of Shares
2016 2015
Shares allotted: 2,511,980 2,511,980 for consideration paid in cash 12,560 12,560 101,094,878 101,094,878 as bonus shares 505,474 505,474 103,606,858 103,606,858 518,034 518,034
Annual Report 2016 93Share Food, Share Love92

Notes to the Financial StatementsFOR THE YEAR ENDED JUNE 30, 2016
Notes to the Financial StatementsFOR THE YEAR ENDED JUNE 30, 2016
14.3 The latest actuarial valuation of the Fund as at June 30, 2016 was carried out using the Projected Unit Credit Method. Details of the Fund as per the actuarial valuation are as follows:
(Rupees in thousand)
2016 2015
(Rupees in thousand)
2016 2015
14.4 Balance sheet reconciliation Present value of de�ned bene�t obligations 106,503 96,324 16,932 9,347 Fair value of plan assets (94,739 ) (79,110 ) (15,062 ) (7,066 ) Recognised liability 11,764 17,214 1,870 2,281
14.5 Movement in the net liability recognised in the balance sheet Opening balance 17,214 27,334 2,281 2,401
Remeasurements recognised in Other Comprehensive Income 7,206 36,137 7,506 5,011 Charge / (income) for the year 4,558 9,063 (1,255) 931 Contribution made (17,214 ) (55,320 ) (6,662 ) (6,062 ) Closing balance 11,764 17,214 1,870 2,281
14.6 Remeasurements recognised in other comprehensive income Acturial loss on de�ned bene�t obligation 2,045 35,018 10,781 4,899
Acturial loss / (gain) on plan assets 5,161 1,119 (3,275 ) 112 7,206 36,137 7,506 5,011
14.7 Expense recognised in Profit and loss account Current service cost 2,839 2,063 194 164
Net interest cost / (income) 1,719 7,000 (1,449 ) 767 4,558 9,063 (1,255 ) 931
14.8 Movement in the present value of defined benefit obligations Obligation as at July 1 96,324 53,202 9,347 4,672
Current service cost 2,839 2,063 194 164 Interest cost 10,004 10,750 991 1,135
Bene�ts paid (4,709 ) (4,709 ) (4,381 ) (1,523 ) - Acturial loss 2,045 35,018 10,781 4,899 Obligation as at June 30 106,503 96,324 16,932 9,347
14.9 Movement in the fair value of plan assets Plan Assets as at July 1 79,110 25,868 7,066 2,271
Expected return on plan assets 8,285 3,750 2,440 368 Contribution made 17,214 55,320 6,662 6,062
Bene�ts paid (4,709 ) (4,709 ) (4,381 ) (1,523 ) Acturial (loss) / gain (5,161 ) (1,119 ) 3,275 (112 )
Plan Assets as at June 30 94,739 79,110 15,062 7,066
Pension Plan Pensioners’ Medical Plan
14.12 Pre-Retirement mortality was assumed to be SLIC (2001-2005), rated down one year.
14.13 In case of the funded plans, the Company ensures that the investment positions are managed within an Asset-Liability Matching (ALM) framework that has been developed to achieve long-term investments that are in line with the obligations under the Retirement bene�t plan. Within this framework, the Company’s ALM objective is to match assets to the retirement bene�t obligations by investing in long-term �xed interest securities with maturities that match the bene�t payments as they fall due and in the appropriate currency. The Company actively monitors how the duration and the expected yield of the investments are matching the expected cash out�ows arising from the Retirement bene�t plan obligations. The Company has not changed the processes used to manage its risks from previous periods. The Company does not use derivatives to manage its risk. Investments are well diversi�ed, such that the failure of any single investment would not have a material impact on the overall level of assets. A large portion of assets in 2016 consists of government bonds and term deposits. The Company believes that government bonds offer the best returns over the long term with an acceptable level of risk.
14.14 The expected return on plan assets was determined by considering the expected returns available on the assets underlying the current investment policy. Expected yields on �xed interest investments are based on gross redemption yields as at the balance sheet date.
Expected charge for the year ending June 30, 2017 works out to be Rs. 4.23 million and Rs. 0.51 million for Pension Plan and Pensioners' Medical Plan respectively.
The actuary conducts separate valuations for calculating contribution rates and the Company contributes to the Pension Plan and Pensioners' Medical Plan according to the actuary’s advice. The expense of the de�ned bene�t plans is calculated by the actuary.
Figures in this note are based on the latest actuarial valuation carried out as at June 30, 2016.
(Rupees in thousand)
2016 2015
14.10 Plan assets comprise of the following:
Defence Savings Certi�cates 101,115 26,514 Cash at bank 1,241 59,662 Investment in mutual fund 7,445 - - 109,801 86,176
14.11 Principal actuarial assumptions
Expected rate of increase in salaries 9.00% 10.50% Expected rate of increase in pension 4.00% 5.50% Expected rate of increase in medical bene�ts 9.00% 10.50% Discount factor used 9.00% 10.50%
Annual Report 2016 95Share Food, Share Love94

Notes to the Financial StatementsFOR THE YEAR ENDED JUNE 30, 2016
Notes to the Financial StatementsFOR THE YEAR ENDED JUNE 30, 2016
14.15 Sensitivity analysis for actuarial assumptions
The sensitivity of the de�ned bene�t obligation to changes in the weighted principal assumptions is:
(Rupees in thousand)
Discount rate at June 30 1.00% 107,404 143,343 Future salary increases 1.00% 113,531 100,044 Future pension increases 1.00% 116,299 97,981 Medical cost increases 1.00% 19,394 14,928
The sensitivity analysis is based on a change in an assumption while holding all other assumptions constant. In practice, this is unlikely to occur, and changes in some of the assumptions may be correlated. When calculating the sensitivity of the de�ned bene�t obligation to signi�cant actuarial assumptions the same method (present value of the de�ned bene�t obligation calculated with the projected unit credit method at the end of the reporting period) has been applied when calculating the pension liability recognised within the balance sheet.
The methods and types of assumptions used in preparing the sensitivity analysis did not change compared to the previous period.
Change in assumption
Impact on defined benefit obligation
Increase in assumption
Decrease in assumption
2012
14.16 Comparison for five years:
Fair value of plan assets 109,801 86,176 28,139 23,352 17,135 Present value of de�ned bene�t obligation (123,435 ) (105,671 ) (57,874 ) (47,281 ) (29,265 ) De�cit (13,634 ) (19,495 ) (29,735 ) (23,929 ) (12,130 )
Experience adjustments (Loss) / gain on plan assets (as a percentage of plan assets) (1.72 ) (1.43 ) (1.92) 2.17 (0.97) Loss on obligation (as a percentage of plan obligations) 10.39 37.77 8.50 28.49 1.14
14.17 The expected return on plan assets is based on the market expectations and depends upon the asset portfolio of the plan, at the beginning of the period, for returns over the entire life of the related obligation.
14.18 The weighted average duration of de�ned bene�t obligation of pension plan and pensioners' medical plan is 14.40 and 13.26 years respectively.
2014 20132016 2015(Rupees in thousand)
14.19 Expected maturity analysis of undiscounted retirement bene�t plans.
14.20 During the year, the Company contributed Rs. 34.31 million (2015: Rs. 26.98 million) to the provident fund.
Retirement bene�t plans 5,998 6,124 12,644 41,805 66,571
Less thana year
(Rupees in thousand)
Between1-2 years
Between2-5 years
Between5-10 years Total
(Rupees in thousand)
2016 2015
15. TRADE AND OTHER PAYABLES
Creditors 203,986 450,832
Accrued liabilities 1,511,012 962,661
Workers' Pro�ts Participation Fund - note 10.1 - - 12,197
Workers' Welfare Fund 46,522 26,162
Advances from customers 62,718 107,742
Payable to provident fund 8,298 4,279
Tax deducted at source 47,938 23,890
Due to related parties - directors 87 14
- others - - 4,078
Advances from employees against sale of vehicles 68,140 59,552
Unclaimed dividend 9,710 5,480
Other liabilities 2,024 15,796
1,960,435 1,672,683
16. SHORT TERM BORROWINGS
Running �nance under mark up arrangements 911,326 284,094
Export re-�nance 400,000 100,000
1,311,326 384,094
Annual Report 2016 97Share Food, Share Love96

Notes to the Financial StatementsFOR THE YEAR ENDED JUNE 30, 2016
Notes to the Financial StatementsFOR THE YEAR ENDED JUNE 30, 2016
18.1 Export sales represents sales made to NF DMCC - a wholly owned subsidiary of the Company.
18.2 The Company's customer base is diverse with no single customer accounting for more than 10% of net sales.
(Rupees in thousand)
2016 2015
19. COST OF SALES
Raw material consumed 5,600,410 4,580,377
Packing material consumed 2,237,022 2,012,418
Stores and spares consumed 63,654 61,054
Brine and cutting charges 41,084 42,978
Salaries, wages and other bene�ts 738,333 438,333
Contribution to provident fund 11,797 9,569
Depreciation / amortisation 145,411 131,544
Ujrah payments 14,525 9,914
Fuel and power 188,140 167,559
Insurance 21,863 18,904
Laboratory, research and development 6,330 5,953
Postage and communications 6,186 6,523
Printing and stationery 1,008 821
Rent, rates and taxes 125,821 89,184
Travelling 74,862 71,317
Repairs and maintenance 35,262 36,984
Security charges 21,087 13,139
Inventory destruction charges 17,007 - -
Others 3,366 4,984
9,353,168 7,701,555
Opening work in process 817,850 592,587
Closing work in process (963,780 ) (817,850 )
Cost of goods manufactured 9,207,238 7,476,292
Opening stock of �nished goods 279,604 345,116
Closing stock of �nished goods (549,375 ) (279,604 )
8,937,467 7,541,804
16.1 This includes running �nance balance maintained with Islamic Bank having balance of Rs. 287.37 million (2015: Nil).
16.2 The facilities available from various banks amount to Rs. 2.93 billion (2015: Rs. 3.44 billion). The arrangements
are secured by way of pari-passu charge against hypothecation of Company's stock in trade, movables and trade debts. The facilities expiring within one year are annual facilities subject to review at various dates during 2016 and 2017.
16.3 The rates of mark up range from one month KIBOR plus 0.05% to six months KIBOR plus 0.2% per annum (2015: one month KIBOR plus 0.2% to six months KIBOR plus 0.9% per annum).
16.4 The facilities for opening letters of credit amount to Rs. 1.19 billion (2015: Rs. 1.35 billion) and for letters of guarantee amount to Rs. 243.3 million (2015: Rs. 141 million) as at June 30, 2016 of which the amount remaining unutilised at year end were Rs. 1.07 billion (2015: Rs. 1.21 billion) and Rs. 76.75 million (2015: Rs. 74.78 million) respectively.
17. COMMITMENTS
Aggregate commitments for capital expenditure as at June 30, 2016 amount to Rs. 404.46 million (2015: Rs. 188.60 million).
A ggregate commitments in respect of ujrah payments for ijarah �nancing of motor vehicles bearing a mark up ranging from six months KIBOR + 0.6% to six months KIBOR + 0.9% (2015: six months KIBOR + 0.6% to six months KIBOR + 0.9%) per annum for rentals payable monthly as at June 30, 2016 amount to:
(Rupees in thousand)
2016 2015
Not later than one year 55,332 53,984 Over one year to �ve years 80,769 71,322 136,101 125,306
(Rupees in thousand)
2016 2015
18. SALES
Manufactured goods
Gross sales Local sales 17,801,422 15,003,578
Export sales - note 18.1 987,460 1,204,409 18,788,882 16,207,987 Sales tax (2,380,572 ) (1,956,026 ) 16,408,310 14,251,961 Less:
Discount, rebates and allowances 2,937,685 2,496,784 Sales return 287,440 173,741 3,225,125 2,670,525 13,183,185 11,581,436
Annual Report 2016 99Share Food, Share Love98
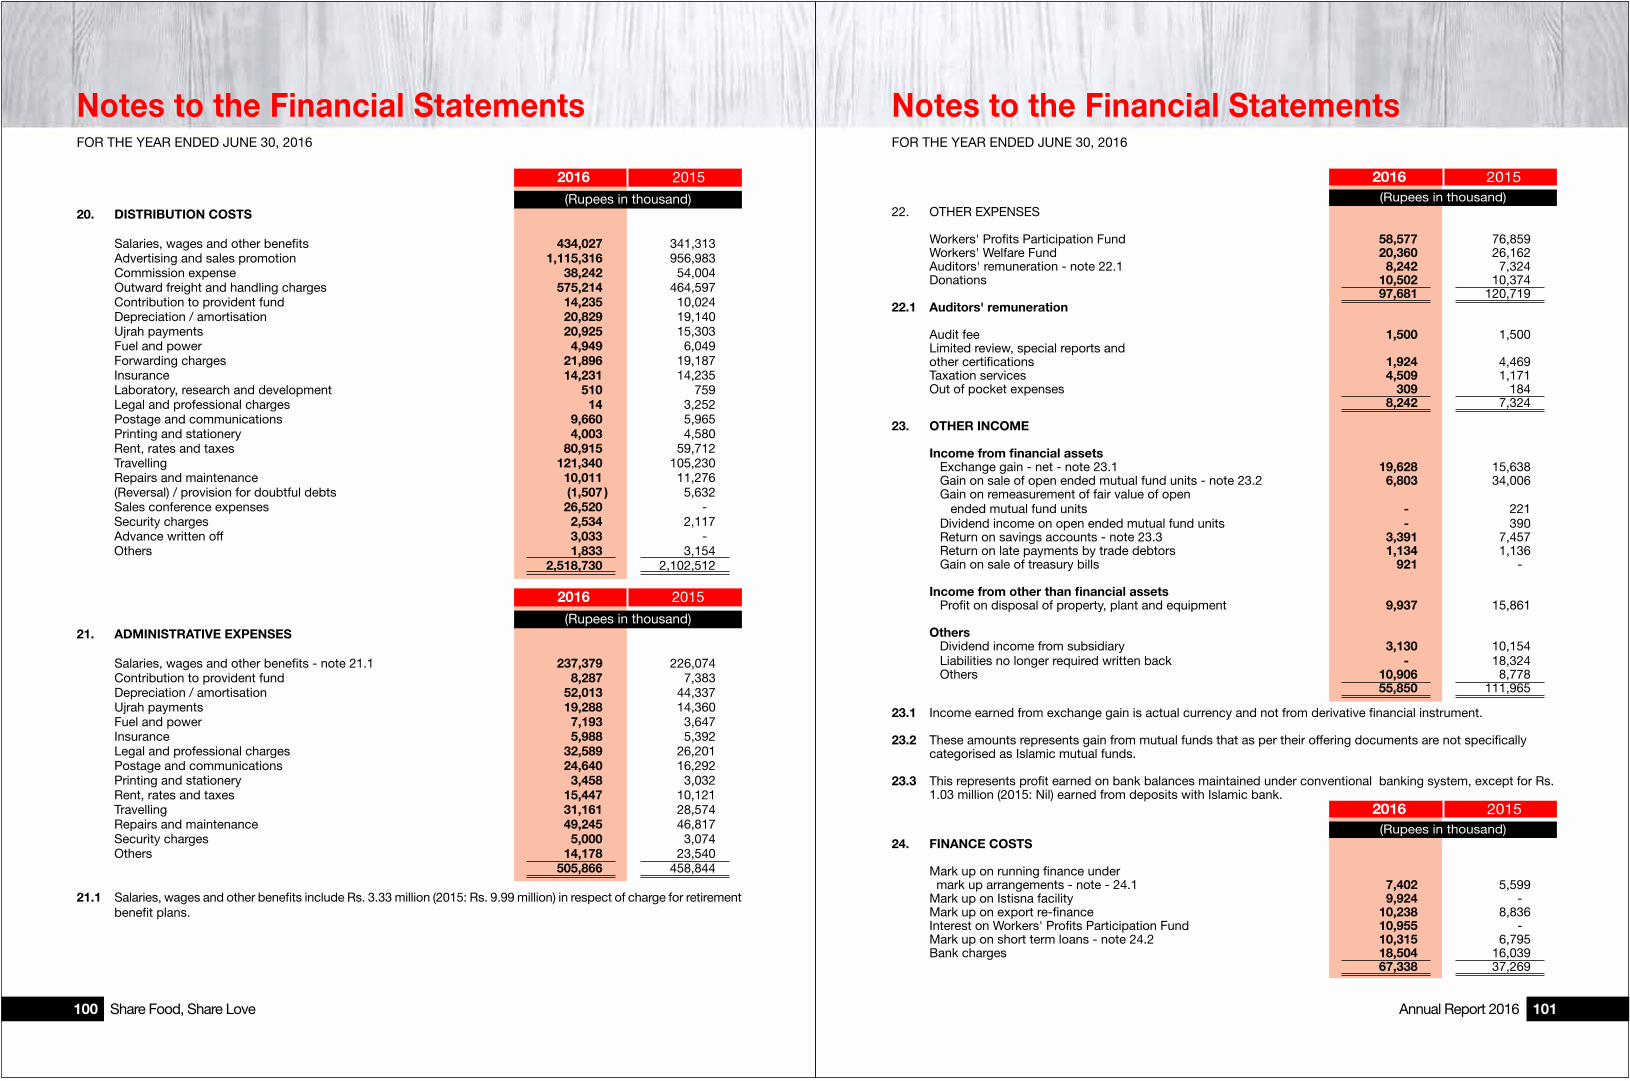
Notes to the Financial StatementsFOR THE YEAR ENDED JUNE 30, 2016
Notes to the Financial StatementsFOR THE YEAR ENDED JUNE 30, 2016
21.1 Salaries, wages and other bene�ts include Rs. 3.33 million (2015: Rs. 9.99 million) in respect of charge for retirement bene�t plans.
(Rupees in thousand)
2016 2015
20. DISTRIBUTION COSTS Salaries, wages and other bene�ts 434,027 341,313 Advertising and sales promotion 1,115,316 956,983 Commission expense 38,242 54,004 Outward freight and handling charges 575,214 464,597 Contribution to provident fund 14,235 10,024 Depreciation / amortisation 20,829 19,140 Ujrah payments 20,925 15,303 Fuel and power 4,949 6,049 Forwarding charges 21,896 19,187 Insurance 14,231 14,235 Laboratory, research and development 510 759 Legal and professional charges 14 3,252 Postage and communications 9,660 5,965 Printing and stationery 4,003 4,580 Rent, rates and taxes 80,915 59,712 Travelling 121,340 105,230 Repairs and maintenance 10,011 11,276 (Reversal) / provision for doubtful debts (1,507 ) 5,632 Sales conference expenses 26,520 - - Security charges 2,534 2,117 Advance written off 3,033 - - Others 1,833 3,154
2,518,730 2,102,512
(Rupees in thousand)
2016 2015
21. ADMINISTRATIVE EXPENSES Salaries, wages and other bene�ts - note 21.1 237,379 226,074 Contribution to provident fund 8,287 7,383 Depreciation / amortisation 52,013 44,337 Ujrah payments 19,288 14,360 Fuel and power 7,193 3,647 Insurance 5,988 5,392 Legal and professional charges 32,589 26,201 Postage and communications 24,640 16,292 Printing and stationery 3,458 3,032 Rent, rates and taxes 15,447 10,121 Travelling 31,161 28,574 Repairs and maintenance 49,245 46,817 Security charges 5,000 3,074 Others 14,178 23,540 505,866 458,844
(Rupees in thousand)
2016 2015
22. OTHER EXPENSES
Workers' Pro�ts Participation Fund 58,577 76,859 Workers' Welfare Fund 20,360 26,162 Auditors' remuneration - note 22.1 8,242 7,324 Donations 10,502 10,374
97,681 120,719 22.1 Auditors' remuneration
Audit fee 1,500 1,500 Limited review, special reports and other certi�cations 1,924 4,469 Taxation services 4,509 1,171 Out of pocket expenses 309 184
8,242 7,324
23. OTHER INCOME
Income from financial assets Exchange gain - net - note 23.1 19,628 15,638
Gain on sale of open ended mutual fund units - note 23.2 6,803 34,006 Gain on remeasurement of fair value of open
ended mutual fund units - - 221 Dividend income on open ended mutual fund units - - 390 Return on savings accounts - note 23.3 3,391 7,457 Return on late payments by trade debtors 1,134 1,136 Gain on sale of treasury bills 921 - -
Income from other than financial assets Pro�t on disposal of property, plant and equipment 9,937 15,861
Others Dividend income from subsidiary 3,130 10,154
Liabilities no longer required written back - - 18,324 Others 10,906 8,778 55,850 111,965
(Rupees in thousand)
2016 2015
24. FINANCE COSTS
Mark up on running �nance under mark up arrangements - note - 24.1 7,402 5,599
Mark up on Istisna facility 9,924 - - Mark up on export re-�nance 10,238 8,836 Interest on Workers' Pro�ts Participation Fund 10,955 - - Mark up on short term loans - note 24.2 10,315 6,795 Bank charges 18,504 16,039 67,338 37,269
23.1 Income earned from exchange gain is actual currency and not from derivative �nancial instrument.
23.2 These amounts represents gain from mutual funds that as per their offering documents are not speci�cally categorised as Islamic mutual funds.
23.3 This represents pro�t earned on bank balances maintained under conventional banking system, except for Rs. 1.03 million (2015: Nil) earned from deposits with Islamic bank.
Annual Report 2016 101Share Food, Share Love100
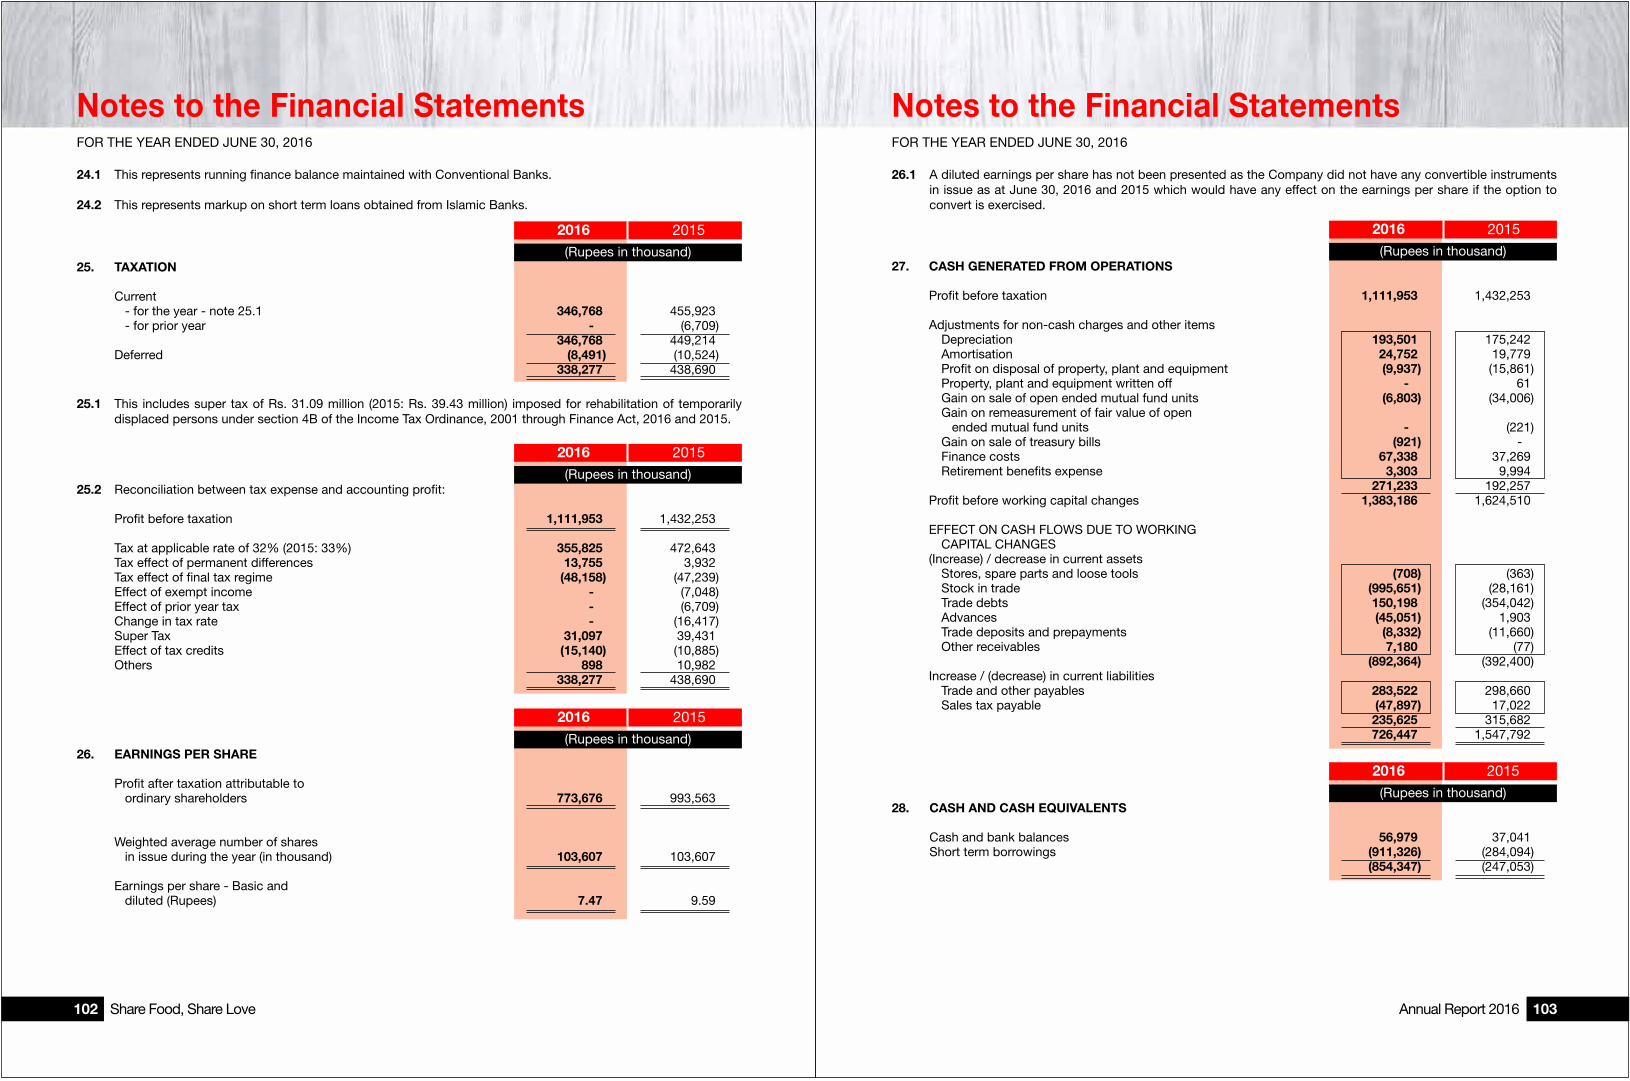
Notes to the Financial StatementsFOR THE YEAR ENDED JUNE 30, 2016
Notes to the Financial StatementsFOR THE YEAR ENDED JUNE 30, 2016
24.1 This represents running �nance balance maintained with Conventional Banks. 24.2 This represents markup on short term loans obtained from Islamic Banks.
25.1 This includes super tax of Rs. 31.09 million (2015: Rs. 39.43 million) imposed for rehabilitation of temporarily displaced persons under section 4B of the Income Tax Ordinance, 2001 through Finance Act, 2016 and 2015.
(Rupees in thousand)
2016 2015
(Rupees in thousand)
2016 2015
26. EARNINGS PER SHARE
Pro�t after taxation attributable to ordinary shareholders 773,676 993,563 Weighted average number of shares
in issue during the year (in thousand) 103,607 103,607
Earnings per share - Basic and diluted (Rupees) 7.47 9.59
(Rupees in thousand)
2016 2015
25.2 Reconciliation between tax expense and accounting pro�t:
Pro�t before taxation 1,111,953 1,432,253 Tax at applicable rate of 32% (2015: 33%) 355,825 472,643 Tax effect of permanent differences 13,755 3,932 Tax effect of �nal tax regime (48,158 ) (47,239 ) Effect of exempt income - - (7,048 ) Effect of prior year tax - - (6,709 ) Change in tax rate - - (16,417 ) Super Tax 31,097 39,431 Effect of tax credits (15,140 ) (10,885 ) Others 898 10,982
338,277 438,690
25. TAXATION
Current - for the year - note 25.1 346,768 455,923
- for prior year - - (6,709 ) 346,768 449,214 Deferred (8,491 ) (10,524 ) 338,277 438,690
(Rupees in thousand)
2016 2015
27. CASH GENERATED FROM OPERATIONS
Pro�t before taxation 1,111,953 1,432,253 Adjustments for non-cash charges and other items Depreciation 193,501 175,242 Amortisation 24,752 19,779 Pro�t on disposal of property, plant and equipment (9,937 ) (15,861 ) Property, plant and equipment written off - - 61 Gain on sale of open ended mutual fund units (6,803 ) (34,006 ) Gain on remeasurement of fair value of open ended mutual fund units - - (221 ) Gain on sale of treasury bills (921 ) - -
Finance costs 67,338 37,269 Retirement bene�ts expense 3,303 9,994 271,233 192,257
Pro�t before working capital changes 1,383,186 1,624,510
EFFECT ON CASH FLOWS DUE TO WORKING CAPITAL CHANGES (Increase) / decrease in current assets Stores, spare parts and loose tools (708 ) (363 )
Stock in trade (995,651 ) (28,161 ) Trade debts 150,198 (354,042 ) Advances (45,051 ) 1,903 Trade deposits and prepayments (8,332 ) (11,660 ) Other receivables 7,180 (77 ) (892,364 ) (392,400 ) Increase / (decrease) in current liabilities
Trade and other payables 283,522 298,660 Sales tax payable (47,897 ) 17,022 235,625 315,682 726,447 1,547,792
(Rupees in thousand)
2016 2015
28. CASH AND CASH EQUIVALENTS
Cash and bank balances 56,979 37,041 Short term borrowings (911,326 ) (284,094 ) (854,347 ) (247,053 )
26.1 A diluted earnings per share has not been presented as the Company did not have any convertible instruments in issue as at June 30, 2016 and 2015 which would have any effect on the earnings per share if the option to convert is exercised.
Annual Report 2016 103Share Food, Share Love102
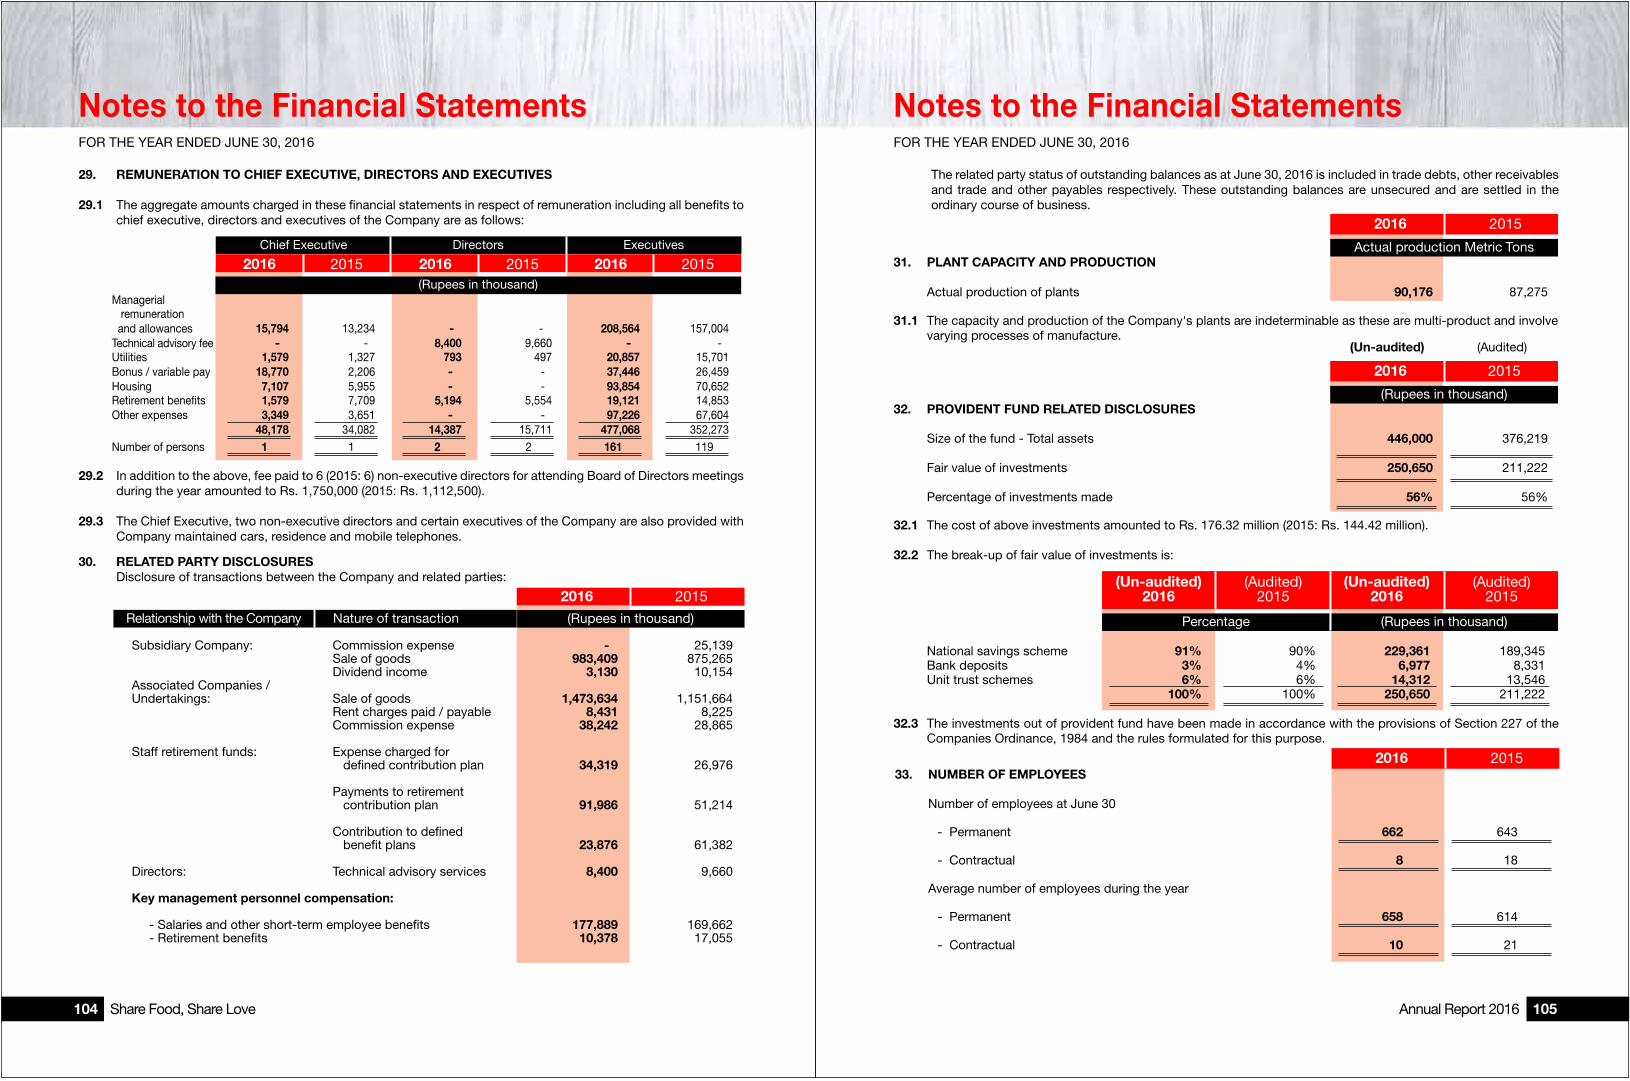
Notes to the Financial StatementsFOR THE YEAR ENDED JUNE 30, 2016
Notes to the Financial StatementsFOR THE YEAR ENDED JUNE 30, 2016
The related party status of outstanding balances as at June 30, 2016 is included in trade debts, other receivables and trade and other payables respectively. These outstanding balances are unsecured and are settled in the ordinary course of business.
Actual production Metric Tons
2016 2015
31. PLANT CAPACITY AND PRODUCTION
Actual production of plants 90,176 87,275
31.1 The capacity and production of the Company's plants are indeterminable as these are multi-product and involve varying processes of manufacture.
32.1 The cost of above investments amounted to Rs. 176.32 million (2015: Rs. 144.42 million).
32.2 The break-up of fair value of investments is:
(Rupees in thousand)
2016 2015
32. PROVIDENT FUND RELATED DISCLOSURES
Size of the fund - Total assets 446,000 376,219 Fair value of investments 250,650 211,222 Percentage of investments made 56% 56%
(Un-audited) (Audited)
(Rupees in thousand)Percentage
(Un-audited)2016
(Audited)2015
National savings scheme 91% 90% 229,361 189,345 Bank deposits 3% 4% 6,977 8,331 Unit trust schemes 6% 6% 14,312 13,546 100% 100% 250,650 211,222
32.3 The investments out of provident fund have been made in accordance with the provisions of Section 227 of the Companies Ordinance, 1984 and the rules formulated for this purpose.
2016 201533. NUMBER OF EMPLOYEES
Number of employees at June 30 - Permanent 662 643
- Contractual 8 18
Average number of employees during the year - Permanent 658 614
- Contractual 10 21
(Un-audited)2016
(Audited)2015
29. REMUNERATION TO CHIEF EXECUTIVE, DIRECTORS AND EXECUTIVES
29.1 The aggregate amounts charged in these �nancial statements in respect of remuneration including all bene�ts to chief executive, directors and executives of the Company are as follows:
30. RELATED PARTY DISCLOSURES Disclosure of transactions between the Company and related parties:
29.2 In addition to the above, fee paid to 6 (2015: 6) non-executive directors for attending Board of Directors meetings during the year amounted to Rs. 1,750,000 (2015: Rs. 1,112,500).
29.3 The Chief Executive, two non-executive directors and certain executives of the Company are also provided with Company maintained cars, residence and mobile telephones.
Managerial remuneration and allowances 15,794 13,234 - - - - 208,564 157,004 Technical advisory fee - - - - 8,400 9,660 - - - -
Utilities 1,579 1,327 793 497 20,857 15,701 Bonus / variable pay 18,770 2,206 - - - - 37,446 26,459 Housing 7,107 5,955 - - - - 93,854 70,652 Retirement bene�ts 1,579 7,709 5,194 5,554 19,121 14,853 Other expenses 3,349 3,651 - - - - 97,226 67,604 48,178 34,082 14,387 15,711 477,068 352,273
Number of persons 1 1 2 2 161 119
(Rupees in thousand)
2016 2015Chief Executive Directors Executives
2016 20152016 2015
2016 2015
Subsidiary Company: Commission expense - - 25,139 Sale of goods 983,409 875,265 Dividend income 3,130 10,154 Associated Companies /
Undertakings: Sale of goods 1,473,634 1,151,664 Rent charges paid / payable 8,431 8,225 Commission expense 38,242 28,865 Staff retirement funds: Expense charged for de�ned contribution plan 34,319 26,976 Payments to retirement contribution plan 91,986 51,214 Contribution to de�ned bene�t plans 23,876 61,382 Directors: Technical advisory services 8,400 9,660 Key management personnel compensation:
- Salaries and other short-term employee bene�ts 177,889 169,662 - Retirement bene�ts 10,378 17,055
(Rupees in thousand) Nature of transactionRelationship with the Company
Annual Report 2016 105Share Food, Share Love104

Notes to the Financial StatementsFOR THE YEAR ENDED JUNE 30, 2016
Notes to the Financial StatementsFOR THE YEAR ENDED JUNE 30, 2016
All the �nancial instruments of the Company are designated as loans and receivables and hence measured at amortised cost. The effective interest / mark up rates for the monetary �nancial assets and liabilities are mentioned in respective notes to the �nancial statements.
i) Credit risk
Credit risk represents the accounting loss that would be recognised at the reporting date if counterparties failed to perform as contracted. Out of the total �nancial assets of Rs. 1.11 billion (2015: Rs. 1.64 billion) the �nancial assets exposed to the credit risk amounted to Rs. 1.11 billion (2015: Rs. 1.64 billion).
For trade debts, internal risk assessment process determines the credit quality of the customers, taking into account their �nancial positions, past experiences and other factors. Individual risk limits are set based on internal or external credit worthiness ratings in accordance with limits set by the management. As of June 30, 2016 trade debts of Rs. 310.39 million (2015: Rs. 347.93 million) were past due but not impaired. The carrying amount of trade debts relates to number of individual customers for whom there is no recent history of default.
The cash and bank balances represent low credit risk as major balances are placed with banks having credit ratings
of A1+ or above as assigned by PACRA or JCR-VIS. The other �nancial assets are neither material to the �nancial statements nor exposed to any signi�cant credit risk.
The management does not expect any losses from non-performance by these counterparties.
ii) Liquidity risk
Liquidity risk re�ects the Company's inability in raising funds to meet commitments. The Company manages liquidity risk by maintaining suf�cient cash and bank balances and the availability of �nancing through banking arrangements. Management monitors rolling forecasts of the Company’s liquidity reserve which comprises of undrawn borrowing facility and cash and cash equivalents on the basis of expected cash �ows.
iii) Market Risks
a) Foreign exchange risk
Foreign exchange risk arises mainly where receivables and payables exist in foreign currency. As at June 30, 2016, net �nancial assets of Rs. 400.35 million (2015: Rs. 597.25 million) were denominated in foreign currency which were exposed to foreign currency risk.
As at June 30, 2016, if the Pak Rupee had weakened / strengthened by 4% (2015: 4%) against US Dollar with all
other variables held constant, pro�t before tax for the year would have been lower / higher by Rs. 16.01 million (2015: Rs. 23.89 million), mainly as a result of foreign exchange losses / gains on translation of US Dollar denominated trade debts.
The sensitivity of foreign exchange rate looks at the outstanding foreign exchange balances of the Company only as at the balance sheet date and assumes this is the position for a full twelve-month period. The volatility percentages for movement in foreign exchange rates have been used due to the fact that historically (�ve years) rates have moved on average basis by the mentioned percentage per annum.
(Rupees in thousand)
Non-interest / Non-mark up bearing
Maturity up to one
year
Maturityafter one
yearSub-total
Interest / Mark up bearing
Maturity up to one
year
Maturityafter one
yearSub-total
34. FINANCIAL INSTRUMENTS AND RELATED DISCLOSURES
34.1 Financial risk factors
The Company's activities expose it to variety of �nancial risks namely credit risk, liquidity risk and market risk (including foreign exchange risk and interest rate risk). The Company's overall risk management programme focuses on having cost effective funding as well as manage �nancial risk to minimise earnings volatility and provide maximum return to shareholders.
34.2 Financial assets and liabilities by category and their respective maturities
Total
FINANCIAL ASSETS Loans and Receivables Trade debts - - - - - - 1,000,468 - - 1,000,468 1,000,468
Trade deposits - - - - - - 12,479 30,979 43,458 43,458 Other receivables - - - - - - 6,272 - - 6,272 6,272 Cash and bank balances - - - - - - 5 6,979 - - 56,979 56,979
June 30, 2016 - - - - - - 1,076,198 30,979 1,107,177 1,107,177 June 30, 2015 - - - - - - 1,602,883 34,768 1,637,651 1,637,651
FINANCIAL LIABILITIES
Trade and other payables - - - - - - 1,726,819 - - 1,726,819 1,726,819 Accrued interest / mark up - - - - - - 8,974 - - 8,974 8,974 Short term borrowings 1,311,326 - - 1,311,326 - - - - - - 1,311,326
June 30, 2016 1,311,326 - - 1,311,326 1,735,793 - - 1,735,793 3,047,119
June 30, 2015 384,094 - - 384,094 1,441,381 - - 1,441,381 1,825,475 ON BALANCE SHEET GAP
June 30, 2016 (1,311,326 ) - - (1,311,326 ) (659,595 ) 30,979 (628,616 ) (1,939,942 ) June 30, 2015 (384,094 ) - - (384,094 ) 161,502 34,768 196,270 (187,824 )
OFF BALANCE SHEET ITEMS Letters of credit 128,260 June 30, 2015 135,383 Letters of guarantees 166,550 June 30, 2015 66,220
Annual Report 2016 107Share Food, Share Love106

Notes to the Financial StatementsFOR THE YEAR ENDED JUNE 30, 2016
Notes to the Financial StatementsFOR THE YEAR ENDED JUNE 30, 2016
b) Interest rate risk
The Company’s only interest rate risk arises from borrowings as the Company has no interest-bearing assets. Borrowings issued at variable rates expose the Company to cash �ow interest rate risk.
At June 30, 2016, the Company had variable interest bearing �nancial liabilities of Rs. 1,311.32 million (2015: Rs.
384.09 million), and had the interest rates varied by 100 basis points (2015: 100 basis points) with all the other variables held constant, pro�t before tax for the year would have been lower / higher by approximately Rs. 13.11 million (2015: Rs. 3.86 million), mainly as a result of higher / lower interest expense on �oating rate borrowings.
The sensitivity of 100 basis points (2015: 100 basis points) movement in interest rates has been used as historically (�ve years) �oating interest rates have moved by an average of 100 basis points (2015: 100 basis points) per annum.
34.3 Capital Risk Management
The Company's objectives when managing capital are to safeguard the Company's ability to continue as a going concern in order to provide returns for shareholders and bene�t for other stake holders and to maintain an optimal capital structure to reduce the cost of capital.
During 2016, the Company's strategy was to maintain leveraged gearing. The gearing ratio as at June 30, 2016 was as follows:
(Rupees in thousand)
2016 2015
Total Borrowings 1,320,300 386,614 Cash and Bank (56,979 ) (37,041 ) Net Debt 1,263,321 349,573 Total Equity 2,483,772 2,756,888
Total Capital 3,747,093 3,106,461 Gearing Ratio 34% 11%
The Company �nances its operations through equity, borrowings and management of working capital with a view to maintaining an appropriate mix between various sources of �nance to minimise risk.
Chief Executive Director
34.4 Fair values of financial assets and liabilities
The carrying values of all �nancial assets and liabilities re�ected in the �nancial statements approximate their fair values.
35. CORRESPONDING FIGURE
Following reclassi�cation has been made for better presentation:
36. EVENTS OCCURRING AFTER BALANCE SHEET DATE
The Board of Directors in its meeting held on August 29, 2016 proposed a cash dividend for the year ended June 30, 2016 of Rs. 2.75 per share amounting to Rs. 0.28 billion (2015: cash dividend of Rs. 10 per share amounting to Rs. 1.04 billion) subject to the approval of the Company in the annual general meeting. Finance Act, 2015 introduced Income Tax at the rate of 10% on undistributed reserves where such reserves of the company are in excess of its paid up capital and the company derives pro�ts for a tax year but does not distribute requisite cash dividend within six months of the end of the said tax year. Liability in respect of such income tax, if any, is recognised when the prescribed time period for distribution of dividend expires.
37. DATE OF AUTHORISATION
These �nancial statements were authorised for issue by the Board of Directors of the Company on August 29, 2016.
Reclassification fromcomponent
Profit and loss account
Distribution Cost Sales 22,854
Reclassification tocomponent
Rupees inthousand
Annual Report 2016 109Share Food, Share Love108

Auditors' Report to the Members
We have audited the annexed consolidated �nancial statements comprising consolidated Balance Sheet of National Foods Limited (the holding Company) and its subsidiary company National Foods DMCC, Dubai, UAE as at June 30, 2016 and the related consolidated Pro�t and Loss Account, consolidated Cash Flow Statement and consolidated Statement of Changes in Equity together with the notes forming part thereof, for the year then ended. We have also expressed separate opinion on the �nancial statements of National Foods Limited. Financial statements of the subsidiary company have been audited by other �rm of auditors whose report has been furnished to us and our opinion, in so far as it relates to the amounts included for such company, is based solely on the report of such other auditors. These �nancial statements are the responsibility of the holding Company’s management. Our responsibility is to express an opinion on these �nancial statements based on our audit.
Our audit was conducted in accordance with the International Standards on Auditing and accordingly included such tests of accounting records and such other auditing procedures as we considered necessary in the circumstances.
In our opinion, the consolidated �nancial statements present fairly the �nancial position of National Foods Limited and its subsidiary company as at June 30, 2016 and the results of their operations for the year then ended.
A.F. Ferguson & Co.Chartered AccountantsKarachi
Dated: September 23, 2016
Name of Engagement Partner: Farrukh Rehman
Annual Report 2016 111
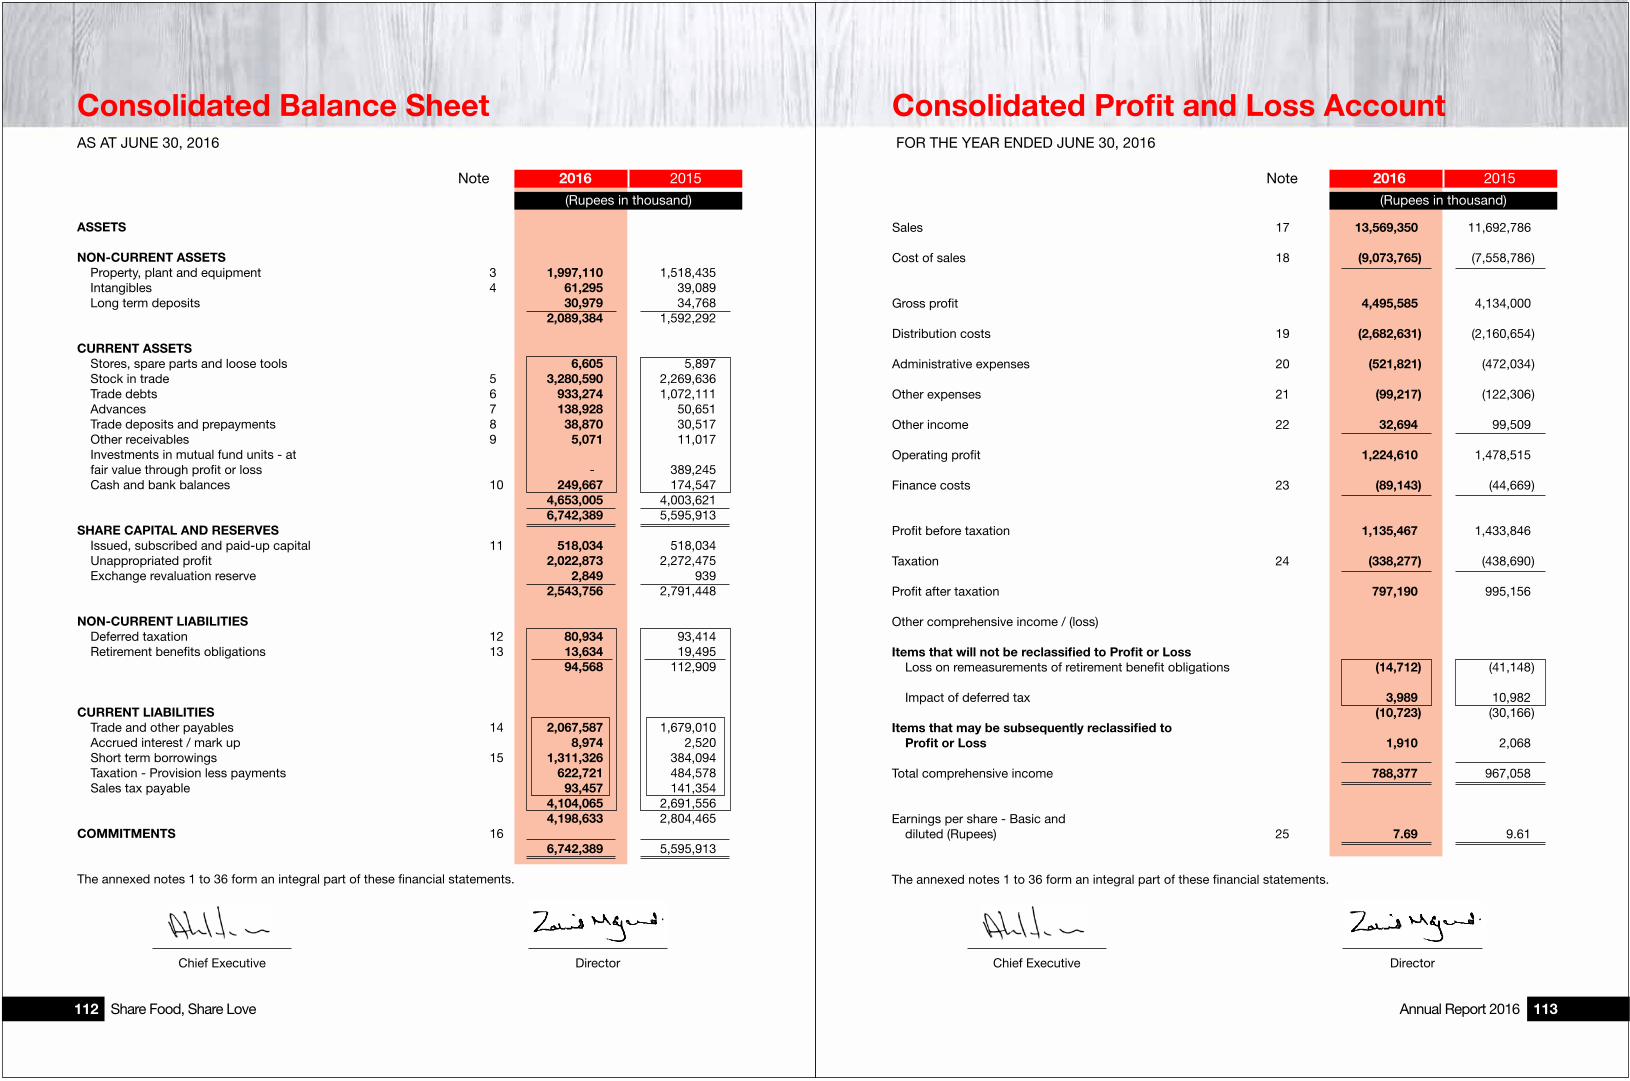
Consolidated Balance SheetAS AT JUNE 30, 2016
Consolidated Profit and Loss Account FOR THE YEAR ENDED JUNE 30, 2016
(Rupees in thousand)
Note
(Rupees in thousand)
2015Note
ASSETS
NON-CURRENT ASSETS Property, plant and equipment 3 1,997,110 1,518,435 Intangibles 4 61,295 39,089 Long term deposits 30,979 34,768 2,089,384 1,592,292
CURRENT ASSETS Stores, spare parts and loose tools 6,605 5,897 Stock in trade 5 3,280,590 2,269,636 Trade debts 6 933,274 1,072,111 Advances 7 138,928 50,651 Trade deposits and prepayments 8 38,870 30,517 Other receivables 9 5,071 11,017 Investments in mutual fund units - at fair value through pro�t or loss - - 389,245 Cash and bank balances 10 249,667 174,547 4,653,005 4,003,621 6,742,389 5,595,913 SHARE CAPITAL AND RESERVES Issued, subscribed and paid-up capital 11 518,034 518,034 Unappropriated pro�t 2,022,873 2,272,475 Exchange revaluation reserve 2,849 939 2,543,756 2,791,448
NON-CURRENT LIABILITIES Deferred taxation 12 80,934 93,414 Retirement bene�ts obligations 13 13,634 19,495 94,568 112,909
CURRENT LIABILITIES Trade and other payables 14 2,067,587 1,679,010 Accrued interest / mark up 8,974 2,520 Short term borrowings 15 1,311,326 384,094 Taxation - Provision less payments 622,721 484,578 Sales tax payable 93,457 141,354 4,104,065 2,691,556 4,198,633 2,804,465 COMMITMENTS 16 6,742,389 5,595,913
The annexed notes 1 to 36 form an integral part of these �nancial statements.
2016
Chief Executive Director Chief Executive Director
20152016
Sales 17 13,569,350 11,692,786 Cost of sales 18 (9,073,765 ) (7,558,786 )
Gross pro�t 4,495,585 4,134,000 Distribution costs 19 (2,682,631 ) (2,160,654 ) Administrative expenses 20 (521,821 ) (472,034 ) Other expenses 21 (99,217 ) (122,306 ) Other income 22 32,694 99,509 Operating pro�t 1,224,610 1,478,515 Finance costs 23 (89,143 ) (44,669 ) Pro�t before taxation 1,135,467 1,433,846 Taxation 24 (338,277 ) (438,690 ) Pro�t after taxation 797,190 995,156 Other comprehensive income / (loss)
Items that will not be reclassified to Profit or Loss Loss on remeasurements of retirement bene�t obligations (14,712 ) (41,148 ) Impact of deferred tax 3,989 10,982 (10,723 ) (30,166 )Items that may be subsequently reclassified to Profit or Loss 1,910 2,068 Total comprehensive income 788,377 967,058 Earnings per share - Basic and
diluted (Rupees) 25 7.69 9.61 The annexed notes 1 to 36 form an integral part of these �nancial statements.
Annual Report 2016 113Share Food, Share Love112
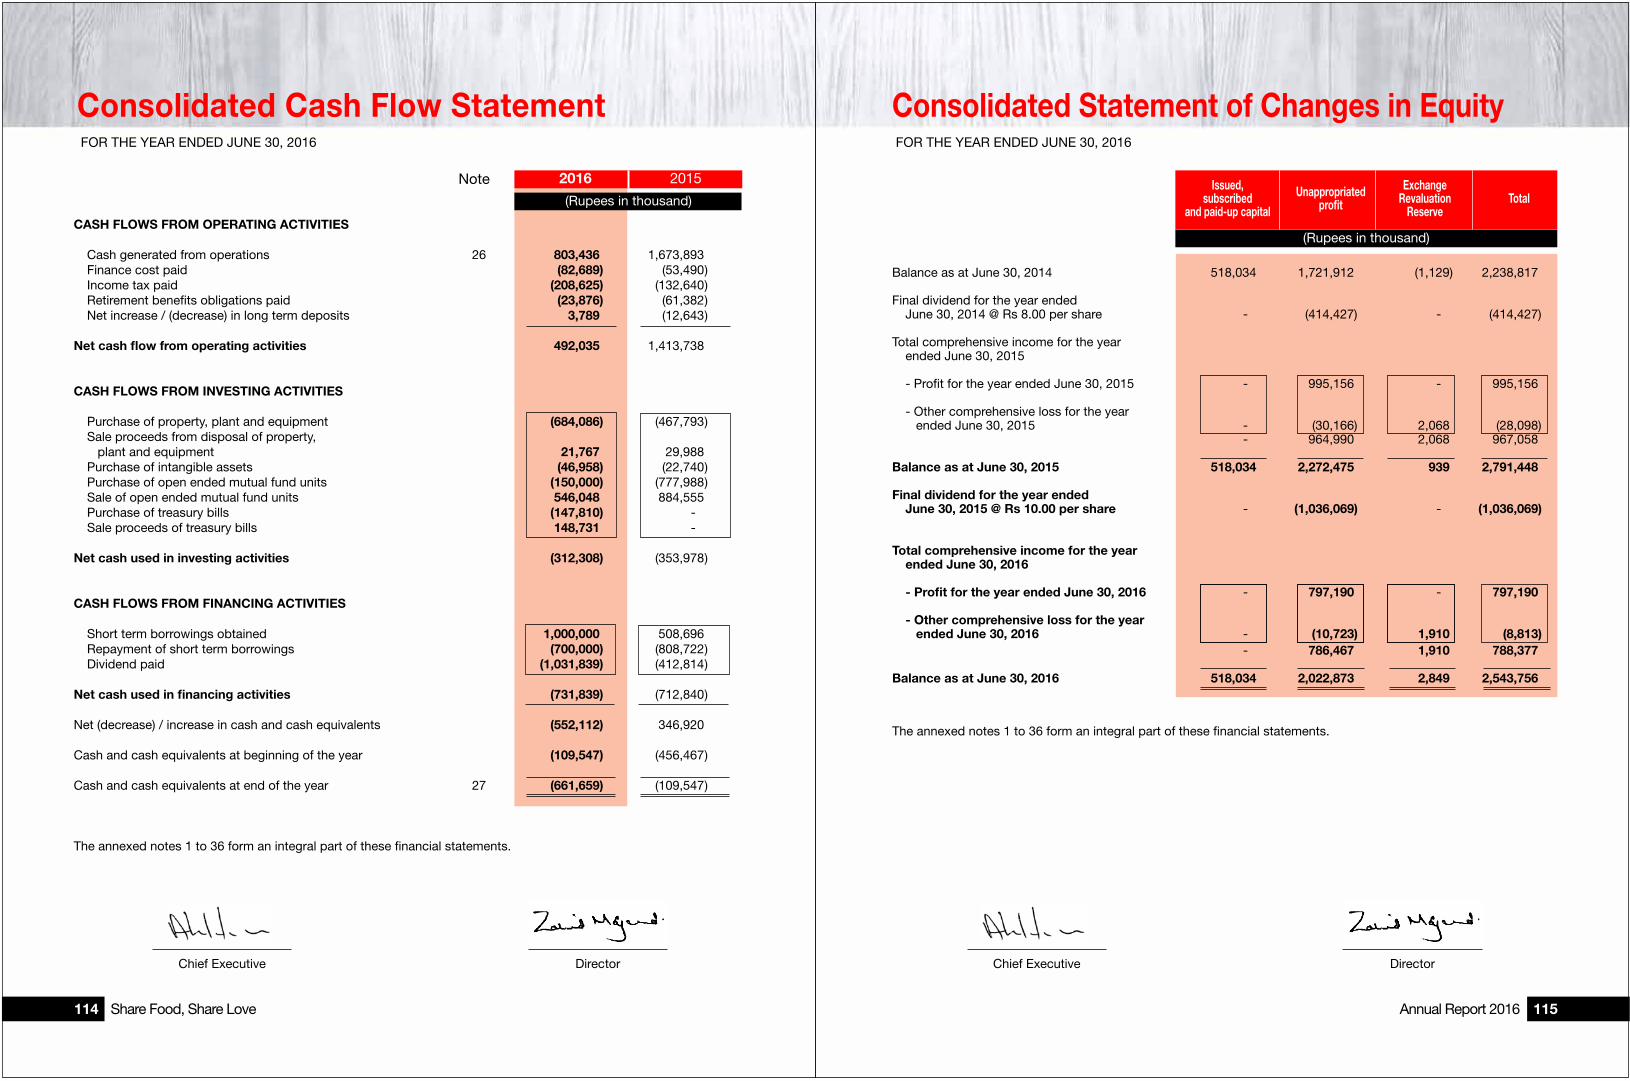
GOAT
Consolidated Cash Flow Statement Consolidated Statement of Changes in Equity FOR THE YEAR ENDED JUNE 30, 2016 FOR THE YEAR ENDED JUNE 30, 2016
(Rupees in thousand)
Note
CASH FLOWS FROM OPERATING ACTIVITIES
Cash generated from operations 26 803,436 1,673,893 Finance cost paid (82,689 ) (53,490 ) Income tax paid (208,625 ) (132,640 ) Retirement bene�ts obligations paid (23,876 ) (61,382 ) Net increase / (decrease) in long term deposits 3,789 (12,643 ) Net cash flow from operating activities 492,035 1,413,738
CASH FLOWS FROM INVESTING ACTIVITIES
Purchase of property, plant and equipment (684,086 ) (467,793 ) Sale proceeds from disposal of property, plant and equipment 21,767 29,988 Purchase of intangible assets (46,958 ) (22,740 ) Purchase of open ended mutual fund units (150,000 ) (777,988 ) Sale of open ended mutual fund units 546,048 884,555 Purchase of treasury bills (147,810 ) - - Sale proceeds of treasury bills 148,731 - -
Net cash used in investing activities (312,308 ) (353,978 )
CASH FLOWS FROM FINANCING ACTIVITIES
Short term borrowings obtained 1,000,000 508,696 Repayment of short term borrowings (700,000 ) (808,722 ) Dividend paid (1,031,839 ) (412,814 )
Net cash used in financing activities (731,839 ) (712,840 )
Net (decrease) / increase in cash and cash equivalents (552,112 ) 346,920 Cash and cash equivalents at beginning of the year (109,547 ) (456,467 ) Cash and cash equivalents at end of the year 27 (661,659 ) (109,547 )
The annexed notes 1 to 36 form an integral part of these �nancial statements.
(Rupees in thousand)
ExchangeRevaluation
ReserveTotal
Balance as at June 30, 2014 518,034 1,721,912 (1,129 ) 2,238,817 Final dividend for the year ended
June 30, 2014 @ Rs 8.00 per share - - (414,427 ) - - (414,427 ) Total comprehensive income for the year
ended June 30, 2015
- Pro�t for the year ended June 30, 2015 - - 995,156 - - 995,156
- Other comprehensive loss for the year ended June 30, 2015 - - (30,166 ) 2,068 (28,098 )
- - 964,990 2,068 967,058 Balance as at June 30, 2015 518,034 2,272,475 939 2,791,448 Final dividend for the year ended
June 30, 2015 @ Rs 10.00 per share - - (1,036,069 ) - - (1,036,069 )
Total comprehensive income for the year ended June 30, 2016
- Profit for the year ended June 30, 2016 - - 797,190 - - 797,190
- Other comprehensive loss for the year ended June 30, 2016 - - (10,723 ) 1,910 (8,813 )
- - 786,467 1,910 788,377 Balance as at June 30, 2016 518,034 2,022,873 2,849 2,543,756
The annexed notes 1 to 36 form an integral part of these �nancial statements.
Unappropriatedprofit
Issued,subscribed
and paid-up capital
Chief Executive Director Chief Executive Director
20152016
Annual Report 2016 115Share Food, Share Love114

Notes to the Consolidated Financial Statements Notes to the Consolidated Financial Statements FOR THE YEAR ENDED JUNE 30, 2016 FOR THE YEAR ENDED JUNE 30, 2016
1. THE GROUP AND ITS OPERATIONS
1.1 The group consists of: i) Holding Company - National Foods Limited
ii) Subsidiary Company - National Foods DMCC, Dubai
National Foods Limited
National Foods Limited was incorporated in Pakistan on February 19, 1970 as a private limited company under the Companies Act, 1913 and subsequently converted into a public limited company under the Companies Ordinance, 1984 by special resolution passed in the extra ordinary general meeting held on March 30, 1988. The company is principally engaged in the manufacture and sale of convenience based food products. It is listed on Pakistan Stock Exchange. The registered of�ce of the Company is situated at 12 / CL - 6, Claremont Road, Civil Lines, Karachi.
National Foods DMCC
National Foods DMCC was registered on 7 November 2012 in Dubai Multi Commodities Centre (“DMCC”) pursuant to Dubai (DMCC) Law No. 4 of 2001 and operates in the United Arab Emirates (“UAE”) under a trade license issued by DMCC. The registered address of the company is Unit No. R30-26, Floor No. 30, R Serviced Of�ces JLT, Reef Tower, Plot No. O1 Jumeirah Lakes Towers Dubai, United Arab Emirates. The company is a wholly owned subsidiary of National Foods Limited, Pakistan.
The company's primary objective is to boost export sales of its parent Company through trading in food stuff and other services.
National Foods DMCC also has following two wholly owned subsidiaries:
a) National Epicure Inc.
National Epicure Inc. was incorporated in Canada on 16 October 2013 under the Canada Business Corporations Act. The company is principally engaged in the trading of food products. The registered of�ce of the company is situated at 193 Maxome Avenue, Toronto, Ontario, Canada.
b) National Foods Pakistan (UK) Limited
National Foods Pakistan (UK) Limited was incorporated in United Kingdom on 29 May 2013 as a private company under the Companies Act, 2006. The company is principally engaged in the trading of food products. The registered of�ce of the company is situated at 27 Second Floor, Gloucester Place, London, United Kingdom.
1.2 Basis of consolidation
The consolidated �nancial statements include the �nancial statements of National Foods Limited and National Foods DMCC. The �nancial statements of the subsidiary company have been consolidated on a line by line basis.
All inter-company balances and transactions have been eliminated.
2. SUMMARY OF SIGNIFICANT ACCOUNTING POLICIES
The principal accounting policies applied in the preparation of these �nancial statements are set out below:
2.1 Basis of preparation
2.1.1 Statement of compliance
These �nancial statements have been prepared in accordance with approved accounting standards as applicable in Pakistan. Approved accounting standards comprise of such International Financial Reporting Standards (IFRS) issued by the International Accounting Standards Board as are noti�ed under the Companies Ordinance, 1984, provisions of and directives issued under the Companies Ordinance, 1984 including Islamic Financial Accounting Standards (IFAS). In case requirements differ, the provisions or directives of the Companies Ordinance, 1984 shall prevail.
2.1.2 Critical accounting estimates and judgements
The preparation of �nancial statements in conformity with the above requirements requires the use of certain critical accounting estimates. It also requires management to exercise its judgement in the process of applying the group's accounting policies. The matters involving a higher degree of judgement or complexity, or areas where assumptions and estimates are signi�cant to the �nancial statements are as follows:
(i) Taxation - notes 12.1 and 24 (ii) Retirement bene�ts obligations - note 13 Estimates and judgements are continually evaluated and are based on historical experience and other factors,
including expectations of future events that are believed to be reasonable under the circumstances.
There have been no critical judgements made by the group's management in applying the accounting policies that would have signi�cant effect on the amounts recognised in the �nancial statements.
2.1.3 Changes in accounting standards, interpretations and pronouncements
(a) Standards, interpretations and amendments to published approved accounting standards that are effective and relevant
Following amendments to existing standards and interpretations have been published and are mandatory for accounting periods beginning on or after January 1, 2015 and are considered to be relevant to the Group's operations.
IFRS 10, 'Consolidated �nancial statements' replaces all of the guidance on control and consolidation in IAS 27,
'Consolidated and separate �nancial statements', and SIC-12, 'Consolidation - special purpose entities'. IAS 27 is renamed 'Separate �nancial statements', it continues to be a standard dealing solely with separate �nancial statements. IFRS 10 has the potential to affect all reporting entities (investors) that control one or more investees under the revised de�nition of control. The standard presently does not impact �nancial statements of the group.
IFRS 11, ‘Joint arrangements’ focuses on the rights and obligations of the parties to the arrangement rather than its legal form. There are two types of joint arrangements: joint operations and joint ventures. Joint operations arise where the investors have rights to the assets and obligations for the liabilities of an arrangement. A joint operator accounts for its share of the assets, liabilities, revenue and expenses. Joint ventures arise where the investors have rights to the net assets of the arrangement; joint ventures are accounted for under the equity method. Proportional consolidation of joint arrangements is no longer permitted. There are no changes to disclosures on application of the standard on the Group's �nancial statements.
IFRS 12, 'Disclosures of interests in other entities' includes the disclosure requirements for all forms of interests in other entities, including joint arrangement, associates, structured entities and other off balance sheet vehicles. There are no changes to disclosures on application of the standard on the Group's �nancial statements.
Annual Report 2016 117Share Food, Share Love116

Notes to the Consolidated Financial Statements Notes to the Consolidated Financial Statements FOR THE YEAR ENDED JUNE 30, 2016 FOR THE YEAR ENDED JUNE 30, 2016
IFRS 13, 'Fair value measurement', aims to improve consistency and reduce complexity by providing a precise de�nition of fair value and a single source of fair value measurement and disclosure requirement for use across IFRSs. The requirement does not extend the use of fair value accounting but provides guidance on how it should be applied where its use is already required or permitted by other standards within IFRSs. There are no changes to disclosures on application of the standard on the Group's �nancial statements.
(b) Standards, interpretations and amendments to published approved accounting standards that are effective but not relevant
Except as stated above, the new standards, amendments and interpretations that are mandatory for accounting periods beginning on or after January 1, 2015 are considered not to be relevant for Group's �nancial statements and hence have not been detailed here.
(c) Standards, interpretations and amendments to published approved accounting standards that are not yet effective but relevant
IAS 1, ‘Presentation of �nancial statements’ aims to improve presentation and disclosure in �nancial reports by emphasising the importance of understandability, comparability and clarity in presentation.
The amendments provides clari�cation on number of issues, including:
- Materiality - an entity should not aggregate or disaggregate information in a manner that obscures useful information. Where items are material, suf�cient information must be provided to explain the impact on the �nancial position or performance.
- Disaggregation and subtotals – line items speci�ed in IAS 1 may need to be disaggregated where this is relevant to an understanding of the entity’s �nancial position or performance. There is also new guidance on the use of subtotals. - Notes – con�rmation that the notes do not need to be presented in a particular order.
- Other Comprehensive Income (OCI) - arising from investments accounted for under the equity method - the share of the OCI arising from equity - accounted investments is grouped based on whether the items will or will not subsequently be reclassi�ed to pro�t or loss. Each group should then be presented as a single line item in the statement of comprehensive income.
The change will impact the disclosures of the Group's �nancial statements.
2.2 Overall valuation policy
These �nancial statements have been prepared under the historical cost convention except as disclosed in the accounting policies below:
2.3 Property, plant and equipment
Property, plant and equipment are stated at cost less accumulated impairment and accumulated depreciation except capital work in progress which is stated at cost.
Depreciation on property, plant and equipment is charged to income applying the straight-line method over the estimated useful lives of related assets. Depreciation on additions is charged from the month in which the assets are put to use and on disposals up to the month of disposal.
Maintenance and normal repairs are charged to income as and when incurred. Major renewals and improvements are capitalised and assets so replaced, if any, are retired.
Pro�t and loss on sale or retirement of property, plant and equipment is included in income currently.
2.4 Intangibles - computer software
These are stated at cost less accumulated amortisation and impairment, if any. Generally, costs associated with developing or maintaining computer software programmes are recognised as an expense as incurred. However, costs that are directly associated with identi�able software and have probable economic bene�t exceeding one year are recognised as intangible assets. Direct costs include the purchase cost of software and related overhead cost.
Amortisation charge is based on the straight-line method whereby the cost of an intangible is written off over its
estimated useful life of three years.
2.5 Taxation
i) Current
Charge for current taxation is based on taxable income at the current rates of taxation after taking into account tax credits and rebates available, if any, and taxes paid under the �nal tax regime.
ii) Deferred
Deferred tax is accounted for using the balance sheet liability method on all temporary differences arising between tax base of assets and liabilities and their carrying amounts in the �nancial statements. Deferred tax liability is generally recognised for all taxable temporary differences and deferred tax asset is recognised to the extent that it is probable that future taxable pro�ts will be available against which the deductible temporary differences, unused tax losses and tax credits can be utilised. Deferred tax is charged or credited in the pro�t and loss account.
2.6 Employee retirement benefits
Defined benefit plans
The group operates a funded pension scheme and post retirement medical bene�t for chief executive and two non-executive directors. The liability recognised in the balance sheet in respect of the de�ned bene�t plans is the present value of the de�ned bene�t obligation at the end of the reporting period less the fair value of plan assets. The de�ned bene�t obligation is calculated annually by independent actuary using the projected unit credit method. The latest actuarial valuation of the de�ned bene�t plans was conducted at June 30, 2016.
Past service cost and the amount arising as a result of remeasurements are recognised in the Balance Sheet immediately, with a charge or credit to Other Comprehensive Income in the periods in which they occur.
Defined contribution plan The group operates an approved contributory provident fund for all employees. Equal monthly contributions are
made, both by the Group and the employees, to the fund at the rate of 10% per annum of the basic salary. 2.7 Stores, spare parts and loose tools These are valued at weighted average cost less provision for slow moving and obsolete stores, spare parts and
loose tools, if any. Items in transit are valued at cost comprising invoice value plus other charges incurred thereon.
Annual Report 2016 119Share Food, Share Love118
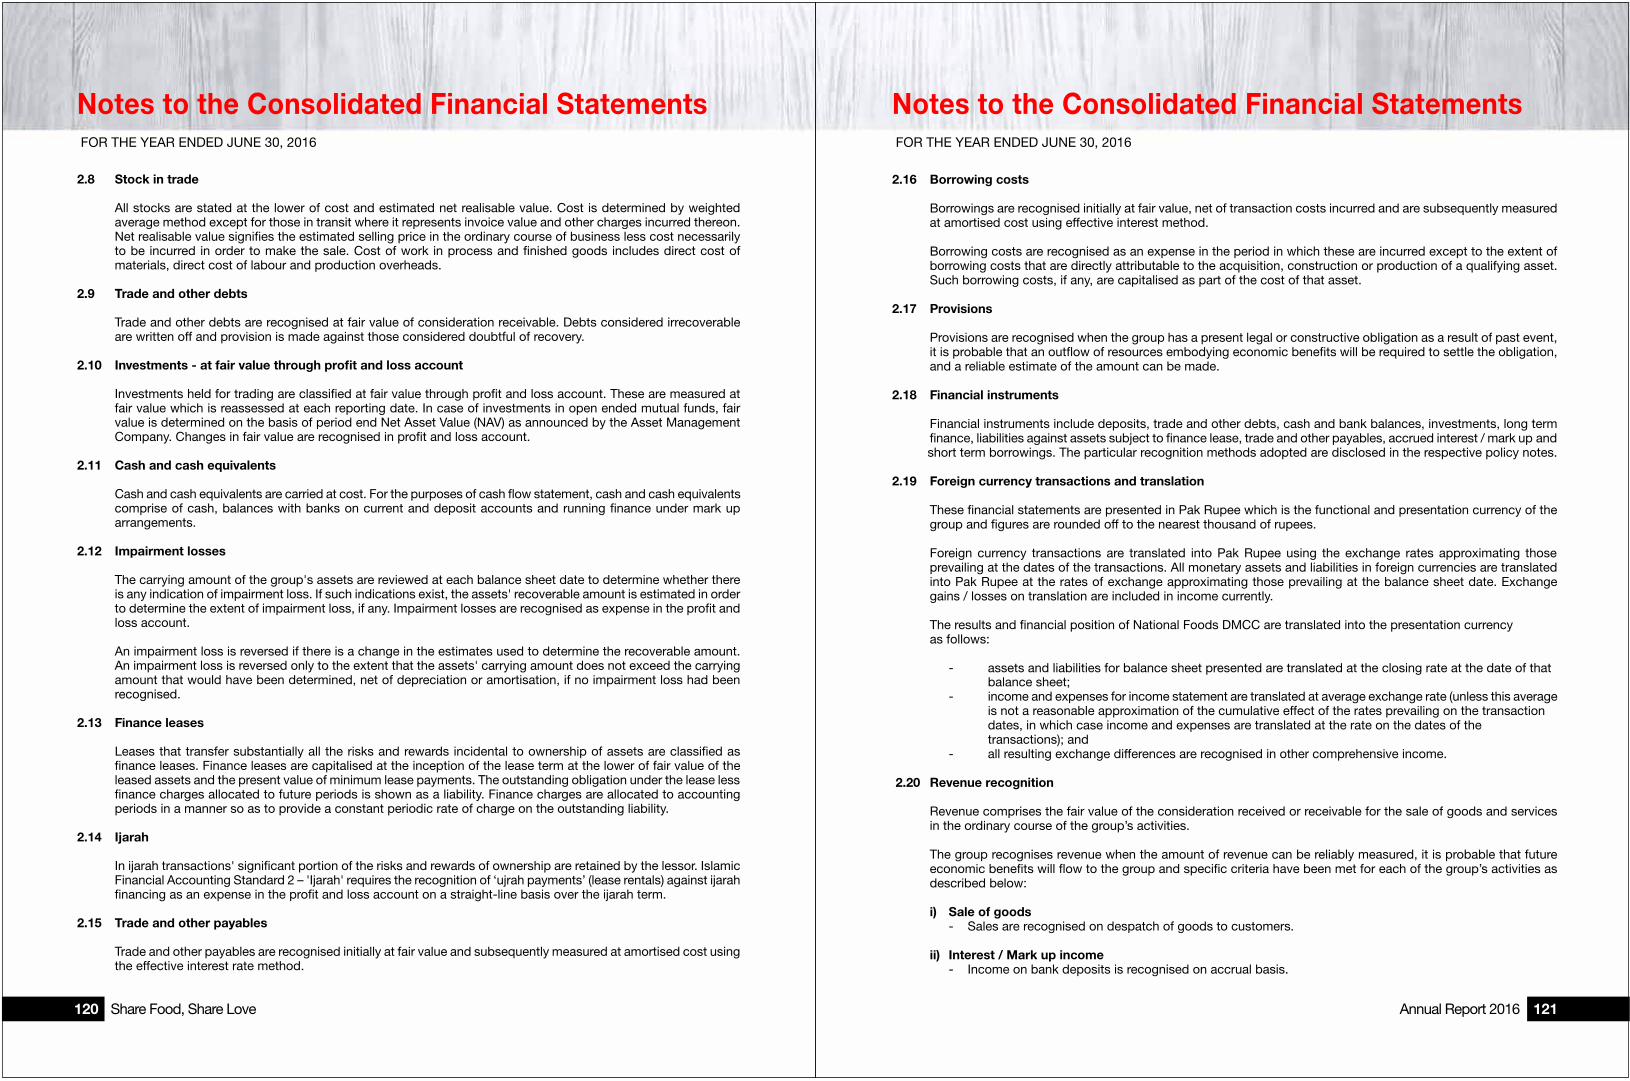
Notes to the Consolidated Financial Statements Notes to the Consolidated Financial Statements FOR THE YEAR ENDED JUNE 30, 2016 FOR THE YEAR ENDED JUNE 30, 2016
2.8 Stock in trade All stocks are stated at the lower of cost and estimated net realisable value. Cost is determined by weighted
average method except for those in transit where it represents invoice value and other charges incurred thereon. Net realisable value signi�es the estimated selling price in the ordinary course of business less cost necessarily to be incurred in order to make the sale. Cost of work in process and �nished goods includes direct cost of materials, direct cost of labour and production overheads.
2.9 Trade and other debts Trade and other debts are recognised at fair value of consideration receivable. Debts considered irrecoverable
are written off and provision is made against those considered doubtful of recovery.
2.10 Investments - at fair value through profit and loss account
Investments held for trading are classi�ed at fair value through pro�t and loss account. These are measured at fair value which is reassessed at each reporting date. In case of investments in open ended mutual funds, fair value is determined on the basis of period end Net Asset Value (NAV) as announced by the Asset Management Company. Changes in fair value are recognised in pro�t and loss account.
2.11 Cash and cash equivalents Cash and cash equivalents are carried at cost. For the purposes of cash �ow statement, cash and cash equivalents
comprise of cash, balances with banks on current and deposit accounts and running �nance under mark up arrangements.
2.12 Impairment losses The carrying amount of the group's assets are reviewed at each balance sheet date to determine whether there
is any indication of impairment loss. If such indications exist, the assets' recoverable amount is estimated in order to determine the extent of impairment loss, if any. Impairment losses are recognised as expense in the pro�t and loss account.
An impairment loss is reversed if there is a change in the estimates used to determine the recoverable amount.
An impairment loss is reversed only to the extent that the assets' carrying amount does not exceed the carrying amount that would have been determined, net of depreciation or amortisation, if no impairment loss had been recognised.
2.13 Finance leases
Leases that transfer substantially all the risks and rewards incidental to ownership of assets are classi�ed as �nance leases. Finance leases are capitalised at the inception of the lease term at the lower of fair value of the leased assets and the present value of minimum lease payments. The outstanding obligation under the lease less �nance charges allocated to future periods is shown as a liability. Finance charges are allocated to accounting periods in a manner so as to provide a constant periodic rate of charge on the outstanding liability.
2.14 Ijarah
In ijarah transactions' signi�cant portion of the risks and rewards of ownership are retained by the lessor. Islamic Financial Accounting Standard 2 – 'Ijarah' requires the recognition of ‘ujrah payments’ (lease rentals) against ijarah �nancing as an expense in the pro�t and loss account on a straight-line basis over the ijarah term.
2.15 Trade and other payables
Trade and other payables are recognised initially at fair value and subsequently measured at amortised cost using the effective interest rate method.
2.16 Borrowing costs
Borrowings are recognised initially at fair value, net of transaction costs incurred and are subsequently measured at amortised cost using effective interest method.
Borrowing costs are recognised as an expense in the period in which these are incurred except to the extent of borrowing costs that are directly attributable to the acquisition, construction or production of a qualifying asset. Such borrowing costs, if any, are capitalised as part of the cost of that asset.
2.17 Provisions
Provisions are recognised when the group has a present legal or constructive obligation as a result of past event, it is probable that an out�ow of resources embodying economic bene�ts will be required to settle the obligation, and a reliable estimate of the amount can be made.
2.18 Financial instruments Financial instruments include deposits, trade and other debts, cash and bank balances, investments, long term
�nance, liabilities against assets subject to �nance lease, trade and other payables, accrued interest / mark up and short term borrowings. The particular recognition methods adopted are disclosed in the respective policy notes.
2.19 Foreign currency transactions and translation
These �nancial statements are presented in Pak Rupee which is the functional and presentation currency of the group and �gures are rounded off to the nearest thousand of rupees.
Foreign currency transactions are translated into Pak Rupee using the exchange rates approximating those prevailing at the dates of the transactions. All monetary assets and liabilities in foreign currencies are translated into Pak Rupee at the rates of exchange approximating those prevailing at the balance sheet date. Exchange gains / losses on translation are included in income currently.
The results and �nancial position of National Foods DMCC are translated into the presentation currency as follows: - assets and liabilities for balance sheet presented are translated at the closing rate at the date of that balance sheet; - income and expenses for income statement are translated at average exchange rate (unless this average is not a reasonable approximation of the cumulative effect of the rates prevailing on the transaction dates, in which case income and expenses are translated at the rate on the dates of the transactions); and
- all resulting exchange differences are recognised in other comprehensive income.
2.20 Revenue recognition
Revenue comprises the fair value of the consideration received or receivable for the sale of goods and services in the ordinary course of the group’s activities.
The group recognises revenue when the amount of revenue can be reliably measured, it is probable that future economic bene�ts will �ow to the group and speci�c criteria have been met for each of the group’s activities as described below:
i) Sale of goods - Sales are recognised on despatch of goods to customers.
ii) Interest / Mark up income - Income on bank deposits is recognised on accrual basis.
Annual Report 2016 121Share Food, Share Love120

Notes to the Consolidated Financial Statements Notes to the Consolidated Financial Statements FOR THE YEAR ENDED JUNE 30, 2016 FOR THE YEAR ENDED JUNE 30, 2016
(Rupees in thousand)
2016 2015
3.2 Capital work in progress
These comprise of: Civil work in progress 391,176 93,856
Plant and machinery 272,273 145,084 Of�ce equipment 25,146 1,697 Advance against acquisition of land 81,424 66,956 770,019 307,593
3.3 The details of property, plant and equipment having net book value of Rs. 50,000 and above sold / disposed of during the year are as follows:
3.1.1 This includes Rs. 64.85 million (2015: Rs. 102.2 million) transferred from capital work in progress.
(Rupees in thousand)
Cost Accumulateddepreciation Net book value Sale proceeds Mode of disposal Particulars of
purchaser
Vehicles
“ 1,699 85 1,614 1,554 Company Policy Mr. Farhan Latif - Executive
“ 1,353 23 1,330 1,533 " Mr. Ashraf Ali - Executive
“ 1,188 79 1,109 1,125 " Mr. SM Umair - Executive
“ 1,124 37 1,087 960 " Mr. Sarwar-e-Azam - Executive
“ 1,168 97 1,071 1,200 " Mr. Khurram Riaz Merchant - Executive
“ 1,080 18 1,062 1,153 " Mr. Ra�q Islam - Executive “ 969 16 953 1,136 " Mr. Idrees - Executive “ 984 33 951 1,268 " Mr. Adnan Malik - Executive “ 1,608 1,045 563 854 " Mr. Syed Waqar Haider Rizvi - Executive
“ 416 7 409 593 " Mr. Wasi Haider - Executive “ 217 4 213 396 " Mr. Adeel Noor - Executive “ 150 5 145 286 " Mr. Ali Kazmi - Executive “ 87 1 86 415 " Mr. Mumtaz Khaleel - Executive
“ 70 9 61 60 " Mr. Kamran Ahmed - Executive
“ 61 5 56 58 " Mr. Shakeel Abbas - Executive
“ 64 8 56 60 " Mr. Shaikh Muhammad Imran - Executive
“ 64 13 51 58 " Mr. Ghulam Abbas - Executive
Total 12,302 1,485 10,817 12,709
(Rupees in thousand)
2016 2015
3. PROPERTY, PLANT AND EQUIPMENT Operating assets - note 3.1 1,227,091 1,210,842 Capital work in progress - at cost - note 3.2 770,019 307,593
1,997,110 1,518,435
3.1 Operating assets
2.21 Research and development Research and development expenditure is charged to pro�t and loss account in the period in which it is incurred.
2.22 Offsetting Financial assets and liabilities are offset and the net amount is reported in the balance sheet where there is a legally
enforceable right to set-off the recognised amounts and the group intends to either settle on a net basis, or to realise the asset and settle the liability simultaneously.
2.23 Dividends
Dividend distribution to the group's shareholders is recognised as liability at the time of their approval.
Net carrying value basis
Year ended June 30, 2016
Opening net book value (NBV) 210,497 343,910 536,435 22,629 19,929 48,601 10,671 18,170 1,210,842 Additions (at cost) - note - 3.1.1 19 32,462 131,957 2,610 15,885 20,921 3,556 14,248 221,658 Disposals (at NBV) - - - - - - - - - - (749 ) - - (11,081 ) (11,830 ) Depreciation charge (4,168 ) (27,953 ) (109,417 ) (7,245 ) (5,938 ) (29,601 ) (2,120 ) (7,139 ) (193,581 ) Net exchange difference - - - - - - - - - - - - - - - - 2
Closing net book value 206,348 348,419 558,975 17,994 29,876 39,174 12,107 14,198 1,227,091 Gross carrying value basis At June 30, 2016
Cost 230,606 555,694 1,124,754 63,135 70,727 147,220 25,529 61,137 2,278,802 Accumulated depreciation (24,258 ) (207,275 ) (565,779 ) (45,141 ) (40,851 ) (108,046 ) (13,422 ) (46,939 ) (1,051,711 ) Net book value 206,348 348,419 558,975 17,994 29,876 39,174 12,107 14,198 1,227,091 Net carrying value basis Year ended June 30, 2015
Opening net book value (NBV) 192,721 355,022 489,952 21,560 14,885 40,133 8,208 19,126 1,141,607 Additions (at cost) 21,596 17,317 140,831 7,653 9,481 36,270 5,184 20,421 258,753 Disposals (at NBV) - - - - - - - - - - (105 ) - - (14,022 ) (14,127 ) Write offs (at NBV) - - - - - - - - (61 ) - - - - - - (61 ) Depreciation charge (3,820 ) (28,429 ) (94,348 ) (6,584 ) (4,376 ) (27,691 ) (2,721 ) (7,355 ) (175,324 ) Net exchange difference - - - - - - - - - - (6 ) - - - - (6 )
Closing net book value 210,497 343,910 536,435 22,629 19,929 48,601 10,671 18,170 1,210,842 Gross carrying value basis
At June 30, 2015 Cost 230,587 523,232 992,797 60,541 55,089 131,839 21,973 62,839 2,078,897 Accumulated depreciation (20,090 ) (179,322 ) (456,362 ) (37,912 ) (35,160 ) (83,238 ) (11,302 ) (44,669 ) (868,055 ) Net book value 210,497 343,910 536,435 22,629 19,929 48,601 10,671 18,170 1,210,842
Useful life (Years) 38 - 99 - 10 - 52 - 5 - 10 - 5 - -- 6 - 7 - 3 - - 10 - - 5 - -
(Rupees in thousand)
Total Laboratory equipments
Office and other
equipments
Furniture and fittings
Plant and machinery
Leasehold land Computers Vehicles
Building on leasehold
land
Annual Report 2016 123Share Food, Share Love122

Notes to the Consolidated Financial Statements Notes to the Consolidated Financial Statements FOR THE YEAR ENDED JUNE 30, 2016 FOR THE YEAR ENDED JUNE 30, 2016
(Rupees in thousand)
2016 2015
4. INTANGIBLES
Computer softwares and ERP System - note 4.1 56,223 39,089 Systems under development 5,072 - - 61,295 39,089 4.1 Computer softwares and ERP System Net carrying value basis Opening net book value 39,089 34,962 Additions (at cost) 41,886 23,906 Amortisation for the year (24,752 ) (19,779 ) Closing net book value 56,223 39,089 Gross carrying value basis
Cost 170,752 128,972 Accumulated amortisation (114,529 ) (89,883 ) Net book value 56,223 39,089
(Rupees in thousand)
2016 2015
Raw materials (including in transit Rs. 193.83 million; 2015: Rs. 25.05 million) 1,450,684 931,433 Provision for obsolescence (21,489 ) (7,557 ) 1,429,195 923,876 Packing materials (including in transit
Rs. 5.06 million; 2015: Rs. Nil) 364,939 270,888 Provision for obsolescence (50,161 ) (37,495 ) 314,778 233,393 Work in process 973,140 824,179 Provision for obsolescence (9,360 ) (6,329 ) 963,780 817,850 Finished goods 586,121 308,229 Provision for obsolescence (13,284 ) (13,712 ) 572,837 294,517 3,280,590 2,269,636
5.1 Stock in trade includes Rs. 1.94 billion (2015: Rs. 1.21 billion) held with third parties.
5.2 The above balances include items costing Rs. 59.75 million (2015: Rs. 30.64 million) valued at net realisable value of Rs. 51.74 million (2015: Rs. 26.27 million).
5.3 The Group has made a provision of Rs. 67.58 million for obsolescence (2015: Rs. 29.21 million) and has written off stocks against the provision amounting to Rs. 38.38 million (2015: Rs. 13.25 million) during the year.
5. STOCK IN TRADE
(Rupees in thousand)
2016 2015
6. TRADE DEBTS
Considered good - unsecured Related parties - note 6.2 117,480 115,633 Others
- local 435,434 473,428 - foreign 380,360 483,050 933,274 1,072,111 Considered doubtful 6,093 7,600 939,367 1,079,711 Less: Provision for doubtful trade debts (6,093 ) (7,600 ) 933,274 1,072,111
6.1 As at June 30, 2016, trade debts of Rs. 448.15 million (2015: Rs. 426.27 million) were past due but not impaired. These relate to a number of individual customers for whom there is no recent history of default. The age analysis of these trade debts is as follows:
(Rupees in thousand)
2016 2015
(Rupees in thousand)
2016 2015
Up to 3 months 374,959 349,118 3 to 6 months 46,373 38,221 More than 6 months 26,823 38,926 448,155 426,265
(Rupees in thousand)
2016 2015
6.2 Receivable from related parties
Premier Distributor 52,234 59,587 Premier Agency 65,246 56,046 117,480 115,633
As at June 30, 2016, trade debts of Rs. 50.3 million (2015: Rs. 0.42 million) from related parties were past due but not
impaired. The age analysis of these trade debts is as follows:
Up to 3 months 39,056 - 3 to 6 months 5,725 - More than 6 months 5,554 421 50,335 421
Annual Report 2016 125Share Food, Share Love124
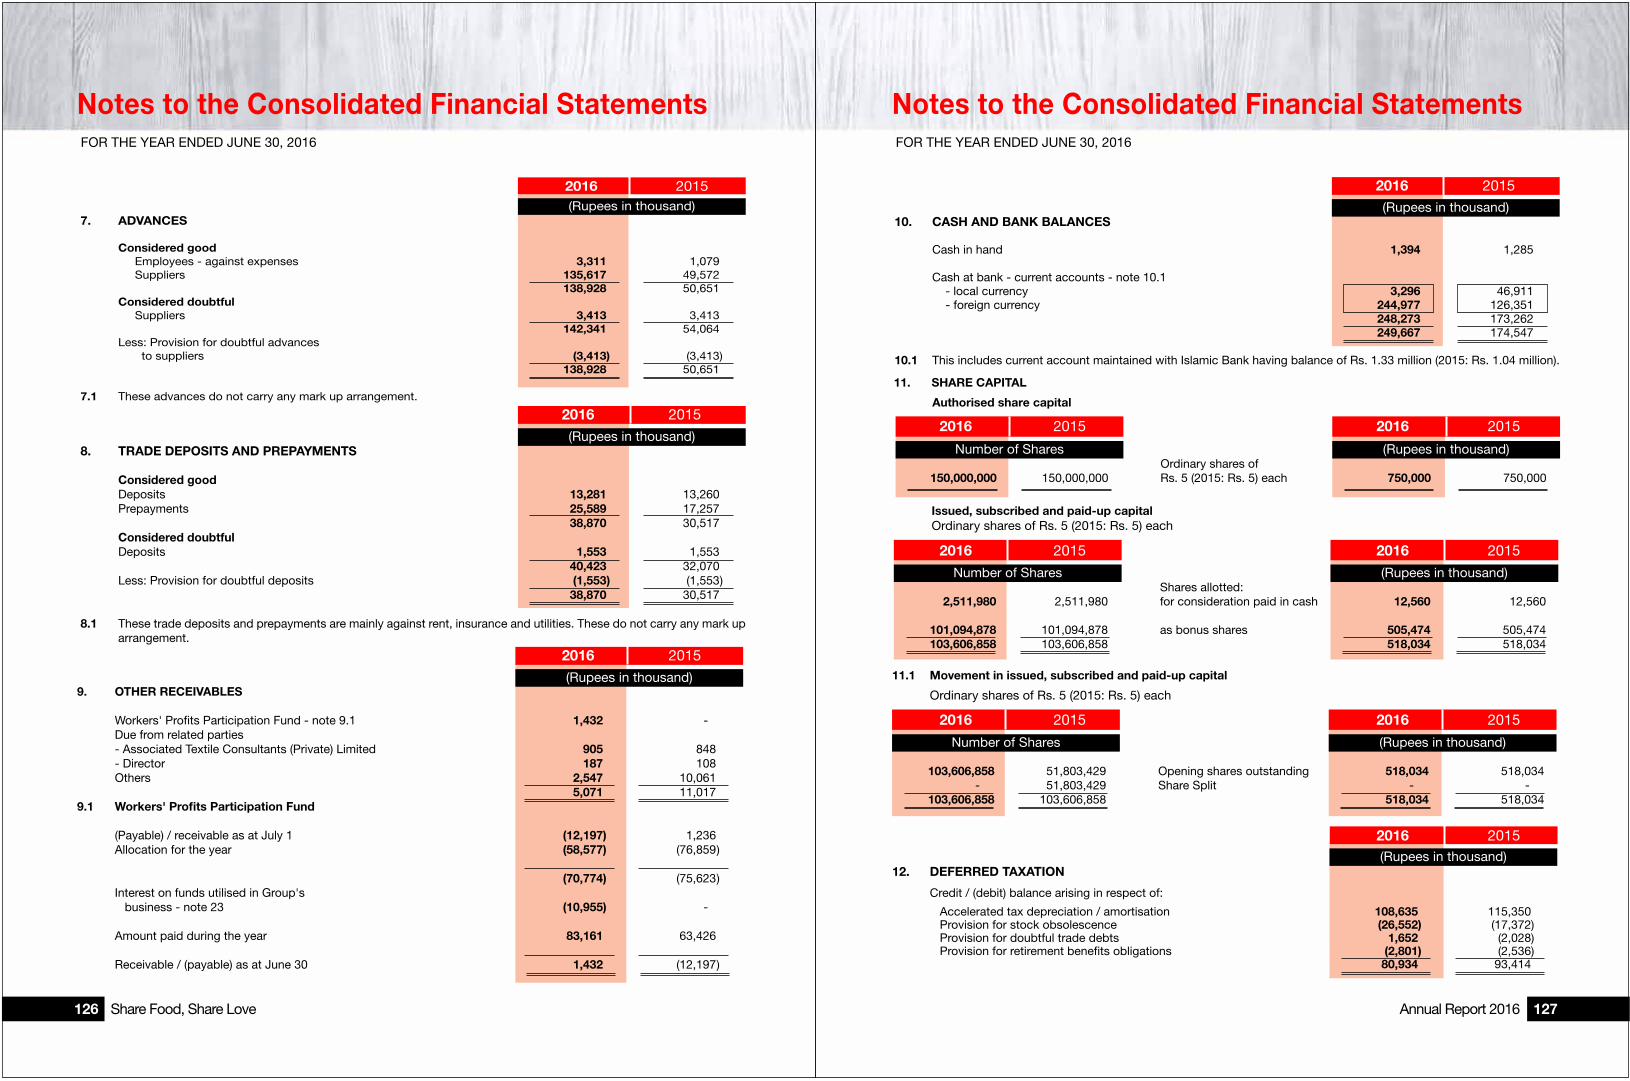
Notes to the Consolidated Financial Statements Notes to the Consolidated Financial Statements FOR THE YEAR ENDED JUNE 30, 2016 FOR THE YEAR ENDED JUNE 30, 2016
(Rupees in thousand)
2016 2015
8. TRADE DEPOSITS AND PREPAYMENTS Considered good Deposits 13,281 13,260 Prepayments 25,589 17,257 38,870 30,517 Considered doubtful Deposits 1,553 1,553 40,423 32,070 Less: Provision for doubtful deposits (1,553 ) (1,553 ) 38,870 30,517
8.1 These trade deposits and prepayments are mainly against rent, insurance and utilities. These do not carry any mark up arrangement.
(Rupees in thousand)9. OTHER RECEIVABLES Workers' Pro�ts Participation Fund - note 9.1 1,432 - - Due from related parties - Associated Textile Consultants (Private) Limited 905 848 - Director 187 108 Others 2,547 10,061 5,071 11,017 9.1 Workers' Profits Participation Fund
(Payable) / receivable as at July 1 (12,197 ) 1,236 Allocation for the year (58,577 ) (76,859 )
(70,774 ) (75,623 ) Interest on funds utilised in Group's
business - note 23 (10,955 ) - - Amount paid during the year 83,161 63,426 Receivable / (payable) as at June 30 1,432 (12,197 )
(Rupees in thousand)7. ADVANCES Considered good Employees - against expenses 3,311 1,079 Suppliers 135,617 49,572 138,928 50,651 Considered doubtful Suppliers 3,413 3,413 142,341 54,064 Less: Provision for doubtful advances to suppliers (3,413 ) (3,413 ) 138,928 50,651
7.1 These advances do not carry any mark up arrangement.
2016 2015
2016 2015
(Rupees in thousand)
2016 2015
10. CASH AND BANK BALANCES Cash in hand 1,394 1,285
Cash at bank - current accounts - note 10.1 - local currency 3,296 46,911
- foreign currency 244,977 126,351 248,273 173,262 249,667 174,547
10.1 This includes current account maintained with Islamic Bank having balance of Rs. 1.33 million (2015: Rs. 1.04 million).
11. SHARE CAPITAL
(Rupees in thousand)12. DEFERRED TAXATION
Credit / (debit) balance arising in respect of: Accelerated tax depreciation / amortisation 108,635 115,350
Provision for stock obsolescence (26,552 ) (17,372 ) Provision for doubtful trade debts 1,652 (2,028 ) Provision for retirement bene�ts obligations (2,801 ) (2,536 ) 80,934 93,414
2013 201
Authorised share capital
(Rupees in thousand)Number of Shares
2016 2015 2016 2015
aOrdinary shares of 150,000,000 150,000,000 Rs. 5 (2015: Rs. 5) each 750,000 750,000
Issued, subscribed and paid-up capital Ordinary shares of Rs. 5 (2015: Rs. 5) each
2013 201
(Rupees in thousand)Number of Shares Shares allotted: 2,511,980 2,511,980 for consideration paid in cash 12,560 12,560 101,094,878 101,094,878 as bonus shares 505,474 505,474 103,606,858 103,606,858 518,034 518,034
11.1 Movement in issued, subscribed and paid-up capital
Ordinary shares of Rs. 5 (2015: Rs. 5) each
2013 201
(Rupees in thousand)Number of Shares 103,606,858 51,803,429 Opening shares outstanding 518,034 518,034 - - 51,803,429 Share Split - - - - 103,606,858 103,606,858 518,034 518,034
2016 2015 2016 2015
2016 2015 2016 2015
2016 2015
Annual Report 2016 127Share Food, Share Love126
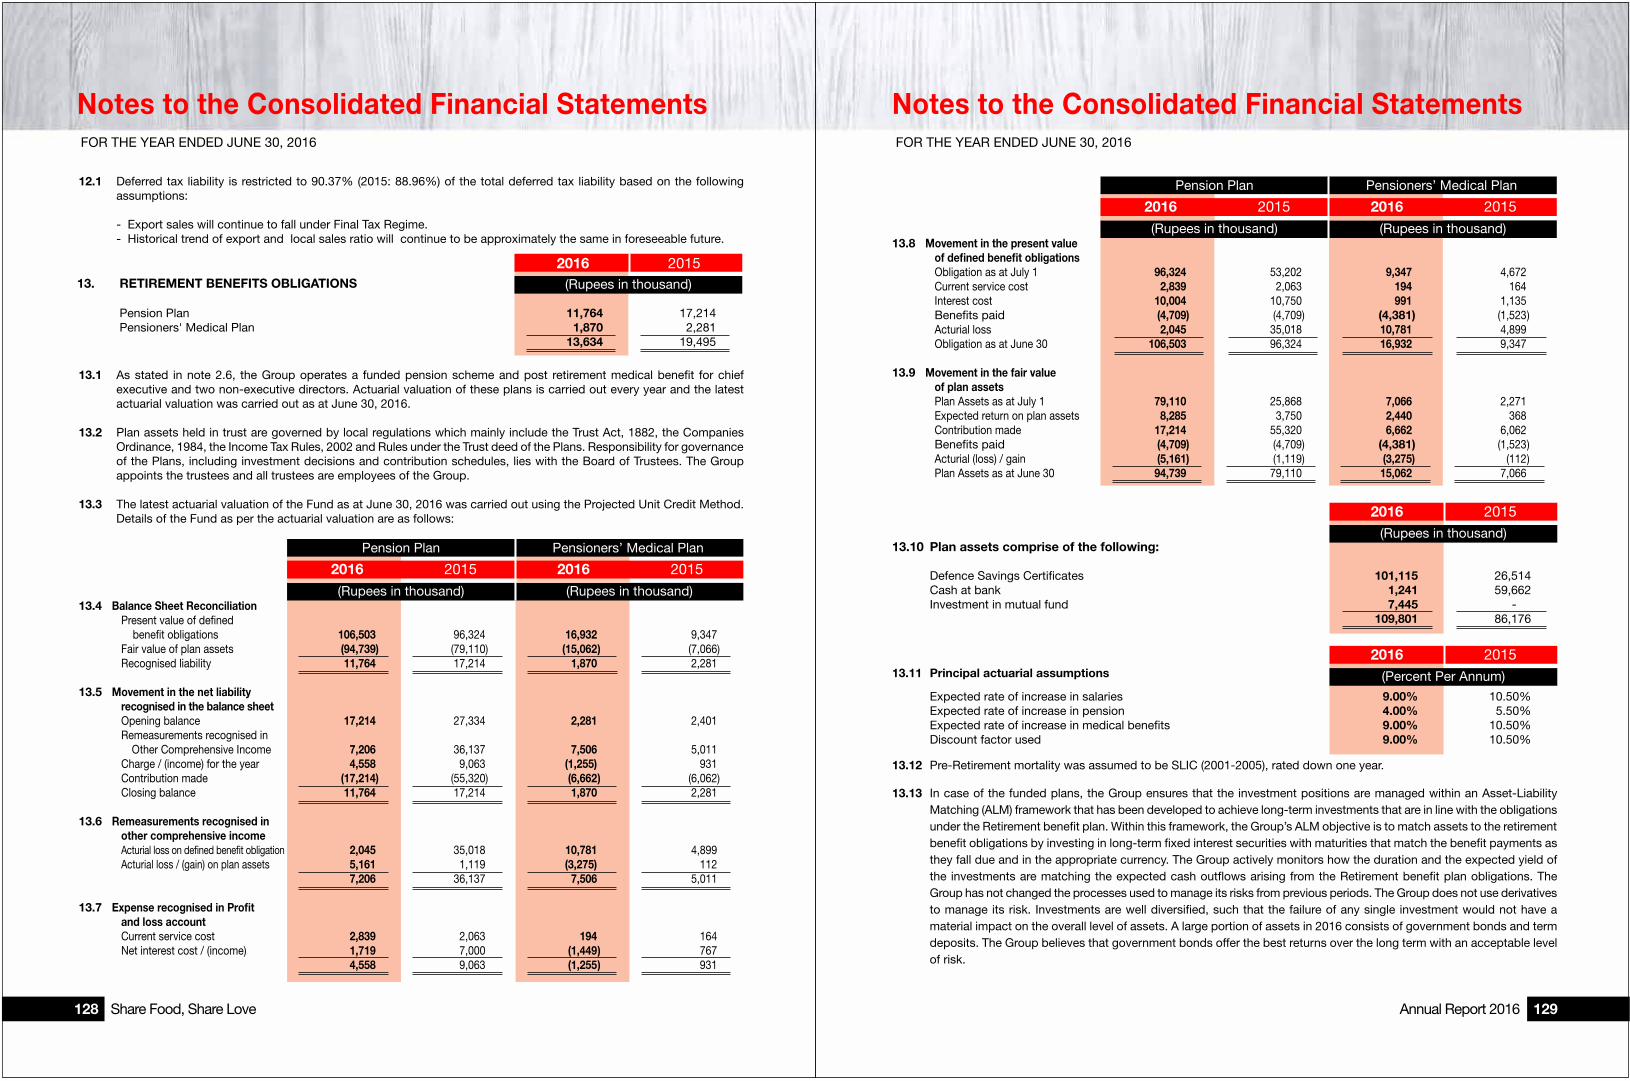
Notes to the Consolidated Financial Statements Notes to the Consolidated Financial Statements FOR THE YEAR ENDED JUNE 30, 2016 FOR THE YEAR ENDED JUNE 30, 2016
(Rupees in thousand)13. RETIREMENT BENEFITS OBLIGATIONS
Pension Plan 11,764 17,214 Pensioners' Medical Plan 1,870 2,281
13,634 19,495
13.1 As stated in note 2.6, the Group operates a funded pension scheme and post retirement medical bene�t for chief executive and two non-executive directors. Actuarial valuation of these plans is carried out every year and the latest actuarial valuation was carried out as at June 30, 2016.
13.2 Plan assets held in trust are governed by local regulations which mainly include the Trust Act, 1882, the Companies Ordinance, 1984, the Income Tax Rules, 2002 and Rules under the Trust deed of the Plans. Responsibility for governance of the Plans, including investment decisions and contribution schedules, lies with the Board of Trustees. The Group appoints the trustees and all trustees are employees of the Group.
13.3 The latest actuarial valuation of the Fund as at June 30, 2016 was carried out using the Projected Unit Credit Method. Details of the Fund as per the actuarial valuation are as follows:
12.1 Deferred tax liability is restricted to 90.37% (2015: 88.96%) of the total deferred tax liability based on the following assumptions:
- Export sales will continue to fall under Final Tax Regime. - Historical trend of export and local sales ratio will continue to be approximately the same in foreseeable future.
2016 2015
(Rupees in thousand)(Rupees in thousand)
2016 2015 2016 2015
13.4 Balance Sheet Reconciliation Present value of de�ned bene�t obligations 106,503 96,324 16,932 9,347 Fair value of plan assets (94,739 ) (79,110 ) (15,062 ) (7,066 ) Recognised liability 11,764 17,214 1,870 2,281
13.5 Movement in the net liability recognised in the balance sheet Opening balance 17,214 27,334 2,281 2,401
Remeasurements recognised in Other Comprehensive Income 7,206 36,137 7,506 5,011 Charge / (income) for the year 4,558 9,063 (1,255) 931 Contribution made (17,214 ) (55,320 ) (6,662 ) (6,062 ) Closing balance 11,764 17,214 1,870 2,281
13.6 Remeasurements recognised in other comprehensive income Acturial loss on de�ned bene�t obligation 2,045 35,018 10,781 4,899
Acturial loss / (gain) on plan assets 5,161 1,119 (3,275) 112 7,206 36,137 7,506 5,011
13.7 Expense recognised in Profit and loss account Current service cost 2,839 2,063 194 164
Net interest cost / (income) 1,719 7,000 (1,449 ) 767 4,558 9,063 (1,255 ) 931
Pension Plan Pensioners’ Medical Plan
(Rupees in thousand)(Rupees in thousand)
2016 2015 2016 2015
13.8 Movement in the present value of defined benefit obligations Obligation as at July 1 96,324 53,202 9,347 4,672
Current service cost 2,839 2,063 194 164 Interest cost 10,004 10,750 991 1,135
Bene�ts paid (4,709 ) (4,709 ) (4,381 ) (1,523 ) Acturial loss 2,045 35,018 10,781 4,899 Obligation as at June 30 106,503 96,324 16,932 9,347
13.9 Movement in the fair value of plan assets Plan Assets as at July 1 79,110 25,868 7,066 2,271
Expected return on plan assets 8,285 3,750 2,440 368 Contribution made 17,214 55,320 6,662 6,062
Bene�ts paid (4,709 ) (4,709 ) (4,381 ) (1,523 ) Acturial (loss) / gain (5,161 ) (1,119 ) (3,275 ) (112 ) Plan Assets as at June 30 94,739 79,110 15,062 7,066
Pension Plan Pensioners’ Medical Plan
(Rupees in thousand)
(Percent Per Annum)
13.10 Plan assets comprise of the following: Defence Savings Certi�cates 101,115 26,514 Cash at bank 1,241 59,662 Investment in mutual fund 7,445 - - 109,801 86,176
13.11 Principal actuarial assumptions
Expected rate of increase in salaries 9.00% 10.50% Expected rate of increase in pension 4.00% 5.50% Expected rate of increase in medical bene�ts 9.00% 10.50% Discount factor used 9.00% 10.50%
13.12 Pre-Retirement mortality was assumed to be SLIC (2001-2005), rated down one year.
13.13 In case of the funded plans, the Group ensures that the investment positions are managed within an Asset-Liability Matching (ALM) framework that has been developed to achieve long-term investments that are in line with the obligations under the Retirement bene�t plan. Within this framework, the Group’s ALM objective is to match assets to the retirement bene�t obligations by investing in long-term �xed interest securities with maturities that match the bene�t payments as they fall due and in the appropriate currency. The Group actively monitors how the duration and the expected yield of the investments are matching the expected cash out�ows arising from the Retirement bene�t plan obligations. The Group has not changed the processes used to manage its risks from previous periods. The Group does not use derivatives to manage its risk. Investments are well diversi�ed, such that the failure of any single investment would not have a material impact on the overall level of assets. A large portion of assets in 2016 consists of government bonds and term deposits. The Group believes that government bonds offer the best returns over the long term with an acceptable level of risk.
2016 2015
2016 2015
Annual Report 2016 129Share Food, Share Love128

13.16 Comparison for five years:
Fair value of plan assets 109,801 86,176 28,139 23,352 17,135 Present value of de�ned bene�t obligation (123,435 ) (105,671 ) (57,874 ) (47,281 ) (29,265 ) De�cit (13,634 ) (19,495) (29,735 ) (23,929 ) (12,130 )
Experience adjustments
(Loss) / gain on plan assets (as a percentage of plan assets) (1.72 ) (1.43 ) (1.92 ) 2.17 (0.97 ) Loss / (gain) on obligation (as a percentage of plan obligations) 10.39 37.77 8.50 28.49 1.14
(Rupees in thousand)
(Rupees in thousand)
Discount rate at June 30 1.00% 107,404 143,343 Future salary increases 1.00% 113,531 100,044 Future pension increases 1.00% 116,299 97,981 Medical cost increases 1.00% 19,394 14,928
The sensitivity analysis is based on a change in an assumption while holding all other assumptions constant. In
practice, this is unlikely to occur, and changes in some of the assumptions may be correlated. When calculating the sensitivity of the de�ned bene�t obligation to signi�cant actuarial assumptions the same method (present value of the de�ned bene�t obligation calculated with the projected unit credit method at the end of the reporting period) has been applied when calculating the pension liability recognised within the balance sheet. The methods and types of assumptions used in preparing the sensitivity analysis did not change compared to the previous period.
Change in assumption
13.15 Sensitivity analysis for actuarial assumptions
The sensitivity of the de�ned bene�t obligation to changes in the weighted principal assumptions is:
Impact on defined benefit obligation
Increase in assumption
Decrease in assumption
13.17 The expected return on plan assets is based on the market expectations and depends upon the asset portfolio of the plan, at the beginning of the period, for returns over the entire life of the related obligation.
13.18 The weighted average duration of de�ned bene�t obligation of pension plan and pensioners' medical plan is 14.40 and 13.26 years respectively.
13.19 Expected maturity analysis of undiscounted retirement bene�t payments.
Retirement bene�t plans 5,998 6,124 12,644 41,805 66,571
(Rupees in thousand)
13.20 During the year, the Group contributed Rs. 34.31 million (2015: Rs. 26.98 million) to the provident fund.
(Rupees in thousand)
2016 2015
14. TRADE AND OTHER PAYABLES Creditors 204,304 455,306 Accrued liabilities 1,566,778 968,549 Workers' Pro�ts Participation Fund - note 9.1 - - 12,197 Workers' Welfare Fund 46,522 26,162 Advances from customers 113,786 107,785 Payable to provident fund 8,298 4,279 Tax deducted at source 47,938 23,890 Due to related parties - directors 87 14 Advances from employees against sale of vehicles 68,140 59,552 Unclaimed dividend 9,710 5,480 Other liabilities 2,024 15,796
2,067,587 1,679,010
Notes to the Consolidated Financial Statements Notes to the Consolidated Financial Statements FOR THE YEAR ENDED JUNE 30, 2016 FOR THE YEAR ENDED JUNE 30, 2016
13.14 The expected return on plan assets was determined by considering the expected returns available on the assets underlying the current investment policy. Expected yields on �xed interest investments are based on gross redemption yields as at the balance sheet date.
Expected charge for the year ending June 30, 2017 works out to be Rs. 4.23 million and Rs. 0.51 million for Pension Plan and Pensioners' Medical Plan respectively.
The actuary conducts separate valuations for calculating contribution rates and the Group contributes to the Pension Plan and Pensioners' Medical Plan according to the actuary’s advice. The expense of the de�ned bene�t plans is calculated by the actuary.
Figures in this note are based on the latest actuarial valuation carried out as at June 30, 2016.
20122014 20132016 2015
Less thana year
Between1-2 year
Between2-5 year
Between5-10 year Total
Annual Report 2016 131Share Food, Share Love130

Notes to the Consolidated Financial Statements Notes to the Consolidated Financial Statements FOR THE YEAR ENDED JUNE 30, 2016 FOR THE YEAR ENDED JUNE 30, 2016
(Rupees in thousand)
2016 2015
15. SHORT TERM BORROWINGS
Running �nance under mark up arrangements 911,326 284,094 Export re-�nance 400,000 100,000 1,311,326 384,094
15.1 This includes running �nance balance maintained with Islamic Bank having balance of Rs. 287.37 million (2015: Nil).
15.2 The facilities available from various banks amount to Rs. 2.93 billion (2015: Rs. 3.44 billion). The arrangements
are secured by way of pari-passu charge against hypothecation of Group's stock in trade, movables and trade debts. The facilities expiring within one year are annual facilities subject to review at various dates during 2016 and 2017.
15.3 The rates of mark up range from one month KIBOR plus 0.05% to six months KIBOR plus 0.2% per annum (2015: one month KIBOR plus 0.2% to six months KIBOR plus 0.9% per annum).
15.4 The facilities for opening letters of credit amount to Rs. 1.19 billion (2015: Rs. 1.35 billion) and for letters of guarantee amount to Rs. 243.3 million (2015: Rs. 141 million) as at June 30, 2016 of which the amount remaining unutilised at year end were Rs. 1.07 billion (2015: Rs. 1.21 billion) and Rs. 76.75 million (2015: Rs. 74.78 million) respectively.
(Rupees in thousand)
2016 2015
16. COMMITMENTS
Aggregate commitments for capital expenditure as at June 30, 2016 amount to Rs. 404.46 million (2015: Rs. 188.60 million).
Aggregate commitments in respect of ujrah payments for ijarah �nancing of motor vehicles bearing a mark up ranging from six months KIBOR + 0.6% to six months KIBOR + 0.9% (2015: six months KIBOR + 0.6% to six months KIBOR + 0.9%) per annum for rentals payable monthly as at June 30, 2016 amount to:
Not later than one year 55,332 53,984 Over one year to �ve years 80,769 71,322 136,101 125,306
(Rupees in thousand)
2016 2015
17. SALES Manufactured goods Gross sales
Local sales 17,801,422 15,089,114 Export sales - note 17.1 1,435,116 1,269,417 19,236,538 16,358,531 Sales tax (2,380,572 ) (1,956,026 ) 16,855,966 14,402,505 Less:
Discount, rebates and allowances 2,999,176 2,535,978 Sales return 287,440 173,741 3,286,616 2,709,719 13,569,350 11,692,786
(Rupees in thousand)
17.1 Export sales comprise of sales made in the following regions:
USA / Canada 592,036 391,356 Africa 5,956 30,162 Middle East Asia 614,223 113,580 Others 222,901 734,319 1,435,116 1,269,417
17.2 The Group's customer base is diverse with no single customer accounting for more than 10% of net sales.
2016 2015
Annual Report 2016 133Share Food, Share Love132

Notes to the Consolidated Financial Statements Notes to the Consolidated Financial Statements FOR THE YEAR ENDED JUNE 30, 2016 FOR THE YEAR ENDED JUNE 30, 2016
(Rupees in thousand)18. COST OF SALES
Raw material consumed 5,610,836 4,608,449 Packing material consumed 2,371,443 2,012,418 Stores and spares consumed 63,654 61,054 Brine and cutting charges 41,084 42,978 Salaries, wages and other bene�ts 738,333 438,333 Contribution to provident fund 11,797 9,569 Depreciation / amortisation 145,411 131,544 Ujrah payments 14,525 9,914 Fuel and power 188,140 167,559 Insurance 21,863 18,904 Laboratory, research and development 6,330 5,953 Postage and communications 6,186 6,523 Printing and stationery 1,008 821 Rent, rates and taxes 125,821 89,184 Travelling 74,862 71,317 Repairs and maintenance 35,262 36,984 Security charges 21,087 13,139 Inventory destruction charges 17,007 ---- Others 3,366 4,984 9,498,015 7,729,627 Opening work in process 817,850 592,587 Closing work in process (963,780 ) (817,850 ) Cost of goods manufactured 9,352,085 7,504,364 Opening stock of �nished goods 294,517 348,939 Closing stock of �nished goods (572,837 ) (294,517 ) 9,073,765 7,558,786
(Rupees in thousand)19. DISTRIBUTION COSTS Salaries, wages and other bene�ts 441,976 348,460 Advertising and sales promotion 1,192,937 1,000,062 Commission expense 38,242 28,865 Outward freight and handling charges 582,438 465,982 Contribution to provident fund 14,235 10,024 Depreciation / amortisation 20,909 19,222 Ujrah payments 20,925 15,303 Fuel and power 5,724 6,423 Forwarding charges 21,896 19,187 Insurance 14,231 14,361 Laboratory, research and development 4,168 1,246 Legal and professional charges 66,442 33,743 Postage and communications 9,660 5,965 Printing and stationery 4,003 4,580 Rent, rates and taxes 80,915 59,712 Travelling 121,340 105,230 Repairs and maintenance 10,011 11,276 (Reversal) / provision for doubtful debts (1,507) 5,632 Sales conference expenses 26,520 --- Security charges 2,534 2,117 Advance written off 3,033 --- Others 1,999 3,264 2,682,631 2,160,654
(Rupees in thousand)20. ADMINISTRATIVE EXPENSES
Salaries, wages and other bene�ts - note 20.1 237,379 226,074 Contribution to provident fund 8,287 7,383 Depreciation / amortisation 52,013 44,337 Ujrah payments 19,288 14,360 Fuel and power 7,193 3,647 Insurance 5,988 5,392 Legal and professional charges 32,589 28,530 Postage and communications 25,746 16,572 Printing and stationery 4,815 3,160 Rent, rates and taxes 24,939 14,002 Travelling 34,721 34,913 Repairs and maintenance 49,245 47,050 Security charges 5,000 3,074 Others 14,618 23,540 521,821 472,034
20.1 Salaries, wages and other bene�ts include Rs. 3.33 million (2015: Rs. 9.99 million) in respect of charge for retirement bene�t plans.
2016 2015 2016 2015
2016 2015
Annual Report 2016 135Share Food, Share Love134
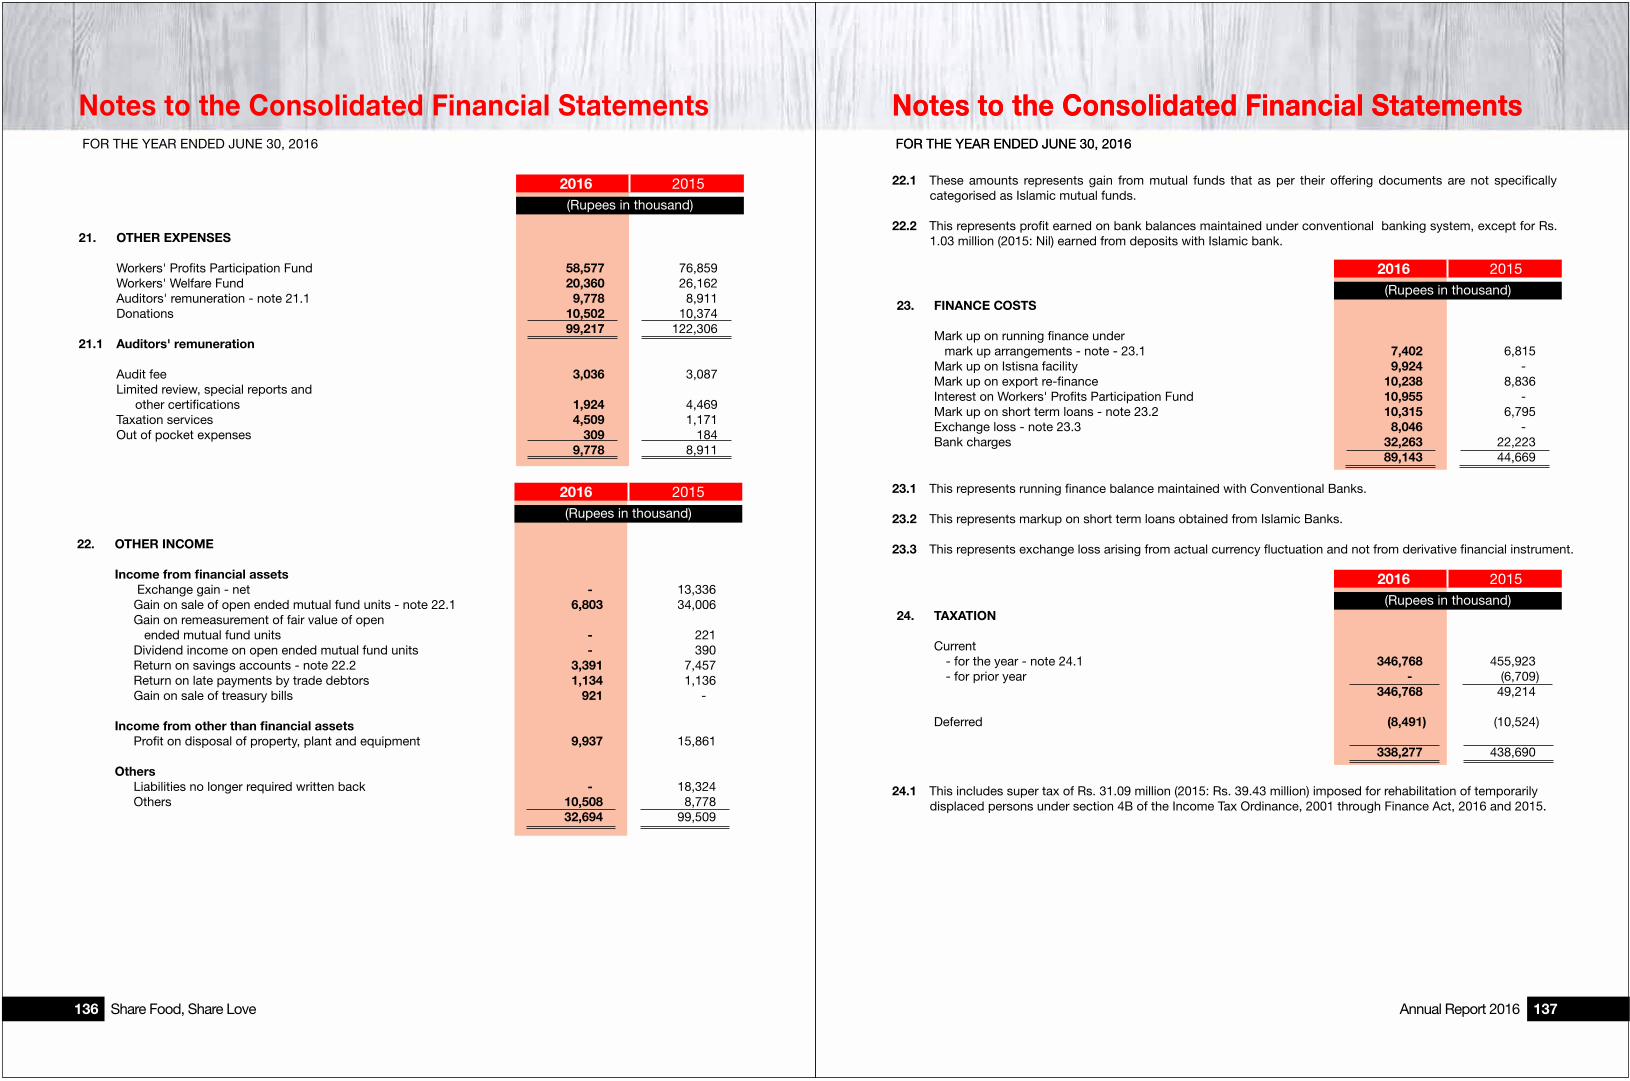
Notes to the Consolidated Financial Statements Notes to the Consolidated Financial Statements FOR THE YEAR ENDED JUNE 30, 2016 FOR THE YEAR ENDED JUNE 30, 2016
22.1 These amounts represents gain from mutual funds that as per their offering documents are not speci�cally categorised as Islamic mutual funds.
22.2 This represents pro�t earned on bank balances maintained under conventional banking system, except for Rs. 1.03 million (2015: Nil) earned from deposits with Islamic bank.
24.1 This includes super tax of Rs. 31.09 million (2015: Rs. 39.43 million) imposed for rehabilitation of temporarily displaced persons under section 4B of the Income Tax Ordinance, 2001 through Finance Act, 2016 and 2015.
(Rupees in thousand)23. FINANCE COSTS
Mark up on running �nance under mark up arrangements - note - 23.1 7,402 6,815 Mark up on Istisna facility 9,924 --- Mark up on export re-�nance 10,238 8,836 Interest on Workers' Pro�ts Participation Fund 10,955 --- Mark up on short term loans - note 23.2 10,315 6,795 Exchange loss - note 23.3 8,046 --- Bank charges 32,263 22,223 89,143 44,669
23.1 This represents running �nance balance maintained with Conventional Banks. 23.2 This represents markup on short term loans obtained from Islamic Banks. 23.3 This represents exchange loss arising from actual currency �uctuation and not from derivative �nancial instrument.
(Rupees in thousand)
22. OTHER INCOME
Income from financial assets Exchange gain - net --- 13,336 Gain on sale of open ended mutual fund units - note 22.1 6,803 34,006 Gain on remeasurement of fair value of open
ended mutual fund units --- 221 Dividend income on open ended mutual fund units --- 390 Return on savings accounts - note 22.2 3,391 7,457 Return on late payments by trade debtors 1,134 1,136 Gain on sale of treasury bills 921 ---
Income from other than financial assets Pro�t on disposal of property, plant and equipment 9,937 15,861
Others Liabilities no longer required written back --- 18,324 Others 10,508 8,778 32,694 99,509
(Rupees in thousand)
21. OTHER EXPENSES
Workers' Pro�ts Participation Fund 58,577 76,859 Workers' Welfare Fund 20,360 26,162 Auditors' remuneration - note 21.1 9,778 8,911 Donations 10,502 10,374 99,217 122,306 21.1 Auditors' remuneration
Audit fee 3,036 3,087 Limited review, special reports and
other certi�cations 1,924 4,469 Taxation services 4,509 1,171 Out of pocket expenses 309 184 9,778 8,911
2016 2015
2016 2015
(Rupees in thousand)24. TAXATION
Current - for the year - note 24.1 346,768 455,923
- for prior year --- (6,709 ) 346,768 49,214 Deferred (8,491 ) (10,524 ) 338,277 438,690
2016 2015
2016 2015
Notes to the Consolidated Financial Statements FOR THE YEAR ENDED JUNE 30, 2016
Annual Report 2016 137Share Food, Share Love136

Notes to the Consolidated Financial Statements Notes to the Consolidated Financial Statements FOR THE YEAR ENDED JUNE 30, 2016 FOR THE YEAR ENDED JUNE 30, 2016
(Rupees in thousand)24 .2 Reconciliation between tax expense and accounting pro�t: Pro�t before taxation 1,135,467 1,433,846
Tax at applicable rate of 32% (2015: 33%) 363,349 473,169 Tax effect of permanent differences 13,755 3,932 Tax effect of �nal tax regime (48,158 ) (47,239 ) Effect of exempt income (7,524 ) (7,574 ) Effect of prior year tax --- (6,709 ) Change in tax rate --- (16,417 ) Super Tax 31,097 39,431 Effect of tax credits (15,140 ) (10,885 ) Others 898 10,982 338,277 438,690
(Rupees in thousand)25. EARNINGS PER SHARE
Pro�t after taxation attributable to ordinary shareholders 797,190 995,156 Weighted average number of shares
in issue during the year (in thousand) 103,607 103,607 Earnings per share - Basic and
diluted (Rupees) 7.69 9.61
25.1 A diluted earnings per share has not been presented as the Group did not have any convertible instruments in issue as at June 30, 2016 and 2015 which would have any effect on the earnings per share if the option to convert is exercised.
(Rupees in thousand)26. CASH GENERATED FROM OPERATIONS
Pro�t before taxation 1,135,467 1,433,846 Adjustments for non-cash charges and other items
Depreciation 193,581 175,324 Amortisation 24,752 19,779 Pro�t on disposal of property, plant and equipment (9,937 ) (15,861 ) Property, plant and equipment written off --- 61 Unrealised foreign exchange loss 1,910 2,068 Gain on sale of open ended mutual fund units (6,803 ) (34,006) Gain on remeasurement of fair value of open
ended mutual fund units --- (221 ) Gain on sale of treasury bills (921 ) - - Finance costs 89,143 44,669 Retirement bene�ts expense 3,303 9,994 295,028 201,807 Pro�t before working capital changes 1,430,495 1,635,653 EFFECT ON CASH FLOWS DUE TO WORKING
CAPITAL CHANGES
(Increase) / decrease in current assets Stores, spare parts and loose tools (708 ) (363 )
Stock in trade (1,010,954 ) (39,251 ) Trade debts 138,837 (271,755 ) Advances (88,277 ) 3,480 Trade deposits and prepayments (8,353 ) (11,681 ) Other receivables 5,946 73 (963,509 ) (319,497 ) Increase / (decrease) in current liabilities
Trade and other payables 384,347 340,715 Sales tax payable (47,897) 17,022 336,450 357,737 803,436 1,673,893
2016 2015
2016 2015
2016 2015
Annual Report 2016 139Share Food, Share Love138

28.2 In addition to the above, fee paid to 6 (2015: 6) non-executive directors for attending Board of Directors meetings during the year amounted to Rs. 1,750,000 (2015: Rs. 1,112,500).
28.3 The Chief Executive, two non-executive directors and certain executives of the Group are also provided with Group maintained cars, residence and mobile telephones.
Notes to the Consolidated Financial Statements Notes to the Consolidated Financial Statements FOR THE YEAR ENDED JUNE 30, 2016 FOR THE YEAR ENDED JUNE 30, 2016
(Rupees in thousand)
27. CASH AND CASH EQUIVALENTS Cash and bank balances 249,667 174,547 Short term borrowings (911,326 ) (284,094 ) (661,659 ) (109,547 )
28. REMUNERATION TO CHIEF EXECUTIVE, DIRECTORS AND EXECUTIVES
28.1 The aggregate amounts charged in these �nancial statements in respect of remuneration including all bene�ts to chief executive, directors and executives of the Group are as follows:
Managerial remuneration and allowances 15,794 13,234 --- --- 214,510 163,063 Technical advisory fee --- --- 8,400 9,660 --- --- Utilities 1,579 1,327 793 497 20,857 15,701 Bonus / variable pay 18,770 2,206 --- --- 37,624 26,604 Housing 7,107 5,955 --- --- 93,854 70,955 Retirement bene�ts 1,579 7,709 5,194 5,554 19,121 15,288 Other expenses 3,349 3,651 --- --- 98,637 67,673 48,178 34,082 14,387 15,711 484,603 359,284 Number of person 1 1 2 2 162 119
(Rupees in thousand)
Chief Executive Directors Executives
29. RELATED PARTY DISCLOSURES Disclosure of transactions between the Group and related parties:
Nature of transactionRelationship with the Group (Rupees in thousand)
Associated Companies /
Undertakings: Sale of goods 1,473,634 1,151,664 Rent charges paid / payable 8,431 8,225
Commission expense 38,242 28,865
Staff retirement funds: Expense charged for de�ned contribution plan 34,319 26,976 Payments to retirement contribution plan 91,986 51,214 Contribution to de�ned bene�t plans 23,876 61,382
Directors: Technical advisory services 8,400 9,660
Key management personnel compensation:
- Salaries and other short-term employee bene�ts 177,889 169,662 - Retirement bene�ts 10,378 17,055
The related party status of outstanding balances as at June 30, 2016 is included in trade debts, other receivables and
trade and other payables respectively. These outstanding balances are unsecured and are settled in the ordinary course of business.
Actual production Metric Tons
30. PLANT CAPACITY AND PRODUCTION
Actual production of plants 90,176 87,275
30.1 The capacity and production of the Group's plants are indeterminable as these are multi-product and involve varying processes of manufacture.
(Rupees in thousand)
31. PROVIDENT FUND RELATED DISCLOSURES
Size of the fund - Total assets 446,000 376,219 Fair value of investments 250,650 211,222 Percentage of investments made 56% 56%
31.1 The cost of above investments amounted to Rs. 176.32 million (2015: Rs. 144.42 million).
(Un-audited) (Audited)
2016 2015
2016 2015
2016 2015
2016 2015
2016 2015 2016 2015 2016 2015
Annual Report 2016 141Share Food, Share Love140

Notes to the Consolidated Financial Statements Notes to the Consolidated Financial Statements FOR THE YEAR ENDED JUNE 30, 2016 FOR THE YEAR ENDED JUNE 30, 2016
31.3 The investments out of provident fund have been made in accordance with the provisions of Section 227 of the Companies Ordinance, 1984 and the rules formulated for this purpose.
(Rupees in thousand)Percentage
National savings scheme 91% 90% 229,361 189,345 Bank deposits 3% 4% 6,977 8,331 Unit trust schemes 6% 6% 14,312 13,546 100% 100% 250,650 211,222
32. NUMBER OF EMPLOYEES Number of employees at June 30
- Permanent 663 664
- Contractual 8 18
Average number of employees during the year
- Permanent 659 614
- Contractual 10 21
33. FINANCIAL INSTRUMENTS AND RELATED DISCLOSURES
33.1 Financial risk factors
The Group's activities expose it to variety of �nancial risks namely credit risk, liquidity risk and market risk (including foreign exchange risk and interest rate risk). The Group's overall risk management programme focuses on having cost effective funding as well as manage �nancial risk to minimise earnings volatility and provide maximum return to shareholders.
31.2 The break-up of fair value of investments is:
(Un-audited) (Audited) (Un-audited) (Audited)
Maturity up to one
year
Maturityafter one
year
Interest / Mark up bearing
Maturity up to one
year
Maturityafter one
yearSub-total
33.2 Financial assets and liabilities by category and their respective maturities
FINANCIAL ASSETS Loans and Receivables Trade debts - - - - - - 933,274 - - 933,274 933,274
Trade deposits - - - - - - 13,281 30,979 44,260 44,260 Other receivables - - - - - - 5,071 - - 5,071 5,071 Cash and bank balances - - - - - - 249,667 - - 249,667 249,667 June 30, 2016 - - - - - - 1,201,293 30,979 1,232,272 1,232,272 June 30, 2015 - - - - - - 1,660,180 34,768 1,694,948 1,694,948 FINANCIAL LIABILITIES
Trade and other payables - - - - - - 1,782,903 - - 1,782,903 1,782,903 Accrued interest / mark up - - - - - - 8,974 - - 8,974 8,974 Short term borrowings 1,311,326 - - 1,311,326 - - - - - 1,311,326
June 30, 2016 1,311,326 - - 1,311,326 1,791,877 - - 1,791,877 3,103,203 June 30, 2015 384,094 - - 384,094 1,447,665 - - 1,447,665 1,831,759
ON BALANCE SHEET GAP
June 30, 2016 (1,311,326) - - (1,311,326) (590,584) 30,979 (559,605) (1,870,931) June 30, 2015 (384,094) - - (384,094) 212,515 34,768 247,283 (136,811)
Non-interest / Non-mark up bearing
(Rupees in thousand)
Sub-total Total
OFF BALANCE SHEET ITEMS Letters of credit 128,260 June 30, 2015 135,383
Letters of guarantees 166,550 June 30, 2015 66,220 All the �nancial instruments of the Group are designated as loans and receivables and hence measured at amortised cost.
The effective interest / mark up rates for the monetary �nancial assets and liabilities are mentioned in respective notes
to the �nancial statements.
2016 2015
2016 2015
2016 2015
Annual Report 2016 143Share Food, Share Love142

Notes to the Consolidated Financial Statements Notes to the Consolidated Financial Statements FOR THE YEAR ENDED JUNE 30, 2016 FOR THE YEAR ENDED JUNE 30, 2016
i) Credit risk
Credit risk represents the accounting loss that would be recognised at the reporting date if counterparties failed to perform as contracted. Out of the total �nancial assets of Rs. 1.23 billion (2015: Rs. 1.69 billion) the �nancial assets exposed to the credit risk amounted to Rs. 1.23 billion (2015: Rs. 1.69 billion).
For trade debts, internal risk assessment process determines the credit quality of the customers, taking into account their �nancial positions, past experiences and other factors. Individual risk limits are set based on internal or external credit worthiness ratings in accordance with limits set by the management. As of June 30, 2016 trade debts of Rs. 448.15 million (2015: Rs. 426.27 million) were past due but not impaired. The carrying amount of trade debts relates to number of individual customers for whom there is no recent history of default.
The cash and bank balances represent low credit risk as major balances are placed with banks having credit ratings of A1+ or above as assigned by PACRA or JCR-VIS.
The other �nancial assets are neither material to the �nancial statements nor exposed to any signi�cant credit risk. The management does not expect any losses from non-performance by these counterparties.
ii) Liquidity risk
Liquidity risk re�ects the Group's inability in raising funds to meet commitments. The Group manages liquidity risk by maintaining suf�cient cash and bank balances and the availability of �nancing through banking arrangements. Management monitors rolling forecasts of the Group’s liquidity reserve which comprises of undrawn borrowing facility and cash and cash equivalents on the basis of expected cash �ows.
iii) Market Risks
a) Foreign exchange risk
Foreign exchange risk arises mainly where receivables and payables exist in foreign currency. As at June 30, 2016, net �nancial assets of Rs. 445.99 million (2015: Rs. 592.54 million) were denominated in foreign currency which were exposed to foreign currency risk.
As at June 30, 2016, if the Pak Rupee had weakened / strengthened by 4% (2015: 4%) against US Dollar with all other variables held constant, pro�t before tax for the year would have been lower / higher by Rs. 17.83 million (2015: Rs. 23.70 million), mainly as a result of foreign exchange losses / gains on translation of US Dollar denominated trade debts.
The sensitivity of foreign exchange rate looks at the outstanding foreign exchange balances of the Group only as at the balance sheet date and assumes this is the position for a full twelve-month period. The volatility percentages for movement in foreign exchange rates have been used due to the fact that historically (�ve years) rates have moved on average basis by the mentioned percentage per annum.
b) Interest rate risk
The Group’s only interest rate risk arises from borrowings as the Group has no interest-bearing assets. Borrowings issued at variable rates expose the Group to cash �ow interest rate risk.
At June 30, 2016, the Group had variable interest bearing �nancial liabilities of Rs. 1,311.32 million (2015: Rs. 384.09 million), and had the interest rates varied by 100 basis points (2015: 100 basis points) with all the other variables held constant, pro�t before tax for the year would have been lower / higher by approximately Rs. 13.11 million (2015: Rs. 3.84 million), mainly as a result of higher / lower interest expense on �oating rate borrowings.
(Rupees in thousand)
2016 2015
Total Borrowings 1,320,300 386,614 Cash and Bank (249,667 ) (174,547 )
Net Debt 1,070,633 212,067 Total Equity 2,543,756 2,791,448 Total Capital 3,614,389 3,003,515
Gearing Ratio 30% 7%
The Group �nances its operations through equity, borrowings and management of working capital with a view to maintaining an appropriate mix between various sources of �nance to minimise risk.
33.4 Fair values of financial assets and liabilities
The carrying values of all �nancial assets and liabilities re�ected in the �nancial statements approximate their fair values.
34. CORRESPONDING FIGURE
Following reclassi�cation have been made for proper presentation:
35. EVENTS OCCURRING AFTER BALANCE SHEET DATE
The Board of Directors in its meeting held on August 29, 2016 proposed a cash dividend for the year ended June 30, 2016 of Rs. 2.75 per share amounting to Rs. billion 0.28 (2015: cash dividend of Rs. 10 per share amounting to Rs. 1.04 billion) subject to the approval of the Group in the annual general meeting. Finance Act, 2015 introduced Income Tax at the rate of 10% on undistributed reserves where such reserves of the company are in excess of its paid up capital and the company derives pro�ts for a tax year but does not distribute requisite cash dividend within six months of the end of the said tax year. Liability in respect of such income tax, if any, is recognised when the prescribed time period for distribution of dividend expires.
36. DATE OF AUTHORISATION
These �nancial statements were authorised for issue by the Board of Directors of the Group on August 29, 2016.
The sensitivity of 100 basis points (2015: 100 basis points) movement in interest rates has been used as historically (�ve years) �oating interest rates have moved by an average of 100 basis points (2015: 100 basis points) per annum.
33.3 Capital Risk Management
The Group's objectives when managing capital are to safeguard the Group's ability to continue as a going concern in order to provide returns for shareholders and bene�t for other stake holders and to maintain an optimal capital structure to reduce the cost of capital.
During 2016, the Group's strategy was to maintain leveraged gearing. The gearing ratio as at June 30, 2016 was as follows:
Chief Executive Director
Reclassification fromcomponent
Profit and loss account
Distribution Cost Sales 22,854
Reclassification tocomponent
Rupees inthousand
Annual Report 2016 145Share Food, Share Love144

Notice of Annual General Meeting Notice of Annual General Meeting
Notice is hereby given that the 45th Annual General Meeting of National Foods Limited will be held on Thursday, October20, 2016 at Beach Luxury Hotel, Karachi, at 3:00 pm to transact the following business:
Ordinary Business:
1. To con�rm the minutes of the 44th Annual General Meeting held on October 21, 2015.
2. To receive, consider and adopt the Audited Financial Statement of the Company for the year ended June 30, 2016 together with the Directors’ and Auditors’ Report thereon.
3. To approve and declare the dividend on the Ordinary Share of the Company. The Directors have recommended �nal dividend of 55% (Rs. 2.75/- per Ordinary share of Rs. 5/- each) on Ordinary shares, for the year ended June 30, 2016.
4 To appoint External Auditors of the Company for the ensuing year and to �x their remuneration. The retiring auditors,
M/s A. F. Ferguson & Co. Chartered Accountants, had indicated their consent to continue as auditors. The Company had also received a notice, under Section 253(1) of the Companies Ordinance, 1984, from one of its shareholders proposing the replacement. The Board of Directors and the Audit Committee, has thus proposed the appointment of M/s KPMG Taseer Hadi & Co., Chartered Accountants in place of retiring auditors M/s A. F. Ferguson & Co. Chartered Accountants, for the year ending June 30, 2017.
5. To transact any other business with the permission of the Chair.
By Order of the Board
Karachi Fazal ur Rehman HajanoDate: September 28, 2016 Company Secretary
NOTES:
1. Book Closure The share transfer books of the Company will remain closed from October 14, 2016 to October 20, 2016 (both
days inclusive). Transfers received, in order, at the of�ce of our Share Registrar M/s. Central Depository Company of Pakistan Limited, CDC House, Block B, SMCHS, Main Shahrah-e-Faisal, Karachi -74400, by the close of business on October 13, 2016, will be considered in time for the determination of the entitlement of the shareholders to �nal cash dividend and to attend and vote at the meeting.
2. Appointment of Proxy and Participation in the AGM a) A member entitled to attend, speak and vote at the Annual General Meeting is entitled to appoint another
member as his/her proxy to attend, speak and vote for his/her behalf. A proxy must be a member of the Company. A proxy shall also have the right to demand and join in demanding a poll and vote on a poll.
b) The instrument appointing proxy, together with the power of attorney or other authority under which it is signed, as the case may be, or a notarially certi�ed copy of the power or authority, must be deposited at 409, The Forum, G-20 Block-9, Khayabane-e-Jami, Clifton Karachi, at least 48 hours before the time of the meeting. Form of Proxy is enclosed. Attested copies of valid CNIC or the passport of the member and the Proxy shall be furnished with the Proxy Form.
c) Owners of the physical shares and of the shares registered in the name of Central Depository Company of Pakistan Ltd. (CDC) and / or their proxies are required to produce their original valid Computerized National Identity Card (CNIC) or Passport, for identi�cation purposes, at the time of attending the meeting.
3. Submission of Copies of Valid CNICs: SECP vide SRO No. 831(1)/2012 dated July 05, 2012 directed the companies to issue dividend warrant crossed
as “A/c Payee only” which should also bear the Computerized National Identity Card (CNIC) of the registered member. Availability of valid CNIC of all members is also necessary for �ling, with SECP, of the list of members along with Annual Return of the Company.
Members, who have not yet submitted attested photocopy of their valid CNIC along with folio number are requested to send the same, at the earliest, directly to the Company’s Share Registrar.
In case of non-availability of valid copy of CNIC of any member, in the Company’s records, the Company may withhold the dividend payment, which will be released only upon providing the copy.
4. Dividend Mandate Option / E-Dividend Facility Dividend Mandate Forms are available at the Registered Of�ce of the Company and the same are also placed
on the Company’s website. Members are encouraged to provide, duly �lled in dividend mandate form, to receive the cash dividend declared by the Company, if any, directly into their bank account through e-dividend payment mechanism, as advised by the Securities and Exchange Commission of Pakistan vide its communication reference No. 8(4)SM/CDC2008 dated April 05, 2013. The members who wish to avail e-Dividend payment facility shall not receive the dividend warrant. Members not providing dividend mandate shall continue to be paid through the dividend warrants.
Annual Report 2016 147Share Food, Share Love146

Notice of Annual General Meeting Notice of Annual General Meeting
5. Changes in Members Addresses Members are requested to notify any change in their addresses immediately to the Share Registrar M/s. Central
Depository Company of Pakistan Limited.
6. Deduction of Income Tax under Section 150 of the Income Tax Ordinance, 2001
a) Pursuant to the Finance Act, 2016, effective July 01, 2016, the rate of deduction of income tax under Section 150 of the Income Tax Ordinance, 2001, from payment of dividend to a NON-FILER of income tax return is prescribed as 20% and for FILER of Tax Returns as 12.5%. List of Filers is available at Federal Board of Revenue’s (FBR) website: http://www.fbr.gov.pk. Members are therefore advised to update their tax FILER status latest by October 13, 2016.
b) Further, according to clari�cation received from Federal Board of Revenue (FBR), with holding tax will be determined separately on ‘Filer/Non-Filer’ status of Principal shareholder as well as joint-holder(s) based on their shareholding proportions, in case of joint accounts.
In this regard all shareholders who hold shares jointly are requested to provide shareholding proportions of Principal shareholder and Joint-holder(s) in respect of shares held by them to our Share Registrar, in writing as follows:
The required information must reach our Share Registrar by the close of business (5:00 p.m) on October 13, 2016; otherwise it will be assumed that the shares are equally held by Principal shareholder and Joint Holder(s).
c) The corporate shareholders having CDC accounts are required to have their National Tax Number (NTN) updated with their respective participants, whereas corporate physical shareholders should send a copy of their NTN certi�cate to the company or Share Registrar. The shareholders while sending NTN or NTN certi�cates, as the case may be, must quote company name and their respective folio numbers.
d) The information received within the above speci�ed time would enable the Company to deduct income tax at the applicable rates from the payment of dividend if announced by the Company on October 20, 2016.
e) Members seeking exemption from deduction of income tax or deduction at a reduced rate under the relevant provisions of the Income Tax Ordinance, 2001, are requested to submit a valid tax certi�cate or necessary documentary evidence, as the case may be, latest by October 13, 2016.
f) For any query/problem/information, the investors may contact the company and/or the Share Registrar at the following email addresses:
Company: [email protected] Share Registrar: [email protected]
7. Availability of Financial Statements and Reports on the Website: The Annual Report of the Company for the year ended June 30, 2016 has been placed on the Company’s website at the given link: http:// http://nfoods.com/investor-relations/�nancial-report/
8. Transmission of Annual Financial Statements and Notice of Meeting through Email In terms of SRO No 787(I)/2014 dated September 8, 2014, shareholders can opt to obtain annual balance sheet
and pro�t and loss account, auditor’s report and directors report etc. alongwith the notice of Annual General Meeting through email. Members who desire to receive annual �nancial statements and notice of meeting for the �nancial year ending June 30, 2017 or onward through e-mail, instead of registered post/courier, are requested to submit their consent alongwith your valid email ID on the FORM available for the purpose on Company’s website.
Folio/CDCA/c No.
Totalnumber of
shares Name and CNIC No.
Name and CNIC No.
ShareholdingProportion
(No. of Shares)
Principal Shareholders Joint Holder(s)
ShareholdingProportion
(No. of Shares)
Annual Report 2016 149Share Food, Share Love148

Glossary
ATL:
APLAC:
BTL:
CEO:
CSR:
DDS:
DMCC:
FSSC:
HACCP:
HMA:
HR:
ID:
ISO:
NFL:
PNAC:
PR:
RDP:
SAP:
SIP:
SKU:
SnOP:
TVC:
UNICEF:
Above the Line
Asian Paci�c Laboratory Accreditation Cooperation
Below the Line
Chief Executive Of�cer
Corporate Social Responsibility
Door to Door Service
Dubai Multi Commodities Centre
Food Safety System Certi�cation
Hazard Analysis and Critical Control Points
Halal Monitoring Authority
Human Resource
International Division
International Standard Organisation
National Foods Limited
Pakistan National Accredation Council
Purchase Requisition
Rural Development Programs
System, Applications and Products in data processing
Sales Incentive Plan
Stock Keeping Units
Sales and Operations Planning
Television Commercial
United Nations International Children's Emergency Fund
Annual Report 2016 151Share Food, Share Love150
This page has been left blank intentionally

Jama Punji Information
PROPOSED ARTICLES OF ASSOCIATION
I/We_________________________________________________________________________________________________________ of
_______________________________________________________________________________________________being a member of
National Foods Limited holding_________________________________________________________ordinary shares as per Registered
Folio No./CDC A/C No. (for members who have shares in CDS) _____________________________________________________________
hereby appoint Mr./Mrs./Miss______________________________________________________________________________________of
(full address)_______________________________________________________________________________________ or failing him/her
Mr./Mrs./Miss____________________________________________________________________________________________________of
(full address)______________________________________________________________________________________________________
(being member of the Company) as my/our Proxy to attend, act and vote for me/us and behalf at the 45th Annual General Meetingof the Company to be held on October 20, 2016 and/or any adjournment thereof.
As witness my/our hands seal this__________________________________day of_________________________2016.
Signed by___________________________________________________________________________________in the
Signature onRs. 5/-
Revenue Stamp
(Signature must agree with the specimensignature registered with the company)
1. Witness
Signature
Name:
Address:
CNIC No. - - CNIC No. - -
Important:
1. This form of proxy, duly completed and signed, must be deposited at the of�ce of theCompany's Shares Registrar, not later than 48 hours before the meeting.
2. This form should be signed by the Member or by his/her attorney duly authorized inwriting. If the member is a Corporation, its common seal should be af�xed tothe instrument.
3. A Member entitled to attend and vote at the meeting may appoint any other Member as his/her proxy to attend and vote onhis/her behalf except that a corporation may appoint a person who is a Member.
For CDC Account Holders/Corporate Entitles:
In addition to the above following requirements have to be met:
i. The Proxy form shall be witnessed by two persons whose names, address and CNIC Numbers shall be mentioned on the form.
ii. Attested copies of CNIC or Passport of the bene�cial owners and proxy shall be furnished with the proxy form.
iii. The proxy shall produce his/her original CNIC or original Passport at the time of the meeting.
iv. In case of corporate entity, the Board of Directors' resolution/power of attorney with specimen signature shall be submitted(unless it has been provided earlier) along with proxy form.
2. Witness
Signature
Name:
Address:
Form of Proxy
Annual Report 2016 153Share Food, Share Love152