Embed Size (px)
Citation preview

ANNUAL REPORT 2014

His HighnessSheikh Khalifa bin Zayed Al NahyanPresident of the UAERuler of Abu Dhabi
His Highness Sheikh Mohammed bin Rashid Al MaktoumVice President and Prime Minister of the UAERuler of Dubai
His HighnessSheikh Hamdan bin Mohammed bin Rashid Al MaktoumCrown Prince of Dubai
His HighnessSheikh Hamdan bin Rashid Al MaktoumDeputy Ruler of DubaiMinister of Finance of the UAE
His HighnessSheikh Maktoum bin Mohammed bin Rashid Al MaktoumDeputy Ruler of Dubai
4 Commercial Bank of Dubai
Our PurposeBuilding sustainable prosperity through extraordinary banking experiences
Our MissionTo be loved for our passion and excellence
Our Values• Authenticity
• Simplicity
• Partnership
• Innovation
• Responsibility
• Excellence

5Annual Report 2014
Board of Directors 6
Chairman’s Statement 8
General Management 10
The Report of the Board of Directors 12
Report of the Auditors to the Shareholders 24
Consolidated Statement of Financial Position 26
Consolidated Income Statement 27
Consolidated Statement of Comprehensive Income 28
Consolidated Statement of Changes in Equity 29
Consolidated Statement of Cash Flows 30
Notes to the Consolidated Financial Statements 31
Branches 96
Contents

6 Commercial Bank of Dubai
Board of Directors
Mr. Saeed Ahmed GhobashChairman
Mr. Hamed Ahmed Kazim Director
Mr. Ali Fardan Al FardanDirector
Mr. Mohammed AbdulrahmanAl JallafDirector
Mr. Khalid Abdul WahedAl RostamaniDeputy Chairman
Mr. Omar Abdulla Al FuttaimDirector

7Annual Report 2014
Mr. Abdulla Saif Al HathboorDirector
Mr. Abdul Wahid Abdul RahimAl UlamaDirector
Mr. Abdulla Saeed Al NaboodaDirector
Mr. Mana Mohammed SaeedAl MullaDirector
Mr. Shehab Mohamed GargashDirector
Shareholders 80% 20%UAE Nationals Dubai Government

8 Commercial Bank of Dubai
Dear Shareholders,
It is my pleasure, on behalf of the Board of Directors, the management and the staff of the Commercial Bank of Dubai, to review the Bank’s activities, achievements and financial performance for the year 2014, while shedding some light on the most important events and changes on local, regional and international levels and their influence on banking and finance activities.
2014 witnessed significant economic developments at the international level, the most important of which was the continued fragile economic recovery in Europe, where nations are struggling to avoid sliding into recession again. We saw the introduction of some unorthodox policies in Japan in an attempt to bolster the domestic economy and the continuation of slowing growth in China.
However, the picture was not totally grim. The US economy continued its moderate growth and the main emerging economies in Africa and some Asian and Latin American countries recorded good growth rates.
At the local level, the economy of the United Arab Emirates recorded a strong performance despite the fall in oil prices, this demonstrates the success of the UAE’s strategy to diversify its economic structure in order to achieve sustainable development and curb the impact of fluctuations in the prices and revenues of oil exports. The contribution of non-oil sectors in the GDP rose to 69%, which is a record high.
The local economy registered strong growth of close to 5%. This has been supported considerably by continued government expenditure on infrastructure projects, especially in the sectors of energy, roads, housing, health, and education. Further investment in tourism, trade, services, manufacturing, and aviation has also played its part in the success. The non-oil sectors in the UAE’s sustained economic growth helped to drive the country’s GDP to approximately 1.54 trillion dirhams.
Chairman’s Statement
The year also witnessed the UAE making huge progress in its international rankings, including the Global Competitiveness Report, in which the country progressed upward by seven ranks compared to 2013. This bears testimony to the leading global role of the UAE, and the success of its efforts to realize the ambitious UAE Vision 2021 under the country’s wise leadership.
The UAE further enhanced its standing as a major active international trade center with the total value of non-oil external trade increasing to 1.55 trillion dirhams despite a decline in the international prices of goods. The strong growth in import, export and re-export transactions compensated for the fall in prices.
The strong recovery in the tourism, retail, and services sectors continued with the UAE receiving record numbers of tourists and retail trade registering robust activity. Dubai International Airport gained the distinction of overtaking London Heathrow as the busiest airport in the world.
Amidst all this, the real estate sector witnessed a fluctuating performance; after a strong first few months of the year, the sector witnessed a comparative slowdown during the second half. However, the continued increase in rents put the brakes on price regression. Government measures aimed at curbing speculation contributed to more depth and stability in the sector.
In conjunction, the construction sector continued to recover as developers started new projects and completed

9Annual Report 2014
CBD continued with its ambitious expansion plans alongside its commitment to enhance its financial solvency and the quality of its asset portfolio. The Bank’s efforts to expand in the area of personal banking and network banking services bore positive fruit
“
previously suspended ones. The rise in rents and prices of goods contributed to an increase in the Consumer Price Index, which fluctuated around the 2.5% level.
Local equity markets witnessed a dichotomous performance. After registering a big increase at the beginning of the year, speculation and profit-taking caused stock prices to lose most of these gains in spite of an improved financial performance by companies.
The banking sector enjoyed a good year. Deposits continued to register healthy growth rates that strengthened the sector’s liquidity and helped boost lending activity. This resulted in strong profit growth, even as banks continued to clean up their balance sheets by making adequate provisions with the support and guidance of the UAE Central Bank.
CBD continued with its ambitious expansion plans alongside its commitment to enhance its financial solvency and the quality of its asset portfolio. The Bank’s efforts to expand in the area of personal banking and network banking services bore positive fruit with a significant expansion in the customer base of these two segments.
The Bank’s continued success in enhancing its presence in the corporate banking segment, as well as with family groups, high net worth individuals and Islamic banking was supported by the creation of more products and services to meet the requirements of its growing customer base.
These elements place the Bank in an ideal position to leverage the growth prospects of the national economy in the coming years.
The momentum of growth and development that CBD has experienced underlines the success and resilience of its business strategy. The Bank posted a net profit of 1.2 billion dirhams, an increase of 19% compared with 2013, while
assets increased by 5.5% over the previous year, reaching 46.9 billion dirhams.
During the year, CBD’s Board of Directors and executive management worked hard on multiple components of the bank’s strategy that focuses on strengthening the Bank’s leading position at the local and regional levels; upgrading performance and efficiency across all functions; improving customer service significantly and expanding into new growth segments. This will continue to bolster the Bank’s revenues, profits and growth prospects as well as shareholder returns, while maintaining the quality of its credit portfolio by adopting lending policies based on discretion, intimate knowledge of markets and clients, and a proactive approach to any unfavorable developments in the market.
In 2014, we also focused on building the Bank’s capability and readiness to handle evolving client needs through an approach that focuses on developing our human resources, particularly our National staff. We adopted the latest technologies to allow us to face challenges and capitalize on emerging opportunities. We continue to ensure that the Bank’s growth is in line with the aspirations and ambitions of its shareholders, while, at the same time, continuing to play a vital and ever-increasing role in enhancing the development of the UAE under its wise leadership.
I would like to take this opportunity to offer my heartfelt thanks and appreciation to the Bank’s shareholders, clients and other stakeholders for their confidence and support; to offer my gratitude to the Bank’s management and employees for their unceasing efforts to support the Bank’s growth and to produce the encouraging results we have achieved.
Best Regards,
Saeed Ahmed Ghobash Chairman
“

10 Commercial Bank of Dubai
Mr. Yaqoob Yousuf Hassan* Deputy Chief Executive
First row (from left to right):
Mr. Peter BaltussenChief Executive Officer
Mr. Ibrahim AbdullaSecretary to the Board of DirectorsGeneral Manager, Administration and Human Resources
Second row (from left to right):
Third row (from left to right):
Mr. Thomas PereiraChief Financial Officer
Mr. Fahad Al MuhairiGeneral ManagerAttijari Al Islami
Mr. Murray SimsGeneral ManagerPersonal Banking Group
*Retired since July 2014
Mr. Mahmoud Hadi Chief Operations Officer
Mr. Alain RenaudGeneral ManagerCorporate, Commercial andInvestment Banking
General Management

11Annual Report 2014
From left to right
Stephen Davies Deputy General Manager, Corporate Banking
Shorouk Al Redha Head of Human Resources
Anoop SapraHead of Internal Audit
Maher Al MarzouqiDeputy Head of Commercial Banking
Yousif Al SuwaidiHead of Sales andDistribution
Mohamed Nassim FaizHead of Debt Capital Market & Syndications
Frans Jan Burkens Deputy General Manager,Personal Banking
Moukarram Atassi Head of Investment Group
Akram GharabehHead of Financial Control
Amer Al ShamaliHead of Business Development – CCIB
Tariq Bin HendiDeputy Head of Corporate Advisory
Hussain Al BalooshiHead of HR Business Partners
Othman Bin HendiHead of Credit
Ahmed Al AboodiHead of Special Credit
Hassan Al Redha Head of Financial Institutions
Masood SafarHead of AMLand Compliance
Nasser AlnajjarHead of Central Operations
Laurent HawathHead of Commodity Finance
John Tuke Head of Treasury and Asset and Liability Management
Asem Fikree Chief Information Officer
Ra’ed Abubaker Regional Manager,Abu Dhabi Region
Stelios MichaelidesHead of Strategic Planning
Tanveer IslamHead Of CorporateProducts
Frederick CarstensDeputy Head of Human Resources
Abdul Rahim Al NimerDeputy General Manager, Commercial Banking
Nabil TayyebDeputy General Manager, Attijari Al Islami
Srikanth DasHead of Corporate Credit
Lakshmanan Sankaran Head of Operations and Trade Finance
Souhayel Tayeb Ph.D Head of Legal Department
Waleed Mohammed Bin SuloomAssistant General Manager, Administration
Jamal SalehHead of RiskManagement
Akram SkaikHead of Private banking
Mohammed Ali RedhaHead of Business Banking
12 Commercial Bank of Dubai
Board of Directors Report 2014
CBD’s personal banking strategy saw the launch of its next generation online banking platform and unveiling of the first of its planned digital kiosks“ “
The audited financial statements in this Annual Report have been prepared in accordance with International Financial Reporting Standards (IFRS) and include Basel II Pillar III annual disclosures.
FINANCIAL HIGHLIGHTS Commercial Bank of Dubai (CBD) reported net profit of AED 1.2 billion for the year ended 31st December 2014; an increase of 19% over the AED 1.01 billion recorded a year earlier. The record 2014 net profit was achieved on the back of a collaborative effort from all of the lines of business, which has further diversified the Bank’s revenues. CBD’s personal banking strategy saw the launch of its next generation online banking platform, unveiling of the first of its planned digital kiosks at Dubai Men’s College targeting the young UAE population and a comprehensive re-alignment of its sales and distribution philosophy. At the same time, CBD has already commenced the process of re-aligning its corporate and commercial banking business, with the addition of value added services like corporate finance and debt capital markets advisory.
Operating Income: Operating income for the year reached an all-time high of AED 2.24 billion which was 10.2% higher than AED 2.03 billion for the year ended 2013. The increase in operating income was largely driven by a 9.3% increase in net interest income from AED 1.45 billion in 2013 to AED 1.58 billion for the full year ended 2014 and a 12.5% increase in non-interest income from AED 584.2 million to AED 657.5 million for the same periods.
Operating Expenses: Operating expenses increased by 20.2% to AED 754.4 million for the year ended 2014 (2013: AED 627.6 million). The Bank’s personal banking strategy entails investments in its sales & distribution network as well as digital banking. The strategy led to 35% growth of the personal banking assets portfolio. CBD has also invested in specialist resources to support its corporate banking growth strategy. The cost-to-income ratio marginally increased to 33.7% as a result.
Impairment Allowances: Impairment provisions net of recoveries reduced from AED 395 million booked during 2013 to AED 283.7 million in 2014.
Overall asset quality continued to improve, as evidenced by the non-performing loan (NPL) ratio dropping from 10.1% as at end of Dec-13 to 9.2% as at end of Dec-14. Meanwhile the impaired loan coverage ratio improved from 84.9% as at end of Dec-2013 to 93.7% as at 31 December 2014.
Net Profit: The net profit for the year 2014 amounted to AED 1,202.3 million, up by 19% as compared to AED 1,010 million for 2013. A sixth consecutive year of growth in annual profit is testimony to the consistency of CBD’s performance and reaffirms the overall strategy as formulated under the guidance of its Board of Directors. Return on average assets for the year ended 31 December 2014 improved to 2.6% from 2.4% for the year ended 2013. Return on average equity increased to 16.7% for the year ended 31 December 2014 when compared to 15.1% for the year ended 31 December 2013.

13Annual Report 2014
Assets and Liquidity: • CBD reported total assets of AED 46.9 billion as
at 31 December 2014 5.5% higher than AED 44.5 billion as at 31 December 2013.
• Customers’ loans & advances stood at AED 32.2billion, 6.2% higher when compared to AED 30.3 billion as at 31 December 2013. - Emphasis on its personal banking offering resulted
in a 35% increase in gross loans from AED 3.3 billion as at 31 December 2013 to AED 4.4 billion as at 31 December 2014.
- The Bank continued to grow its corporate banking business where gross lending increased by 4% from AED 29.1 billion as at end of December 2013 to AED 30.1 billion as at 31 December 2014.
• Customers’depositsatAED32.2billionwere3.9%over the AED 30.9 billion as at end of 2013.
• Advancestostableresourcesratioat82.6%asat31December 2014 against 80.9% as at 31 December 2013 compared to the regulatory maximum ratio of 100%.
• Liquidity coverage ratio as calculated per Basle-IIIguidelines was 109.1% as at 31 December 2014 whilst the minimum stipulated ratio is 50%.
Capital Adequacy: The Bank is robustly capitalized with total capital of AED 7.7 billion as at 31 December 2014. Capital adequacy ratio as per BASEL II was at 18.1% as at 31 December 2014 against regulatory requirement of 12%, while Tier 1 capital ratio was at 16.8% as at 31 December 2014.
The Board of Directors has proposed a 50% dividend for the year, with 25% paid as cash, AED 561 million (2013:
AED 612 million) and 25% as bonus shares, AED 561 million (2013: AED 204 million) subject to the agreement of the shareholders at the Annual General Assembly Meeting.
CORPORATE GOVERNANCECBD continued to follow international best practice in its Corporate Governance framework which was revised in 2013. The framework is created on principles of fair treatment for all stakeholders and to provide a basis for an inclusive relationship between the Bank, its Board of Directors, its Shareholders and other stakeholders including customers, regulators and supervisors.
Board of DirectorsThe Board of Directors has collective responsibility for the long term success of CBD and to provide overall direction, supervision and control. It has complete responsibility for the Bank’s operations and financial stability.
The Board sets CBD’s strategic objectives and has oversight responsibility over the executive management. It also ensures the effectiveness of internal control systems and keeps a watch on the extent to which the Bank implements strategic plans and approved policies. In addition, it is responsible for the credibility of the Bank’s financial reports, the application of appropriate risk policies as well as compliance with all laws and regulations in force.
The formation of the Board of Directors is governed by the Federal Law No. 8 of 1984 (as amended). The current Board comprises of eleven members elected for tenure of three years. CBD’s Board of Directors held a total of eight meetings during 2014 with a combined total of twenty four working hours.

14 Commercial Bank of Dubai
CBD’s corporate banking division had another strong year in 2014, with total revenue growth of 9%“ “
Board of Directors Report 2014 Continued
The Board has delegated authority to CBD’s executive management to enter into transactions which are consistent with the Bank’s Risk Strategy and policy guidelines (as described on pages 64 to 70 of the audited financial statements).
Board CommitteesThe Board has delegated specific responsibilities to committees as shown in the following table. Each Committee has a defined charter. The Board and its committees are supplied with complete and timely information to enable it to discharge its responsibilities. In this respect, the Board, its committees and all the directors have access to senior management, external consultants and advisors.
For details about corporate governance, board committees, management committees and control environment please see pages 64 to 73 of the audited financial statements.
Audit, Risk & Compliance Committee
(ARCC)
ARCC assists the Board of Directors in overseeing the Bank’s financial reporting system, internal control and risk management framework, audit functions, legal and regulatory requirements.
Nomination & Remuneration
Committee (NRC)
NRC reviews and approves HR strategy and key policies as well as CBD’s compensation program in order to attract, retain and motivate its employees.
Special Credit Committee
(SCC)
SCC reviews and follows up exposures which are delinquent or where significant financial difficulty of the borrower is evident and negotiates debt restructuring and repayments, evaluates adequacy of provisions for non-performing loans and reviews the overall performance of the credit portfolio.
Strategy and Transformation
Committee (STC)
STC assists the Board of Directors in fulfilling its oversight responsibilities relating to the Bank’s strategic plans and initiatives in support of its strategy. It initiates, reviews and evaluates the Bank’s growth strategy including inorganic growth. It also initiates, reviews and assesses responses to external developments and factors such as changes in the economy, industry trends, competition and technology.
Credit & Investment Committee
(CIC)
CIC oversees the quality of the Bank’s Credit & Investment portfolio and effectiveness of its credit policies and approves loans and investment above delegated limits.
CORPORATE BANKINGCBD’s corporate banking division had another strong year in 2014, with total revenue growth of 9%. Despite an increasingly competitive environment, CBD expanded and consolidated its relationships with clients from both the public and private sectors. Its growth strategy has been focused on companies involved in trade and manufacturing, along with growth sectors such as healthcare services and education. The result has been an increased level of business volume across customer segments (local and international companies) and products.

15Annual Report 2014
The new growth strategy has led to a year-on-year increase of fee and commission income of 21% primarily from higher transaction banking activity across Trade +16%, Cash Management +29% and from participation in syndicated loans +15% and Financial Institutions transactions +22%.
Moreover, the sector focus has already shown results with strong growth in sectors such as transportation and education.
COMMERCIAL BANKINGCBD’s commercial banking division had a good year, with revenue growth of 6% in 2014.
Loan volumes were strong with 17% year-on-year growth, and yields remaining at the higher end of the market; while fee and commission income progressed significantly at an annual rate of 19%. Fee income growth was driven by all transaction banking products, i.e. Trade +18% and Cash Management +28%.
While retaining a high market share in its UAE client base, with many businesses being family-owned, CBD has made strong progress in the expatriate segment, particularly through collaboration and agreements with key free zones such as:- Agreements were signed during the year with JAFZA,
Saif Free Zone, and Hamriyah Free Zone Authority subsequent to which it organized several customer and product seminars to showcase CBD’s range of solutions designed to meet its clients’ business requirements;
- CBD held discussions with Dubai Multi Commodities Centre (DMCC) to offer funding solutions for the diamond industry and the commodities sector ;
- Strategic partnerships were forged with key Abu Dhabi-based entities such as Abu Dhabi Education council (ADEC), Masdar, Industrial City of Abu Dhabi (ICAD) and Khalifa Industrial Zone Abu Dhabi (KIZAD);
- Specialist relationship managers were hired to provide an expanded range of services in Free Zone areas.
SPECIALIST PRODUCTSCBD offers its corporate and commercial banking clients a traditional range of corporate banking services: bilateral lending, syndicated finance, trade finance, payments, cash management and treasury services. In 2014 CBD has added two new products corporate advisory and commodity finance.
Trade FinanceGlobalization and the introduction of free trade agreements have made international trade more dynamic and challenging. During 2014, CBD created a Trade Sales Team comprising experienced trade products specialists, with a mandate to augment the trade portfolio in both the corporate and commercial segments.
The trade sales team introduced the concept of “Trade Advisory” for valued corporate and commercial clients and offered an additional channel of engagement through seasoned trade professionals. During 2014, the “Bene Marketing Approach” was also introduced in order to effectively utilize correspondent bank/country limits through primary market short tenor trade deals which resulted in soliciting greater export volumes and corresponding revenues through discounting of export LCs advised through CBD counters.

16 Commercial Bank of Dubai
CBD continued the aggressive growth of its personal banking customer base using a blend of state of the art technology, expanded distribution channels, market-friendly products, and a relationship-driven approach
“ “
The Report of the Board of Directors Continued
The African trade corridor has also been on the trade sales forefront during 2014 to enhance CBD’s geographical coverage of the African market. African country and bank limits were established along with strategic tie-ups with renowned Export Credit Agencies (ECAs), which resulted in capturing cross border trade opportunities offered by African markets.
Transactional Banking/ Payments and Cash ManagementThroughout 2014, CBD’s Payments and Cash Management team continued to provide high level of payment collections and liquidity management services to clients, which has led to very strong year-on-year growth of 29% in fees and commission.
Further, a new corporate card payment product was introduced with good uptake and utilization from its customers. This product will become more relevant as the UAE Government moves away from cash towards e-services.
Debt Capital Markets (DCM)The debt capital markets and syndications department is responsible for all loan underwriting and secondary market loan activities. The department worked closely with relationship managers to originate, structure, underwrite, and distribute syndicated loans and bonds covering many sectors including acquisition finance, leveraged finance, project finance, real estate, and public finance.
The DCM business has grown substantially in 2014 with 15% increase in fees, driven by increased focus on fee-based income and the aim of enhancing the CBD product suite for wholesale clients, particularly GREs and large corporates.
During 2014, CBD has won a number of large, high-profile financing mandates as lead arranger and underwriter, executing eight transactions with a combined transaction value of more than AED 1.9 billion.
Commodity FinanceIn line with the emergence of the UAE as a regional commodity trade hub, CBD created a department whose purpose is to seek business from local, regional and international commodity traders in the energy, agribusiness, metals and precious gems segments. A senior specialized banker supervises its fast growing activity in the diamond trade business, and African trade corridor strategy.
Corporate AdvisoryCBD constantly strives to offer its corporate and commercial clients more sophisticated products and services. With that in mind, and the recent hiring of a new General Manager for Corporate, Commercial and Investment Banking in 2014, CBD set up a corporate advisory team to offer its clients investment banking advice and services, focused on M&A (sell-side and buy-side), equity capital markets (especially IPOs and private placements) and financing advisory.
CBD’s clients are continuously growing and evolving their businesses, and the corporate advisory team can now help them move beyond a traditional lending relationship with the Bank into a more creative and dynamic relationship, supported by exceptional advice and service.

17Annual Report 2014
PERSONAL BANKINGCBD continued the aggressive growth of its personal banking customer base using a blend of state of the art technology, expanded distribution channels, market-friendly products, and a relationship-driven approach. This helped the Bank significantly expand the customer base in 2014, as well as the division’s contribution to overall revenues. Total personal banking asset growth of 35% compared extremely favourably with the market as a whole.
During the course of 2014 a number of projects were launched as part of the division’s strategy to be recognized by consumers and competitors as a leading service provider in the UAE for affluent customers, professionals and small enterprises competing on the basis of comprehensive, personalized, quality service provided across both traditional and digital channels.
In particular, emphasis was given to developing a comprehensive network strategy for the division’s branches including the design of an entirely new look, feel, zoned and branded branch concept which, going forward, will be the future model for all branches. A revised customer value proposition for the division’s affluent customers was also developed and a completely new service, distribution, sales and customer value proposition for the small business customer segment was launched. An entirely new “digital” kiosk was launched following a partnership agreement with the Higher Colleges of Technology, Dubai Men’s College. This new and refreshing approach to banking will, after testing, be the blue-print for the future kiosk strategy that will be implemented going forward.
Client centricity and customer engagement were also areas of particular focus in 2014. A new service quality function, encompassing the existing contact center (“Voice of Customer”); Business Process Engineering Unit and complaint management units were set-up and a comprehensive plan drawn up to ensure that going forward, client engagement features at the heart of everything the division undertakes.
Personal Banking unveiled its new website, bringing the next generation of online banking to customers’ smartphones, laptops, and desktops. The new platform brings an innovative and personalized customer experience, which includes Sara, the first virtual banking assistant, and the personal financial management tool, the most revolutionary way to analyze spending patterns, putting customers in total control of their finances, thereby helping them make smarter choices and achieve long-term financial goals.
Sara, is an avatar that chats intelligently and guides customers every step of the way, round the clock. Through Sara, CBD is able to engage online visitors in a conversational and friendly manner. While increasing customer engagement and overall satisfaction, Sara can also help bridge a real-time live dialog with the CBD call center in a live web chat.
CBD also initiated a brand new trend in banking services by introducing banking transactions through Facebook, the most widespread social networking website. This is the first time that a UAE bank has adapted its financial services specifically for Facebook. The initiative is the first in the region and one of only three in the world.

18 Commercial Bank of Dubai
The Report of the Board of Directors Continued
Online banking customers with a Facebook account can manage their daily banking needs without having to leave the platform they enjoy spending time on. Customers can perform a number of tasks such as checking their current and savings accounts and credit card balances without leaving Facebook. They can also pay CBD credit cards, as well as transfer money between their CBD accounts and apply for CBD products. They can also track their expenses.
With the objective of providing a wide array of financial options to its customers and, in effect, become a one-stop financial shop, CBD launched bancassurance products across all branches in 2014. The launch of the bancassurance business is in line with CBD’s multi-dimensional, multi-product approach to the needs of its customers.
CBD’s cards division also witnessed innovative and customer-oriented initiatives in 2014. All customer debit cards were upgraded to MasterCard with embedded “chip and pin” security. The transition from the previous cards was completed for all cardholders. The new microchip-embedded cards provide CBD’s customers with a more advanced level of payment security than cards with a magnetic stripe.
In keeping with CBD’s philosophy of offering customers the best of everything in the financial services space, the interest rate charged to the Bank’s credit card customers was reduced to 1.5 percent per month, compared to the 3 percent or more market norms. This rate applies to all credit cards offered by CBD, including World MasterCard; Visa Infinite, Signature and Classic; MasterCard Gold; and e-Tijari Web Card. The exciting new positioning has generated significant interest from existing as well as non-CBD customers. The personal
banking division’s achievements are in consonance with CBD’s philosophy of providing a more engaging customer experience in a competitive market. TREASURY & ASSET AND LIABILITY MANAGEMENTThe Treasury business, in 2014, was impacted by the continued low levels of interest rates and the increased competition in the foreign exchange (FX) markets.
Treasury Sales: During 2014, the Bank focused on strengthening Treasury product sales offerings. CBD introduced new documentation, updated policies and procedures, launched new products and upgraded staffing to offer improved services to its clients. The results were evident in the latter part of 2014 when CBD achieved record Treasury sales to clients despite competition for FX business from other local banks resulting in finer margins during the year. The sales desk now offers a full range of treasury products to support clients in mitigating the risks in their business associated with Foreign Exchange, Interest Rates and Commodities.
The Bank received number of inquiries from clients who were considering fixing their borrowing costs in anticipation of future interest rate rises following the end of the asset purchase program (quantitative easing) by the US Federal Reserve. The Treasury sales team provided these clients with bespoke solutions.
Trading and Liquidity: During 2014, ongoing low US interest rates and increased liquidity in the local market resulted in downward pressure on AED deposit rates. CBD was able to take advantage of these factors to reduce its cost of funds to record low levels; in fact, its cost of funds was amongst the lowest of all the UAE banks
2014 was a good year for Attijari Al Islami, which recorded consistent growth and delivered notable achievements along the path of commitment towards excellence through high standards of customer service and a range of innovative new Islamic product offerings.
“
“

19Annual Report 2014
and thus an important contributing factor to the Bank’s net interest income. Early in the year CBD renewed its Euro Medium Term Note (EMTN) program but due to its comfortable funding levels, the Bank did not enter into any new related transactions in 2014.
ATTIJARI AL ISLAMI2014 was a good year for Attijari Al Islami, CBD’s Islamic Banking division, which recorded consistent growth and delivered notable achievements along the path of commitment towards excellence through high standards of customer service and a range of innovative new Islamic product offerings.
The Bank’s Islamic financing increased by 12 percent continuing the remarkable growth levels achieved since the division was established in 2009.
CBD has 24 Attijari Al Islami centres and four dedicated Islamic units across the UAE. During the year Attijari Al Islami introduced new product offerings such as Sukuk Murabaha and Commodity Murabaha to facilitate retail customers’ cash and buy-out requirements under the umbrella of its Absher Personal Finance. CBD also introduced a group scheme through which it offered employees of approved corporate entities the full range of retail Islamic products on preferential pricing and terms.
The Attijari Al Islami Sharia Supervisory Board comprises three leading scholars in the field of Islamic Banking. The role of these scholars is to review the operations of Attijari Al Islami, supervise its development of Islamic products, and determine the Sharia compliance of the Bank’s existing and new products.
Attijari Al Islami is ready to move ahead with more ambitious plans to take the country’s Islamic financial industry to the next level.
INFORMATION TECHNOLOGY2014 was a rewarding year for CBD’s Information Technology Department. IT continued modernizing its infrastructure, security and application-delivery platforms while remaining agile and responsive to business needs and customer demands.
More than thirty projects were successfully delivered, of which many had clearly defined business benefits while others provided the foundations for future business growth.
Some of the key initiatives completed during the year are:
New Internet Banking: CBD was the first bank in the region to launch advanced personal finance management and virtual assistant (Sara) modules as part of its new Internet banking’s feature-rich interface.
Facebook Banking: The first in the region and one of only three in the world, this initiative enables CBD customers to login to their Facebook accounts and perform banking transactions.
Customer Visit Management System: This enables priority queuing for VIP customers and improves customer turn-around times.
Utility Payment Gateway: This was enhanced and made more robust, to enable additional payment options such as Western Union.
20 Commercial Bank of Dubai
Corporate Social Responsibility is a core element ofCBD’s mission, vision and values. The Bank’s CSR policiesare continuously reviewed and aligned with the needs ofthe society and environment
“ “
The Report of the Board of Directors Continued
CBD Financial Services System: The CBDFS System was upgraded to provide a better customer experience through a new interface.
Digital Kiosk: CBD has launched its first model digital branch to provide an innovative digital experience to customers in the Higher Colleges of Technology.
Express Account Opening: Customers can now visit CBD branches with a valid Emirates ID and open an account within a few hours.
CBD IT was rated best in the world in the ICMG World Architecture Awards for “Driving Transformation and Change”. The ICMG WAA is a global award across more than 24 countries, including the USA, France and South Africa.
CBD is certified for ISO 9001:2008 “Quality Management System” and 10002:2004 “Customer Satisfaction”. In addition, many CBD IT staff are certified in various disciplines like TOGAF, COBIT, PRINCE2, PMP, Green-IT, Six Sigma Green-Belt etc. The Bank is committed to enhancing technology to enable it to introduce innovative banking products in an efficient, contemporary way, to optimize banking convenience, and thereby attract and retain customers.
HUMAN RESOURCES AND TRAININGCBD grew its headcount by 6 percent in 2014 to 1,230 and takes pride in recognizing and rewarding staff for their achievements, with a special focus on promoting
deserving UAE Nationals to key senior management positions. At the end of 2014, the actual number of UAE Nationals made up 41 percent of the Bank’s employees, many of whom are in key leadership positions.
Given the success of the initial two management trainee programs for Emirati candidates, another program was started at the end of 2014. The third program has nine UAE Nationals engaged in an 18-month management training program. They will undergo a carefully planned series of training programs as well as on-the-job training and, through this process, be groomed to take on leadership roles in CBD.
To further support its Emiratization policy, the Bank again took part in four National Career Fairs in Abu Dhabi, Dubai, Sharjah and Ajman, as well as career open days with six universities in Dubai and Sharjah. CBD also supported local initiatives through the National HR Development and Employment Authority in Abu Dhabi, Dubai and Sharjah.
To underscore CBD’s leadership status in Emiratization in the UAE banking sector, the Bank was awarded the UAE National Resources Development Award. CBD’s efforts have also been recognized by the GCC Social Affairs and Labor Ministers Council with an award honoring the Bank’s contributions to localization. CBD also won the Dubai Human Development Award from the Department of Economic Development in Dubai, as well as the Human Resources Development Award

21Annual Report 2014
from the Emirates Institute for Banking and Financial Studies.
To ensure that the successful transfer of skills continues to take place within CBD, just over 90 managers were trained in coaching skills during 2014. CBD also ran best-in-class individual competency assessments on their top hundred leaders and top sixty relationship managers to determine development needs. Individual plans have been developed and the customized interventions will be delivered in 2015 to ensure that CBD continues to provide extraordinary banking experiences to all of its customers.
During 2014 the new CBD purpose, mission and values were developed and communicated to its employees through an experiential event facilitated by fifty of its own staff. Throughout 2015, the new values will be cascaded into the organization and will also form the core fabric of the key performance drivers for 2015.
CORPORATE SOCIAL RESPONSIBILITYThe Bank’s CSR practices are in line with society’s values, principles and needs. This is based on the belief that businesses have the responsibility to operate ethically and with integrity. The Bank aims to fulfil its role as a responsible corporate citizen through a CSR framework that addresses all its stakeholders.
As part of its CSR, CBD organized a blood donation day in co-operation with the Department of Blood
Transfusion and Research Services at the UAE Ministry of Health to provide blood for thalassemia patients in the country.
The Bank once again collaborated with Dubai Sports Council to organize the fourth edition of the CBD Youth Athletics Competition, Dubai’s biggest athletics tournament for young athletes from public and private schools. The Olympics-like event witnessed immense sportsmanship and camaraderie among the athletes, and unstinting support for the competitors from their classmates, teachers, and families.
The Bank’s active CSR calendar included silver sponsorship by Attijari Al Islami of the 10th World Islamic Economic Forum in Dubai; platinum sponsorship of the Fourth Annual Middle East Accountancy and Finance Excellence Awards organized by ICAEW in Dubai; and strategic sponsorship of the Sheikha Latifa Childhood and Youth Creativity Awards.
22 Commercial Bank of Dubai
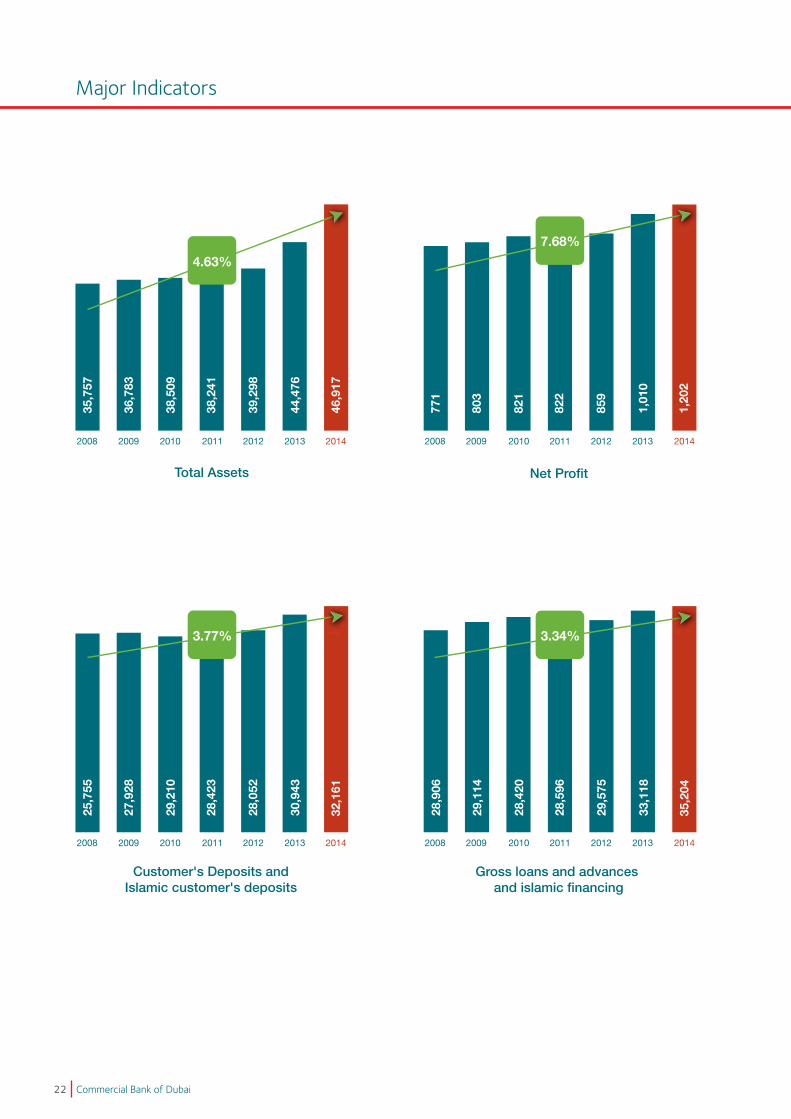
Major Indicators
2008 2009 2010 2011 2012 2013 2014
2008 2009 2010 2011 2012 2013 2014
Total Assets Net Profit
Customer's Deposits andIslamic customer's deposits
3.77%
4.63%
7.68%
3.34%
Gross loans and advances and islamic financing
2008 2009 2010 2011 2012 2013 2014
25,755
27,928
29,210
28,423
28,052
30,943
32,161
35,757
36,783
38,509
38,241
39,298
44,476
46,917
771
803
821
822
859
1,01
0
1,20
2
28,906
29,114
28,420
28,596
29,575
33,118
35,204
2008 2009 2010 2011 2012 2013 2014
23Annual Report 2014
Report of the Auditors to the Shareholders
Consolidated Statement of Financial Position
Consolidated Income Statement
Consolidated Statement of Comprehensive Income
Consolidated Statement of Changes in Equity
Consolidated Statement of Cash Flows
Notes to the Consolidated Financial Statements

24 Commercial Bank of Dubai
Report of the Auditors to the Shareholders

25Annual Report 2014
Report of the Auditors to the Shareholders (continued)

26 Commercial Bank of Dubai
Consolidated statement of financial position As at 31 December 2014
Mr. Saeed Ahmed GhobashChairman
Mr. Peter BaltussenChief Executive Officer
2014 2013 Note AED’000 AED’000ASSETS Cash and balances with Central Bank 5 5,450,145 6,132,063Due from banks 6 1,565,312 1,662,172Loans and advances and Islamic financing 7 32,167,216 30,287,385Investment securities 8 5,587,998 4,228,653Investment in associate 9 84,590 72,862Investment properties 10 249,991 259,853Property and equipment 11 323,852 321,273Other assets 12 1,488,150 1,511,930––––––––––––––––––––––––––––––––––––––––––––––––––––––––––––––––––––––––––––––––––––––––––––––––––––––––––––Total assets 46,917,254 44,476,191=========================================================================================================== LIABILITIES AND EQUITY LIABILITIES Due to banks 13 1,097,926 499,259Customers’depositsandIslamiccustomers’deposits 14 32,161,339 30,942,680Notes and medium term borrowings 15 4,021,998 4,014,806Other liabilities 16 1,825,578 1,803,057––––––––––––––––––––––––––––––––––––––––––––––––––––––––––––––––––––––––––––––––––––––––––––––––––––––––––––Total liabilities 39,106,841 37,259,802––––––––––––––––––––––––––––––––––––––––––––––––––––––––––––––––––––––––––––––––––––––––––––––––––––––––––––
EQUITY Share capital 17 2,242,187 2,038,352Legal reserve 17 1,380,495 1,379,813Capital reserve 17 38,638 38,638General reserve 17 1,121,095 1,100,000Cumulative changes in fair values of AFS investments and cash flow hedge instruments 17 69,808 54,712Reserve for proposed bonus issue 17 560,547 203,835Proposed cash dividend 17 560,547 611,506Proposeddirectors’remuneration 17 10,540 11,000Retained earnings 1,826,556 1,778,533––––––––––––––––––––––––––––––––––––––––––––––––––––––––––––––––––––––––––––––––––––––––––––––––––––––––––––Total Equity 7,810,413 7,216,389––––––––––––––––––––––––––––––––––––––––––––––––––––––––––––––––––––––––––––––––––––––––––––––––––––––––––––Total liabilities and equity 46,917,254 44,476,191===========================================================================================================
These consolidated financial statements were approved and authorized for issue by the Board of Directors on 28th of January 2015.The attached notes on pages 31 to 95 form part of these consolidated financial statements.
The report of the Auditors is set out on pages 24 and 25.

27Annual Report 2014
Consolidated income statement For the year ended 31 December 2014
2014 2013 Note AED’000 AED’000
Interest income and income from Islamic financing 18 1,827,058 1,766,533Interest expense and distributions to Islamic depositors 19 (244,093) (317,864) –––––––––––––––––––––––––––––––––––––––––––––––––––––––––––––––––––––––––––––––––––––––––––––––––––––––––––Net interest income and net income from Islamic financing 1,582,965 1,448,669
Net fees and commission income 20 405,389 354,918 Net gains from foreign exchange and derivatives 119,450 113,469 Net gains from investments at fair value through profit or loss - held for trading 21 2,506 1,604 Net gains from sale of available-for-sale investments 72,271 51,239Share of profit of associate 9 17,567 17,337Dividend income 22 6,579 6,254Other income 33,703 39,404–––––––––––––––––––––––––––––––––––––––––––––––––––––––––––––––––––––––––––––––––––––––––––––––––––––––––––Total operating income 2,240,430 2,032,894
Impairment allowances on loans and advances and Islamic financing 7 (347,288) (419,208)Recoveries 63,548 24,155–––––––––––––––––––––––––––––––––––––––––––––––––––––––––––––––––––––––––––––––––––––––––––––––––––––––––––Total net income 1,956,690 1,637,841–––––––––––––––––––––––––––––––––––––––––––––––––––––––––––––––––––––––––––––––––––––––––––––––––––––––––––General and administrative expenses 23 (708,738) (581,382)Depreciation and amortization 10,11 (45,696) (46,224)–––––––––––––––––––––––––––––––––––––––––––––––––––––––––––––––––––––––––––––––––––––––––––––––––––––––––––Total operating expenses (754,434) (627,606) –––––––––––––––––––––––––––––––––––––––––––––––––––––––––––––––––––––––––––––––––––––––––––––––––––––––––––Net profit for the year 1,202,256 1,010,235==========================================================================================================Basic and diluted earnings per share 25 AED 0.54 AED 0.45 ==========================================================================================================
The attached notes on pages 31 to 95 form part of these consolidated financial statements.
Appropriations have been reflected in the consolidated statement of changes in equity.
The report of the Auditors is set out on pages 24 and 25.

28 Commercial Bank of Dubai
Consolidated statement of comprehensive income For the year ended 31 December 2014
2014 2013 AED’000 AED’000
Net profit for the year 1,202,256 1,010,235––––––––––––––––––––––––––––––––––––––––––––––––––––––––––––––––––––––––––––––––––––––––––––––––––––––––––––Other comprehensive income : Changes in fair value of effective portion of cash flow hedge (349) -
Changes in available-for-sale investments:Realized gains on sale of available-for-sale investments (72,271) (51,239)Amortization of reclassified investments - 3,608Share of other comprehensive income of associate 305 -Revaluation of available-for-sale investments 87,411 79,810
Net change in available-for-sale investments 15,445 32,179––––––––––––––––––––––––––––––––––––––––––––––––––––––––––––––––––––––––––––––––––––––––––––––––––––––––––––Other comprehensive income for the year 15,096 32,179––––––––––––––––––––––––––––––––––––––––––––––––––––––––––––––––––––––––––––––––––––––––––––––––––––––––––––Total comprehensive income for the year 1,217,352 1,042,414===========================================================================================================
Balances of all items included in other comprehensive income (as above) for the year ended 31 December 2014 and 2013 could be recycled to consolidated income statement in subsequent periods.
The attached notes on pages 31 to 95 form part of these consolidated financial statements.
The report of the Auditors is set out on pages 24 and 25.

29Annual Report 2014
Consolidated statement of changes in equity For the year ended 31 December 2014
Cumulative changes in fair values of AFS investments and cash Attributable Non- Share Legal Capital General Flow hedge Retained Proposed to equity Controlling capital reserve reserve reserve instruments earnings distributions of the parent interest Total AED’000 AED’000 AED’000 AED’000 AED’000 AED’000 AED’000 AED’000 AED’000 AED’000At 1 January 2013 2,038,352 1,379,683 38,638 1,100,000 22,533 1,595,295 622,506 6,797,007 13,577 6,810,584 Transactions with owners, recorded directly in equity Cash dividend paid for 2012 (30%) - - - - - - (611,506) (611,506) - (611,506) Proposed cash dividend for 2013 (30%) - - - - - (611,506) 611,506 - - - Proposed bonus issue for 2013 (10%) - - - - - (203,835) 203,835 - - - ShareofDirectors’remunerationofassociate - - - - - (526) - (526) - (526) Redemption of units of funds - - - - - - - - (13,577) (13,577) Comprehensive income Net profit for the year - - - - - 1,010,235 - 1,010,235 - 1,010,235 Other comprehensive income for the year - - - - 32,179 - - 32,179 - 32,179 Total comprehensive income - - - - 32,179 1,010,235 - 1,042,414 - 1,042,414 Directors’remunerationpaidfor2012 - - - - - - (11,000) (11,000) - (11,000)Proposed directors remuneration for 2013 - - - - - (11,000) 11,000 - - - Transfer to legal reserve - 130 - - - (130) - - - - ––––––––––––––––––––––––––––––––––––––––––––––––––––––––––––––––––––––––––––––––––––––––––––––––––––––––––––At 31 December 2013 2,038,352 1,379,813 38,638 1,100,000 54,712 1,778,533 826,341 7,216,389 - 7,216,389 Transactions with owners, recorded directly in equity Cash dividend paid for 2013 (30%) - - - - - - (611,506) (611,506) - (611,506) Proposed cash dividend for 2014 (25%) - - - - - (560,547) 560,547 - - - Bonus shares issued for 2013 (10%) 203,835 - - - - - (203,835) - Proposed bonus issue for 2014 (25%) - - - - - (560,547) 560,547 - - - ShareofDirectors’remuneration of associate - - - - - (822) - (822) - (822) Comprehensive income Net profit for the year - - - - - 1,202,256 - 1,202,256 - 1,202,256 Other comprehensive income for the year - - - - 15,096 - - 15,096 - 15,096 Total comprehensive income - - - - 15,096 1,202,256 - 1,217,352 - 1,217,352 Directors’remunerationpaidfor2013 - - - - - - (11,000) (11,000) - (11,000) Proposed directors remuneration for 2014 - - - - - (10,540) 10,540 - - - Transfer to legal reserve - 682 - - - (682) - - - - Transfer to General reserve - - - 21,095 - (21,095) - - - - ––––––––––––––––––––––––––––––––––––––––––––––––––––––––––––––––––––––––––––––––––––––––––––––––––––––––––––At 31 December 2014 2,242,187 1,380495 38,638 1,121,095 69,808 1,826,556 1,131,634 7,810,413 - 7,810,413 ===========================================================================================================
The attached notes on pages 31 to 95 form part of these consolidated financial statements. The report of the Auditors is set out on pages 24 and 25.
30 Commercial Bank of Dubai
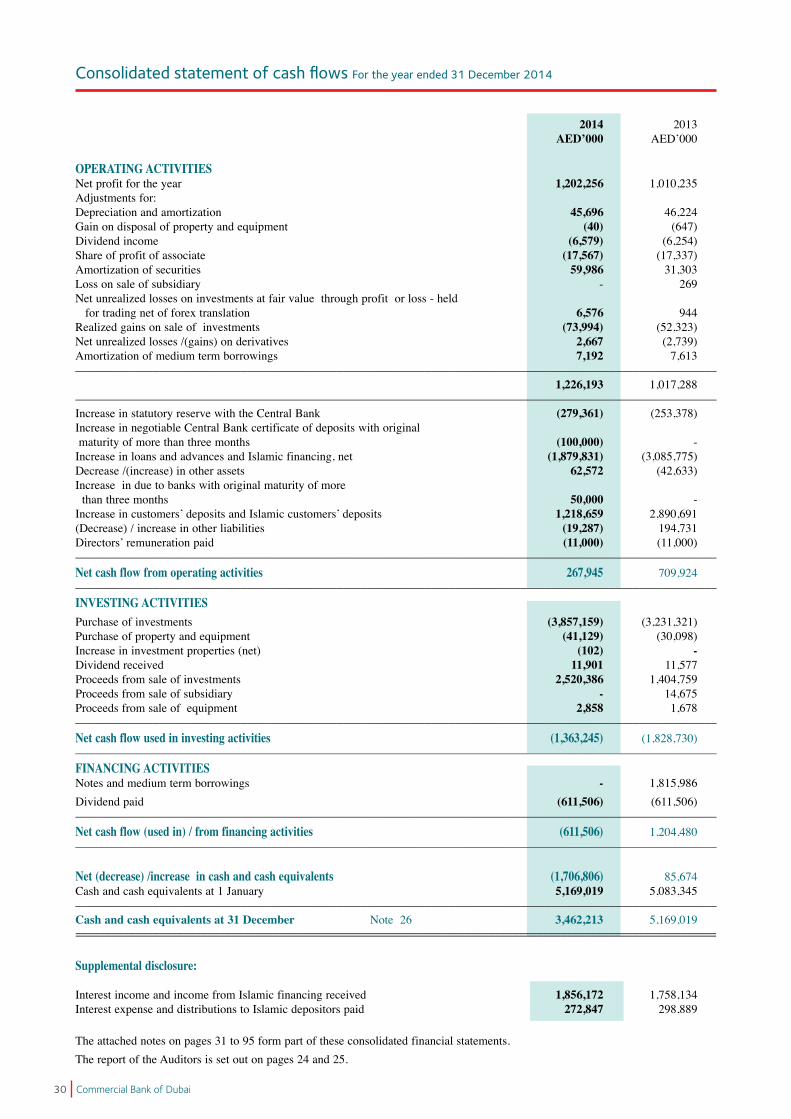
Consolidated statement of cash flows For the year ended 31 December 2014
2014 2013 AED’000 AED’000 OPERATING ACTIVITIES Net profit for the year 1,202,256 1,010,235 Adjustments for: Depreciation and amortization 45,696 46,224 Gain on disposal of property and equipment (40) (647) Dividend income (6,579) (6,254) Share of profit of associate (17,567) (17,337) Amortization of securities 59,986 31,303 Loss on sale of subsidiary - 269 Net unrealized losses on investments at fair value through profit or loss - held for trading net of forex translation 6,576 944 Realized gains on sale of investments (73,994) (52,323) Net unrealized losses /(gains) on derivatives 2,667 (2,739) Amortization of medium term borrowings 7,192 7,613 –––––––––––––––––––––––––––––––––––––––––––––––––––––––––––––––––––––––––––––––––––––––––––––––––––––––––––– 1,226,193 1,017,288––––––––––––––––––––––––––––––––––––––––––––––––––––––––––––––––––––––––––––––––––––––––––––––––––––––––––––Increase in statutory reserve with the Central Bank (279,361) (253,378) Increase in negotiable Central Bank certificate of deposits with original maturity of more than three months (100,000) - Increase in loans and advances and Islamic financing, net (1,879,831) (3,085,775) Decrease /(increase) in other assets 62,572 (42,633) Increase in due to banks with original maturity of more than three months 50,000 - Increaseincustomers’depositsandIslamiccustomers’deposits 1,218,659 2,890,691 (Decrease) / increase in other liabilities (19,287) 194,731 Directors’remunerationpaid (11,000) (11,000) ––––––––––––––––––––––––––––––––––––––––––––––––––––––––––––––––––––––––––––––––––––––––––––––––––––––––––––Net cash flow from operating activities 267,945 709,924 ––––––––––––––––––––––––––––––––––––––––––––––––––––––––––––––––––––––––––––––––––––––––––––––––––––––––––––INVESTING ACTIVITIES Purchase of investments (3,857,159) (3,231,321) Purchase of property and equipment (41,129) (30,098) Increase in investment properties (net) (102) -Dividend received 11,901 11,577 Proceeds from sale of investments 2,520,386 1,404,759 Proceeds from sale of subsidiary - 14,675 Proceeds from sale of equipment 2,858 1,678 ––––––––––––––––––––––––––––––––––––––––––––––––––––––––––––––––––––––––––––––––––––––––––––––––––––––––––––Net cash flow used in investing activities (1,363,245) (1,828,730) ––––––––––––––––––––––––––––––––––––––––––––––––––––––––––––––––––––––––––––––––––––––––––––––––––––––––––––FINANCING ACTIVITIES Notes and medium term borrowings - 1,815,986 Dividend paid (611,506) (611,506) ––––––––––––––––––––––––––––––––––––––––––––––––––––––––––––––––––––––––––––––––––––––––––––––––––––––––––––Net cash flow (used in) / from financing activities (611,506) 1,204,480 –––––––––––––––––––––––––––––––––––––––––––––––––––––––––––––––––––––––––––––––––––––––––––––––––––––––––––– Net (decrease) /increase in cash and cash equivalents (1,706,806) 85,674 Cash and cash equivalents at 1 January 5,169,019 5,083,345 ––––––––––––––––––––––––––––––––––––––––––––––––––––––––––––––––––––––––––––––––––––––––––––––––––––––––––––Cash and cash equivalents at 31 December Note 26 3,462,213 5,169,019 ===========================================================================================================
Supplemental disclosure:
Interest income and income from Islamic financing received 1,856,172 1,758,134 Interest expense and distributions to Islamic depositors paid 272,847 298,889
The attached notes on pages 31 to 95 form part of these consolidated financial statements. The report of the Auditors is set out on pages 24 and 25.
31Annual Report 2014
Notes to the consolidated financial statements For the year ended 31 December 2014
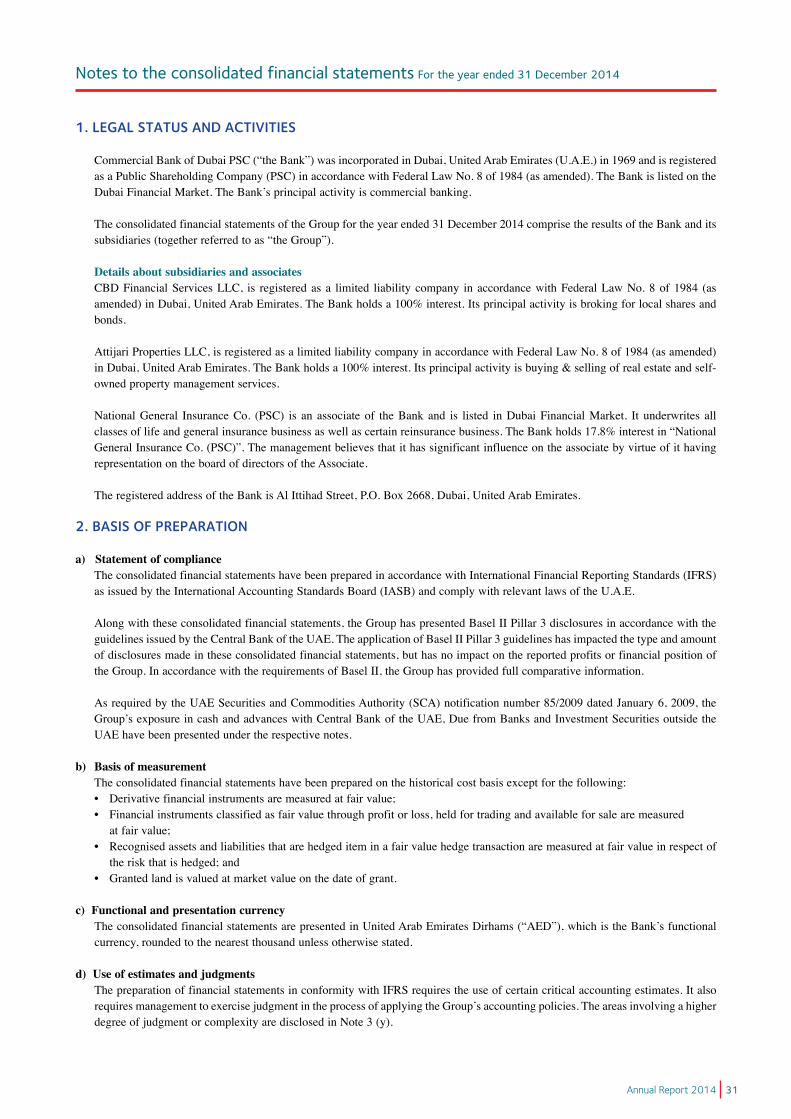
1. LEGAL STATUS AND ACTIVITIES
Commercial Bank of Dubai PSC (“the Bank”) was incorporated in Dubai, United Arab Emirates (U.A.E.) in 1969 and is registered as a Public Shareholding Company (PSC) in accordance with Federal Law No. 8 of 1984 (as amended). The Bank is listed on the DubaiFinancialMarket.TheBank’sprincipalactivityiscommercialbanking.
The consolidated financial statements of the Group for the year ended 31 December 2014 comprise the results of the Bank and its subsidiaries (together referred to as “the Group”).
Details about subsidiaries and associates CBD Financial Services LLC, is registered as a limited liability company in accordance with Federal Law No. 8 of 1984 (as
amended) in Dubai, United Arab Emirates. The Bank holds a 100% interest. Its principal activity is broking for local shares and bonds.
Attijari Properties LLC, is registered as a limited liability company in accordance with Federal Law No. 8 of 1984 (as amended) in Dubai, United Arab Emirates. The Bank holds a 100% interest. Its principal activity is buying & selling of real estate and self-owned property management services.
National General Insurance Co. (PSC) is an associate of the Bank and is listed in Dubai Financial Market. It underwrites all
classes of life and general insurance business as well as certain reinsurance business. The Bank holds 17.8% interest in “National General Insurance Co. (PSC)”. The management believes that it has significant influence on the associate by virtue of it having representation on the board of directors of the Associate.
The registered address of the Bank is Al Ittihad Street, P.O. Box 2668, Dubai, United Arab Emirates.
2. BASIS OF PREPARATION
a) Statement of compliance The consolidated financial statements have been prepared in accordance with International Financial Reporting Standards (IFRS)
as issued by the International Accounting Standards Board (IASB) and comply with relevant laws of the U.A.E. Along with these consolidated financial statements, the Group has presented Basel II Pillar 3 disclosures in accordance with the
guidelines issued by the Central Bank of the UAE. The application of Basel II Pillar 3 guidelines has impacted the type and amount of disclosures made in these consolidated financial statements, but has no impact on the reported profits or financial position of the Group. In accordance with the requirements of Basel II, the Group has provided full comparative information.
As required by the UAE Securities and Commodities Authority (SCA) notification number 85/2009 dated January 6, 2009, the
Group’sexposureincashandadvanceswithCentralBankoftheUAE,DuefromBanksandInvestmentSecuritiesoutsidetheUAE have been presented under the respective notes.
b) Basis of measurement The consolidated financial statements have been prepared on the historical cost basis except for the following:
• Derivativefinancialinstrumentsaremeasuredatfairvalue;• Financialinstrumentsclassifiedasfairvaluethroughprofitorloss,heldfortradingandavailableforsalearemeasured atfairvalue;• Recognisedassetsandliabilitiesthatarehedgediteminafairvaluehedgetransactionaremeasuredatfairvalueinrespectof
theriskthatishedged;and• Grantedlandisvaluedatmarketvalueonthedateofgrant.
c) Functional and presentation currency TheconsolidatedfinancialstatementsarepresentedinUnitedArabEmiratesDirhams(“AED”),whichistheBank’sfunctional
currency, rounded to the nearest thousand unless otherwise stated.
d) Use of estimates and judgments The preparation of financial statements in conformity with IFRS requires the use of certain critical accounting estimates. It also
requiresmanagementtoexercisejudgmentintheprocessofapplyingtheGroup’saccountingpolicies.Theareasinvolvingahigherdegree of judgment or complexity are disclosed in Note 3 (y).
Notes to the consolidated financial statements (continued) For the year ended 31 December 2014
32 Commercial Bank of Dubai
2. BASIS OF PREPARATION (continued)
e) Basis of consolidation The consolidated financial statements comprise the financial statements of the Bank and its subsidiaries, which it controls, as at
31 December 2014. Control is achieved when the Group is exposed, or has rights, to variable returns from its involvement with the investee and has the ability to affect those returns through its power over the investee.
Specifically, the Group controls an investee if and only if the Group has:• Powerovertheinvestee(i.e.existingrightsthatgiveitthecurrentabilitytodirecttherelevantactivitiesoftheinvestee);•Exposure,orrights,tovariablereturnsfromitsinvolvementwiththeinvestee;and•Theabilitytouseitspowerovertheinvesteetoaffectitsreturns.
When the Group has less than a majority of the voting or similar rights of an investee, the Group considers all relevant facts and circumstances in assessing whether it has power over an investee, including:
• Thecontractualarrangementwiththeothervoteholdersoftheinvestee;• Rightsarisingfromothercontractualarrangements;and• TheGroup’svotingrightsandpotentialvotingrights.
The Group re-assesses whether or not it controls an investee if facts and circumstances indicate that there are changes to one or more of the three elements of control. Consolidation of a subsidiary begins when the Group obtains control over the subsidiary and ceases when the Group loses control of the subsidiary. Assets, liabilities, income and expenses of a subsidiary acquired or disposed of during the year are included in the consolidated financial statements of the Group from the date the Group gains control until the date the Group ceases to control the subsidiary.
Profit or loss and each component of other comprehensive income (OCI) is attributed to the equity holders of the parent of the Group and non-controlling interest. When necessary, adjustments are made to the financial statements of subsidiaries to bring their accountingpoliciesintolinewiththeGroup’saccountingpolicies.Allintra-groupassetsandliabilities,equity,income,expensesand cash flows relating to transactions between members of the Group are eliminated in full on consolidation.
A change in the ownership interest of a subsidiary, without a loss of control, is accounted for as an equity transaction. If the Group loses control over a subsidiary, it:• Derecognisestheassets(includinggoodwill)andliabilitiesofthesubsidiary• Derecognisesthecumulativetranslationdifferencesrecordedinequity• Derecognisesthecarryingamountofanynon-controllinginterest• Recognisesthefairvalueoftheconsiderationreceived• Recognisesthefairvalueofanyinvestmentretained• Recognisesanysurplusordeficitinconsolidatedincomestatement.• Reclassifiestheparent’sshareofcomponentspreviouslyrecognisedinOCItoprofitorlossorretainedearnings,asappropriate,
as would be required if the Group had directly disposed of the related assets or liabilities.
(i) Subsidiary The subsidiary is an entity that is controlled by the Bank. Control exists when the Bank has power, directly or indirectly, to govern
the financial and operating policies of an entity so as to obtain benefits from its activities. The financial statements of the subsidiary are included in the consolidated financial statements from the date control commences until the date that control ceases.
(ii) Associate An associate is an entity over which the Group has significant influence. Significant influence is the power to participate in the
financial and operating policy decisions of the investee, but is not control or joint control over those policies. TheGroup’sinvestmentsinitsassociateareaccountedforusingtheequitymethod.
Under the equity method, the investment in an associate is initially recognised at cost. The carrying amount of the investment is adjustedtorecognizechangesintheGroup’sshareofnetassetsoftheassociatesincetheacquisitiondate.Goodwillrelatingtothe associate is included in the carrying amount of the investment and is neither amortized nor individually tested for impairment.
ThestatementofprofitorlossreflectstheGroup’sshareoftheresultsofoperationsoftheassociate.AnychangeinOCIofthose
investeesispresentedaspartoftheGroup’sOCI.Inaddition,whentherehasbeenachangerecogniseddirectlyintheequityof

Notes to the consolidated financial statements (continued) For the year ended 31 December 2014
33Annual Report 2014
2. BASIS OF PREPARATION (continued)
e) Basis of consolidation (continued)
(ii) Associate (continued) the associate, the Group recognises its share of any changes, when applicable, in the statement of changes in equity. The aggregate
oftheGroup’sshareofprofitorlossofanassociateisshownonthefaceoftheconsolidatedincomestatement.
The financial statements of the associate are prepared for the same reporting period as the Group. When necessary, adjustments are made to bring the accounting policies in line with those of the Group.
After application of the equity method, the Group determines whether it is necessary to recognise an impairment loss on its investment in its associate. At each reporting date, the Group determines whether there is objective evidence that the investment in the associate is impaired. If there is such evidence, the Group calculates the amount of impairment as the difference between
therecoverableamountoftheassociateanditscarryingvalue,thenrecognizesthelossas‘Shareofprofitorlossofanassociate’. Upon loss of significant influence over the associate, the Group measures and recognises any retained investment at its fair value.
Any difference between the carrying amount of the associate upon loss of significant influence and the fair value of the retained investment and proceeds from disposal is recognised in the consolidated income statement.
(iii) Transactions eliminated on consolidation Intra-group balances and income and expenses (except for foreign currency transactions gains or losses) arising from intra-group
transactions are eliminated in preparing the consolidated financial statements. Unrealized losses are eliminated in the same way as unrealized gains, but only to the extent that there is no evidence of impairment.
3. SIGNIFICANT ACCOUNTING POLICIES The accounting policies set out below have been applied consistently to all the years presented in these consolidated financial
statements.
a) Financial instruments A financial instrument is any contract that gives rise to both a financial asset for the Group and a financial liability or equity
instrument for another party or vice versa. The Group classifies its financial assets at initial recognition in the following categories:
(i) ClassificationFinancial assets at fair value through profit or loss (FVPL): This category has the following two sub-categories: Financial assets held for trading Financial assets held for trading are those that are acquired principally for the purpose of sale in the near term. They are
recorded at fair value. Fair value changes are recognized in consolidated income statement. Designated to be fair valued through profit or loss at inception The Group designates financial assets at fair value through profit or loss in the following circumstances:
• Theassetsaremanaged,evaluatedandreportedinternallyonafairvaluebasis.• Thedesignationeliminatesorsignificantlyreducesanaccountingmismatchwhichwouldotherwisearise.• Theasset contains anembeddedderivative that significantlymodifies the cash flows thatwouldotherwisebe required
under the contract.
Loans and advances: Loans and advances are non-derivative financial assets with fixed and determinable payments that are not quoted in an active market. These arise when the Group provides money directly to the borrower with no intention of trading the receivable.
Held-to-maturity (HTM): Investments classified as held-to-maturity are non-derivative financial assets with fixed or determinable payments and fixed maturities that the Group’s management has the intention of and the ability to hold tomaturity. HTM assets are carried at amortized cost less impairment loss if any.
Sale of HTM assets is allowed only under the following circumstances:• Theinvestmentiscloseenoughtomaturityastohavenoimpactonfairvalue;• Theprincipalissubstantiallyreceived;• IsolatedeventsbeyondtheGroup’scontrol;• Significantcreditdeteriorationoftheissuer;• Majorbusinesscombinationordisposal;or• Increaseinregulatorycapitalrequirements.
Notes to the consolidated financial statements (continued) For the year ended 31 December 2014
34 Commercial Bank of Dubai
3. SIGNIFICANT ACCOUNTING POLICIES (continued)
a) Financial instruments (continued)
(i) Classification (continued)Available-for-sale (AFS): Available-for-sale investments are those non-derivative financial assets that are designated as available-
for-sale or not classified as (i) financial assets at fair value through profit or loss, (ii) loans and advances or (iii) held-to-maturity investments. AFS assets are carried at fair value, with fair value changes recognized in other comprehensive income (OCI). These assets may be sold in response to needs for liquidity or changes in interest rates, exchange rates or equity prices.
(ii) Initial recognition Purchases and sales of investment securities are recognized on the trade date which is the date on which the Group commits
to purchase or sell the securities. Loans and advances are recognized when cash is advanced to the borrowers. Financial assets are initially recognized at fair value plus transaction costs, which approximates to its cost, for all financial assets not carried at fair value through profit or loss. Financial assets at fair value through profit or loss are initially recognized at fair value, which approximates to its cost.
(iii) Derecognition Financial assets are derecognized when the rights to receive cash flows from the financial assets have expired or where the Group
has transferred substantially all the risks and rewards of ownership. A financial liability is derecognized when its contractual obligation is discharged, cancelled or expired.
(iv) Subsequent measurement Financial assets available-for-sale and investments at fair value through profit or loss are subsequently carried at fair value. Loans
and advances and held-to-maturity investments are carried at amortized cost using the effective interest method, less impairment allowances.
(v) Embedded derivatives Certain derivatives embedded in other financial instruments are treated as separate derivatives when their economic characteristics
and risks are not closely related to those of the host contract and the host contract is not carried at fair value through profit or loss. These embedded derivatives are measured at fair value with changes in fair value recognised in the consolidated income statement.
(vi) Gains and losses on subsequent measurement Gains and losses arising from changes in the fair value of the investments at fair value through profit or loss category are included
in the consolidated income statement in the period in which they arise.
Gains and losses arising from changes in the fair value of available-for-sale investments are recognized directly in other comprehensive income (OCI), until the financial asset is derecognized or impaired, at which time the cumulative gain or loss previously recognized in OCI is recognized in the consolidated income statement.
In cases where available-for-sale investments with a fixed maturity are reclassified as held-to-maturity investments, the fair value gains or losses until the date of the reclassification are held in OCI and amortized over the remaining life of the held-to-maturity investments using the effective interest rate method.
(vii) Fair value measurement principles The Group measures financial instruments, such as derivatives and investments in equity and certain fixed income instruments, at
fair value at each reporting date.
Fair value is the price that would be received to sell an asset or paid to transfer a liability in an orderly transaction between market participants at the measurement date. The fair value measurement is based on the presumption that the transaction to sell the asset or transfer the liability takes place either:
In the principal market for the asset or liability, or In the absence of a principal market, in the most advantageous market for the asset or liability
The principal or the most advantageous market must be accessible to by the Group.
The fair value of an asset or a liability is measured using the assumptions that market participants would use when pricing the asset or liability, assuming that market participants act in their economic best interest.

Notes to the consolidated financial statements (continued) For the year ended 31 December 2014
35Annual Report 2014
3. SIGNIFICANT ACCOUNTING POLICIES (continued)
a) Financial instruments (continued)
(vii) Fair value measurement principles (continued) Afairvaluemeasurementofanon-financialassettakesintoaccountamarketparticipant’sabilitytogenerateeconomicbenefits
by using the asset in its highest and best use or by selling it to another market participant that would use the asset in its highest and best use.
The Group uses valuation techniques that are appropriate in the circumstances and for which sufficient data are available to measure fair value, maximising the use of relevant observable inputs and minimising the use of unobservable inputs.
(viii) Fair value hierarchy All assets and liabilities for which fair value is measured or disclosed in the financial statements are categorized within the fair
value hierarchy, described as follows, based on the lowest level input that is significant to the fair value measurement as a whole: Level 1: Quoted market price (unadjusted) in an active market for an identical instrument. A financial instrument is regarded as
quoted in an active market if quoted prices are readily and regularly available from an exchange, dealer, broker, industry, group, pricingserviceor regulatoryagency,and thosepricesrepresentactualandregularlyrecurringmarket transactionsonanarm’slength basis.
Level 2: Valuation techniques based on observable inputs, either directly (i.e. as prices) or indirectly (i.e. derived from prices).
Thiscategoryincludesinstrumentsvaluedusing:quotedmarketpricesinactivemarketsforsimilar instruments;quotedpricesforidenticalorsimilarinstruments;orothervaluationtechniqueswhereallsignificantinputsaredirectlyorindirectlyobservablefrom market data.
Level 3: Valuation techniques using significant unobservable inputs. This category includes all instruments where the valuation techniqueincludesinputsbasedonunobservabledataandtheunobservableinputshaveasignificanteffectontheinstrument’svaluation. This category includes instruments that are valued based on quoted prices for similar instruments where significant unobservable adjustments or assumptions are required to reflect differences between the instruments.
The hierarchy used by the Group is set out in note 4.2, 9 and 10.
For assets and liabilities that are recognized in the financial statements on a recurring basis, the Group determines whether transfers have occurred between Levels in the hierarchy by re-assessing categorization (based on the lowest level input that is significant to the fair value measurement as a whole) at the end of each reporting period.
The Group determines the policies and procedures for both recurring fair value measurement, such as investment properties and unquoted AFS financial assets, and for non-recurring measurement, such as assets held for sale in discontinued operation.
At each reporting date, the Group analyses the movements in the values of assets and liabilities which are required to be
re-measuredorre-assessedaspertheGroup’saccountingpolicies.Forthisanalysis,theGroupverifiesthemajorinputsappliedin the latest valuation by agreeing the information in the valuation computation to contracts and other relevant documents.
For the purpose of fair value disclosures, the Group has determined classes of assets and liabilities on the basis of the nature, characteristics and risks of the asset or liability and the level of the fair value hierarchy as explained above.

Notes to the consolidated financial statements (continued) For the year ended 31 December 2014
36 Commercial Bank of Dubai
3. SIGNIFICANT ACCOUNTING POLICIES (continued)
a) Financial instruments (continued)
(ix) Amortized cost measurement The amortized cost of a financial asset or liability is the amount at which the financial asset or liability is measured at initial
recognition, minus principal repayments, plus or minus the cumulative amortization using the effective interest method of any difference between the initial amount recognized and the maturity amount, minus any reduction for impairment. The effective interest rate is the rate that exactly discounts estimated future cash receipts or payments through the expected life of the financial asset or financial liability to the net carrying amount of the financial asset or financial liability.
(x) Identification and measurement of impairment At each reporting date the Group assesses whether there is objective evidence that financial assets not carried at fair value through
profit or loss are impaired. A financial asset or a group of financial assets are impaired when objective evidence demonstrates that a loss event has occurred after the initial recognition of the assets, and that the loss event has an impact on the future cash flows of the assets that can be estimated reliably.
Objective evidence that financial assets (including equity securities) are impaired can include significant financial difficulty of the borrower or issuer, default or delinquency by a borrower, restructuring of a loan or advance by the Group on terms that the Group would not otherwise consider, indications that a borrower or issuer will enter bankruptcy, the disappearance of an active market for a security, or other observable data relating to a group of assets such as adverse changes in the payment status of borrowers or issuers in the group, or economic conditions that correlate with defaults in the group. In addition, for an investment in an equity security, a significant or prolonged decline in its fair value below its cost is objective evidence of impairment.
The Group considers evidence of impairment for loans and advances and held-to-maturity investment securities at both a specific asset and collective level.
Individually assessed loans At each reporting date, the Group assesses on a case-by-case basis whether there is any objective evidence that a loan is impaired.
Impairment losses on assets carried at amortized cost are measured as the difference between the carrying amount of the financial assetandthepresentvalueofestimatedfuturecashflowsdiscountedattheasset’soriginaleffectiveinterestrate.Thisprocedureis applied to all accounts that are considered individually significant.
In determining impairment losses on these loans, the following factors are considered:• theGroup’saggregateexposuretothecustomer;• theviabilityofthecustomer’sbusinessmodelandcapabilitytotradesuccessfullyoutoffinancialdifficultiesandgenerate
sufficientcashflowtoserviceitsdebtobligations;• theamountandtimingofexpectedreceiptsandrecoveries;• thelikelydividendavailableonliquidationorbankruptcy;• theextentofothercreditors’commitments rankingaheadof,orparipassuwith, theGroupand the likelihoodofother
creditorscontinuingtosupportthecompany;• thecomplexityofdeterminingtheaggregateamountandrankingofallcreditorclaimsandtheextenttowhichlegaland
insuranceuncertaintiesareevident;• therealizablevalueofsecurity(orothercreditmitigants)andlikelihoodofsuccessfulrepossession;• thelikelydeductionofanycostsinvolvedinrecoveryofamountsoutstanding;and• theabilityoftheborrowertoobtain,andmakepaymentsin,thecurrencyoftheloanifnotlocalcurrency.
Impairment losses are recognized in consolidated income statement and reflected in an allowance account against loans and advances. When a subsequent event causes the amount of impairment loss to decrease, the decrease in impairment loss is reversed through profit or loss.

Notes to the consolidated financial statements (continued) For the year ended 31 December 2014
37Annual Report 2014
3. SIGNIFICANT ACCOUNTING POLICIES (continued)
a) Financial instruments (continued)
(x) Identification and measurement of impairment (continued)
Collectively assessed loans Impairment is determined on a collective basis in two different scenarios:
• forloanssubjecttoindividualassessmenttocoverlosseswhichhavebeenincurredbuthavenotyetbeenidentified;and• forhomogeneousgroupsofloansthatarenotconsideredindividuallysignificant.
Incurred but not yet identified impairment Individually assessed loans for which no evidence of loss has been identified (performing loans) are grouped together according
to their credit risk characteristics for the purpose of calculating an estimated collective loss.
This arises from individual loan impairment at the reporting date which will only be specifically identified in the future. The collective impairment loss is determined after taking into account:
• historical loss experience in portfolios of similar risk characteristics (for example, by industry sector, loan grade orproduct);
• theestimatedperiodbetweenimpairmentoccurringandthelossbeingidentifiedandevidencedbytheestablishmentofanappropriatespecificallowanceagainsttheindividualloan;and
• management’s judgmentas towhethercurrenteconomicandcreditconditionsaresuch that theactual levelof inherentlosses is likely to be greater or less than that suggested by historical experience.
The period between a loss occurring and its identification is estimated by the management for each portfolio grouping. Homogeneous groups of loans For homogeneous groups of loans that are not considered individually significant, the Group uses historical trends of the
probabilityofdefault,timingofrecoveriesandtheamountoflossincurred,adjustedformanagement’sjudgmentastowhethercurrent economic and credit conditions are such that the actual losses are likely to be greater or less. Default rates, loss rates and the expected timing of future recoveries are regularly benchmarked against actual outcomes to ensure that they remain appropriate.
Impairment on investments classified as available-for-sale The Group determines that available-for-sale equity investments are impaired when there has been a significant or prolonged
decline in the fair value below its cost. Impairment losses on available-for-sale investment securities are recognized by transferring the cumulative loss that has been recognized in other comprehensive income (OCI) to income statement as a recycle adjustment. The cumulative loss that is recycled from other comprehensive income to consolidated income statement is the difference between the acquisition cost, net of any principal repayment and amortization, and the current fair value, less any impairment loss previously recognized in consolidated income statement. Changes in impairment provisions attributable to time value are reflected as a component of interest income.
If, in a subsequent period, the fair value of an impaired available-for-sale debt security increases and the increase can be objectively related to an event occurring after the impairment loss was recognised in consolidated income statement, the impairment loss is reversed through consolidated income statement to the extent of amount earlier recognised as impairment loss. However, any subsequent recovery in the fair value of an impaired available-for-sale equity security is not reversed through the consolidated income statement and is recognised directly in other comprehensive income.
Impairment on investments classified as associates Management reviews its share of investments in associates to assess impairment on a regular basis. In determining the assessment,
management compares the recoverable amount with the carrying value of the investment. Estimating recoverable amount using value in use requires the Group to make an estimate of the expected future cash flows from the associates and choosing a suitable discount rate in order to calculate the present value of those cash flows.
Notes to the consolidated financial statements (continued) For the year ended 31 December 2014
38 Commercial Bank of Dubai
3. SIGNIFICANT ACCOUNTING POLICIES (continued)
b) Derivative financial instruments
(i) Classification The Group enters into derivative financial instruments including forwards, futures, swaps and options in the foreign exchange
and capital markets. Derivative financial instruments, that do not qualify for hedge accounting are classified as “FVPL – financial assets held for trading” financial instruments.
(ii) Initial and subsequent measurement In the normal course of business, the fair value of a derivative on initial recognition is the transaction price. Subsequent to initial
recognition, derivative financial instruments are stated at fair values. Fair values are generally obtained by reference to quoted market prices in active markets, or by using valuation techniques when an active market does not exist.
The positive mark to market values (unrealized gains) of derivative financial instruments is included in other assets. While, the negative mark to market values (unrealized losses) of derivative financial instruments is included in other liabilities.
(iii) Gains and losses on subsequent measurement The gains or losses from derivative financial instruments classified as held for trading are taken to the consolidated income
statement.
c) Hedging instruments When derivatives are designated as hedges, the Group classifies them as either:
• fairvaluehedgeswhichhedgethechangeinthefairvalueofrecognizedassetsorliabilities;or• cashflowhedgeswhichhedgetheexposuretovariabilityinhighlyprobablefuturecashflowsattributabletoarecognized
asset or liability or a forecast transaction.
Hedge accounting is applied to derivatives designated as hedging instruments in fair value or cash flow hedge provided certain criteria are met.
Hedge accounting
(i) Hedge documentation At the inception of the hedge, formal documentation of the hedge relationship must be established. The hedge documentation
prepared at the inception of the hedge must include a description of the following:
• TheGroup’sriskmanagementobjectiveandstrategyforundertakingthehedge;• Thenatureofriskbeinghedged;• Clearidentificationofthehedgeditemandthehedginginstrument;and• HowtheGroupwillassesstheeffectivenessofthehedgingrelationshiponanongoingbasis.
(ii) Hedge effectiveness testing The hedge is regarded as highly effective if both of the following conditions are met:
• Attheinceptionof thehedgeandinsubsequentperiods, thehedgeisexpectedtobehighlyeffectiveinoffsettingthe•changes in fair value or cash flows of the hedging instruments with corresponding changes in the hedged risk and should bereliablymeasurable;and
• Theactualresultsofthehedgeeffectivenesstestingarewithinarangeof80to125percent.
In case of a cash flow hedge, prospective hedge effectiveness is assessed by matching the critical terms of hedging instruments and hedged items.
Notes to the consolidated financial statements (continued) For the year ended 31 December 2014
39Annual Report 2014
3. SIGNIFICANT ACCOUNTING POLICIES (continued)
c) Hedging instruments (continued)
(iii) Fair value hedge The changes in the fair value of derivatives that are designated and qualify as fair value hedge instruments is recognized in the
consolidated income statement.
(iv) Cash flow hedges The effective portion of changes in the fair value of derivatives that are designated and qualify as cash flow hedges is recognized
in OCI. Any gain or loss in fair value relating to an ineffective portion is recognized immediately in the consolidated income statement.
(v) Discontinuance of hedge accounting The hedge accounting is discontinued when a hedging instrument expires or is sold, or when a hedge no longer meets the criteria
for hedge accounting. At that point of time, any cumulative gain or loss on the hedging instrument that has been recognized in OCI remains in other comprehensive income until the forecast transaction occurs. When a forecast transaction is no longer expected to occur, the cumulative gain or loss that was reported in other comprehensive income is immediately transferred to the consolidated income statement.
(vi) Hedges that do not qualify for hedge accounting For hedges that do not qualify for hedge accounting, any gains or losses arising from changes in the fair value of the hedging
instrument are taken directly to the consolidated income statement for the period.
d) Due from banks Amounts due from banks are initially recognized at fair value and subsequently measured at amortized cost less provision for
impairment, if any.
e) Loans and advances and Islamic financing Loans and advances are initially measured at fair value plus incremental direct transaction costs, and subsequently measured at
their amortized cost using the effective interest method, except when the Group chooses to carry the loans and advances at fair value through profit or loss.
In addition to conventional banking products, the Group offers its customers certain Islamic financing products, which are approvedbySharia’aSupervisoryBoard.IslamicFinancingconsistsofthefollowing:
Murabaha An agreement whereby the Group sells to a customer, commodity or asset (subject asset), which the Group has purchased and
acquired, based on a promise received from the customer to buy the item purchased according to specific terms and conditions. The selling price comprises the cost of the subject asset and an agreed profit margin. Income is recognized on an accrual basis adjusted by actual income when received.
Ijarah Ijarah refers to lease of the asset, which the Group (Lessor) constructs or purchases as per customer (Lessee) request based on the
promise to lease the asset for a fixed term against certain rent installment. Ijara can end by transferring the ownership of the asset to the lessee in case of Ijara Muntahia Bittamleek.
Musharaka An agreement whereby the Group and a customer contribute to a certain enterprise according to a diminishing arrangement ending
up with the acquisition by the customer of the full ownership. The profit is shared as per the agreement set between both parties while the loss is shared in proportion to their shares of capital in the enterprise.
Islamic financing products are initially recognized at fair value and subsequently measured at amortized cost, using the effective profit method, less any amounts written off, allowance for doubtful accounts and unearned income.
The effective profit rate is the rate that exactly discounts estimated future cash flow through the expected life of the financial asset or liability.

Notes to the consolidated financial statements (continued) For the year ended 31 December 2014
40 Commercial Bank of Dubai
3. SIGNIFICANT ACCOUNTING POLICIES (continued)
f) Investment properties The Group holds certain properties for its own use as well as to lease out. The leased out or intended to lease out components
have been classified as investment properties. Investment properties are measured initially at cost, including transaction costs. The carrying amount includes the cost of replacing part of an existing investment property at the time that cost is incurred, if the recognition criteria are met and excludes the costs of day-to-day servicing of an investment property. Subsequent to initial recognition, investment properties are stated at cost less any accumulated depreciation and accumulated impairment losses.
Depreciation is charged using straight line method over the useful life of the asset. Estimated useful life of buildings is 20 to 30
years.
Investment properties are derecognised when either they have been disposed of or when the investment property is permanently withdrawn from use and no future economic benefit is expected from its disposal. Any gains or losses on the retirement or disposal ofaninvestmentpropertyarerecognisedintheconsolidatedincomestatementunder‘otherincome’intheyearofretirementordisposal.
Transfers are made to investment properties when, and only when there is change in use evidenced by ending of owner-occupation, commencement of an operating lease of another party or ending of construction or development.
Transfers are made from investment properties when, and only when, there is a change in use evidenced by commencement of owner-occupation.
g) Property and equipment Property and equipment are stated at cost less accumulated depreciation and impairment losses except for granted land, which is
stated at the market value at the date of grant.
Cost includes expenditures that are directly attributable to the acquisition of the asset. The cost of replacing an item of property and equipment is recognised in the carrying value of the item if it is probable that the future economic benefits embodied within the part will flow to the Group and its cost can be measured reliably. The day-to-day servicing expenses of property and equipment are recognised in the consolidated income statement as incurred.
The gain or loss on disposal of an item of property and equipment is determined by comparing the proceeds from disposal with the carrying amount of the item of property and equipment. These are included in the consolidated income statement.
Property and equipment is impaired if the carrying amount of the asset or its cash generating unit exceed its recoverable amount. The impairment loss is recognized in the consolidated income statement.
The cost of all property and equipment other than freehold land and capital work in progress is depreciated using the straight-line
method over the following estimated useful lives:
Depreciation methods, useful lives and residual values are reassessed at each reporting date and prospectively adjusted if appropriate.
Capital work in progress is initially recorded at cost, and upon completion is transferred to the appropriate category of property andequipmentandthereafterdepreciatedinaccordancewiththeGroup’spolicies.
Buildings 20 to 30 yearsLeasehold improvements 5 yearsFurniture, equipment and vehicles 3 to 5 years

Notes to the consolidated financial statements (continued) For the year ended 31 December 2014
41Annual Report 2014
3. SIGNIFICANT ACCOUNTING POLICIES (continued)
h) Due to banks, Notes and medium term borrowing Amounts due to banks, notes and medium term borrowing are initially measured at fair value plus transaction costs, and are
subsequently measured at amortised cost using the effective interest method.
i) Repurchase agreement When the Group sells a financial asset and simultaneously enters into an agreement to repurchase the asset at a fixed price on a
future date the agreement is accounted for as a term borrowing depending on period of the agreement, and the underlying asset continuestoberecognizedintheGroup’sfinancialstatement.
j) Customers’depositsandIslamicCustomers’deposits Customers’depositsareinitiallyrecognisedatfairvalue,beingthefairvalueoftheconsiderationreceived.Afterinitialrecognition,
all deposits are subsequently measured at amortised cost using the effective interest method. Amortised cost is calculated by taking into account any transaction costs that are directly attributable to the acquisition or receipt of customer deposit.
The Islamic customer deposits are received by entering into following kinds of agreements: Mudaraba An agreement between the Group and a third party whereby one party would provide a certain amount of funds which the other
party (Mudarib) would then invest in a specific enterprise or activity against a specific share in the profit. The Mudarib would bear the loss in case of default, negligence or violation of any of the terms and conditions of the Mudaraba.
Wakala An agreement between Group and third party whereby one party (Muwakil) provides certain amount of funds which the other
party (Wakil) would invest according to the terms and conditions of Wakala in return for a certain fee. The Wakil is obliged to return the invested amount in case of default, negligence or violation of any of the terms and conditions of the Wakala.
Islamic customers’ deposits are initially measured at fair value plus transaction costs, and subsequently measured at their
amortized cost using the effective profit method.
k) Provisions A provision is recognized if as a result of a past event, the Group has a present legal or constructive obligation that can be estimated
reliably, and it is probable that an outflow of economic benefits will be required to settle the obligation. Provisions are determined by discounting the expected future cash flows at a rate that reflects current market assessments of the time value of money and, where appropriate, the risks specific to the liability.
l) Employees’terminalbenefitsandlong-termincentivearrangements ProvisionismadeforamountspayableundertheUAEFederalLabourLawapplicabletononUAEnationals’accumulatedperiods
of service at the reporting date. The Group pays its contributions in respect of UAE nationals and GCC citizens under the UAE Pension and Social Security Law. Effective from 1 January 2007, the Group introduced a long term incentive plan (“the plan”). UnderthisplancertainkeyemployeesareeligibleforanincentiveattheofferingdatecontingentupontheGroup’sperformanceup to an award date. The award is the percentage of the actual salary of the eligible key employees. The salary includes the basic salary, allowance, national allowance and cost of living allowance as at the effective date. The obligation towards the plan is accrued in the period when the key employees are eligible for such awards in accordance with the plan.
m) Share capital The Group classifies capital instruments as financial liabilities or equity instruments in accordance with the substance of the
contractual terms of the instruments. Incremental costs directly attributable to the issue of an equity instrument are deducted from the initial measurement of the equity instruments.
n) Dividend on ordinary shares Dividends payable on ordinary shares are recognized as a liability in the period in which they are approved by the Bank’s
shareholders.

Notes to the consolidated financial statements (continued) For the year ended 31 December 2014
42 Commercial Bank of Dubai
3. SIGNIFICANT ACCOUNTING POLICIES (continued)
o) Offsetting Financial assets and liabilities are offset and the net amount is reported in the statement of financial position when, and only when,
the Group has a legally enforceable right to set off the recognized amounts and it intends either to settle on a net basis or to realize the asset and settle the liability simultaneously.
Income and expenses are presented on a net basis only when permitted under IFRSs, or of gains and losses arising from a group
ofsimilartransactionssuchasintheGroup’stradingactivity.
p) Cash and cash equivalents For the purposes of the consolidated cash flow statement, cash and cash equivalents consist of cash on hand and balances with the
Central Bank (excluding statutory reserve), and amounts due from and due to banks with original maturity less than three months. Cash and cash equivalents are carried at amortized cost in the statement of financial position.
q) Revenue recognition
(i) Interest income and expense Interest income and expense for all interest bearing financial instruments except for those classified as held for trading or
designatedatfairvaluethroughprofitorloss,arerecognizedin‘interestincome’and‘interestexpense’intheconsolidatedincomestatement on an accrual basis using the effective interest rates of the financial assets or financial liabilities to which they relate. Interest income and expense for financial instruments classified as held for trading or designated at fair value through profit or loss is recognized as trading income.
The effective interest rate is the rate that discounts estimated future cash receipts and payments earned or paid on a financial asset or a liability through its expected life or, where appropriate, a shorter period to the net carrying amount of the financial asset or financial liability. The effective interest rate is established on initial recognition of the financial asset and liability and is not revised subsequently.
When calculating effective interest rates, the Group estimates cash flows considering all contractual terms of the financial instruments, but not future credit losses. The calculation includes all amounts paid or received by the Group that are an integral part of the effective interest rate, including transaction costs and all other premiums or discounts.
(ii) Income from Islamic financing and distributions to depositors Income from Islamic financing is recognized in the consolidated income statement using the effective profit method.
The calculation of the effective profit rate includes all fees paid or received, transaction costs, and discounts or premiums that are an integral part of the effective profit rate. Transaction costs are incremental costs that are directly attributable to the acquisition, issue or disposal of a financial asset.
DistributiontoDepositors(Islamicproducts)iscalculatedaccordingtotheGroup’sstandardproceduresandisapprovedbythe
Group’sSharia’aSupervisoryBoard.
(iii) Fees and commission Fees and commission income and expenses that are integral to the effective interest rate on a financial asset or liability are included
in the measurement of effective interest rate.
Other fees and commission income earned from the provision of services are recognized as revenue, as and when the services are rendered or on a time proportion basis as applicable.
(iv) Income from investments Net income from investments at fair value through profit or loss which arises from gains and losses resulting from disposal, and
from the fair valuation of such investments, are recognized when they occur. Gains resulting from disposal of AFS investments are recognized in profit or loss when they occur. Gains resulting from valuation are recognized in OCI until disposal at which time it will be recycled to profit or loss.
(v) Property related income Property related income includes rental income, which is recognised on a straight line basis over the term of the lease.
Notes to the consolidated financial statements (continued) For the year ended 31 December 2014
43Annual Report 2014
3. SIGNIFICANT ACCOUNTING POLICIES (continued)
q) Revenue recognition (continued)
(vi) Dividend income DividendincomeisrecognizedwhentheGroup’srighttoreceivethepaymentisestablished. (vii) Share of profit from associate ShareofprofitfromassociatereflectstheGroup’sshareoftheresultsofoperationsoftheassociate.
viii) Foreign currencies Foreign currency transactions are recorded at rates of exchange ruling at the value dates of the transactions. Monetary assets and
liabilities denominated in foreign currencies at the reporting date, which are stated at historical cost, are translated at the foreign exchange rate ruling at that date.
Non-monetary assets and liabilities denominated in foreign currencies, which are stated at historical cost, are translated at the
foreign exchange rate ruling at the date of the transaction. Non-monetary assets and liabilities denominated in foreign currencies that are stated at fair value are translated to AED at the foreign exchange rates ruling at the dates that the fair values were determined.
Forward foreign exchange contracts are translated into AED at market rates of exchange ruling at the reporting date. Foreign exchange differences arising on translation are recognized in the consolidated income statement.
r) Leasing The Group has entered into leasing arrangements which based on the evaluation of the terms and condition of the leasing
arrangement has been classified as operating lease. Leases are classified as operating leases if risk and reward incidental to ownership of the leased asset lie with lessor.
Group as lessor Asset subjected to operating lease are presented in the consolidated statement of financial position according to the nature of the
asset. Income from operating leases are recognized in the consolidated income statement on straight line basis over the lease term.
Group as lessee Lease payments under operating leases are recognized as expense on a straight line basis over the lease term.
s) Fiduciary activities TheGroupprovideswealthmanagementsolutionstomanageclientassets.TheseassetsareheldintheGroup’scustodyandare
invested on behalf of the client in third party funds, and other securities like bonds and sukuk. TheseassetsandincomearisingfromtheseassetsarenotincludedintheGroup’sconsolidatedfinancialstatementsastheriskand
rewards incidental to ownership of these assets lie with the client. t) Financial guarantees In the ordinary course of business, the Group gives financial guarantees, consisting of letters of credit, guarantees and acceptances.
Financial guarantees are initially recognised in the financial statements at fair value, being the premium received. Subsequent to initial recognition, theGroup’s liabilityundereachguarantee ismeasuredat thehigherof theamount initiallyrecognised lesscumulative amortization recognised in the consolidated income statement, and the best estimate of amount required to settle any financial obligation arising as a result of the guarantee.
u) Acceptances Acceptances arise when the Bank is under an obligation to make payments against documents drawn under letters of credit.
Acceptances specify the amount of money, the date, and the person to which the payment is due. After acceptance, the instrument becomes an unconditional liability (time draft) of the Group and is therefore recognised as a financial liability (Note 16) in the consolidated statement of financial position with a corresponding contractual right of reimbursement from the customer recognised as a financial asset (Note 12).
Notes to the consolidated financial statements (continued) For the year ended 31 December 2014
44 Commercial Bank of Dubai
3. SIGNIFICANT ACCOUNTING POLICIES (continued)
v) Earnings per share The Group presents basic and diluted earnings per share (EPS) data for its ordinary shares. Basic EPS is calculated by dividing
the profit or loss attributable to ordinary shareholders of the Bank by the weighted average number of ordinary shares outstanding during the period. Diluted EPS is determined by adjusting the profit or loss attributable to ordinary shareholders and the weighted average number of ordinary shares outstanding for the effects of all dilutive potential ordinary shares.
w) Segment reporting An operating segment is a component of the Group that engages in business activities from which it may earn revenues and
incurexpenses, including revenuesandexpenses that relate to transactionswithanyof theGroup’sother components,whoseoperating results are reviewed regularly by the Business Committee of the Group to make decisions about resources allocated to the segment and assess its performance, and for which distinct financial information is available. Segment results that are reported to the Business Committee of the Group include items directly attributable to a segment as well as those that can be allocated on a reasonable basis.
x) Related Parties An entity is considered related party of the Group if:. a)Apersonoraclosememberofthatperson’sfamilyisrelatedtotheGroupifthatperson:
i. hascontrolorjointcontroloftheGroup; ii. hassignificantinfluenceovertheGroup;oriii. is a member of the key management personnel of the Group.
b) An entity is related to a Group if any of the following conditions applies: i. The entity and the Group are members of the same group (which means that each parent, subsidiary and fellow subsidiary
is related to the others). ii. One entity is an associate or joint venture of the other entity (or an associate or joint venture of a member of a group of
which the other entity is a member).iii. Both entities are joint ventures of the same third party.iv. One entity is a joint venture of a third entity and the other entity is an associate of the third entity. v. The entity is controlled or jointly controlled by a person identified in (a).vi. A person identified in (a)(i) has significant influence over the entity or is a member of the key management personnel of
the entity (or of a parent of the entity).
y) Use of estimates and judgments The preparation of the consolidated financial statements requires management to make estimates and assumptions that affect the
application of accounting policies and reported amounts of assets, liabilities, income and expenses. Such estimates are necessarily based on assumptions about several factors involving varying degrees of judgment and uncertainty and actual results may therefore differ, resulting in future changes in these estimates.
In particular, considerable management judgment is required in respect of the following issues:
Impairment losses on loans and advances and Islamic financing The Group reviews its loan portfolios to assess impairment at each reporting date. In determining whether an impairment loss
should be recorded in the consolidated income statement, the Group makes judgments as to whether there is any observable data indicating that there is a measurable decrease in the estimated future cash flows from a portfolio of loans before the decrease can be identified with an individual loan in that portfolio.
This evidence may include observable data indicating that there has been an adverse change in the payment status of borrowers in a group, or national or local economic conditions that correlate with defaults on assets in the group. Management uses estimates based on historical loss experience for assets with credit risk characteristics and objective evidence of impairment similar to those in the portfolio when scheduling its future cash flows (excluding future expected credit losses that have not yet been incurred). The methodology and assumptions used for estimating both the amount and timing of future cash flows are reviewed regularly to reduce any differences between loss estimates and actual loss experience.

Notes to the consolidated financial statements (continued) For the year ended 31 December 2014
45Annual Report 2014
3. SIGNIFICANT ACCOUNTING POLICIES (continued)
y) Use of estimates and judgments(continued) Held-to-maturity investments The Group follows the guidance of IAS 39 in classifying non-derivative financial assets with fixed or determinable payments and
fixed maturity as held-to-maturity. This classification requires significant judgment. In making this judgment, the Group evaluates its intention and ability to hold such investments to maturity. If the Group fails to keep these investments to maturity other than for the specific circumstances – for example, selling an insignificant amount close to maturity – it will be required to reclassify the entire class as available-for-sale. The investments would therefore be measured at fair value and not amortized cost. Further, the Group will not be allowed to classify any security as held to maturity for next two years.
Impairment of available-for-sale investments The Group determines that available-for-sale equity investments are impaired when there has been a significant or prolonged
decline in the fair value below its cost. This determination of what is significant or prolonged requires judgment. In making this judgment, the Group evaluates among other factors, the normal volatility in share price. In addition, impairment may be appropriate when there is evidence of deterioration in the financial health of the investee, industry and sector performance, changes in technology or operational and financing cash flows.
Impairment of investment property Investment properties are assessed for impairment based on assessment of cash flows on individual cash-generating units when
there is indication that those assets have suffered an impairment loss. Cash flows are determined with reference to recent market conditions, prices existing at the end of the reporting period, contractual agreements and estimations over the useful lives of the assets and discounted using a range of discounting rates that reflects current market assessments of the time value of money and the risks specific to the asset. The net present values are compared to the carrying amounts to assess any probable impairment.
Impairment on non-financial assets ThecarryingamountsoftheGroup’sassetsarereviewedateachreportingdatetodeterminewhetherthereisanyindicationof
impairment.Ifsuchindicationexists,theasset’srecoverableamountisestimated.Animpairmentlossisrecognizedifthecarryingamount of an asset exceeds its recoverable amount. Impairment losses are recognized in the consolidated income statement. For the purpose of assessing impairment, assets are grouped at the lowest levels for which there are separately identifiable cash flows (cash-generating units). Non-financial assets, which suffered impairment, are reviewed for possible reversal of the impairment at each reporting date.
z) Standards and interpretation Issued and effective for accounting periods beginning on 1 January 2014 Following are the amendments to IFRSs which have been applied by the Group in these financial statements. The adoption of
these amendments has no significant impact on the financial performance or position of the Group. Amendments that are relevant totheGroup’sfinancialstatementsaresetoutbelow:
Offsetting Financial Assets and Financial Liabilities - Amendments to IAS 32 Theseamendmentsclarifythemeaningof’currentlyhasalegallyenforceablerighttoset-off’andthecriteriafornon-simultaneous
settlement mechanisms of clearing houses to qualify for offsetting and is applied retrospectively. These amendments have no impact on the financial statements of the Group, since none of the entities in the Group has any offsetting arrangements.
Novation of Derivatives and Continuation of Hedge Accounting – Amendments to IAS 39 These amendments provide relief from discontinuing hedge accounting when novation of a derivative designated as a hedging
instrument meets certain criteria and retrospective application is required. These amendments have no impact on the financial statements of the Group as the Group has not novated its derivatives during the current or prior period.
Amendment to IAS 36, ‘Impairment of assets’ on recoverable amount disclosures This amendment addresses the disclosure of information about the recoverable amount of impaired assets if that amount is based
on fair value less costs of disposal.
Issued but not yet effective for accounting periods beginning on 1 January 2014 Thestandardsandinterpretationsthatareissued,butnotyeteffective,uptothedateofissuanceoftheGroup’s financialstatementsaredisclosedbelowtotheextentthattheyarerelevanttotheGroup’sfinancialstatements.TheGroupintends
to adopt these standards, if applicable, when they become effective.
Notes to the consolidated financial statements (continued) For the year ended 31 December 2014
46 Commercial Bank of Dubai
3. SIGNIFICANT ACCOUNTING POLICIES (continued)
z) Standards and interpretation (continued) Issued but not yet effective for accounting periods beginning on 1 January 2014(continued)
IFRS 9 Financial Instruments In July 2014, the IASB issued the final version of IFRS 9 Financial Instruments which reflects all phases of the financial
instruments project and replaces IAS 39 Financial Instruments: Recognition and Measurement and all previous versions of IFRS 9. The standard introduces new requirements for classification and measurement, impairment, and hedge accounting. IFRS 9 is effective for annual periods beginning on or after 1 January 2018, with early application permitted. Retrospective application is required, but comparative information is not compulsory. The adoption of IFRS 9 will have an effect on the classification andmeasurementoftheGroup’sfinancialassets,butnoimpactontheclassificationandmeasurementoftheGroup’sfinancialliabilities. There is now a new expected credit losses model that replaces the incurred loss impairment model used in IAS 39. The Group is currently assessing the impact of IFRS 9 on its consolidated financial statements.
IFRS 8 Operating Segments The amendments are applied retrospectively and clarifies that an entity must disclose the judgements made by management in
applying the aggregation criteria in paragraph 12 of IFRS 8, including a brief description of operating segments that have been aggregatedandtheeconomiccharacteristics(e.g.,salesandgrossmargins)usedtoassesswhetherthesegmentsare‘similar’.Thereconciliation of segment assets to total assets is only required to be disclosed if the reconciliation is reported to the chief operating decision maker, similar to the required disclosure for segment liabilities.
IFRS 13 Fair Value Measurement The amendment is applied prospectively and clarifies that the portfolio exception in IFRS 13 can be applied not only to financial
assets and financial liabilities, but also to other contracts within the scope of IFRS 9 (or IAS 39, as applicable).
IFRS 15 Revenue from Contracts with Customers IFRS 15 was issued in May 2014 and establishes a new five-step model that will apply to revenue arising from contracts with
customers. Under IFRS 15 revenue is recognised at an amount that reflects the consideration to which an entity expects to be entitled in exchange for transferring goods or services to a customer. The principles in IFRS 15 provide a more structured approach to measuring and recognising revenue. The new revenue standard is applicable to all entities and will supersede all current revenue recognition requirements under IFRS. Either a full or modified retrospective application is required for annual periods beginning on or after 1 January 2017 with early adoption permitted. The Group is currently assessing the impact of IFRS 15 on its consolidated financial statements.

Notes to the consolidated financial statements (continued) For the year ended 31 December 2014
47Annual Report 2014
4. FINANCIAL ASSETS AND LIABILITIES
4.1 Financial assets and liabilities classification
ThetablebelowsetsouttheGroup’sassetsandliabilitiesclassificationinaccordancewiththecategoriesoffinancialinstrumentsin IAS 39:
Fair value Amortized Cost Available- Other Total through Held-to- Loans and For-sale at amortized carrying profit or loss maturity receivables fair value cost amount31 December 2014 AED’000 AED’000 AED’000 AED’000 AED’000 AED’000 Cash and balances with central bank - - - - 5,450,145 5,450,145 Due from banks - - - - 1,565,312 1,565,312 Loans and advances and Islamic financing - - 32,167,216 - - 32,167,216 Investment securities 29,371 - - 5,558,627 - 5,587,998 Other assets 23,159 - - - 1,337,435 1,360,594 –––––––––––––––––––––––––––––––––––––––––––––––––––––––––––––––––––––––––––––––––––––––––––––––––––––––––––Total financial asset 52,530 - 32,167,216 5,558,627 8,352,892 46,131,265 ==========================================================================================================
Due to banks - - - - 1,097,926 1,097,926 Customers’depositsandIslamiccustomers’deposits - - - - 32,161,339 32,161,339 Notes and medium term borrowing - - - - 4,021,998 4,021,998 Other liabilities 21,683 - - - 1,650,649 1,672,332 –––––––––––––––––––––––––––––––––––––––––––––––––––––––––––––––––––––––––––––––––––––––––––––––––––––––––––Total financial liabilities 21,683 - - - 38,931,912 38,953,595 ========================================================================================================== 31 December 2013 Cash and balances with central bank - - - - 6,132,063 6,132,063 Due from banks - - - - 1,662,172 1,662,172 Loans and advances and Islamic financing - - 30,287,385 - - 30,287,385 Investment securities 33,297 35,261 - 4,160,095 - 4,228,653 Other assets 14,695 - - - 1,370,376 1,385,071 –––––––––––––––––––––––––––––––––––––––––––––––––––––––––––––––––––––––––––––––––––––––––––––––––––––––––––Total financial assets 47,992 35,261 30,287,385 4,160,095 9,164,611 43,695,344 ==========================================================================================================Due to banks - - - - 499,259 499,259 Customers’depositsandIslamiccustomers’deposits - - - - 30,942,680 30,942,680Notes and medium term borrowing - - - - 4,014,806 4,014,806 Other liabilities 10,203 - - - 1,652,320 1,662,523 –––––––––––––––––––––––––––––––––––––––––––––––––––––––––––––––––––––––––––––––––––––––––––––––––––––––––––Total financial liabilities 10,203 - - - 37,109,065 37,119,268 ==========================================================================================================
The carrying values of the financial assets and liabilities (that are not stated at fair value) are not significantly different to their fair values.

Notes to the consolidated financial statements (continued) For the year ended 31 December 2014
48 Commercial Bank of Dubai
4. FINANCIAL ASSETS AND LIABILITIES (continued)
4.2 Fair value measurement – Fair value hierarchy:
The below table, shows the hierarchy used by the Group to determine the fair value of the financial assetsand financial liabilities:
31 December 2014 Level 1 Level 2 Level 3 AED’000 AED’000 AED’000Investments Equity 159,011 - - Fund of funds - 272,685 - Fixed and floating rate securities 5,156,302 - -Forward foreign exchange contracts and other derivatives (net) - 1,476 -
–––––––––––––––––––––––––––––––––––––––––––––––––––––––––––––––––––––––––––––––––––––––––––––––––––––––––––– 5,315,313 274,161 -
===========================================================================================================
31 December 2013 Level 1 Level 2 Level 3 AED’000 AED’000 AED’000Investments Equity 103,004 - - Fund of funds - 188,824 - Fixed and floating rate securities 3,901,564 - -Forward foreign exchange contracts and other derivatives (net) - 4,492 -
–––––––––––––––––––––––––––––––––––––––––––––––––––––––––––––––––––––––––––––––––––––––––––––––––––––––––––– 4,004,568 193,316 -
=========================================================================================================== During the year there were no transfers between Level 1 and Level 2 of the fair value hierarchy above and no financial
instruments were classified within level 3 of the fair value hierarchy at any time during the current or prior year. Further, there has been no change in the valuation techniques in relation to valuation of financial instruments during the year.
5. CASH AND BALANCES WITH CENTRAL BANK
2014 2013 AED’000 AED’000 Cash on hand 445,682 443,485Balances with UAE Central Bank - Clearing account balances 99,145 362,621 - Statutory reserves 2,405,318 2,125,957 - Negotiable certificates of deposit 2,500,000 3,200,000
–––––––––––––––––––––––––––––––––––––––––––––––––––––––––––––––––––––––––––––––––––––––––––––––––––––––––––– 5,450,145 6,132,063
===========================================================================================================
6. DUE FROM BANKS 2014 2013 AED’000 AED’000 Current and demand deposits 187,897 89,948Placements 1,377,415 1,572,224
–––––––––––––––––––––––––––––––––––––––––––––––––––––––––––––––––––––––––––––––––––––––––––––––––––––––––––– 1,565,312 1,662,172
===========================================================================================================
The geographical concentration is disclosed in note 33b.

Notes to the consolidated financial statements (continued) For the year ended 31 December 2014
49Annual Report 2014
7. LOANS AND ADVANCES AND ISLAMIC FINANCINGThe composition of the loans and advances and Islamic financing portfolio is as follows: 2014 2013Loans and advances AED’000 AED’000Overdrafts 5,241,049 5,486,219Loans 25,834,277 24,160,337Advances against letters of credit and trust receipts 885,449 680,820Bills discounted 881,213 677,948
––––––––––––––––––––––––––––––––––––––––––––––––––––––––––––––––––––––––––––––––––––––––––––––––––––––––––––Gross loans and advances 32,841,988 31,005,324
––––––––––––––––––––––––––––––––––––––––––––––––––––––––––––––––––––––––––––––––––––––––––––––––––––––––––––Islamic financing Murabaha 828,832 872,066Ijara 1,434,813 982,413Others 98,524 257,805
––––––––––––––––––––––––––––––––––––––––––––––––––––––––––––––––––––––––––––––––––––––––––––––––––––––––––––Gross Islamic financing 2,362,169 2,112,284
––––––––––––––––––––––––––––––––––––––––––––––––––––––––––––––––––––––––––––––––––––––––––––––––––––––––––––Gross loans and advances and Islamic financing 35,204,157 33,117,608
––––––––––––––––––––––––––––––––––––––––––––––––––––––––––––––––––––––––––––––––––––––––––––––––––––––––––––Provisions for impairment losses (3,036,941) (2,830,223)
––––––––––––––––––––––––––––––––––––––––––––––––––––––––––––––––––––––––––––––––––––––––––––––––––––––––––––Net loans and advances and Islamic financing 32,167,216 30,287,385
===========================================================================================================The movements in provisions for impairment losses are as follows:
Interest Specific Collective suspended provisions provisions Total AED’000 AED’000 AED’000 AED’000Opening balance 1 January 2014 478,482 1,877,746 473,995 2,830,223Interest not recognized / new provisions raised 204,377 296,064 51,224 551,665Less: Written-Off (78,653) (98,596) - (177,249)Recoveries / reversal to income (106,564) (61,134) - (167,698)
––––––––––––––––––––––––––––––––––––––––––––––––––––––––––––––––––––––––––––––––––––––––––––––––––––––––––––Closing Balance 31 December 2014 497,642 2,014,080 525,219 3,036,941
===========================================================================================================
Interest Specific Collective suspended provisions provisions Total AED’000 AED’000 AED’000 AED’000Opening balance 1 January 2013 395,001 1,538,093 440,743 2,373,837Interest not recognized / new provisions raised 203,301 385,956 33,252 622,509Less: Written-Off (19,851) (19,117) - (38,968)Recoveries / reversal to income (99,969) (27,186) - (127,155)
––––––––––––––––––––––––––––––––––––––––––––––––––––––––––––––––––––––––––––––––––––––––––––––––––––––––––––Closing Balance 31 December 2013 478,482 1,877,746 473,995 2,830,223
===========================================================================================================The economic sector composition of the loans and advances and Islamic financing is set out in note 33-b.

Notes to the consolidated financial statements (continued) For the year ended 31 December 2014
50 Commercial Bank of Dubai
8. INVESTMENT SECURITIES
Domestic GCC International Total31 December 2014 AED’000 AED’000 AED’000 AED’000
Held for trading Equities 771 - 993 1,764 Fixed rate securities - Government 23,675 3,932 - 27,607 - Others - - - - Available-for-sale Equities 157,247 - - 157,247 Fund of funds 15,328 36,815 220,542 272,685 Fixed rate securities - Government 1,750,825 312,076 - 2,062,901 - Others 1,317,490 729,809 537,186 2,584,485 Floating rate non-government securities 320,925 96,705 63,679 481,309
––––––––––––––––––––––––––––––––––––––––––––––––––––––––––––––––––––––––––––––––––––––––––––––––––––––––––––Total investment securities 3,586,261 1,179,337 822,400 5,587,998
===========================================================================================================
Domestic GCC International Total31 December 2013 AED’000 AED’000 AED’000 AED’000
Held for trading Equities 834 - 817 1,651 Fixed rate securities - Government 13,262 7,311 - 20,573 - Others - 11,073 - 11,073 Available-for-sale Equities 101,353 - - 101,353 Fund of funds 15,475 18,077 155,272 188,824 Fixed rate securities - Government 1,544,530 182,111 - 1,726,641 - Others 1,272,524 420,363 310,168 2,003,055 Floating rate non-government securities 71,363 68,859 - 140,222 Held-to-maturity Floating rate non-government securities 35,261 - - 35,261
––––––––––––––––––––––––––––––––––––––––––––––––––––––––––––––––––––––––––––––––––––––––––––––––––––––––––––Total investment securities 3,054,602 707,794 466,257 4,228,653
===========================================================================================================

Notes to the consolidated financial statements (continued) For the year ended 31 December 2014
51Annual Report 2014
8. INVESTMENT SECURITIES (continued)
8.1 AFS and HTM debt securities
The below table shows the rating of AFS and HTM debt securities:
2014 2013 AED’000 AED’000 Rated Aaa to Aa3 165,370 319,957 Rated A1 to A3 1,951,626 1,584,956 Rated BBB+ to BBB- 1,969,700 1,044,160 Rated BBB- and below 220,631 241,017 Unrated 821,368 715,089
–––––––––––––––––––––––––––––––––––––––––––––––––––––––––––––––––––––––––––––––––––––––––––––––––––––––Total AFS and HTM debt securities 5,128,695 3,905,179
======================================================================================================
8. 2. Fund of funds investmentsThisrepresentsinvestmentsinglobalandregionalassetmanagementfundsasapartoftheGroup’sstrategyofdiversifying its holdings. These investments are carried at net assets value provided by the respective fund managers.
9. INVESTMENT IN ASSOCIATE Equity accounting was applied using management information available at the time of the Board approval date and subsequent changes are not considered material. The following is the aggregated financial information of the associate:
2014 2013 AED’000 AED’000
Assets 961,275 911,551Liabilities 484,642 501,002Revenue 124,877 97,687
At 1 January 72,862 61,374Share of profit of associate 17,567 17,337Dividend received (5,322) (5,323)Share of OCI of associate 305 -Others (822) (526)
–––––––––––––––––––––––––––––––––––––––––––––––––––––––––––––––––––––––––––––––––––––––––––––––––––––––At 31 December 84,590 72,862
======================================================================================================
FairvalueoftheGroup’sshareofassociateasat31December2014wasAED101.1million(31December2013:AED 149.6 million). The fair value of associate is based on quoted price on Dubai Financial Market. Fair Value of the associate represents level 1 of the fair value hierarchy.
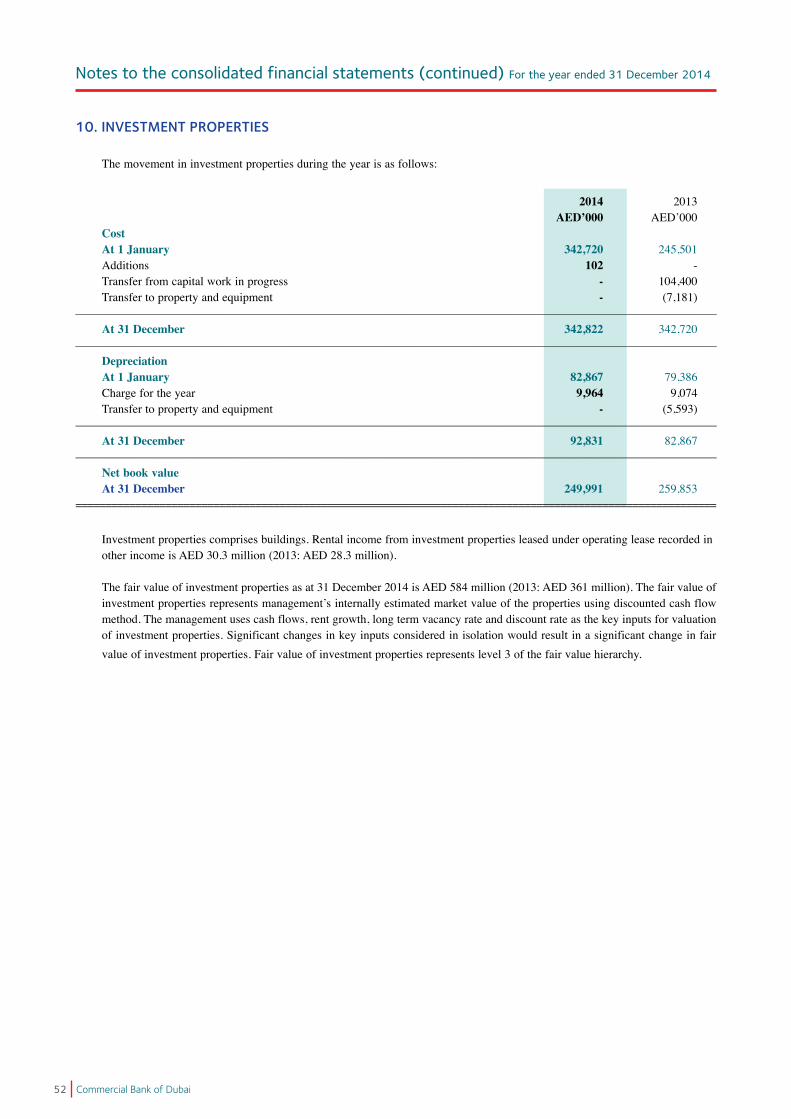
Notes to the consolidated financial statements (continued) For the year ended 31 December 2014
52 Commercial Bank of Dubai
10. INVESTMENT PROPERTIES
The movement in investment properties during the year is as follows:
2014 2013 AED’000 AED’000Cost At 1 January 342,720 245,501Additions 102 -Transfer from capital work in progress - 104,400Transfer to property and equipment - (7,181)
–––––––––––––––––––––––––––––––––––––––––––––––––––––––––––––––––––––––––––––––––––––––––––––––––––––––––––– At 31 December 342,822 342,720––––––––––––––––––––––––––––––––––––––––––––––––––––––––––––––––––––––––––––––––––––––––––––––––––––––––––––
Depreciation At 1 January 82,867 79,386
Charge for the year 9,964 9,074Transfer to property and equipment - (5,593)
–––––––––––––––––––––––––––––––––––––––––––––––––––––––––––––––––––––––––––––––––––––––––––––––––––––––––––– At 31 December 92,831 82,867––––––––––––––––––––––––––––––––––––––––––––––––––––––––––––––––––––––––––––––––––––––––––––––––––––––––––––
Net book value At 31 December 249,991 259,853
===========================================================================================================
Investment properties comprises buildings. Rental income from investment properties leased under operating lease recorded in other income is AED 30.3 million (2013: AED 28.3 million).
The fair value of investment properties as at 31 December 2014 is AED 584 million (2013: AED 361 million). The fair value of investmentpropertiesrepresentsmanagement’sinternallyestimatedmarketvalueofthepropertiesusingdiscountedcashflowmethod. The management uses cash flows, rent growth, long term vacancy rate and discount rate as the key inputs for valuation of investment properties. Significant changes in key inputs considered in isolation would result in a significant change in fair value of investment properties. Fair value of investment properties represents level 3 of the fair value hierarchy.

Notes to the consolidated financial statements (continued) For the year ended 31 December 2014
53Annual Report 2014
11. PROPERTY AND EQUIPMENT
Freehold Leasehold Furniture, Capital land and improvements equipment work in buildings & vehicles progress Total AED’000 AED’000 AED’000 AED’000 AED’000 Cost At 1 January 2014 385,240 38,132 272,140 13,222 708,734Additions during the year 88 499 17,382 23,160 41,129Transfer from capital work in progress to property and equipment - - 21,927 (21,927) -Disposals - (227) (5,943) (2,186) (8,356)––––––––––––––––––––––––––––––––––––––––––––––––––––––––––––––––––––––––––––––––––––––––––––––––––––––––––––At 31 December 2014 385,328 38,404 305,506 12,269 741,507––––––––––––––––––––––––––––––––––––––––––––––––––––––––––––––––––––––––––––––––––––––––––––––––––––––––––––Depreciation At 1 January 2014 127,136 29,015 231,310 - 387,461Charge for the year 10,338 3,681 21,713 - 35,732On disposals - (3) (5,535) - (5,538)–––––––––––––––––––––––––––––––––––––––––––––––––––––––––––––––––––––––––––––––––––––––––––––––––––––––––––– At 31 December 2014 137,474 32,693 247,488 - 417,655––––––––––––––––––––––––––––––––––––––––––––––––––––––––––––––––––––––––––––––––––––––––––––––––––––––––––––Net book values At 31 December 2014 247,854 5,711 58,018 12,269 323,852===========================================================================================================
Freehold Leasehold Furniture, Capital land and improvements equipment work in buildings & vehicles progress Total AED’000 AED’000 AED’000 AED’000 AED’000 Cost At 1 January 2013 332,590 36,102 258,855 155,887 783,434Additions during the year - - 12,260 17,838 30,098Transfer from capital work in progress to property and equipment 45,469 2,030 7,988 (55,487) -Transfer to investment properties - - - (104,400) (104,400)Transfer from investment properties 7,181 - - - 7,181Disposals - - (6,963) (616) (7,579)––––––––––––––––––––––––––––––––––––––––––––––––––––––––––––––––––––––––––––––––––––––––––––––––––––––––––––At 31 December 2013 385,240 38,132 272,140 13,222 708,734––––––––––––––––––––––––––––––––––––––––––––––––––––––––––––––––––––––––––––––––––––––––––––––––––––––––––––Depreciation At 1 January 2013 109,471 24,069 217,726 - 351,266Charge for the year 12,072 4,946 20,132 - 37,150Transfer from investment properties 5,593 - - - 5,593On disposals - - (6,548) - (6,548)––––––––––––––––––––––––––––––––––––––––––––––––––––––––––––––––––––––––––––––––––––––––––––––––––––––––––––At 31 December 2013 127,136 29,015 231,310 - 387,461––––––––––––––––––––––––––––––––––––––––––––––––––––––––––––––––––––––––––––––––––––––––––––––––––––––––––––Net book values At 31 December 2013 258,104 9,117 40,830 13,222 321,273===========================================================================================================
Freehold land and buildings includes the market value of a plot of land granted to the Group by the Government of Dubai in 1998. Granted land is valued at market value on the date of grant.
The Group assessed whether there is an indication that an asset may be impaired and concluded that there was no indication of impairment.

Notes to the consolidated financial statements (continued) For the year ended 31 December 2014
54 Commercial Bank of Dubai
12. OTHER ASSETS 2014 2013 AED’000 AED’000 Interest receivable 217,478 246,592 Accounts receivable and prepayments 151,491 184,949Customer’sindebtednessforacceptances 1,096,022 1,065,694 Positive mark to market value of derivatives (note 29) 23,159 14,695–––––––––––––––––––––––––––––––––––––––––––––––––––––––––––––––––––––––––––––––––––––––––––––––––––––––––––– 1,488,150 1,511,930===========================================================================================================
13. DUE TO BANKS 2014 2013 AED’000 AED’000 Current and demand deposits 560,999 258,378 Short term borrowings 536,927 240,881–––––––––––––––––––––––––––––––––––––––––––––––––––––––––––––––––––––––––––––––––––––––––––––––––––––––––––– 1,097,926 499,259===========================================================================================================
14. CUSTOMERS’ DEPOSITS AND ISLAMIC CUSTOMERS’ DEPOSITS
Customers’deposits 2014 2013 AED’000 AED’000 Current and demand accounts 13,085,481 12,106,932 Savings accounts 1,411,014 1,352,344 Time deposits 10,880,955 10,714,666–––––––––––––––––––––––––––––––––––––––––––––––––––––––––––––––––––––––––––––––––––––––––––––––––––––––––––– 25,377,450 24,173,942––––––––––––––––––––––––––––––––––––––––––––––––––––––––––––––––––––––––––––––––––––––––––––––––––––––––––––
Islamiccustomers’deposits 2014 2013 AED’000 AED’000 Current and demand accounts 955,337 857,584 Mudaraba savings accounts 467,467 504,915 Investment and Wakala deposits 5,361,085 5,406,239–––––––––––––––––––––––––––––––––––––––––––––––––––––––––––––––––––––––––––––––––––––––––––––––––––––––––––– 6,783,889 6,768,738––––––––––––––––––––––––––––––––––––––––––––––––––––––––––––––––––––––––––––––––––––––––––––––––––––––––––––Totalcustomers’depositsandIslamiccustomers’deposits 32,161,339 30,942,680===========================================================================================================
2014 2013By sector: AED’000 AED’000
Government 5,445,838 4,765,539Corporate 17,755,414 17,739,712Personal 8,960,087 8,437,429––––––––––––––––––––––––––––––––––––––––––––––––––––––––––––––––––––––––––––––––––––––––––––––––––––––––––– 32,161,339 30,942,680===========================================================================================================
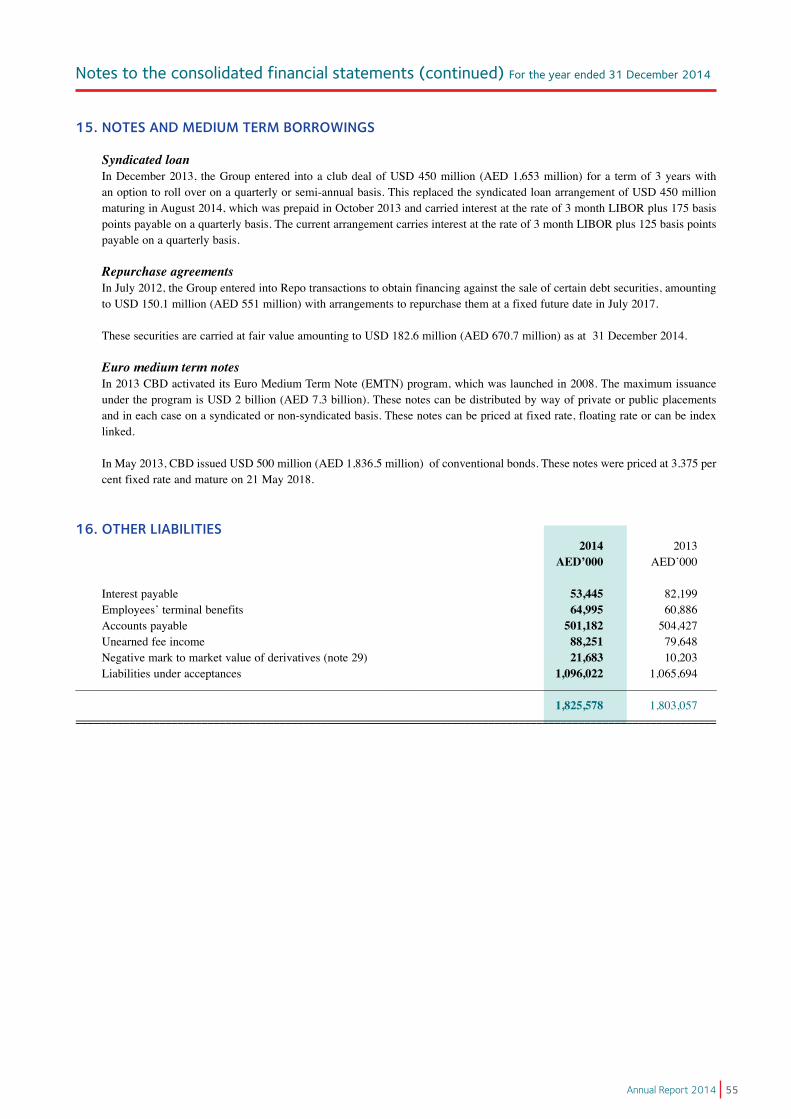
Notes to the consolidated financial statements (continued) For the year ended 31 December 2014
55Annual Report 2014
15. NOTES AND MEDIUM TERM BORROWINGS
Syndicated loan In December 2013, the Group entered into a club deal of USD 450 million (AED 1,653 million) for a term of 3 years with
an option to roll over on a quarterly or semi-annual basis. This replaced the syndicated loan arrangement of USD 450 million maturing in August 2014, which was prepaid in October 2013 and carried interest at the rate of 3 month LIBOR plus 175 basis points payable on a quarterly basis. The current arrangement carries interest at the rate of 3 month LIBOR plus 125 basis points payable on a quarterly basis.
Repurchase agreements In July 2012, the Group entered into Repo transactions to obtain financing against the sale of certain debt securities, amounting
to USD 150.1 million (AED 551 million) with arrangements to repurchase them at a fixed future date in July 2017. These securities are carried at fair value amounting to USD 182.6 million (AED 670.7 million) as at 31 December 2014. Euro medium term notes In 2013 CBD activated its Euro Medium Term Note (EMTN) program, which was launched in 2008. The maximum issuance
under the program is USD 2 billion (AED 7.3 billion). These notes can be distributed by way of private or public placements and in each case on a syndicated or non-syndicated basis. These notes can be priced at fixed rate, floating rate or can be index linked.
In May 2013, CBD issued USD 500 million (AED 1,836.5 million) of conventional bonds. These notes were priced at 3.375 per cent fixed rate and mature on 21 May 2018.
16. OTHER LIABILITIES 2014 2013 AED’000 AED’000
Interest payable 53,445 82,199 Employees’terminalbenefits 64,995 60,886 Accounts payable 501,182 504,427 Unearned fee income 88,251 79,648 Negative mark to market value of derivatives (note 29) 21,683 10,203 Liabilities under acceptances 1,096,022 1,065,694
–––––––––––––––––––––––––––––––––––––––––––––––––––––––––––––––––––––––––––––––––––––––––––––––––––––––––––– 1,825,578 1,803,057===========================================================================================================

Notes to the consolidated financial statements (continued) For the year ended 31 December 2014
56 Commercial Bank of Dubai
17. EQUITY Share capital
The fully paid up and authorized ordinary share capital as at 31 December 2014 comprised 2,242,187,147 ordinary shares of AED 1 each (2013: 2,038,351,976 shares of AED 1 each). The movement in no. of shares during the year is as follows:
2014 2013 As at 1 January 2,038,351,976 2,038,351,976 Bonus shares issued during the year 203,835,171 - ––––––––––––––––––––––––––––––––––––––––––––––––––––––––––––––––––––––––––––––––––––––––––––––––––––––– As at 31 December 2,242,187,147 2,038,351,976 ====================================================================================================== Legal reserve FederalLawNo.8of1984 (asamended),UnionLawNo.10of1980and theBank’sArticlesofAssociation require that a
minimum of 10% of the annual net profit be transferred to a legal reserve, until such time as this reserve equals 50% of share capital. The legal reserve is not available for distribution except under the circumstances stipulated by the relevant law. During the current year an amount of AED 682 thousand (2013: AED 130 thousand) was transferred to the legal reserve in respect of CBD Financial Services LLC (subsidiary company).
Capital reserve This reserve represents the market value of the granted land at the date of grant as explained in note 11, and is not available for
distribution to the shareholders. General reserve Inaccordancewitharticle87oftheBank’sArticlesofAssociation,aminimumof10%oftheannualnetprofittobetransferred
to general reserve until such time as this reserve equals 50% of share capital. This reserve may only be used for the purposes recommended by the Board of Directors and approved by the Shareholders. During the current year an amount of AED 21,095 thousand (2013: AED Nil) was transferred to the general reserve.
Cumulative changes in fair values of AFS investments and cash flow hedge instruments This represents the net change in the fair values of available-for-sale investments and derivative instruments designated as cash
flow hedge instruments held by the Group at reporting date. This reserve is not available for distribution to the shareholders. Proposed distribution The Board of Directors has proposed the following distribution for approval by the Annual General Meeting of the shareholders
to be held on 04th March 2015. i) Proposed cash dividend A cash dividend of 25% (2013: 30%) of the share capital amounting to AED 560,546,787 (2013: AED 611,505,593) is proposed
representing a dividend of AED 0.25 per share (2013: AED 0.30 per share). ii) proposed bonus issue A bonus issue of 25 % in the ratio of 1 share for every 4 shares held is proposed (2013: 10%). iii)Proposeddirectors’remuneration InaccordancewithArticle118ofFederalLawNo.8of1984,directors’remunerationamountingtoAED10,540,000(2013:AED
11,000,000) has been treated as an appropriation from equity.
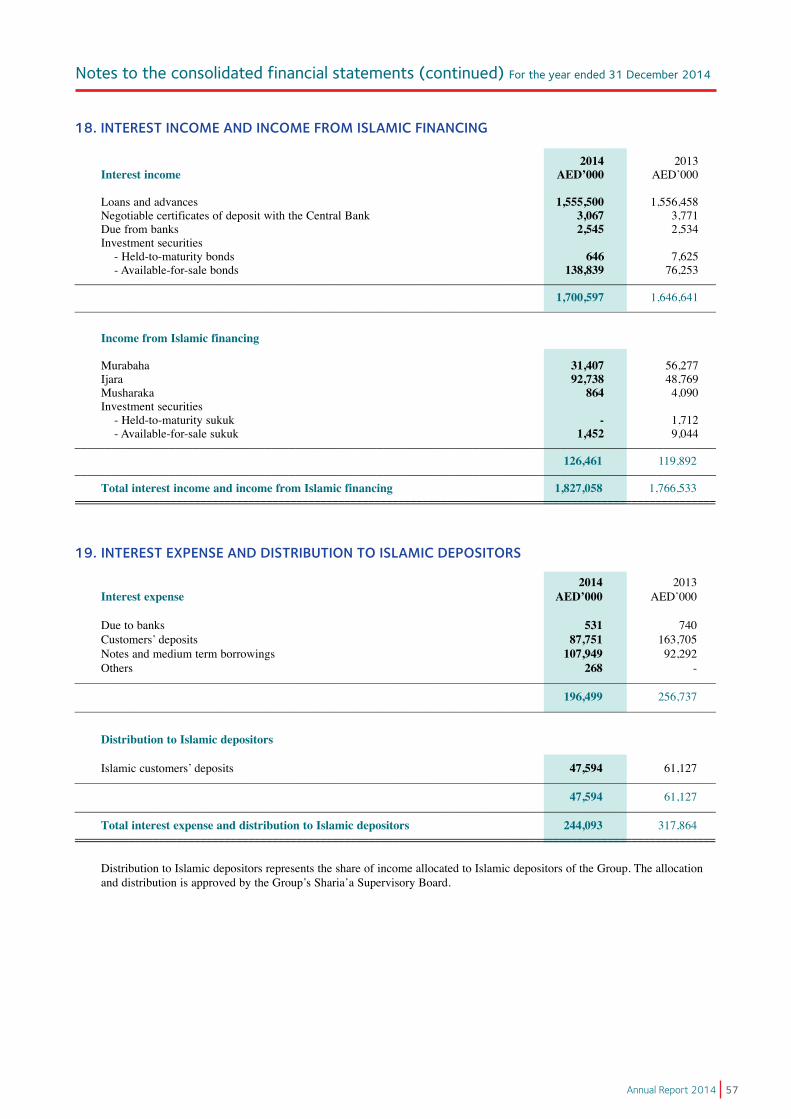
Notes to the consolidated financial statements (continued) For the year ended 31 December 2014
57Annual Report 2014
18. INTEREST INCOME AND INCOME FROM ISLAMIC FINANCING
2014 2013 Interest income AED’000 AED’000 Loans and advances 1,555,500 1,556,458 Negotiable certificates of deposit with the Central Bank 3,067 3,771 Due from banks 2,545 2,534 Investment securities
- Held-to-maturity bonds 646 7,625 - Available-for-sale bonds 138,839 76,253–––––––––––––––––––––––––––––––––––––––––––––––––––––––––––––––––––––––––––––––––––––––––––––––––––––––––––– 1,700,597 1,646,641–––––––––––––––––––––––––––––––––––––––––––––––––––––––––––––––––––––––––––––––––––––––––––––––––––––––––––– Income from Islamic financing
Murabaha 31,407 56,277 Ijara 92,738 48,769 Musharaka 864 4,090 Investment securities
- Held-to-maturity sukuk - 1,712 - Available-for-sale sukuk 1,452 9,044–––––––––––––––––––––––––––––––––––––––––––––––––––––––––––––––––––––––––––––––––––––––––––––––––––––––––––– 126,461 119,892–––––––––––––––––––––––––––––––––––––––––––––––––––––––––––––––––––––––––––––––––––––––––––––––––––––––––––– Total interest income and income from Islamic financing 1,827,058 1,766,533===========================================================================================================
19. INTEREST EXPENSE AND DISTRIBUTION TO ISLAMIC DEPOSITORS 2014 2013
Interest expense AED’000 AED’000 Due to banks 531 740 Customers’deposits 87,751 163,705 Notes and medium term borrowings 107,949 92,292 Others 268 -
–––––––––––––––––––––––––––––––––––––––––––––––––––––––––––––––––––––––––––––––––––––––––––––––––––––––––––– 196,499 256,737–––––––––––––––––––––––––––––––––––––––––––––––––––––––––––––––––––––––––––––––––––––––––––––––––––––––––––– Distribution to Islamic depositors
Islamiccustomers’deposits 47,594 61,127–––––––––––––––––––––––––––––––––––––––––––––––––––––––––––––––––––––––––––––––––––––––––––––––––––––––––––– 47,594 61,127–––––––––––––––––––––––––––––––––––––––––––––––––––––––––––––––––––––––––––––––––––––––––––––––––––––––––––– Total interest expense and distribution to Islamic depositors 244,093 317,864===========================================================================================================
Distribution to Islamic depositors represents the share of income allocated to Islamic depositors of the Group. The allocation anddistributionisapprovedbytheGroup’sSharia’aSupervisoryBoard.
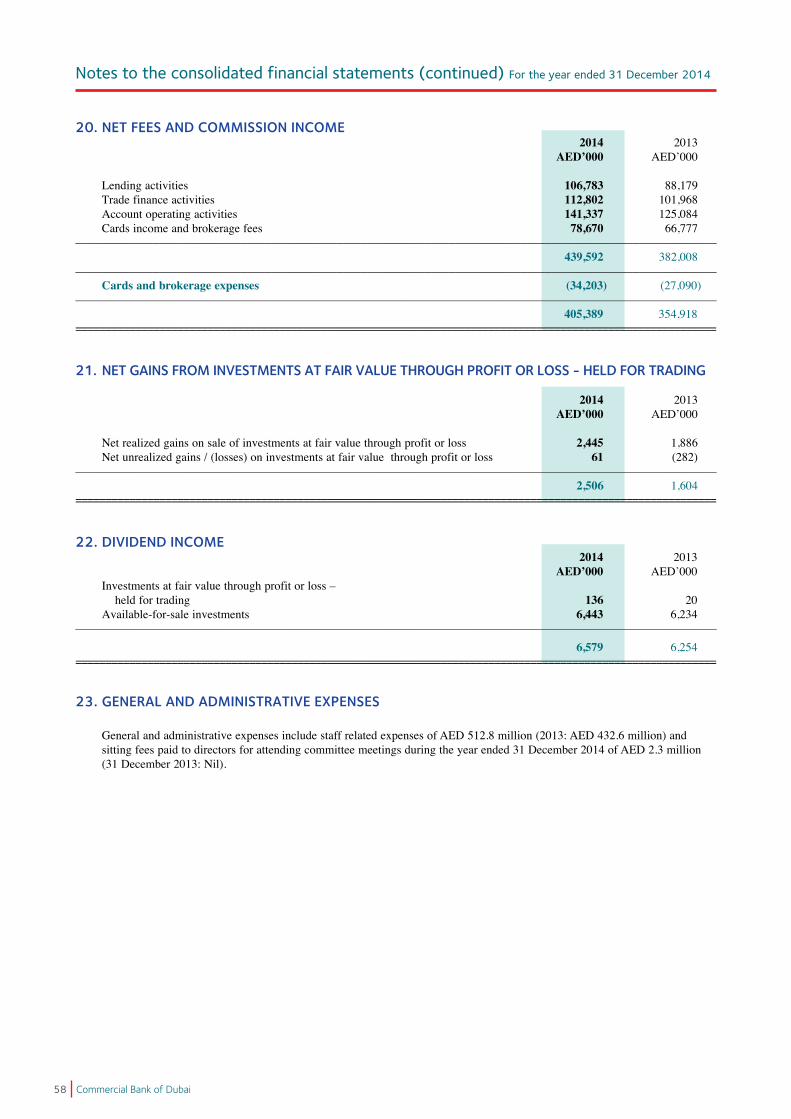
Notes to the consolidated financial statements (continued) For the year ended 31 December 2014
58 Commercial Bank of Dubai
20. NET FEES AND COMMISSION INCOME 2014 2013 AED’000 AED’000 Lending activities 106,783 88,179 Trade finance activities 112,802 101,968 Account operating activities 141,337 125,084 Cards income and brokerage fees 78,670 66,777–––––––––––––––––––––––––––––––––––––––––––––––––––––––––––––––––––––––––––––––––––––––––––––––––––––––––––– 439,592 382,008–––––––––––––––––––––––––––––––––––––––––––––––––––––––––––––––––––––––––––––––––––––––––––––––––––––––––––– Cards and brokerage expenses (34,203) (27,090)–––––––––––––––––––––––––––––––––––––––––––––––––––––––––––––––––––––––––––––––––––––––––––––––––––––––––––– 405,389 354,918===========================================================================================================
21. NET GAINS FROM INVESTMENTS AT FAIR VALUE THROUGH PROFIT OR LOSS - HELD FOR TRADING 2014 2013 AED’000 AED’000 Net realized gains on sale of investments at fair value through profit or loss 2,445 1,886 Net unrealized gains / (losses) on investments at fair value through profit or loss 61 (282)–––––––––––––––––––––––––––––––––––––––––––––––––––––––––––––––––––––––––––––––––––––––––––––––––––––––––––– 2,506 1,604===========================================================================================================
22. DIVIDEND INCOME 2014 2013
AED’000 AED’000Investments at fair value through profit or loss –
held for trading 136 20 Available-for-sale investments 6,443 6,234
–––––––––––––––––––––––––––––––––––––––––––––––––––––––––––––––––––––––––––––––––––––––––––––––––––––––––––– 6,579 6,254===========================================================================================================
23. GENERAL AND ADMINISTRATIVE EXPENSES
General and administrative expenses include staff related expenses of AED 512.8 million (2013: AED 432.6 million) and sitting fees paid to directors for attending committee meetings during the year ended 31 December 2014 of AED 2.3 million
(31 December 2013: Nil).

Notes to the consolidated financial statements (continued) For the year ended 31 December 2014
59Annual Report 2014
24. OPERATING LEASES
Group as lessee General and administrative expenses include rental expense under operating leases of AED 16.1 million (2013: AED 14.4
million). Non-cancellable operating lease rental payable as at 31 December is as follows: 2014 2013 AED’000 AED’000 Less than one year 8,062 7,246 Group as lessor OperatingleasesrelatetotheGroup’sinvestmentproperties.Non-cancellableoperatingleaserentalreceivablesareasfollows 2014 2013 AED’000 AED’000
Less than one year 14,227 14,771
25. BASIC AND DILUTED EARNINGS PER SHARE
Theearningspershare(EPS)isbasedontheGroup’sprofitattributabletoshareholdersfortheyearamountingtoAED 1,202.3 million (2013: AED 1,010.2 million), and on the weighted average number of shares in issue totaling 2,242,187,174 (2013: 2,242,187,174). Weighted average number of shares used for EPS calculation for 2013 and 2014 is adjusted for bonus shares issued in 2014.
There was no dilutive effect on earnings per share.
26. CASH AND CASH EQUIVALENTS
Cash and cash equivalents included in the consolidated statement of cash flow comprise the following statement of financial position amounts:
2014 2013 AED’000 AED’000 Cash on hand 445,682 443,485 Balances with the Central Bank 99,145 362,621 Negotiable certificates of deposit with the Central Bank with original maturity less than three months 2,400,000 3,200,000 Due from banks with original maturity less than three months 1,565,312 1,662,172–––––––––––––––––––––––––––––––––––––––––––––––––––––––––––––––––––––––––––––––––––––––––––––––––––––––––––– 4,510,139 5,668,278 Due to banks with original maturity less than three months (1,047,926) (499,259)–––––––––––––––––––––––––––––––––––––––––––––––––––––––––––––––––––––––––––––––––––––––––––––––––––––––––––– 3,462,213 5,169,019===========================================================================================================

Notes to the consolidated financial statements (continued) For the year ended 31 December 2014
60 Commercial Bank of Dubai
27. CONTINGENT LIABILITIES AND COMMITMENTS
Contingent liabilities represent credit-related commitments to extend letters of credit, guarantees and forward foreign exchange contractswhicharedesignedtomeettherequirementsoftheGroup’scustomerstowardthirdparties.CommitmentsrepresenttheGroup’scommitmentstowardsapprovedun-drawncreditfacilities. Theamountofcontingentliabilitiesreflectedbelowrepresent the maximum accounting loss that would be recognized at the reporting date if counterparties failed completely to perform as contracted.
2014 2013 AED’000 AED’000 Contingent liabilities: Letters of credit 1,091,458 1,157,129 Guarantees 6,656,419 5,107,403–––––––––––––––––––––––––––––––––––––––––––––––––––––––––––––––––––––––––––––––––––––––––––––––––––––––––––– 7,747,877 6,264,532 Credit commitments:
Undrawn commitments to extend credit 11,900,926 9,927,716 Capital commitments:
Capital expenditure commitments 16,737 10,636–––––––––––––––––––––––––––––––––––––––––––––––––––––––––––––––––––––––––––––––––––––––––––––––––––––––––––– Total contingent liabilities and commitments 19,665,540 16,202,884===========================================================================================================
28. FIDUCIARY ASSETS Assets held under fiduciary capacity on behalf of clients amounted to AED1,472.6 million (2013: AED 634.9 million)
29. DERIVATIVES The following table shows the fair values of derivative financial instruments at the reporting date, together with the notional
amounts,analyzedbytermstomaturity.Thenotionalamountisthevalueofthederivative’sunderlyingassetandisthebasisupon which changes in the value of derivatives are measured. The notional amounts indicate the volume of transactions outstandingattheyearendandtherefore,areneitherindicativeoftheGroup’sexposuretocreditrisknormarketrisk.Creditrisk on derivatives is limited to its positive fair value if any.
Positive Negative Less than From three From one Over market market Notional three months to year to Five value value amount months one year five years Years31 December 2014 AED’000 AED’000 AED’000 AED’000 AED’000 AED’000 AED’000 Cash flow hedge instrument - 349 42,368 - - 42,368 -Forward foreign exchange contracts and other derivatives assets 23,159 - 4,197,311 2,055,486 1,245,082 162,143 734,600Forward foreign exchange contracts and other derivatives liabilities - 21,334 3,746,173 1,263,271 1,620,296 101,756 760,850–––––––––––––––––––––––––––––––––––––––––––––––––––––––––––––––––––––––––––––––––––––––––––––––––––––––––––– 23,159 21,683 7,985,852 3,318,757 2,865,378 306,267 1,495,450===========================================================================================================
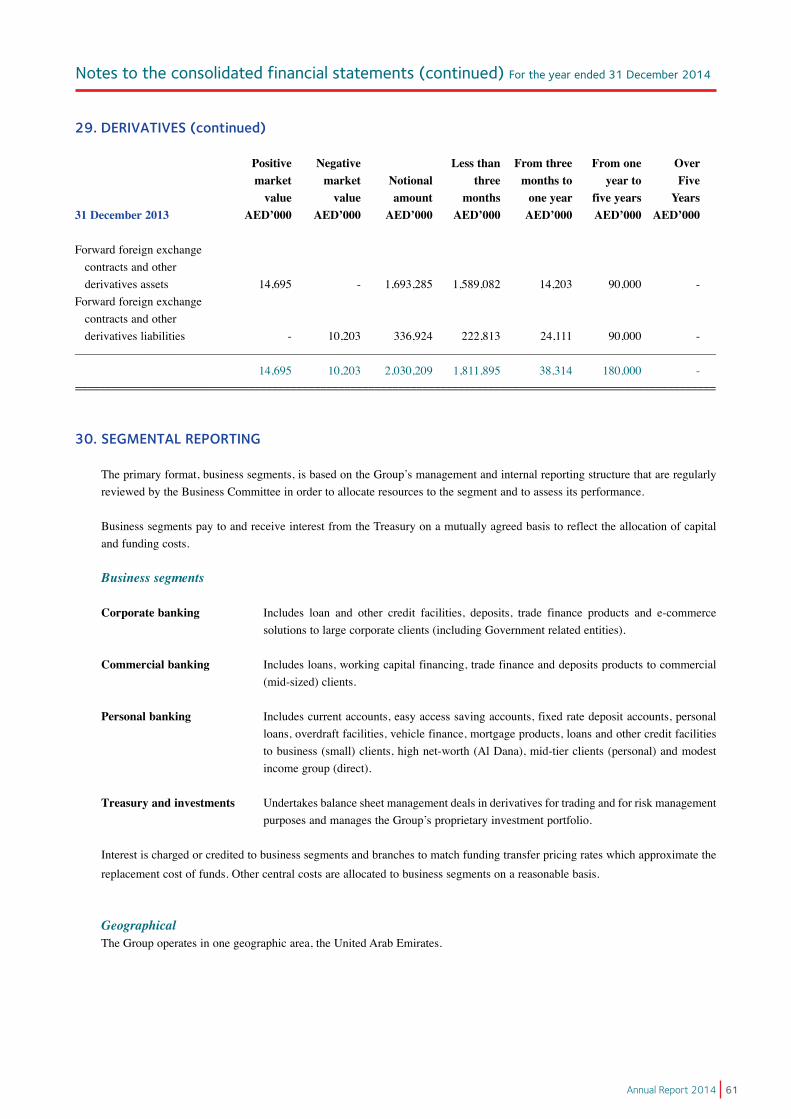
Notes to the consolidated financial statements (continued) For the year ended 31 December 2014
61Annual Report 2014
29. DERIVATIVES (continued)
Positive Negative Less than From three From one Over market market Notional three months to year to Five value value amount months one year five years Years31 December 2013 AED’000 AED’000 AED’000 AED’000 AED’000 AED’000 AED’000
Forward foreign exchange contracts and other derivatives assets 14,695 - 1,693,285 1,589,082 14,203 90,000 -Forward foreign exchange contracts and other derivatives liabilities - 10,203 336,924 222,813 24,111 90,000 -–––––––––––––––––––––––––––––––––––––––––––––––––––––––––––––––––––––––––––––––––––––––––––––––––––––––––––– 14,695 10,203 2,030,209 1,811,895 38,314 180,000 -===========================================================================================================
30. SEGMENTAL REPORTING
Theprimaryformat,businesssegments,isbasedontheGroup’smanagementandinternalreportingstructurethatareregularlyreviewed by the Business Committee in order to allocate resources to the segment and to assess its performance.
Business segments pay to and receive interest from the Treasury on a mutually agreed basis to reflect the allocation of capital and funding costs.
Business segments
Corporate banking Includes loan and other credit facilities, deposits, trade finance products and e-commerce solutions to large corporate clients (including Government related entities).
Commercial banking Includes loans, working capital financing, trade finance and deposits products to commercial (mid-sized) clients.
Personal banking Includes current accounts, easy access saving accounts, fixed rate deposit accounts, personal loans, overdraft facilities, vehicle finance, mortgage products, loans and other credit facilities to business (small) clients, high net-worth (Al Dana), mid-tier clients (personal) and modest income group (direct).
Treasury and investments Undertakes balance sheet management deals in derivatives for trading and for risk management purposesandmanagestheGroup’sproprietaryinvestmentportfolio.
Interest is charged or credited to business segments and branches to match funding transfer pricing rates which approximate the
replacement cost of funds. Other central costs are allocated to business segments on a reasonable basis.
Geographical The Group operates in one geographic area, the United Arab Emirates.

Notes to the consolidated financial statements (continued) For the year ended 31 December 2014
62 Commercial Bank of Dubai
30. SEGMENTAL REPORTING (continued)
Segmental analysis for the year ended 31 December 2014 was as follows:
Corporate Commercial Personal Treasury & banking banking banking investments Total31 December 2014 AED’000 AED’000 AED’000 AED’000 AED’000 Assets 21,085,331 8,203,749 4,861,396 12,766,778 46,917,254 ===========================================================================================================Liabilities 15,513,645 6,028,734 12,417,019 5,147,443 39,106,841 ===========================================================================================================
31 December 2013 Assets 21,337,747 7,171,875 3,761,343 12,205,226 44,476,191 ===========================================================================================================Liabilities 14,638,879 6,499,608 11,586,409 4,534,906 37,259,802 ===========================================================================================================
31 December 2014 Net interest income and net income from Islamic financing 626,532 427,412 306,799 222,222 1,582,965 Non-Interest & Other Income 213,982 142,732 176,577 124,174 657,465––––––––––––––––––––––––––––––––––––––––––––––––––––––––––––––––––––––––––––––––––––––––––––––––––––––––––––Total operating income 840,514 570,144 483,376 346,396 2,240,430 –––––––––––––––––––––––––––––––––––––––––––––––––––––––––––––––––––––––––––––––––––––––––––––––––––––––––––– Direct and allocated cost 167,230 209,714 300,979 30,815 708,738 Provisions for impairment losses net of recoveries 169,331 52,158 62,251 - 283,740 Depreciation 14,512 5,923 24,287 974 45,696––––––––––––––––––––––––––––––––––––––––––––––––––––––––––––––––––––––––––––––––––––––––––––––––––––––––––––Total expenses 351,073 267,795 387,517 31,789 1,038,174 ––––––––––––––––––––––––––––––––––––––––––––––––––––––––––––––––––––––––––––––––––––––––––––––––––––––––––––Net profit for the year 489,441 302,349 95,859 314,607 1,202,256===========================================================================================================
31 December 2013 Net interest income and net income from Islamic financing 545,554 410,702 226,161 266,252 1,448,669 Non-Interest & Other Income 188,840 120,343 174,732 100,310 584,225––––––––––––––––––––––––––––––––––––––––––––––––––––––––––––––––––––––––––––––––––––––––––––––––––––––––––––Total operating income 734,394 531,045 400,893 366,562 2,032,894––––––––––––––––––––––––––––––––––––––––––––––––––––––––––––––––––––––––––––––––––––––––––––––––––––––––––––Direct and allocated cost 148,831 201,022 209,469 22,060 581,382 Provisions for impairment losses net of recoveries 373,710 47,835 (26,492) - 395,053 Depreciation 20,007 10,429 14,750 1,038 46,224 ––––––––––––––––––––––––––––––––––––––––––––––––––––––––––––––––––––––––––––––––––––––––––––––––––––––––––––Total expenses 542,548 259,286 197,727 23,098 1,022,659 ––––––––––––––––––––––––––––––––––––––––––––––––––––––––––––––––––––––––––––––––––––––––––––––––––––––––––––Net profit for the year 191,846 271,759 203,166 343,464 1,010,235 ===========================================================================================================
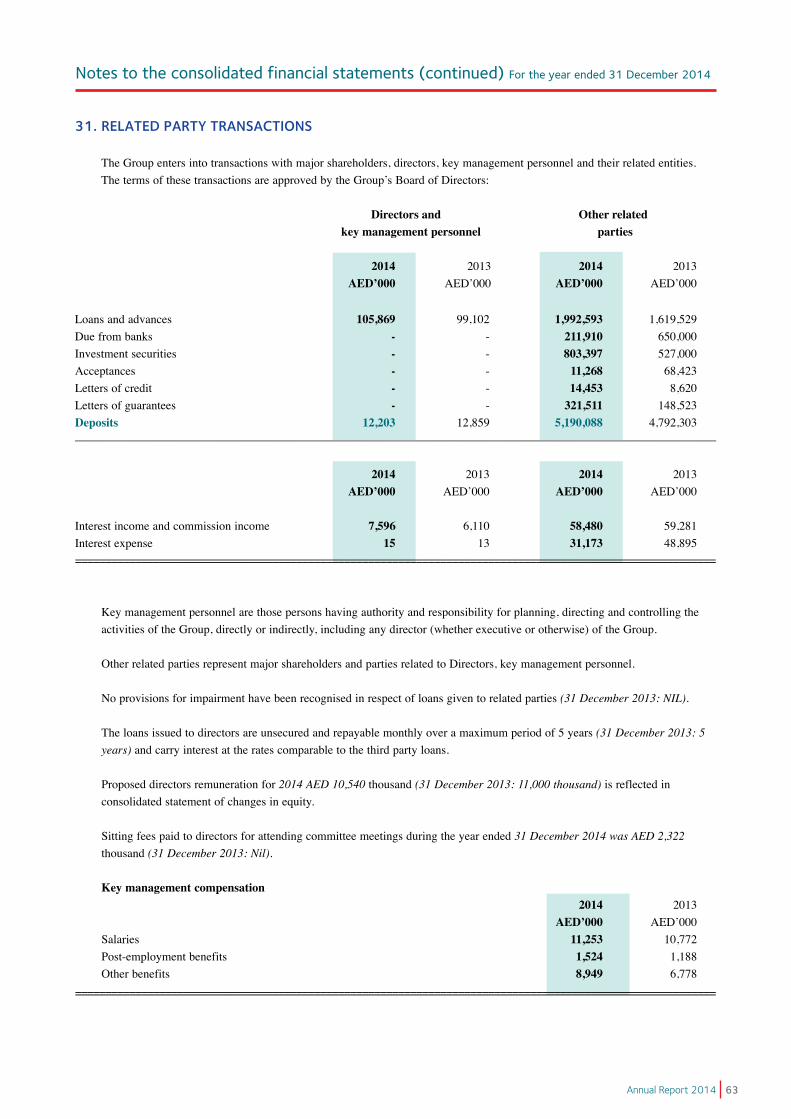
Notes to the consolidated financial statements (continued) For the year ended 31 December 2014
63Annual Report 2014
31. RELATED PARTY TRANSACTIONS
The Group enters into transactions with major shareholders, directors, key management personnel and their related entities. ThetermsofthesetransactionsareapprovedbytheGroup’sBoardofDirectors:
Directors and Other related key management personnel parties
2014 2013 2014 2013 AED’000 AED’000 AED’000 AED’000
Loans and advances 105,869 99,102 1,992,593 1,619,529Due from banks - - 211,910 650,000Investment securities - - 803,397 527,000Acceptances - - 11,268 68,423Letters of credit - - 14,453 8,620Letters of guarantees - - 321,511 148,523Deposits 12,203 12,859 5,190,088 4,792,303––––––––––––––––––––––––––––––––––––––––––––––––––––––––––––––––––––––––––––––––––––––––––––––––––––––––––––
2014 2013 2014 2013 AED’000 AED’000 AED’000 AED’000 Interest income and commission income 7,596 6,110 58,480 59,281Interest expense 15 13 31,173 48,895===========================================================================================================
Key management personnel are those persons having authority and responsibility for planning, directing and controlling the activities of the Group, directly or indirectly, including any director (whether executive or otherwise) of the Group.
Other related parties represent major shareholders and parties related to Directors, key management personnel.
No provisions for impairment have been recognised in respect of loans given to related parties (31 December 2013: NIL).
The loans issued to directors are unsecured and repayable monthly over a maximum period of 5 years (31 December 2013: 5 years) and carry interest at the rates comparable to the third party loans.
Proposed directors remuneration for 2014 AED 10,540 thousand (31 December 2013: 11,000 thousand) is reflected in consolidated statement of changes in equity.
Sitting fees paid to directors for attending committee meetings during the year ended 31 December 2014 was AED 2,322 thousand (31 December 2013: Nil).
Key management compensation 2014 2013 AED’000 AED’000
Salaries 11,253 10,772 Post-employment benefits 1,524 1,188 Other benefits 8,949 6,778===========================================================================================================
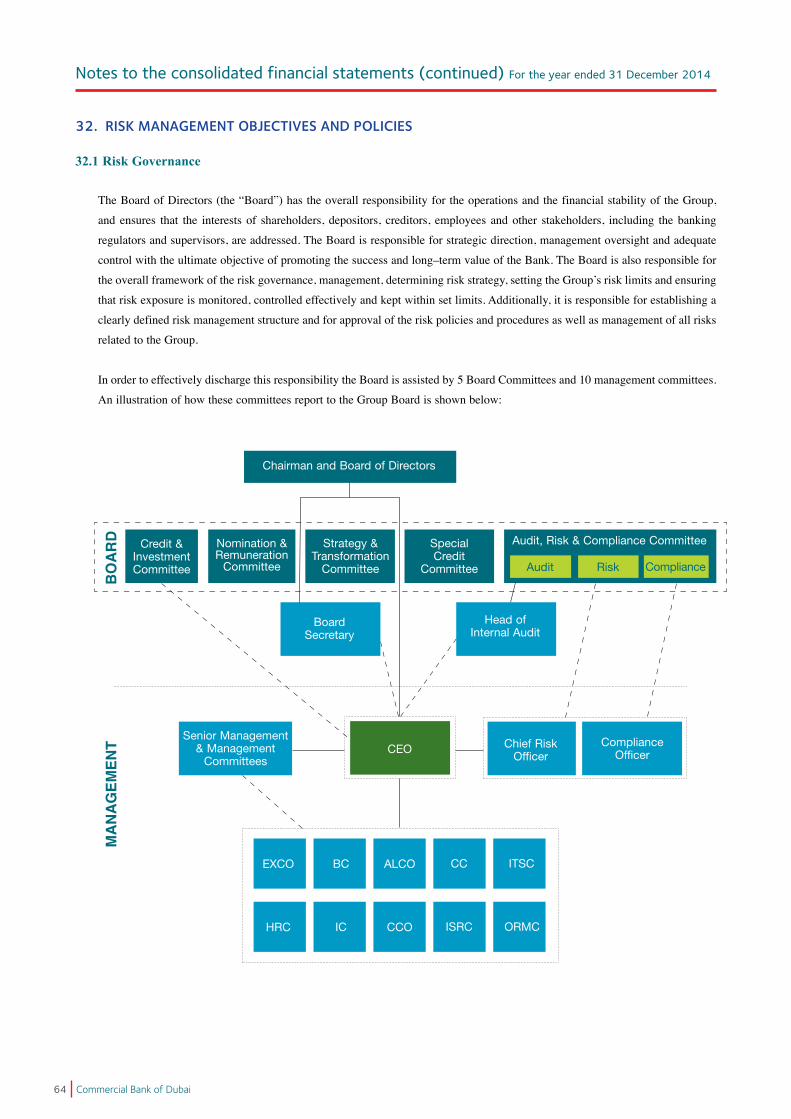
Notes to the consolidated financial statements (continued) For the year ended 31 December 2014
64 Commercial Bank of Dubai
32. RISK MANAGEMENT OBJECTIVES AND POLICIES
32.1 Risk Governance
The Board of Directors (the “Board”) has the overall responsibility for the operations and the financial stability of the Group,
and ensures that the interests of shareholders, depositors, creditors, employees and other stakeholders, including the banking
regulators and supervisors, are addressed. The Board is responsible for strategic direction, management oversight and adequate
control with the ultimate objective of promoting the success and long–term value of the Bank. The Board is also responsible for
theoverallframeworkoftheriskgovernance,management,determiningriskstrategy,settingtheGroup’srisklimitsandensuring
that risk exposure is monitored, controlled effectively and kept within set limits. Additionally, it is responsible for establishing a
clearly defined risk management structure and for approval of the risk policies and procedures as well as management of all risks
related to the Group.
In order to effectively discharge this responsibility the Board is assisted by 5 Board Committees and 10 management committees.
An illustration of how these committees report to the Group Board is shown below:
MA
NA
GEM
ENT
BO
AR
D Credit & Investment Committee
Nomination & Remuneration
Committee
Strategy &Transformation
Committee
SpecialCredit
Committee
Audit, Risk & Compliance Committee
Chairman and Board of Directors
Audit Risk Compliance
BoardSecretary
Head of Internal Audit
CEOSenior Management
& Management Committees
Chief Risk Officer
Compliance Officer
EXCO
HRC
CC
ISRC
ITSC
ORMC
BC
IC
ALCO
CCO

Notes to the consolidated financial statements (continued) For the year ended 31 December 2014
65Annual Report 2014
32. RISK MANAGEMENT OBJECTIVES AND POLICIES (continued)
32.1 Risk Governance (continued)
Board Committees
a) Credit & Investment Committee (CICO)
The purpose of the CICO is to:
•OverseethequalityoftheGroup’screditandinvestmentsportfolio,thetrendsaffectingthatportfolioandexpressesits
opiniononthesametotheAudit,Risk&ComplianceCommitteeforconsideration;
•Overseetheeffectivenessandadministrationofcredit-relatedpolicies;
•Approveloansandinvestmentsabovemanagementlimits;
•Developinvestmentpoliciesandmonitormanagement’scompliancewiththeinvestmentstrategiesandguidelines;and
•Approvepurchaseanddisposalofassetswithinthelimitsandapprovedstrategicplans.
CICO consists of 6 non-executive Board Members.
CICO held 10 meetings during 2014.
b) Strategy and Transformation Committee (STC)
The Strategy and Transformation Committee (STC) is responsible for assisting the Board of Directors in fulfilling its oversight
responsibilitiesrelatingtotheBank’sstrategicplansandinitiativesinsupportofitsstrategy.
The Strategy and Transformation Committee:
•InitiatesandevaluatestheBank’simplementationplanregularly,onaquarterlybasisatleast.
•InitiatesandevaluatestheBank’soperationalplansinsupportoftheBank’sstrategicplan,including:
i. Expansion strategy (geographical and product offering)
ii. Acquisition Strategy
iii. Opportunities for potential acquisitions
•Initiatesandassessesresponsestoexternaldevelopmentsandfactors,suchaschangesintheeconomy,industrytrends,
competition and technology, which impacts the Banks strategic plan.
The STC comprises of 3 non-executive Board members.
STC held 8 meetings during 2014.
c) Nomination & Remuneration Committee (REMCO)
TheNomination&RemunerationCommitteehasbeenestablishedtoprovideanefficientmechanismforreviewingtheBank’s
compensationarrangementforitsManagementandStaffandmakingrecommendationsfortheBoard’sapprovalonthesematters.
Its primary objectives and responsibilities that are independently undertaken and assumed on behalf of the Board, that may be
amended time to time are as given below but not limited to:
•ReviewthesuccessionplanfortheseniorexecutivesoftheGroup,takingintoaccountthechallengesandopportunities
facingtheGroup,andwhatskillsandexpertisearethereforeneededinthefuture;
•Ensuringthatcompensationprogramsarefairinordertoattract,retainandmotivateitsprofessionalmanagementandstaff
and in adherence to the short, medium and long-term objectives of the Group bearing in mind the risk-taking and market
conditions. Additionally, they must oversee the development of new compensation plans and approve the revision of existing
plans,asandwhenrequired;

Notes to the consolidated financial statements (continued) For the year ended 31 December 2014
66 Commercial Bank of Dubai
32. RISK MANAGEMENT OBJECTIVES AND POLICIES (continued)
32.1 Risk Governance (continued)
Board Committees (continued)
c) Nomination & Remuneration Committee (REMCO) (continued) •ReviewBoardMembers’feesandcommitteefeesfortheBankandanyofitssubsidiariesasappropriate;
•Ensuringthatremunerationpracticesarecompliantwithalllaws/rulesthatareapplicabletothebanksandthatreporting and disclosures pertaining to the same are carried out in a timely manner as regulated by, but not limited to the laws of UAE CentralBank,DubaiFinancialMarket&SecuritiesandCommoditiesAuthority;
•FacilitatingandexpeditingtheimplementationofanyBoarddecisionpertainingtoremuneration; •Recommendingtheremunerationandcompensationoftheseniormanagement; •Determiningthebonuspool,overallincrementpoolforstaffandprepareacompensationrecommendationforpresentation
totheBoardconsideringcertainfactorssuchasBank’sperformanceandshareholderreturn,compensationincomparisontopeersandrewardsgiveninthepastyears;
•RecommendingproposalsforgrantingandexercisingLongTermIncentivePrograms(LTIPs)and/orshareoptionschemes,whereapplicable;and
•ReviewingandapprovingoverallHRpoliciesandstrategy.
The REMCO comprises of 4 non-executive Board members. REMCO held 6 meetings during 2014.
d) Audit, Risk & Compliance Committee (ARCC) The role of the ARCC is to assist the Board of Directors in fulfilling its oversight responsibilities for the integrity of financial
statements and system of internal control and risk management through: •OverseeingtheGroup’sfinancialreportingprocesses,maintainingaccountingpolicies,reviewingandapprovingthefinancial
statement; •Monitoringtheeffectivenessandintegrityoftheriskmanagementframeworkandreviewreportsonriskmanagement; •EvaluatingtheadequacyandeffectivenessoftheGroup’sproceduresandcontrolsforensuringcompliancewithlegaland
regulatoryrequirementsandinternalpolicies; •ManagingtherelationshipwiththeGroup’sexternalauditors; •Supervisinginternalauditors,determiningtheirscopeofwork,ensuringcoordinationbetweenvariousexternalauditing
bodies,reviewingtheperiodicityandscopeofinternalaudit,andtheapprovaloftheirworkingplans; •ReviewingreportsoftheCentralBank,FinancialAuditDepartmentofGovernmentofDubai,internalandexternalauditors,
and following up relevant measures taken to address weaknesses in controls, and non-compliance with laws & regulations, toensurethatmanagementhasinstitutedappropriateremedialmeasures;
•SubmittingrecommendationstotheBoardconcerningthenomination,appointment,terminationandremunerationofthe external auditor and its election by the general assembly, ensuring that the external auditor fulfills the requirements of supervisorybodies,andthatnothingimpairsitsindependencetotheexternalauditor;
•Ensuringtheindependenceoftheinternalauditdepartmenttocarryoutitsduties; •Reviewingreportsontheinternalcontrolsandensuringthesufficiencyandefficiencyoftheinternalcontrolsystemto
avoidanypotentialconflictofinterest,whichmayarisefromtheGroup’stransactionsorcontractsorenteringintoprojectswithrelatedparties,andtoensurethatinternalauditplanscoverthis;
•MonitoringthecompliancesystemsinplacebywhichmanagementdischargesitslegalobligationsinrespectoftheBank’sbusiness;
•Receivinginformationandmonitoringthat‘duediligence’matterswhicharisearebeingreportedtoSeniorManagementandtheBoardandthatthereareappropriatemechanismsinplacefordealingwithsuchmatters;and
•ReviewingcompliancesystemsandprocedureswithintheBanktomonitorthatthereisappropriatedisclosuretotheBoard of areas of operating and non-financial risk.
The ARCC consists of 3 non-executive Board members and an independent non-Board member. ARCC held 7 meetings during 2014.

Notes to the consolidated financial statements (continued) For the year ended 31 December 2014
67Annual Report 2014
32. RISK MANAGEMENT OBJECTIVES AND POLICIES (continued)
32.1 Risk Governance (continued)
Board Committees (continued)
e) Special Credit Committee (SCC) Special Credit Committee was established to review and follow up large exposures of clients in distressed circumstances. SCC
considersanyissuesregardinglargeexposuresandprovisioningwhichmayhaveamaterialimpactupontheBank’sperformance. The responsibilities of the Committee are to:
•FollowupoflargeexposurestoCorporate/Commercialcustomers,fallingunderthecategoriesofWatch-List,Non- Performing Loans (NPLs), Other Loans Especially Mentioned (OLEM) and Stressed Credits.
•Committeemembersmayvisitsuchcustomerswhenevernecessary,tonegotiatespecificdebtrestructuresandrepaymentstopreservetheBank’sinterest.
•Reviewandevaluateadequacyofprovisionsfornon-performingloans(NPLs),classifiedandwatch-listcustomers. •ReviewofhighriskissuesidentifiedbyInternalandExternalAuditorsorCentralBankaswellasAudit,Risk&Compliance
Committee. •ReviewBi-monthlyupdateonRetailCreditandCorporateportfolioperformance •Reviewthecollection/recoveryperformance.
The SCC consists of 3 non-executive Board members and the Chief Executive Officer (CEO) of the Bank. SCC held 5 meetings during 2014.
Management Committees
a) Executive Committee (EXCO) TheroleoftheExecutiveCommittee(EXCO)istoprovidestrategicoversightandleadershipwithregardstotheBank’sbusiness.
EXCOconsidersanyissuesthatmayhaveapotentialmaterialimpactontheBank’sperformance,qualityofbankingservices,risks, control framework and corporate social responsibility.
b) Business Committee (BC)
The Business Committee is responsible for recommending, making decisions for implementing business initiatives, monitoring theBank’soverallperformanceacrossallfunctionsandtoimplementtheBank’sbusinesspolicieswithintheapprovedstrategies.
c) Asset and Liability Committee (ALCO) The objective of ALCO is to drive the most appropriate strategy for the Group in terms of the mix of assets and liabilities given its
expectations of the future and the potential consequences of interest rate movements, liquidity constraints, and foreign exchange exposureandcapitaladequacy.TheALCOisalsoresponsibletoensurethatallstrategiesconformtotheGroup’sriskappetiteand levels of exposure as determined by the Board of Directors.
The terms of reference of ALCO include the following:
Developing an effective asset and liability management process and related procedures to oversee and monitor the
Group’sapprovedpoliciesandproceduresinrelationtothemanagementandcontrolofthefollowingrisks:
- Liquidity risk –beingtheriskoftheGroup’sinabilitytomeetobligationswhentheybecomeduewithoutincurring
unacceptable lossesbecauseofaninabilitytoliquidateassetsortoobtainadequatefunding; - Market risk – being the following risks:
•Therisktoearningsfromadversemovementsininterestrates,exchangeratesandmarketvolatility;and
•Theriskfromchangesinthevalueofportfoliooffinancialinstruments.
Notes to the consolidated financial statements (continued) For the year ended 31 December 2014
68 Commercial Bank of Dubai
32. RISK MANAGEMENT OBJECTIVES AND POLICIES (continued)
32.1 Risk Governance (continued)
Management Committees (continued)c) Asset and Liability Committee (ALCO) (continued)
- Statement of financial position risk - being the following risks:
•Therisktoearningsfromchangesininterestratesandmarketvolatilityinretailandwholesalerates; •Therisktovalueandcapitalfromchangesinthevalueofassetsandliabilitiesasaresultofchangesininterestrates andmarketvolatility; •Theriskfrommaterialchangesinglobalanddomesticeconomicconditionsgenerally;and •Considerdepositandloanproductsandtheirimpactonthestatementoffinancialposition.Inparticular,consider
the pricing and maturity distributions of deposits, loans and investments. Overseeing the installation and maintenance of information systems that supplies, on a timely basis, the information and
data necessary for the ALCO to fulfill its roles and responsibilities.
d) Credit Committee (CC)
TheBoardofDirectorshasdelegatedresponsibility for themanagementofcertain levelsofcredit risk to theGroup’sCreditCommittee(CC),whichisresponsibleforoversightoftheGroup’screditriskincluding:
• Formulatingcreditpoliciesinconsultationwithbusinessunits,coveringcollateralrequirements,creditassessment,risk gradingandreporting,documentaryandlegalproceduresandcompliancewithregulatoryandstatutoryrequirements;
• Establishinganauthorizationstructureandlimitsfortheapprovalandrenewalofcreditfacilities.Lendingauthorities have been established at various levels together with a framework of dual/multiple credit approval delegated authorities.
LargerfacilitiesrequireapprovalbytheCCand/ortheBoardofDirectors,asappropriate; • Establishinglimits-actuallevelsofexposureareregularlyreviewedatCCorBoardlevel,asappropriate; • Limitingconcentrationsofexposuretoindustrysectors,geographiclocationsandcounterparties; • Designingcreditreviewproceduressoastoidentify,atanearlystage,exposureswhichrequiremoredetailedmonitoring
andreview; • DevelopingandmaintainingtheGroup’sriskgradingineachcategoryofexposuresaccordingtothedegreeofriskof
financial loss faced and to ensure focus of management on the attendant risks. The risk grading system is used in determining whether impairment provisions may be required against specific credit exposures. The current risk grading framework consists
of fourteen grades reflecting varying degrees of risk of default and the availability of collateral or other credit risk mitigation. The responsibility for setting risk grades lies with the Credit and Investment Committee (CICO) and is subject to regular
reviewsbytheRiskManagementDepartment;and • Reviewingcompliance,onanongoingbasis,withagreedexposurelimitsrelatingtocounterparties,industriesandcountries
and reviewing limits in accordance with risk management strategy and market trends.
e) IT Steering Committee (ITSC) TheITSCprovidesstrategicandtacticalguidanceformanagingtheGroup’soveralltechnologyplatforminthelongandshort
term, to ensure that Information Technology (IT) initiatives are consistent with the strategic business goals of the Group. The ITSC is charged with:

Notes to the consolidated financial statements (continued) For the year ended 31 December 2014
69Annual Report 2014
32. RISK MANAGEMENT OBJECTIVES AND POLICIES (continued)
32.1 Risk Governance (continued)
Management Committees (continued)e) IT Steering Committee (ITSC) (continued)
• ReviewingtheGroup’sITdevelopment,strategicopportunitiesandplans;
• Providingguidanceintheprioritizationandimplementationoftechnologyinitiativesandprojects(includingthoserelatedto
infrastructure);
• ReviewingIToperations’effectiveness;
• Reviewingbusinesscontinuityplans,policiesandreportsrelatingtotheeffectivenessofbusinesscontinuity,their
implementationandmeasurestakentoaddressanyresidualrisks;and
• ApprovingITBudgets.
f) Human Resources Committee (HRC)
The purpose of the HRC is to set strategy and policy in the following areas:
• Organization development in terms of structure, professional ethics, annual business strategy, business focused succession
planning.
• Staffing in terms of Emiratisation, optimal headcount/manpower distribution, review sourcing process, policies & strategies,
review the approved agencies.
• Training and Development ensuring the timely conduct of training, approve specialized development programs, review
financial budget for training & development and ensure it has been used extensively for this purpose.
• Compensation & Reward Management supporting the Nomination & Remuneration Committee, ensure jobs are graded
based on the Job Evaluation System, ensure incentive scheme, revision of salary structure, changes in the allowances,
benefits & facilities and other rewards reaches employees.
• Employee Services ensuring that employee grievances are timely resolved, effective implementation of Staff Suggestion
scheme, Employee Satisfaction Survey and outstanding performance awards.
g) Investment Committee (IC)
TheICisresponsibleforoverseeingandmanagingtheBank’sproprietaryinvestments,inbothfixedincomeandequitysecurities,
in accordance with the investment policy and guidelines.
TheIC’skeyresponsibilitiesare:
• Approvingandamendingthepoliciesandguidelines;
• ReviewingandapprovingInvestmentGroup/Treasury’sproposedinvestmentrecommendations;
• Reviewingandevaluatingperformanceofportfoliosagainstbenchmarks;and
• Reviewingtheportfolio’scontinuedcompliancewithregulatoryguidelines.
h) Compliance Committee (CCO)
The CCO primarily ensures the prevention of money laundering and terrorism financing in adherence and compliance with
the relevant regulations set by regulatory authorities, applicable to the Bank. It oversees the monitoring and implementation of
policies and procedures related to compliance and AML. CCO members duties include but are not limited to:
Assessing and approving reports prepared by Head of Compliance and AML regarding suspicious transactions in
staff & customer accounts/credit cards & internal and external fraud cases and subsequently taking appropriate
correctiveactionthroughinvestigation,policeandcourtactionwherevernecessary;

Notes to the consolidated financial statements (continued) For the year ended 31 December 2014
70 Commercial Bank of Dubai
32. RISK MANAGEMENT OBJECTIVES AND POLICIES (continued)
32.1 Risk Governance (continued)
Management Committees (continued)h) Compliance Committee (CCO) (continued)
Reviewingthehigherriskcustomers,likenon-residents,free-zonesentities,politicallyexposedpersons(PEP’s)and
others as defined by our “Know Your Customer (KYC) and Anti-money Laundering (AML) Policies & Procedures”,
and provides the suitable guidance.
i) Information Security Risk Committee (ISRC)
TheCommitteeprovidesastrategicandtacticalguidanceformanagingtheBank’soverallinformationsecurityandITrisksin
the long and short term, to ensure adherence with applicable regulations and standards, compliance with internal policies and
managementofITriskstoprotecttheBank’sbusiness,supportingstrategicbusinessgoals.
ISRC is charged with assisting the Board in:
• ReviewingtheBank’sInformationSecurity&RiskPlans
• Providingguidanceintheprioritizationandimplementationofinformationsecuritypoliciesandcontrols
• ReviewingofInformationSecurity&RiskpoliciesandreportsrelatingtotheeffectivenessoftheInformationSecurity,their
implementation and measures taken to address any residual risks
• Reviewingsecurityincidents,threatsandtrendsinordertoprovidestrategicguidanceofriskevaluation,acceptanceand
treatment plans.
j) Operational Risk Management Committee (ORMC)
The purpose of ORMC is to maintain oversight of the operational risks identified across the Bank by all relevant units like
Operational Risk Management Department, Internal Control Department and Internal Audit. The key responsibilities of ORMC
are:
• Tomaintainoversightofbankwideoperationrisks
• Toperformtimelyreviewsofoperationalrisks,reportsandissues
• Toanalyzetherootcauseforreoccurringoperationalriskissuesandrecommendationtoaddressthesame
• Tobetheescalationpointforkeyoperationalrisks
• Toperformreviewsofoperationalriskpoliciesandprocedures
32.2 Control Environment
a) Group Risk
Group Risk Department comprises credit, market, operational and IT risks units. Its responsibilities include the following:
• Developingastrategy,policyandframeworkforriskmanagementsuchthatthesearealignedwithbusinessrequirements;
• ProvidingsupporttotheGroupinimplementationoftheframework;
• BringingtogetheranalysisofriskconcentrationsandsensitivitiesacrosstheGroup;
• Actingasapointofreferenceforriskandcontrolmatters,providingadvicetomanagement,sharingbestpracticesand
carryingoutspecialreviewsasdirectedbyALCO;and
• Providingindependentassessmentof,andchallengetothebusinessareas’riskmanagementandprofilestoensurethatthey
are maintained in a robust manner.

Notes to the consolidated financial statements (continued) For the year ended 31 December 2014
71Annual Report 2014
32. RISK MANAGEMENT OBJECTIVES AND POLICIES (continued)
32.2 Control Environment (continued)
b) Internal Audit and Anti –fraud function
The role of the Internal Audit Department within the Group is to provide independent and objective assurance that the process
for identifying, evaluating and managing significant risks faced by the Group is appropriate and effectively applied. In addition,
italsoprovidesanindependentcheckonthecompliancewithlawsandregulationsandmeasuringcompliancewiththeGroup’s
policies and procedures. Additionally, Internal Audit provides consulting services which are advisory in nature, and are generally
performed at the specific request of the ARCC or Senior Management.
It is led by the Head of Internal Audit who reports to the ARCC of the Board of Directors, with administrative reporting to the
Chief Executive Officer.
To perform its role effectively, Internal Audit has organizational independence from management, to enable unrestricted
evaluation of management activities and personnel. The Internal Audit Charter empowers it to have full, free and effective access
at all reasonable times to all records, documents and employees of the Group. Further, Internal Audit has direct access to the
Chairman of the Audit, Risk & Compliance Committee.
To determine whether the Internal Audit Function is functioning effectively, the ARCC shall:
• AssesstheappropriatenessoftheInternalAuditCharteronceeachyear;
• Assesstheadequacyofresourcesavailable,bothintermsofskillsandfundingonceeachyear;and
• Sponsorexternalassessments,atleastonceeverythree(3)years,byaqualified,independentreviewerfromoutsidetheGroup.
Anti-fraud function
The bank has a dedicated Fraud Prevention and Investigation Unit that assists in identification, detection, and verification of
potential or actual fraud incidents including quantification and recoupment of any losses sustained as a result of such incident.
Thepurposeistomanagesusceptibilityofbank’sassetsandprocessestofraudriskwithaviewtoreducingitandtoraisethe
level of fraud awareness amongst employees and other stakeholders.
The Fraud Prevention and Investigations Unit is led by a Head of Fraud Prevention and Investigations, which forms part of
Internal Audit having reporting line to ARCC through the Head of Internal Audit.
c) Internal Control
Board of Directors and Executive Management are responsible for developing and maintaining the existence of a sound Internal
ControlSystemandproceduresthatmeet internationalstandardsandfulfill therequirementsof theGroup’smanagementand
external regulatory bodies. The internal control system should be capable of ensuring the achievement of the following:
• AccuracyandintegrityoffinancialandoperationalstatementsissuedbytheGroup;
• EffectivenessandefficiencyoftheGroup’soperationalactivities;
• EffectivenessofmeasuresandproceduressettosafeguardtheGroup’sassetsandproperties;and
• Compatibilitywithlaws,legislationsandregulationsinforceaswellaspoliciespertinenttointernaloperationalprocedures.
Executive management constantly monitors and assesses the efficiency and effectiveness of internal control procedures and their
ability to achieve stated objectives and their furtherance and enhancement.
The Internal Control Department reports to the Chief Operating Officer (COO). The functions and responsibilities of the Internal
Control Department include but not limited to:

Notes to the consolidated financial statements (continued) For the year ended 31 December 2014
72 Commercial Bank of Dubai
32. RISK MANAGEMENT OBJECTIVES AND POLICIES (continued)
32.2 Control Environment (continued)c) Internal Control (continued) • EnsuringthattheGroup’soperationalpolicies,processesandcontrolsareadheredto; • Ensuringthatproperinternalcontrolsareinplaceandthattheyarefunctioningasdesignedinatimelyandeffectivemanner; • PeriodicreviewoftheGroup’sinternalcontrolsysteminordertoidentifyareaswhereinternalcontrolsmaybeweak,not
present and areas where there appear to be excessive controls resulting in operational inefficiency so as to suggest ways to rectifythesame;
• Enablingthemanagementtoconductanannualreviewoftheefficiencyoftheinternalcontrolsystemandreportits findings;and
• Followingupoftheoperationalactivitiesfromapreventiveperspectiveandoverseeingoperationalcontrolsbeingexercised to ensure that these are timely and effective.
d) Compliance The process of monitoring compliance is considered an independent task it aims at ensuring that the Group and its internal
policies are in compliance with all applicable laws, regulations, instructions, directives, codes of conduct and sound banking standards and practices as issued by relevant authorities.
The Board of Directors takes necessary measures to further the values of integrity and sound professional conduct within the Group promoting a culture of compliance in latter and spirit with the applicable laws, regulations, instructions and standards that constitute a primary goal that must be achieved.
The overall mission and role of compliance department is to: • ensuringcompliancerisksareadequatelyidentified,assessed,monitoredandcontrolledinconjunctionwithBusinessand
othercontrolfunctions; • ensuringseniormanagementisfullyinformedofsignificantcomplianceissuesandplansforresolution; • contributingtoa“nosurprise”complianceculturebyeducatingandcommunicatingcomplianceawarenessthroughoutthe
Group; •aligningannualcomplianceplanswithbusinessstrategiesandgoals;and • meetregulatoryexpectations.
e) Whistle Blowing A set of arrangements has been designed to enable employees to confidentially report concerns about any potential violations,
enabling the investigation and follow up of such concerns independently and discreetly through the whistle blowing policy. Such arrangements are supervised by the ARCC and in coordination with the executive management.
32-3 Disclosure Policy
The Group has laid down the disclosure policy to ensure compliance with all regulations and guidelines issued by the lead regulator Central Bank of the UAE (CBUAE), International Financial Reporting Standards (IFRS), Securities and Commodities Authority (SCA) and Dubai Financial Market (DFM).
ThefollowingarethekeyfeaturesoftheGroup’sdisclosurepolicyconcerningdisclosureoffinancialinformation:
a) Materiality thresholds Information is material if its omission or misstatement could influence the economic decisions of users taken on the basis of
financial statements. Materiality depends on the size of the item or error judged in the particular circumstances of its omission or misstatement, and / or any material information that might affect the share price. The Group, in order to ensure adequate disclosurelaysdownqualitativematerialitythreshold,sothatnomaterialinformationisomittedormisstated;atthesametimeit does not jeopardize its competitive position.
Notes to the consolidated financial statements (continued) For the year ended 31 December 2014
73Annual Report 2014
32. RISK MANAGEMENT OBJECTIVES AND POLICIES (continued)
32.3 Disclosure Policy (continued)b) Control framework In order to ensure true and fair disclosure, the Group has established controls including detailed procedures for finalization and
review of financial disclosures. In addition, the consolidated financial statements are subject to a quarterly review and year end auditproceduresbytheGroup’sexternalauditors.
c) Frequency and medium of disclosure Interim financial results are disclosed on a quarterly basis while complete consolidated financial statements complying with
the requirements of IFRS, Basel II Pillar 3, relevant laws of the U.A.E, SCA requirement and other guidelines from CBUAE, disclosures of material non-public financial information are made as follows:
• UploadingquarterlyreviewedandannualauditedconsolidatedfinancialstatementsalongwithDirectors’reporttoDFMand SCAwebsites;
• PostingquarterlyandannualconsolidatedfinancialstatementsontheGroup’swebsite; • PublishingofannualauditedconsolidatedfinancialstatementsinbothArabicandEnglishnewspapersaftertheapprovalof
theCentralBankofUAEandtheShareholdersattheAnnualGeneralMeeting(AGM); • ManagementdiscussionandanalysisinArabicandEnglishnewspapersinamannerthatensureswidedissemination;and • Publicationoftheannualreportwhichincludesauditedconsolidatedfinancialstatements.
33. Financial Risk Management
a) Introduction and overview The Group has exposure to the following primary risks: • Creditrisk • Liquidityrisk • Marketrisk • Operationalrisk
RiskisinherenttotheGroup’sbusinessandactivities.TheGroup’sabilitytoidentify,assess,monitorandmanageeach type of risk to which the Group is exposed is an important factor in its financial stability, performance and reputation.
TheGroup’sriskmanagementpoliciesareestablishedtoidentifyandanalyzetherisksfacedbytheGroup,tosetappropriate risk limits and controls, and to monitor risks and adherence to limits. Risk management policies and systems are reviewed regularly to reflect changes in market conditions, products and services offered. The Group, through its training and management standards and procedures, aims to develop a disciplined and constructive control environment, in which all employees understand their roles and obligations.
TheGroupAudit, Risk&Compliance Committee (ARCC) is responsible formonitoring compliancewith theGroup’s riskmanagement policies and procedures, and for reviewing the adequacy of the risk management framework in relation to the risks facedbytheGroup.TheGroups’ARCCisassistedinthesefunctionsbyInternalAudit,whichundertakesbothregularandad-hocreviews of risk management controls and procedures, the results of which are reported to the Group ARCC.
ThisnotepresentsinformationrelatingtotheGroup’sexposuretoeachoftheaboverisks,theGroup’sobjectives,policiesandprocessesformeasuringandmanagingrisk,andtheGroup’smanagementofcapital.
b) Credit risk Credit risk is the risk of financial loss to the Group if a customer or counterparty to a financial instrument fails to meet its
contractualobligationsarisingprincipallyfromtheGroup’sloansandadvances,Islamicfinancing,amountsduefrombanksandinvestment in debt securities. For reporting purpose credit risk on Islamic financing is reported as component of credit risk on loans and advances. For risk management purposes, credit risk arising on trading investments is managed independently.

Notes to the consolidated financial statements (continued) For the year ended 31 December 2014
74 Commercial Bank of Dubai
33. Financial Risk Management (continued)
b) Credit risk (continued) (i) Management of credit risk Credit Committee (CC) manages the credit risk of the Group by continuous review and update of credit limits, credit policies,
process and frame-work, the approval of specific exposures and work out proposals, constant revaluation of the loans portfolio and the sufficiency of provisions thereof. For details on Credit Risk management please refer to note 32.1 management committees-d.
(ii) Impaired loans and advances, Islamic financing and investment in debt securities Individually impaired loans and advances, Islamic financing and investment in debt securities are financial assets for which the
Group determines that there is objective evidence of impairment and it is probable that it will be unable to collect all principal and interest due according to the contractual terms of the agreements.
The Group Credit Risk Rating Methodology, which has been internally developed based on actual historical data, is in line with
the requirements set-out in the Basel II Accord and has a 14- grades frame-work, whereby: • Thefirst9gradesareassignedtonon-defaultingborrowers/performingaccounts; • Grade10reflectsirregularaccounts;and • Thelast4gradesarefordefaultingborrowers/non-performingaccounts.
Grades Asset quality Risk significance1 Standard Good, top performing assets and debt securities with External Credit Assessment
(ECA) of “A” and better than “A” and unrated bonds internally assessed as top performing.
2-5 Standard Good, above average performing assets6-9 Standard Good, below average performing assets10 Standard Watch-list loans / performing11-12 Substandard Substandard - Interest Suspended / Specific provision starts / non-performing13 Doubtful Doubtful of recovery / non-performing14 Loss Loss (fully provided for, and written off) / non-performing
Themethodologyprovidesamulti-dimensionalapproachtotheGroup’sCreditRiskRating,wherecreditisassessedandratedon 2 dimensions, as follows:
• 1stDimension:whichassesses/ratestheborrower’sprobabilityofDefault(PD);and • 2ndDimension:whichassesses/ratesthefacilityandtheLoss-GivenDefault(LGD). Both dimensions create a Credit-Risk Rating Grid/Matrix which plays a key role in pricing, approval, and credit monitoring. In
order to achieve this, the Group has priced facilities using Risk Adjusted Return on Capital (RAROC), which leads to the Basel II compliance.
(iii) Past due but not impaired loans These are the loans where contractual interest or principal payments are past due, but the Group believes that impairment is not
appropriate on the basis of the level of security/collateral available and/or the stage of collection of amounts owed to the Group.
(iv) Loans with renegotiated terms Loans with renegotiated terms include loans, the repayment plan of which have been rescheduled with no other concession in
amount or rate of interest. Rescheduling activity is designed to manage customer relationships. Following rescheduling, an overdue account will normally be reset from delinquent to current status. Rescheduling is done based on indications or criteria which, in the opinion of management, evidence the probability that payment will continue. Management continuously monitors the progress on renegotiated loans to ensure compliance with the terms at all times.
(v) Restructured performing loans / under restructuring Restructured performing loans or loans under restructuring represent loans, whose terms have been restructured or are under
restructuringandinvolveaconcessioninrateofinterest.Theseloansarenotdelinquent;howeverappropriateimpairmentlossisrecognized on such loans.
At 31 December 2014 restructured performing loans and loans under restructuring amount to AED 691 million (2013: AED 693 million).

Notes to the consolidated financial statements (continued) For the year ended 31 December 2014
75Annual Report 2014
33. FINANCIAL RISK MANAGEMENT (continued)
b) Credit risk (continued) (vi) Exposure to credit risk The Group measures its exposure to credit risk by reference to gross carrying amount of financial assets less interest suspended
and impairment losses, if any.
Loans and receivables Due from banks Debt securities 2014 2013 2014 2013 2014 2013 AED’000 AED’000 AED’000 AED’000 AED’000 AED’000
Neither past due nor impaired Grades 1: good, top performing assets 8,587,292 6,647,316 1,565,312 1,662,172 2,595,551 2,616,387Grade 2-9: good, performing assets 19,825,710 20,168,056 - - 2,560,751 1,320,438 Grade 10: watch- list loans /performing 3,041,881 2,242,118 - - - - ––––––––––––––––––––––––––––––––––––––––––––––––––––––––––––––––––––––––––––––––––––––––––––––––––––––––––––Carrying amount 31,454,883 29,057,490 1,565,312 1,662,172 5,156,302 3,936,825––––––––––––––––––––––––––––––––––––––––––––––––––––––––––––––––––––––––––––––––––––––––––––––––––––––––––––Past due but not impaired In Grade 1 to 10 Less than 30 days 260,968 81,958 - - - - 30 – 60 days 48,190 29,733 - - - - 60 – 90 days 26,717 12,229 - - - - Over 90 days 218,131 664,380 - - - - ––––––––––––––––––––––––––––––––––––––––––––––––––––––––––––––––––––––––––––––––––––––––––––––––––––––––––––Carrying amount 554,006 788,300 - - - - ––––––––––––––––––––––––––––––––––––––––––––––––––––––––––––––––––––––––––––––––––––––––––––––––––––––––––––Individually impaired Grade 11: Substandard (a) 119,453 87,250 - - - - Grade 12: Substandard (b) 767,669 817,654 - - - - Grade 13: Doubtful 1,798,673 1,813,551 - - - - Grade 14: Loss 225,568 295,962 - - - - ––––––––––––––––––––––––––––––––––––––––––––––––––––––––––––––––––––––––––––––––––––––––––––––––––––––––––––Carrying amount 2,911,363 3,014,417 - - - - ––––––––––––––––––––––––––––––––––––––––––––––––––––––––––––––––––––––––––––––––––––––––––––––––––––––––––––Impaired on portfolio basis - Retail Grade 11: Substandard (a) 14,154 3,352 - - - -Grade 12: Substandard (b) 59,554 283,856 - - - - Grade 13: Doubtful 243,944 6,383 - - - - Grade 14: Loss 13,360 26,156 - - - - ––––––––––––––––––––––––––––––––––––––––––––––––––––––––––––––––––––––––––––––––––––––––––––––––––––––––––––Carrying amount 331,012 319,747 - - - - ––––––––––––––––––––––––––––––––––––––––––––––––––––––––––––––––––––––––––––––––––––––––––––––––––––––––––––Less: deferred credits (47,107) (62,346) - - - -––––––––––––––––––––––––––––––––––––––––––––––––––––––––––––––––––––––––––––––––––––––––––––––––––––––––––––Total carrying amount 35,204,157 33,117,608 1,565,312 1,662,172 5,156,302 3,936,825––––––––––––––––––––––––––––––––––––––––––––––––––––––––––––––––––––––––––––––––––––––––––––––––––––––––––––Specific provision for impairment (1,576,137) (1,523,066) - - - - Portfolio provision for impairment related to (iv) above (76,072) (84,604) - - - - Specific provision for individually Restructured loans and under restructuring/OLEM (361,871) (270,076) - - - - Interest in suspense (497,642) (478,482) - - - - Collective provision for impairment related to (i) and (ii) above (525,219) (473,995) - - - - ––––––––––––––––––––––––––––––––––––––––––––––––––––––––––––––––––––––––––––––––––––––––––––––––––––––––––––Total provisions for impairment (3,036,941) (2,830,223) - - - - ––––––––––––––––––––––––––––––––––––––––––––––––––––––––––––––––––––––––––––––––––––––––––––––––––––––––––––Carrying amount net of impairment 32,167,216 30,287,385 1,565,312 1,662,172 5,156,302 3,936,825===========================================================================================================
(i)
(ii)
(iii)
(iv)
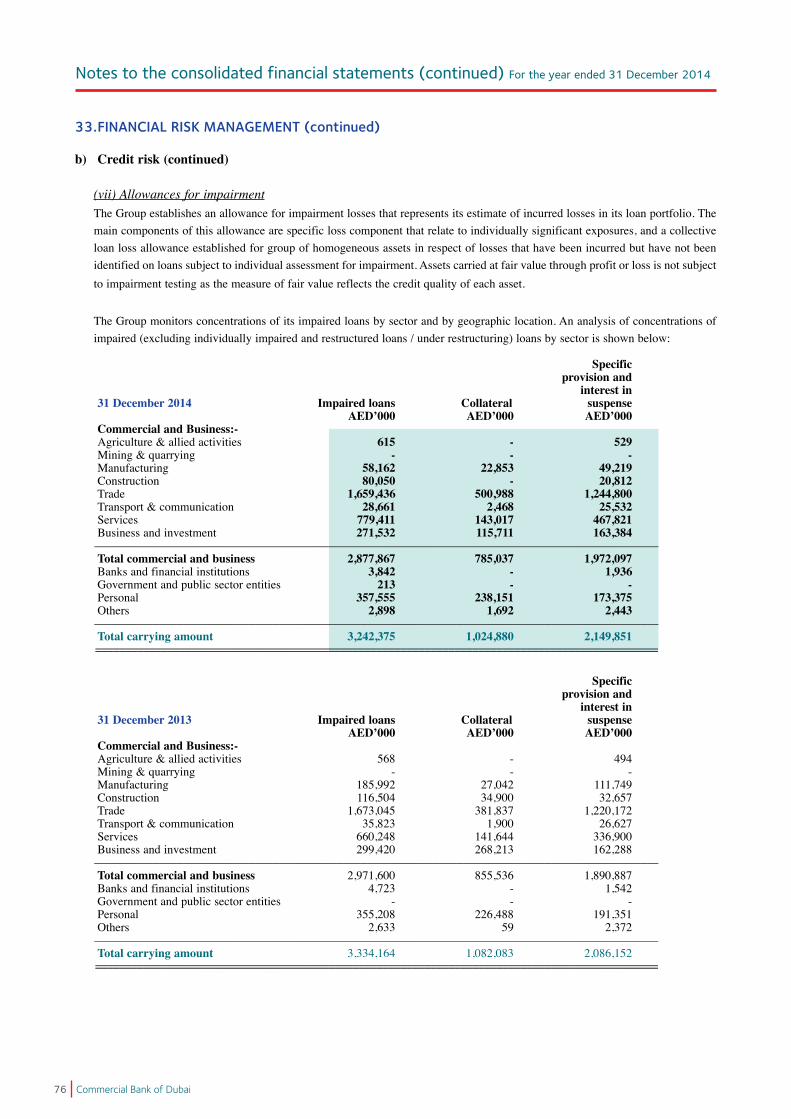
Notes to the consolidated financial statements (continued) For the year ended 31 December 2014
76 Commercial Bank of Dubai
33. FINANCIAL RISK MANAGEMENT (continued)
b) Credit risk (continued)
(vii) Allowances for impairment The Group establishes an allowance for impairment losses that represents its estimate of incurred losses in its loan portfolio. The
main components of this allowance are specific loss component that relate to individually significant exposures, and a collective loan loss allowance established for group of homogeneous assets in respect of losses that have been incurred but have not been identified on loans subject to individual assessment for impairment. Assets carried at fair value through profit or loss is not subject to impairment testing as the measure of fair value reflects the credit quality of each asset.
The Group monitors concentrations of its impaired loans by sector and by geographic location. An analysis of concentrations of impaired (excluding individually impaired and restructured loans / under restructuring) loans by sector is shown below:
Specific provision and interest in 31 December 2014 Impaired loans Collateral suspense AED’000 AED’000 AED’000 Commercial and Business:- Agriculture & allied activities 615 - 529 Mining & quarrying - - - Manufacturing 58,162 22,853 49,219 Construction 80,050 - 20,812 Trade 1,659,436 500,988 1,244,800 Transport & communication 28,661 2,468 25,532 Services 779,411 143,017 467,821 Business and investment 271,532 115,711 163,384
–––––––––––––––––––––––––––––––––––––––––––––––––––––––––––––––––––––––––––––––––––––––––––––––Total commercial and business 2,877,867 785,037 1,972,097 Banks and financial institutions 3,842 - 1,936 Government and public sector entities 213 - - Personal 357,555 238,151 173,375 Others 2,898 1,692 2,443
–––––––––––––––––––––––––––––––––––––––––––––––––––––––––––––––––––––––––––––––––––––––––––––––Total carrying amount 3,242,375 1,024,880 2,149,851
==============================================================================================
Specific provision and interest in 31 December 2013 Impaired loans Collateral suspense AED’000 AED’000 AED’000Commercial and Business:-Agriculture & allied activities 568 - 494 Mining & quarrying - - - Manufacturing 185,992 27,042 111,749 Construction 116,504 34,900 32,657 Trade 1,673,045 381,837 1,220,172 Transport & communication 35,823 1,900 26,627 Services 660,248 141,644 336,900 Business and investment 299,420 268,213 162,288
–––––––––––––––––––––––––––––––––––––––––––––––––––––––––––––––––––––––––––––––––––––––––––––––Total commercial and business 2,971,600 855,536 1,890,887 Banks and financial institutions 4,723 - 1,542 Government and public sector entities - - - Personal 355,208 226,488 191,351 Others 2,633 59 2,372
–––––––––––––––––––––––––––––––––––––––––––––––––––––––––––––––––––––––––––––––––––––––––––––––Total carrying amount 3,334,164 1,082,083 2,086,152
==============================================================================================

Notes to the consolidated financial statements (continued) For the year ended 31 December 2014
77Annual Report 2014
33. FINANCIAL RISK MANAGEMENT (continued)
b) Credit risk (continued)
(vii) Allowances for impairment (continued) In addition to the specific provision, the Group held AED 525 million (31 December 2013: AED 474 million) as collective
provisions.
All impaired loans are located in one geographic area i.e. the United Arab Emirates. The value of collateral is restricted to lower of loan exposure or realizable value of the collateral.
Unfunded exposures pertaining to impaired loans amounted to AED 93.2 million (31 December 2013: AED 73.9 million). Set out below is an analysis of the gross and net (of provisions for impairment) amounts of individually impaired assets by risk
grade; Specific provision and interest in 31 December 2014 Gross suspense Net AED’000 AED’000 AED’000
Grade11&12: Substandard (a & b) 887,122 382,977 504,145 Grade 13: Doubtful 1,798,673 1,453,084 345,589 Grade 14: Loss 225,568 224,178 1,390
––––––––––––––––––––––––––––––––––––––––––––––––––––––––––––––––––––––––––––––––––––––––––––––-Total 2,911,363 2,060,239 851,124 ==============================================================================================
31 December 2013
Grade11&12: Substandard (a & b) 904,904 307,811 597,093 Grade 13:Doubtful 1,813,551 1,328,151 485,400 Grade 14: Loss 295,962 288,985 6,977
––––––––––––––––––––––––––––––––––––––––––––––––––––––––––––––––––––––––––––––––––––––––––––––-Total 3,014,417 1,924,947 1,089,470 ==============================================================================================
In addition to specific provisions and interest in suspense the Group also holds collaterals against the non-performing loans.
Realizable value of these collaterals is taken into account to calculate provision requirement.
(viii) Write - off policy The Group writes off a loan / investment in debt security (and any related allowances for impairment) when the Group Credit
Committee determines that the loan / security is uncollectible. This determination is reached after considering information such asthesignificantdeteriorationintheborrower’s/issuer’sfinancialpositionsuchthattheborrower/issuercannolongerpaytheobligation, or proceeds from collateral will not be sufficient to pay back the entire exposure or all possible efforts of collecting the amounts have been exhausted.
For smaller balances of standardized loans, write off decisions are generally based on a product-specific past due status. (ix) Collateral The Group holds collateral against loans and advances in the form of cash, guarantees, mortgages and liens over properties or
other securities over assets. Estimates of fair value are based on the value of collateral assessed at the time of borrowing, and are subsequently monitored and updated on a periodic basis. Generally, collateral is not held against debt securities and amounts due from banks, and no such collateral was held at 31 December 2014 or 2013.

Notes to the consolidated financial statements (continued) For the year ended 31 December 2014
78 Commercial Bank of Dubai
33. FINANCIAL RISK MANAGEMENT (continued)
b) Credit risk (continued)
Analysis of collateral by type is presented in the following table:
2014 2013 AED’000 AED’000 Pledged deposits 1,776,112 1,751,783 Properties 12,082,269 9,052,507 Hypothecation & mortgages 1,017,023 355,738 Pledge of shares 689,687 710,974 Government and bank guarantees 255,919 846,981 Bills discounted-cheques 716,090 623,167 Others 295,423 394,360 ––––––––––––––––––––––––––––––––––––––––––––––––––––––––––––––––––––––––––––––––––––––––––– Total collaterals 16,832,523 13,735,510 ==========================================================================================
The above represents collateral value restricted to the lower of loan balance or collateral value.
(x) Concentration Concentrations arise when a number of counterparties are engaged in similar business activities or activities in same geographic
region or have similar economic features that would cause their ability to meet contractual obligations to be similarly affected by changes in economic, political or other conditions. The following tables set out the concentration of credit risk by sector, geography and currency.
Concentration of credit risk by sector for 2014
Cash, Loans and Equity balances Contingent advances Securities with Central Total liabilities and Islamic Due from Debt and fund of bank and funded Undrawn and financing banks securities funds other assets exposures commitments acceptances AED’000 AED’000 AED’000 AED’000 AED’000 AED’000 AED’000 AED’000Concentration by sector Commercial and Business:- Agriculture & allied activities 43,206 - - - - 43,206 54,018 40,287Mining & quarrying 65,706 - - - - 65,706 3,080 1,274Manufacturing 1,156,073 - 18,493 - - 1,174,566 421,036 442,122Construction 2,329,036 - - - - 2,329,036 964,215 429,407Trade 8,508,367 - - - - 8,508,367 3,183,250 2,953,420Transport & communication 308,786 - - 9,007 - 317,793 128,913 196,762Services 5,326,976 - - 76,683 - 5,403,659 2,497,019 4,104,894Business and investment 9,034,415 - 159,529 10,139 - 9,204,083 1,921,297 65,343––––––––––––––––––––––––––––––––––––––––––––––––––––––––––––––––––––––––––––––––––––––––––––––––––––––––––––Total commercial and Business 26,772,565 - 178,022 95,829 - 27,046,416 9,172,828 8,233,509Banks and financial institutions 645,050 1,565,312 2,887,772 335,867 84,590 5,518,591 298,026 471,693Government and public sector entities 3,633,307 - 2,090,508 - 5,004,463 10,728,278 1,779,481 88,395Personal-schematic 3,929,180 - - - - 3,929,180 559,719 22,264Others 224,055 - - - 1,435,330 1,659,385 90,872 28,038––––––––––––––––––––––––––––––––––––––––––––––––––––––––––––––––––––––––––––––––––––––––––––––––––––––––––––Total carrying amount 35,204,157 1,565,312 5,156,302 431,696 6,524,383 48,881,850 11,900,926 8,843,899===========================================================================================================

Notes to the consolidated financial statements (continued) For the year ended 31 December 2014
79Annual Report 2014
33. FINANCIAL RISK MANAGEMENT (continued)
b) Credit risk (continued)
(x) Concentration (continued)
Concentration of credit risk by sector for 2013
Cash, Loans and Equity balances Contingent advances Securities with Central Total liabilities and Islamic Due from Debt and fund of bank and funded Undrawn and financing banks securities funds other assets exposures commitments acceptances AED’000 AED’000 AED’000 AED’000 AED’000 AED’000 AED’000 AED’000
Concentration by sector Commercial and Business:- Agriculture & allied activities 99,424 - - - - 99,424 60,405 82,861Mining & quarrying 76,450 - - - - 76,450 471,466 3,003Manufacturing 1,037,578 - - - - 1,037,578 862,306 333,737Construction 2,790,517 - - 361 - 2,790,878 350,281 244,636Trade 8,067,592 - - - - 8,067,592 3,117,067 2,929,833Transport & communication 499,498 - - - - 499,498 400,647 209,418 Services 4,964,752 - - - - 4,964,752 1,886,070 2,936,642Business and investment 7,049,932 - 181,951 551 - 7,232,434 1,288,140 50,851––––––––––––––––––––––––––––––––––––––––––––––––––––––––––––––––––––––––––––––––––––––––––––––––––––––––––––Total commercial and Business 24,585,743 - 181,951 912 - 24,768,606 8,436,382 6,790,981Banks and financial institutions 421,160 1,662,172 2,007,659 290,916 72,862 4,454,769 213,517 395,152Government and public sector entities 4,702,193 - 1,747,215 - 5,688,578 12,137,986 119,296 46,385Personal-schematic 2,894,867 - - - - 2,894,867 637,662 19,531Others 513,645 - - - 1,473,914 1,987,559 520,859 78,177––––––––––––––––––––––––––––––––––––––––––––––––––––––––––––––––––––––––––––––––––––––––––––––––––––––––––––Total carrying amount 33,117,608 1,662,172 3,936,825 291,828 7,235,354 46,243,787 9,927,716 7,330,226===========================================================================================================
Acceptancesarepartofunfundedexposures;inlinewiththeBaselII,Pillar3disclosurerequirements.
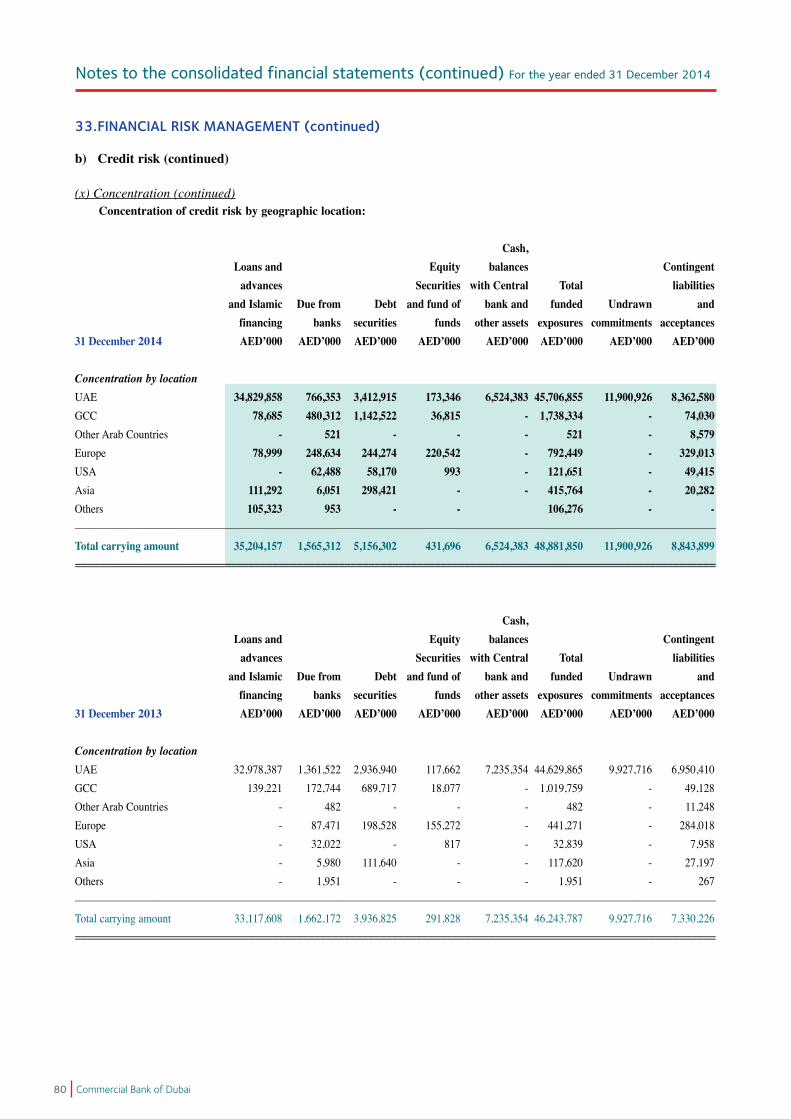
Notes to the consolidated financial statements (continued) For the year ended 31 December 2014
80 Commercial Bank of Dubai
33. FINANCIAL RISK MANAGEMENT (continued)
b) Credit risk (continued)
(x) Concentration (continued) Concentration of credit risk by geographic location:
Cash, Loans and Equity balances Contingent advances Securities with Central Total liabilities and Islamic Due from Debt and fund of bank and funded Undrawn and financing banks securities funds other assets exposures commitments acceptances31 December 2014 AED’000 AED’000 AED’000 AED’000 AED’000 AED’000 AED’000 AED’000 Concentration by location UAE 34,829,858 766,353 3,412,915 173,346 6,524,383 45,706,855 11,900,926 8,362,580 GCC 78,685 480,312 1,142,522 36,815 - 1,738,334 - 74,030 Other Arab Countries - 521 - - - 521 - 8,579 Europe 78,999 248,634 244,274 220,542 - 792,449 - 329,013 USA - 62,488 58,170 993 - 121,651 - 49,415 Asia 111,292 6,051 298,421 - - 415,764 - 20,282 Others 105,323 953 - - 106,276 - -––––––––––––––––––––––––––––––––––––––––––––––––––––––––––––––––––––––––––––––––––––––––––––––––––––––––––––Total carrying amount 35,204,157 1,565,312 5,156,302 431,696 6,524,383 48,881,850 11,900,926 8,843,899=========================================================================================================== Cash, Loans and Equity balances Contingent advances Securities with Central Total liabilities and Islamic Due from Debt and fund of bank and funded Undrawn and financing banks securities funds other assets exposures commitments acceptances31 December 2013 AED’000 AED’000 AED’000 AED’000 AED’000 AED’000 AED’000 AED’000
Concentration by locationUAE 32,978,387 1,361,522 2,936,940 117,662 7,235,354 44,629,865 9,927,716 6,950,410 GCC 139,221 172,744 689,717 18,077 - 1,019,759 - 49,128 Other Arab Countries - 482 - - - 482 - 11,248 Europe - 87,471 198,528 155,272 - 441,271 - 284,018 USA - 32,022 - 817 - 32,839 - 7,958 Asia - 5,980 111,640 - - 117,620 - 27,197 Others - 1,951 - - - 1,951 - 267––––––––––––––––––––––––––––––––––––––––––––––––––––––––––––––––––––––––––––––––––––––––––––––––––––––––––––Total carrying amount 33,117,608 1,662,172 3,936,825 291,828 7,235,354 46,243,787 9,927,716 7,330,226 ===========================================================================================================

Notes to the consolidated financial statements (continued) For the year ended 31 December 2014
81Annual Report 2014
33. FINANCIAL RISK MANAGEMENT (continued)
b) Credit risk (continued)
(x) Concentration (continued) Concentration of credit risk by currency:
Cash, Loans and Equity balances Contingent advances Securities with Central Total liabilities and Islamic Due from Debt and fund of bank and funded Undrawn and financing banks securities funds other assets exposures commitments acceptances31 December 2014 AED’000 AED’000 AED’000 AED’000 AED’000 AED’000 AED’000 AED’000 Concentration by currency AED 31,492,665 550,020 31,210 172,891 6,207,028 38,453,814 11,900,926 8,163,014Other currencies 3,711,492 1,015,292 5,125,092 258,805 317,355 10,428,036 - 680,885––––––––––––––––––––––––––––––––––––––––––––––––––––––––––––––––––––––––––––––––––––––––––––––––––––––––––––Total carrying amount 35,204,157 1,565,312 5,156,302 431,696 6,524,383 48,881,850 11,900,926 8,843,899===========================================================================================================
Cash, Loans and Equity balances Contingent advances Securities with Central Total liabilities and Islamic Due from Debt and fund of bank and funded Undrawn and financing banks securities funds other assets exposures commitments acceptances31 December 2013 AED’000 AED’000 AED’000 AED’000 AED’000 AED’000 AED’000 AED’000
Concentration by currency AED 30,474,512 750,011 1,023 117,216 7,003,470 38,346,232 9,927,716 6,800,579Other currencies 2,643,096 912,161 3,935,802 174,612 231,884 7,897,555 - 529,647––––––––––––––––––––––––––––––––––––––––––––––––––––––––––––––––––––––––––––––––––––––––––––––––––––––––––––Total carrying amount 33,117,608 1,662,172 3,936,825 291,828 7,235,354 46,243,787 9,927,716 7,330,226===========================================================================================================
Majority of assets denominated in other currencies are in USD to which AED is pegged.
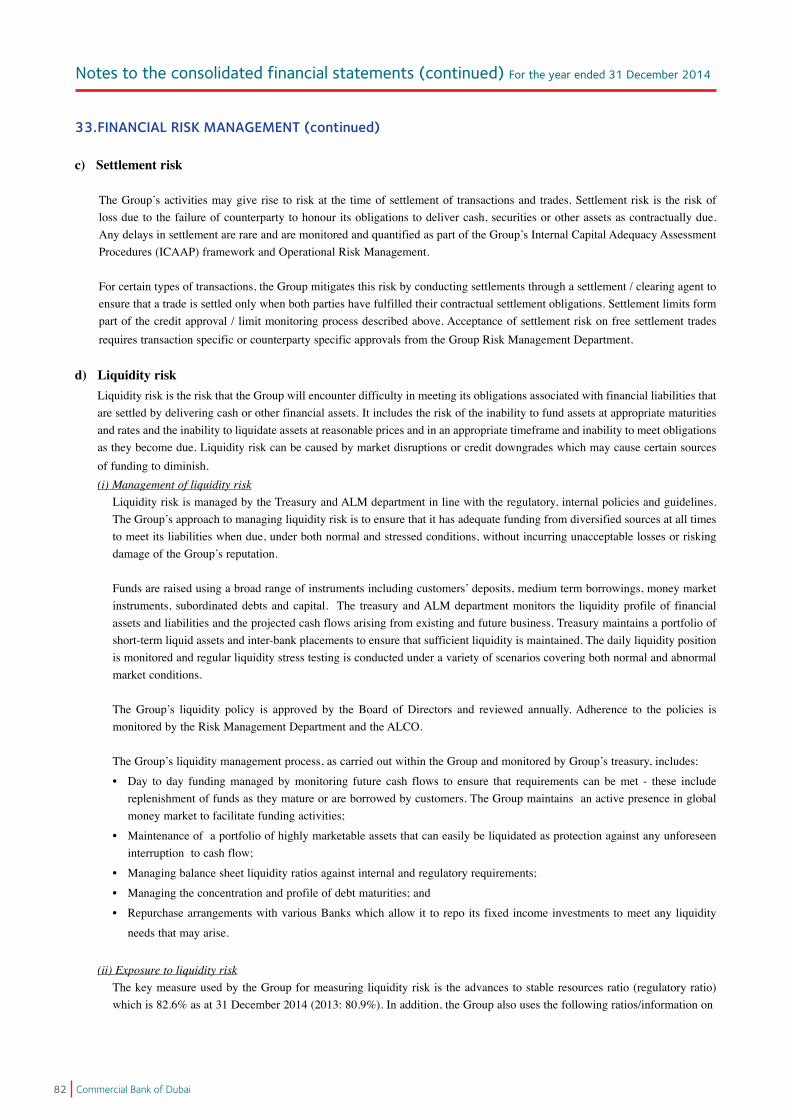
Notes to the consolidated financial statements (continued) For the year ended 31 December 2014
82 Commercial Bank of Dubai
33. FINANCIAL RISK MANAGEMENT (continued)
c) Settlement risk TheGroup’sactivitiesmaygiverise to riskat the timeofsettlementof transactionsand trades.Settlementrisk is theriskof
loss due to the failure of counterparty to honour its obligations to deliver cash, securities or other assets as contractually due. AnydelaysinsettlementarerareandaremonitoredandquantifiedaspartoftheGroup’sInternalCapitalAdequacyAssessmentProcedures (ICAAP) framework and Operational Risk Management.
For certain types of transactions, the Group mitigates this risk by conducting settlements through a settlement / clearing agent to ensure that a trade is settled only when both parties have fulfilled their contractual settlement obligations. Settlement limits form part of the credit approval / limit monitoring process described above. Acceptance of settlement risk on free settlement trades requires transaction specific or counterparty specific approvals from the Group Risk Management Department.
d) Liquidity riskLiquidity risk is the risk that the Group will encounter difficulty in meeting its obligations associated with financial liabilities that are settled by delivering cash or other financial assets. It includes the risk of the inability to fund assets at appropriate maturities and rates and the inability to liquidate assets at reasonable prices and in an appropriate timeframe and inability to meet obligations as they become due. Liquidity risk can be caused by market disruptions or credit downgrades which may cause certain sources of funding to diminish.(i) Management of liquidity risk
Liquidity risk is managed by the Treasury and ALM department in line with the regulatory, internal policies and guidelines. TheGroup’sapproachtomanagingliquidityriskistoensurethatithasadequatefundingfromdiversifiedsourcesatalltimesto meet its liabilities when due, under both normal and stressed conditions, without incurring unacceptable losses or risking damageoftheGroup’sreputation.
Fundsareraisedusingabroadrangeofinstrumentsincludingcustomers’deposits,mediumtermborrowings,moneymarketinstruments, subordinated debts and capital. The treasury and ALM department monitors the liquidity profile of financial assets and liabilities and the projected cash flows arising from existing and future business. Treasury maintains a portfolio of short-term liquid assets and inter-bank placements to ensure that sufficient liquidity is maintained. The daily liquidity position is monitored and regular liquidity stress testing is conducted under a variety of scenarios covering both normal and abnormal market conditions.
TheGroup’s liquidity policy is approved by the Board of Directors and reviewed annually.Adherence to the policies ismonitored by the Risk Management Department and the ALCO.
TheGroup’sliquiditymanagementprocess,ascarriedoutwithintheGroupandmonitoredbyGroup’streasury,includes:
• Day to day fundingmanaged bymonitoring future cash flows to ensure that requirements can bemet - these includereplenishment of funds as they mature or are borrowed by customers. The Group maintains an active presence in global moneymarkettofacilitatefundingactivities;
• Maintenanceofaportfolioofhighlymarketableassetsthatcaneasilybeliquidatedasprotectionagainstanyunforeseeninterruptiontocashflow;
• Managingbalancesheetliquidityratiosagainstinternalandregulatoryrequirements;
• Managingtheconcentrationandprofileofdebtmaturities;and
• RepurchasearrangementswithvariousBankswhichallowit torepoitsfixedincomeinvestments tomeetanyliquidity
needs that may arise.
(ii) Exposure to liquidity riskThe key measure used by the Group for measuring liquidity risk is the advances to stable resources ratio (regulatory ratio) which is 82.6% as at 31 December 2014 (2013: 80.9%). In addition, the Group also uses the following ratios/information on

Notes to the consolidated financial statements (continued) For the year ended 31 December 2014
83Annual Report 2014
33. FINANCIAL RISK MANAGEMENT (continued)
d) Liquidity risk (continued)
(ii) Exposure to liquidity risk (continued)a continuous basis for measuring liquidity risk:
• Liquidassetstototalassetsratio;
• Netloanstodepositsratio(LDR);
• Thirdpartyliabilitiesmaturingwithinonemonthtototalthirdpartyliabilities;
• Customers’depositsmaturingwithinonemonthtototalcustomers’deposits;and
• Deposits’concentration.
• BaselIIIratios(includingLCR,USRR,etc.)arealsomonitoredinternallyandsharedwiththeBoardonquarterlybasis.
ThefollowingtablesummarizesthematurityprofileoftheGroup’sassetsandliabilitiesbasedonthecontractualrepaymentarrangements.ThesedonottakeaccountoftheeffectivematuritiesasindicatedbytheGroup’sdepositretentionhistory.Thecontractual maturities of assets and liabilities have been determined on the basis of the residual period at the reporting date to the contractual maturity date.
The maturity profile of the assets and liabilities at 31 December 2014 was as follows:
From From Less than From 1 to 3 months 1 to 5 Over No Fixed Total 1 month 3 months to 1 year years 5 years Maturity AED’000 AED’000 AED’000 AED’000 AED’000 AED’000 AED’000AssetsCash and balances with Central Bank 5,450,145 4,904,463 - 100,000 - - 445,682Due from banks 1,565,312 1,565,312 - - - - -Loans and advances and Islamic financing 32,167,216 5,258,980 1,528,142 2,168,364 10,889,698 12,322,032 -Investment securities 5,587,998 27,607 18,515 367,250 3,533,132 1,209,798 431,696Investment in associate 84,590 - - - - - 84,590Investment properties 249,991 - - - - - 249,991Property and equipment 323,852 - - - - - 323,852Other assets 1,488,150 529,972 402,360 465,818 - - 90,000––––––––––––––––––––––––––––––––––––––––––––––––––––––––––––––––––––––––––––––––––––––––––––––––––––––––––––Total assets 46,917,254 12,286,334 1,949,017 3,101,432 14,422,830 13,531,830 1,625,811===========================================================================================================
Liabilities and equity Due to banks 1,097,926 1,047,926 - 50,000 - - -Customers’depositsandIslamiccustomers’deposits 32,161,339 20,416,363 6,204,118 5,395,131 145,727 - - Notes and medium term borrowings 4,021,998 - - - 4,021,998 - -Other liabilities 1,825,578 892,405 402,360 465,818 - - 64,995––––––––––––––––––––––––––––––––––––––––––––––––––––––––––––––––––––––––––––––––––––––––––––––––––––––––––––Total liabilities 39,106,841 22,356,694 6,606,478 5,910,949 4,167,725 - 64,995––––––––––––––––––––––––––––––––––––––––––––––––––––––––––––––––––––––––––––––––––––––––––––––––––––––––––––Gap representing equity 7,810,413 (10,070,360) (4,657,461) (2,809,517) 10,255,105 13,531,830 1,560,816===========================================================================================================
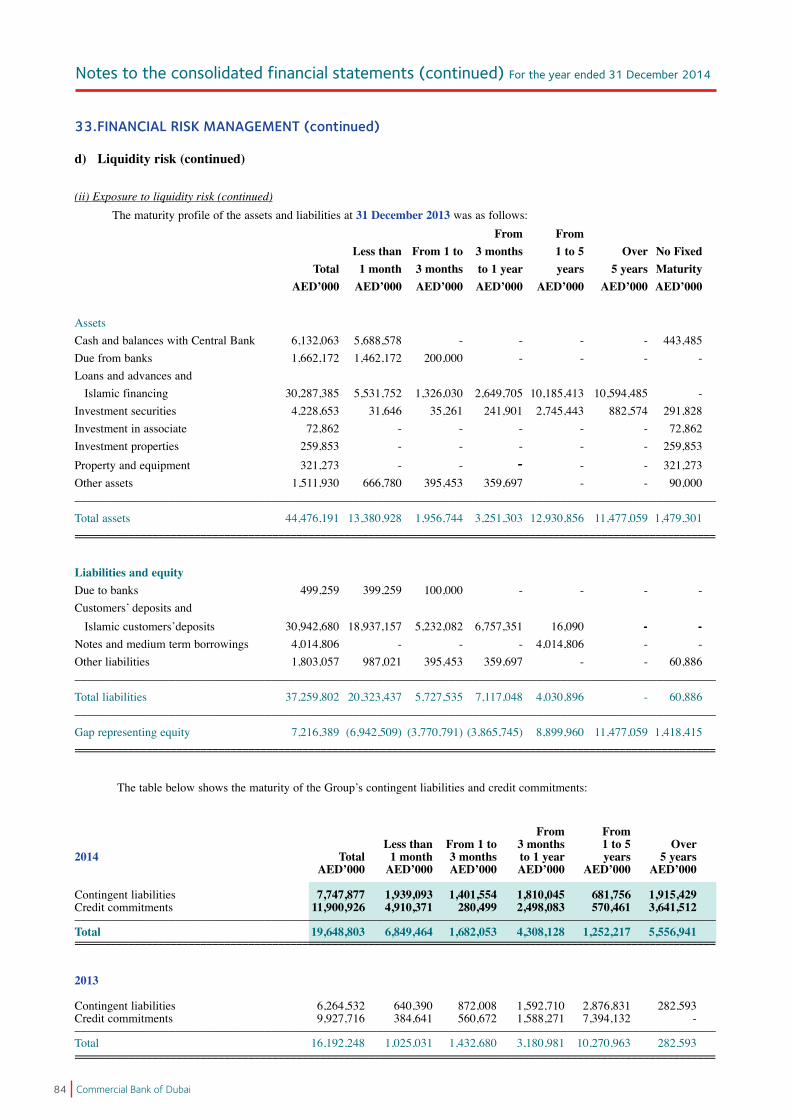
Notes to the consolidated financial statements (continued) For the year ended 31 December 2014
84 Commercial Bank of Dubai
33. FINANCIAL RISK MANAGEMENT (continued)
d) Liquidity risk (continued)
(ii) Exposure to liquidity risk (continued)The maturity profile of the assets and liabilities at 31 December 2013 was as follows:
From From Less than From 1 to 3 months 1 to 5 Over No Fixed Total 1 month 3 months to 1 year years 5 years Maturity AED’000 AED’000 AED’000 AED’000 AED’000 AED’000 AED’000
AssetsCash and balances with Central Bank 6,132,063 5,688,578 - - - - 443,485Due from banks 1,662,172 1,462,172 200,000 - - - -Loans and advances and Islamic financing 30,287,385 5,531,752 1,326,030 2,649,705 10,185,413 10,594,485 -Investment securities 4,228,653 31,646 35,261 241,901 2,745,443 882,574 291,828Investment in associate 72,862 - - - - - 72,862Investment properties 259,853 - - - - - 259,853Property and equipment 321,273 - - - - - 321,273Other assets 1,511,930 666,780 395,453 359,697 - - 90,000––––––––––––––––––––––––––––––––––––––––––––––––––––––––––––––––––––––––––––––––––––––––––––––––––––––––––––Total assets 44,476,191 13,380,928 1,956,744 3,251,303 12,930,856 11,477,059 1,479,301===========================================================================================================
Liabilities and equity Due to banks 499,259 399,259 100,000 - - - -Customers’depositsandIslamiccustomers’deposits 30,942,680 18,937,157 5,232,082 6,757,351 16,090 - -Notes and medium term borrowings 4,014,806 - - - 4,014,806 - -Other liabilities 1,803,057 987,021 395,453 359,697 - - 60,886––––––––––––––––––––––––––––––––––––––––––––––––––––––––––––––––––––––––––––––––––––––––––––––––––––––––––––Total liabilities 37,259,802 20,323,437 5,727,535 7,117,048 4,030,896 - 60,886––––––––––––––––––––––––––––––––––––––––––––––––––––––––––––––––––––––––––––––––––––––––––––––––––––––––––––Gap representing equity 7,216,389 (6,942,509) (3,770,791) (3,865,745) 8,899,960 11,477,059 1,418,415===========================================================================================================
ThetablebelowshowsthematurityoftheGroup’scontingentliabilitiesandcreditcommitments:
From From Less than From 1 to 3 months 1 to 5 Over2014 Total 1 month 3 months to 1 year years 5 years AED’000 AED’000 AED’000 AED’000 AED’000 AED’000
Contingent liabilities 7,747,877 1,939,093 1,401,554 1,810,045 681,756 1,915,429Credit commitments 11,900,926 4,910,371 280,499 2,498,083 570,461 3,641,512––––––––––––––––––––––––––––––––––––––––––––––––––––––––––––––––––––––––––––––––––––––––––––––––––––––––––––Total 19,648,803 6,849,464 1,682,053 4,308,128 1,252,217 5,556,941=========================================================================================================== 2013 Contingent liabilities 6,264,532 640,390 872,008 1,592,710 2,876,831 282,593Credit commitments 9,927,716 384,641 560,672 1,588,271 7,394,132 -––––––––––––––––––––––––––––––––––––––––––––––––––––––––––––––––––––––––––––––––––––––––––––––––––––––––––––Total 16,192,248 1,025,031 1,432,680 3,180,981 10,270,963 282,593===========================================================================================================

Notes to the consolidated financial statements (continued) For the year ended 31 December 2014
85Annual Report 2014
33. FINANCIAL RISK MANAGEMENT (continued)
d) Liquidity risk (continued)
(ii) Exposure to liquidity risk (continued)ThetablesbelowshowundiscountedcashflowsontheGroup’sfinancialliabilities:
From Less than From 1 to 3 months From 1 to Total 1 month 3 months 1 year 5 years2014 AED’000 AED’000 AED’000 AED’000 AED’000
Due to banks 1,098,251 1,047,926 - 50,325 -Customers’depositsandIslamiccustomers’deposits 32,286,280 20,490,936 6,226,979 5,418,965 149,400Notes and medium term borrowings 4,340,338 3,227 22,727 89,428 4,224,956Other liabilities 1,618,887 86,148 1,066,921 465,818 -––––––––––––––––––––––––––––––––––––––––––––––––––––––––––––––––––––––––––––––––––––––––––––––––––––––––––––Total liabilities 39,343,756 21,628,237 7,316,627 6,024,536 4,374,356=========================================================================================================== From Less than From 1 to 3 months From 1 to Total 1 month 3 months 1 year 5 years2013 AED’000 AED’000 AED’000 AED’000 AED’000
Due to banks 499,353 399,304 100,049 - -Customers’depositsandIslamiccustomers’deposits 31,052,942 18,957,104 5,256,743 6,822,489 16,606Notes and medium term borrowings 4,454,648 3,157 22,113 75,810 4,353,568Other liabilities 1,519,438 825,174 395,453 298,811 -––––––––––––––––––––––––––––––––––––––––––––––––––––––––––––––––––––––––––––––––––––––––––––––––––––––––––––Total liabilities 37,526,381 20,184,739 5,774,358 7,197,110 4,370,174===========================================================================================================
e) Market riskMarket risk is the risk that changes in market prices, such as interest rates, equity prices, foreign exchange rates and credit spreads, willaffecttheGroup’sincomeand/orvalueofafinancialinstrument.TheGroupmanagesitsmarketriskinordertoachieveoptimum returns while maintaining market risk exposures within set risk appetite.(i) Management of market risk
The Board of Directors sets the risk appetite pertaining to market Risk which translates into risk limits which are closely monitored by Group Risk Management, reported daily to senior management and discussed monthly by the ALCO.
The Group separates its exposure to market risk between trading and non-trading portfolios with overall responsibility vested in the ALCO. The Group Risk Management department is responsible for the development of detailed risk management policies and for the day-to-day implementation, subject to review and approval by the ALCO.
(ii)Exposure to interest rate risk – non trading portfolioInterest rate risk arises from interest bearing financial instruments and reflects the possibility that changes in interest rates will adversely affect the value of the financial instruments and the related income. The Group manages the risk principally through monitoring interest rate gaps, matching the re-pricing profile of assets and liabilities and by having pre-approved limits for repricing bands. The Group Risk Management Department monitors compliance with these limits on a daily basis and is responsible for reporting breaches if any, to senior management. ALCO review reports on a monthly basis.
In addition the Group also assesses the impact of defined movement in interest yield curves on its net interest income and regulatory capital. The following is the impact of interest rate movement on net interest income and regulatory capital:

Notes to the consolidated financial statements (continued) For the year ended 31 December 2014
86 Commercial Bank of Dubai
33.FINANCIAL RISK MANAGEMENT (continued)
e) Market risk (continued)
(ii)Exposure to interest rate risk – non trading portfolio
2014 2013 Net interest Income Net interest Income 50 b.p. 100 b.p. 50 b.p. 100 b.p. AED’000 AED’000 AED’000 AED’000
Upward Parallel Shift 9,241 30,934 18,322 45,018Downward Parallel Shift. (9,464) (18,928) (11,843) (23,686)
Interest rate movement is not expected to have material impact on the regulatory capital.
AsummaryoftheGroup’sinterestratesensitivitypositionbasedoncontractualre-pricingarrangementsormaturitydates,whichever dates are earlier is as follows:
31 December 2014 Non From interest Less than From 3 to 6 months Over 1 bearing 3 months 6 months to 1 year year TotalAssets AED’000 AED’000 AED’000 AED’000 AED’000 AED’000 Cash and balances with Central Bank 2,950,145 2,400,000 100,000 - - 5,450,145 Due from banks 187,897 1,377,415 - - - 1,565,312 Loans and advances and Islamic financing 3,242,375 21,396,656 1,442,074 1,348,836 7,774,216 35,204,157 Provisions (3,036,941) - - - - (3,036,941) Investment securities 431,696 427,696 179,762 301,378 4,247,466 5,587,998 Investment in associate 84,590 - - - - 84,590 Investment properties 249,991 - - - - 249,991 Property and equipment 323,852 - - - - 323,852 Other assets 1,488,150 - - - - 1,488,150––––––––––––––––––––––––––––––––––––––––––––––––––––––––––––––––––––––––––––––––––––––––––––––––––––––––––––Total assets 5,921,755 25,601,767 1,721,836 1,650,214 12,021,682 46,917,254 –––––––––––––––––––––––––––––––––––––––––––––––––––––––––––––––––––––––––––––––––––––––––––––––––––––––––––– Liabilities Due to banks 560,999 486,927 - 50,000 - 1,097,926 Customers’depositsandIslamiccustomers’deposits 14,040,818 9,914,131 2,777,326 2,549,554 2,879,510 32,161,339 Notes and medium term borrowings - 1,647,704 - - 2,374,294 4,021,998 Other liabilities 1,825,578 - - - - 1,825,578––––––––––––––––––––––––––––––––––––––––––––––––––––––––––––––––––––––––––––––––––––––––––––––––––––––––––––Total liabilities 16,427,395 12,048,762 2,777,326 2,599,554 5,253,804 39,106,841––––––––––––––––––––––––––––––––––––––––––––––––––––––––––––––––––––––––––––––––––––––––––––––––––––––––––––Interest rate sensitivity gap (10,505,640) 13,553,005 (1,055,490) (949,340) 6,767,878 7,810,413––––––––––––––––––––––––––––––––––––––––––––––––––––––––––––––––––––––––––––––––––––––––––––––––––––––––––––Cumulative interest rate sensitivity gap (10,505,640) 3,047,365 1,991,875 1,042,535 7,810,413 ===========================================================================================================Represented by equity 7,810,413===========================================================================================================

Notes to the consolidated financial statements (continued) For the year ended 31 December 2014
87Annual Report 2014
33.FINANCIAL RISK MANAGEMENT (continued)
e) Market risk (continued)
(ii)Exposure to interest rate risk – non trading portfolio
31 December 2013 Non From interest Less than From 3 to 6 months Over 1 bearing 3 months 6 months to 1 year year TotalAssets AED’000 AED’000 AED’000 AED’000 AED’000 AED’000 Cash and balances with Central Bank 2,932,063 3,200,000 - - - 6,132,063 Due from banks 89,948 1,572,224 - - - 1,662,172 Loans and advances and Islamic financing 3,334,164 25,879,750 837,802 1,030,044 2,035,848 33,117,608 Provisions (2,830,223) - - - - (2,830,223) Investment securities 291,828 207,129 - 241,901 3,487,795 4,228,653 Investment in associate 72,862 - - - - 72,862 Investment properties 259,853 - - - - 259,853 Property and equipment 321,273 - - - - 321,273 Other assets 1,511,930 - - - - 1,511,930––––––––––––––––––––––––––––––––––––––––––––––––––––––––––––––––––––––––––––––––––––––––––––––––––––––––––––Total assets 5,983,698 30,859,103 837,802 1,271,945 5,523,643 44,476,191––––––––––––––––––––––––––––––––––––––––––––––––––––––––––––––––––––––––––––––––––––––––––––––––––––––––––––
Liabilities Due to banks 258,378 240,881 - - - 499,259 Customers’depositsandIslamiccustomers’deposits 12,964,516 11,204,724 4,146,279 2,611,071 16,090 30,942,680Notes and medium term borrowings - 1,640,454 - - 2,374,352 4,014,806 Other liabilities 1,803,057 - - - - 1,803,057––––––––––––––––––––––––––––––––––––––––––––––––––––––––––––––––––––––––––––––––––––––––––––––––––––––––––––Total liabilities 15,025,951 13,086,059 4,146,279 2,611,071 2,390,442 37,259,802––––––––––––––––––––––––––––––––––––––––––––––––––––––––––––––––––––––––––––––––––––––––––––––––––––––––––––Interest rate sensitivity gap (9,042,253) 17,773,044 (3,308,477) (1,339,126) 3,133,201 7,216,389––––––––––––––––––––––––––––––––––––––––––––––––––––––––––––––––––––––––––––––––––––––––––––––––––––––––––––Cumulative interest rate sensitivity gap (9,042,253) 8,730,791 5,422,314 4,083,188 7,216,389 ===========================================================================================================Represented by equity 7,216,389===========================================================================================================

Notes to the consolidated financial statements (continued) For the year ended 31 December 2014
88 Commercial Bank of Dubai
33.FINANCIAL RISK MANAGEMENT (continued)
e) Market risk (continued)
(ii)Exposure to interest rate risk – non trading portfolio Overall interest rate risk positions are managed by the Treasury and ALM Department, which uses investment securities, advances
to banks, deposits frombanks and derivative instruments tomanage the overall position arising from theGroup’s activities.Interest rate risks are assumed by ALM from the businesses through fund transfer pricing (FTP process).
f) Currency risk Currency risk is the risk that the value of a financial instrument will fluctuate due to changes in foreign exchange rates and arises
from financial instruments denominated in a foreign currency. The Board of Directors has set limits on positions by currency. Positions are closely monitored and hedging strategies are used to ensure positions are maintained within established limits. At 31 December, the Group had the following significant net exposures denominated in foreign currencies:
Net spot Forward Net exposure Position Position 2014 2013Currency AED’000 AED’000 AED’000 AED’000 US Dollar & GCC currencies pegged with USD 3,434,650 (1,953,544) 1,481,106 770,443 Great Britain Pound (358) (5,437) (5,795) 99 Japanese Yen 23,180 (23,148) 32 (10,455) Euro (373,962) 374,240 278 136 Others 2,540 (838) 1,702 1,068––––––––––––––––––––––––––––––––––––––––––––––––––––––––––––––––––––––––––––––––––––––––––––––––––––––––
A summary of capital requirement for market risk under standardized approach of Basel II is set out below:
2014 2013 AED’000 AED’000 Equity position risk 423 198Foreign currency risk 6,063 1,269Interest rate risk 2,891 1,333–––––––––––––––––––––––––––––––––––––––––––––––––––––––––––––––––––––––––––––––––––––––––––––––––––––––––– 9,377 2,800==========================================================================================================

Notes to the consolidated financial statements (continued) For the year ended 31 December 2014
89Annual Report 2014
33. FINANCIAL RISK MANAGEMENT (continued)
g) Equity risk The Group has defined in its trading book policy the instruments which the Group is allowed to trade. A limited trading activity
takes place in the equity market, monitored by Risk Management and in line with investment committee (IC) recommendations. Daily stop loss limits as well as portfolio notional limits are monitored daily and reported to senior management. In addition, the Group has classified an equity portfolio as available for sale investments.
Analysis of equity portfolio: 2014 2013 Publicly traded (quoted): AED’000 AED’000 Equity 159,011 103,004 Privately held (unquoted): Funds of funds investments 272,685 188,824–––––––––––––––––––––––––––––––––––––––––––––––––––––––––––––––––––––––––––––––––––––––––––––––––––––––––––– Total 431,696 291,828===========================================================================================================
Analysis of gains or (losses) on equity investments: 2014 2013 AED’000 AED’000 Realized gains on sale 27,286 28,955 Unrealized gains in P/L 505 160 Unrealized (loss) / gains in OCI (8,010) 65,836 The revaluation reserve on equity and funds of funds portfolio as at 31 December 2014 amounting to AED 37,003 thousand
(2013: AED 45,013 thousand) was considered as Tier II capital. Analysis of capital requirement for equity investments under standardized approach of Basel II:
2014 2013
Held for Held for AFS trading Total AFS trading Total AED’000 AED’000 AED’000 AED’000 AED’000 AED’000
Equity 18,870 212 19,082 12,162 198 12,360Funds of funds investment 32,722 - 32,722 22,659 - 22,659
––––––––––––––––––––––––––––––––––––––––––––––––––––––––––––––––––––––––––––––––––––––––––––––––––––––––––––Total 51,592 212 51,804 34,821 198 35,019
===========================================================================================================
h) Operational risk Operational risk is defined by Basel as “The risk of loss resulting from inadequate or failed internal processes, people and systems
or from external events, this includes legal risk but excludes strategic and reputation risks”.
TheGroup’sobjectiveistomanageoperationalrisk,soastobalancetheavoidanceoffinanciallossesanddamagetotheGroup’sreputation, with overall cost effectiveness and to avoid control procedures that restrict initiative, innovativeness and creativity.
The primary responsibility for the overseeing the establishment of sound operational risk management framework and monitoring the operational risk profile of the Group vests with the senior management of the Group, The Bank has set up a cross functional committee named Operational Risk Management Committee (ORMC) of senior management personnel to formalize this responsibility and closely monitor key Operational Risks on a pan bank basis to support timely execution of action plans.
Accountability and responsibility is further assigned to the Heads of individual units, departments or branches. This responsibility
is supported by the development of overall Group standards for the management of operational risk in the following areas:

Notes to the consolidated financial statements (continued) For the year ended 31 December 2014
90 Commercial Bank of Dubai
33. FINANCIAL RISK MANAGEMENT (continued)
h) Operational risk (continued)
• Requirements for appropriate segregation of duties, including the independent authorization of transactions to eliminate scenariosinvolvinganyconflictofinterest;
• Requirementsforthereconciliationandmonitoringoftransactions;• Compliancewithregulatoryandotherlegalrequirements;• Documentationofcontrolsandprocedurespertainingtoallactivitiesofthebank;• Requirements for the periodic assessment of operational risks faced, and the adequacy of controls and procedures to address
therisksidentified;• Requirementsforthereportingofoperationallossesandproposedremedialactiontoavoiditsfuturerecurrence;• Developmentofcontingencyplanstoensurecontinuityofbusinessunderallcircumstances;• Trainingandprofessionaldevelopmentofemployeesatalllevelssoastoincreasetheirawarenessofthesubject;• Ethicalandbusinessstandards(throughtheGroup’sapprovedandfunctionalCodeofEthics);• Riskmitigation,includinginsurancewhereverthisiseffective;and• Whistle Blowing and Incident Reporting Policies are channels available to all staff for reporting of any loss events or other
wrongdoings. The Group has an approved framework for end-to-end management of its operational risks, which involves the active participation
of the employees at all levels. The Operational Risk Management plan places an equal emphasis on the identification, assessment, control and reporting of operational risks and on quantification of potential risks and resultant losses therein, if any. Reports are produced covering Operational Risk dashboards, heat-maps, loss matrices, Operational Risk register and loss databases.
The Group has in place an operational risk management system to collate operational risk information in an automated
environment;thishasenabledthebanktobuildoperationalriskdatabasestosupportmigrationtomorecomplexapproachesforcomputation of operational risk capital in the future.
Group Risk Management continued its efforts towards increasing bank-wide awareness about the ORM concept, by organizing workshops, seminars and training courses on the subject, for our employees, throughout the year. On an ongoing basis, Risk and Control Self Assessments (RCSA) are being carried out by all branches and units to identify the operational risks and assess the effectiveness of existing controls, so as to plan any remedial actions (if required) and minimize recurrence of loss events.
Moreover, the Group conducts an assessment of disaster recovery and business continuity position, as well as detailed system risk
assessments of all new/upgraded IT systems and assessment of Operational Risk elements in any new products to be launched or procedures to be implemented. Compliance with policies and procedures is supported by periodic reviews undertaken by Internal Audit. A review of the insurance coverage available to the bank is undertaken to maintain oversight of adequacy of insurance as necessitated by the Basel guidelines. The unit provides regular updates to the senior management and the board Audit, Risk & Compliance Committee (ARCC) to support their mandate to maintain adequate oversight of the banks operational risk framework and status of operational risks across all areas of the bank.

Notes to the consolidated financial statements (continued) For the year ended 31 December 2014
91Annual Report 2014
34. CAPITAL MANAGEMENT
34-1.Regulatory capital
TheGroup’sregulator,theCentralBankoftheUAE,setsandmonitorsregulatorycapitalrequirements.
TheGroup’sobjectiveswhenmanagingcapitalareasfollows:
• SafeguardtheGroup’sabilitytocontinueasagoingconcernandoptimizereturnsforshareholders;and• ComplywithregulatorycapitalrequirementssetbytheCentralBankoftheUAE.
TheGroup’spolicyistomaintainastrongcapitalbasesoastomaintaininvestors,creditorsandmarketconfidenceandtosustainfuturedevelopmentofthebusiness.Theimpactofthelevelofcapitalonshareholders’returnisalsorecognizedand the Group recognizes the need to maintain a balance between the higher returns that might be possible with greater gearing and the advantages and security afforded by a sound capital position.
The Group also assesses its capital requirements internally taking into consideration growth requirements and business plans, and quantifies its Regulatory and Risk / Economic Capital requirements within its integrated ICAAP Framework. Risks such as Interest Rate Risk in the Banking Book, Concentration Risk, Strategic Risk, Legal and Compliance Risk, Stress Risk, Insurance Risk and Reputational Risk are all part of the ICAAP.
The Group also calculates the Risk Adjusted Return on Capital (RAROC) for credit applications that are priced on a risk-adjusted basis. RAROC calculations are also built into the Credit Appraisal System.
TheGroup’sregulatorycapitaladequacyratioissetbytheCentralBankofUAE(‘theCentralBank’).TheGrouphascomplied with all externally imposed capital requirements throughout the year. There have been no material changes in theGroup’smanagementofcapitalduringtheyear.Thecapitaladequacyratioshouldbeaminimumof12%analysedinto two Tiers, of which Tier 1 capital adequacy must not be less than 8% as mandated by the Central Bank.
TheGroup’sregulatorycapitalisanalyzedintotwotiers:
• Tier1capital,whichincludesordinarysharecapitalandretainedearnings;and• Tier2capital,whichincludesfairvaluereservesrelatingtounrealizedgains/lossesoninvestmentsclassifiedasavailable-
for-sale, collective provision and subordinated term loans. The following limits have been applied for Tier 2 capital:-Totaltier2capitalshallnotexceed67%oftier1capital;-Subordinatedliabilitiesshallnotexceed50%oftotaltier1capital;and- Collective provision shall not exceed 1.25% of total risk weighted assets.

Notes to the consolidated financial statements (continued) For the year ended 31 December 2014
92 Commercial Bank of Dubai
34. CAPITAL MANAGEMENT (continued)
34-2. Capital resources and adequacy
The table below summarizes the composition of regulatory capital and capital adequacy ratio calculation as per Basel II, of the Group:
31 December 31 December 2014 2013 AED’000 AED’000 Core tier 1 capital Share capital 2,242,187 2,038,352Legal reserve 1,380,495 1,379,813General reserve 1,121,095 1,100,000Retained earnings 2,387,103 1,982,368––––––––––––––––––––––––––––––––––––––––––––––––––––––––––––––––––––––––––––––––––––––––––––––––––––––––––Tier 1 capital 7,130,880 6,500,533––––––––––––––––––––––––––––––––––––––––––––––––––––––––––––––––––––––––––––––––––––––––––––––––––––––––––
Upper tier 2 capital Fair value reserve 31,414 24,620Collective provisions (up to allowable limit) 525,219 459,916––––––––––––––––––––––––––––––––––––––––––––––––––––––––––––––––––––––––––––––––––––––––––––––––––––––––––Tier 2 capital 556,633 484,536––––––––––––––––––––––––––––––––––––––––––––––––––––––––––––––––––––––––––––––––––––––––––––––––––––––––––Total capital base 7,687,513 6,985,069=========================================================================================================
Risk weighted assets (RWA) Pillar 1 Credit risk 38,614,847 34,374,854Market risk 78,145 23,336Operational risk 3,832,044 2,395,103–––––––––––––––––––––––––––––––––––––––––––––––––––––––––––––––––––––––––––––––––––––––––––––––––––––––––Risk weighted assets 42,525,036 36,793,293=========================================================================================================
Tier 1 ratio 16.77% 17.67%Capital adequacy ratio (Pillar) 1 18.08% 18.98%
Risk weighted capital requirement The Group has adopted the standardized approach for credit risk and market risk and basic indicator approach for operational risk
forregulatoryreportingpurposes.TheGroup’sriskweightedcapitalrequirementforcredit,marketandoperationriskaregivenbelow:
(i)Risk weights for credit risk The Group has a diversified funded and unfunded credit portfolio. The exposures are classified as per the Standard Portfolio
approach mentioned under the Central Bank of UAE Basel II Capital Adequacy Framework covering the standardized approach for credit risk. The descriptions of the counterparty classes along with the risk weights used to derive the risk weighted assets are as follows:

Notes to the consolidated financial statements (continued) For the year ended 31 December 2014
93Annual Report 2014
34. CAPITAL MANAGEMENT (continued)
34-2.Capital resources and adequacy (continued) (i)Risk weights for credit risk (continued)
Funded exposure Claims on sovereigns These pertain to exposures to governments and their central banks. Claims on central banks and sovereigns are risk weighted in
accordance with their ratings from acceptable external credit assessment institutions (ECAIs), except that, for all GCC sovereigns a 0% weight has been applied.
Claims on non- commercial public sector entities (PSEs) Domestic currency claims on GCC non-commercial PSEs were treated as claims on GCC sovereign if their Central Bank or
monetary authority treats them as such. Foreign currency claims on GCC PSE were treated one grade less favourable than its sovereign i.e. 20% risk weight were applied. Claims on other foreign non-commercial PSEs were treated one grade less favorable than its sovereign.
Claims on multilateral development banks (MDBs) AllMDBsareriskweighted inaccordancewitheachbank’scredit ratingexceptfor thosemembers listed in theWorldBank
Group which are risk weighted at 0%. Claims on banks Claims on banks are risk weighted based on the ratings assigned to them by external rating agencies, however, short term claims
denominated in local currency were assigned more favorable risk weighting. No claim on an unrated bank would receive a risk weight lower than that applied to claims on its sovereign of incorporation. Claims on corporate and government related entities portfolio Claims on corporate and government related entities (entities with greater than 50% government ownership) are risk weighted in
accordance with ratings from acceptable ECAIs. Risk weight of 100% is applied on claims on unrated corporate and government related entities.
Claims on regulatory retail exposures Retail claims that are included in the regulatory retail portfolio are assigned risk weights of 75% (except for past due loans), if
they meet the criteria mentioned in the Central Bank of UAE BASEL-II guidelines.
Claims secured by residential property A preferential risk weight of 35% was applied on claims that did not exceed AED 10 million to a single borrower and the claim
was secured by residential property with LTV of up to 85%. Other claims secured on residential property were risk weighted 100%.
Claims secured by commercial property 100% risk weight was applied on claims secured by commercial property. Past due exposures The unsecured portion of any loan (other than a qualifying residential mortgage loan) that is past due for more than 90 days, net
of specific provisions (including partial write-offs), is risk weighted as follows :- 150%riskweightwhenspecificprovisionsarelessthan20%oftheoutstandingamountofloan;- 100% risk weight when specific provisions are greater than 20% of the outstanding amount of loan.

Notes to the consolidated financial statements (continued) For the year ended 31 December 2014
94 Commercial Bank of Dubai
34. CAPITAL MANAGEMENT (continued)
34-2.Capital resources and adequacy (continued) (i)Risk weights for credit risk (continued)
Funded exposure (continued) Equity portfolios 0% risk weight was applied on equity in trading book. Equity in banking book was risk weighted at 100%. The aggregate
investments in insurance companies (including investment in associate held as per equity accounting) amounting to AED 97,128 thousand (2013: AED 93,894 thousand) have been risk weighted in accordance with Basel II.
Other exposures These are risk weighted at 100%.
Unfunded exposure For credit-related contingent items, the nominal value is converted to an exposure through the application of Credit Conversions
Factors (CCF). The CCF is at 20%, 50% or 100% depending on the type of contingent item, and is used to convert off balance sheet notional amounts into an equivalent on balance sheet exposure.
Undrawn commitments to extend credit represent commitments that have not been drawn down or utilized at the reporting date.
The nominal amount provides the calculation base to which the CCF is applied for calculating the exposure. CCF range between 20% and 50% for commitment with original maturity of up to one year and over one year respectively and 0% CCF is applicable for commitments which can be unconditionally cancelled at any time.
On & Off balance Credit risk mitigation On & Off balance balance Sheet (CRM) Sheet
Asset Classes Net exposure Gross Exposure after credit Risk Outstanding Before conversion weighted CRM CRM factors (CCF) assets31 December 2014 AED’000 AED’000 AED’000 AED’000 AED’000
Claims on sovereigns 5,595,298 5,595,298 - 5,473,307 1,102 Claims on non-commercial Public Sector Enterprises (PSEs) 1,221,850 1,221,850 - 670,900 - Claims on banks 5,751,968 5,751,968 - 5,354,394 2,135,445 Claims on corporates and government related enterprises (GRE) 42,934,837 42,674,794 2,262,986 28,135,570 27,893,289 Claims included in the regulatory retail portfolio 4,610,709 4,610,709 118,224 2,987,607 2,446,695 Claims secured by residential property 1,482,482 1,482,482 - 1,482,482 671,283 Claims secured by commercial real estate 2,680,184 2,680,184 - 2,679,763 2,679,763 Past due loans 3,553,999 1,302,320 61,273 1,197,711 1,306,777 Other assets 1,979,223 1,955,546 - 1,955,546 1,480,493 ––––––––––––––––––––––––––––––––––––––––––––––––––––––––––––––––––––––––––––––––––––––––––––––––––––––––––––Total Claims 69,810,550 67,275,151 2,442,483 49,937,280 38,614,847 ––––––––––––––––––––––––––––––––––––––––––––––––––––––––––––––––––––––––––––––––––––––––––––––––––––––––––––Total Credit Risk 38,614,847===========================================================================================================
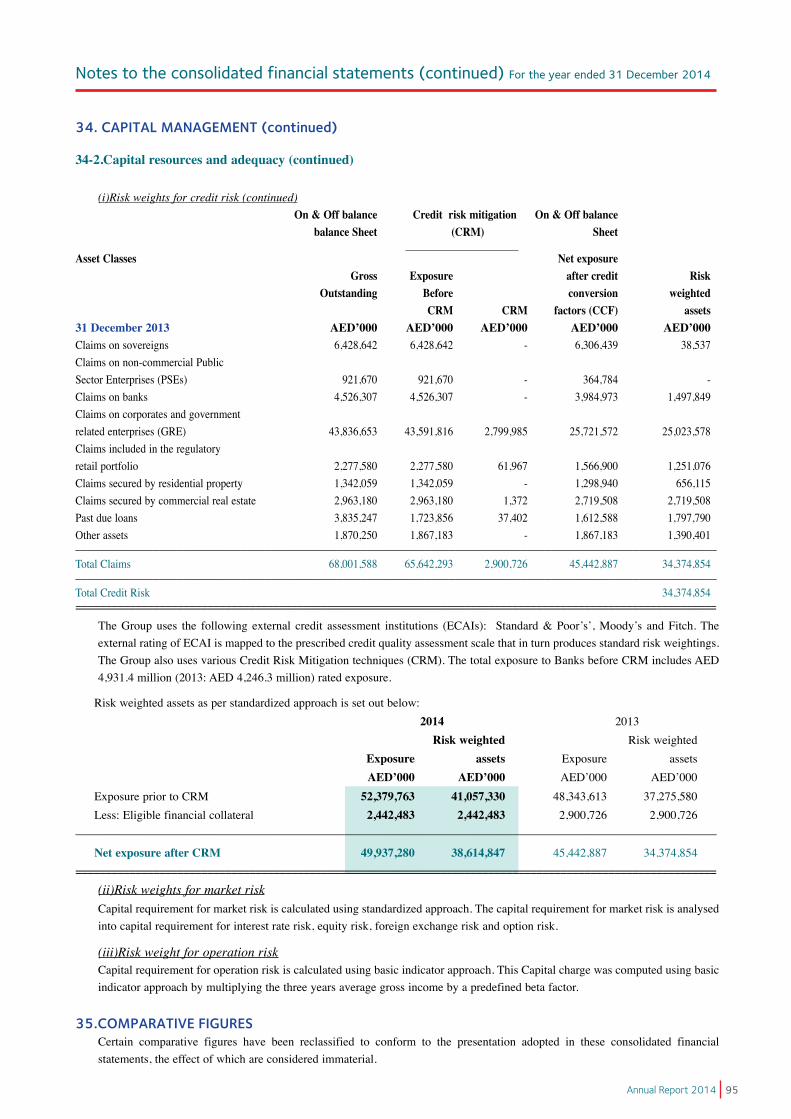
Notes to the consolidated financial statements (continued) For the year ended 31 December 2014
95Annual Report 2014
34. CAPITAL MANAGEMENT (continued)
34-2.Capital resources and adequacy (continued) (i)Risk weights for credit risk (continued) On & Off balance Credit risk mitigation On & Off balance balance Sheet (CRM) Sheet
Asset Classes Net exposure Gross Exposure after credit Risk Outstanding Before conversion weighted CRM CRM factors (CCF) assets31 December 2013 AED’000 AED’000 AED’000 AED’000 AED’000Claims on sovereigns 6,428,642 6,428,642 - 6,306,439 38,537Claims on non-commercial Public Sector Enterprises (PSEs) 921,670 921,670 - 364,784 -Claims on banks 4,526,307 4,526,307 - 3,984,973 1,497,849Claims on corporates and government related enterprises (GRE) 43,836,653 43,591,816 2,799,985 25,721,572 25,023,578Claims included in the regulatory retail portfolio 2,277,580 2,277,580 61,967 1,566,900 1,251,076Claims secured by residential property 1,342,059 1,342,059 - 1,298,940 656,115Claims secured by commercial real estate 2,963,180 2,963,180 1,372 2,719,508 2,719,508Past due loans 3,835,247 1,723,856 37,402 1,612,588 1,797,790Other assets 1,870,250 1,867,183 - 1,867,183 1,390,401––––––––––––––––––––––––––––––––––––––––––––––––––––––––––––––––––––––––––––––––––––––––––––––––––––––––––––Total Claims 68,001,588 65,642,293 2,900,726 45,442,887 34,374,854––––––––––––––––––––––––––––––––––––––––––––––––––––––––––––––––––––––––––––––––––––––––––––––––––––––––––––Total Credit Risk 34,374,854=========================================================================================================== TheGroup uses the following external credit assessment institutions (ECAIs): Standard&Poor’s’,Moody’s andFitch.The
external rating of ECAI is mapped to the prescribed credit quality assessment scale that in turn produces standard risk weightings. The Group also uses various Credit Risk Mitigation techniques (CRM). The total exposure to Banks before CRM includes AED 4,931.4 million (2013: AED 4,246.3 million) rated exposure.
Risk weighted assets as per standardized approach is set out below: 2014 2013 Risk weighted Risk weighted Exposure assets Exposure assets AED’000 AED’000 AED’000 AED’000 Exposure prior to CRM 52,379,763 41,057,330 48,343,613 37,275,580 Less: Eligible financial collateral 2,442,483 2,442,483 2,900,726 2,900,726–––––––––––––––––––––––––––––––––––––––––––––––––––––––––––––––––––––––––––––––––––––––––––––––––––––––––––– Net exposure after CRM 49,937,280 38,614,847 45,442,887 34,374,854=========================================================================================================== (ii)Risk weights for market risk Capital requirement for market risk is calculated using standardized approach. The capital requirement for market risk is analysed
into capital requirement for interest rate risk, equity risk, foreign exchange risk and option risk.
(iii)Risk weight for operation risk Capital requirement for operation risk is calculated using basic indicator approach. This Capital charge was computed using basic
indicator approach by multiplying the three years average gross income by a predefined beta factor. 35.COMPARATIVE FIGURES Certain comparative figures have been reclassified to conform to the presentation adopted in these consolidated financial
statements, the effect of which are considered immaterial.

Commercial Bank of Dubai96
Head OfficeP.O. Box 2668, Al Ittihad Road, Dubai, U.A.E.Toll-free: 800 CBD (223)Tel: +9714 212 1000Fax: +9714 212 1911Swift: CBDUAEAD XXXE-Mail: [email protected]
Branches
Al Aweer BranchP.O. Box 2668, Dubai, U.A.E.Tel: +9714 320 1222Fax: +9714 320 1201Branch Manager: Hussain Al Marzooqi
Al Quoz BranchP.O. Box 2668, Dubai, UAETel: +9714 330 7000Fax: +9714 330 7701 Branch Manager: Haitham Ibrahim Abdul Malik
Dubai BranchP.O. Box 2668, Dubai, U.A.E.Tel: +9714 352 3355Fax: +9714 352 7655Branch Manager: Mohammed Al Awadi
Jumeirah BranchP.O. Box 2668, Dubai, U.A.E.Tel: +9714 344 1438Fax: +9714 344 7346Branch Manager: Arefa Al Hashemi
Umm Suqeim BranchP.O. Box 2668, Dubai, U.A.E.Tel: +9714 373 0700Fax: +9714 373 0703Branch Manager: Farah Alulama
Sheikh Zayed Road BranchP.O. Box 2668, Dubai, U.A.E.Tel: +9714 343 4777Fax: +9714 343 6088Branch Manager: Malik Al Muhairby
Baniyas Square BranchP.O. Box 2668, Dubai, U.A.E.Tel: +9714 228 9000Fax: +9714 221 8262Branch Manager: Majid Al Marzouqi
Deira BranchP.O. Box 1709, Dubai, U.A.E.Tel: +9714 225 3222Fax: +9714 225 4565Branch Manager: Talal Tareq Al Khaja
Main BranchP.O. Box 2668, Dubai, U.A.E.Tel: +9714 212 1000 Fax: +9714 212 1012Branch Manager: Abdul Wahab Galadari
Al Garhoud BranchP.O. Box 2668, Dubai, U.A.E.Tel: +9714 282 6444Fax: +9714 282 6620Branch Manager: Jaber Al Haddad
Al Qusais BranchP.O. Box 2668, Dubai, U.A.E.Tel: +9714 261 5000Fax: +9714 261 2520Branch Manager: Hamad Juma Al Mas
Al Muhaisna BranchP.O. Box 2668, Dubai, U.A.E.Tel: +9714 220 4222Fax: +9714 220 7288Branch Manager: Muhannad Al Redha
Old Town BranchP.O. Box 2668, Dubai, U.A.E.Tel: +9714 420 0292Fax: +9714 420 0299Branch Manager: Redha Sajwani
Marina BranchP.O. Box 2668, Dubai U.A.E.Tel: +9714 423 4888Fax: +9714 423 4851Branch Manager: Hind Ahmad Kamel
Jebel Ali BranchP.O. Box 2668, Dubai, U.A.E.Tel: +9714 881 8882Fax: +9714 881 2252Branch Manager: Abdolrazagh Ibrahim Parham
Al Maktoum BranchP.O. Box 3393, Dubai, U.A.E.Tel: +9714 268 3555Fax: +9714 268 3477 Branch Manager: Mohamed Ahmed Bani Hammad
Annual Report 2014 97
Abdul Wahab GaladanDubai District ManagerDistrict (C)
Abdulsatar AbdulrahmanNorthern EmiratesDistrict Manager
Mohamed Ahmed Bani HammadDubai District ManagerDistrict (D)
Amin Al HendiAbu Dhabi District Manager
Farah Alulama Dubai District ManagerDistrict (A)
Mohammed Al AwadiDubai District ManagerDistrict (B)
Naturalization and Residence Administration BranchP.O. Box : 2668, Dubai, UAETel: +9714 398 5000Fax: +9714 398 2259Branch Manager: Adel Al Khooly
Abu Dhabi BranchP.O. Box 2466, Abu Dhabi, U.A.E.Tel: +9712 626 8400Fax: +9712 627 4120Branch Manager: Khalid Al Manthari
Umm Suqeim BranchP.O. Box 2668, Dubai, U.A.E.Tel: +9714 373 0777Fax: +9714 373 0707Branch Manager: Mohammad Abdulla
Airport BranchP.O. Box 2466, Abu Dhabi, U.A.E.Tel: +9712 641 1333Fax: +9712 6411644Branch Manager: Ala Issa Ammari
Abu Dhabi BranchP.O. Box 2466, Abu Dhabi, U.A.E.Tel: +9712 626 8400Fax: +9712 627 4120Branch Manager: Ramzi Al Rimawi
Village Mall Branch - Abu DhabiP.O. Box 2466, Abu Dhabi, U.A.E.Tel: +9712 555 5510Fax: +9712 554 0330Branch Manager: Ramzi Ishaq Sulaiman
Al Ain BranchP.O. Box 1497, Al Ain, U.A.E.Tel: +9713 766 7800Fax: +9713 766 6590Branch Manager: Jamal Al Hemiary
Ajman BranchP.O. Box 4199, Ajman, U.A.E.Tel: +9716 745 6668Fax: +9716 744 9987Branch Manager: Khalid Ahmed Al Housani
Ras Al Khaima BranchP.O. Box 5849, R.A.K., U.A.E.Tel: +9717 228 6266Fax: +9717 228 5545
Sharjah BranchP.O. Box 677, Sharjah, U.A.E.Tel: +9716 574 0666Fax: +9716 517 0150Branch Manager: Abdulsatar Abdulrahman
Fujairah BranchP.O. Box 4554, Fujairah, UAETel: +9719 222 5111Fax: +9719 201 8111Branch Manager: Abdullah Al Suwaidi
Attijari Al Islami Branches
Main BranchP.O. Box 2668, Dubai, U.A.E.Tel: +9714 212 1000 Fax: +9714 212 1090District Manager: Saud Al Tamimi
Sharjah BranchP.O. Box 677, Sharjah, U.A.E.Tel: +9716 574 0666Fax: +9716 517 0150District Manager: Hasan Al Marzouqi
Burj Al Arab, DubaiTel: +9714 348 4414American University in DubaiTel: +9714 399 1316Dubai ChamberTel: +9714 202 8176
Cash Offices :

Commercial Bank of Dubai98

Annual Report 2014 99

ANNUAL REPORT 2014
www.cbd.ae