Embed Size (px)
Citation preview
Annual Report 2013 A
Cover Story
At Highnoon Laboratories, we are living our vision to advance health and prosperity by providing quality products to our consumers. Our endeavours to nurture a healthier nation have reciprocated with escalated growth and remarkable success for us.
Resolved to transcend the standards of excellence in healthcare, we seek continued progress through our unmatched prowess and our unwavering drive to succeed in the pharmaceutical industry. With our relentless determination to grow, we shall continue to ascend to new heights; aiming big and rising high on the sky of success.

Contents Corporate Financial Highlights 02
Company Information 04
Notice of Annual General Meeting 06
Our Vision 08
Our Mission 09
Corporate Objectives 10
Statement of Ethics & Core Values 11
Directors’ Report to the Shareholders 12
Chairman’s Review 18
Six Years at a Glance 26
Statement of Value Addition and its Distribution 29
Horizontal & Vertical Analysis 30
Pattern of Shareholding 32
Statement of Compliance with the Best Practices of
the Code of Corporate Governance 34
Review Report to the Members on Statement of
Compliance with the Best Practices of the
Code of Corporate Governance 36
Financial StatementsAuditors’ Report to the Members 39
Balance Sheet 40
Profit & Loss Account 42
Statement of Comprehensive Income 43
Cash Flow Statement 44
Statement of Changes in Equity 46
Notes to the Financial Statements 47
Form of Proxy
Annual Report 2013 01

Financial Highlights 2013
Operating Profit
ProfitAfter
Tax
Payout *
EquityGross Profit Margin
EarningsPer Share
MarketValue
Sales
InterestBearing
Liabilities
Return onCapital
Employed
47%
50%
45%
15%41%
8.56
150%
22%
97
20%
(2012: 35%)
(2012: Rs. 621 million)
increased by
reduced to Rs.
million
increased to
up by
(2012: 41.6%)
(2012: Rs. 5.72)
(2012: Rs. 47.50)
increased by
(2012: Rs. 315 million)
(2012: 15%)
(2012: Rs. 162 million)
(2012: Rs. 104 million)
(2012: Rs. 2.46 billion)
up by
Rs. 156 million
* Proposed
Cash Dividend
increased by
Rs. 249 million
Rs. 715 million
Rs. 118.53per share
Rs. 3 billion
Rs.
Highnoon Laboratories Limited 02
Inspiring Excellence
Annual Report 2013 03
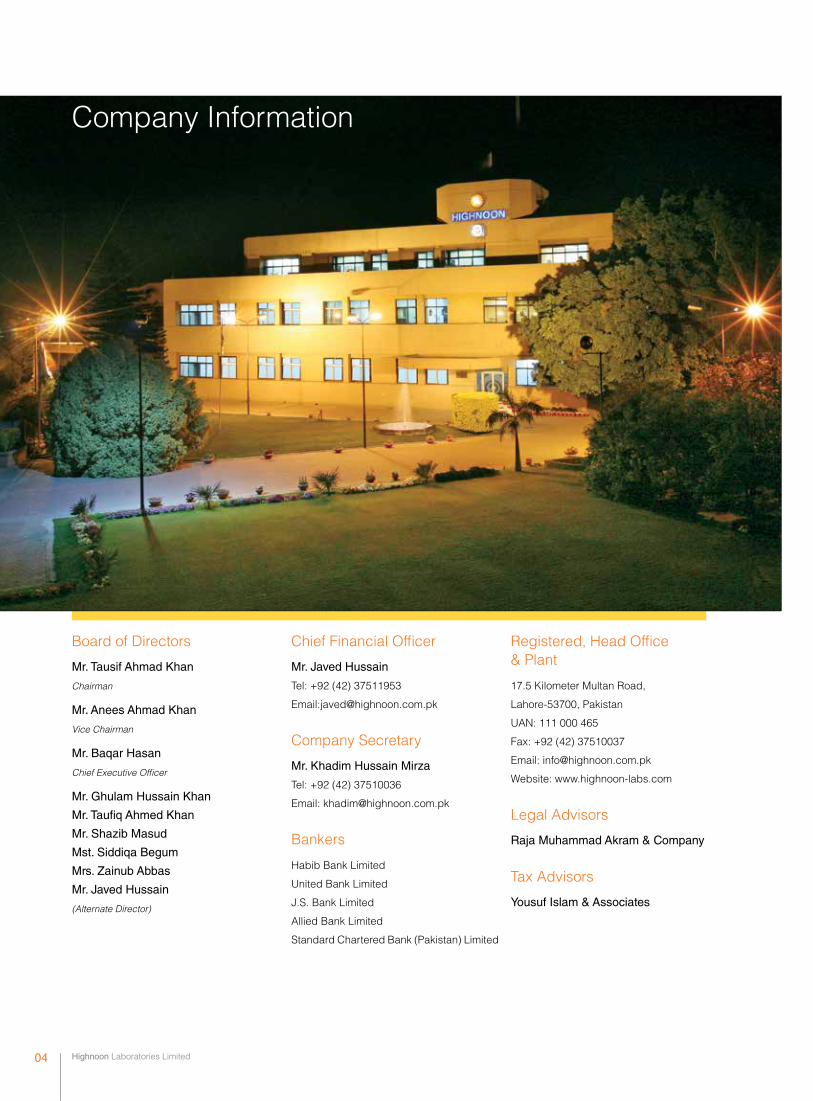
Company Information
Board of Directors
Mr. Tausif Ahmad Khan
Chairman
Mr. Anees Ahmad Khan
Vice Chairman
Mr. Baqar Hasan
Chief Executive Officer
Mr. Ghulam Hussain Khan
Mr. Taufiq Ahmed Khan
Mr. Shazib Masud
Mst. Siddiqa Begum
Mrs. Zainub Abbas
Mr. Javed Hussain
(Alternate Director)
Chief Financial Officer
Mr. Javed Hussain
Tel: +92 (42) 37511953
Email:[email protected]
Company Secretary
Mr. Khadim Hussain Mirza
Tel: +92 (42) 37510036
Email: [email protected]
Bankers
Habib Bank Limited
United Bank Limited
J.S. Bank Limited
Allied Bank Limited
Standard Chartered Bank (Pakistan) Limited
Registered, Head Office & Plant
17.5 Kilometer Multan Road,
Lahore-53700, Pakistan
UAN: 111 000 465
Fax: +92 (42) 37510037
Email: [email protected]
Website: www.highnoon-labs.com
Legal Advisors
Raja Muhammad Akram & Company
Tax Advisors
Yousuf Islam & Associates
Highnoon Laboratories Limited 04
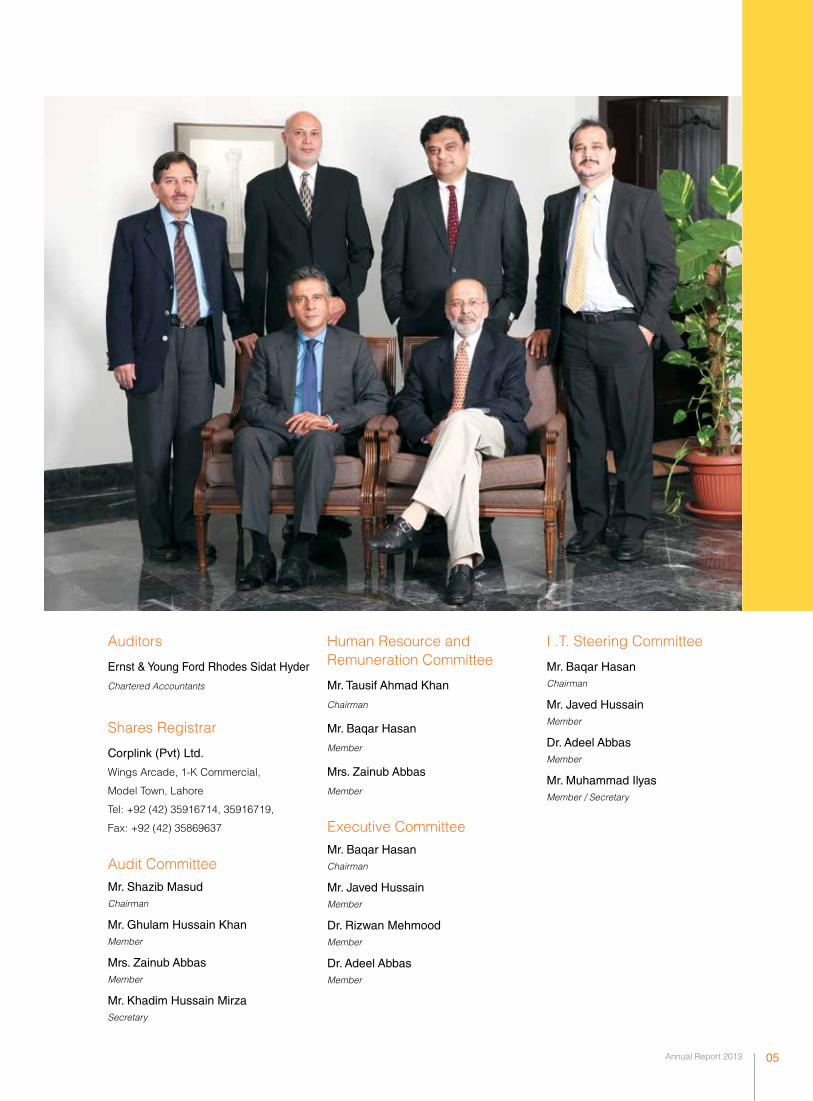
Auditors
Ernst & Young Ford Rhodes Sidat Hyder
Chartered Accountants
Shares Registrar
Corplink (Pvt) Ltd.
Wings Arcade, 1-K Commercial,
Model Town, Lahore
Tel: +92 (42) 35916714, 35916719,
Fax: +92 (42) 35869637
Audit CommitteeMr. Shazib MasudChairman
Mr. Ghulam Hussain Khan Member
Mrs. Zainub Abbas Member
Mr. Khadim Hussain Mirza Secretary
Human Resource and Remuneration Committee
Mr. Tausif Ahmad Khan
Chairman
Mr. Baqar Hasan
Member
Mrs. Zainub Abbas
Member
Executive Committee Mr. Baqar Hasan Chairman
Mr. Javed Hussain Member
Dr. Rizwan Mehmood Member
Dr. Adeel Abbas Member
I .T. Steering Committee
Mr. Baqar HasanChairman
Mr. Javed Hussain Member
Dr. Adeel Abbas Member
Mr. Muhammad Ilyas Member / Secretary
Annual Report 2013 05
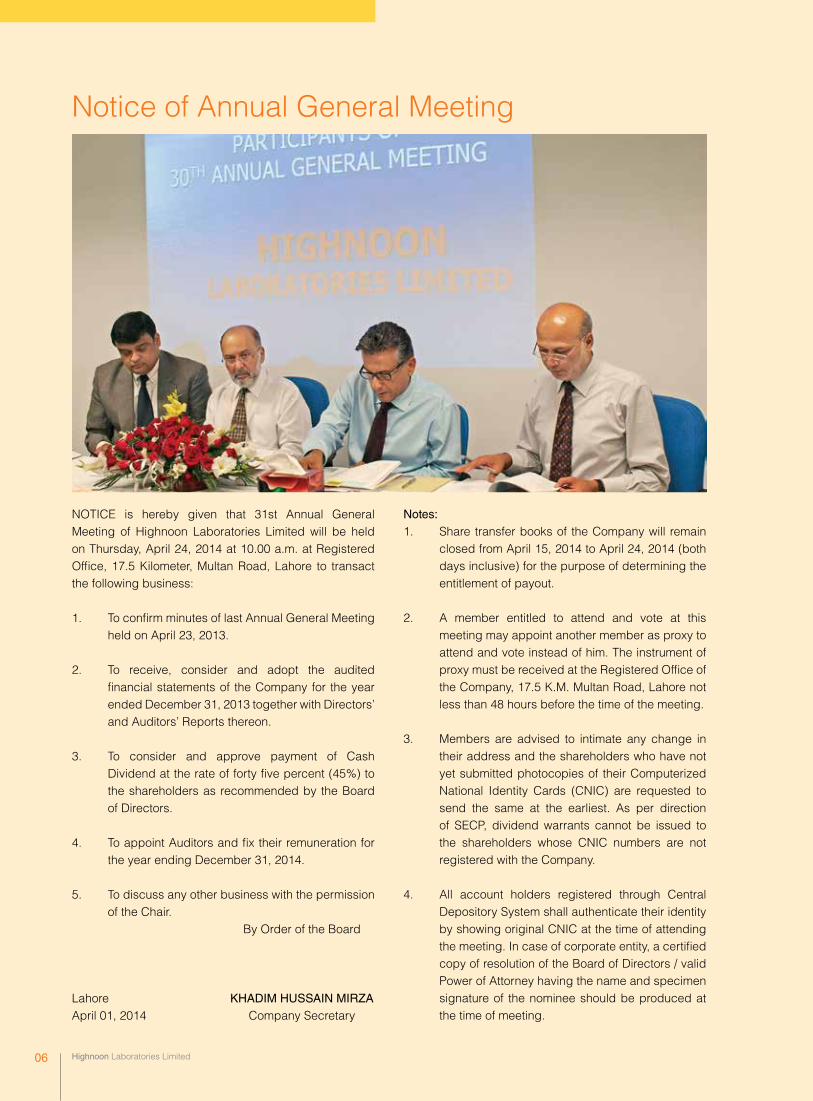
Notice of Annual General Meeting
NOTICE is hereby given that 31st Annual General Meeting of Highnoon Laboratories Limited will be held on Thursday, April 24, 2014 at 10.00 a.m. at Registered Office, 17.5 Kilometer, Multan Road, Lahore to transact the following business:
1. To confirm minutes of last Annual General Meeting held on April 23, 2013.
2. To receive, consider and adopt the audited financial statements of the Company for the year ended December 31, 2013 together with Directors’ and Auditors’ Reports thereon.
3. To consider and approve payment of Cash Dividend at the rate of forty five percent (45%) to the shareholders as recommended by the Board of Directors.
4. To appoint Auditors and fix their remuneration for the year ending December 31, 2014.
5. To discuss any other business with the permission of the Chair.
By Order of the Board
Lahore KHADIM HUSSAIN MIRZAApril 01, 2014 Company Secretary
Notes:1. Share transfer books of the Company will remain
closed from April 15, 2014 to April 24, 2014 (both days inclusive) for the purpose of determining the entitlement of payout.
2. A member entitled to attend and vote at this meeting may appoint another member as proxy to attend and vote instead of him. The instrument of proxy must be received at the Registered Office of the Company, 17.5 K.M. Multan Road, Lahore not less than 48 hours before the time of the meeting.
3. Members are advised to intimate any change in their address and the shareholders who have not yet submitted photocopies of their Computerized National Identity Cards (CNIC) are requested to send the same at the earliest. As per direction of SECP, dividend warrants cannot be issued to the shareholders whose CNIC numbers are not registered with the Company.
4. All account holders registered through Central Depository System shall authenticate their identity by showing original CNIC at the time of attending the meeting. In case of corporate entity, a certified copy of resolution of the Board of Directors / valid Power of Attorney having the name and specimen signature of the nominee should be produced at the time of meeting.
Highnoon Laboratories Limited 06

Embracing Innovation
Annual Report 2013 07
Highnoon Laboratories Limited 08
Our Vision
We at Highnoon
Laboratories Limited
understand the duties of
being responsible corporate
citizen and stand true to
our conviction and promise
to work for the betterment
and prosperity of our
people.
“Highnoon for a
Healthier Nation”

Annual Report 2013 09
Our Mission
We strive to maintain
excellence in our
business practices with
the objective to benefit
the medical community,
consumers, stakeholders
and employees; and to
improve quality of life
by providing quality
products.

Highnoon Laboratories Limited 10
Corporate Objectives
q Excel in meeting customer needs.
q Maintain leadership in national pharmaceutical industry.
q Gain confidence of Doctors, Pharmacists and Consumers who use our products.
q Seek employee involvement, continuous improvement and enhanced performance goals.
q Enhance export business.
Annual Report 2013 11
Statement of Ethics & Core Values
Shared Responsibility
The achievement and continuation
of an ethical work environment is a
shared responsibility among employees,
senior officials and directors of the Company,
which will be treated as confidential.
Intellectual Honesty
Personal interaction among employees should be
characterized by truthfulness, openness to new ideas
and consideration for the rights of others. Each member
of the team should respect the right of others to freedom
of thought, opinion, speech and association.
Personal Conduct
At Highnoon each employee is responsible for avoiding
real or apparent conflicts of interest, ensuring that
authority is exercised within a framework of accountability
and ensuring that information is managed in accordance
with relevant statutes. Employees must ensure that the
organization’s interests are foremost in all business
decisions and shall remove themselves from decision
making roles which involve the employee in any personal
capacity or which involve friends or family members.
Research
Research carried out by our organization shall be
characterized by the highest standards of integrity and
ethical behavior. Every effort shall be made to ensure
that all research data or results of projects or programs
sponsored by or under the administrative supervision of
organization are represented properly and accurately.
The Board of Directors is pleased to present the annual audited financial statements of Highnoon Laboratories Limited
for the year ended 31 December 2013.
Financial Highlights of the Company 2013
Rs. ‘000’
Profit before tax 232,302
Taxation 76,767
Profit after tax 155,535
Un-appropriated profit brought forward 324,931
Incremental depreciation relating to surplus on revaluation of fixed assets 6,899
Other Comprehensive income net of tax (4,165)
Profit available for appropriation 483,200
Appropriations:
Cash Dividend for the financial year
31 December 2012 @ Rs. 3.50 per share 63,632
419,568
Highnoon Laboratories Limited 12
Directors’ Reportto the Shareholders
Earnings Per Share
Based on net profit for the year ended 31 December
2013, the earnings per share (EPS) of the Company is
Rs. 8.56 (2012 : Rs.5.72).
Dividend Announcement
The Directors of the Company have recommended a
final cash dividend of 45 percent i.e. Rs. 4.50 per share
(2012: Rs. 3.50 per share) for the financial year ended
31 December 2013, for consideration and approval by
the shareholders in the Annual General Meeting.
Pattern of Shareholding
The pattern of shareholding along with categories of
shareholders as at 31 December 2013 as required
under Section 236 of the Companies Ordinance and
listing regulations is presented on Page 32 of the Annual
Report 2013.
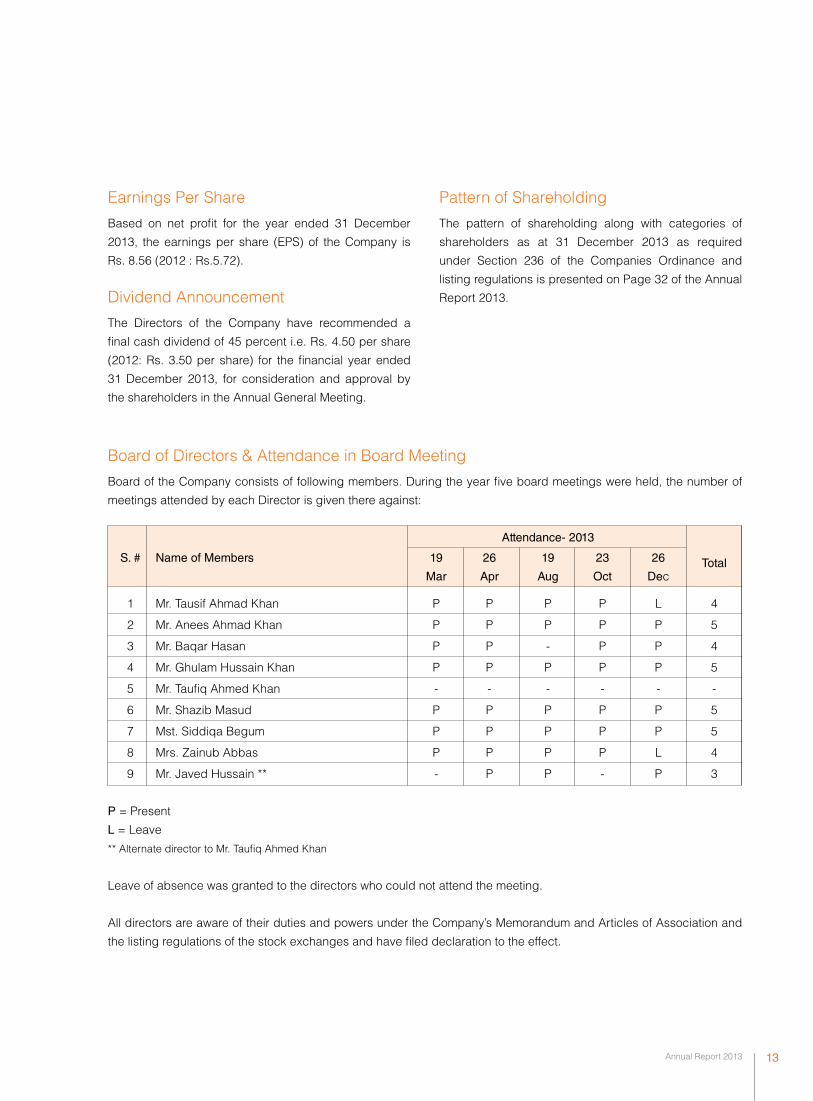
Board of Directors & Attendance in Board Meeting
Board of the Company consists of following members. During the year five board meetings were held, the number of
meetings attended by each Director is given there against:
Attendance- 2013
S. # Name of Members 19 26 19 23 26 Total Mar Apr Aug Oct Dec
1 Mr. Tausif Ahmad Khan P P P P L 4
2 Mr. Anees Ahmad Khan P P P P P 5
3 Mr. Baqar Hasan P P - P P 4
4 Mr. Ghulam Hussain Khan P P P P P 5
5 Mr. Taufiq Ahmed Khan - - - - - -
6 Mr. Shazib Masud P P P P P 5
7 Mst. Siddiqa Begum P P P P P 5
8 Mrs. Zainub Abbas P P P P L 4
9 Mr. Javed Hussain ** - P P - P 3
P = Present
L = Leave
** Alternate director to Mr. Taufiq Ahmed Khan
Leave of absence was granted to the directors who could not attend the meeting.
All directors are aware of their duties and powers under the Company’s Memorandum and Articles of Association and
the listing regulations of the stock exchanges and have filed declaration to the effect.
Annual Report 2013 13
Trading of Shares by Directors, CEO, CFO and Company Secretary etc.
Directors, Chief Executive Officer, Chief Financial Officer,
Company Secretary, their spouses and minor children
have not sold or purchased shares of the Company
during the period except following:
S. No. Name Addition Deletion
1 Mr. Tausif Ahmad Khan 20,605 -
2 Mr. Ghulam Hussain Khan 23,068 113,655
3 Mrs. Huma Hussain Khan - 143,701
The Board of Directors was accordingly apprised with the
above sale / purchase by the directors and their spouse
in the meeting held just after the transactions took place.
Audit Committee
Audit Committee constituted in accordance with the
requirements of Revised Code of Corporate Governance
2012 consists of the following members:
1. Mr. Shazib Masud
(Independent director) Chairman
2. Mr. G. H. Khan
(Non executive director) Member
3. Mrs. Zainub Abbas
(Non executive director) Member
During the year 05 meetings of Audit Committee were
held and the meetings attended by each member are
given there against:
Attendance - 2013
S.# Name of Members 14 14 22 16 14 Total Feb Mar Apr Aug Oct
1 Mr. Shazib Masud P P P P P 5
2 Mr. Ghulam Hussain Khan P P P P P 5
3 Mrs. Zainub Abbas* P L P P P 4
P = Present
L = Leave
Highnoon Laboratories Limited 14
Directors’ Reportto the Shareholders

Human Resource and Remuneration Committee
The Board of Directors, in compliance with the
requirements of Revised Code of Corporate Governance
2012, constituted Human Resource and Remuneration
(HR&R) Committee. The committee is responsible for
recommending to the Board human resource management
policies, selection, evaluation, compensation (including
retirement benefits) and succession planning of the CEO,
CFO, Company Secretary and head of Internal Audit and
recommending to CEO on matters of key management
positions who report directly to the CEO.
Following are the members of HR&R Committee:
1. Mr. Tausif Ahmad Khan
(Non-executive director) Chairman
2. Mr. Baqar Hasan,
(Executive Director) Member
3. Mrs. Zainub Abbas,
(Non-executive director) Member
Statement of Ethics and Business Practices
The Board has prepared and circulated the Statement
of Ethics and Business Practices signed by every
Director and employee of the Company as a token
of acknowledgement of his/her understanding of the
standards of conduct in relation to persons associated or
dealing with the Company.
External Auditors
The external auditors of the Company Ernst & Young
Ford Rhodes Sidat Hyder, Chartered Accountants shall
retire on the conclusion of Annual General Meeting.
Being eligible for re-appointment under the listing
regulations, they have offered their services as auditors
of the Company for the financial year 2014. The Audit
Committee has recommended the appointment of
Ernst & Young Ford Rhodes Sidat Hyder, Chartered
Accountants as Auditors of the Company for the year
ending 31 December 2014 and the Board agrees to the
recommendation of the Audit Committee. The Auditors
have also given their consent to work as Auditors for the
next year and have conveyed that they have been given
satisfactory rating under the Quality Control Review of
Institute of Chartered Accountants of Pakistan and the
Annual Report 2013 15
firm is fully compliant with the code of ethics issued by International Federation of Accountants (IFAC). Further they are also not rendering any related services to the Company. The Auditors have also confirmed that neither the firm nor any of their partners, their spouses or minor children at any time during the year held or traded in the shares of the Company.
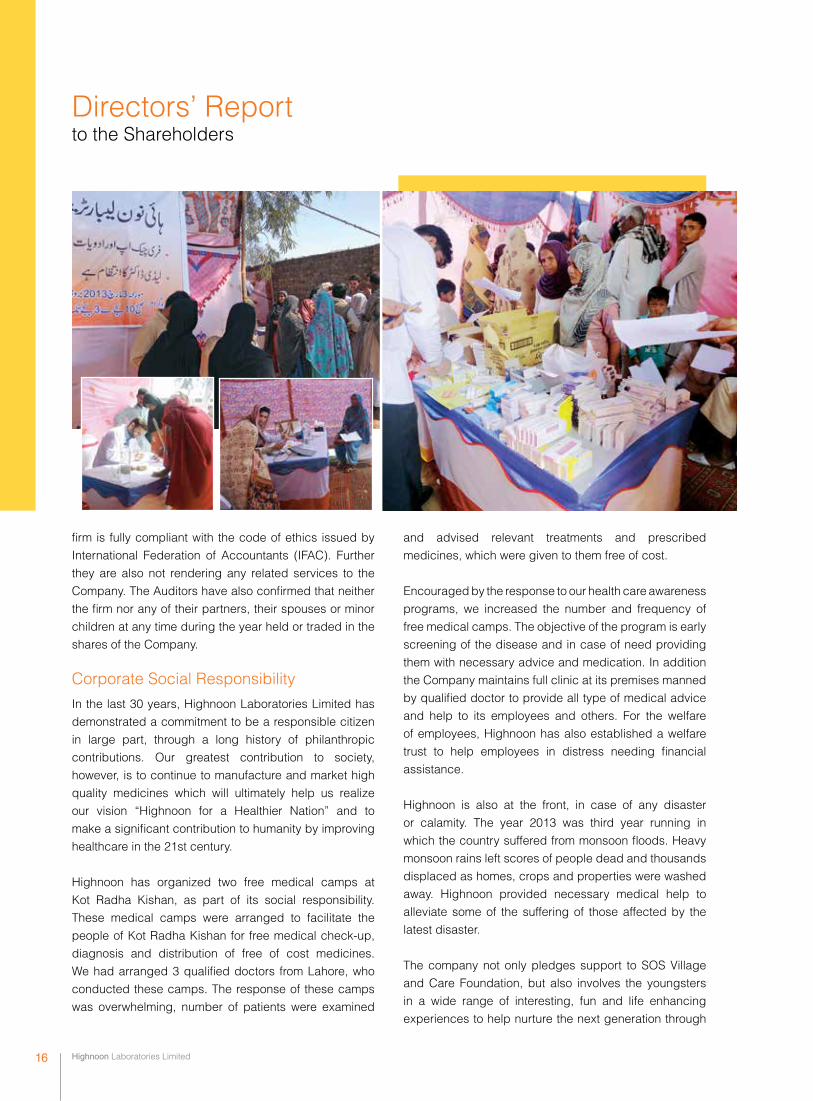
Corporate Social ResponsibilityIn the last 30 years, Highnoon Laboratories Limited has demonstrated a commitment to be a responsible citizen in large part, through a long history of philanthropic contributions. Our greatest contribution to society, however, is to continue to manufacture and market high quality medicines which will ultimately help us realize our vision “Highnoon for a Healthier Nation” and to make a significant contribution to humanity by improving healthcare in the 21st century. Highnoon has organized two free medical camps at Kot Radha Kishan, as part of its social responsibility. These medical camps were arranged to facilitate the people of Kot Radha Kishan for free medical check-up, diagnosis and distribution of free of cost medicines. We had arranged 3 qualified doctors from Lahore, who conducted these camps. The response of these camps was overwhelming, number of patients were examined
and advised relevant treatments and prescribed medicines, which were given to them free of cost.
Encouraged by the response to our health care awareness programs, we increased the number and frequency of free medical camps. The objective of the program is early screening of the disease and in case of need providing them with necessary advice and medication. In addition the Company maintains full clinic at its premises manned by qualified doctor to provide all type of medical advice and help to its employees and others. For the welfare of employees, Highnoon has also established a welfare trust to help employees in distress needing financial assistance.
Highnoon is also at the front, in case of any disaster or calamity. The year 2013 was third year running in which the country suffered from monsoon floods. Heavy monsoon rains left scores of people dead and thousands displaced as homes, crops and properties were washed away. Highnoon provided necessary medical help to alleviate some of the suffering of those affected by the latest disaster.
The company not only pledges support to SOS Village and Care Foundation, but also involves the youngsters in a wide range of interesting, fun and life enhancing experiences to help nurture the next generation through
Highnoon Laboratories Limited 16
Directors’ Reportto the Shareholders
supporting educational efforts and other co-curricular activities. We created an opportunity for young people with yearnings to become world class photographers and painters. Hundreds of aspiring young artists submitted entries, which were judged by a jury and winning pictures, were published in the form of calendars.
Corporate GovernanceThe Directors confirm compliance with the Corporate and Financial Reporting framework of the Code of Corporate Governance as contained in the listing regulations for the followings:
1. The financial statements together with the notes thereon have drawn up in conformity with the Companies Ordinance, 1984. These Statements, prepared by the management present fairly the Company’s state of affairs, the results of its operations, cash flows and changes in equity.
2. Proper Books of accounts have been maintained.
3. Accounting estimates are based on prudent judgments and there are no outstanding statutory payments on account of Government taxes, duties, levies and charges except for those which have been disclosed in note 12 and note 16 to the financial statements.
4. Appropriate accounting policies have been consistently applied in preparation of financial statements and accounting estimates are based on reasonable and prudent judgment.
5. There have been no material changes since 31 December 2013 and the Company has not entered into any commitment which would affect the financial position at the date.
6. An Audit Committee of the Board constituted in accordance with the requirement of Revised Code of Corporate Governance comprises of three members including the Chairman. Two members are Non-executive Directors while the Chairman is Independent Director. The Committee has its own terms of reference, which were determined by the Board of Directors in accordance with the guidelines provided in the Code of Corporate Governance.
7. International Accounting Standards, as applicable
in Pakistan, have been followed in preparation of financial statements.
8. The System of internal controls is sound in design and has been effectively implemented and monitored.
9. There are no significant doubts upon the Company’s ability to continue as a going concern.
10. None of the Directors have been convicted as a defaulter in payment of any loans of Banks / DFIs, nor they or their spouses are engaged in the business of stock brokerage. The Board has separately appended “Statement of Compliance with Best Practices of Corporate Governance” and auditors have given unqualified review report thereon.
11. There has been no significant departure from the Best Practices of Corporate Governance, as detailed in the listing regulations.
12. The principal value of investment of the Provident Fund based on un-audited figure as on 31 December 2013 was Rs.155.034 Million as compared to audited figures as at 31 December 2012 of Rs. 125.109 million.
13. Key financial data for the last six periods as an investors’ guide is annexed to the Directors’ Report.
Web PresenceAll our stakeholders and general public can log on to Company’s web site www.highnoon-labs.com where information relating to Company including periodic financial statements / annual reports etc., is available.
Chairman’s ReviewThe Directors endorse the contents of the Chairman’s Review, which form part of the Directors’ Report. The Board authorized the Chief Executive Officer to sign the
Directors’ Report on behalf of the Board.
For and on behalf of the Board
Lahore: Baqar Hasan
18 March 2014 Chief Executive Officer
Annual Report 2013 17
Highnoon Laboratories Limited 18
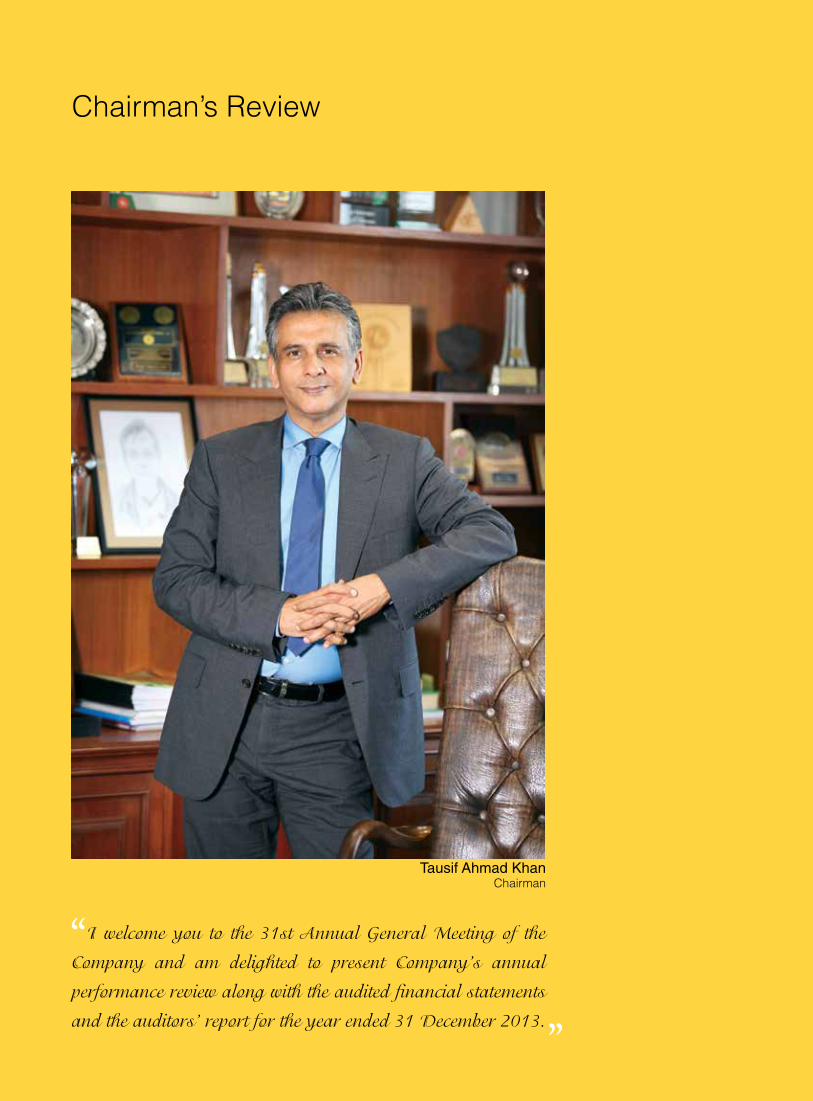
Chairman’s Review
Tausif Ahmad KhanChairman
“
“
I welcome you to the 31st Annual General Meeting of the
Company and am delighted to present Company’s annual
performance review along with the audited financial statements
and the auditors’ report for the year ended 31 December 2013.

Local Export
Sales Trend
13.0
(Rs.in million)
900
1,200
1,500
1,800
2,100
2,400
2,700
3,000
201320122011201020092008
Profitability Margins
GP.
EB
ITD
A a
nd O
pera
ting
Mar
gin
%
NPB
T and NPAT M
argin %
201320122011201020092008Years
G P Margin EBITDA Margin
NPBT NPATOperating Profit Margin
0
1
2
3
4
5
6
7
8
9
0
5
10
15
20
25
30
35
40
45
Annual Report 2013 19
Financial Highlights
The year 2013 shall be remembered
as an exciting and productive year
for Highnoon. It was the year during
which many of our brands grew
significantly and our financial results
improved. It was fulfillment of the
initiatives necessary to achieve our
vision to become a growth driven
company, a company known for its
ability to build brands and create
sustained value for our shareholders.
The financial results of 2013 have
exceeded our expectations. Our
sales grew to Rs. 3 billion registering
an increase of 22 percent. Local sales
registered an increase of 23 percent,
while export and third party sales
registered an increase of 18 percent
and 15 percent respectively. The
gross margin was maintained while
operating expenses as a percentage
of sales, remained unchanged. This
performance helped us to generate
free cash flow of Rs.359 million
that was used to reduce short term
borrowings.
The increase in local sales was mainly
driven by volumes that increased
by 18 percent over last year. The
volumetric increase came from the
established brands and the relatively
new brands. Consistent with the
increase in sales volume, the cost of
goods sold increased from Rs.1,440
million to Rs.1,777 million during the
fiscal year 2013. Despite increase
in costs of imported materials on
account of exchange rate parity and
electricity costs; we were still able to
maintain margins. Distribution and
sales promotion expenses increased
by 23 percent over last year primarily
on account of marketing investments
on new products. Administrative and
general expenses were contained
and these remained within limits.
Finance cost showed a decline of 58
percent owing to better management
of working capital and available free
cash flows that repaid short term
borrowings.
Highnoon Laboratories Limited 20
Chairman’s Review
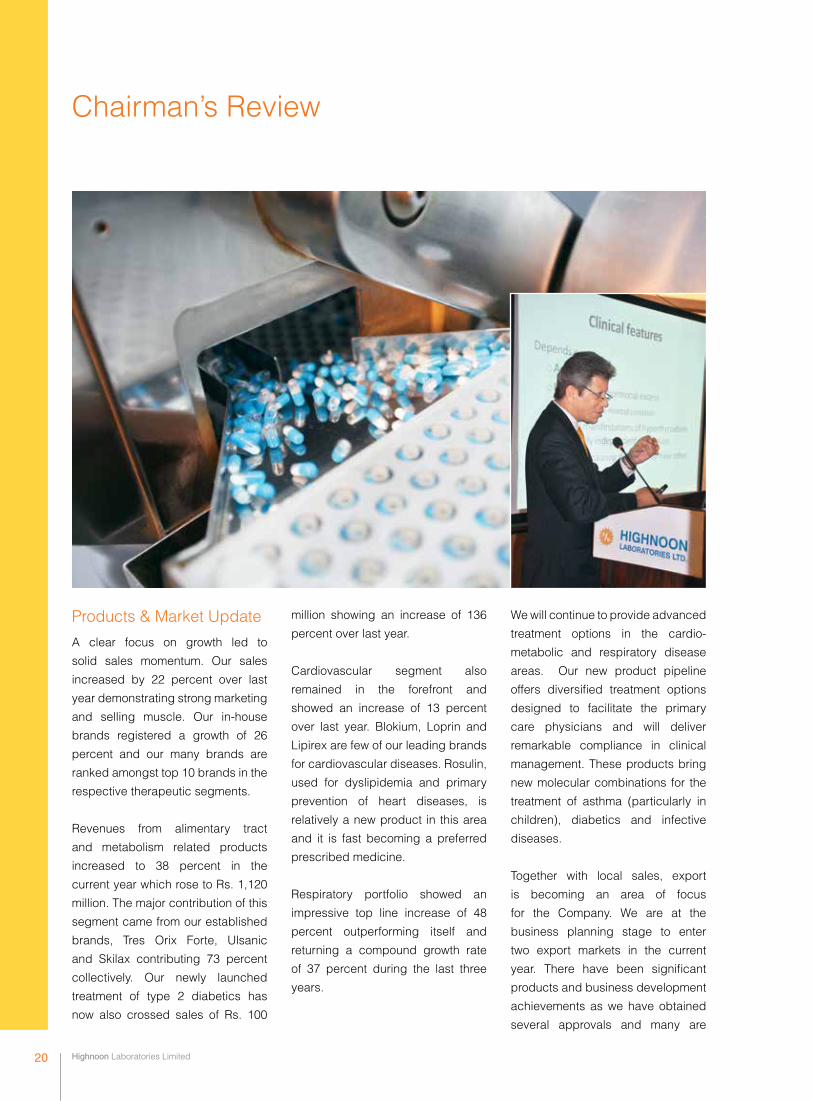
Products & Market Update
A clear focus on growth led to
solid sales momentum. Our sales
increased by 22 percent over last
year demonstrating strong marketing
and selling muscle. Our in-house
brands registered a growth of 26
percent and our many brands are
ranked amongst top 10 brands in the
respective therapeutic segments.
Revenues from alimentary tract
and metabolism related products
increased to 38 percent in the
current year which rose to Rs. 1,120
million. The major contribution of this
segment came from our established
brands, Tres Orix Forte, Ulsanic
and Skilax contributing 73 percent
collectively. Our newly launched
treatment of type 2 diabetics has
now also crossed sales of Rs. 100
million showing an increase of 136
percent over last year.
Cardiovascular segment also
remained in the forefront and
showed an increase of 13 percent
over last year. Blokium, Loprin and
Lipirex are few of our leading brands
for cardiovascular diseases. Rosulin,
used for dyslipidemia and primary
prevention of heart diseases, is
relatively a new product in this area
and it is fast becoming a preferred
prescribed medicine.
Respiratory portfolio showed an
impressive top line increase of 48
percent outperforming itself and
returning a compound growth rate
of 37 percent during the last three
years.
We will continue to provide advanced
treatment options in the cardio-
metabolic and respiratory disease
areas. Our new product pipeline
offers diversified treatment options
designed to facilitate the primary
care physicians and will deliver
remarkable compliance in clinical
management. These products bring
new molecular combinations for the
treatment of asthma (particularly in
children), diabetics and infective
diseases.
Together with local sales, export
is becoming an area of focus
for the Company. We are at the
business planning stage to enter
two export markets in the current
year. There have been significant
products and business development
achievements as we have obtained
several approvals and many are
Realizing DreamsRealizing Dreams
Annual Report 2013 21
Highnoon Laboratories Limited 22
in the pipeline. Furthermore, new
opportunities are also being explored
and evaluated to continuously
strengthen our in licensing product
portfolio.
The Pakistan pharmaceutical
industry remained in the limelight
once again, albeit for the wrong
reasons. The industry struggled with
the authorities for a price increase but
the authorities remained inflexible.
The prices of majority medicines
produced by the multinationals and
local companies have remained
unchanged since 2001, while
the input costs have escalated
enormously since 2001. If the prices
of medicines are not adjusted even
after a 12-year gap, the companies
following international safety and
efficacy standards will be forced out
of business.
This stalemate has already
reduced the production capacity
of the Industry and threatens to
completely destroy the Industry. In
the absence of clear pricing policy,
the Industry has already seen exit of
some multinational companies and
closure of few local companies. The
Chairman’s Review
authorities must seriously consider
the demand of pharmaceutical
industry for price adjustment
mechanism to ensure that life-saving
and essential medicines remain in
the market. Pricing issue is just one
of the many concerns of the Industry,
other being delays in product
registrations, toll manufacturing
policy and licensing to name a few.
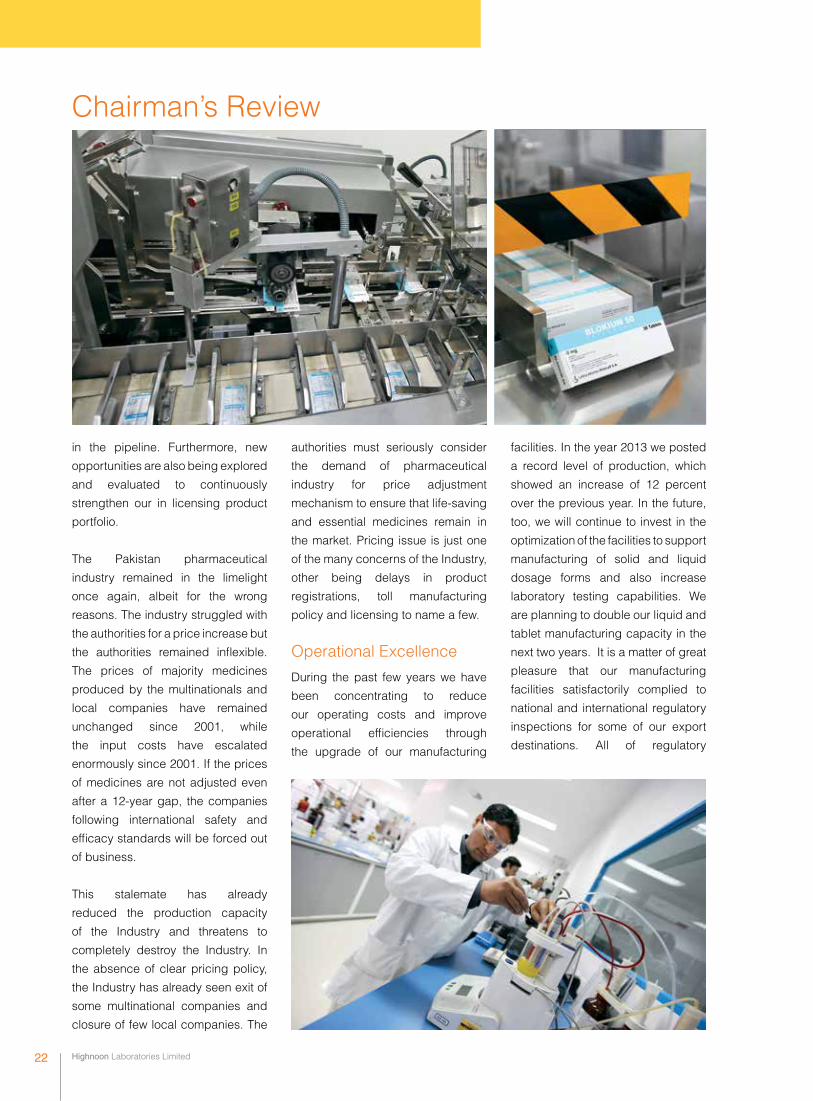
Operational Excellence
During the past few years we have
been concentrating to reduce
our operating costs and improve
operational efficiencies through
the upgrade of our manufacturing
facilities. In the year 2013 we posted
a record level of production, which
showed an increase of 12 percent
over the previous year. In the future,
too, we will continue to invest in the
optimization of the facilities to support
manufacturing of solid and liquid
dosage forms and also increase
laboratory testing capabilities. We
are planning to double our liquid and
tablet manufacturing capacity in the
next two years. It is a matter of great
pleasure that our manufacturing
facilities satisfactorily complied to
national and international regulatory
inspections for some of our export
destinations. All of regulatory
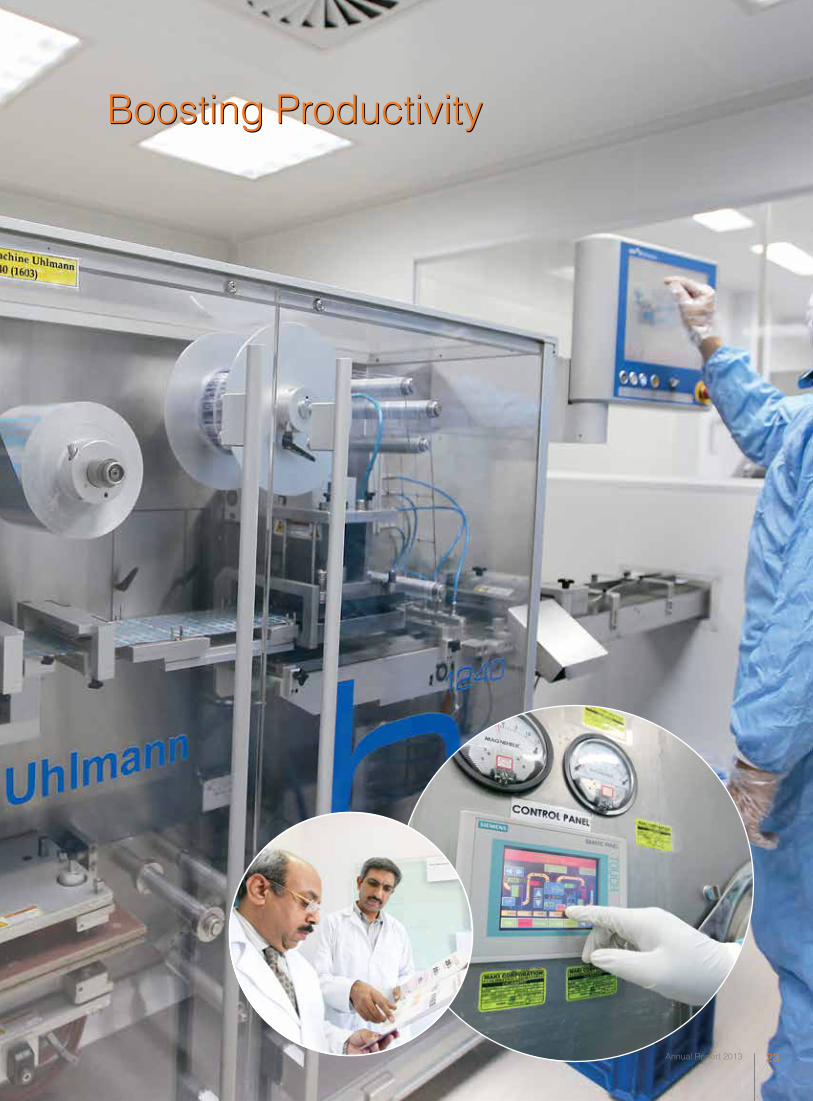
Boosting ProductivityBoosting Productivity
Annual Report 2013 23
Highnoon Laboratories Limited 24
Chairman’s Review
inspections have maintained a
satisfactory GMP status for our plant.
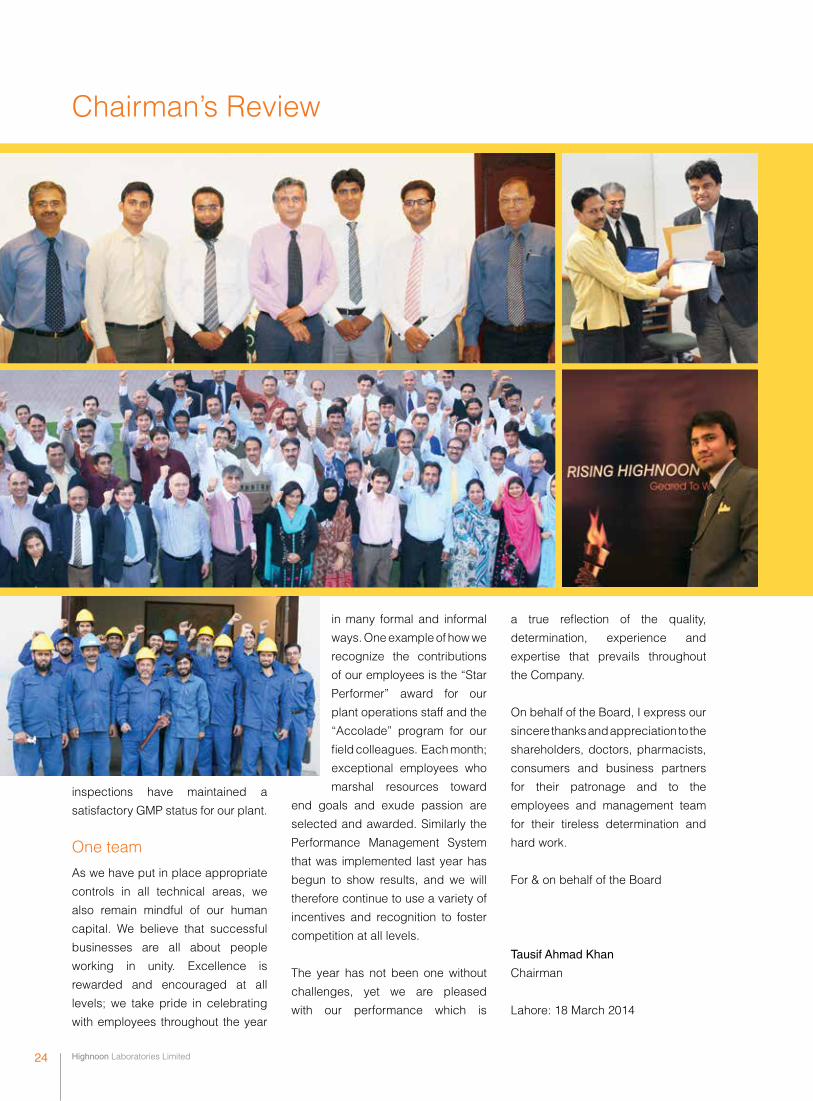
One team
As we have put in place appropriate
controls in all technical areas, we
also remain mindful of our human
capital. We believe that successful
businesses are all about people
working in unity. Excellence is
rewarded and encouraged at all
levels; we take pride in celebrating
with employees throughout the year
in many formal and informal
ways. One example of how we
recognize the contributions
of our employees is the “Star
Performer” award for our
plant operations staff and the
“Accolade” program for our
field colleagues. Each month;
exceptional employees who
marshal resources toward
end goals and exude passion are
selected and awarded. Similarly the
Performance Management System
that was implemented last year has
begun to show results, and we will
therefore continue to use a variety of
incentives and recognition to foster
competition at all levels.
The year has not been one without
challenges, yet we are pleased
with our performance which is
a true reflection of the quality,
determination, experience and
expertise that prevails throughout
the Company.
On behalf of the Board, I express our
sincere thanks and appreciation to the
shareholders, doctors, pharmacists,
consumers and business partners
for their patronage and to the
employees and management team
for their tireless determination and
hard work.
For & on behalf of the Board
Tausif Ahmad Khan
Chairman
Lahore: 18 March 2014

Annual Report 2013 25
Top 10 Products of Highnoon
Tres OrixUlsanicCyrocinLoprinLipirexTagipmetCombivairTiovairAirtalKestine
10%7%
4%
3%
6%
4%
4%
9%
8%
6%
Highnoon Laboratories Limited 26
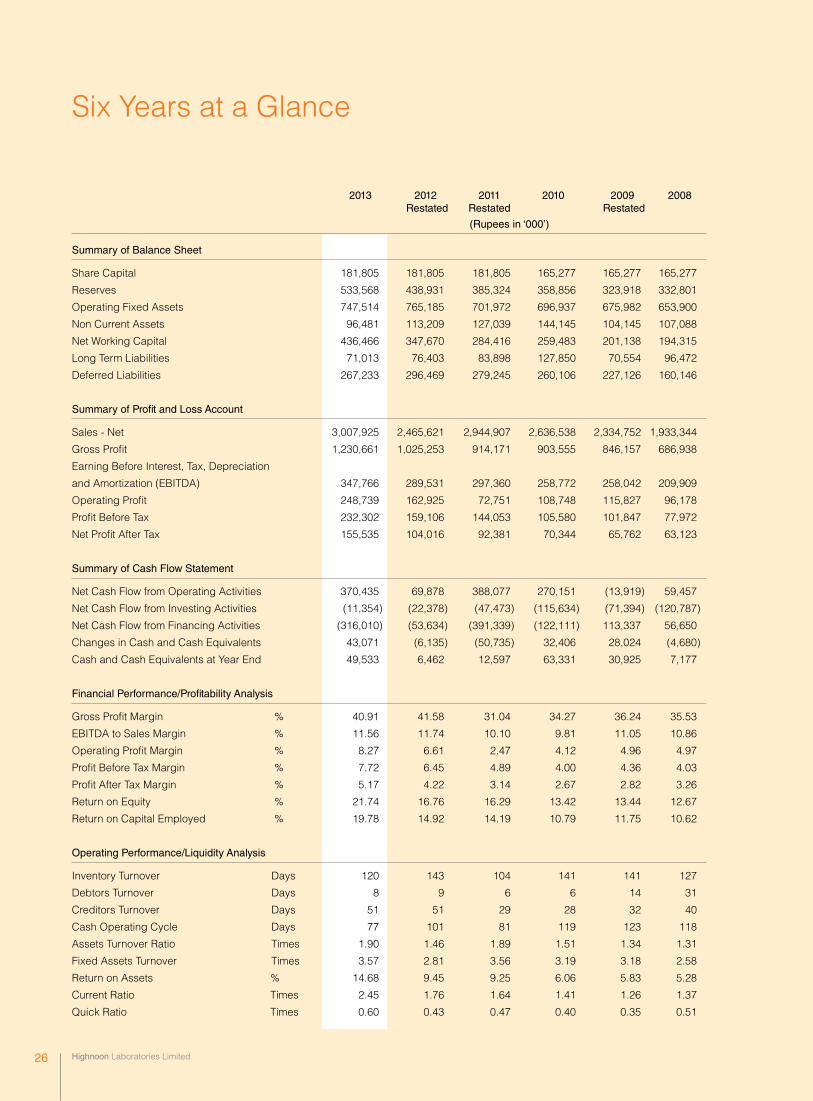
Six Years at a Glance
2013 2012 2011 2010 2009 2008 Restated Restated Restated
(Rupees in ‘000’)
Summary of Balance Sheet
Share Capital 181,805 181,805 181,805 165,277 165,277 165,277
Reserves 533,568 438,931 385,324 358,856 323,918 332,801
Operating Fixed Assets 747,514 765,185 701,972 696,937 675,982 653,900
Non Current Assets 96,481 113,209 127,039 144,145 104,145 107,088
Net Working Capital 436,466 347,670 284,416 259,483 201,138 194,315
Long Term Liabilities 71,013 76,403 83,898 127,850 70,554 96,472
Deferred Liabilities 267,233 296,469 279,245 260,106 227,126 160,146
Summary of Profit and Loss Account
Sales - Net 3,007,925 2,465,621 2,944,907 2,636,538 2,334,752 1,933,344
Gross Profit 1,230,661 1,025,253 914,171 903,555 846,157 686,938
Earning Before Interest, Tax, Depreciation
and Amortization (EBITDA) 347,766 289,531 297,360 258,772 258,042 209,909
Operating Profit 248,739 162,925 72,751 108,748 115,827 96,178
Profit Before Tax 232,302 159,106 144,053 105,580 101,847 77,972
Net Profit After Tax 155,535 104,016 92,381 70,344 65,762 63,123
Summary of Cash Flow Statement
Net Cash Flow from Operating Activities 370,435 69,878 388,077 270,151 (13,919) 59,457
Net Cash Flow from Investing Activities (11,354) (22,378) (47,473) (115,634) (71,394) (120,787)
Net Cash Flow from Financing Activities (316,010) (53,634) (391,339) (122,111) 113,337 56,650
Changes in Cash and Cash Equivalents 43,071 (6,135) (50,735) 32,406 28,024 (4,680)
Cash and Cash Equivalents at Year End 49,533 6,462 12,597 63,331 30,925 7,177
Financial Performance/Profitability Analysis
Gross Profit Margin % 40.91 41.58 31.04 34.27 36.24 35.53
EBITDA to Sales Margin % 11.56 11.74 10.10 9.81 11.05 10.86
Operating Profit Margin % 8.27 6.61 2.47 4.12 4.96 4.97
Profit Before Tax Margin % 7.72 6.45 4.89 4.00 4.36 4.03
Profit After Tax Margin % 5.17 4.22 3.14 2.67 2.82 3.26
Return on Equity % 21.74 16.76 16.29 13.42 13.44 12.67
Return on Capital Employed % 19.78 14.92 14.19 10.79 11.75 10.62
Operating Performance/Liquidity Analysis
Inventory Turnover Days 120 143 104 141 141 127
Debtors Turnover Days 8 9 6 6 14 31
Creditors Turnover Days 51 51 29 28 32 40
Cash Operating Cycle Days 77 101 81 119 123 118
Assets Turnover Ratio Times 1.90 1.46 1.89 1.51 1.34 1.31
Fixed Assets Turnover Times 3.57 2.81 3.56 3.19 3.18 2.58
Return on Assets % 14.68 9.45 9.25 6.06 5.83 5.28
Current Ratio Times 2.45 1.76 1.64 1.41 1.26 1.37
Quick Ratio Times 0.60 0.43 0.47 0.40 0.35 0.51
Annual Report 2013 27
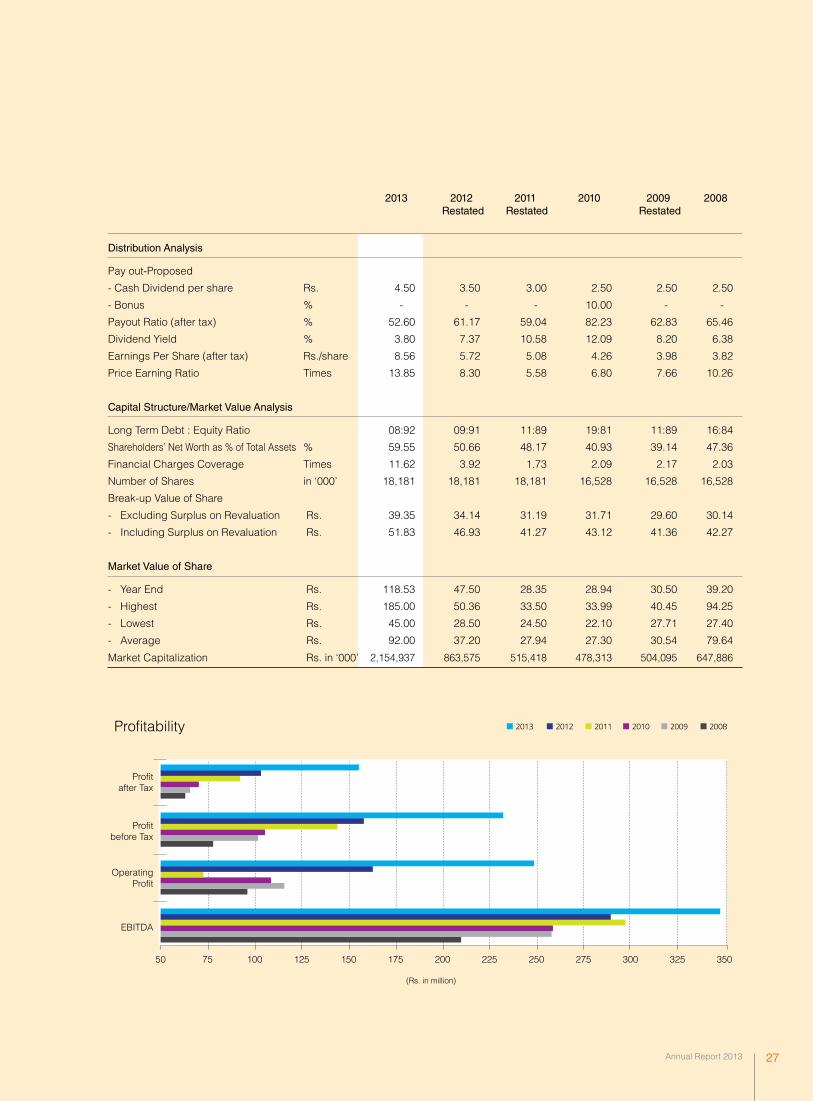
2013 2012 2011 2010 2009 2008 Restated Restated Restated
Distribution Analysis
Pay out-Proposed
- Cash Dividend per share Rs. 4.50 3.50 3.00 2.50 2.50 2.50
- Bonus % - - - 10.00 - -
Payout Ratio (after tax) % 52.60 61.17 59.04 82.23 62.83 65.46
Dividend Yield % 3.80 7.37 10.58 12.09 8.20 6.38
Earnings Per Share (after tax) Rs./share 8.56 5.72 5.08 4.26 3.98 3.82
Price Earning Ratio Times 13.85 8.30 5.58 6.80 7.66 10.26
Capital Structure/Market Value Analysis
Long Term Debt : Equity Ratio 08:92 09:91 11:89 19:81 11:89 16:84
Shareholders’ Net Worth as % of Total Assets % 59.55 50.66 48.17 40.93 39.14 47.36
Financial Charges Coverage Times 11.62 3.92 1.73 2.09 2.17 2.03
Number of Shares in ‘000’ 18,181 18,181 18,181 16,528 16,528 16,528
Break-up Value of Share
- Excluding Surplus on Revaluation Rs. 39.35 34.14 31.19 31.71 29.60 30.14
- Including Surplus on Revaluation Rs. 51.83 46.93 41.27 43.12 41.36 42.27
Market Value of Share
- Year End Rs. 118.53 47.50 28.35 28.94 30.50 39.20
- Highest Rs. 185.00 50.36 33.50 33.99 40.45 94.25
- Lowest Rs. 45.00 28.50 24.50 22.10 27.71 27.40
- Average Rs. 92.00 37.20 27.94 27.30 30.54 79.64
Market Capitalization Rs. in ‘000’ 2,154,937 863,575 515,418 478,313 504,095 647,886
Profitability
Profitbefore Tax
OperatingProfit
50 75 100 125 150 175 200 225 250 275 300 325 350
EBITDA
Profitafter Tax
2013 2012 2011 2010 2009 2008
(Rs. in million)
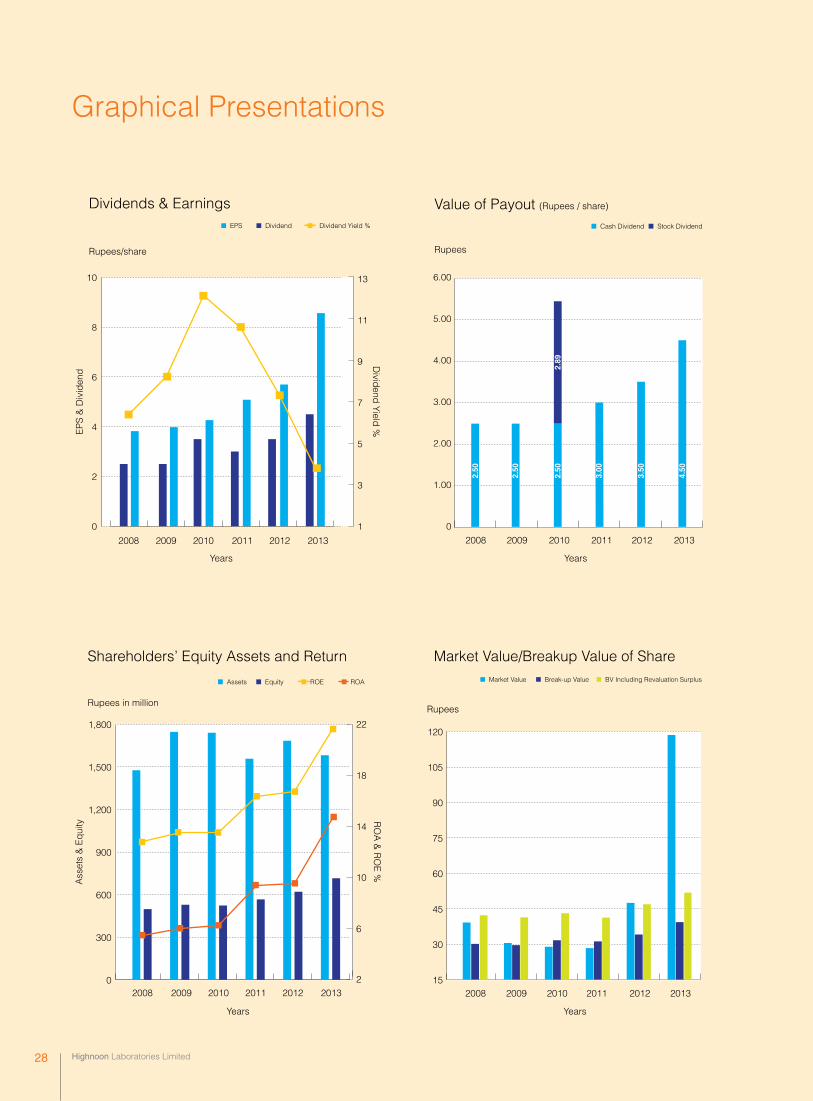
Graphical Presentations
EPS Dividend Dividend Yield %
Dividends & Earnings
Rupees/share
Dividend Yield %EP
S &
Div
iden
d
0
2
4
6
8
10
2013201220112010200920081
3
5
7
9
11
13
Years
Value of Payout (Rupees / share)
Cash Dividend Stock Dividend
201320122011201020092008
Years
Rupees
6.00
5.00
4.00
3.00
2.00
1.00
0
2.50
2.50
3.00
2.50
2.89
3.50
4.50
Shareholders’ Equity Assets and Return
Years
Rupees in million
RO
A &
RO
E %
Ass
ets
& E
quity
EquityAssets ROE ROA
0
300
600
900
1,200
1,500
1,800
2
6
10
14
18
22
201320122011201020092008
Market Value/Breakup Value of Share
Years
Rupees
Market Value Break-up Value BV Including Revaluation Surplus
20132012201120102009200815
30
45
60
75
90
105
120
Highnoon Laboratories Limited 28
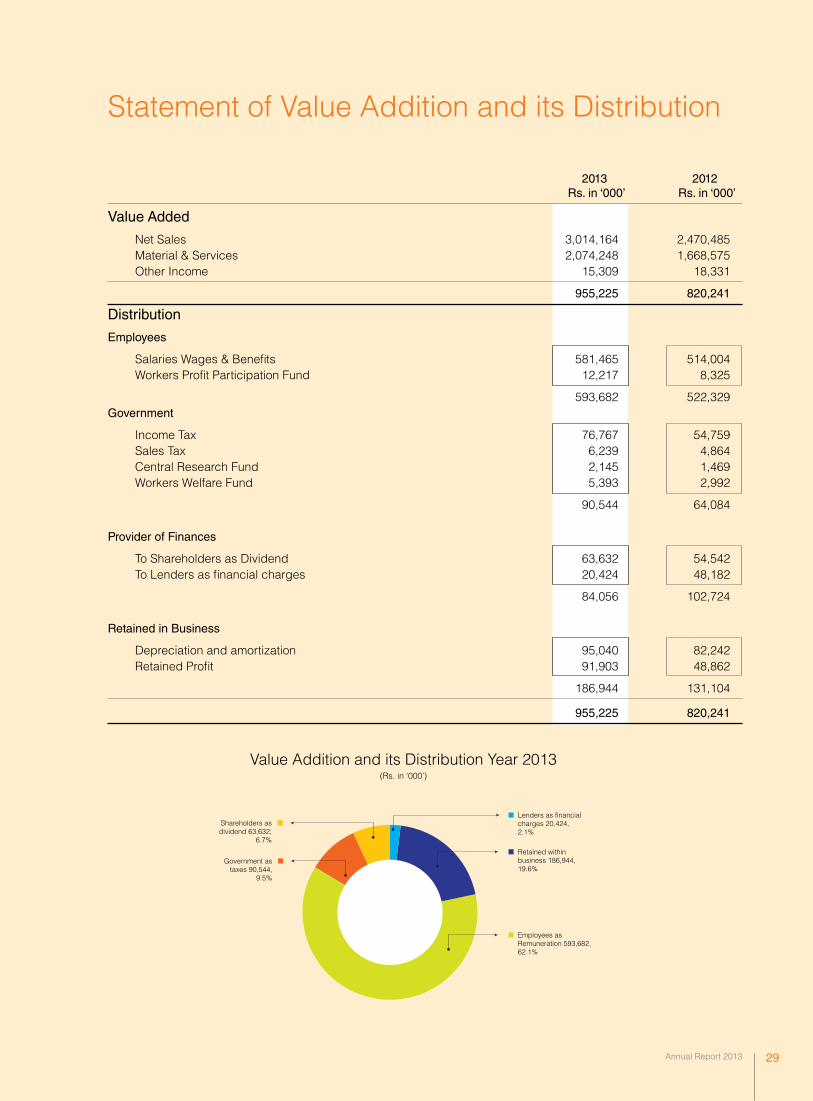
2013 2012 Rs. in ‘000’ Rs. in ‘000’
Value Added
Net Sales 3,014,164 2,470,485 Material & Services 2,074,248 1,668,575 Other Income 15,309 18,331
955,225 820,241
Distribution
Employees
Salaries Wages & Benefits 581,465 514,004 Workers Profit Participation Fund 12,217 8,325
593,682 522,329 Government
Income Tax 76,767 54,759 Sales Tax 6,239 4,864 Central Research Fund 2,145 1,469 Workers Welfare Fund 5,393 2,992
90,544 64,084 Provider of Finances
To Shareholders as Dividend 63,632 54,542 To Lenders as financial charges 20,424 48,182
84,056 102,724 Retained in Business
Depreciation and amortization 95,040 82,242 Retained Profit 91,903 48,862
186,944 131,104
955,225 820,241
Statement of Value Addition and its Distribution
Value Addition and its Distribution Year 2013(Rs. in ‘000’)
Lenders as financial charges 20,424,2.1%
Retained within business 186,944,19.6%
Shareholders asdividend 63,632,
6.7%
Government astaxes 90,544,
9.5%
Employees asRemuneration 593,682,62.1%
Annual Report 2013 29
Highnoon Laboratories Limited 30
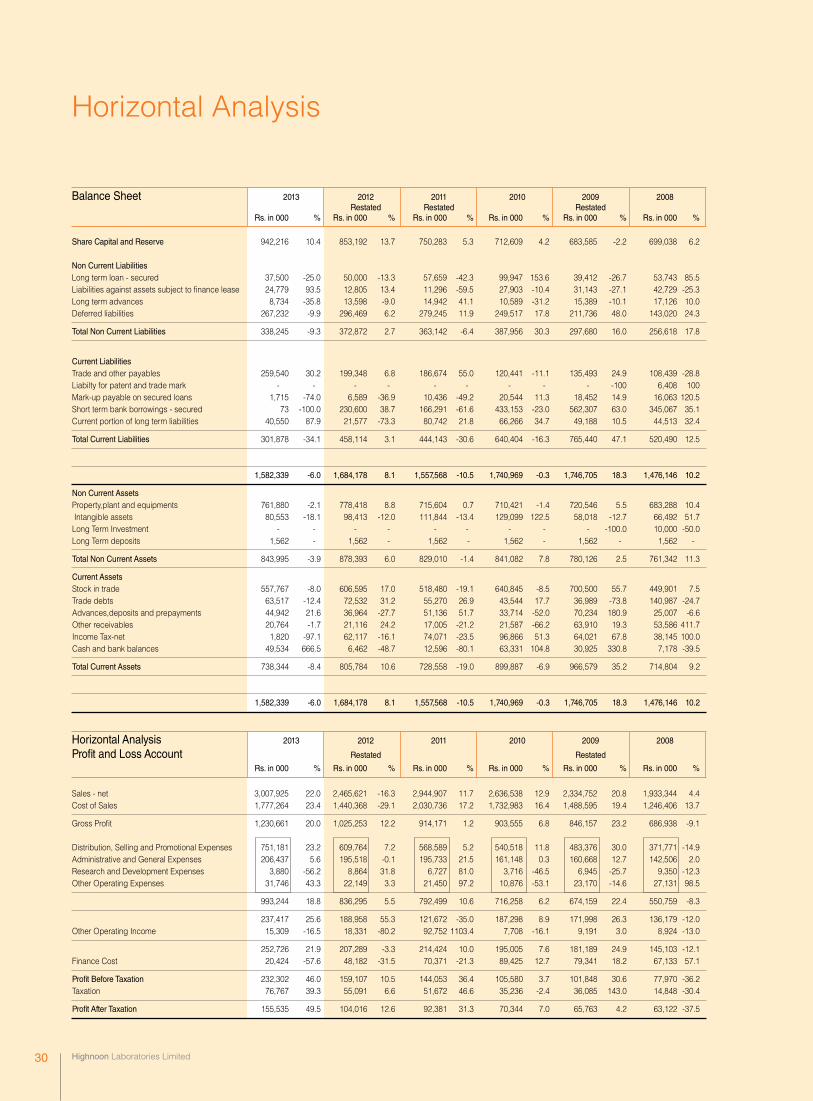
Horizontal Analysis
Horizontal Analysis 2013 2012 2011 2010 2009 2008
Profit and Loss Account Restated Restated
Rs. in 000 % Rs. in 000 % Rs. in 000 % Rs. in 000 % Rs. in 000 % Rs. in 000 %
Sales - net 3,007,925 22.0 2,465,621 -16.3 2,944,907 11.7 2,636,538 12.9 2,334,752 20.8 1,933,344 4.4Cost of Sales 1,777,264 23.4 1,440,368 -29.1 2,030,736 17.2 1,732,983 16.4 1,488,595 19.4 1,246,406 13.7
Gross Profit 1,230,661 20.0 1,025,253 12.2 914,171 1.2 903,555 6.8 846,157 23.2 686,938 -9.1 Distribution, Selling and Promotional Expenses 751,181 23.2 609,764 7.2 568,589 5.2 540,518 11.8 483,376 30.0 371,771 -14.9Administrative and General Expenses 206,437 5.6 195,518 -0.1 195,733 21.5 161,148 0.3 160,668 12.7 142,506 2.0Research and Development Expenses 3,880 -56.2 8,864 31.8 6,727 81.0 3,716 -46.5 6,945 -25.7 9,350 -12.3Other Operating Expenses 31,746 43.3 22,149 3.3 21,450 97.2 10,876 -53.1 23,170 -14.6 27,131 98.5
993,244 18.8 836,295 5.5 792,499 10.6 716,258 6.2 674,159 22.4 550,759 -8.3
237,417 25.6 188,958 55.3 121,672 -35.0 187,298 8.9 171,998 26.3 136,179 -12.0Other Operating Income 15,309 -16.5 18,331 -80.2 92,752 1103.4 7,708 -16.1 9,191 3.0 8,924 -13.0
252,726 21.9 207,289 -3.3 214,424 10.0 195,005 7.6 181,189 24.9 145,103 -12.1Finance Cost 20,424 -57.6 48,182 -31.5 70,371 -21.3 89,425 12.7 79,341 18.2 67,133 57.1
Profit Before Taxation 232,302 46.0 159,107 10.5 144,053 36.4 105,580 3.7 101,848 30.6 77,970 -36.2Taxation 76,767 39.3 55,091 6.6 51,672 46.6 35,236 -2.4 36,085 143.0 14,848 -30.4
Profit After Taxation 155,535 49.5 104,016 12.6 92,381 31.3 70,344 7.0 65,763 4.2 63,122 -37.5
Balance Sheet 2013 2012 2011 2010 2009 2008 Restated Restated Restated Rs. in 000 % Rs. in 000 % Rs. in 000 % Rs. in 000 % Rs. in 000 % Rs. in 000 % Share Capital and Reserve 942,216 10.4 853,192 13.7 750,283 5.3 712,609 4.2 683,585 -2.2 699,038 6.2 Non Current Liabilities Long term loan - secured 37,500 -25.0 50,000 -13.3 57,659 -42.3 99,947 153.6 39,412 -26.7 53,743 85.5Liabilities against assets subject to finance lease 24,779 93.5 12,805 13.4 11,296 -59.5 27,903 -10.4 31,143 -27.1 42,729 -25.3Long term advances 8,734 -35.8 13,598 -9.0 14,942 41.1 10,589 -31.2 15,389 -10.1 17,126 10.0Deferred liabilities 267,232 -9.9 296,469 6.2 279,245 11.9 249,517 17.8 211,736 48.0 143,020 24.3
Total Non Current Liabilities 338,245 -9.3 372,872 2.7 363,142 -6.4 387,956 30.3 297,680 16.0 256,618 17.8
Current Liabilities Trade and other payables 259,540 30.2 199,348 6.8 186,674 55.0 120,441 -11.1 135,493 24.9 108,439 -28.8Liabilty for patent and trade mark - - - - - - - - - -100 6,408 100Mark-up payable on secured loans 1,715 -74.0 6,589 -36.9 10,436 -49.2 20,544 11.3 18,452 14.9 16,063 120.5Short term bank borrowings - secured 73 -100.0 230,600 38.7 166,291 -61.6 433,153 -23.0 562,307 63.0 345,067 35.1Current portion of long term liabilities 40,550 87.9 21,577 -73.3 80,742 21.8 66,266 34.7 49,188 10.5 44,513 32.4
Total Current Liabilities 301,878 -34.1 458,114 3.1 444,143 -30.6 640,404 -16.3 765,440 47.1 520,490 12.5
1,582,339 -6.0 1,684,178 8.1 1,557,568 -10.5 1,740,969 -0.3 1,746,705 18.3 1,476,146 10.2
Non Current Assets Property,plant and equipments 761,880 -2.1 778,418 8.8 715,604 0.7 710,421 -1.4 720,546 5.5 683,288 10.4 Intangible assets 80,553 -18.1 98,413 -12.0 111,844 -13.4 129,099 122.5 58,018 -12.7 66,492 51.7Long Term Investment - - - - - - - - - -100.0 10,000 -50.0Long Term deposits 1,562 - 1,562 - 1,562 - 1,562 - 1,562 - 1,562 -
Total Non Current Assets 843,995 -3.9 878,393 6.0 829,010 -1.4 841,082 7.8 780,126 2.5 761,342 11.3
Current Assets Stock in trade 557,767 -8.0 606,595 17.0 518,480 -19.1 640,845 -8.5 700,500 55.7 449,901 7.5Trade debts 63,517 -12.4 72,532 31.2 55,270 26.9 43,544 17.7 36,989 -73.8 140,987 -24.7Advances,deposits and prepayments 44,942 21.6 36,964 -27.7 51,136 51.7 33,714 -52.0 70,234 180.9 25,007 -6.6Other receivables 20,764 -1.7 21,116 24.2 17,005 -21.2 21,587 -66.2 63,910 19.3 53,586 411.7Income Tax-net 1,820 -97.1 62,117 -16.1 74,071 -23.5 96,866 51.3 64,021 67.8 38,145 100.0Cash and bank balances 49,534 666.5 6,462 -48.7 12,596 -80.1 63,331 104.8 30,925 330.8 7,178 -39.5
Total Current Assets 738,344 -8.4 805,784 10.6 728,558 -19.0 899,887 -6.9 966,579 35.2 714,804 9.2
1,582,339 -6.0 1,684,178 8.1 1,557,568 -10.5 1,740,969 -0.3 1,746,705 18.3 1,476,146 10.2
Annual Report 2013 31
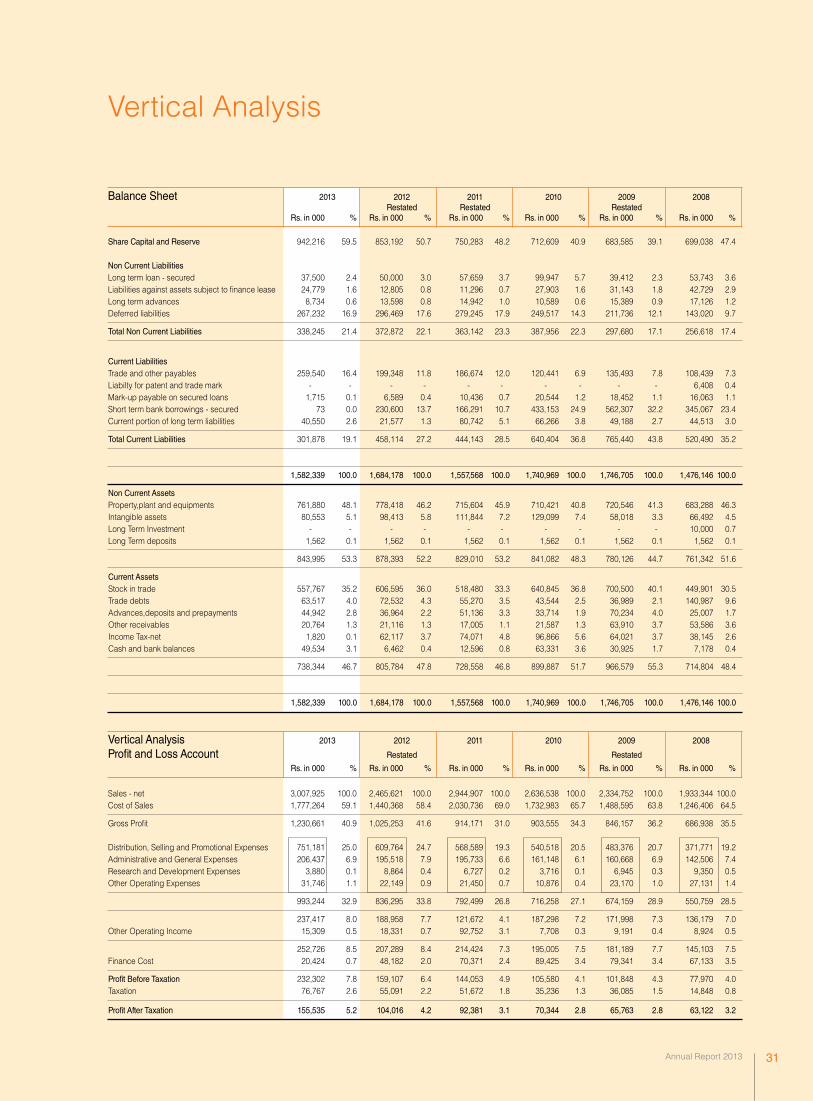
Vertical Analysis
Balance Sheet 2013 2012 2011 2010 2009 2008 Restated Restated Restated Rs. in 000 % Rs. in 000 % Rs. in 000 % Rs. in 000 % Rs. in 000 % Rs. in 000 %
Share Capital and Reserve 942,216 59.5 853,192 50.7 750,283 48.2 712,609 40.9 683,585 39.1 699,038 47.4 Non Current Liabilities Long term loan - secured 37,500 2.4 50,000 3.0 57,659 3.7 99,947 5.7 39,412 2.3 53,743 3.6Liabilities against assets subject to finance lease 24,779 1.6 12,805 0.8 11,296 0.7 27,903 1.6 31,143 1.8 42,729 2.9Long term advances 8,734 0.6 13,598 0.8 14,942 1.0 10,589 0.6 15,389 0.9 17,126 1.2Deferred liabilities 267,232 16.9 296,469 17.6 279,245 17.9 249,517 14.3 211,736 12.1 143,020 9.7
Total Non Current Liabilities 338,245 21.4 372,872 22.1 363,142 23.3 387,956 22.3 297,680 17.1 256,618 17.4
Current Liabilities Trade and other payables 259,540 16.4 199,348 11.8 186,674 12.0 120,441 6.9 135,493 7.8 108,439 7.3Liabilty for patent and trade mark - - - - - - - - - - 6,408 0.4Mark-up payable on secured loans 1,715 0.1 6,589 0.4 10,436 0.7 20,544 1.2 18,452 1.1 16,063 1.1Short term bank borrowings - secured 73 0.0 230,600 13.7 166,291 10.7 433,153 24.9 562,307 32.2 345,067 23.4Current portion of long term liabilities 40,550 2.6 21,577 1.3 80,742 5.1 66,266 3.8 49,188 2.7 44,513 3.0
Total Current Liabilities 301,878 19.1 458,114 27.2 444,143 28.5 640,404 36.8 765,440 43.8 520,490 35.2
1,582,339 100.0 1,684,178 100.0 1,557,568 100.0 1,740,969 100.0 1,746,705 100.0 1,476,146 100.0
Non Current Assets Property,plant and equipments 761,880 48.1 778,418 46.2 715,604 45.9 710,421 40.8 720,546 41.3 683,288 46.3Intangible assets 80,553 5.1 98,413 5.8 111,844 7.2 129,099 7.4 58,018 3.3 66,492 4.5Long Term Investment - - - - - - - - - - 10,000 0.7Long Term deposits 1,562 0.1 1,562 0.1 1,562 0.1 1,562 0.1 1,562 0.1 1,562 0.1
843,995 53.3 878,393 52.2 829,010 53.2 841,082 48.3 780,126 44.7 761,342 51.6
Current Assets Stock in trade 557,767 35.2 606,595 36.0 518,480 33.3 640,845 36.8 700,500 40.1 449,901 30.5Trade debts 63,517 4.0 72,532 4.3 55,270 3.5 43,544 2.5 36,989 2.1 140,987 9.6Advances,deposits and prepayments 44,942 2.8 36,964 2.2 51,136 3.3 33,714 1.9 70,234 4.0 25,007 1.7Other receivables 20,764 1.3 21,116 1.3 17,005 1.1 21,587 1.3 63,910 3.7 53,586 3.6Income Tax-net 1,820 0.1 62,117 3.7 74,071 4.8 96,866 5.6 64,021 3.7 38,145 2.6Cash and bank balances 49,534 3.1 6,462 0.4 12,596 0.8 63,331 3.6 30,925 1.7 7,178 0.4
738,344 46.7 805,784 47.8 728,558 46.8 899,887 51.7 966,579 55.3 714,804 48.4
1,582,339 100.0 1,684,178 100.0 1,557,568 100.0 1,740,969 100.0 1,746,705 100.0 1,476,146 100.0
Vertical Analysis 2013 2012 2011 2010 2009 2008
Profit and Loss Account Restated Restated
Rs. in 000 % Rs. in 000 % Rs. in 000 % Rs. in 000 % Rs. in 000 % Rs. in 000 %
Sales - net 3,007,925 100.0 2,465,621 100.0 2,944,907 100.0 2,636,538 100.0 2,334,752 100.0 1,933,344 100.0Cost of Sales 1,777,264 59.1 1,440,368 58.4 2,030,736 69.0 1,732,983 65.7 1,488,595 63.8 1,246,406 64.5
Gross Profit 1,230,661 40.9 1,025,253 41.6 914,171 31.0 903,555 34.3 846,157 36.2 686,938 35.5 Distribution, Selling and Promotional Expenses 751,181 25.0 609,764 24.7 568,589 19.3 540,518 20.5 483,376 20.7 371,771 19.2Administrative and General Expenses 206,437 6.9 195,518 7.9 195,733 6.6 161,148 6.1 160,668 6.9 142,506 7.4Research and Development Expenses 3,880 0.1 8,864 0.4 6,727 0.2 3,716 0.1 6,945 0.3 9,350 0.5Other Operating Expenses 31,746 1.1 22,149 0.9 21,450 0.7 10,876 0.4 23,170 1.0 27,131 1.4
993,244 32.9 836,295 33.8 792,499 26.8 716,258 27.1 674,159 28.9 550,759 28.5
237,417 8.0 188,958 7.7 121,672 4.1 187,298 7.2 171,998 7.3 136,179 7.0Other Operating Income 15,309 0.5 18,331 0.7 92,752 3.1 7,708 0.3 9,191 0.4 8,924 0.5
252,726 8.5 207,289 8.4 214,424 7.3 195,005 7.5 181,189 7.7 145,103 7.5Finance Cost 20,424 0.7 48,182 2.0 70,371 2.4 89,425 3.4 79,341 3.4 67,133 3.5
Profit Before Taxation 232,302 7.8 159,107 6.4 144,053 4.9 105,580 4.1 101,848 4.3 77,970 4.0Taxation 76,767 2.6 55,091 2.2 51,672 1.8 35,236 1.3 36,085 1.5 14,848 0.8
Profit After Taxation 155,535 5.2 104,016 4.2 92,381 3.1 70,344 2.8 65,763 2.8 63,122 3.2
Highnoon Laboratories Limited 32
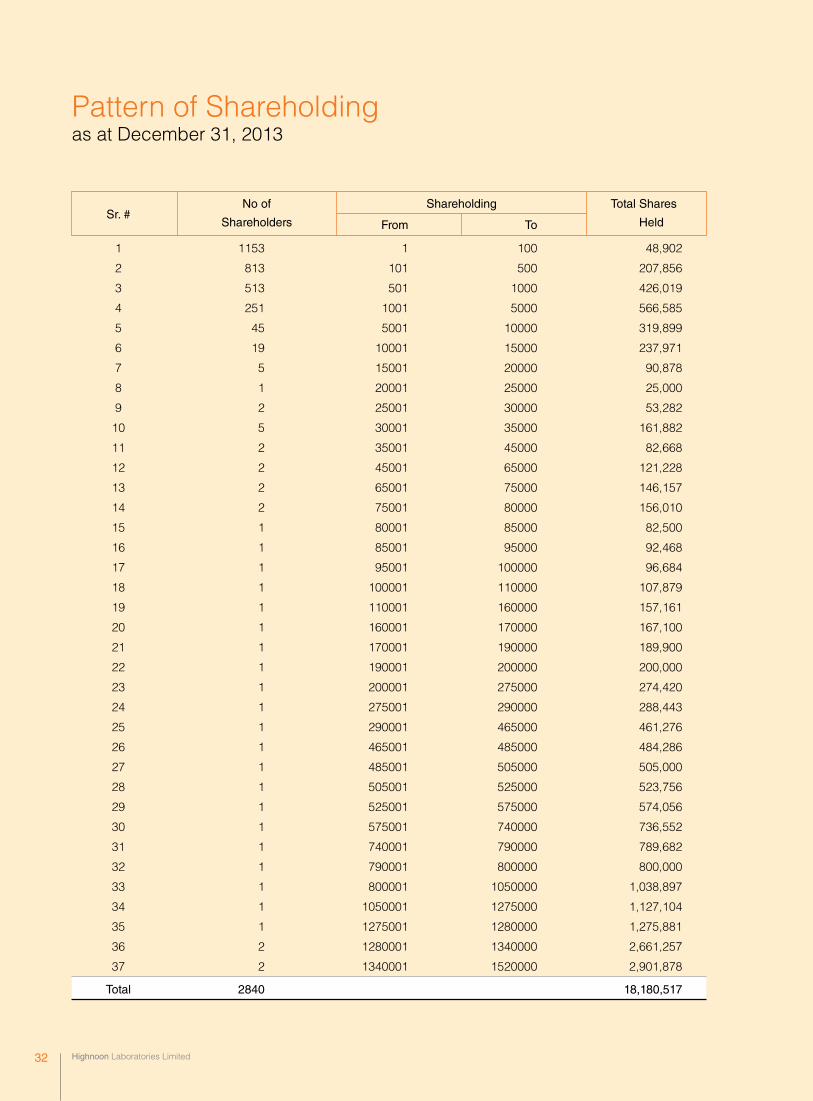
Pattern of Shareholdingas at December 31, 2013
Sr. #
No of Shareholding Total Shares
Shareholders From To Held
1 1153 1 100 48,902
2 813 101 500 207,856
3 513 501 1000 426,019
4 251 1001 5000 566,585
5 45 5001 10000 319,899
6 19 10001 15000 237,971
7 5 15001 20000 90,878
8 1 20001 25000 25,000
9 2 25001 30000 53,282
10 5 30001 35000 161,882
11 2 35001 45000 82,668
12 2 45001 65000 121,228
13 2 65001 75000 146,157
14 2 75001 80000 156,010
15 1 80001 85000 82,500
16 1 85001 95000 92,468
17 1 95001 100000 96,684
18 1 100001 110000 107,879
19 1 110001 160000 157,161
20 1 160001 170000 167,100
21 1 170001 190000 189,900
22 1 190001 200000 200,000
23 1 200001 275000 274,420
24 1 275001 290000 288,443
25 1 290001 465000 461,276
26 1 465001 485000 484,286
27 1 485001 505000 505,000
28 1 505001 525000 523,756
29 1 525001 575000 574,056
30 1 575001 740000 736,552
31 1 740001 790000 789,682
32 1 790001 800000 800,000
33 1 800001 1050000 1,038,897
34 1 1050001 1275000 1,127,104
35 1 1275001 1280000 1,275,881
36 2 1280001 1340000 2,661,257
37 2 1340001 1520000 2,901,878
Total 2840 18,180,517

Annual Report 2013 33
Pattern of Shareholdingas at December 31, 2013
Categories of Shareholders
No. of No. of Shares Percentage
Shareholders Held
Directors, CEO and their Spouse and Minor Children
Mr. Tausif Ahmad Khan 1 1,386,502 7.63%
Mr. Anees Ahmad Khan 1 613 0.00%
Mr. Ghulam Hussain Khan 1 523,756 2.88%
Mr. Shazib Masud 1 500 0.00%
Mr. Taufiq Ahmed Khan 1 1,321,257 7.27%
Mst. Siddiqa Begum 1 872 0.00%
Mrs. Zainub Abbas 1 800,000 4.40%
Mrs. Saweela Anees Khan 1 484,286 2.66%
Associated Companies, Undertakings and Related Parties - - -
NIT and ICP 3 461,510 2.54%
Banks, Development Financial Institutions, Non Banking
Financial Institutions, Joint Stock Companies & Trusts 33 347,282 1.91%
Insurance Companies 4 815,078 4.48%
Modarabas and Mutual Funds 3 8,710 0.05%
*Shareholders holding 5% - - -
Non-Resident Companies 2 1,515,412 8.34%
General Public
a. Local 2768 10,177,757 55.98%
b. Foreign 19 336,982 1.85%
Others - - -
TOTAL 2840 18,180,517 100%
*Shareholders holding five percent or more of the total capital
Pharmatec Investment Limited 1,515,376 8.34%
Mr. Tausif Ahmad Khan 1,386,202 7.62%
Mr. Tauqeer Ahmed Khan 1,275,881 7.02%
Mr. Taufiq Ahmed Khan 1,321,257 7.27%
Mr. Jawaid Tariq Khan 1,127,104 6.20%
Mrs. Nosheen Riaz Khan 1,038,897 5.71%
Ms. Amina Wadalawala 1,340,000 7.37%
Highnoon Laboratories Limited 34
Statement of Compliancewith Best Practices of the Code of Corporate Governance
This Statement is being presented to comply with the
Code of Corporate Governance contained in the listing
regulation of Karachi, Lahore and Islamabad Stock
Exchanges for the purpose of establishing a framework
of good governance, whereby a listed company is
managed in compliance with the best practices of
Corporate Governance.
The Company has applied the principles contained in the
Code in the following manner:
1. The Company encourages representation of independent non-executive directors and directors representing minority interests on its Board of Directors. At present the board includes:
Category Names
Non-Executive Directors Mr. Tausif Ahmad Khan Mr. Ghulam Hussain Khan Mr. Taufiq Ahmed Khan Mst. Siddiqa Begum Mrs. Zainub AbbasExecutive Director Mr. Anees Ahmad KhanIndependent Director Mr. Shazib Masud
The independent director meets the criteria of
independence under clause i(b) of the Code of
Corporate Governance.
2. The directors have confirmed that none of them is serving as a director in more than seven listed companies, including Highnoon Laboratories Limited.
3. All the resident directors of the Company are registered as tax payers and none of them has defaulted in payment of any loan to a banking company, a DFI or an NBFI or, being a member of a stock exchange, has been declared as a defaulter by that stock exchange.
4. The Company has prepared the “Code of Conduct” and has ensured that appropriate steps have been taken to disseminate it throughout the Company along-with its supporting policies and procedures.
5. The Board has developed a vision / mission statement, overall corporate strategy and significant policies of the Company. A complete record of particulars of significant policies along with the dates on which they were approved or amended has been maintained.
6. All the powers of the Board have been duly exercised and decisions on material transactions, including appointment and determination of remuneration and terms and conditions of employment of the CEO, other executive and non-executive directors have been taken by the Board/shareholders.
Annual Report 2013 35
Statement of Compliancewith Best Practices of the Code of Corporate Governance
7. The meetings of the Board were presided over by the Chairman, and in his absence, by a director elected by the Board for this purpose and the Board met at least once in every quarter. Written notices of the Board meetings, along with agenda and working papers were circulated at least seven days before the meetings. The minutes of the meetings were appropriately recorded and circulated.
8. The board arranged two training programs for its directors during the year.
9. The Board approved appointment, remuneration and terms and conditions of employment of Chief Financial Officer, Company Secretary and the head of Internal Audit. However, there were no new appointments of CFO. Company Secretary and head of Internal Audit during the year.
10. The directors’ report for the year has been prepared in compliance with the requirements of the Code and fully describes the salient matters required to be disclosed.
11. The financial statements of the Company were duly endorsed by CEO and CFO before approval of the Board.
12. The directors, CEO and executives do not hold any interest in the shares of the Company other than that disclosed in the pattern of shareholding.
13. The Company has complied with all the corporate and financial reporting requirements of the Code.
14. The Board has formed an Audit Committee. It comprises of three members including the Chairman, who is an independent Director, rest of the two are non-executive directors.
15. The meetings of the Audit Committee were held at least once in every quarter prior to the approval of interim and final results of the Company as required by the Code. The terms of reference of the Committee have been fully complied with.
16. The board has formed an HR and Remuneration Committee. The Committee comprises of three members, of whom two are non-executive directors. The Chairman of the committee is a non-executive director.
17. The Board has set-up an effective internal audit function and the internal auditors of the Company are considered suitably qualified and experienced for the purpose and are fully conversant with the policies and procedures of the Company and working on a full time basis.
18. The statutory auditors of the Company have confirmed that they have been given a satisfactory rating under the quality control review program of the Institute of Chartered Accountants of Pakistan, that they or any of the partners of the firm, their spouses and minor children do not hold shares of the Company and that the firm and all its partners are in compliance with International Federation of Accountants (IFAC) guidelines on code of ethics as adopted by the Institute of Chartered Accountants of Pakistan.
19. The statutory auditors or the persons associated with them have not been appointed to provide other services except in accordance with the listing regulations and the auditors have confirmed that they have observed IFAC guidelines in this regard.
20. The ‘closed period’, prior to the announcement
of interim/ final results, and business decisions,
which may materially affect the market price
of company’s securities, was determined and
intimated to directors, employees and stock
exchange(s).
21. Material / price sensitive information has been disseminated among all market participants at once through stock exchange(s).
22. We confirm that all other material principles
enshrined in the Code have been complied with.
For and on Behalf of the Board
Lahore: Baqar Hasan 18 March 2014 Chief Executive Officer
Highnoon Laboratories Limited 36
Review Report to the Memberson Statement of Compliance with Best Practices of the Code of Corporate Governance
We have reviewed the Statement of Compliance with
the best practices contained in the Code of Corporate
Governance prepared by the Board of Directors of
Highnoon Laboratories Limited to comply with the Listing
Regulation No. 35 of the Karachi Stock Exchange and
Chapter XIII of the Lahore Stock Exchange and Chapter XI
of the Listing Regulations of Islamabad Stock Exchange
where the Company is listed.
The responsibility for compliance with the Code of
Corporate Governance is that of the Board of Directors of
the Company. Our responsibility is to review, to the extent
where such compliance can be objectively verified,
whether the Statement of Compliance reflects the status
of the Company’s compliance with the provisions of the
Code of Corporate Governance and report if it does not.
A review is limited primarily to inquiries of the Company
personnel and review of various documents prepared by
the Company to comply with the Code.
As part of our audit of financial statements we are required
to obtain an understanding of the accounting and internal
control systems sufficient to plan the audit and develop an
effective audit approach. We are not required to consider
whether the Board’s statement on internal controls covers
all the risks and controls, or to form an opinion on the
effectiveness of such internal controls, the Company’s
corporate governance procedures and risks.
Further, sub-regulation (xiii) of Listing Regulation No.
35 notified by the Karachi Stock Exchange (Guarantee)
Limited vide circular KSE/N-269 dated 19 January 2009
requires the Company to place before the Board of
Directors for their consideration and approval related party
transactions distinguishing between transactions carried
out on terms equivalent to those that prevail in arm’s length
transactions and transactions which are not executed
at arm’s length price recording proper justifications for
using such alternate pricing mechanism. Further, all
such transactions also required to be separately placed
before the audit committee. We are only required and
have ensured compliance of requirement to the extent
of approval of related party transactions by the board of
directors and placement of such transactions before audit
committee. We have not carried out any procedures to
determine whether the related party transactions were
undertaken at arm’s length price or not.
Based on our review, nothing has come to our attention
which causes us to believe that the Statement of
Compliance does not appropriately reflect the Company’s
compliance, in all material respects, with the best
practices contained in the Code of Corporate Governance
as applicable to the Company for the year ended 31
December 2013.
Chartered Accountants
Lahore: Engagement Partner:
18 March 2014 Naseem Akbar

Annual Report 2013 37
Financial Statementsfor the year ended 31 December 2013

Highnoon Laboratories Limited 38
Annual Report 2013 39
Auditors’ Reportto the Members
We have audited the annexed balance sheet of Highnoon Laboratories Limited (the Company) as at 31 December 2013 and the
related profit and loss account, statement of comprehensive income, cash flow statement and statement of changes in equity
together with the notes forming part thereof, for the year then ended and we state that we have obtained all the information
and explanations which, to the best of our knowledge and belief, were necessary for the purposes of our audit.
It is the responsibility of the Company’s management to establish and maintain a system of internal control, and prepare
and present the above said statements in conformity with the approved accounting standards and the requirements of the
Companies Ordinance, 1984. Our responsibility is to express an opinion on these statements based on our audit.
We conducted our audit in accordance with the auditing standards as applicable in Pakistan. These standards require that we
plan and perform the audit to obtain reasonable assurance about whether the above said statements are free of any material
misstatement. An audit includes examining, on a test basis, evidence supporting the amounts and disclosures in the above said
statements. An audit also includes assessing the accounting policies and significant estimates made by management, as well
as, evaluating the overall presentation of the above said statements. We believe that our audit provides a reasonable basis for
our opinion and, after due verification, we report that:
a) in our opinion, proper books of accounts have been kept by the Company as required by the Companies Ordinance,
1984;
b) in our opinion:
(i) the balance sheet and profit and loss account together with the notes thereon have been drawn up in
conformity with the Companies Ordinance, 1984, and are in agreement with the books of accounts and are
further in accordance with accounting policies consistently applied except for changes as stated in Note 2.3
with which we concur;
(ii) the expenditure incurred during the year was for the purpose of the Company’s business; and
(iii) the business conducted, investments made and the expenditure incurred during the year were in accordance
with the objects of the Company.
c) in our opinion and to the best of our information and according to the explanations given to us, the balance
sheet, profit and loss account, statement of comprehensive income, cash flow statement and statement
of changes in equity together with the notes forming part thereof conform with approved accounting
standards as applicable in Pakistan, and, give the information required by the Companies Ordinance, 1984,
in the manner so required and respectively give a true and fair view of the state of the Company’s affairs as
at 31 December 2013 and of the profit, comprehensive income, its cash flows and changes in equity for the
year then ended; and
d) in our opinion, Zakat deductible at source under the Zakat and Ushr Ordinance, 1980 (XVIII of 1980), was
deducted by the Company and deposited in the Central Zakat Fund established under Section 7 of that
Ordinance.
Chartered AccountantsLahore: 18 March 2014 Engagement Partner: Naseem Akbar

Highnoon Laboratories Limited 40
Balance Sheet
2013 2012 2011 Note Rupees Rupees Rupees Restated Restated
EQUITY AND LIABILITIES
Share capital and reserves
Authorized share capital
20,000,000 (2012: 20,000,000) Ordinary
shares of Rs. 10 each 200,000,000 200,000,000 200,000,000
Share capital 6 181,805,170 181,805,170 181,805,170
Revenue reserves 533,568,145 438,931,431 385,324,407
715,373,315 620,736,601 567,129,577
Surplus on revaluation of fixed assets 7 226,842,522 232,455,404 183,153,055
Non-current liabilities
Long term loan - secured 8 37,500,000 50,000,000 57,659,470
Liabilities against assets subject to finance lease 9 24,778,541 12,805,239 11,296,272
Long term advances 10 8,734,244 13,597,545 14,942,278
Deferred liabilities 11 267,232,781 296,468,613 279,245,181
338,245,566 372,871,397 363,143,201
Current liabilities
Trade and other payables 12 259,539,592 199,348,127 186,673,545
Mark up payable on secured loans 13 1,714,617 6,588,896 10,436,070
Short term borrowings - secured 14 73,203 230,599,758 166,291,136
Current portion of long term liabilities 15 40,550,058 21,577,392 80,742,402
301,877,470 458,114,173 444,143,153
640,123,036 830,985,570 807,286,354
TOTAL EQUITY AND LIABILITIES 1,582,338,873 1,684,177,575 1,557,568,986
CONTINGENCIES AND COMMITMENTS 16
The annexed notes from 1 to 44 form an integral part of these financial statements.
BAQAR HASAN CHIEF EXECUTIVE OFFICER
Annual Report 2013 41
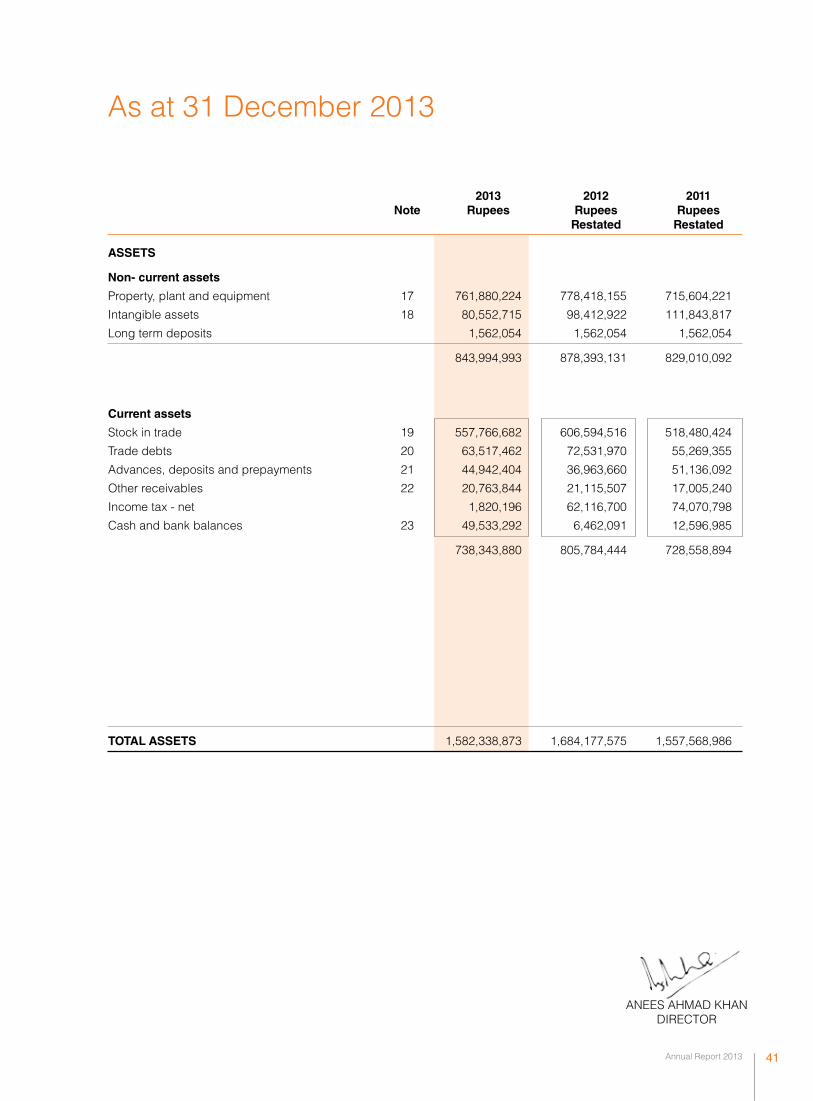
As at 31 December 2013
2013 2012 2011 Note Rupees Rupees Rupees Restated Restated
ASSETS
Non- current assets
Property, plant and equipment 17 761,880,224 778,418,155 715,604,221
Intangible assets 18 80,552,715 98,412,922 111,843,817
Long term deposits 1,562,054 1,562,054 1,562,054
843,994,993 878,393,131 829,010,092
Current assets
Stock in trade 19 557,766,682 606,594,516 518,480,424
Trade debts 20 63,517,462 72,531,970 55,269,355
Advances, deposits and prepayments 21 44,942,404 36,963,660 51,136,092
Other receivables 22 20,763,844 21,115,507 17,005,240
Income tax - net 1,820,196 62,116,700 74,070,798
Cash and bank balances 23 49,533,292 6,462,091 12,596,985
738,343,880 805,784,444 728,558,894
TOTAL ASSETS 1,582,338,873 1,684,177,575 1,557,568,986
ANEES AHMAD KHAN DIRECTOR
Highnoon Laboratories Limited 42
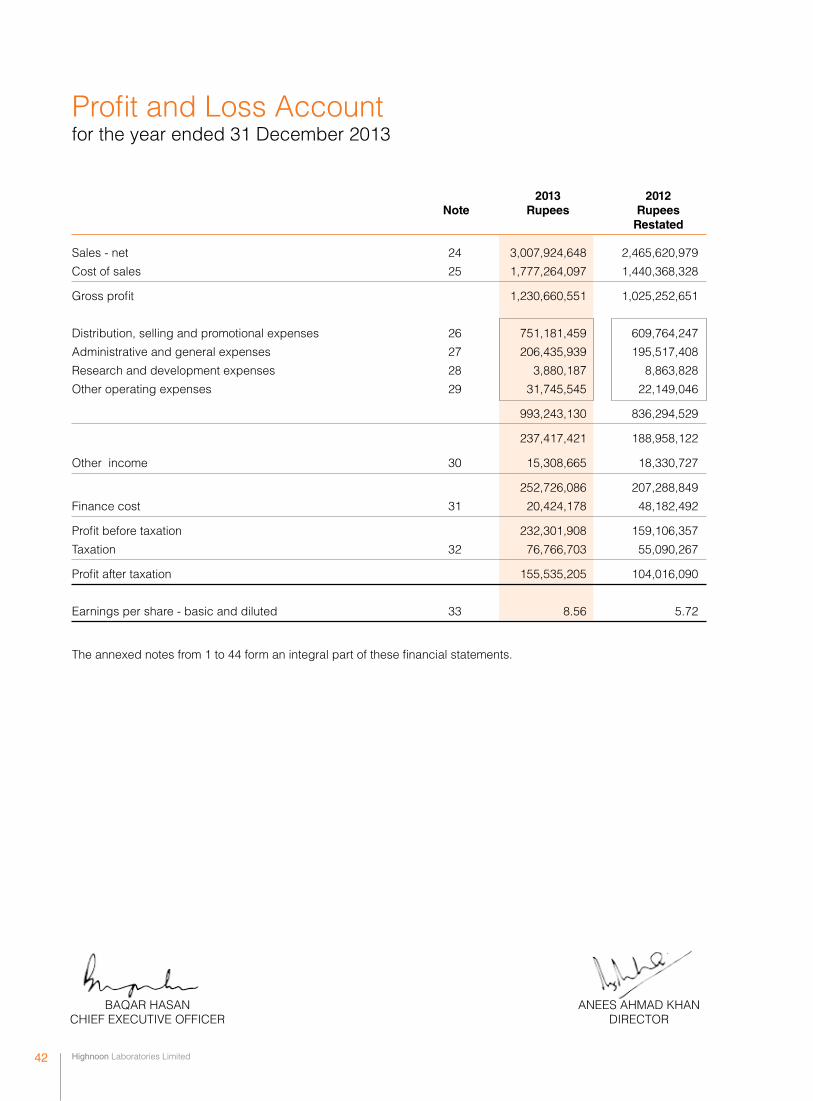
Profit and Loss Accountfor the year ended 31 December 2013
2013 2012 Note Rupees Rupees Restated
Sales - net 24 3,007,924,648 2,465,620,979
Cost of sales 25 1,777,264,097 1,440,368,328
Gross profit 1,230,660,551 1,025,252,651
Distribution, selling and promotional expenses 26 751,181,459 609,764,247
Administrative and general expenses 27 206,435,939 195,517,408
Research and development expenses 28 3,880,187 8,863,828
Other operating expenses 29 31,745,545 22,149,046
993,243,130 836,294,529
237,417,421 188,958,122
Other income 30 15,308,665 18,330,727
252,726,086 207,288,849
Finance cost 31 20,424,178 48,182,492
Profit before taxation 232,301,908 159,106,357
Taxation 32 76,766,703 55,090,267
Profit after taxation 155,535,205 104,016,090
Earnings per share - basic and diluted 33 8.56 5.72
The annexed notes from 1 to 44 form an integral part of these financial statements.
ANEES AHMAD KHAN DIRECTOR
BAQAR HASAN CHIEF EXECUTIVE OFFICER
Annual Report 2013 43
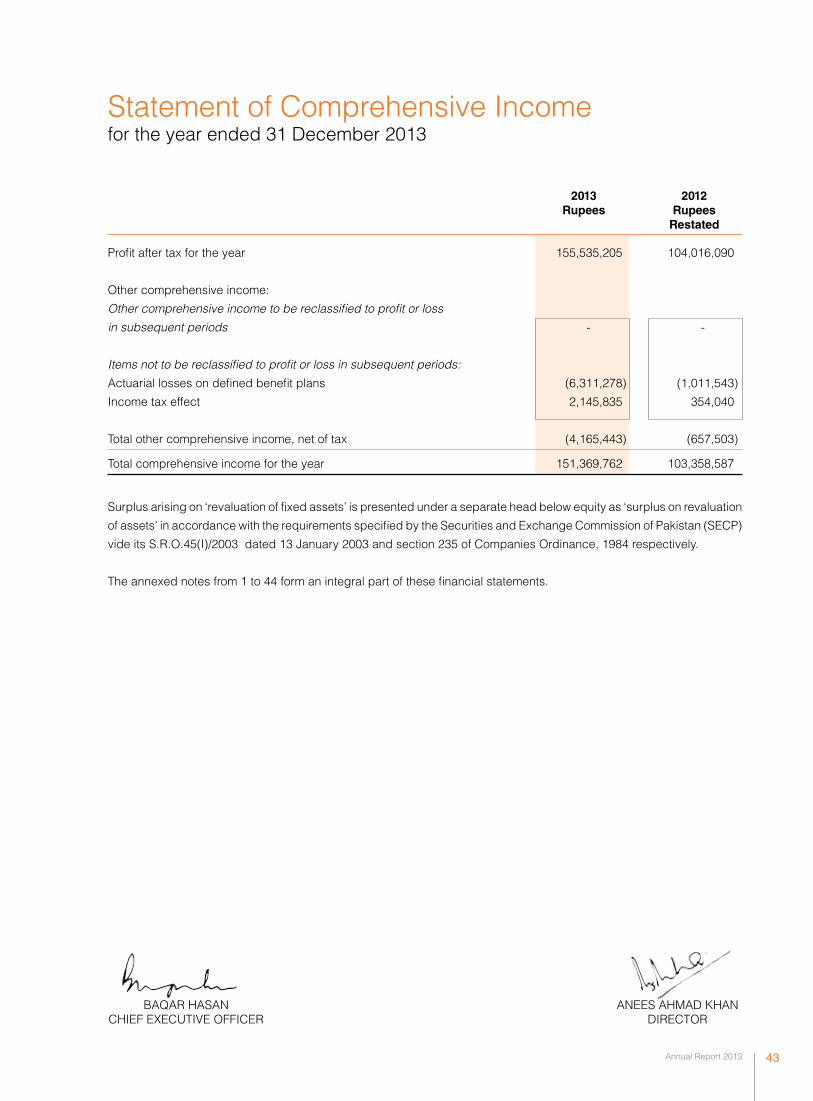
Statement of Comprehensive Incomefor the year ended 31 December 2013
2013 2012 Rupees Rupees Restated
Profit after tax for the year 155,535,205 104,016,090
Other comprehensive income:
Other comprehensive income to be reclassified to profit or loss in subsequent periods - -
Items not to be reclassified to profit or loss in subsequent periods: Actuarial losses on defined benefit plans (6,311,278) (1,011,543)
Income tax effect 2,145,835 354,040
Total other comprehensive income, net of tax (4,165,443) (657,503)
Total comprehensive income for the year 151,369,762 103,358,587
Surplus arising on ‘revaluation of fixed assets’ is presented under a separate head below equity as ‘surplus on revaluation
of assets’ in accordance with the requirements specified by the Securities and Exchange Commission of Pakistan (SECP)
vide its S.R.O.45(I)/2003 dated 13 January 2003 and section 235 of Companies Ordinance, 1984 respectively.
The annexed notes from 1 to 44 form an integral part of these financial statements.
ANEES AHMAD KHAN DIRECTOR
BAQAR HASAN CHIEF EXECUTIVE OFFICER
Highnoon Laboratories Limited 44
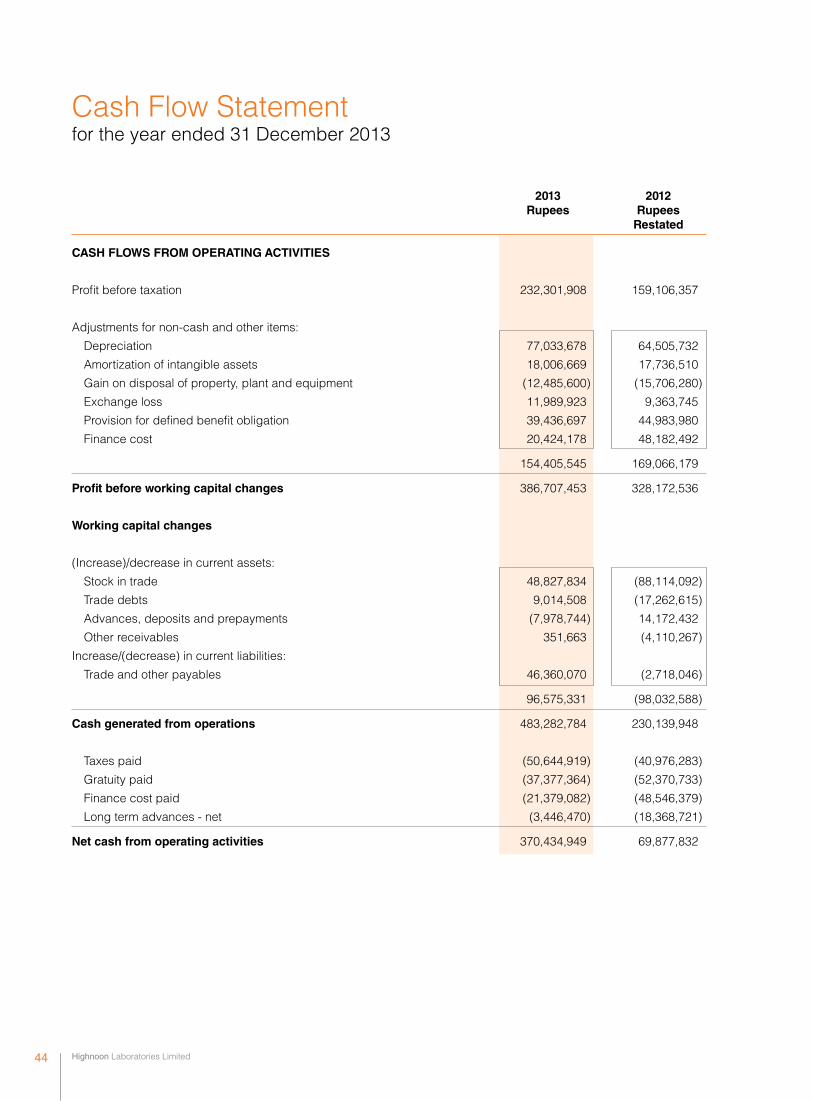
Cash Flow Statementfor the year ended 31 December 2013
2013 2012 Rupees Rupees Restated
CASH FLOWS FROM OPERATING ACTIVITIES
Profit before taxation 232,301,908 159,106,357
Adjustments for non-cash and other items:
Depreciation 77,033,678 64,505,732
Amortization of intangible assets 18,006,669 17,736,510
Gain on disposal of property, plant and equipment (12,485,600) (15,706,280)
Exchange loss 11,989,923 9,363,745
Provision for defined benefit obligation 39,436,697 44,983,980
Finance cost 20,424,178 48,182,492
154,405,545 169,066,179
Profit before working capital changes 386,707,453 328,172,536
Working capital changes
(Increase)/decrease in current assets:
Stock in trade 48,827,834 (88,114,092)
Trade debts 9,014,508 (17,262,615)
Advances, deposits and prepayments (7,978,744) 14,172,432
Other receivables 351,663 (4,110,267)
Increase/(decrease) in current liabilities:
Trade and other payables 46,360,070 (2,718,046)
96,575,331 (98,032,588)
Cash generated from operations 483,282,784 230,139,948
Taxes paid (50,644,919) (40,976,283)
Gratuity paid (37,377,364) (52,370,733)
Finance cost paid (21,379,082) (48,546,379)
Long term advances - net (3,446,470) (18,368,721)
Net cash from operating activities 370,434,949 69,877,832

Annual Report 2013 45
2013 2012 Note Rupees Rupees Restated
CASH FLOWS FROM INVESTING ACTIVITIES
Capital expenditure incurred (40,714,378) (49,316,316)
Intangible assets acquired (146,462) (4,305,615)
Proceeds from disposal of property, plant and equipment 29,506,724 31,243,564
Net cash used in investing activities (11,354,116) (22,378,367)
CASH FLOWS FROM FINANCING ACTIVITIES
Repayment of finance lease liabilities - net (23,692,738) (19,483,549)
Long term loan obtained - 50,000,000
Long term loan repayment - (99,946,763)
Increase/(decrease) in short term borrowings - net (230,526,555) 64,308,622
Dividend paid (61,790,339) (48,512,669)
Net cash used in financing activities (316,009,632) (53,634,359)
Net increase/(decrease) in cash and cash equivalents 43,071,201 (6,134,894)
Cash and cash equivalents at beginning of the year 6,462,091 12,596,985
Cash and cash equivalents at end of the year 23 49,533,292 6,462,091
The annexed notes from 1 to 44 form an integral part of these financial statements.
ANEES AHMAD KHAN DIRECTOR
BAQAR HASAN CHIEF EXECUTIVE OFFICER
Highnoon Laboratories Limited 46
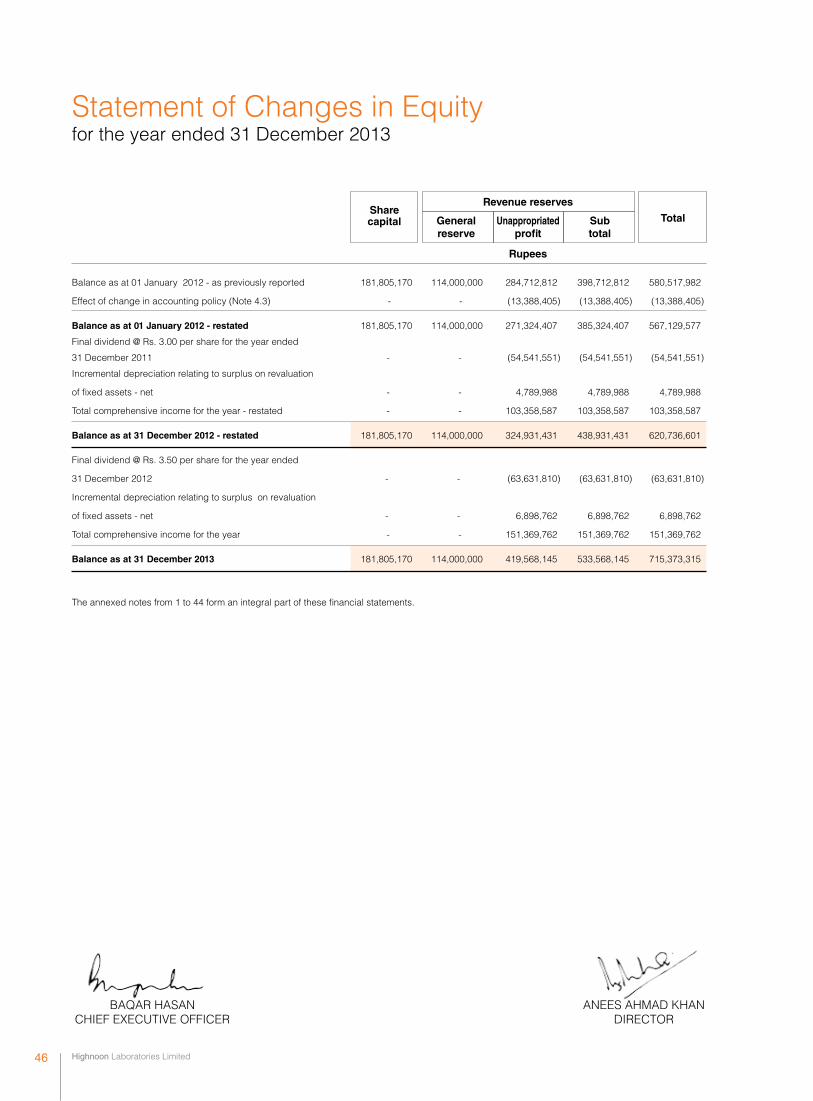
Statement of Changes in Equityfor the year ended 31 December 2013
Revenue reserves
Share
General Unappropriated Sub Total
capital reserve profit total
Rupees
Balance as at 01 January 2012 - as previously reported 181,805,170 114,000,000 284,712,812 398,712,812 580,517,982
Effect of change in accounting policy (Note 4.3) - - (13,388,405) (13,388,405) (13,388,405)
Balance as at 01 January 2012 - restated 181,805,170 114,000,000 271,324,407 385,324,407 567,129,577
Final dividend @ Rs. 3.00 per share for the year ended
31 December 2011 - - (54,541,551) (54,541,551) (54,541,551)
Incremental depreciation relating to surplus on revaluation
of fixed assets - net - - 4,789,988 4,789,988 4,789,988
Total comprehensive income for the year - restated - - 103,358,587 103,358,587 103,358,587
Balance as at 31 December 2012 - restated 181,805,170 114,000,000 324,931,431 438,931,431 620,736,601
Final dividend @ Rs. 3.50 per share for the year ended
31 December 2012 - - (63,631,810) (63,631,810) (63,631,810)
Incremental depreciation relating to surplus on revaluation
of fixed assets - net - - 6,898,762 6,898,762 6,898,762
Total comprehensive income for the year - - 151,369,762 151,369,762 151,369,762
Balance as at 31 December 2013 181,805,170 114,000,000 419,568,145 533,568,145 715,373,315
The annexed notes from 1 to 44 form an integral part of these financial statements.
ANEES AHMAD KHAN DIRECTOR
BAQAR HASAN CHIEF EXECUTIVE OFFICER
Annual Report 2013 47
Notes to The Financial Statements for the year ended 31 December 2013
1. THE COMPANY, OPERATIONS AND REGISTERED OFFICE
Highnoon Laboratories Limited (“the Company”) was incorporated as a private limited company in Pakistan in
year 1984 and converted into an unquoted public limited company in 1985. Its shares are quoted on all stock
exchanges in Pakistan since November 1994. The Company is principally engaged in the manufacture, import,
sale and marketing of pharmaceutical and allied consumer products. The registered office of the Company is
situated at 17.5 Km, Multan Road, Lahore.
2. BASIS OF PRESENTATION AND STATEMENT OF COMPLIANCE
2.1 Statement of compliance
These financial statements have been prepared in accordance with approved accounting standards
as applicable in Pakistan. Approved accounting standards comprise of such International Financial
Reporting Standards (IFRSs) issued by the International Accounting Standards Board (IASB) as
are notified under the Companies Ordinance, 1984, provisions of and directives issued under the
Companies Ordinance, 1984. In case requirements differ, the provisions or directives of the Companies
Ordinance, 1984 shall prevail.
2.2 Basis of measurement
These financial statements have been prepared under the historical cost convention, except for
revaluation of certain assets as referred to in note 17 and recognition of certain employees retirement
benefits at present value. In these financial statements, except for the cash flow statement, all the
transactions have been accounted for on accrual basis.
2.3 New and amended standards and interpretations became effective during the year
The accounting policies adopted in the preparation of these financial statements are consistent
with those of previous financial year except the following new/revised standards, amendments and
interpretations to accounting standards that became effective during the year:
IAS 1 - Presentation of Items of Other Comprehensive Income (OCI)
IFRS 7 - Financial Instruments : Disclosures – (Amendments)
Amendments enhancing disclosures about offsetting of financial assets and financial
liabilities.
IAS 19 - Employee Benefits -(Amendment)
Significant changes have been made in the requirements of IAS 19-Employee
Benefits.
IFRIC 20 - Stripping Costs in the Production Phase of a Surface Mine
The adoption of the above amendments did not have any effect on the financial statements except
changes in accounting policy relating to defined benefit plan as disclosed in Note 4.3.
2.4 Functional and presentation currency
These financial statements are presented in Pak rupee, which is also the functional currency of the
Company.
Highnoon Laboratories Limited 48
3. SIGNIFICANT ACCOUNTING ESTIMATES AND JUDGMENTS
3.1 Use of estimates and judgments
The preparation of financial statements in conformity with approved accounting standards requires
management to make judgments, estimates and assumptions that affect the application of accounting
policies and reported amounts of assets and liabilities, income and expenses. The estimates and
associated assumptions and judgments are based on historical experience and various other factors
that are believed to be reasonable under the circumstances, the result of which form the basis of
making the judgments about carrying values of assets and liabilities that are not readily apparent from
other sources. Actual results may differ from these estimates.
The estimates and underlying assumptions are reviewed on an ongoing basis. Revision to accounting
estimates are recognized in the period in which the estimate is revised if revision affects only that
period, or in the period of revision and future periods if the revision affects both current and future
periods.
The areas where various assumptions and estimates are significant to Company’s financial statements
or where judgments were exercised in application of accounting policies are as follows:
Notes
- staff retirement benefits 4.3
- property, plant and equipment 4.6
- amortization 4.7
- impairment 4.13
- taxation 4.17
- provisions 4.21
3.2 Change in estimate
The Company has changed its estimate regarding useful life of office equipment starting from 2013
based on its historical experience of rapid changes in technology and physical obsolescence of the
assets. The rate of depreciation on office equipment has been changed from 10% to 25% starting
from 01 January 2013. This change has been accounted for as a change in accounting estimate
whereby current and future periods are corrected. Had there been no change in accounting estimate,
the depreciation charge for the period would have been lower by Rs. 4,075,963 while carrying value
of property, plant and equipment and profit before tax would have been higher by the same amount.
Due to impracticability, the future impact is not disclosed.
4. SUMMARY OF SIGNIFICANT ACCOUNTING POLICIES
4.1 The accounting policies adopted in the preparation of these financial statements are consistent with
those of the previous financial year except as mentioned in note 2.3.
4.2 Segment reporting
The key financial decision maker consider the whole business as one operating segment.
Notes to The Financial Statements for the year ended 31 December 2013
Annual Report 2013 49
4.3 Staff retirement benefits
Defined benefit plan
The Company operates an unfunded gratuity scheme for all of its permanent employees joined on or before 19 March 2013, under which benefits are paid on cessation of employment subject to a minimum qualifying period of service.
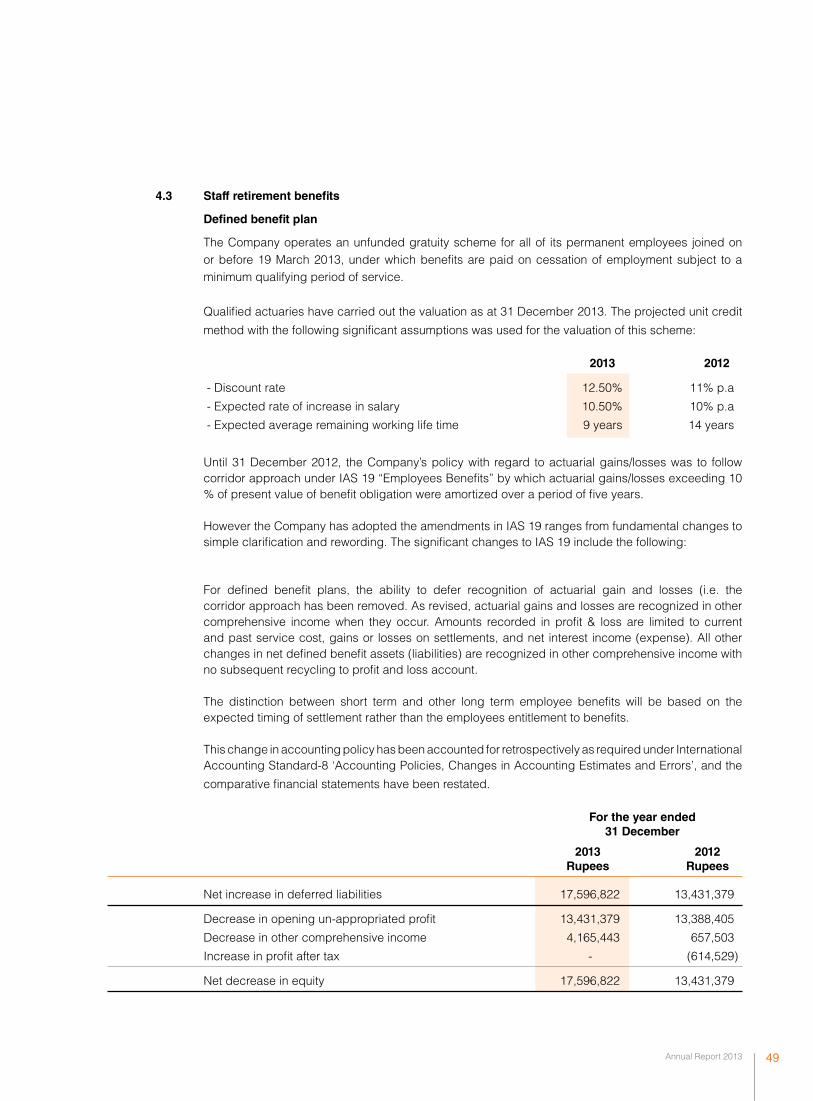
Qualified actuaries have carried out the valuation as at 31 December 2013. The projected unit credit
method with the following significant assumptions was used for the valuation of this scheme:
2013 2012
- Discount rate 12.50% 11% p.a
- Expected rate of increase in salary 10.50% 10% p.a
- Expected average remaining working life time 9 years 14 years
Until 31 December 2012, the Company’s policy with regard to actuarial gains/losses was to follow corridor approach under IAS 19 “Employees Benefits” by which actuarial gains/losses exceeding 10 % of present value of benefit obligation were amortized over a period of five years.
However the Company has adopted the amendments in IAS 19 ranges from fundamental changes to
simple clarification and rewording. The significant changes to IAS 19 include the following:
For defined benefit plans, the ability to defer recognition of actuarial gain and losses (i.e. the
corridor approach has been removed. As revised, actuarial gains and losses are recognized in other comprehensive income when they occur. Amounts recorded in profit & loss are limited to current and past service cost, gains or losses on settlements, and net interest income (expense). All other changes in net defined benefit assets (liabilities) are recognized in other comprehensive income with no subsequent recycling to profit and loss account.
The distinction between short term and other long term employee benefits will be based on the
expected timing of settlement rather than the employees entitlement to benefits. This change in accounting policy has been accounted for retrospectively as required under International
Accounting Standard-8 ‘Accounting Policies, Changes in Accounting Estimates and Errors’, and the
comparative financial statements have been restated.
For the year ended
31 December
2013 2012 Rupees Rupees
Net increase in deferred liabilities 17,596,822 13,431,379
Decrease in opening un-appropriated profit 13,431,379 13,388,405
Decrease in other comprehensive income 4,165,443 657,503
Increase in profit after tax - (614,529)
Net decrease in equity 17,596,822 13,431,379
Highnoon Laboratories Limited 50
Defined contribution plan
The Company also operates a recognized provident fund scheme for all of its permanent employees in accordance with the trust deed and rules made there under. Equal monthly contributions are made to the fund by the Company and employees at the rate of 8.33% of basic salary and cost of living allowance.
Compensated leave absences
Provision for compensated absences is made to the extent of value of accumulated accrued leaves / leave fare assistance of the employees at the balance sheet date as per entitlement on the basis of last drawn salary. A maximum of 10 unavailed leaves are allowed to be carried forward for a maximum of one year.
4.4 Foreign currency translation
All monetary assets and liabilities in foreign currency are translated at the rates of exchange prevailing on the balance sheet date. Non-monetary assets and liabilities that are measured in terms of historical cost in foreign currency are translated into rupees at exchange rates prevailing at the date of transaction. Non-monetary assets and liabilities denominated in foreign currency that are stated at fair value are translated into rupees at exchange rates prevailing at the date when fair values are determined. Transactions in foreign currencies are converted into Pak rupees at exchange rates prevailing on the date of transaction. All exchange gains/losses on foreign currency transactions are taken to profit and loss account.
4.5 Trade and other payables
Trade and other payables are initially carried at fair value and subsequently at amortized cost using effective interest rate method.
4.6 Property, plant and equipment
Owned operating assets
These are stated at cost or revalued amount less accumulated depreciation and impairment except for freehold land, which is stated at revalued amount. Revaluation is carried out every five years unless earlier revaluation is necessitated.
Deprecation is charged on reducing balance method at the rates in note 17.1 to write off the cost /
revalued amount of an asset over its estimated useful life. The assets’ residual values and useful lives are reviewed at each financial year end and adjusted, if its impact on depreciation is significant. Full month’s depreciation is charged on additions, while no depreciation is charged in the month of disposal or deletion of assets. Surplus on revaluation of fixed assets relating to incremental depreciation (net of deferred taxation) is transferred directly to unappropriated profit.
Gains and losses on disposal of fixed assets are included in income currently, except that the related
surplus on revaluation of fixed assets (net of deferred taxation) is transferred directly to Unappropriated profit.
Normal repairs and maintenance is charged to profit and loss account as and when incurred, while major renewals and replacements are capitalized if it is probable that the respective future economic benefits will flow to the Company and the cost of the item can be measured reliably, and assets so replaced, if any, are retired.
Notes to The Financial Statements for the year ended 31 December 2013
Annual Report 2013 51
Leasehold assets
Leases, where all the risks and rewards incidental to ownership of the leased assets have been transferred to the Company, are classified as finance leases. Assets subject to finance lease are stated at the lower of present value of minimum lease payments under the lease agreements and the fair value of the leased assets at the commencement of lease, less accumulated depreciation and any identified impairment loss.
The related rental obligations, net of finance costs, are included in liabilities against assets subject to
finance lease as referred to in note 9. The liabilities are classified as current and long term depending upon the timing of the payment.
Each lease payment is allocated between the liability and finance costs so as to produce a constant
periodic rate of interest on the balance outstanding. The interest element of the rental is charged to profit and loss account over the lease term.
Assets acquired under finance lease are depreciated over the useful lives of assets on reducing
balance method at the rates given in note 17.1. The assets’ residual values and useful lives are reviewed at each financial year end and adjusted, if its impact on depreciation is significant. Depreciation of leased assets is charged to profit and loss account. Depreciation on additions in leased assets is charged from the month in which an asset is acquired while no depreciation is charged for the month in which the asset is disposed off/transferred to freehold assets.
Capital work in progress
Capital work in progress is stated at cost less any identified impairment loss and includes the expenditures on material, labour and appropriate overheads directly relating to the project. These costs are transferred to fixed assets as and when assets are available for intended use.
4.7 Intangible assets
Intangible assets includes Intellectual Property, Rights, Trademarks and Software, which are non-monetary assets without physical substance. These are recognized at cost, which comprises its purchase price, non-refundable purchase taxes and any directly attributable expenditures.
After initial recognition, an intangible asset is carried at its cost less accumulated amortization and any
identified impairment loss. Amortization is charged to the profit and loss account on monthly basis by following the straight line method over a maximum period of ten years. Amortization on additions is charged from the month when the asset is put to use, while for disposals, no amortization is charged in the month of disposal.
At each financial year end, the Company reviews the recoverable amounts of intangible assets to assess
impairment loss. If such indication exists, impairment losses are recognized as an expense.
Subsequent expenditures on intangible assets are recognized as an expense when it is incurred
unless the expenditure will enable the asset to generate future economic benefits in excess of its
originally assessed standard of performance.
Highnoon Laboratories Limited 52
4.8 Borrowing costs
Finance cost on long term liabilities / lease liabilities which are specifically obtained for the acquisition
of qualifying assets i.e. assets that take a substantial period of time to get ready for their intended use,
are capitalized up to the date of commissioning of respective asset. All other interest, mark-up and
expenses are charged to profit and loss account in the period in which they are incurred.
4.9 Stores and spares
These are valued at moving average cost and charged to profit and loss as consumed.
4.10 Stock in trade
These are valued at the lower of cost and net realizable value. Cost is determined using the following
basis :
Raw materials - on moving average
Work-in-process - at estimated manufacturing cost including appropriate overheads
Finished goods
- Imported - on moving average
- Local - on annual average manufacturing cost including appropriate
overheads
Merchandise in
transit/pledged - at invoice value plus other charges incurred thereon
Net realizable value signifies the estimated selling price in the ordinary course of business less
estimated costs necessary to make the sale.
4.11 Trade debts
These are initially carried at original invoice amount, which is the fair value of consideration to be
received in future and subsequently measured at amortized cost less impairment loss, if any. A
provision for impairment of trade debts is established when there is an objective evidence that the
Company will not be able to collect all amounts due according to the original terms of receivable.
4.12 Cash and cash equivalents
For the purpose of cash flow statement, cash and cash equivalents comprise of cash in hand and
balance with banks in current accounts.
4.13 Impairment
The carrying amount of the assets except for inventories are reviewed at each balance sheet date
to identify the circumstances indicating the occurrence of impairment loss or reversal of previously
recognized impairment losses. If any such indication exists, the recoverable amount of such asset is
estimated.
An impairment loss is recognized if the carrying amount of an asset or its cash-generating unit exceeds
its recoverable amount. A cash-generating unit is the smallest identifiable asset group that generates
cash flows that largely are independent from other assets and groups.
Notes to The Financial Statements for the year ended 31 December 2013

Annual Report 2013 53
Where an impairment loss subsequently reverses, the carrying amount of such asset is increased
to the extent that it does not exceed the carrying amount that would have been determined, net of
depreciation and amortization, if no impairment loss has been charged. A reversal of the impairment
loss is recognized in income.
4.14 Revenue recognition
Revenue from local sales is recognized when risk and reward incidental to ownership are transferred
i.e. on dispatch of goods to the customers. Export goods are considered dispatched when bill of
lading is prepared for shipment to customers.
Service income is recognized when related services are rendered.
Return on bank deposits is accounted for on time proportion basis and other income is recognized on
accrual basis.
4.15 Transactions with related parties and transfer pricing
The Company under the direction of Securities and Exchange Commission of Pakistan’s Notification
SRO 66(I)/ 2003 dated 22 January 2003 adopted the following policies of transfer pricing for the
determination of arm’s length prices with subsidiary company/associated companies/related parties
except for the assets sold to employees at written down value under the employee’s car scheme as
approved by the Board of Directors.
- Associated companies / related parties Cost plus method
Parties are said to be related, if they are able to influence the operating and financial decisions of the
Company and vice versa.
4.16 Research and development cost
These costs are charged to profit and loss account as and when incurred, except for any development
costs which are recognized as intangible assets when it is probable that the development project
will be a success and certain criteria, including commercial and technological feasibility have been
met.
4.17 Taxation
Income tax on profit and loss for the year comprises current and deferred tax.
Current
The charge for current taxation is based on taxable income for the year determined in accordance
with Income Tax Ordinance, 2001 and prevailing tax rates after taking into account applicable tax
credits and rebates, if any. The charge for current tax also includes adjustments, where considered
necessary, to provision for tax made in previous years arising from assessments framed during the
year for such years.
Highnoon Laboratories Limited 54
Deferred
Deferred tax is recognized using the balance sheet liability method on all temporary differences
between the amounts attributed to assets and liabilities for financial reporting purposes and amounts
used for taxation purposes.
Deferred tax liabilities are recognized for all taxable temporary differences and deferred tax assets are
recognized to the extent that it is probable that future taxable profits will be available against which the
deductible temporary differences, unused tax losses and tax credits can be utilized.
Carrying amount of deferred tax asset is reviewed at each balance sheet date and reduced to the
extent that it is no longer probable that the related tax benefit will be realized. Deferred tax is calculated
at the rates that are expected to apply to the period when differences reverse based on tax rates and
tax laws that have been enacted or substantively enacted by the balance sheet date.
Deferred tax is charged or credited in profit and loss account except for deferred tax asset/liability
arising on deficit/surplus on revaluation of fixed assets and other comprehensive income which is
adjusted against the related surplus and recognised in other comprehensive income respectively as
per the requirements of revised IAS 12 “Income Taxes”.
4.18 Dividend
Dividend to shareholders is recognized as a liability in the period in which it is approved.
4.19 Financial instruments
These comprise financial assets and financial liabilities. Significant financial assets include trade
debts, advances and deposits, other receivables and cash and bank balances. Significant financial
liabilities include borrowings, trade and other payables, liabilities in respect of leased assets and mark
up payable on bank borrowings.
Financial assets and financial liabilities are recognized when the Company becomes a party to the
contractual provisions of the instrument and assets and liabilities are stated at fair value. The Company
derecognizes the financial assets and liabilities when it ceases to be a party to such contractual
provisions of the instruments. Any gain or loss on derecognizing of the financial assets and financial
liabilities is taken to profit and loss account currently. The particular measurement methods adopted
are disclosed in the individual policy statement associated with each item.
4.20 Offsetting of financial assets and financial liabilities
Financial assets and liabilities are offset and the net amount is reported in the balance sheet if the
Company has legally enforceable right to offset the recognized amounts and the Company intends to
settle either on a net basis or realize the asset and settle the liability simultaneously.
4.21 Provisions
A provision is recognized when the Company has a present, legal or constructive obligation as a result
of past event and it is probable that an outflow of resources embodying economic benefits will be
required to settle the obligation of which reliable estimate can be made.
Notes to The Financial Statements for the year ended 31 December 2013
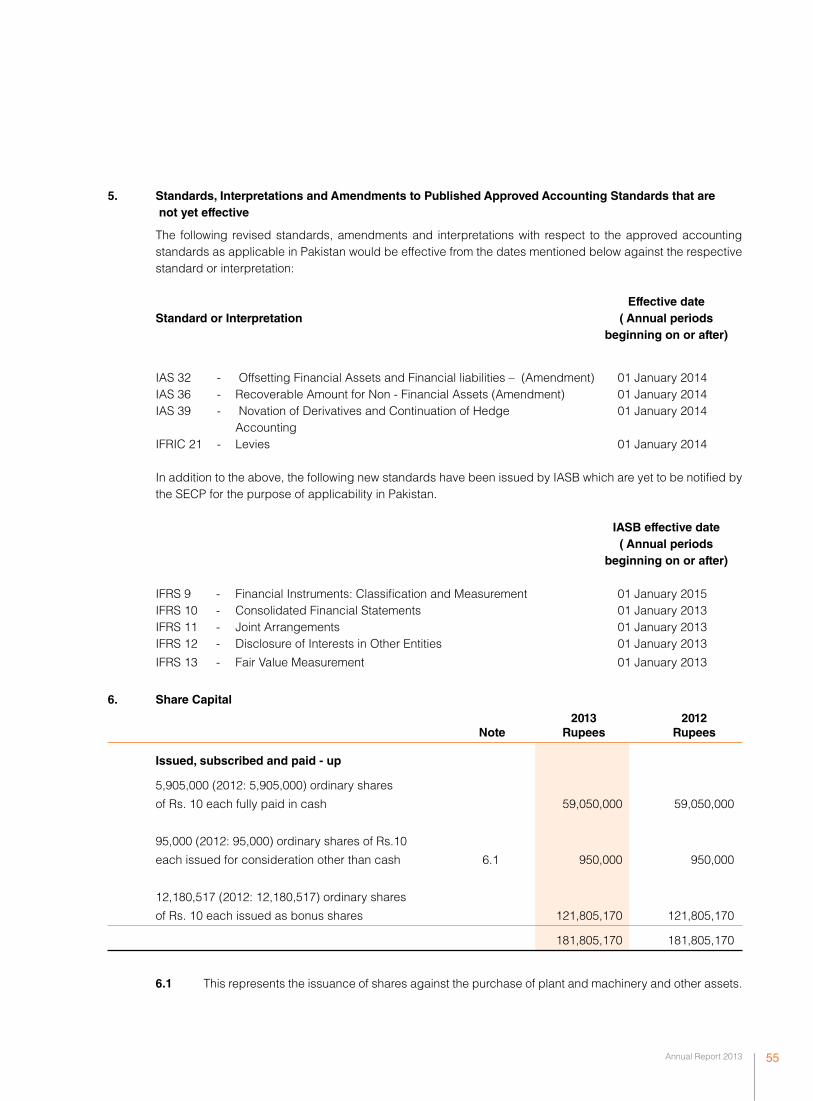
Annual Report 2013 55
5. Standards, Interpretations and Amendments to Published Approved Accounting Standards that are not yet effective
The following revised standards, amendments and interpretations with respect to the approved accounting standards as applicable in Pakistan would be effective from the dates mentioned below against the respective standard or interpretation:
Effective dateStandard or Interpretation ( Annual periods beginning on or after)
IAS 32 - Offsetting Financial Assets and Financial liabilities – (Amendment) 01 January 2014 IAS 36 - Recoverable Amount for Non - Financial Assets (Amendment) 01 January 2014 IAS 39 - Novation of Derivatives and Continuation of Hedge 01 January 2014 Accounting IFRIC 21 - Levies 01 January 2014 In addition to the above, the following new standards have been issued by IASB which are yet to be notified by
the SECP for the purpose of applicability in Pakistan.
IASB effective date ( Annual periods beginning on or after)
IFRS 9 - Financial Instruments: Classification and Measurement 01 January 2015 IFRS 10 - Consolidated Financial Statements 01 January 2013 IFRS 11 - Joint Arrangements 01 January 2013 IFRS 12 - Disclosure of Interests in Other Entities 01 January 2013
IFRS 13 - Fair Value Measurement 01 January 2013
6. Share Capital
2013 2012 Note Rupees Rupees
Issued, subscribed and paid - up
5,905,000 (2012: 5,905,000) ordinary shares
of Rs. 10 each fully paid in cash 59,050,000 59,050,000
95,000 (2012: 95,000) ordinary shares of Rs.10
each issued for consideration other than cash 6.1 950,000 950,000
12,180,517 (2012: 12,180,517) ordinary shares
of Rs. 10 each issued as bonus shares 121,805,170 121,805,170
181,805,170 181,805,170
6.1 This represents the issuance of shares against the purchase of plant and machinery and other assets.
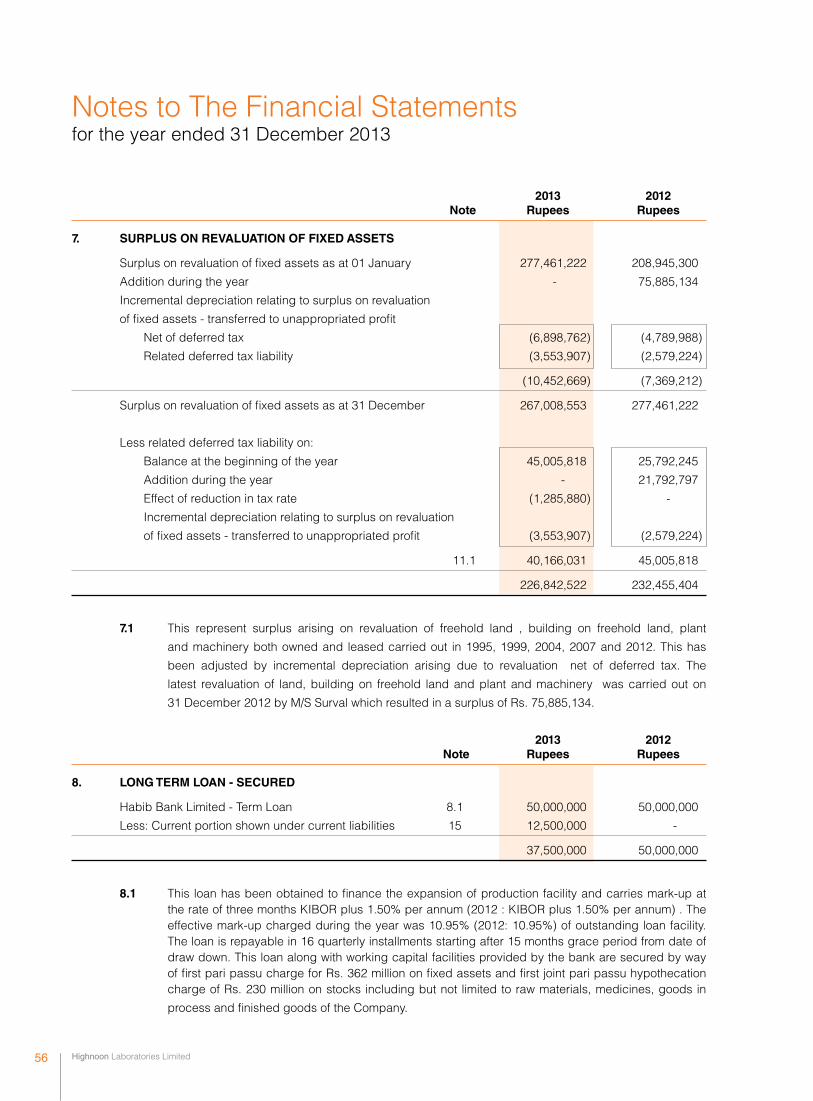
Highnoon Laboratories Limited 56
Notes to The Financial Statements for the year ended 31 December 2013
2013 2012 Note Rupees Rupees
7. SURPLUS ON REVALUATION OF FIXED ASSETS
Surplus on revaluation of fixed assets as at 01 January 277,461,222 208,945,300
Addition during the year - 75,885,134
Incremental depreciation relating to surplus on revaluation
of fixed assets - transferred to unappropriated profit
Net of deferred tax (6,898,762) (4,789,988)
Related deferred tax liability (3,553,907) (2,579,224)
(10,452,669) (7,369,212)
Surplus on revaluation of fixed assets as at 31 December 267,008,553 277,461,222
Less related deferred tax liability on:
Balance at the beginning of the year 45,005,818 25,792,245
Addition during the year - 21,792,797
Effect of reduction in tax rate (1,285,880) -
Incremental depreciation relating to surplus on revaluation
of fixed assets - transferred to unappropriated profit (3,553,907) (2,579,224)
11.1 40,166,031 45,005,818
226,842,522 232,455,404
7.1 This represent surplus arising on revaluation of freehold land , building on freehold land, plant
and machinery both owned and leased carried out in 1995, 1999, 2004, 2007 and 2012. This has
been adjusted by incremental depreciation arising due to revaluation net of deferred tax. The
latest revaluation of land, building on freehold land and plant and machinery was carried out on
31 December 2012 by M/S Surval which resulted in a surplus of Rs. 75,885,134.
2013 2012 Note Rupees Rupees
8. LONG TERM LOAN - SECURED
Habib Bank Limited - Term Loan 8.1 50,000,000 50,000,000
Less: Current portion shown under current liabilities 15 12,500,000 -
37,500,000 50,000,000
8.1 This loan has been obtained to finance the expansion of production facility and carries mark-up at the rate of three months KIBOR plus 1.50% per annum (2012 : KIBOR plus 1.50% per annum) . The effective mark-up charged during the year was 10.95% (2012: 10.95%) of outstanding loan facility. The loan is repayable in 16 quarterly installments starting after 15 months grace period from date of draw down. This loan along with working capital facilities provided by the bank are secured by way of first pari passu charge for Rs. 362 million on fixed assets and first joint pari passu hypothecation charge of Rs. 230 million on stocks including but not limited to raw materials, medicines, goods in
process and finished goods of the Company.

Annual Report 2013 57
2013 2012 Note Rupees Rupees
9. LIABILITIES AGAINST ASSETS SUBJECT TO FINANCE LEASE
Present value of minimum lease payments 44,997,599 27,968,462
Less: Current portion shown under current liabilities 15 20,219,058 15,163,223
24,778,541 12,805,239
Minimum Finance cost lease for future Principal payments periods outstanding Rupees
2013
Not later than one year 24,209,119 3,990,061 20,219,058
Later than one year but not later than five years 26,959,334 2,180,794 24,778,540
51,168,453 6,170,855 44,997,598
2012
Not later than one year 17,770,521 2,607,298 15,163,223
Later than one year but not later than five years 14,000,804 1,195,565 12,805,239
31,771,325 3,802,863 27,968,462
2013 2012
Salient features of the leases are as follows:
Discounting factor 11.30%-12.80% 14.50%-16.50%
Period of lease 36 months 36 months
Security deposits 5%-10% 5%-10%
The Company has entered into finance lease arrangements with various financial institutions for lease of plant
and machinery and vehicles as shown in note 17.1. The liabilities under these arrangements are payable in
monthly installments and above mentioned mark-up rates are used as discounting factor to determine the
present value of minimum lease payments.
All lease agreements carry renewal option at the end of lease period and the Company intends to exercise
its option to purchase the leased assets upon completion of the respective lease terms. Residual value of the
leased assets has already been paid at the inception of the lease in the form of security deposit. There are no
financial restrictions imposed by lessor. Taxes, repairs, replacements and insurance costs are borne by the
lessee.
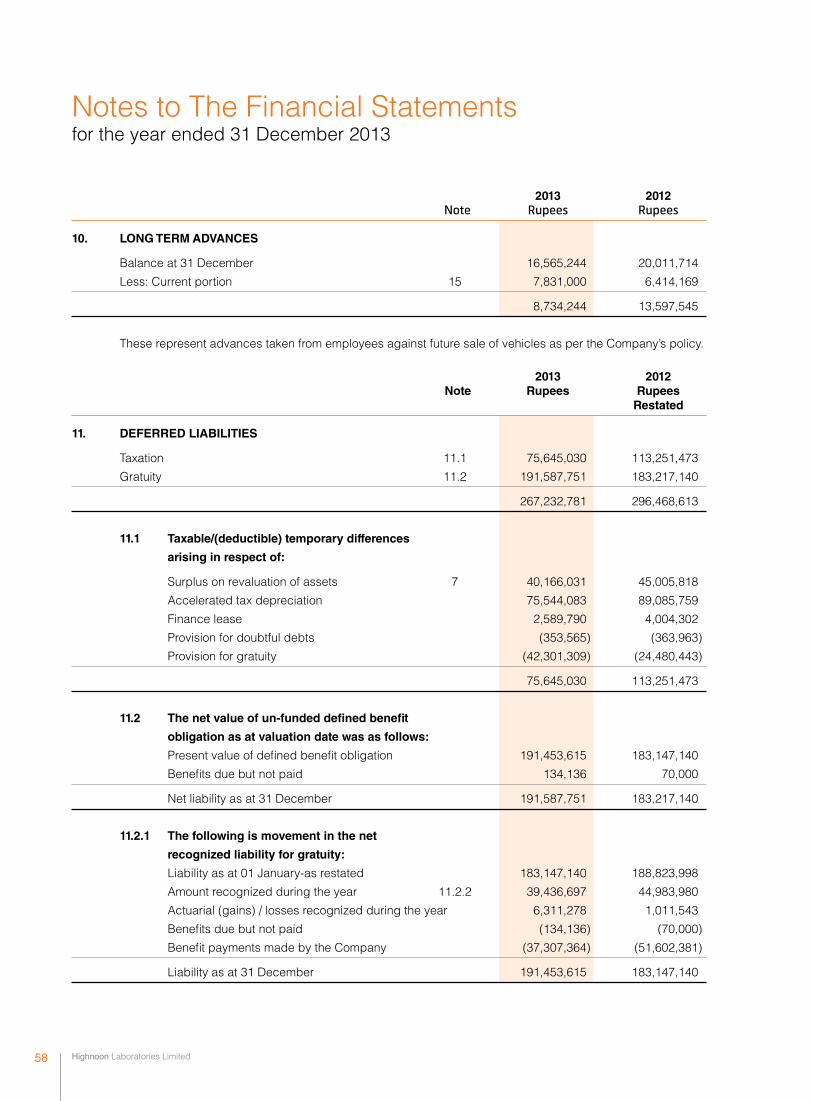
Highnoon Laboratories Limited 58
Notes to The Financial Statements for the year ended 31 December 2013
2013 2012 Note Rupees Rupees
10. LONG TERM ADVANCES
Balance at 31 December 16,565,244 20,011,714
Less: Current portion 15 7,831,000 6,414,169
8,734,244 13,597,545
These represent advances taken from employees against future sale of vehicles as per the Company’s policy.
2013 2012 Note Rupees Rupees Restated
11. DEFERRED LIABILITIES
Taxation 11.1 75,645,030 113,251,473
Gratuity 11.2 191,587,751 183,217,140
267,232,781 296,468,613
11.1 Taxable/(deductible) temporary differences
arising in respect of:
Surplus on revaluation of assets 7 40,166,031 45,005,818
Accelerated tax depreciation 75,544,083 89,085,759
Finance lease 2,589,790 4,004,302
Provision for doubtful debts (353,565) (363,963)
Provision for gratuity (42,301,309) (24,480,443)
75,645,030 113,251,473
11.2 The net value of un-funded defined benefit
obligation as at valuation date was as follows:
Present value of defined benefit obligation 191,453,615 183,147,140
Benefits due but not paid 134,136 70,000
Net liability as at 31 December 191,587,751 183,217,140
11.2.1 The following is movement in the net
recognized liability for gratuity:
Liability as at 01 January-as restated 183,147,140 188,823,998
Amount recognized during the year 11.2.2 39,436,697 44,983,980
Actuarial (gains) / losses recognized during the year 6,311,278 1,011,543
Benefits due but not paid (134,136) (70,000)
Benefit payments made by the Company (37,307,364) (51,602,381)
Liability as at 31 December 191,453,615 183,147,140
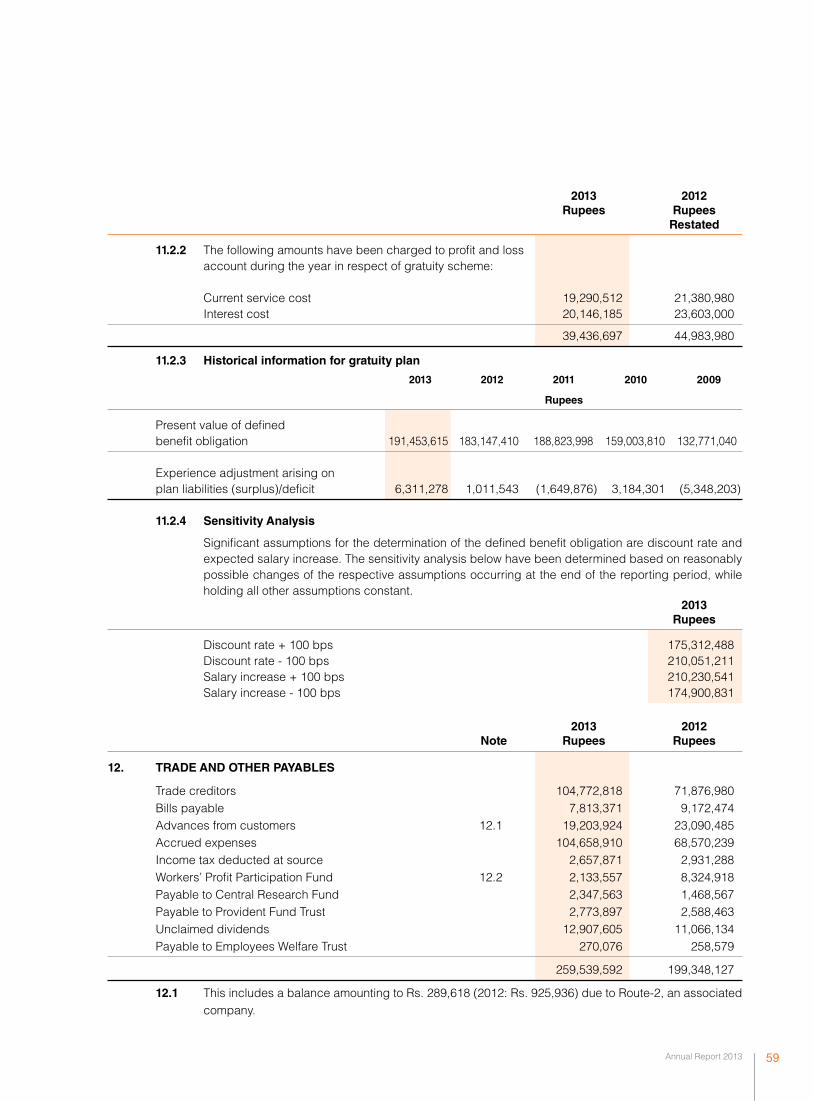
Annual Report 2013 59
2013 2012 Rupees Rupees Restated
11.2.2 The following amounts have been charged to profit and loss account during the year in respect of gratuity scheme: Current service cost 19,290,512 21,380,980 Interest cost 20,146,185 23,603,000
39,436,697 44,983,980
11.2.3 Historical information for gratuity plan
2013 2012 2011 2010 2009
Rupees
Present value of defined benefit obligation 191,453,615 183,147,410 188,823,998 159,003,810 132,771,040 Experience adjustment arising on plan liabilities (surplus)/deficit 6,311,278 1,011,543 (1,649,876) 3,184,301 (5,348,203)
11.2.4 Sensitivity Analysis
Significant assumptions for the determination of the defined benefit obligation are discount rate and expected salary increase. The sensitivity analysis below have been determined based on reasonably possible changes of the respective assumptions occurring at the end of the reporting period, while holding all other assumptions constant.
2013 Rupees
Discount rate + 100 bps 175,312,488 Discount rate - 100 bps 210,051,211 Salary increase + 100 bps 210,230,541 Salary increase - 100 bps 174,900,831
2013 2012 Note Rupees Rupees
12. TRADE AND OTHER PAYABLES
Trade creditors 104,772,818 71,876,980 Bills payable 7,813,371 9,172,474 Advances from customers 12.1 19,203,924 23,090,485 Accrued expenses 104,658,910 68,570,239 Income tax deducted at source 2,657,871 2,931,288 Workers’ Profit Participation Fund 12.2 2,133,557 8,324,918 Payable to Central Research Fund 2,347,563 1,468,567 Payable to Provident Fund Trust 2,773,897 2,588,463 Unclaimed dividends 12,907,605 11,066,134 Payable to Employees Welfare Trust 270,076 258,579
259,539,592 199,348,127
12.1 This includes a balance amounting to Rs. 289,618 (2012: Rs. 925,936) due to Route-2, an associated company.
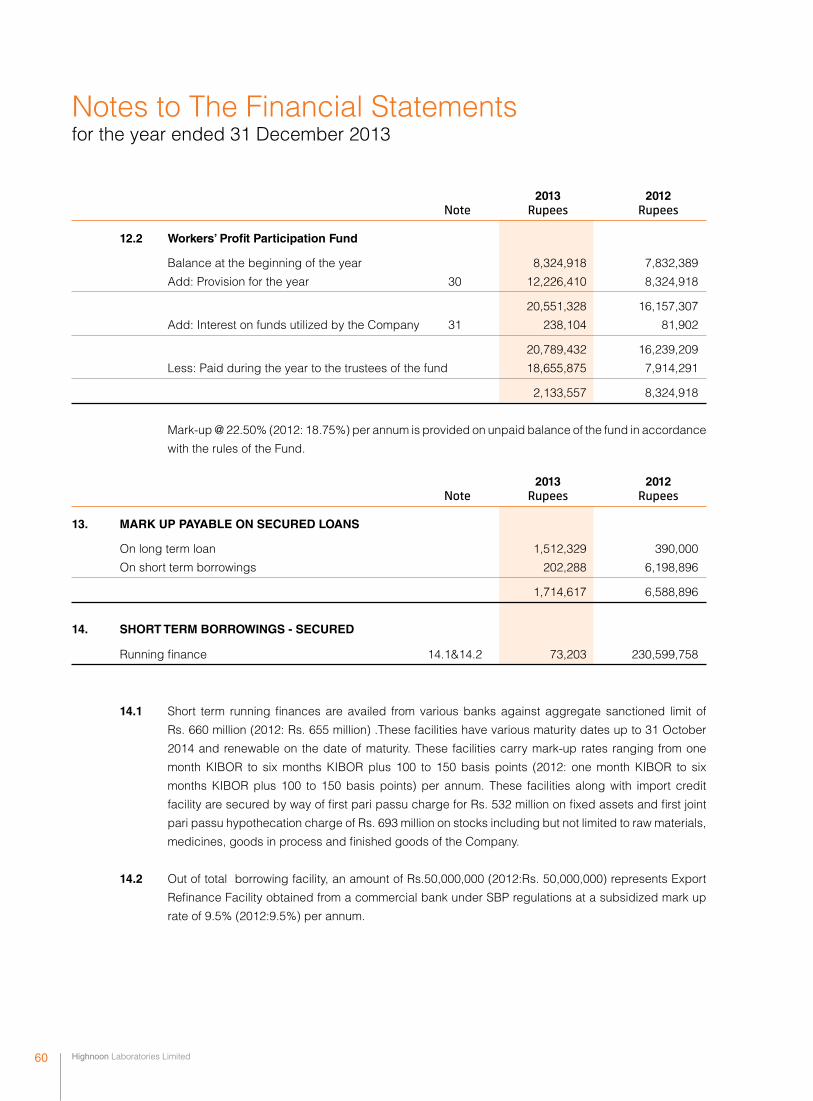
Highnoon Laboratories Limited 60
Notes to The Financial Statements for the year ended 31 December 2013
2013 2012 Note Rupees Rupees
12.2 Workers’ Profit Participation Fund
Balance at the beginning of the year 8,324,918 7,832,389
Add: Provision for the year 30 12,226,410 8,324,918
20,551,328 16,157,307
Add: Interest on funds utilized by the Company 31 238,104 81,902
20,789,432 16,239,209
Less: Paid during the year to the trustees of the fund 18,655,875 7,914,291
2,133,557 8,324,918
Mark-up @ 22.50% (2012: 18.75%) per annum is provided on unpaid balance of the fund in accordance
with the rules of the Fund.
2013 2012 Note Rupees Rupees
13. MARK UP PAYABLE ON SECURED LOANS
On long term loan 1,512,329 390,000
On short term borrowings 202,288 6,198,896
1,714,617 6,588,896
14. SHORT TERM BORROWINGS - SECURED
Running finance 14.1&14.2 73,203 230,599,758
14.1 Short term running finances are availed from various banks against aggregate sanctioned limit of
Rs. 660 million (2012: Rs. 655 million) .These facilities have various maturity dates up to 31 October
2014 and renewable on the date of maturity. These facilities carry mark-up rates ranging from one
month KIBOR to six months KIBOR plus 100 to 150 basis points (2012: one month KIBOR to six
months KIBOR plus 100 to 150 basis points) per annum. These facilities along with import credit
facility are secured by way of first pari passu charge for Rs. 532 million on fixed assets and first joint
pari passu hypothecation charge of Rs. 693 million on stocks including but not limited to raw materials,
medicines, goods in process and finished goods of the Company.
14.2 Out of total borrowing facility, an amount of Rs.50,000,000 (2012:Rs. 50,000,000) represents Export
Refinance Facility obtained from a commercial bank under SBP regulations at a subsidized mark up
rate of 9.5% (2012:9.5%) per annum.
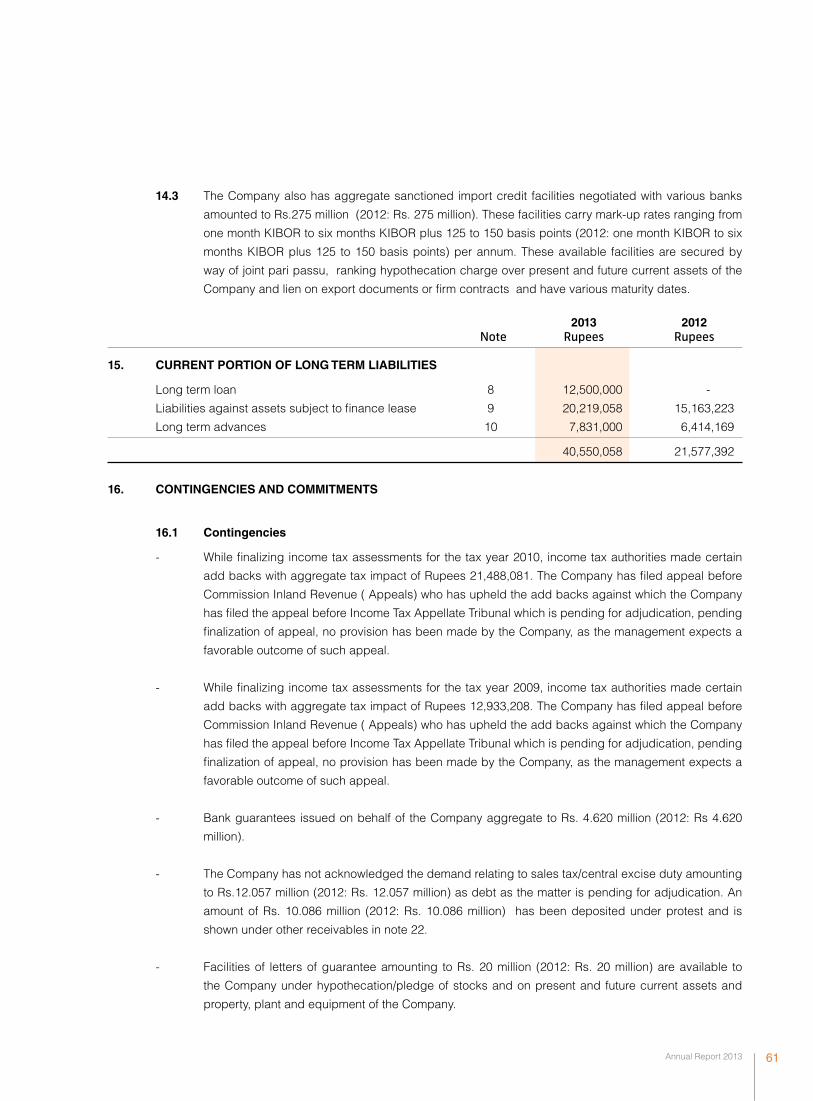
Annual Report 2013 61
14.3 The Company also has aggregate sanctioned import credit facilities negotiated with various banks
amounted to Rs.275 million (2012: Rs. 275 million). These facilities carry mark-up rates ranging from
one month KIBOR to six months KIBOR plus 125 to 150 basis points (2012: one month KIBOR to six
months KIBOR plus 125 to 150 basis points) per annum. These available facilities are secured by
way of joint pari passu, ranking hypothecation charge over present and future current assets of the
Company and lien on export documents or firm contracts and have various maturity dates.
2013 2012 Note Rupees Rupees
15. CURRENT PORTION OF LONG TERM LIABILITIES
Long term loan 8 12,500,000 -
Liabilities against assets subject to finance lease 9 20,219,058 15,163,223
Long term advances 10 7,831,000 6,414,169
40,550,058 21,577,392
16. CONTINGENCIES AND COMMITMENTS
16.1 Contingencies
- While finalizing income tax assessments for the tax year 2010, income tax authorities made certain
add backs with aggregate tax impact of Rupees 21,488,081. The Company has filed appeal before
Commission Inland Revenue ( Appeals) who has upheld the add backs against which the Company
has filed the appeal before Income Tax Appellate Tribunal which is pending for adjudication, pending
finalization of appeal, no provision has been made by the Company, as the management expects a
favorable outcome of such appeal.
- While finalizing income tax assessments for the tax year 2009, income tax authorities made certain
add backs with aggregate tax impact of Rupees 12,933,208. The Company has filed appeal before
Commission Inland Revenue ( Appeals) who has upheld the add backs against which the Company
has filed the appeal before Income Tax Appellate Tribunal which is pending for adjudication, pending
finalization of appeal, no provision has been made by the Company, as the management expects a
favorable outcome of such appeal.
- Bank guarantees issued on behalf of the Company aggregate to Rs. 4.620 million (2012: Rs 4.620
million).
- The Company has not acknowledged the demand relating to sales tax/central excise duty amounting
to Rs.12.057 million (2012: Rs. 12.057 million) as debt as the matter is pending for adjudication. An
amount of Rs. 10.086 million (2012: Rs. 10.086 million) has been deposited under protest and is
shown under other receivables in note 22.
- Facilities of letters of guarantee amounting to Rs. 20 million (2012: Rs. 20 million) are available to
the Company under hypothecation/pledge of stocks and on present and future current assets and
property, plant and equipment of the Company.

Highnoon Laboratories Limited 62
2013 2012 Note Rupees Rupees
16.2 Commitments
Commitments against irrevocable letters
of credit include:
Raw materials 164,456,000 110,085,000
Packing materials 44,858,000 15,866,000
Furniture - 6,141,000
17. PROPERTY, PLANT AND EQUIPMENT
Operating assets (owned) 17.1 694,898,950 725,775,250
Operating assets (leased) 17.1 52,614,628 39,409,323
Capital work-in-progress 17.2 14,366,646 13,233,582
761,880,224 778,418,155
Notes to The Financial Statements for the year ended 31 December 2013
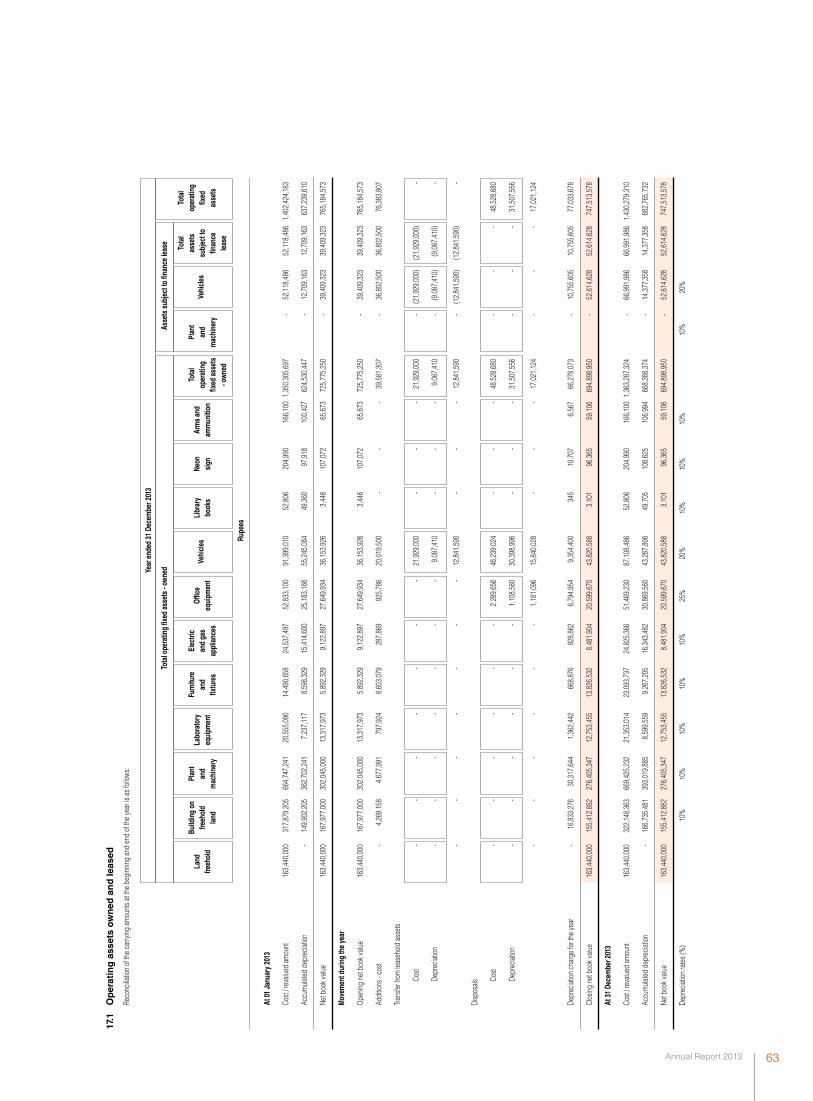
Annual Report 2013 63
17.1
O
per
atin
g a
sset
s o
wn
ed a
nd
leas
ed
Re
conc
iliatio
n of
the
carry
ing a
mou
nts a
t the
beg
inning
and
end
of t
he ye
ar is
as f
ollow
s:
Year
end
ed 3
1 De
cem
ber 2
013
Tota
l ope
ratin
g fix
ed a
sset
s - o
wned
As
sets
sub
ject
to fi
nanc
e le
ase
Land
Bu
ildin
g on
Pl
ant
Labo
rato
ry
Fu
rnitu
re
Elec
tric
Offic
e
Vehi
cles
Libr
ary
Ne
on
Arm
s an
d To
tal
Plan
t
Vehi
cles
To
tal
Tota
l
freeh
old
freeh
old
and
equi
pmen
t an
d an
d ga
s
equi
pmen
t
book
s si
gn
amm
uniti
on
op
erat
ing
and
as
sets
op
erat
ing
la
nd
mac
hine
ry
fix
ture
s ap
plia
nces
fixed
ass
ets
mac
hine
ry
su
bjec
t to
fixed
finan
ce
asse
ts
- own
ed
leas
e
Ru
pees
At 01
Jan
uary
201
3
Cost
/ rev
alued
am
ount
1
63,4
40,0
00
317
,879
,205
6
64,7
47,2
41
20,
555,
090
1
4,49
0,65
8
24,5
37,4
97
52,
833,
100
9
1,39
9,01
0 52
,806
2
04,9
90
166
,100
1,3
50,3
05,6
97
-
52,
118,
486
5
2,11
8,48
6 1
,402
,424
,183
Accu
mula
ted
depr
eciat
ion
-
149
,902
,205
3
62,7
02,2
41
7,2
37,1
17
8
,598
,329
1
5,41
4,60
0
25
,183
,166
5
5,24
5,08
4 49
,360
9
7,91
8
100
,427
6
24,5
30,4
47
-
12,
709,
163
1
2,70
9,16
3
637
,239
,610
Net b
ook v
alue
163
,440
,000
1
67,9
77,0
00
302
,045
,000
1
3,31
7,97
3
5,8
92,3
29
9,1
22,8
97
27,6
49,9
34
36,
153,
926
3,
446
1
07,0
72
65,
673
725
,775
,250
-
3
9,40
9,32
3
39,
409,
323
7
65,1
84,5
73
Mov
emen
t dur
ing
the
year
Open
ing n
et b
ook v
alue
163
,440
,000
1
67,9
77,0
00
302
,045
,000
1
3,31
7,97
3
5,8
92,3
29
9,12
2,89
7
27,
649,
934
3
6,15
3,92
6
3,44
6
107
,072
6
5,67
3
725
,775
,250
-
3
9,40
9,32
3
39,
409,
323
7
65,1
84,5
73
Addi
tions
- co
st -
4
,269
,158
4
,677
,991
7
97,9
24
8,6
03,0
79
287
,869
9
25,7
86
20,
019,
500
-
- -
39,
581,
307
-
36,
802,
500
3
6,80
2,50
0
76,
383,
807
Trans
fer f
rom
leas
ehold
ass
ets
Co
st -
-
-
-
-
-
-
2
1,92
9,00
0
-
-
-
21,
929,
000
-
(2
1,92
9,00
0)
(21,
929,
000)
-
De
prec
iation
-
-
-
-
-
-
-
9
,087
,410
-
-
-
9
,087
,410
-
(9
,087
,410
) (9
,087
,410
) -
-
-
-
-
-
-
-
12,
841,
590
-
-
-
1
2,84
1,59
0
-
(12,
841,
590)
(1
2,84
1,59
0)
-
Disp
osals
Co
st -
-
-
-
-
-
2
,289
,656
4
6,23
9,02
4
-
-
-
48,
528,
680
-
-
-
4
8,52
8,68
0
De
prec
iation
-
-
-
-
-
-
1
,108
,560
3
0,39
8,99
6
-
-
-
31,
507,
556
-
-
-
3
1,50
7,55
6
-
-
-
-
-
-
1,1
81,0
96
15,
840,
028
-
-
-
1
7,02
1,12
4
-
-
-
17,
021,
124
Depr
eciat
ion c
harg
e fo
r the
year
-
1
6,83
3,27
6
30,
317,
644
1
,362
,442
6
68,8
76
928,
862
6
,794
,954
9
,354
,400
34
5
10,
707
6,5
67
66,2
78,0
73
-
10,
755,
605
1
0,75
5,60
5
77,
033,
678
Clos
ing n
et b
ook v
alue
163
,440
,000
1
55,4
12,8
82
276
,405
,347
1
2,75
3,45
5
13,
826,
532
8
,481
,904
2
0,59
9,67
0
43,8
20,5
88
3,1
01
96,3
65
59,1
06
694
,898
,950
-
5
2,61
4,62
8
52,
614,
628
7
47,5
13,5
78
At 3
1 De
cem
ber 2
013
Cost
/ rev
alued
am
ount
1
63,4
40,0
00
322
,148
,363
6
69,4
25,2
32
21,
353,
014
2
3,09
3,73
7
24,
825,
366
51
,469
,230
8
7,10
8,48
6 5
2,80
6 2
04,9
90
166
,100
1,3
63,2
87,3
24
-
66,
991,
986
6
6,99
1,98
6 1
,430
,279
,310
Accu
mula
ted
depr
eciat
ion
-
166
,735
,481
3
93,0
19,8
85
8,5
99,5
59
9,2
67,2
05
16,
343,
462
3
0,86
9,56
0
43,
287,
898
49,
705
108
,625
1
06,9
94
668
,388
,374
-
1
4,37
7,35
8
14,
377,
358
6
82,7
65,7
32
Net b
ook v
alue
163
,440
,000
1
55,4
12,8
82
276
,405
,347
1
2,75
3,45
5
13,
826,
532
8
,481
,904
2
0,59
9,67
0
43,
820,
588
3
,101
9
6,36
5
59,1
06
694
,898
,950
-
5
2,61
4,62
8
52,
614,
628
7
47,5
13,5
78
Depr
eciat
ion ra
tes (
%)
10
%
10%
10
%
10%
10
%
25%
20
%
10%
10
%
10%
10%
20
%
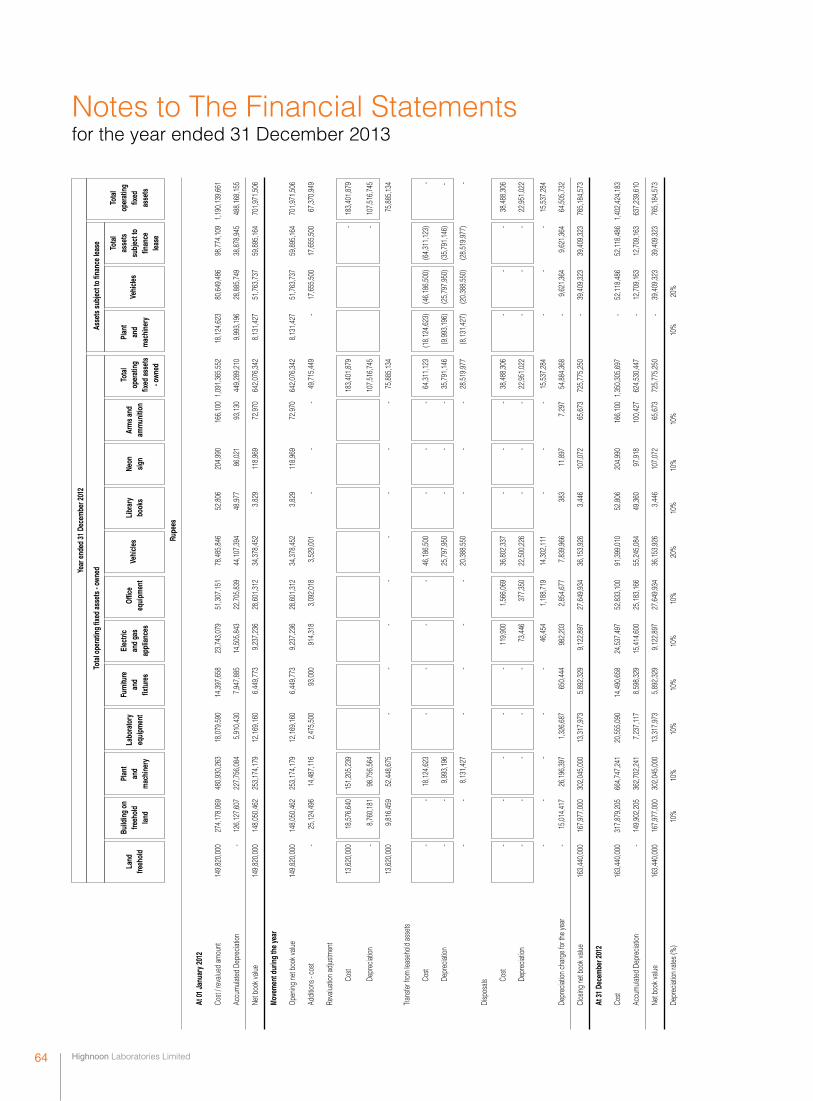
Highnoon Laboratories Limited 64
Year
end
ed 3
1 De
cem
ber 2
012
Tota
l ope
ratin
g fix
ed a
sset
s - o
wned
As
sets
sub
ject
to fi
nanc
e le
ase
Land
Bu
ildin
g on
Pl
ant
Labo
rato
ry
Fu
rnitu
re
Elec
tric
Offic
e
Vehi
cles
Libr
ary
Ne
on
Arm
s an
d To
tal
Plan
t
Vehi
cles
To
tal
Tota
l
freeh
old
freeh
old
and
equi
pmen
t an
d an
d ga
s
equi
pmen
t
book
s si
gn
amm
uniti
on
op
erat
ing
and
as
sets
op
erat
ing
la
nd
mac
hine
ry
fix
ture
s ap
plia
nces
fixed
ass
ets
mac
hine
ry
su
bjec
t to
fixed
finan
ce
asse
ts
- own
ed
leas
e
Ru
pees
At 01
Jan
uary
201
2
Cost
/ rev
alued
am
ount
1
49,8
20,0
00
274
,178
,069
4
80,9
30,2
63
18,
079,
590
1
4,39
7,65
8
23,
743,
079
5
1,30
7,15
1
78,
485,
846
5
2,80
6
204
,990
1
66,1
00 1
,091
,365
,552
1
8,12
4,62
3
80,
649,
486
9
8,77
4,10
9 1
,190
,139
,661
Accu
mula
ted
Depr
eciat
ion
-
126
,127
,607
2
27,7
56,0
84
5,9
10,4
30
7,9
47,8
85
14,
505,
843
2
2,70
5,83
9
44,
107,
394
4
8,97
7
86,
021
9
3,13
0
449
,289
,210
9
,993
,196
2
8,88
5,74
9
38,
878,
945
4
88,1
68,1
55
Net b
ook v
alue
149
,820
,000
1
48,0
50,4
62
253
,174
,179
1
2,16
9,16
0
6,4
49,7
73
9,2
37,2
36
28,
601,
312
3
4,37
8,45
2
3,8
29
118
,969
7
2,97
0
642
,076
,342
8
,131
,427
5
1,76
3,73
7
59,
895,
164
7
01,9
71,5
06
Mov
emen
t dur
ing
the
year
Open
ing n
et b
ook v
alue
149
,820
,000
1
48,0
50,4
62
253
,174
,179
1
2,16
9,16
0
6,4
49,7
73
9,2
37,2
36
28,
601,
312
3
4,37
8,45
2
3,8
29
118
,969
7
2,97
0
642
,076
,342
8
,131
,427
5
1,76
3,73
7
59,
895,
164
7
01,9
71,5
06
Addi
tions
- co
st -
2
5,12
4,49
6
14,
487,
116
2
,475
,500
9
3,00
0
914
,318
3
,092
,018
3
,529
,001
-
-
-
4
9,71
5,44
9
-
17,
655,
500
1
7,65
5,50
0
67,
370,
949
Reva
luatio
n ad
justm
ent
Co
st 1
3,62
0,00
0
18,
576,
640
1
51,2
05,2
39
183
,401
,879
-
183
,401
,879
De
prec
iation
-
8
,760
,181
9
8,75
6,56
4
107
,516
,745
-
1
07,5
16,7
45
13,
620,
000
9
,816
,459
5
2,44
8,67
5
-
-
-
-
-
-
-
-
75,
885,
134
75,
885,
134
Trans
fer f
rom
leas
ehold
ass
ets
Co
st -
-
1
8,12
4,62
3
-
-
-
-
46,
186,
500
-
-
-
6
4,31
1,12
3
(18,
124,
623)
(4
6,18
6,50
0)
(64,
311,
123)
-
De
prec
iation
-
-
9
,993
,196
2
5,79
7,95
0
-
-
-
35,
791,
146
(9
,993
,196
) (2
5,79
7,95
0)
(35,
791,
146)
-
-
-
8
,131
,427
-
-
-
-
2
0,38
8,55
0
-
-
-
28,
519,
977
(8
,131
,427
) (2
0,38
8,55
0)
(28,
519,
977)
-
Disp
osals
Co
st -
-
-
-
-
1
19,9
00
1,5
66,0
69
36,
802,
337
-
-
-
3
8,48
8,30
6
-
-
-
38,
488,
306
De
prec
iation
-
-
-
-
-
7
3,44
6
377
,350
2
2,50
0,22
6
-
-
-
22,
951,
022
-
-
-
2
2,95
1,02
2
-
-
-
-
-
46,
454
1
,188
,719
1
4,30
2,11
1
-
-
-
15,
537,
284
-
-
-
1
5,53
7,28
4
Depr
eciat
ion c
harg
e fo
r the
year
-
1
5,01
4,41
7
26,
196,
397
1
,326
,687
6
50,4
44
982
,203
2
,854
,677
7
,839
,966
3
83
11,
897
7
,297
5
4,88
4,36
8
-
9,6
21,3
64
9,6
21,3
64
64,
505,
732
Clos
ing n
et b
ook v
alue
163
,440
,000
1
67,9
77,0
00
302
,045
,000
1
3,31
7,97
3
5,8
92,3
29
9,1
22,8
97
27,
649,
934
3
6,15
3,92
6
3,4
46
107
,072
6
5,67
3
725
,775
,250
-
3
9,40
9,32
3
39,
409,
323
7
65,1
84,5
73
At 3
1 De
cem
ber 2
012
Cost
1
63,4
40,0
00
317
,879
,205
6
64,7
47,2
41
20,
555,
090
1
4,49
0,65
8
24,
537,
497
5
2,83
3,10
0
91,
399,
010
5
2,80
6
204
,990
1
66,1
00 1
,350
,305
,697
-
5
2,11
8,48
6
52,
118,
486
1,4
02,4
24,1
83
Accu
mula
ted
Depr
eciat
ion
-
149
,902
,205
3
62,7
02,2
41
7,2
37,1
17
8,5
98,3
29
15,
414,
600
2
5,18
3,16
6
55,
245,
084
4
9,36
0
97,
918
1
00,4
27
624
,530
,447
-
1
2,70
9,16
3
12,
709,
163
6
37,2
39,6
10
Net b
ook v
alue
163
,440
,000
1
67,9
77,0
00
302
,045
,000
1
3,31
7,97
3
5,8
92,3
29
9,1
22,8
97
27,
649,
934
3
6,15
3,92
6
3,4
46
107
,072
6
5,67
3
725
,775
,250
-
3
9,40
9,32
3
39,
409,
323
7
65,1
84,5
73
Depr
eciat
ion ra
tes (
%)
10
%
10%
10
%
10%
10
%
10%
20
%
10%
10
%
10%
10%
20
%
Notes to The Financial Statements for the year ended 31 December 2013
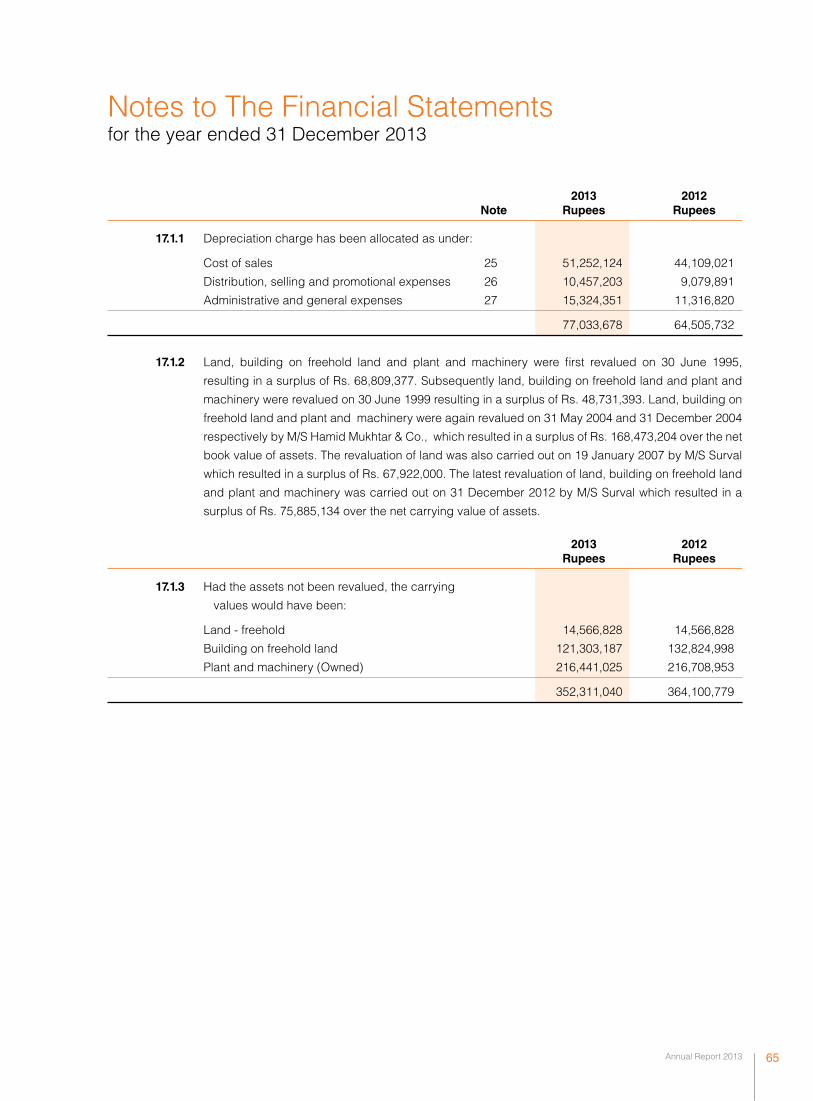
Annual Report 2013 65
Notes to The Financial Statements for the year ended 31 December 2013
2013 2012 Note Rupees Rupees
17.1.1 Depreciation charge has been allocated as under:
Cost of sales 25 51,252,124 44,109,021
Distribution, selling and promotional expenses 26 10,457,203 9,079,891
Administrative and general expenses 27 15,324,351 11,316,820
77,033,678 64,505,732
17.1.2 Land, building on freehold land and plant and machinery were first revalued on 30 June 1995,
resulting in a surplus of Rs. 68,809,377. Subsequently land, building on freehold land and plant and
machinery were revalued on 30 June 1999 resulting in a surplus of Rs. 48,731,393. Land, building on
freehold land and plant and machinery were again revalued on 31 May 2004 and 31 December 2004
respectively by M/S Hamid Mukhtar & Co., which resulted in a surplus of Rs. 168,473,204 over the net
book value of assets. The revaluation of land was also carried out on 19 January 2007 by M/S Surval
which resulted in a surplus of Rs. 67,922,000. The latest revaluation of land, building on freehold land
and plant and machinery was carried out on 31 December 2012 by M/S Surval which resulted in a
surplus of Rs. 75,885,134 over the net carrying value of assets.
2013 2012 Rupees Rupees
17.1.3 Had the assets not been revalued, the carrying
values would have been:
Land - freehold 14,566,828 14,566,828
Building on freehold land 121,303,187 132,824,998
Plant and machinery (Owned) 216,441,025 216,708,953
352,311,040 364,100,779

Highnoon Laboratories Limited 66
17.1.4 Disposal of property, plant & equipment
Sold to Cost
Accumulated Written Sales Gain / Mode of Depreciation Down
Proceeds (Loss) Sales Value
Rupees
Vehicles
Amer Saeed 883,000 409,555 473,445 667,386 193,941 Company Policy
Saima Irfan 529,000 245,362 283,638 407,298 123,660 Company Policy
Syed Kamran Ali Zaidi 529,000 250,252 278,748 475,000 196,252 Company Policy
Adeel Khaliq 529,000 250,252 278,748 577,033 298,285 Company Policy
Waseem Ahmed Qureshi 883,000 409,555 473,445 696,721 223,276 Company Policy
Syed Ashar Ali 474,000 325,691 148,309 320,520 172,211 Company Policy
Muhammad Asghar 83,400 40,403 42,997 83,400 40,403 Company Policy
Nasir Athar 795,000 477,396 317,604 330,720 13,116 Company Policy
Muhammad Asadullah 682,000 443,469 238,531 425,160 186,629 Company Policy
Aleem ud din 395,000 284,262 110,738 268,260 157,522 Company Policy
Arif Hussain 795,000 453,426 341,574 482,657 141,083 Company Policy
Muhammad Shahid Ghouri 465,000 393,487 71,513 20,000 (51,513) Company Policy
M. Ahsan 365,000 278,673 86,327 247,776 161,449 Company Policy
Munawar Saeed 395,000 296,127 98,873 238,200 139,327 Company Policy
Zulifqar Ahmed 395,000 280,236 114,764 244,329 129,565 Company Policy
Sheikh Zulfiqar 790,500 660,087 130,413 720,000 589,587 Negotiation
Muhammad Arshad 395,000 305,152 89,848 - (89,848) Company Policy
Abdul Khaliq 395,000 305,152 89,848 - (89,848) Company Policy
Sheharyar Ilyas 395,000 305,152 89,848 - (89,848) Company Policy
Muhammad Saleem 395,000 305,152 89,848 - (89,848) Company Policy
Farhan Saeed 395,000 305,152 89,848 - (89,848) Company Policy
Muhammad Anwar 395,000 305,152 89,848 - (89,848) Company Policy
Zahid Yousaf 395,000 305,152 89,848 - (89,848) Company Policy
Muhammad Shahid 395,000 305,152 89,848 - (89,848) Company Policy
Zafarullah Khan 395,000 305,152 89,848 - (89,848) Company Policy
Muhammad Tahir 395,000 305,152 89,848 - (89,848) Company Policy
Ghulam Haider 395,000 305,152 89,848 - (89,848) Company Policy
Babar Rasheed Khan 395,000 305,152 89,848 - (89,848) Company Policy
Hafsa Moiz 408,300 277,992 130,308 277,500 147,192 Company Policy
Muhammad Hafeez 62,900 30,304 32,596 62,900 30,304 Company Policy
Kamran Zai 434,509 293,118 141,391 274,532 133,141 Company Policy
Nadeem Hussain 66,500 18,528 47,972 66,500 18,528 Company Policy
Abid Bashir 499,000 318,455 180,545 363,440 182,895 Company Policy
S. Ashar Hussain 408,300 292,347 115,953 256,620 140,667 Company Policy
Dr. Imran Hyder 549,000 370,353 178,647 372,120 193,473 Company Policy
Muhammad Ashfaq 62,900 30,472 32,428 62,900 30,472 Company Policy
Muhammad Nadeem 62,900 30,393 32,507 62,900 30,393 Company Policy
Asif Munawar 62,900 29,353 33,547 62,900 29,353 Company Policy
Muhammad Rizwan Hamidi 62,900 30,393 32,507 62,900 30,393 Company Policy
Notes to The Financial Statements for the year ended 31 December 2013

Annual Report 2013 67
Sold to Cost
Accumulated Written Sales Gain / Mode of Depreciation Down
Proceeds (Loss) Sales Value
Rupees
Vehicles
Muhammad Ahmad 62,900 29,711 33,189 62,900 29,711 Company Policy
Ayesha Qazafi Mehmood 943,000 298,826 644,174 799,664 155,490 Company Policy
Tanveer Ahmed 403,000 300,877 102,123 244,080 141,957 Company Policy
Muhammad Anzar 408,300 276,738 131,562 276,600 145,038 Company Policy
Tahir Mehmood 829,000 473,407 355,593 577,633 222,040 Company Policy
Ramzan Shahid 408,300 276,738 131,562 276,600 145,038 Company Policy
Muhammad Ramzan 632,000 427,639 204,361 425,160 220,799 Company Policy
Muhammad Ilyas 825,000 558,231 266,769 548,340 281,571 Company Policy
Syed Javed Raza 1,389,000 884,861 504,139 500,792 (3,347) Company Policy
Muhammad Raza Saeed 8,103,492 6,084,238 2,019,254 7,000,000 4,980,746 Negotiation
Muhammad Saqib 1,142,500 887,925 254,575 980,000 725,425 Negotiation
Azadar Hussain Naqvi 754,000 470,898 283,102 528,846 245,744 Company Policy
Asad Abbas Jaffery 504,000 275,197 228,803 371,518 142,715 Company Policy
Ali Raza Zaidi 62,900 32,815 30,085 58,104 28,019 Company Policy
Asim Munir 890,000 635,953 254,047 254,047 - Company Policy
Abdul Rauf 890,000 640,490 249,510 249,510 - Company Policy
Jawad Zafar 825,000 558,231 266,769 548,340 281,571 Company Policy
Azia Zafar 825,000 558,231 266,769 548,340 281,571 Company Policy
M. Wasim Wafa 1,389,000 910,937 478,063 504,139 26,076 Company Policy
Muhammad Ishaq 51,890 33,470 18,420 43,704 25,284 Company Policy
Haseeb Ahmad 444,333 291,606 152,727 375,000 222,273 Negotiation
Mirza Farooq Baig 1,322,500 1,032,729 289,771 1,065,000 775,229 Company Policy
Dr. Ahmad Atif Mirza 1,422,000 994,351 427,649 427,649 - Company Policy
Muhammad Ajmal 65,900 19,243 46,657 65,900 19,243 Company Policy
Muhammad Ghufran 408,300 271,256 137,044 253,110 116,066 Company Policy
Muhammad Abid 519,000 246,813 272,187 420,001 147,814 Company Policy
Ikhlaq Ahmed 62,900 34,452 28,448 50,148 21,700 Company Policy
Khadim Hussain Mirza 1,040,000 732,345 307,655 307,655 - Company Policy
Zohaib 65,500 26,899 38,601 65,500 26,899 Company Policy
Muhammad Khalid 64,500 28,667 35,833 64,500 28,667 Company Policy
Irfan Ullah Wasim 65,500 26,899 38,601 65,500 26,899 Company Policy
Muhammad Raza 64,500 27,233 37,267 64,500 27,233 Company Policy
Yasir Ali 530,000 318,339 211,661 376,295 164,634 Company Policy
Muhammad Nazim 65,900 27,063 38,837 65,900 27,063 Company Policy
Muhammad Muzammil 67,000 16,676 50,324 67,000 16,676 Company Policy
Qasim Mehmood 66,500 19,418 47,082 66,500 19,418 Company Policy
Ashfaq Ahmed 64,500 22,217 42,283 55,000 12,717 Company Policy
Syed Samad Hussain 65,900 23,212 42,688 65,900 23,212 Company Policy
Tanveer ul Haq Qureshi 2,088,000 742,400 1,345,600 1,850,000 504,400 Negotiation
46,239,024 30,398,996 15,840,028 28,699,047 12,859,019

Highnoon Laboratories Limited 68
Sold to Cost
Accumulated Written Sales Gain / Mode of Depreciation Down
Proceeds (Loss) Sales Value
Rupees
Office Equipment
HP ProBook 4430s Notebook 63,000 11,266 51,734 - (51,734) Scrap
HP ProBook 4530s Notebook 63,568 14,452 49,116 - (49,116) Scrap
HP Compaq M 2222 Notebook 65,493 34,573 30,920 - (30,920) Scrap
HP Compaq M 2222 Notebook 65,493 34,573 30,920 - (30,920) Scrap
Note Book 68,900 31,652 37,248 - (37,248) Scrap
NECMultimedia Projector 66,000 20,262 45,738 - (45,738) Scrap
HP Note Book 6730 72,815 29,465 43,350 37,131 (6,219) Negotiation
HP ProBook 4430s 76,600 12,554 64,046 64,046 - Negotiation
4 -Apple iPad 77,107 21,446 55,661 55,661 - Negotiation
Compac Note Book 88,160 39,657 48,503 48,503 - Negotiation
Note Book 110,000 67,032 42,968 42,968 - Negotiation
Note Book IBM Z60-M 111,999 58,954 53,045 30,000 (23,045) Negotiation
Lap Top Sony (M.S110) 120,000 67,919 52,081 52,081 - Negotiation
Note Book 142,538 86,862 55,676 55,676 - Negotiation
Lap Top 210,243 115,737 94,506 94,506 - Negotiation
Acer 5204 NWLMI Note Book 358,000 179,195 178,805 178,805 - Negotiation
Assets having indvidual cost
less than Rs. 50,000 529,740 282,961 246,778 148,300 (98,478) Scrap sales
2,289,656 1,108,560 1,181,096 807,677 (373,419)
2013 48,528,680 31,507,556 17,021,124 29,506,724 12,485,600
2012 38,488,306 22,951,022 15,537,284 31,243,564 15,706,280
Notes to The Financial Statements for the year ended 31 December 2013
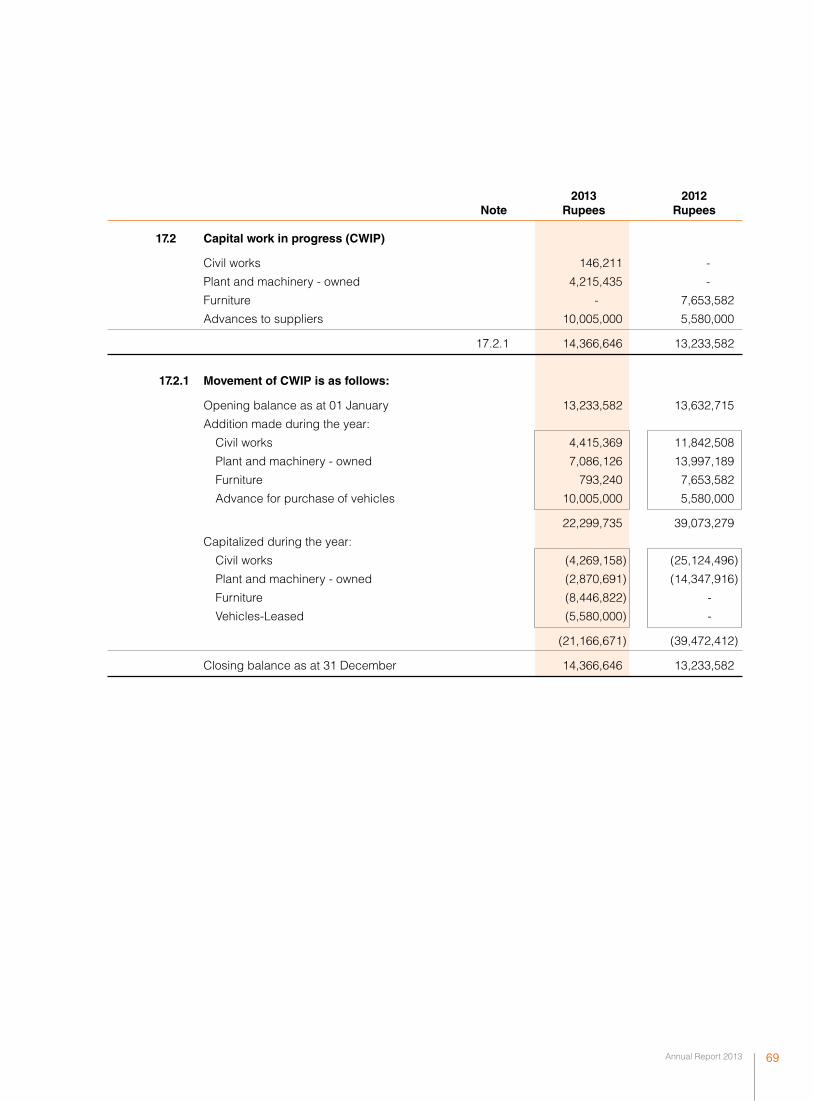
Annual Report 2013 69
2013 2012 Note Rupees Rupees
17.2 Capital work in progress (CWIP)
Civil works 146,211 -
Plant and machinery - owned 4,215,435 -
Furniture - 7,653,582
Advances to suppliers 10,005,000 5,580,000
17.2.1 14,366,646 13,233,582
17.2.1 Movement of CWIP is as follows:
Opening balance as at 01 January 13,233,582 13,632,715
Addition made during the year:
Civil works 4,415,369 11,842,508
Plant and machinery - owned 7,086,126 13,997,189
Furniture 793,240 7,653,582
Advance for purchase of vehicles 10,005,000 5,580,000
22,299,735 39,073,279
Capitalized during the year:
Civil works (4,269,158) (25,124,496)
Plant and machinery - owned (2,870,691) (14,347,916)
Furniture (8,446,822) -
Vehicles-Leased (5,580,000) -
(21,166,671) (39,472,412)
Closing balance as at 31 December 14,366,646 13,233,582

Highnoon Laboratories Limited 70
Notes to The Financial Statements for the year ended 31 December 2013
18.1 This represents registration and trademarks of brands named as “Tres Orix Forte”, “Skilax drops” and
“Blokium”.
2013 2012 Note Rupees Rupees
18.2 Amortization charge has been allocated as under:
Cost of sales 25 15,443,418 15,443,418
Distribution, selling and promotional expenses 26 2,563,251 2,293,092
18,006,669 17,736,510
18. INTANGIBLE ASSETS
Cost Amortization
Particulars
As at
Additions
As at 31 As at For As at 31
Book Value
Rate
01 January
December 01 January the year December
as at 31
%
December
Rupees
2013
Registration and trademark 154,434,175 - 154,434,175 72,144,068 15,443,418 87,587,486 66,846,689 10
(Note18.1)
Computer softwares 25,518,611 146,462 25,665,073 9,395,796 2,563,251 11,959,047 13,706,026 10
179,952,786 146,462 180,099,248 81,539,864 18,006,669 99,546,533 80,552,715
2012
Registration and trademark 154,434,175 - 154,434,175 56,700,650 15,443,418 72,144,068 82,290,107 10
(Note18.1)
Computer softwares 21,212,996 4,305,615 25,518,611 7,102,704 2,293,092 9,395,796 16,122,815 10
175,647,171 4,305,615 179,952,786 63,803,354 17,736,510 81,539,864 98,412,922
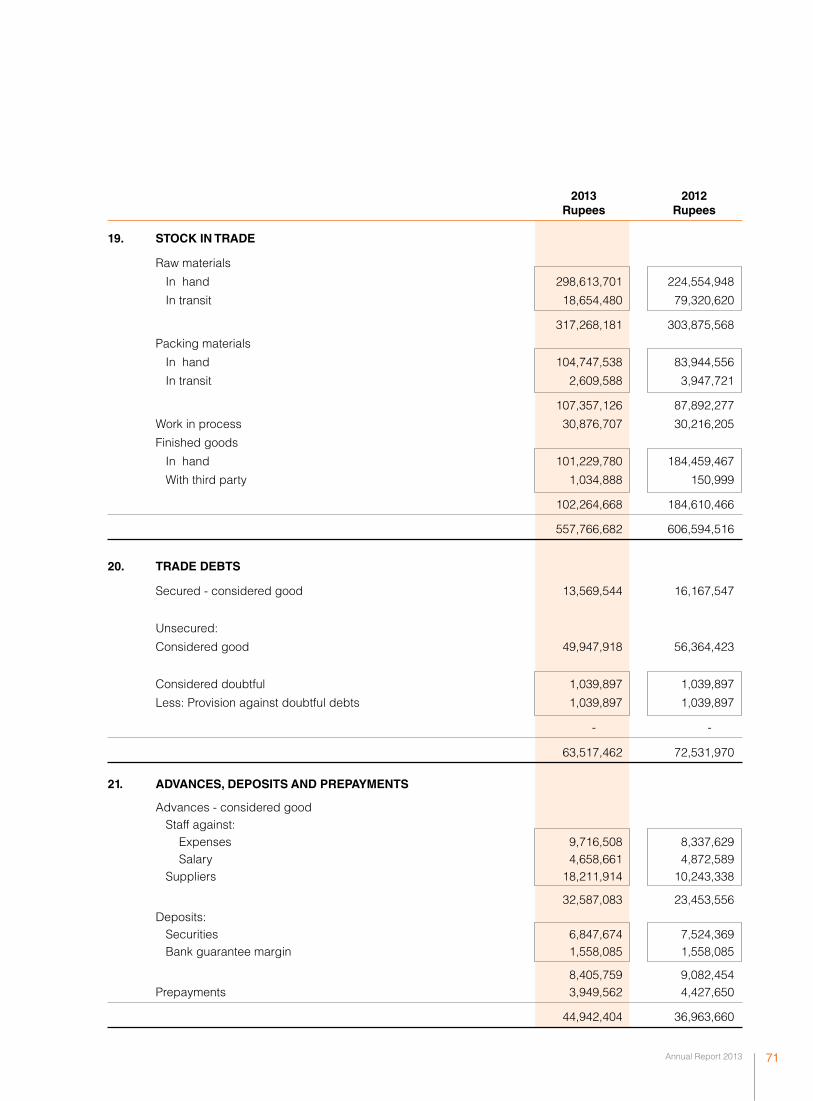
Annual Report 2013 71
2013 2012 Rupees Rupees
19. STOCK IN TRADE
Raw materials
In hand 298,613,701 224,554,948
In transit 18,654,480 79,320,620
317,268,181 303,875,568
Packing materials
In hand 104,747,538 83,944,556
In transit 2,609,588 3,947,721
107,357,126 87,892,277
Work in process 30,876,707 30,216,205
Finished goods
In hand 101,229,780 184,459,467
With third party 1,034,888 150,999
102,264,668 184,610,466
557,766,682 606,594,516
20. TRADE DEBTS
Secured - considered good 13,569,544 16,167,547
Unsecured:
Considered good 49,947,918 56,364,423
Considered doubtful 1,039,897 1,039,897
Less: Provision against doubtful debts 1,039,897 1,039,897
- -
63,517,462 72,531,970
21. ADVANCES, DEPOSITS AND PREPAYMENTS
Advances - considered good Staff against: Expenses 9,716,508 8,337,629 Salary 4,658,661 4,872,589 Suppliers 18,211,914 10,243,338
32,587,083 23,453,556 Deposits: Securities 6,847,674 7,524,369 Bank guarantee margin 1,558,085 1,558,085
8,405,759 9,082,454 Prepayments 3,949,562 4,427,650
44,942,404 36,963,660
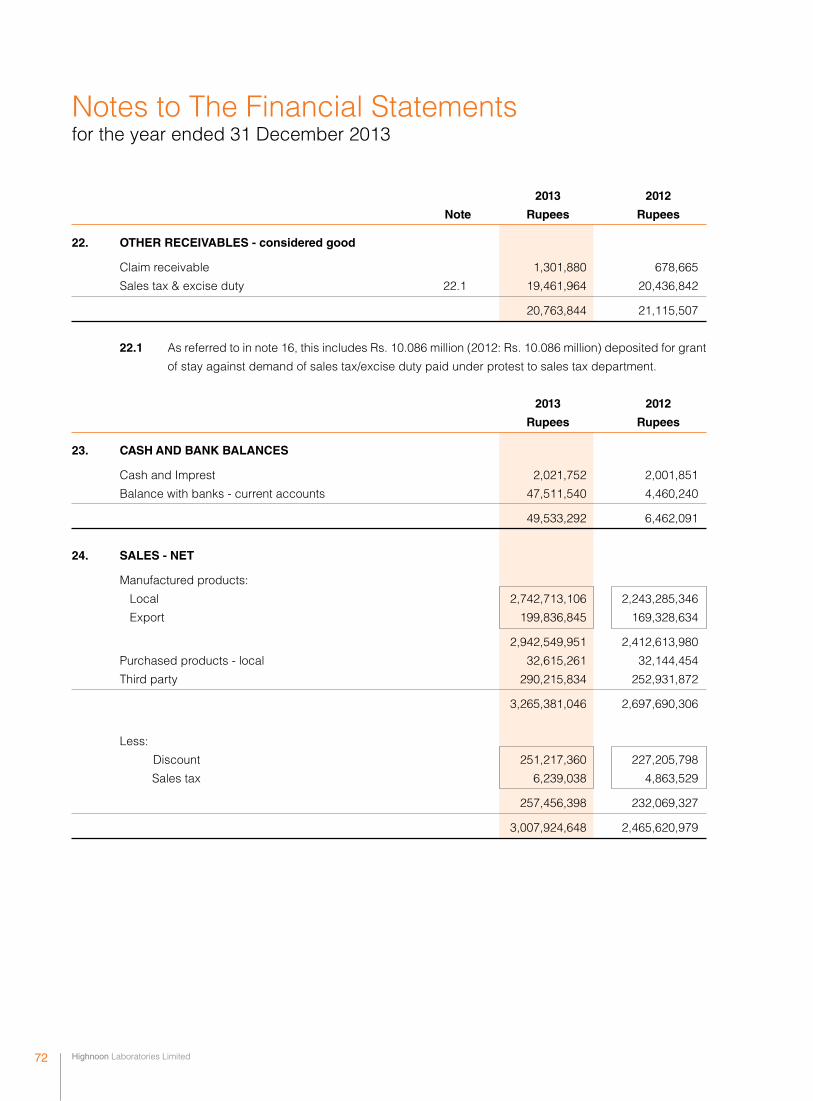
Highnoon Laboratories Limited 72
2013 2012
Note Rupees Rupees
22. OTHER RECEIVABLES - considered good
Claim receivable 1,301,880 678,665
Sales tax & excise duty 22.1 19,461,964 20,436,842
20,763,844 21,115,507
22.1 As referred to in note 16, this includes Rs. 10.086 million (2012: Rs. 10.086 million) deposited for grant
of stay against demand of sales tax/excise duty paid under protest to sales tax department.
2013 2012
Rupees Rupees
23. CASH AND BANK BALANCES
Cash and Imprest 2,021,752 2,001,851
Balance with banks - current accounts 47,511,540 4,460,240
49,533,292 6,462,091
24. SALES - NET
Manufactured products:
Local 2,742,713,106 2,243,285,346
Export 199,836,845 169,328,634
2,942,549,951 2,412,613,980
Purchased products - local 32,615,261 32,144,454
Third party 290,215,834 252,931,872
3,265,381,046 2,697,690,306
Less:
Discount 251,217,360 227,205,798
Sales tax 6,239,038 4,863,529
257,456,398 232,069,327
3,007,924,648 2,465,620,979
Notes to The Financial Statements for the year ended 31 December 2013
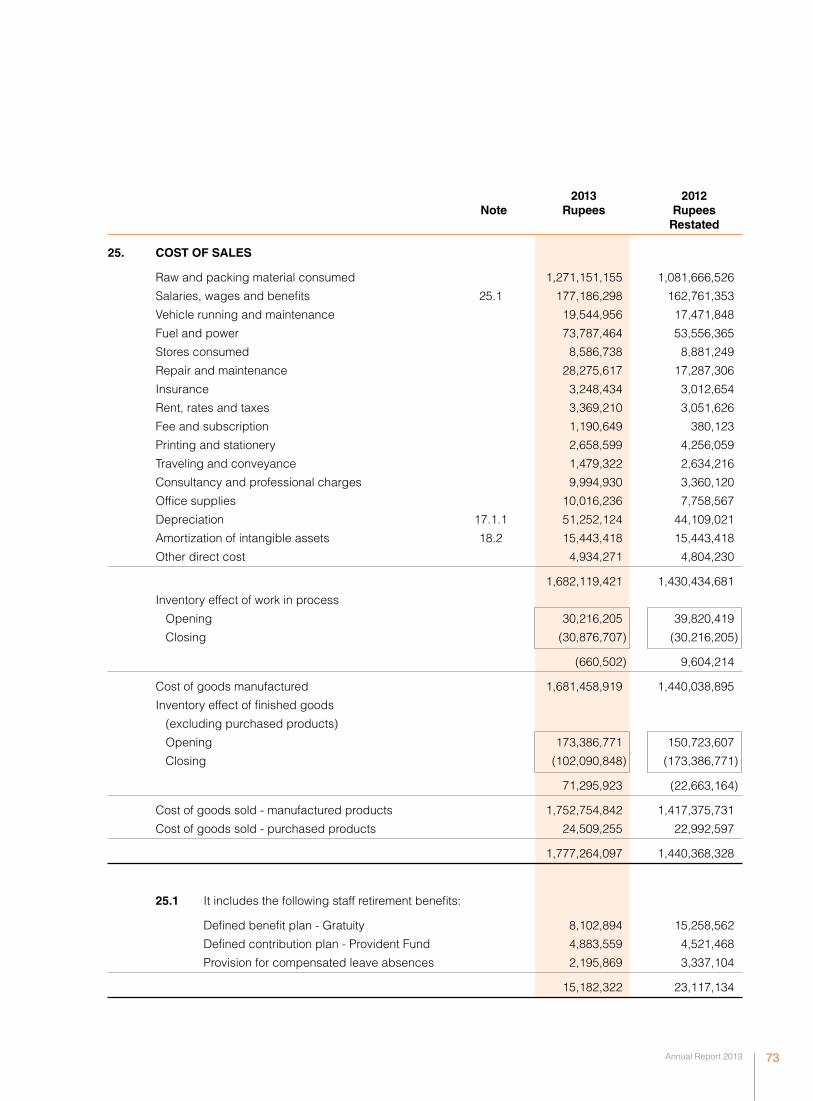
Annual Report 2013 73
2013 2012 Note Rupees Rupees Restated
25. COST OF SALES
Raw and packing material consumed 1,271,151,155 1,081,666,526
Salaries, wages and benefits 25.1 177,186,298 162,761,353
Vehicle running and maintenance 19,544,956 17,471,848
Fuel and power 73,787,464 53,556,365
Stores consumed 8,586,738 8,881,249
Repair and maintenance 28,275,617 17,287,306
Insurance 3,248,434 3,012,654
Rent, rates and taxes 3,369,210 3,051,626
Fee and subscription 1,190,649 380,123
Printing and stationery 2,658,599 4,256,059
Traveling and conveyance 1,479,322 2,634,216
Consultancy and professional charges 9,994,930 3,360,120
Office supplies 10,016,236 7,758,567
Depreciation 17.1.1 51,252,124 44,109,021
Amortization of intangible assets 18.2 15,443,418 15,443,418
Other direct cost 4,934,271 4,804,230
1,682,119,421 1,430,434,681
Inventory effect of work in process
Opening 30,216,205 39,820,419
Closing (30,876,707) (30,216,205)
(660,502) 9,604,214
Cost of goods manufactured 1,681,458,919 1,440,038,895
Inventory effect of finished goods
(excluding purchased products)
Opening 173,386,771 150,723,607
Closing (102,090,848) (173,386,771)
71,295,923 (22,663,164)
Cost of goods sold - manufactured products 1,752,754,842 1,417,375,731
Cost of goods sold - purchased products 24,509,255 22,992,597
1,777,264,097 1,440,368,328
25.1 It includes the following staff retirement benefits:
Defined benefit plan - Gratuity 8,102,894 15,258,562
Defined contribution plan - Provident Fund 4,883,559 4,521,468
Provision for compensated leave absences 2,195,869 3,337,104
15,182,322 23,117,134
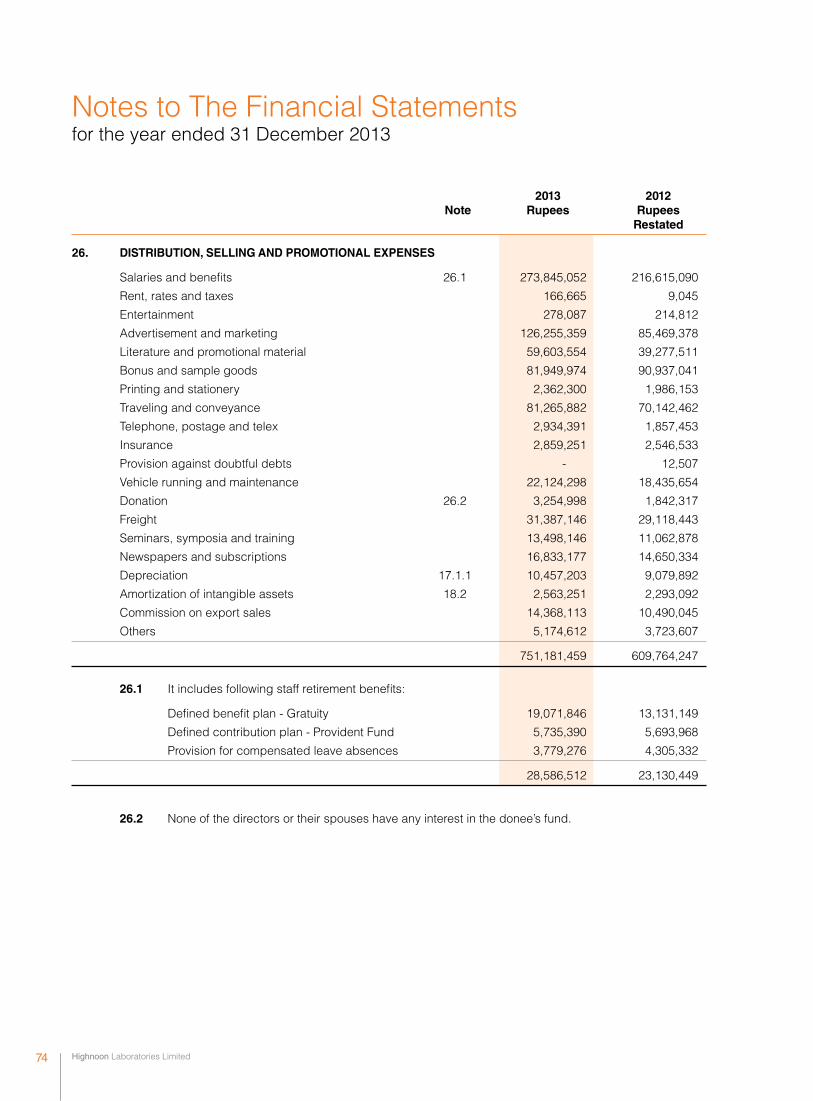
Highnoon Laboratories Limited 74
2013 2012 Note Rupees Rupees Restated
26. DISTRIBUTION, SELLING AND PROMOTIONAL EXPENSES
Salaries and benefits 26.1 273,845,052 216,615,090
Rent, rates and taxes 166,665 9,045
Entertainment 278,087 214,812
Advertisement and marketing 126,255,359 85,469,378
Literature and promotional material 59,603,554 39,277,511
Bonus and sample goods 81,949,974 90,937,041
Printing and stationery 2,362,300 1,986,153
Traveling and conveyance 81,265,882 70,142,462
Telephone, postage and telex 2,934,391 1,857,453
Insurance 2,859,251 2,546,533
Provision against doubtful debts - 12,507
Vehicle running and maintenance 22,124,298 18,435,654
Donation 26.2 3,254,998 1,842,317
Freight 31,387,146 29,118,443
Seminars, symposia and training 13,498,146 11,062,878
Newspapers and subscriptions 16,833,177 14,650,334
Depreciation 17.1.1 10,457,203 9,079,892
Amortization of intangible assets 18.2 2,563,251 2,293,092
Commission on export sales 14,368,113 10,490,045
Others 5,174,612 3,723,607
751,181,459 609,764,247
26.1 It includes following staff retirement benefits:
Defined benefit plan - Gratuity 19,071,846 13,131,149
Defined contribution plan - Provident Fund 5,735,390 5,693,968
Provision for compensated leave absences 3,779,276 4,305,332
28,586,512 23,130,449
26.2 None of the directors or their spouses have any interest in the donee’s fund.
Notes to The Financial Statements for the year ended 31 December 2013
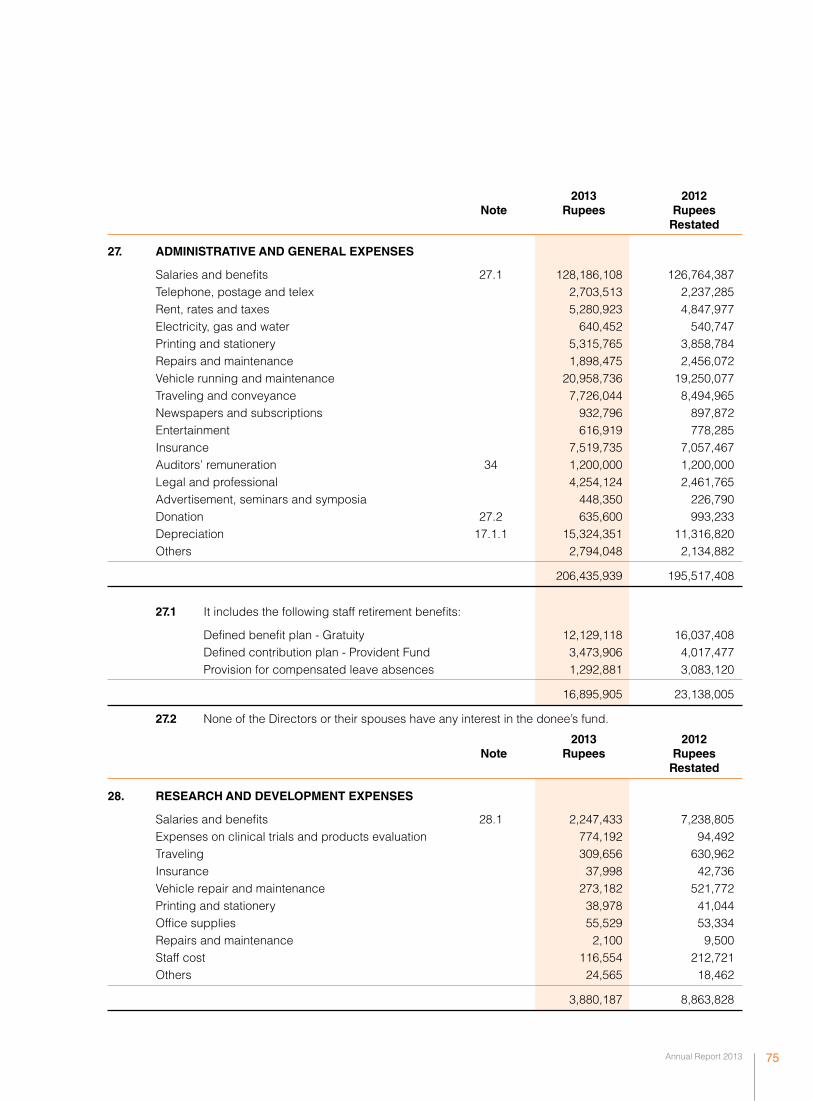
Annual Report 2013 75
2013 2012 Note Rupees Rupees Restated
27. ADMINISTRATIVE AND GENERAL EXPENSES
Salaries and benefits 27.1 128,186,108 126,764,387 Telephone, postage and telex 2,703,513 2,237,285 Rent, rates and taxes 5,280,923 4,847,977 Electricity, gas and water 640,452 540,747 Printing and stationery 5,315,765 3,858,784 Repairs and maintenance 1,898,475 2,456,072 Vehicle running and maintenance 20,958,736 19,250,077 Traveling and conveyance 7,726,044 8,494,965 Newspapers and subscriptions 932,796 897,872 Entertainment 616,919 778,285 Insurance 7,519,735 7,057,467 Auditors’ remuneration 34 1,200,000 1,200,000 Legal and professional 4,254,124 2,461,765 Advertisement, seminars and symposia 448,350 226,790 Donation 27.2 635,600 993,233 Depreciation 17.1.1 15,324,351 11,316,820 Others 2,794,048 2,134,882
206,435,939 195,517,408
27.1 It includes the following staff retirement benefits:
Defined benefit plan - Gratuity 12,129,118 16,037,408 Defined contribution plan - Provident Fund 3,473,906 4,017,477 Provision for compensated leave absences 1,292,881 3,083,120
16,895,905 23,138,005
27.2 None of the Directors or their spouses have any interest in the donee’s fund.
2013 2012 Note Rupees Rupees Restated
28. RESEARCH AND DEVELOPMENT EXPENSES
Salaries and benefits 28.1 2,247,433 7,238,805 Expenses on clinical trials and products evaluation 774,192 94,492 Traveling 309,656 630,962 Insurance 37,998 42,736 Vehicle repair and maintenance 273,182 521,772 Printing and stationery 38,978 41,044 Office supplies 55,529 53,334 Repairs and maintenance 2,100 9,500 Staff cost 116,554 212,721 Others 24,565 18,462
3,880,187 8,863,828
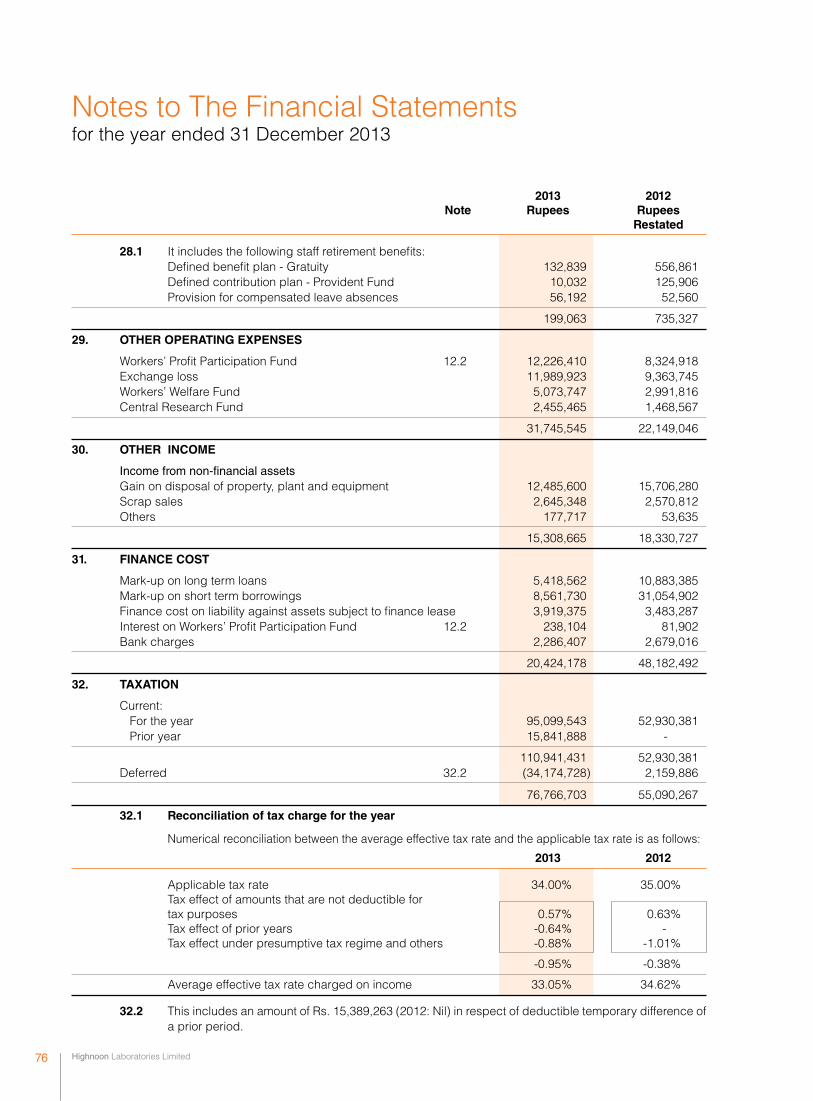
Highnoon Laboratories Limited 76
2013 2012 Note Rupees Rupees Restated
28.1 It includes the following staff retirement benefits: Defined benefit plan - Gratuity 132,839 556,861 Defined contribution plan - Provident Fund 10,032 125,906 Provision for compensated leave absences 56,192 52,560
199,063 735,327
29. OTHER OPERATING EXPENSES
Workers’ Profit Participation Fund 12.2 12,226,410 8,324,918 Exchange loss 11,989,923 9,363,745 Workers’ Welfare Fund 5,073,747 2,991,816 Central Research Fund 2,455,465 1,468,567
31,745,545 22,149,046
30. OTHER INCOME
Income from non-financial assets Gain on disposal of property, plant and equipment 12,485,600 15,706,280 Scrap sales 2,645,348 2,570,812 Others 177,717 53,635
15,308,665 18,330,727
31. FINANCE COST
Mark-up on long term loans 5,418,562 10,883,385 Mark-up on short term borrowings 8,561,730 31,054,902 Finance cost on liability against assets subject to finance lease 3,919,375 3,483,287 Interest on Workers’ Profit Participation Fund 12.2 238,104 81,902 Bank charges 2,286,407 2,679,016
20,424,178 48,182,492
32. TAXATION
Current: For the year 95,099,543 52,930,381 Prior year 15,841,888 -
110,941,431 52,930,381 Deferred 32.2 (34,174,728) 2,159,886
76,766,703 55,090,267
32.1 Reconciliation of tax charge for the year
Numerical reconciliation between the average effective tax rate and the applicable tax rate is as follows:
2013 2012
Applicable tax rate 34.00% 35.00% Tax effect of amounts that are not deductible for tax purposes 0.57% 0.63% Tax effect of prior years -0.64% - Tax effect under presumptive tax regime and others -0.88% -1.01%
-0.95% -0.38%
Average effective tax rate charged on income 33.05% 34.62%
32.2 This includes an amount of Rs. 15,389,263 (2012: Nil) in respect of deductible temporary difference of a prior period.
Notes to The Financial Statements for the year ended 31 December 2013

Annual Report 2013 77
33. EARNINGS PER SHARE - BASIC AND DILUTED
There is no dilutive effect on the basic earnings per share of the Company which is based on: 2013 2012 Restated
Profit after taxation Rupees 155,535,205 104,016,090
Weighted average number of ordinary shares 18,180,517 18,180,517
Earnings per share Rupees 8.56 5.72
2013 2012 Rupees Rupees
34. AUDITORS’ REMUNERATION
Statutory audit 800,000 800,000
Fee for review of half yearly financial information 265,000 265,000
Other certifications 60,000 60,000
Out of pocket 75,000 75,000
1,200,000 1,200,000
35. REMUNERATION OF CHIEF EXECUTIVE, DIRECTORS AND EXECUTIVES
31 December 2013 31 December 2012
Chief Directors Executives
Chief Directors Executives Executive Executive
Rupees
Managerial remuneration 5,222,000 15,764,400 87,843,913 5,923,700 15,764,400 69,002,459
House allowance 2,088,800 1,200,000 35,137,566 2,369,480 2,400,000 27,600,984
Provident fund 870,310 1,328,584 14,099,397 451,869 1,067,073 5,634,178
Gratuity 2,907,984 5,036,907 15,261,904 2,381,734 3,694,531 25,928,675
Bonus 435,167 664,350 8,015,070 322,900 1,208,700 4,592,742
Utilities 522,200 1,934,970 8,825,973 592,370 2,006,775 6,903,913
Medical 150,747 811,813 2,198,675 105,603 543,758 2,203,992
12,197,208 26,741,024 171,382,498 12,147,656 26,685,237 141,866,943
Number of persons 1 2 67 1 2 56
35.1 The Chief Executive, Directors and 28 executives (2012: 28) have been provided with Company
maintained cars while 28 executives (2012: 28) have been provided with cars under self finance scheme with limited fuel and maintenance facility.
35.2 Rs. 2,000 (2012 : Rs. 2,000) per meeting have been paid during the year to an independent non -
executive director for attending Board meetings.
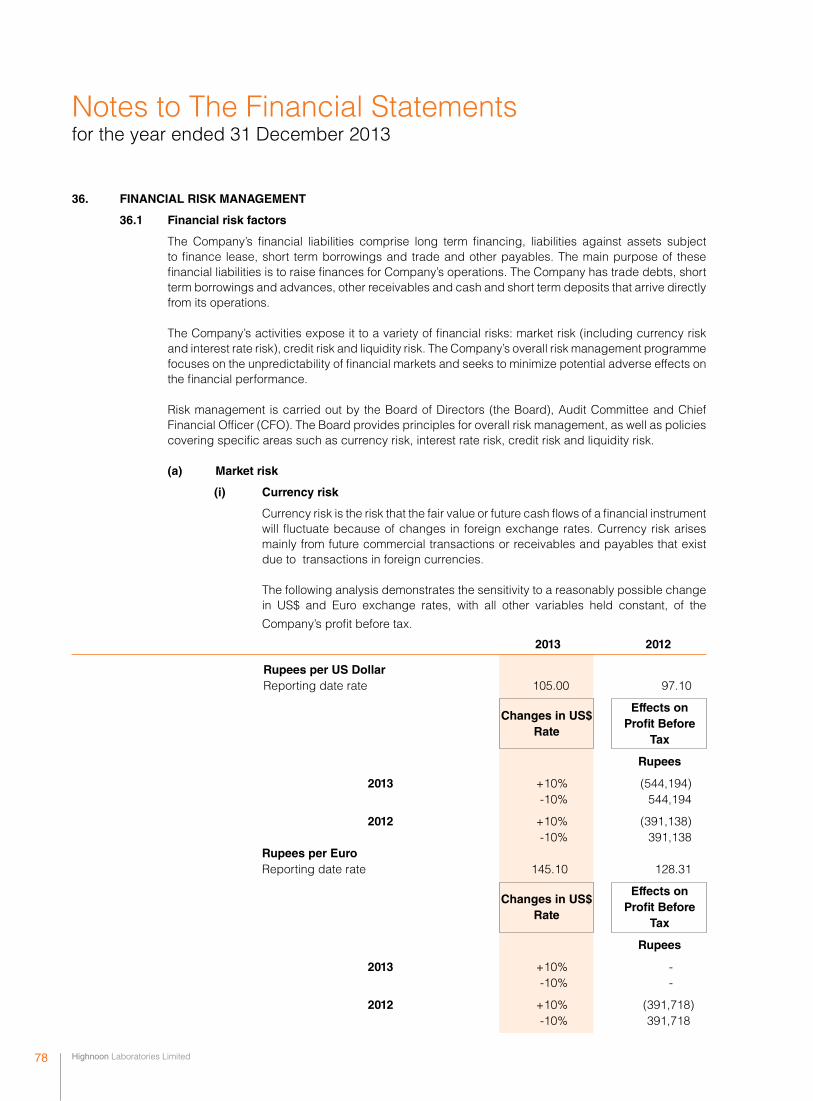
Highnoon Laboratories Limited 78
36. FINANCIAL RISK MANAGEMENT 36.1 Financial risk factors
The Company’s financial liabilities comprise long term financing, liabilities against assets subject to finance lease, short term borrowings and trade and other payables. The main purpose of these financial liabilities is to raise finances for Company’s operations. The Company has trade debts, short term borrowings and advances, other receivables and cash and short term deposits that arrive directly from its operations.
The Company’s activities expose it to a variety of financial risks: market risk (including currency risk
and interest rate risk), credit risk and liquidity risk. The Company’s overall risk management programme focuses on the unpredictability of financial markets and seeks to minimize potential adverse effects on the financial performance.
Risk management is carried out by the Board of Directors (the Board), Audit Committee and Chief
Financial Officer (CFO). The Board provides principles for overall risk management, as well as policies covering specific areas such as currency risk, interest rate risk, credit risk and liquidity risk.
(a) Market risk
(i) Currency risk
Currency risk is the risk that the fair value or future cash flows of a financial instrument will fluctuate because of changes in foreign exchange rates. Currency risk arises mainly from future commercial transactions or receivables and payables that exist due to transactions in foreign currencies.
The following analysis demonstrates the sensitivity to a reasonably possible change
in US$ and Euro exchange rates, with all other variables held constant, of the
Company’s profit before tax.
2013 2012
Rupees per US Dollar Reporting date rate 105.00 97.10
Changes in US$
Effects on
Rate Profit Before
Tax
Rupees
2013 +10% (544,194) -10% 544,194
2012 +10% (391,138) -10% 391,138 Rupees per Euro Reporting date rate 145.10 128.31
Changes in US$
Effects on
Rate Profit Before
Tax
Rupees
2013 +10% - -10% -
2012 +10% (391,718) -10% 391,718
Notes to The Financial Statements for the year ended 31 December 2013
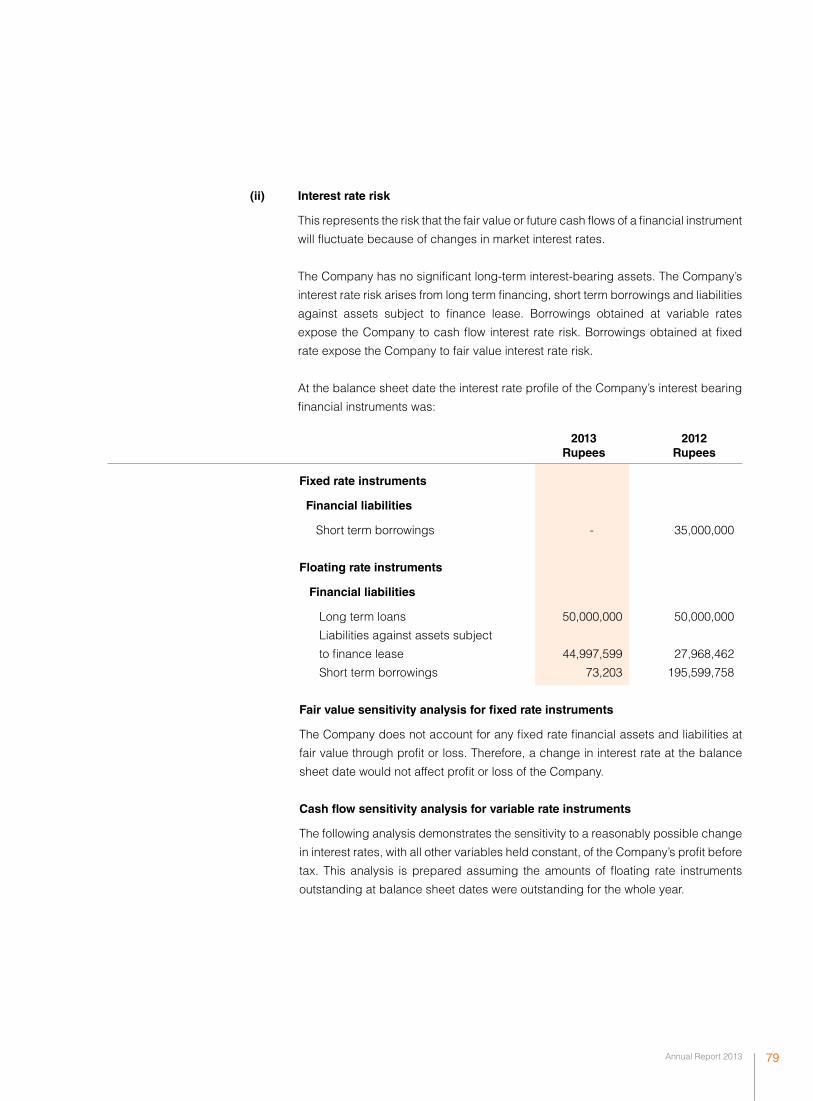
Annual Report 2013 79
(ii) Interest rate risk
This represents the risk that the fair value or future cash flows of a financial instrument
will fluctuate because of changes in market interest rates.
The Company has no significant long-term interest-bearing assets. The Company’s
interest rate risk arises from long term financing, short term borrowings and liabilities
against assets subject to finance lease. Borrowings obtained at variable rates
expose the Company to cash flow interest rate risk. Borrowings obtained at fixed
rate expose the Company to fair value interest rate risk.
At the balance sheet date the interest rate profile of the Company’s interest bearing
financial instruments was:
2013 2012 Rupees Rupees
Fixed rate instruments
Financial liabilities
Short term borrowings - 35,000,000
Floating rate instruments
Financial liabilities
Long term loans 50,000,000 50,000,000
Liabilities against assets subject
to finance lease 44,997,599 27,968,462
Short term borrowings 73,203 195,599,758
Fair value sensitivity analysis for fixed rate instruments
The Company does not account for any fixed rate financial assets and liabilities at
fair value through profit or loss. Therefore, a change in interest rate at the balance
sheet date would not affect profit or loss of the Company.
Cash flow sensitivity analysis for variable rate instruments
The following analysis demonstrates the sensitivity to a reasonably possible change
in interest rates, with all other variables held constant, of the Company’s profit before
tax. This analysis is prepared assuming the amounts of floating rate instruments
outstanding at balance sheet dates were outstanding for the whole year.

Highnoon Laboratories Limited 80
Changes in Effects on Interest Rate Profit Before Tax
% Rupees
Long term financing
2013 +1.50 (750,000)
-1.50 750,000
2012 +1.50 (750,000)
-1.50 750,000 Liabilities against assets subject to finance lease
2013 +1.50 (674,964)
-1.50 674,964
2012 +1.50 (419,527)
-1.50 419,527
Short term borrowings
2013 +1.50 (1,098)
-1.50 1,098
2012 +1.50 (2,933,996)
-1.50 2,933,996(b) Credit risk
Credit risk represents the risk that one party to a financial instrument will cause a financial loss for the other party by failing to discharge an obligation. The carrying amount of financial assets represents the maximum credit exposure. The maximum exposure to credit risk at the reporting date was as follows:
2013 2012 Rupees Rupees
Trade debts 49,947,918 56,364,423 Short term advances 4,658,661 4,872,589 Trade deposits 8,405,759 9,082,454 Other receivables 1,301,880 678,665 Bank balances 47,511,540 4,460,240
111,825,758 75,458,371
Trade Debts
Credit risk related to trade debts is managed by established procedures and controls relating to customers credit risk management. Outstanding receivables are regularly monitored and shipments to foreign customers are covered by letters of credit.
The maximum credit risk exposure at reporting date is carrying value of financial assets stated above.
At 31 December 2013, the Company has 12 (2012:9) customers who owed the Company more than Rupees 1.00 million each and accounted for approximately 76% (2012:79%) of all receivables owing.
Notes to The Financial Statements for the year ended 31 December 2013
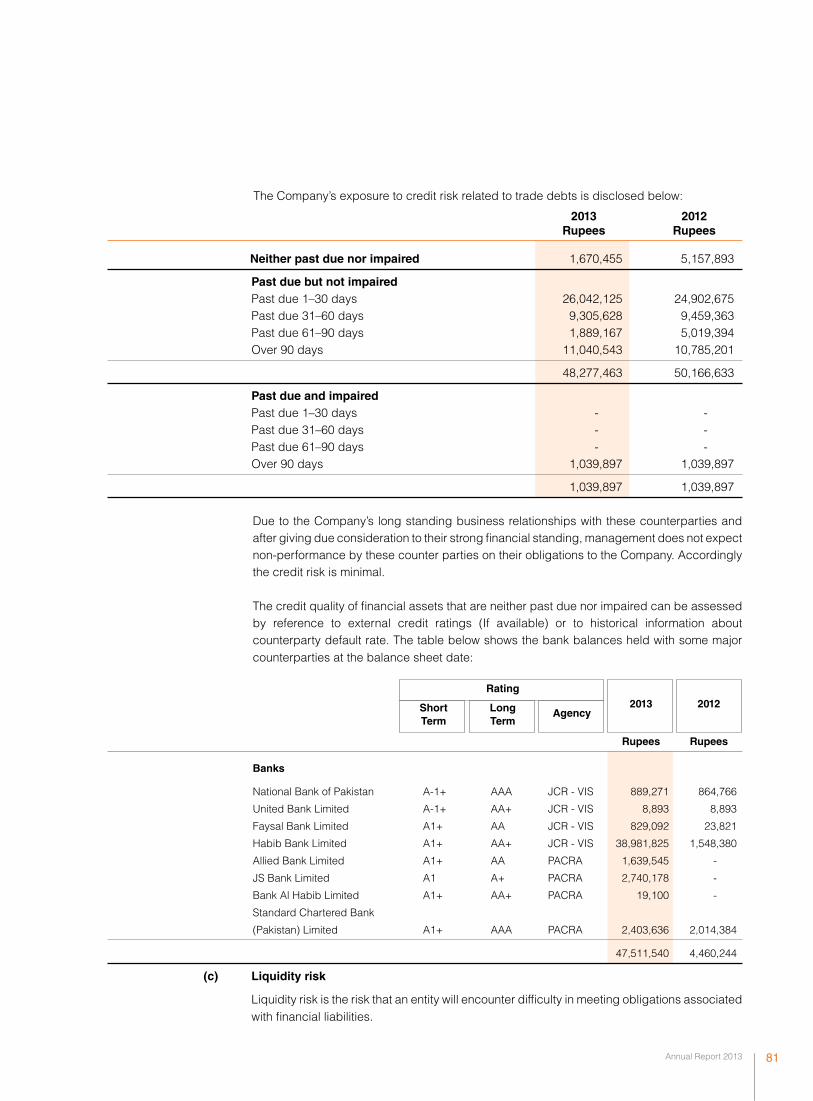
Annual Report 2013 81
The Company’s exposure to credit risk related to trade debts is disclosed below:
2013 2012 Rupees Rupees
Neither past due nor impaired 1,670,455 5,157,893
Past due but not impaired Past due 1–30 days 26,042,125 24,902,675 Past due 31–60 days 9,305,628 9,459,363 Past due 61–90 days 1,889,167 5,019,394 Over 90 days 11,040,543 10,785,201
48,277,463 50,166,633
Past due and impaired Past due 1–30 days - - Past due 31–60 days - - Past due 61–90 days - - Over 90 days 1,039,897 1,039,897
1,039,897 1,039,897 Due to the Company’s long standing business relationships with these counterparties and
after giving due consideration to their strong financial standing, management does not expect non-performance by these counter parties on their obligations to the Company. Accordingly the credit risk is minimal.
The credit quality of financial assets that are neither past due nor impaired can be assessed
by reference to external credit ratings (If available) or to historical information about counterparty default rate. The table below shows the bank balances held with some major counterparties at the balance sheet date:
Rating
Short Long Agency 2013 2012
Term Term
Rupees Rupees
Banks
National Bank of Pakistan A-1+ AAA JCR - VIS 889,271 864,766
United Bank Limited A-1+ AA+ JCR - VIS 8,893 8,893
Faysal Bank Limited A1+ AA JCR - VIS 829,092 23,821
Habib Bank Limited A1+ AA+ JCR - VIS 38,981,825 1,548,380
Allied Bank Limited A1+ AA PACRA 1,639,545 -
JS Bank Limited A1 A+ PACRA 2,740,178 -
Bank Al Habib Limited A1+ AA+ PACRA 19,100 -
Standard Chartered Bank
(Pakistan) Limited A1+ AAA PACRA 2,403,636 2,014,384
47,511,540 4,460,244
(c) Liquidity risk
Liquidity risk is the risk that an entity will encounter difficulty in meeting obligations associated with financial liabilities.
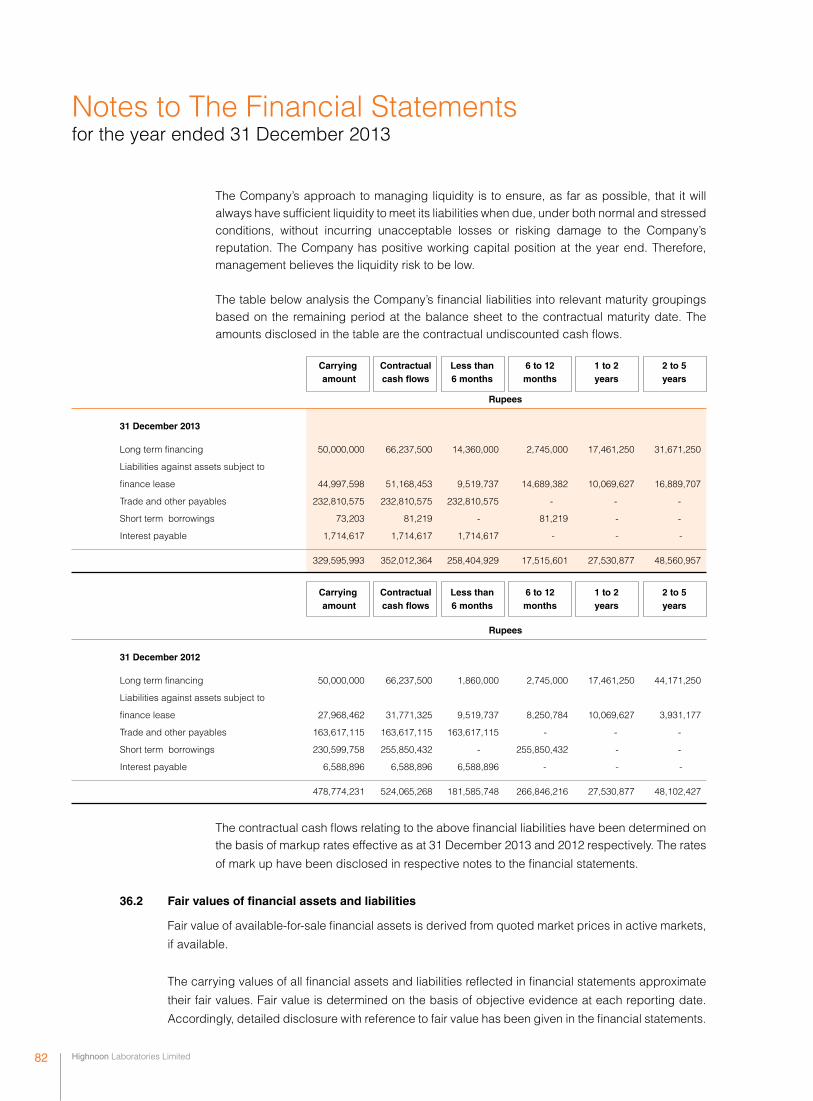
Highnoon Laboratories Limited 82
The Company’s approach to managing liquidity is to ensure, as far as possible, that it will always have sufficient liquidity to meet its liabilities when due, under both normal and stressed conditions, without incurring unacceptable losses or risking damage to the Company’s reputation. The Company has positive working capital position at the year end. Therefore, management believes the liquidity risk to be low.
The table below analysis the Company’s financial liabilities into relevant maturity groupings
based on the remaining period at the balance sheet to the contractual maturity date. The amounts disclosed in the table are the contractual undiscounted cash flows.
Carrying Contractual Less than 6 to 12 1 to 2 2 to 5 amount cash flows 6 months months years years
Rupees
31 December 2013
Long term financing 50,000,000 66,237,500 14,360,000 2,745,000 17,461,250 31,671,250
Liabilities against assets subject to
finance lease 44,997,598 51,168,453 9,519,737 14,689,382 10,069,627 16,889,707
Trade and other payables 232,810,575 232,810,575 232,810,575 - - -
Short term borrowings 73,203 81,219 - 81,219 - -
Interest payable 1,714,617 1,714,617 1,714,617 - - -
329,595,993 352,012,364 258,404,929 17,515,601 27,530,877 48,560,957
Carrying Contractual Less than 6 to 12 1 to 2 2 to 5 amount cash flows 6 months months years years
Rupees
31 December 2012
Long term financing 50,000,000 66,237,500 1,860,000 2,745,000 17,461,250 44,171,250
Liabilities against assets subject to
finance lease 27,968,462 31,771,325 9,519,737 8,250,784 10,069,627 3,931,177
Trade and other payables 163,617,115 163,617,115 163,617,115 - - -
Short term borrowings 230,599,758 255,850,432 - 255,850,432 - -
Interest payable 6,588,896 6,588,896 6,588,896 - - -
478,774,231 524,065,268 181,585,748 266,846,216 27,530,877 48,102,427
The contractual cash flows relating to the above financial liabilities have been determined on the basis of markup rates effective as at 31 December 2013 and 2012 respectively. The rates
of mark up have been disclosed in respective notes to the financial statements.
36.2 Fair values of financial assets and liabilities
Fair value of available-for-sale financial assets is derived from quoted market prices in active markets,
if available.
The carrying values of all financial assets and liabilities reflected in financial statements approximate
their fair values. Fair value is determined on the basis of objective evidence at each reporting date.
Accordingly, detailed disclosure with reference to fair value has been given in the financial statements.
Notes to The Financial Statements for the year ended 31 December 2013
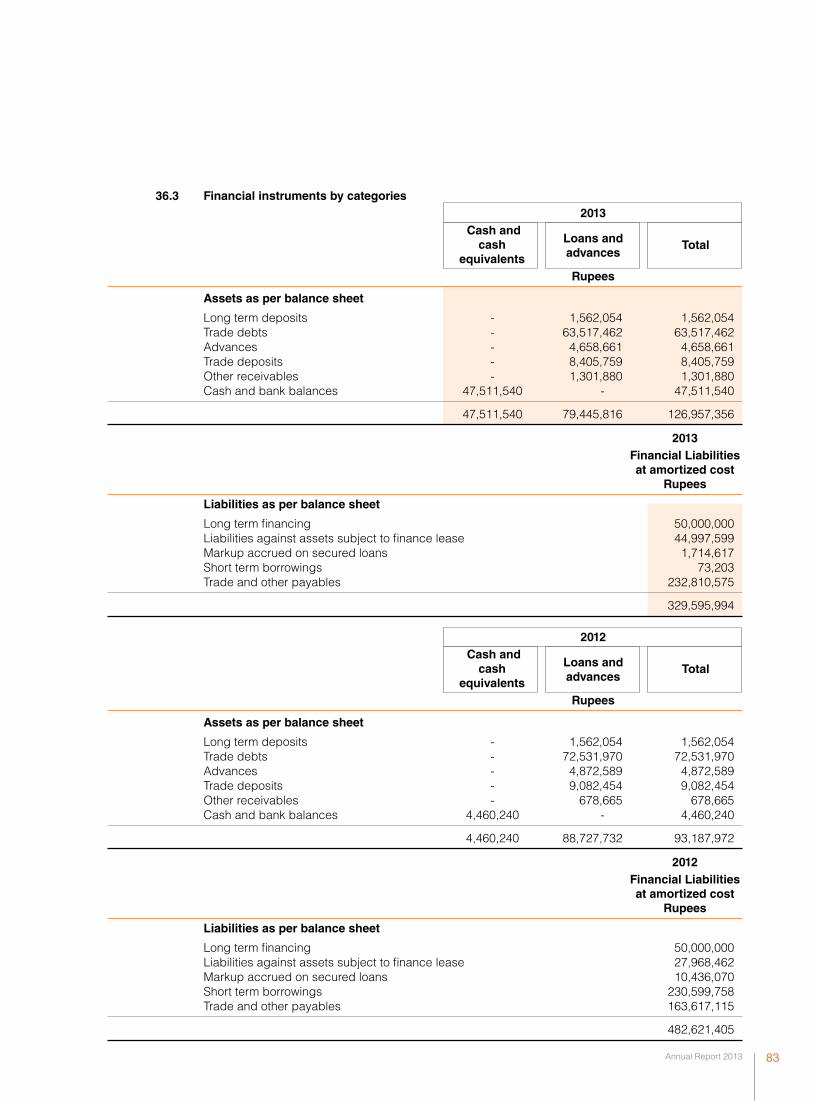
Annual Report 2013 83
36.3 Financial instruments by categories 2013 Cash and
Loans and
Total cash advances equivalents
Rupees
Assets as per balance sheet
Long term deposits - 1,562,054 1,562,054 Trade debts - 63,517,462 63,517,462 Advances - 4,658,661 4,658,661 Trade deposits - 8,405,759 8,405,759 Other receivables - 1,301,880 1,301,880 Cash and bank balances 47,511,540 - 47,511,540
47,511,540 79,445,816 126,957,356
2013 Financial Liabilities at amortized cost Rupees
Liabilities as per balance sheet
Long term financing 50,000,000 Liabilities against assets subject to finance lease 44,997,599 Markup accrued on secured loans 1,714,617 Short term borrowings 73,203 Trade and other payables 232,810,575
329,595,994
2012 Cash and
Loans and
Total cash advances equivalents
Rupees
Assets as per balance sheet
Long term deposits - 1,562,054 1,562,054 Trade debts - 72,531,970 72,531,970 Advances - 4,872,589 4,872,589 Trade deposits - 9,082,454 9,082,454 Other receivables - 678,665 678,665 Cash and bank balances 4,460,240 - 4,460,240
4,460,240 88,727,732 93,187,972
2012 Financial Liabilities at amortized cost Rupees
Liabilities as per balance sheet
Long term financing 50,000,000 Liabilities against assets subject to finance lease 27,968,462 Markup accrued on secured loans 10,436,070 Short term borrowings 230,599,758 Trade and other payables 163,617,115
482,621,405
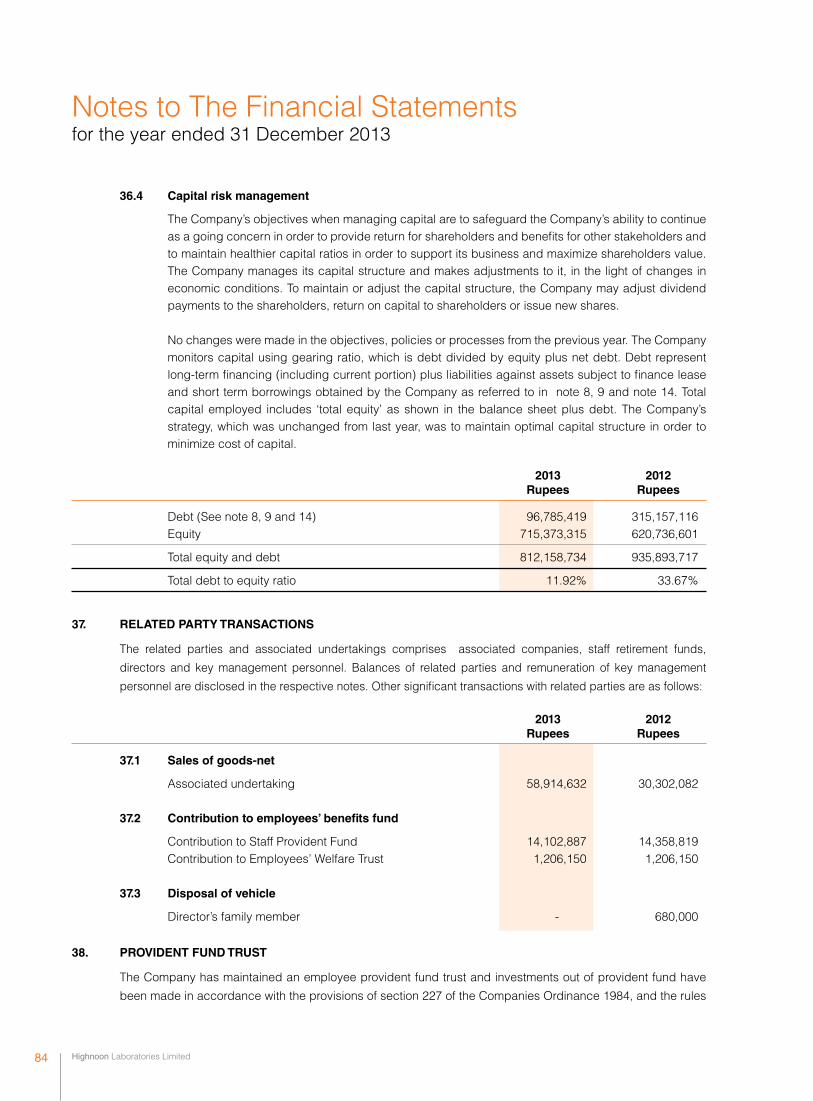
Highnoon Laboratories Limited 84
36.4 Capital risk management
The Company’s objectives when managing capital are to safeguard the Company’s ability to continue as a going concern in order to provide return for shareholders and benefits for other stakeholders and to maintain healthier capital ratios in order to support its business and maximize shareholders value. The Company manages its capital structure and makes adjustments to it, in the light of changes in economic conditions. To maintain or adjust the capital structure, the Company may adjust dividend payments to the shareholders, return on capital to shareholders or issue new shares.
No changes were made in the objectives, policies or processes from the previous year. The Company
monitors capital using gearing ratio, which is debt divided by equity plus net debt. Debt represent long-term financing (including current portion) plus liabilities against assets subject to finance lease and short term borrowings obtained by the Company as referred to in note 8, 9 and note 14. Total capital employed includes ‘total equity’ as shown in the balance sheet plus debt. The Company’s strategy, which was unchanged from last year, was to maintain optimal capital structure in order to minimize cost of capital.
2013 2012 Rupees Rupees
Debt (See note 8, 9 and 14) 96,785,419 315,157,116 Equity 715,373,315 620,736,601
Total equity and debt 812,158,734 935,893,717
Total debt to equity ratio 11.92% 33.67%
37. RELATED PARTY TRANSACTIONS
The related parties and associated undertakings comprises associated companies, staff retirement funds,
directors and key management personnel. Balances of related parties and remuneration of key management
personnel are disclosed in the respective notes. Other significant transactions with related parties are as follows:
2013 2012 Rupees Rupees
37.1 Sales of goods-net
Associated undertaking 58,914,632 30,302,082 37.2 Contribution to employees’ benefits fund
Contribution to Staff Provident Fund 14,102,887 14,358,819 Contribution to Employees’ Welfare Trust 1,206,150 1,206,150 37.3 Disposal of vehicle
Director’s family member - 680,000
38. PROVIDENT FUND TRUST
The Company has maintained an employee provident fund trust and investments out of provident fund have
been made in accordance with the provisions of section 227 of the Companies Ordinance 1984, and the rules
Notes to The Financial Statements for the year ended 31 December 2013
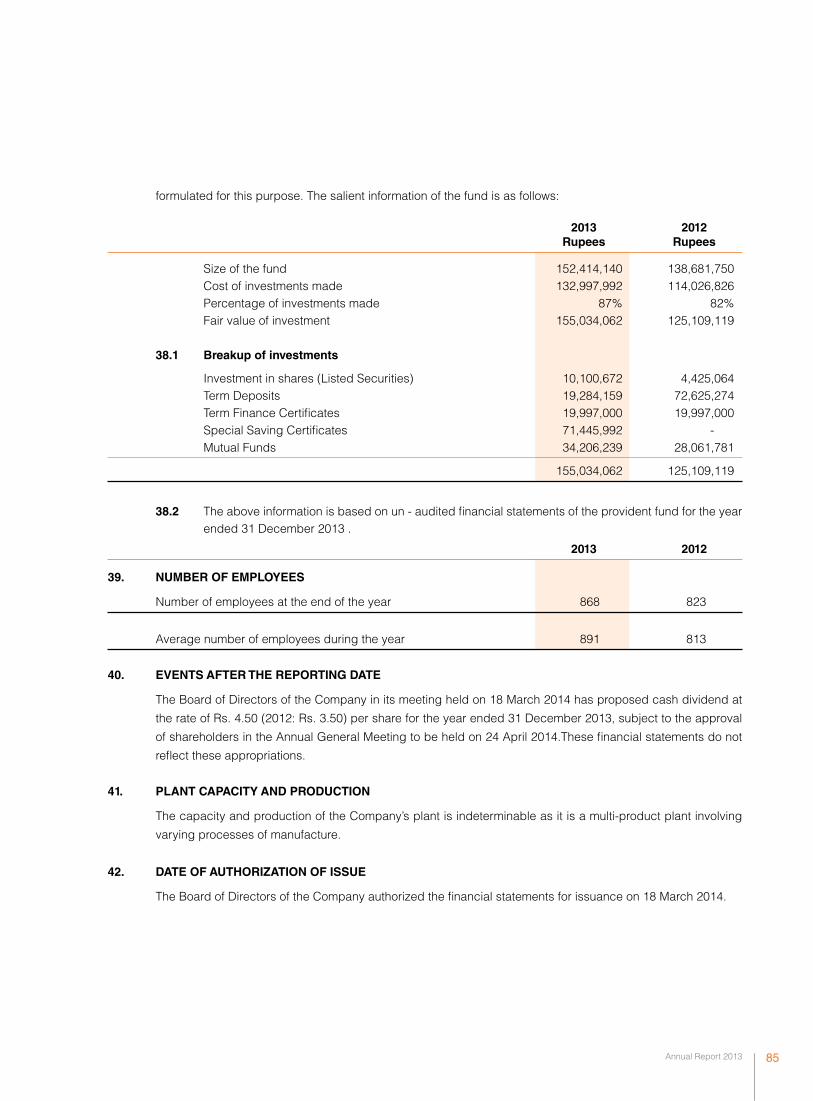
Annual Report 2013 85
formulated for this purpose. The salient information of the fund is as follows:
2013 2012 Rupees Rupees
Size of the fund 152,414,140 138,681,750 Cost of investments made 132,997,992 114,026,826 Percentage of investments made 87% 82% Fair value of investment 155,034,062 125,109,119 38.1 Breakup of investments
Investment in shares (Listed Securities) 10,100,672 4,425,064 Term Deposits 19,284,159 72,625,274 Term Finance Certificates 19,997,000 19,997,000 Special Saving Certificates 71,445,992 - Mutual Funds 34,206,239 28,061,781
155,034,062 125,109,119
38.2 The above information is based on un - audited financial statements of the provident fund for the year
ended 31 December 2013 .
2013 2012
39. NUMBER OF EMPLOYEES
Number of employees at the end of the year 868 823
Average number of employees during the year 891 813
40. EVENTS AFTER THE REPORTING DATE
The Board of Directors of the Company in its meeting held on 18 March 2014 has proposed cash dividend at
the rate of Rs. 4.50 (2012: Rs. 3.50) per share for the year ended 31 December 2013, subject to the approval
of shareholders in the Annual General Meeting to be held on 24 April 2014.These financial statements do not
reflect these appropriations.
41. PLANT CAPACITY AND PRODUCTION
The capacity and production of the Company’s plant is indeterminable as it is a multi-product plant involving
varying processes of manufacture.
42. DATE OF AUTHORIZATION OF ISSUE
The Board of Directors of the Company authorized the financial statements for issuance on 18 March 2014.
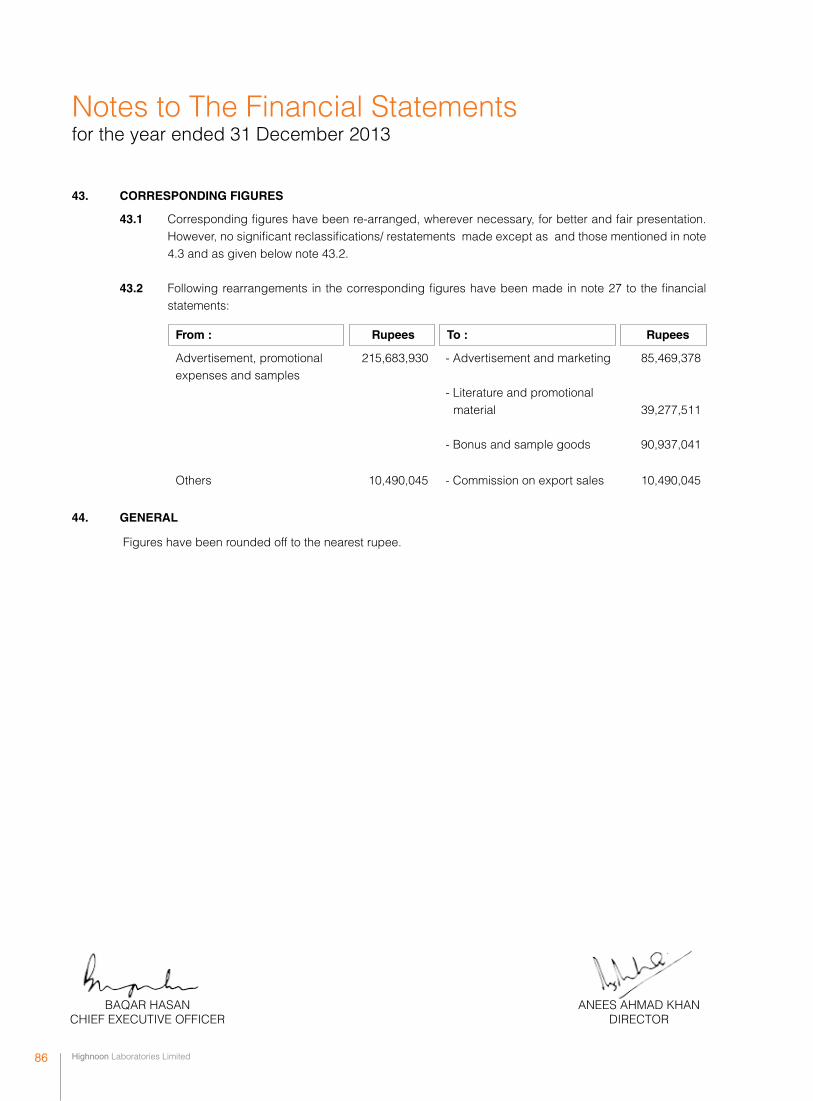
Highnoon Laboratories Limited 86
43. CORRESPONDING FIGURES
43.1 Corresponding figures have been re-arranged, wherever necessary, for better and fair presentation. However, no significant reclassifications/ restatements made except as and those mentioned in note 4.3 and as given below note 43.2.
43.2 Following rearrangements in the corresponding figures have been made in note 27 to the financial
statements:
From : Rupees To : Rupees
Advertisement, promotional 215,683,930 - Advertisement and marketing 85,469,378 expenses and samples - Literature and promotional material 39,277,511
- Bonus and sample goods 90,937,041
Others 10,490,045 - Commission on export sales 10,490,045
44. GENERAL
Figures have been rounded off to the nearest rupee.
Notes to The Financial Statements for the year ended 31 December 2013
ANEES AHMAD KHAN DIRECTOR
BAQAR HASAN CHIEF EXECUTIVE OFFICER
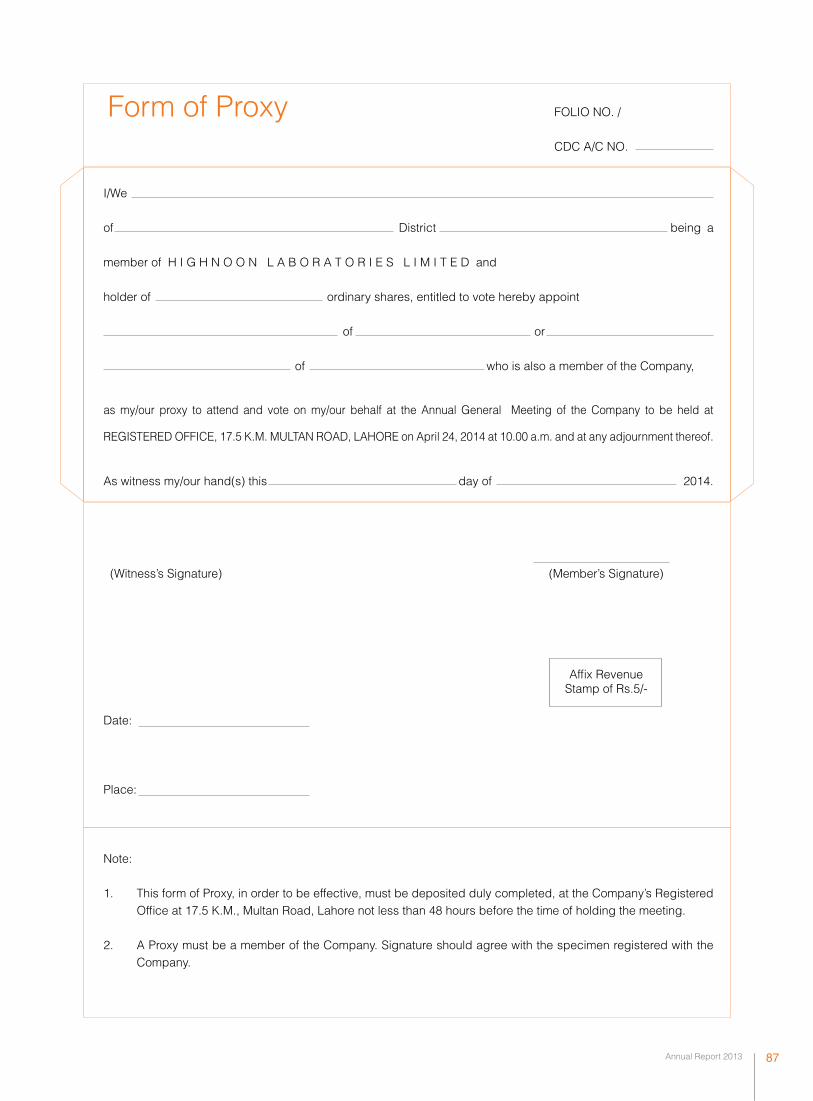
Annual Report 2013 87
Form of Proxy FOLIO NO. / CDC A/C NO.
I/We
of District being a
member of H I G H N O O N L A B O R A T O R I E S L I M I T E D and
holder of ordinary shares, entitled to vote hereby appoint
of or
of who is also a member of the Company,
as my/our proxy to attend and vote on my/our behalf at the Annual General Meeting of the Company to be held at
REGISTERED OFFICE, 17.5 K.M. MULTAN ROAD, LAHORE on April 24, 2014 at 10.00 a.m. and at any adjournment thereof.
As witness my/our hand(s) this day of 2014.
(Witness’s Signature) (Member’s Signature)
Affix Revenue Stamp of Rs.5/- Date:
Place:
Note:
1. This form of Proxy, in order to be effective, must be deposited duly completed, at the Company’s Registered Office at 17.5 K.M., Multan Road, Lahore not less than 48 hours before the time of holding the meeting.
2. A Proxy must be a member of the Company. Signature should agree with the specimen registered with the Company.
Highnoon Laboratories Limited 88
The Company Secretary
HIGHNOON LABORATORIES LIMITED17.5 Kilometer, Multan Road,
Lahore - 53700 Pakistan.
AFFIXCORRECTPOSTAGE

Highnoon Laboratories Limited 38


![arXiv:1608.08710v3 [cs.CV] 10 Mar 2017 · Asim Kadav NEC Labs America asim@nec-labs.com Igor Durdanovic NEC Labs America igord@nec-labs.com Hanan Samety University of Maryland hjs@cs.umd.edu](https://img.dokumen.tips/doc/110x75/5ec9c6967af0ce2b0906a548/arxiv160808710v3-cscv-10-mar-2017-asim-kadav-nec-labs-america-asimnec-labscom.jpg)