Embed Size (px)
Citation preview
1
Disse guides viser minimums området som skal være rundt logoen.Logoen må plasseres på riktig mørkeblå farge.For mer info om bruk, formater og spesialvarianter, se designmanual.NB; husk å gjøre navnet om til “outline” før du lagrer den nye logoen.
annual report2011

2
Rogaland
Hordaland
Vest-Agder
Aust-Agder
CENTRAL SWITCHBOARD+47 915 02002 for retail customers+47 915 02008 for corporate customers
HEADOFFICE/ADMINISTRATION:Bjergsted Terrasse 1,P.O.Box 250, N-4066 Stavanger
E-mail retail customers:[email protected]
E-mail corporate customers:[email protected]
Fax +47 51 57 12 60
OvERvIEWOF OuR OFFICES

03
Main figures and key figures 4
Market position and customer basis 6
The CEO’s article 8
Significant events in 2011 10
The group 12
Organisational chart 15
Report of the Board of Directors 16
The board 29
Annual accounts 30
Corporate governance 108
Risk and capital management 114
Human capital 116
Retail market division 118
Corporate market division 120
Capital market division 122
Subsidiaries 123
From equity certificates to shares 126
Corporate social commitment 129
Key figures last 5 years 130
TABLE OF CONTENTS
CENTRAL SWITCHBOARD+47 915 02002 for retail customers+47 915 02008 for corporate customers
HEADOFFICE/ADMINISTRATION:Bjergsted Terrasse 1,P.O.Box 250, N-4066 Stavanger
E-mail retail customers:[email protected]
E-mail corporate customers:[email protected]
Fax +47 51 57 12 60

04
Main figures(figures in NOK million) 2011 2010 2009
Net interest income 1 756 1 742 1 676Net other operating income 1 511 1 672 1 703Total operating expenses before loan losses 1 633 1 566 1 579
Operating profit before loan losses 1 634 1 848 1 800
Losses on loans and guarantees 139 234 368 Operating profit before tax 1 495 1 614 1 432
KeY figures(figures in NOK million) 2011 2010 2009 Total assets 31.12. (NOK million) 131 142 134 778 124 909Net lending (NOK million) 100 588 105 033 92 824Net lending including SpareBank 1 Boligkreditt and SpareBank 1 Næringskreditt 145 917 131 194 117 578Deposits from customers (NOK million) 64 042 60 770 54 336Lending growth including SpareBank 1 Boligkreditt and SpareBank 1 Næringskreditt 11.2 % 11.6 % 5.3 %Lending growth 5.4 % 11.8 % 2.4 %
Capital ratio 11.4 12.4 11.9Core capital ratio 10.6 10.2 9.6Net equity and subordinated loan capital (NOK million) 11 681 11 482 10 029Return on equity (%) 11.2 15.5 17.5Cost ratio (%) 50.0 45.9 46.7
No. of full-time equivalents employed 1 213 1 163 1 093No. of offices 53 54 51
Market price at year-end 40.70 57.00 50.00Earnings per equity certificate 5.42 6.84 6.88Dividend per equity certificate 1.50 2.75 1.75Effective yield on equity certificate -23.77 17.50 87.70
Please also refer to a complete review and key definitions on page 130 and 128.

05
1 495 1 756
11,2 1 192
319 11,2
5,4 0,10
Group profitbefore tax:
million (NoK 1 614 million)
Net iNterestiNcome:
million (NoK 1 742 million)
returN oN equityafter tax:
per cent (15,5 per cent)
Net commissioNaNd other iNcome:
million (NoK 1 101 million)
Net yield oNfiNaNcial iNvestmeNts:
million (NoK 571 million)
Growth iN leNdiNG, Gross last 12 moNths iNcludiNG sb1 boliGKreditt aNdsb1 NæriNGsKreditt:
per cent (11,6 per cent)
Growth iN deposits last 12 moNths:
per cent (11,8 per cent)
write-dowN iN per ceNt of leNdiNG iNcl. sb1 boliGKreditt
per cent (0,19 per cent)

6
LOcatiOn and distributiOn netwOrKSpareBank 1 SR-Bank is Norway’s largest regional bank, and is the second largest Norwegian-owned bank. Rogaland is SpareBank 1 SR-Bank’s core area, but focus on the Agder counties and Hordaland has given good growth, both in terms of market share and profitability, over a few years. In all, the counties in the bank’s market area have about 1.18 million inhabitants and there areapproximately 208,000 companies and sole proprietorships in the region.
Over the last forty years, the South and West of Norway, and in particular the Stavanger region has been at the centre of the development of Norway as anoil and energy producer. About 40 per cent of the Norwegian oil servicecompanies are located in the Stavanger region, and the majority of theNorwegian operating companies’ headquarters are to be found here. Statoil, Norway’s largest oil company, has its head office in Forus, Stavanger andthe vast majority of the international operating companies also have theirNorwegian headquarters in the Stavanger region. These include, inter alia, Total, ENI, ConocoPhillips and Shell. Governmental organisations such as Petoro, the Norwegian Petroleum Directorate and the Petroleum SafetyAuthority, as well as The Norwegian Oil Industry Association (OLF), alsohave their headquarters in Stavanger.
Southern and Western Norway has a diverse and dynamic industry that is known for its high degree of internationalisation, value creation andinnovation. The region is well located in terms of international communi-cation, the Norwegian Continental Shelf and regional transport routes.
Trade and industry’s international orientation and networks make the region open and accessible to the outside world. In the wake of the Norwegianpetroleum adventure, we have seen a sharp increase in entrepreneurshipand new business establishments, and in general there is very muchinnovation activity in the region.
Currently, there is a significant amount of industrial investment based on the region’s primary industry in oil and energy. This forms the basis for increased activity and value creation in the region through ripple effects. Major national and international companies are making large investments on the Norwegian Continental Shelf and positioning themselves in the region. This leads to increased demand for labour and a tighter labour market than elsewhere inthe country, as well as increased pressure on housing prices.
The industrial structure in the region is dominated by oil and gas related activities, but the region also has expertise in many other areas:
• The region is one of the most important producers of meat and dairy products, as well as vegetables.• The financial industry, with SpareBank 1 SR-Bank, HitecVision and Skagen Fondene in the lead, has grown large. • There is also an extensive foodstuff industry in the region. SpareBank 1 SR-Bank’s geographic exposure stretches from Grimstad in Aust-Agder to Åsane in Hordaland.
The bulk is still in the core area, namely Rogaland. SpareBank 1 SR-Bankfollows a multi-channel strategy that builds on the relationship betweencustomer and bank being on personal relationships, while at the same time traditional and new banking services are made easily available in digital channels. This simplifies customers’ lives and helps strengthen customer relationships.
SpareBank 1 SR-Bank’s main competitors are the full-service banks DNB, Nordea, Fokus Bank and local savings banks. Because of the strong economic growth in the market area in recent year, the competition has investedheavily in establishing themselves and growing, through aggressive pricing and recruitment of employees from competitors.
custOMer baseSpareBank 1 SR-Bank’s market area covers about 24 per cent of Norway’s population.
Overall, the region has for a long time experienced significant growth in employment and economic activity. Growth in employment in Rogaland has been significantly stronger than in Norway as a whole. Developments in the oil industry have provided a basis for growth in the labour market, so that the county has attracted a significant share of immigration from abroad (especially from Western countries) and by domestic migration. The county also has a relatively high number of childbirths and a young age structure. Compared with previous decades, however, growth has been particularly rapid in recent years.
Statistics Norway estimated, in its latest population forecast, that thepopulation of Rogaland will increase by about 145 000 people up to 2030 (mean estimate), which would imply an annual growth of about 1.42 per cent. The prognosis over time shows that Rogaland will have the strongest growthin the country. This mean an increase of 35 per cent compared with thecurrent population. In the short term up to 2015, the estimated population growth in Rogaland is on a par with growth in Oslo and Akershus,approximately 2 per cent p.a. The significant future increase in population requires that there is sufficient land for settlement and jobs, for a much larger population than today. Probably, this requires that parts of the population have to live further away from the current growth centres in North Jæren and inthe Haugesund region
In the Agder counties, population growth through to 2015 growth is on a par with the national average, about 1.35 per cent p.a., but through to 203 projections from Statistics Norway show that these counties will have about 1.20 per cent annual growth compared with the national average of about1 ,03 per cent.
The prognosis from Statistics Norway shows that Hordaland will have anannual growth through to 2015 of about 1.54 per cent and in the longer term up to 2030 about 1.18 per cent.
MARKET POSITIONAND CuSTOMER BASIS
7
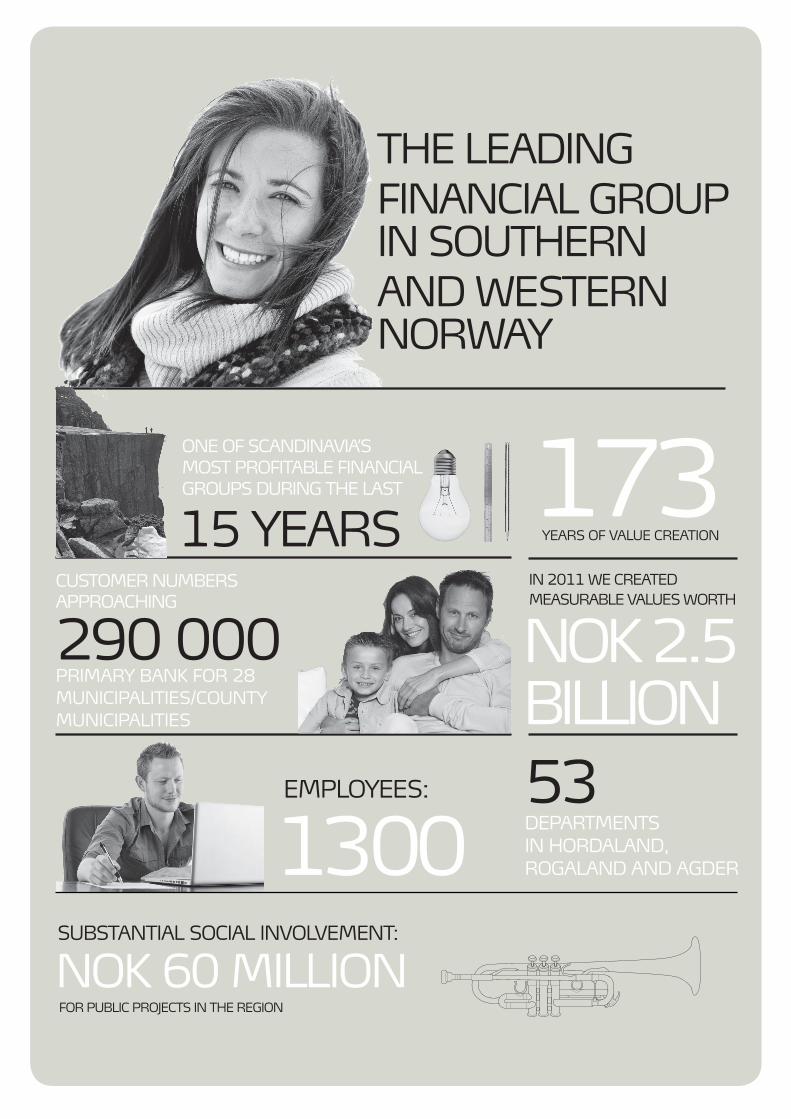
tHe leaDInGFInanCIal Group In SoutHernanD WeStern norWaY
290 000 prIMarY BanK For 28MunICIpalItIeS/CountYMunICIpalItIeS
eMploYeeS:
15 YearS
one oF SCanDInaVIa’S MoSt proFItaBle FInanCIal GroupS DurInG tHe laSt
53 DepartMentSIn HorDalanD,roGalanD anD aGDer
173YearS oF Value CreatIon
noK 2.5BIllIon
SuBStantIal SoCIal InVolVeMent:
In 2011 We CreateDMeaSuraBle ValueS WortH
noK 60 MIllIon For puBlIC proJeCtS In tHe reGIon
1300
CuStoMer nuMBerSapproaCHInG

08
We have changed in order to be what we have always been.Yes, it sounds like a self-contradiction, but it is a fact.
We have now been transferred to an ASA, a public limited liability company. Our entire capital was listed on Oslo Stock Exchange on 2 January 2012. We have a listed paper that makes us interestingto far more investors than ever before. We do this because ourcustomers can be confident that we are with them both in good and difficult times. SpareBank 1 SR-Bank will ensure that the region is supplied with the capital needed for our area to continue its natural growth. In this way, we fulfil our object, which is tocreate value for the region of which we are a part.
We have a new owner. Our largest owner and shareholder is Sparebankstiftelsen SR-Bank. The foundation manages the former primary capital by owning the largest percentage of shares in SpareBank 1 SR-Bank. This is a stable and long-term investor, which will ensure regional ownership, and continue our savings bank traditions.
The conversion has nothing to do with giving up our identity and history. It is a milestone, a moment, in a long history of valuecreation in our region.
SpareBank 1 SR-Bank’s oldest roots go back to 1839. At that time, it was fishermen who experienced a herring bonanza in the 1830s and 1840s. The poor people in Egersund suddenly had cash in hand and found that they needed a bank. The solution was Egersund Sparebank. The savings bank got capital to circulate from depositors to borrowers with a sincere desire to put their hands at work. This created further value in the small coastal town in the south of Rogaland.
We were also here when the first oil was discovered in 1969. Then, as now, we had eyes fixed ahead, and realised that mergers of small savings banks were necessary if the region was to maintain its natural growth. This secured both robustness and profitability for what is today SpareBank 1 SR-Bank.
TO BE AHEAD OF OuR TIME
Arne AustreidCEO
1839 1969

09
We received the Finance Ministry’s permission for convertion to an ASA in 2011. The same year that new giant discoveries were made in the North Sea. The conversion is a new and important milestone for the region and us.
History shows us that the capital need of our part of the country just gets bigger and bigger. Our main task is to supply the region’s businesses and individuals with this capital. In this way, we help to create new jobs and secure residential buildings, for which there is an urgent need.
Our goal is to be one of Scandinavia’s most profitable financial groups. We will continue to do this through strong focus on income, increased efficiency and good cost control. But it is our employees who make the biggest difference. Every employee meets all customers on behalf of the group. These employees constantly want to learn more in order to maintain their professional com-petence. Employees who result in us being recommended by the customer.
We do not conceal the fact that we are fortunate. It is a privilege to deliver financial services to a region as energetic as southern and western Norway. We are proud of our customers. We are keen to help so that they will succeed. Our customers’ success is important if we are to achieve our goal of being among the most profitable, solid and attractive financial groups.
It’s an art to be ahead of our time. It’s an art to be the one who lays down the premises for the future. It’s an art to put one’s ear to the ground, listening to the region’s heartbeat, and then to look up to see the future. It is an art that we master.
We have therefore changed in order to be what we have always been.
Arne AustreidCEO
2012
+norWaY’S larGeStGroWtH reGIon
24,9%oF GDp tHe reGIon
GenerateS
10
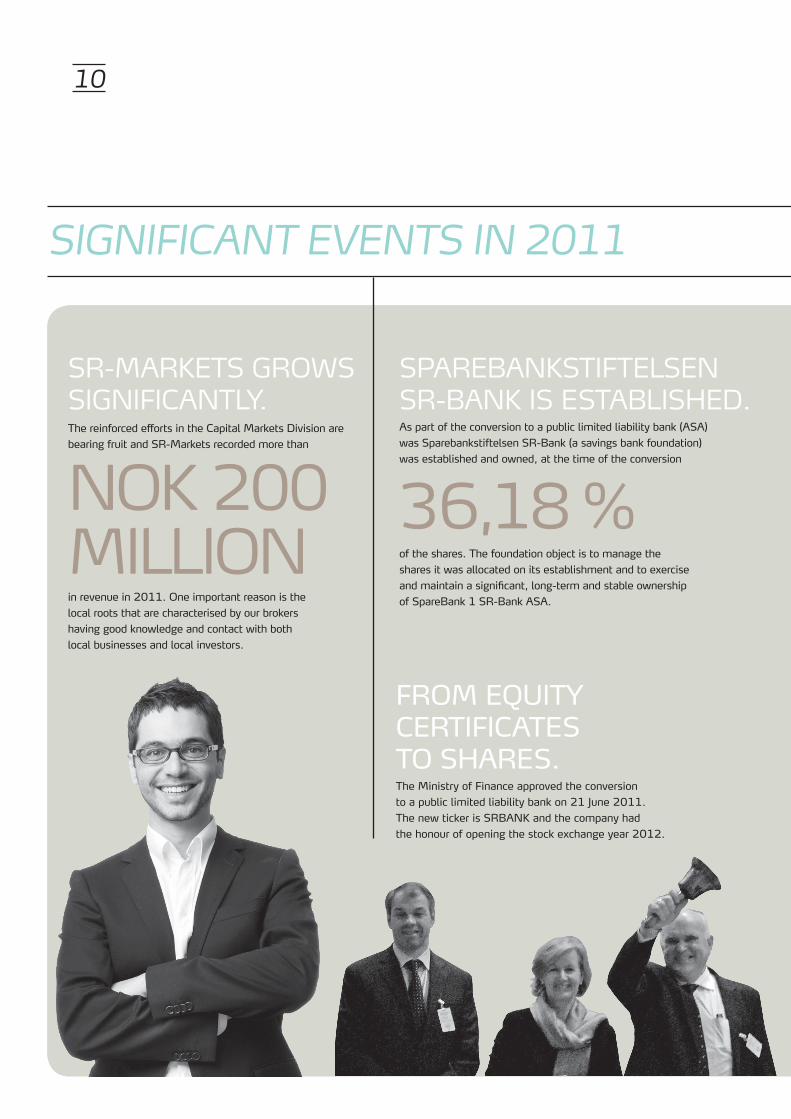
SIGNIFICANT EvENTS IN 2011
FROm EquiTycERTiFicATESTO SHARES.The ministry of Finance approved the conversionto a public limited liability bank on 21 June 2011. The new ticker is SRBANK and the company hadthe honour of opening the stock exchange year 2012.
Sr-MarKetS GroWS SIGnIFICantlY. The reinforced efforts in the capital markets Division are bearing fruit and SR-markets recorded more than
noK 200MIllIon in revenue in 2011. One important reason is the local roots that are characterised by our brokers having good knowledge and contact with both local businesses and local investors.
of the shares. The foundation object is to manage theshares it was allocated on its establishment and to exercise and maintain a significant, long-term and stable ownershipof SpareBank 1 SR-Bank ASA.
SpareBanKStIFtelSen Sr-BanK IS eStaBlISHeD. As part of the conversion to a public limited liability bank (ASA)was Sparebankstiftelsen SR-Bank (a savings bank foundation)was established and owned, at the time of the conversion
36,18 %

11
one Door In - InteraCtIon GenerateS reSultS. We have for a long time had sharp focus on the interaction betweendepartments and disciplines in order to improve both customer satisfactionand group revenue bases. in 2011, we launched the strategic concept “One door in”. in the years ahead, we will be even better on interaction and dialogue - regardless of which communication channel the customer wishes to use.
eIenDoMSMeGler 1 StrenGtHenS ItSMarKet poSItIon.
7500properties were sold in 2011, and Eiendomsmegler 1 SR-Eiendom is the region’s dominant real estate agent.
was paid by the bank from the Endowment Fund.A new multi-purpose hall at moi, upgrading of Fort Fjøløy to a recreational area, the coastal culture centre at Obrestad harbour and a new organ for the Osean Art and culture centre in Os are all examples of local cost sharing that make the individual community an even better place to live.
CHarItaBle CauSeSreCeIVeD SuBStantIal aMountS.
noK 60 MIllIon

12
HistOrYOn 1 October 1976, 22 savings banks in Rogaland mergedto form Norway’s first regional savings bank, SparebankenRogaland. At that time, this was the most comprehensivemerger that had been carried out among Norwegian savings banks. From the very beginning, the bank was the nation’ssecond largest savings bank, with total assets of NOK 1.5billion. The regional savings bank grew through activeinteraction with community and business development inRogaland and this has been the guiding spirit ever since 1839, when the first of the merged savings banks was founded in Egersund. The intention of the founders of the savings banks in the rural districts was to contribute to a positive community development by channelling value created locally back intothe local community.
In 1996, the bank was a co-founder of SpareBank 1 Alliance, which is a banking and product alliance. By participatingin the SpareBank 1 Alliance, the Group is linked to andcooperates with independent, locally rooted banks. In this way, we offer competitive products and combine efficient operations and economies of scale with the benefit of being close to our customers and the market. In March 2007, the bank formally changed its name from Sparebanken Rogaland to SpareBank 1 SR-Bank.
On 21 June 2011, the Ministry of Finance gave permission for SpareBank 1 SR-Bank to be converted from a savingsbank to a limited liability company (limited liabilitysavings bank) and to establish a savings bank foundationon specific terms and conditions. The conversion andthe establishment of Sparebankstiftelsen SR-Bank wereeffective from 1 January 2012. At that time, the bank’s legal name was changed to SpareBank 1 SR-Bank ASA.
tHe grOuPAs at 31 December 2011, SpareBank 1 SR-Bank’s employees represented 1 279 full time equivalents, of which 1 213were members of the permanent staff. The Group comprisesthe parent bank, SpareBank 1 SR-Bank, and the subsidiariesSpareBank 1 SR-Finans AS, EiendomsMegler 1 SR-EiendomAS, SR-Investering AS, and SR Forvaltning AS.
tHe banKThe Group’s market areas are Rogaland, Agder and Hordaland. Currently, the bank has 53 branch offices and total assets of NOK 131 billion. In addition, the bank has sold approximately NOK 45 billion in housing loans to the partly ownedmortgage company SpareBank 1 Boligkreditt AS. The registered head office is in Stavanger. The customer-orientated activityis organised in three divisions – the Retail Market Division,
THE GROuP
CEOArne Austreid
Executive VP BusinessSupportand developmentGlenn Sæther
Executive VP Capital MarketStian Helgøy
Executive VPCommunicationThor-Christian Haugland
Executive VPCorporate MarketTore Medhus
13
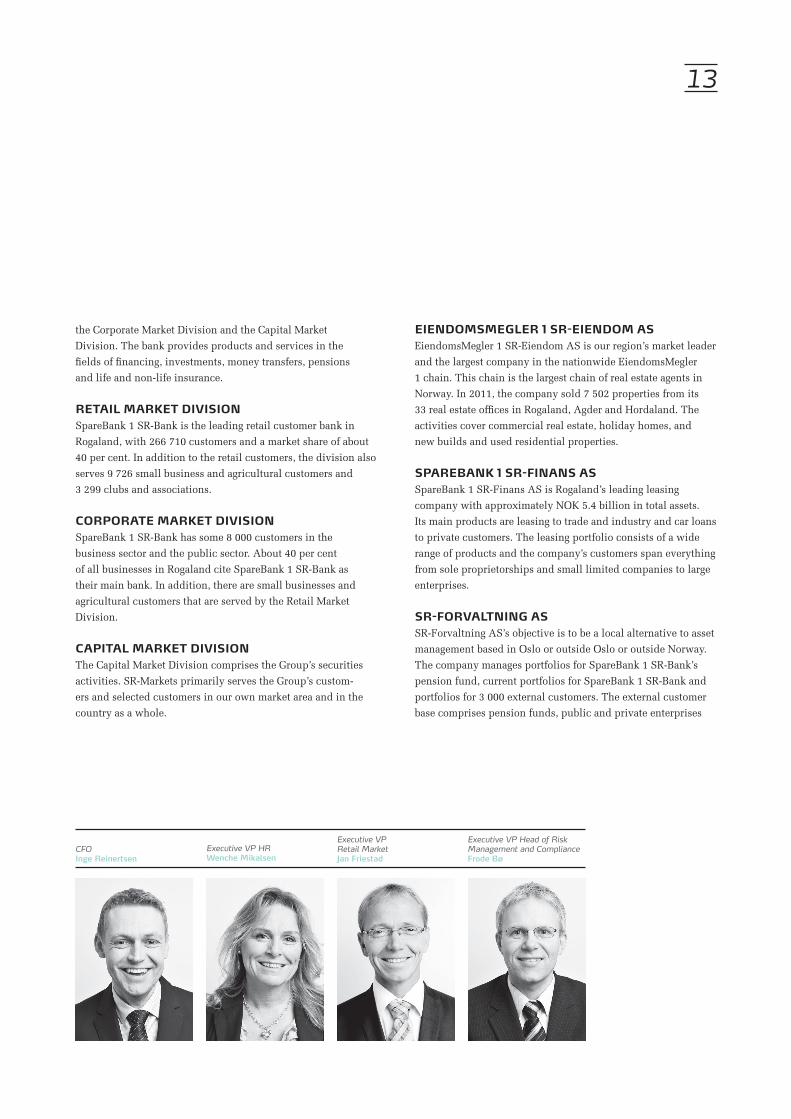
the Corporate Market Division and the Capital MarketDivision. The bank provides products and services in thefields of financing, investments, money transfers, pensionsand life and non-life insurance.
retaiL MarKet diVisiOnSpareBank 1 SR-Bank is the leading retail customer bank in Rogaland, with 266 710 customers and a market share of about 40 per cent. In addition to the retail customers, the division also serves 9 726 small business and agricultural customers and3 299 clubs and associations.
cOrPOrate MarKet diVisiOnSpareBank 1 SR-Bank has some 8 000 customers in thebusiness sector and the public sector. About 40 per centof all businesses in Rogaland cite SpareBank 1 SR-Bank astheir main bank. In addition, there are small businesses and agricultural customers that are served by the Retail Market Division.
caPitaL MarKet diVisiOnThe Capital Market Division comprises the Group’s securities activities. SR-Markets primarily serves the Group’s custom-ers and selected customers in our own market area and in the country as a whole.
eiendOMsMegLer 1 sr-eiendOM asEiendomsMegler 1 SR-Eiendom AS is our region’s market leader and the largest company in the nationwide EiendomsMegler 1 chain. This chain is the largest chain of real estate agents in Norway. In 2011, the company sold 7 502 properties from its 33 real estate offices in Rogaland, Agder and Hordaland. The activities cover commercial real estate, holiday homes, andnew builds and used residential properties.
sParebanK 1 sr-finans asSpareBank 1 SR-Finans AS is Rogaland’s leading leasingcompany with approximately NOK 5.4 billion in total assets.Its main products are leasing to trade and industry and car loans to private customers. The leasing portfolio consists of a wide range of products and the company’s customers span everything from sole proprietorships and small limited companies to large enterprises.
sr-fOrVaLtning asSR-Forvaltning AS’s objective is to be a local alternative to asset management based in Oslo or outside Oslo or outside Norway. The company manages portfolios for SpareBank 1 SR-Bank’s pension fund, current portfolios for SpareBank 1 SR-Bank and portfolios for 3 000 external customers. The external customer base comprises pension funds, public and private enterprises
CFOInge Reinertsen
Executive VP HRWenche Mikalsen
Executive VPRetail MarketJan Friestad
Executive VP Head of Risk Management and ComplianceFrode Bø

14
and affluent private individuals. Total assets amount toapproximately NOK 5.9 billion.
sr-inVestering as SR-Investering AS’ object is to contribute to long-term value creation by investing in trade and industry in the Group’smarket area. The company invests primarily in private equity funds and companies in the SMB segment that have a need for capital in order to develop and expand. At the end of 2011,the company had investments and commitments totallingNOK 255.5 million in 23 private equity funds and companies.
tHe sParebanK 1 aLLianceThe Alliance is a bank and product association comprisinga number of independent banks. All in all, the Alliance is one of Norway’s largest providers of financial products and services. The independent banks in the Alliance are SpareBank 1SR-Bank, SpareBank 1 SMN, SpareBank 1 Nord-Norge,Sparebanken Hedmark, and Samarbeidende Sparebanker(11 local savings banks in southern Norway). The banks inthe SpareBank 1 Alliance distribute financial products from jointly owned companies in major areas such as brand names, work processes, competence building, ITC operations, system development and procurement. The Alliance has entered intoa strategic cooperation agreement with the NorwegianConfederation of Trade Unions (LO) and affiliated trade unions.
One overriding goal for the SpareBank 1 Alliance is to secure the individual bank’s independence and regional roots through a strong competitiveness, profitability and sound financial strength. At the same time, the SpareBank 1 Alliance represents a competitive, full-service banking alternative on the national level. In order to achieve common goals, the alliance banks have established a national market profile and developed a common strategy for brand name building and communication. This market strategic platform also forms the basis for common product and concept development.
The product companies in the SpareBank 1 Alliance are owned by the banks through the holding company SpareBank 1
Gruppen AS. SpareBank 1 Gruppen owns all of the shares in SpareBank 1 Livsforsikring AS (life insurance), SpareBank 1 Skadeforsikring AS (non-life insurance), ODIN Forvaltning AS (asset management), SpareBank 1 Medlemskort AS(membership cards), SpareBank 1 Gruppen Finans ASand 97.2 per cent of the shares in Sparebank 1 Markets AS. The banks that are part of SpareBank 1 Alliance also own SpareBank 1 Boligkreditt AS, SpareBank 1 Næringskreditt AS, EiendomsMegler 1 (chain), the alliance cooperation SpareBank 1 Utvikling DA, Bank 1 Oslo Akershus AS and BN Bank ASA.
tHe ObJect Of sParebanK 1 sr-banKSpareBank 1 SR-Bank’s object is to create values for the region of which we are a part.
VisiOnSpareBank 1 SR-Bank - recommended by the customer
basic VaLues“The courage to have opinions, the strength to create”
By:• taking a long-term approach• being open and honest
and by:• assuming responsibility and showing respect• having a will and desire to improve
strategYSpareBank 1 SR-Bank aims to be the most attractive supplier of financial services in the West and South of Norway.
based On:• Good customer experiences• A strong team feeling and professionalism• Local roots and decision-making powers• Financial strength, profitability and market trust

15
Executive VPBusiness Supportand development
Tore medhus
Executive VPRetail Market
Jan Friestad
Executive VPHead of Risk Management
and ComplianceStian Helgøy
Executive VPCorporate Market
Glenn Sæther
Executive VPCommunication
Thor-christian Haugland
Executive VP Capital Market
Frode Bø
Executive VPHR
Wenche mikalsen
CFOinge Reinertsen
Supervisory board
Eiendoms-Megler 1
SR-Eiendom AS100%
SpareBank 1SR-Finans AS
100%
SR-ForvaltningAS
100%
SR-Investering AS 100%
SpareBank 1Gruppen AS
19,5%
SpareBank 1Boligkreditt AS
34,4%
Bank 1 Oslo Akershus AS
19,5%
BN Bank ASA23,5%
SpareBank 1Nærings-kreditt AS
30,7%
SpareBank 1 SR-Bank
CEOarne austreid
BoardInternal Auditor
Audit CommitteeAuditor
General meeting
THE SPAREBANK 1 SR-BANK GROuP
ORGANISATIONAL CHART

16
The Board of Directors is satisfied with the 2011 result. The sound efforts of the staff, the good quality of the loan portfolios, and close customer relationships were important drivers of the sound result, despite the unrest in the financial market. Our market positionas the leading financial Group in the west of Norway wasconsolidated. Net lending growth declined by 4.2 per cent in 2011. Thetotal growth in lending, including the partly owned mortgage companies was 11.2 per cent in 2011, whilst deposits grew by 5.4 per cent. The deposit coverage, that is deposits in terms of gross loans rose from 57.4 per cent to 63.2 per cent in the course of 2011. The rise in deposit coverage was positively impacted by the saleof loan portfolios to the partly owned mortgage companiesSpareBank 1 Boligkreditt AS and SpareBank 1 Næringskreditt AS.
Net interest income totalled NOK 1 756 million in 2011, compared with NOK 1 742 million in the preceding year. In 2011, measured in terms of average total assets, net interest income amounted to 1.31 per cent, down from 1.35 per cent in 2010. This was primarily due to higher funding costs and tough competition.
Net commission and other income totalled NOK 1 192 million in 2011, up from NOK 1 101 million in the preceding year. The increase is primarily due to higher commissions from real estate broking, good sales of insurance products and the increasedactivity in the Capital Market Division. The net return oninvestment securities aggregated NOK 319 million in 2011, compared with NOK 571 million in 2010. This includes shares in the profits of SpareBank 1 Gruppen AS, BN Bank ASA, Bank 1 Oslo Akershus AS, SpareBank 1 Boligkreditt AS and SpareBank 1 Næringskreditt AS.
In addition to the financial market turmoil, the decrease must be seen in light of the fact that NOK 163 million was taken to income in 2010 as a result of the merger of Nordito AS and PBS AS, and the subsequent adjustment of the value of the bank’s stake in the merged company, Nets Holding AS.
The Group’s ordinary operating expenses totalled NOK 1 633million in 2011 compared with NOK 1 566 million in 2010.Pension items affected both operating expenses in 2010 and 2011.
In 2010, NOK 106 million was reversed from earlier allocations to early retirement pensions (AFP). In 2011, adjustments in the Group’s own pension schemes resulted in a cost-reduction ofNOK 224 million. The Group’s cost ratio (costs in terms of income) rose in the same period from 45.9 per cent to 50.0 per cent.
Good quality in credit management and a good macro-economic situation in the country and the region contributed to the net loan loss provisions in 2011 being reduced to NOK 139 million from NOK 234 million. The low level of impairment confirms the Group’s strong loan portfolio.
The distribution of the profit for the year is based on the available profit of the parent bank, which was NOK 936 million in 2011. The Board of Directors proposes that NOK 299 million shall beallocated to dividend (NOK 1.50 per share), while NOK 637million shall be allocated to other equity.
Core capital adequacy rose to 10.6 per cent from 10.2 per cent in 2010. Solvency is well above the Board of Directors’ adopted goal for 2011, namely a minimum core capital adequacy of 9 per cent. SpareBank 1 SR-Bank has a sound financial position and a leading position in the nation’s strongest growing region. In addition to retained earnings, the Board of Directors proposes that the equity is strengthened in the first half of 2012 by way of new share issue up to NOK 1.63 billion.
The proposed capital injection will strengthen the Group’s ability to satisfy the financing needs of its customers in an offensive man-ner, and satisfy the European Banking Authority’s requirement of 9 per cent pure core capital adequacy by 30 June 2012. At the end of 2011, pure core capital adequacy stood at 8.3 per cent.
The annual accounts for the SpareBank 1 SR-Bank Group and the parent company are prepared in accordance with IFRS, as adopted by the EC.
tHe nature Of tHe OPeratiOnsAt the end of 2011, the SpareBank 1 SR-Bank Group comprises the parent bank, and the subsidiaries: SpareBank 1 SR-Finans AS,
REPORT OF THE BOARDOF DIRECTORS 2011in 2011, SpareBank 1 SR-Bank Group achieved a pre-tax profit of NOK 1 495 million. Profit aftertax amounted to NOK 1 081 million, compared with NOK 1 317 million in 2010. The after-tax returnon equity was 11.2 per cent, compared with 15.5 per cent in 2010. The decline in the profit was dueto the unrest in the international financial markets being only partly compensated for by the stabledevelopment in banking operations and positive one-time effects.

17
EiendomsMegler 1 SR-Eiendom AS, SR-Investering AS andSR-Forvaltning AS.
SpareBank 1 SR-Bank’s registered head office is in Stavanger. The bank has 53 offices in the counties of Rogaland, Hordaland, Vest-Agder and Aust-Agder. The Group’s primary activities are sales and provision of financial products and services and investments services, as well as leasing and real estate brokering
tHe grOuP’s deVeLOPMentIn 2011, SpareBank 1 SR-Bank recorded satisfactory progress in all of the Group’s business areas. The Group has further cemented its position as market leader in Rogaland in the retail and the corporate markets. The Capital Market Division recorded good progress and is now perceived as the leading specialist in its field in the region. The position in the real estate broking market has contributed to EiendomsMegler 1 being the largest real estate agency chain in Norway. EiendomsMegler 1 SR-Eiendom AS is market leader in Rogaland and it has strengthened its position in Hordaland and Agder in 2011.
The Group’s subsidiaries and its strategic stakes in the SpareBank 1 Alliance’s product companies make significant contributions to SpareBank 1 SR-Bank’s earnings. Among the subsidiaries, the level of activity in the real estate broking and financing companies in particular was high. Cooperation and collaboration between the various business areas in the Group were further cemented and demonstrated in 2011 through the strategic concept “One door in”, and contribute to the Group being able to present a complete and competitive range of products and services to its customers.
In 2011, the banking market was characterised by toughcompetition for deposits and housing loans. The low interest rate levels, higher funding costs and strong competition have putpressure on interest margins in general, but this pressure hasdecreased somewhat towards the end of the year. However,earnings were virtually maintained through good growth inthe period.
The stock and interest markets were volatile in 2011. Unrestcontributed to the securities portfolio falling in value. The result for SpareBank 1 Gruppen AS was also affected by market turmoil.
Net commission and other income rose from 2010 to 2011. The increase can mainly be ascribed to the increased sales of insurance products and a higher activity level in the Capital Markets Division and in real estate brokerage.
Loan losses were significantly lower in 2011 than in 2010. Losses as a percentage of gross lending declined from 0.23 per cent to 0.13 per cent. The Board of Directors is satisfied with the quality of the loan portfolios and considers risk management good.
The Board of Directors believes that it is important to the region’s business community and to society in general that SpareBank 1
SR-Bank, as a sound, locally based financial Group, is able tosupply the capital that is necessary for growth and developmentin the Group’s market area. Again, in 2011, several millions of kroner were awarded to commercial development measures bythe five business development foundations in Dalane and Lister,Haugaland, Southern Norway, and the Bergen and Stavangerregions respectively. The object of these foundations is tocontribute to business development that is beneficial to societyby providing financial assistance and investments in businesses and business-promoting activities. SpareBank 1 SR-Bank assumes a comprehensive social responsibility by supporting localinitiatives in the fields of culture, sport, and research andeducation. This is done by actively using the bank’s endowment fund for public benefit. In 2011, in excess of NOK 70 million was allocated from this fund. Sparebankstiftelsen SR-Bank was established in connection with the conversion to a public limited company and from 2012, the foundation will continue to support charitable causes.
deVeLOPMent in tHe grOuP’sMarKet areasMainland-Norway’s GDP grew by about 2 per cent in 2011,approximately the same as in the preceding year. Financial unrest and weaker international economic development caused aslowdown also in the Norwegian economy, but economicdevelopment is expected to improve moderately in theimmediate future.
Demographic development trends are of paramount importance to the Group’s framework conditions. For a long time now, the Group’s primary area has seen high migration and population growth. The percentage of disabled is also significantly lower than the national average. The population is relatively young in and around the regional centres, and along the coast of Southern and Western Norway. This population growth trend has continued over the last few years. According to Statistics Norway, the country’s population rose by 1.2 per cent in 2009, whilst in Rogaland the population growth was higher, namely 1.8 per cent. In Hordaland, the population grew by 1.6 per cent, 1.3 per cent in Vest-Agderand 1.1 per cent in Aust-Agder in 2009. Statistics Norway’sprojections support the belief that growth in Rogaland andHordaland in particular will be higher than the national average.
Figures from the Norwegian Labour and Welfare Service (NAV) show that unemployment in Norway as a whole was 2.8 per cent at the end of 2011. In Rogaland, it was 2.0 per cent, in Hordaland 2.4 per cent and in Vest and Aust-Agder 3.0 per cent and 3.5 per cent respectively.
Separate business surveys are published that deal with the economic activity in the Group’s market areas. According to these reports, companies in Rogaland, Hordaland and Agder expect positive development in 2012. The business survey shows that for Rogaland in particular growth is reaching the same level as in the record year 2008, before the financial crisis arose. There is
18
still a great deal of uncertainty surrounding what the effect of the increasing Euro crisis and the national debt accumulation will be. Responses from a representative selection of companies in various trades and industry show, despite the uncertainty and low growth in our important market areas, that a 4 per cent increase in employment is expected in 2012 with about 9 000 new jobs being created. The challenge facing many companies will be finding necessary skilled labour. Parts of the business community report that one consequence of the financial crisis and the resultingmarket unrest is that access to capital is still limited.
Housing prices have continued to rise in 2011 and at year-end, housing prices in the Group’s market area were almost 10 per cent higher than one year earlier.
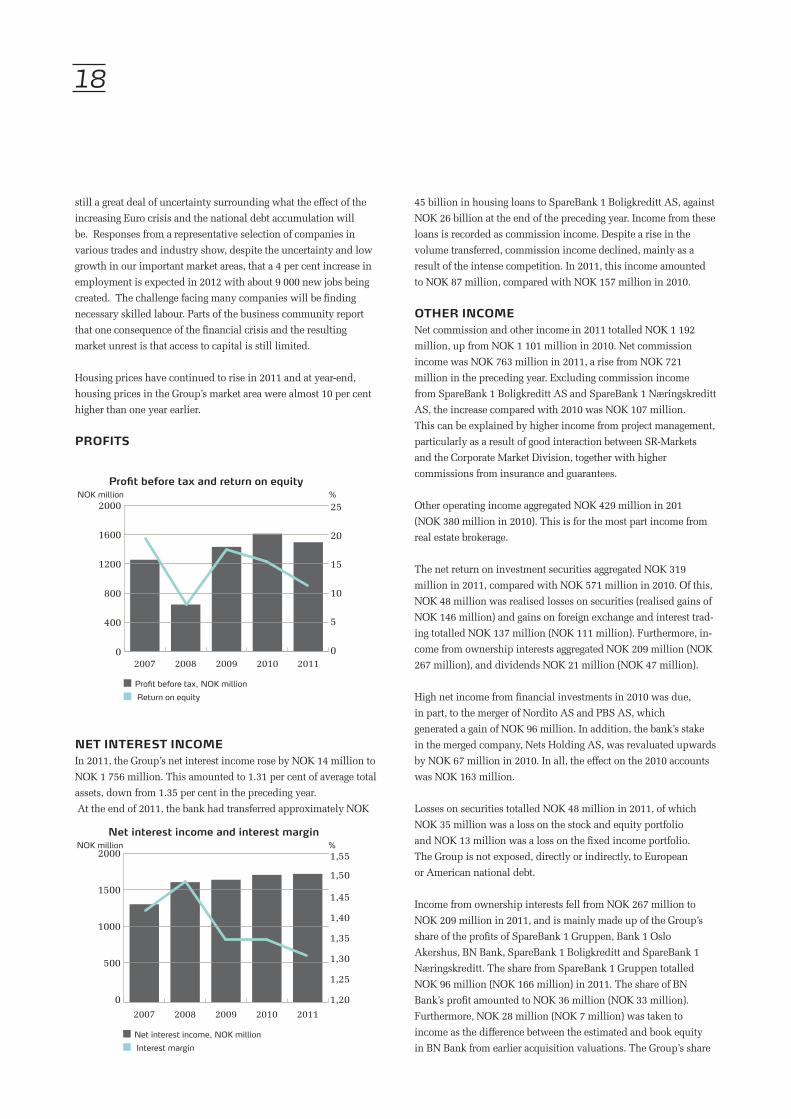
PrOfits
net interest incOMeIn 2011, the Group’s net interest income rose by NOK 14 million to NOK 1 756 million. This amounted to 1.31 per cent of average total assets, down from 1.35 per cent in the preceding year. At the end of 2011, the bank had transferred approximately NOK
45 billion in housing loans to SpareBank 1 Boligkreditt AS, against NOK 26 billion at the end of the preceding year. Income from these loans is recorded as commission income. Despite a rise in thevolume transferred, commission income declined, mainly as a result of the intense competition. In 2011, this income amounted to NOK 87 million, compared with NOK 157 million in 2010.
OtHer incOMeNet commission and other income in 2011 totalled NOK 1 192million, up from NOK 1 101 million in 2010. Net commission income was NOK 763 million in 2011, a rise from NOK 721million in the preceding year. Excluding commission incomefrom SpareBank 1 Boligkreditt AS and SpareBank 1 Næringskreditt AS, the increase compared with 2010 was NOK 107 million. This can be explained by higher income from project management, particularly as a result of good interaction between SR-Marketsand the Corporate Market Division, together with highercommissions from insurance and guarantees.
Other operating income aggregated NOK 429 million in 201(NOK 380 million in 2010). This is for the most part income from real estate brokerage.
The net return on investment securities aggregated NOK 319million in 2011, compared with NOK 571 million in 2010. Of this, NOK 48 million was realised losses on securities (realised gains of NOK 146 million) and gains on foreign exchange and interest trad-ing totalled NOK 137 million (NOK 111 million). Furthermore, in-come from ownership interests aggregated NOK 209 million (NOK 267 million), and dividends NOK 21 million (NOK 47 million).
High net income from financial investments in 2010 was due,in part, to the merger of Nordito AS and PBS AS, whichgenerated a gain of NOK 96 million. In addition, the bank’s stake in the merged company, Nets Holding AS, was revaluated upwards by NOK 67 million in 2010. In all, the effect on the 2010 accounts was NOK 163 million.
Losses on securities totalled NOK 48 million in 2011, of which NOK 35 million was a loss on the stock and equity portfolioand NOK 13 million was a loss on the fixed income portfolio.The Group is not exposed, directly or indirectly, to Europeanor American national debt.
Income from ownership interests fell from NOK 267 million to NOK 209 million in 2011, and is mainly made up of the Group’s share of the profits of SpareBank 1 Gruppen, Bank 1 OsloAkershus, BN Bank, SpareBank 1 Boligkreditt and SpareBank 1 Næringskreditt. The share from SpareBank 1 Gruppen totalled NOK 96 million (NOK 166 million) in 2011. The share of BN Bank’s profit amounted to NOK 36 million (NOK 33 million).Furthermore, NOK 28 million (NOK 7 million) was taken to income as the difference between the estimated and book equity in BN Bank from earlier acquisition valuations. The Group’s share
%
Net interest income, NOK millionInterest margin
Net interest income and interest marginNOK million
0
500
1000
1500
2000
201120102009200820071,20
1,25
1,30
1,35
1,40
1,45
1,50
1,55
%
Profit before tax, NOK millionReturn on equity
Profit before tax and return on equityNOK million
0
400
800
1200
1600
2000
201120102009200820070
5
10
15
20
25

19
from SpareBank 1 Boligkreditt was NOK 24 million (NOK 25million), SpareBank 1 Næringskreditt NOK 7 million (NOK2 million), Bank 1 Oslo Akershus NOK 16 million (NOK 37million) and Samspar Bankinvest NOK 2 million. OPerating eXPensesThe Group’s ordinary operating expenses totalled NOK 1 633million in 2011. This is a rise from NOK 1 566 in 2010.Personnel costs were reduced by NOK 42 million to NOK 828 million, and other expenses rose by NOK 109 million to NOK 805 million. Expenses in both 2010 and 2011 were affected by pension allocations. In 2010, an amount (net) of NOK 106 millionrelating to AFP (early retirement) allocations was reversed. In 2011, changes in the pension schemes resulted in a reduction in costs of NOK 224 million (one-time effects). Excluding pension items, personnel costs rose by NOK 76 million from 2010 to 2011.
A large part of the Group’s increased expenses can be attributedto the merger with Kvinnherad Sparebank in 2010 and higherexpenses in EiendomsMegler 1 SR-Eiendom AS in connection with acquisitions and a higher level of activity. The higher level of activity in the parent bank’s divisions also has an impact on the cost growth. From 2010 to 2011, the underlying growth in expenses was approximately 5 per cent.
The Group’s cost ratio (costs in terms of income) was 50.0 per cent in 2011 compared with 45.9 per cent in 2010.
In 2011, the number of full time equivalents employed rose by 67. The largest growth took place in the real estate brokerage company and the Capital Market Division. At the end of 2011, the Group employed 1 279 full time equivalents, of which 1 213 weremembers of the permanent staff.
LOsses and defauLtsIn 2011, the Group recorded net new loan loss provisions of NOK 139 million (NOK 234 million) representing 0.13 per cent (0.23
per cent) of gross lending. Write-downs on groups of loans rose by NOK 5 million to NOK 362 million at the end of 2011. Of the total individual loan loss provisions recorded in 2011, NOK 134 million, the corporate market accounted for NOK 88 million and the retail market NOK 46 million.
Gross non-performing commitments totalled NOK 415 million at the end of 2011, compared with NOK 443 million at the same time last year, or 0.41 per cent (0.42 per cent) of gross lending. Problem loans (not in default) totalled NOK 696 million (NOK 762 million), corresponding to 0.69 per cent of gross loans (0.72 per cent). On aggregate, gross non-performing loans and problem loans totalled NOK 1 111 million at the end of 2011, down from NOK 1 205million at the end of 2010. In terms of gross lending, however,this was a decline from 1.14 per cent to 1.10 per cent.
The provision ratios, measured in terms of individual write-downs as a percentage of non-performing and problem loans were 33 per cent and 41 per cent respectively at the end of 2011, compared with 30 per cent and 35 per cent in 2010.
Operating expensesNOK million %
Operating expenses, NOK million% of average total assets
0
500
1000
1500
2000
20112010200920082007
0,0
0,5
1,0
1,5
2,0
Gross defaults as a % of gross lending
Gross defaultsNOK million %
0
100
200
300
400
500
20112010200920082007
0,0
0,1
0,2
0,3
0,4
0,5
Corporate marketRetail market incl. Boligkreditt
Gross lending, % growth, retail and corporate markets
%
-10
0
10
20
30
40
20112010200920082007
14,813,7
10,7
26,4
30,3
-0,9
12,1
8,5
16,6
4,2

20
baLance sHeetThe Group’s total assets declined in 2011 from NOK 134.8 billion at the beginning of the year to NOK 131.1 billion at year-end. This decline is because lending portfolios transferred to SpareBank 1 Boligkreditt AS and SpareBank 1 Næringskreditt AS (jointly owned companies) are not included in total assets. At the end of the year, Sparebank 1 SR-Bank had a portfolio of housing loans with SpareBank 1 Boligkreditt AS totalling NOK 45 billion, com-pared with NOK 26 billion at the end of 2010.
Growth in lending (including SpareBank 1 Boligkreditt AS and SpareBank 1 Næringskreditt AS) in 2011 was 11.2 per cent and total lending at the end of 2011 aggregated NOK 146.7 billion. Retail market lending rose by 11.2 per cent. Loans to the corporate market and the public sector rose in volume by 11.8 per cent in 2011. The distribution between loans to the retail market (includ-ing SpareBank 1 Boligkreditt AS) and the corporate market/public sector (including SpareBank1 Næringskreditt AS) was 63.1 per cent and 36.9 per cent respectively at the end of 2011, against 62.6 per cent and 37.4 per cent at the end of 2010. Through the merger
with Kvinnherad Sparebank on 1 November 2010, the Group’s lending rose by approximately NOK 4.0 billion.
Total deposits were NOK 64 billion at the end of 2011, up 5.4 per cent from the end of 2010. The growth in the retail and corporate market/public sector was 9.6 per cent and 3.0 per cent respectively.
The deposit-to-loan ratio stood at 63.2 per cent at the end of 2011, against 57.4 per cent at the end of the preceding year. In a market that is experiencing tough competition, the Group has maintained a good deposit-to-loan ratio. In addition to ordinary deposits from customers, at the end of 2011 the Group has NOK 11.2 million (NOK 12.5 million) under management, primarily thoughSR-Forvaltning and ODIN Funds.
retaiL MarKet diVisiOnThe Retail Market Division’s contribution before write-down on loans was NOK 747 million in 2011. Higher funding costs and tough competition are the main reason for the contribution before write-downs on loans being NOK 43 million lower than in 2010.
During 2011, the division increased its lending (including the sale of housing loans to SpareBank 1 Boligkreditt AS) by 11.2 per cent, while deposits increased by 9.6 per cent. The growth is a result of good market growth, combined with a long-term commitmentto provide qualified advisory services supported by a strongbrand name.
The good net rise in the number of customers, privateindividuals and small companies, continues at the same rateas in 2010. The development in housing loans is still good as a result of the high level in market activity and the Group’s strong distribution model. Impairments of loans and the percentage of non-performing loans remain low. Commission income (excluding income from SpareBank 1 Boligkreditt) rose by NOK 45 million in 2011 compared with 2010. The largest increase comes from insurance commissions and portfolio commissions in the savings and investments field. Rising products sales are a direct result of the Group’s commitment to broad advisory services. Sparebank 1 SR-Bank is a market leader when it comes to its percentage of authorised financial advisers. Furthermore, a well-functioning customer centre has resulted in higher sales and a better serviceto customers, especially in relation to non-life insurance.
cOrPOrate MarKet diVisiOnThe Corporate Market Division’s contribution before anywrite-down on loans amounted to NOK 762 million in 2011.This was NOK 33 million more than in the preceding year.
The activity level in trade and industry is good, but the market is experiencing tough competition. In 2011, the division’s lending volume rose by 11.8 per cent, while deposits rose by 3.0 per cent. Lending margins are under pressure, but were fairly stable in 2011.The division is working intensely on broad-scale sales of the
Retail market incl. BoligkredittCorporate market
Gross lending, retail and corporate marketsNOK million
0
20000
40000
60000
80000
100000
20112010200920082007
8234
9
5608
5
6375
4
7060
1
4904
0
9228
7
531
98
3644
7 4750
0
4706
3
Deposit-to-loan-ratio
Deposit-to-loan-ratio%
Deposit-to-loan-ratio incl. loans sold toSpareBank 1 Boligkreditt and Næringskreditt
40
45
50
55
60
65
70
20112010200920082007
57,4
46,1
63,2
43,7
56,9
53,8 53,0
47,2
58,1
46

21
Group’s products, and the product coverage is rising. Commissions and other income rose by NOK 47 million in 2011.
The portfolio quality is good. Cyclical trends affect creditquality, but the repercussions of the financial crisis has notaffected the business in the region as hard as previously expected, and a gradual improvement in the quality of the loan portfolio was observed throughout the year. This improvement is due both toimproved market prospects, as well as to the effects of risk-reducing measures. A competent organisation, customer portfolio quality and a good and close customer interaction have paved the way for appropriate solutions for customers and for the Group. In 2011, losses totalled NOK 83 million, compared with NOK 165million in 2010. The proportion of non-performing loans remains low.
caPitaL MarKet diVisiOnThe division’s areas of competence complement traditionalbanking operations and gather the Group’s expertise in the fieldsof security operations and asset management. The securitiesoperation is organised under the brand name SR-Markets and comprises trading in shares, interest rate instruments and foreign exchange for own account and for account of customers, andCorporate Finance services, settlement functions and securities related administrative services. Asset management is organisedin a separate subsidiary, SR-Forvaltning AS.
SR-Market’s income in 2011 amounted to NOK 214 million, compared with NOK 180 million in the preceding year. Most of the income is still generated by trading in currencies and interest instruments for account of customers. The bond portfolio showed a gain of NOK 5 million, down NOK 23 million on 2010, after positive developments toward the end of the year. The Corporate Finance Department has managed and completed several major projects in the course of 2011, and the department’s income more than doubled compared with the preceding year. Toward the end of the year, the department strengthened its workforce and is well positioned for further growth. The newly established stock trading desk returned a positive result in its first full business year.
subsidiariesThrough their products and services, the subsidiaries allow the Group to offer a broader range to customers and enhance the bank’s earnings basis. Through good internal interaction and joint marketing, the Group is a total supplier of financial services and products.
EiendomsMegler 1 SR-Eiendom AS is well represented throughout the Group’s entire market area and has 33 offices from Grimstad to Bergen. The company is the leading real estate agent in Rogaland and Vest-Agder and it is gleaning market shares in Hordaland and Aust-Agder.
The company recorded a pre-tax profit of NOK 91 million (NOK 59 million). The improvement in the profit is due to the increase
in the number of properties sold, as well as the reversal of earlier allocations for pension liabilities in the Group’s pension schemes.
The company sold 7 502 properties in 2011, compared with7 183 in 2010. The value of the properties sold by the company was NOK 20.8 billion (NOK 17.6 billion). Toward the end of 2011, there was slightly less activity in the housing market than had been expected. However, prospects for 2012 are considered good in the Group’s market area, with high employment and lowinterest rates.
The market for commercial properties was to some extent effected by the uncertainty in the financial markets, and the market is expected to be hesitant in 2012 as well. The rental market is good and is expected to remain so during the entire year.
The company has maintained its strong market position. New offices at Karmøy and Stord, and the establishment of a separate commercial real estate office in Kristiansund will furthercontribute to strengthen distribution power in the future.
SpareBank 1 SR-Finans AS offers lease financing for trade and industry and secured car loans. In 2011, the company returned a pre-tax profit of NOK 100 million (NOK 78 million in 2010). The improvement in the result is primarily due to lower losses in the corporate portfolio. Profit before write-downs was NOK 117 million compared with NOK 125 million one year earlier. Total assets have grown steadily over the last year and at the end of 2011 amounted to NOK 5 404 million.
New sales of car loans and in the leasing field were good in 2011, and prospects for 2012 are good with increasing order reserves and low defaults.
SR-Forvaltning AS is a securities firm with a licence to provide asset management services. In 2011, the profit before tax was NOK 27million, compared with NOK 21 million in 2010. At the end of 2011, the company had NOK 5.9 billion under management. This isapproximately NOK 300 million less than at the beginning of the year.
SR-Investering AS’ object is to contribute to long-term creation of added value through investments in trade and industry in the Group’s market area. The company primarily invests in privateequity funds and companies in the SMB segment that have a need for capital if they are to develop and grow. In 2011, profit before tax amounted to NOK 11 million, up from NOK 7 million in 2010. At the end of 2011, SR-Investering AS had total investments of NOK 143 million. The residual commitment relating to these investments is NOK 112 million.
sParebanK 1 bOLigKreditt asand sParebanK 1 nÆringsKreditt asSpareBank 1 Boligkreditt AS and SpareBank 1 Næringskreditt AS are mortgage companies operating under a licence issued by the
22
Financial Supervisory Authority of Norway and issue covered bond (with pre-emptive rights) on the bank’s home mortgage and commercial properties portfolios respectively that are bought from the owner banks. The companies are owned by savings banks that are part of the SpareBank 1 Alliance and contribute to the owner banks having access to stable and long-term funding at competitive rates.
At the end of 2011, SpareBank 1 Boligkreditt AS made loanstotalling NOK 128.6 billion, of which NOK 44.7 billion washousing loans transferred from SpareBank 1 SR-Bank. At the end of 2011, the bank owned 34.4 per cent of the company. Ownership stakes are adjusted annually in line with the volumes actually transferred.
At the end of 2011, Sparebank 1 Næringskreditt AS had lent atotal of NOK 8.9 billion, of which NOK 600 million was loans transferred from Sparebank 1 SR-Bank. SpareBank 1 SR-Bankhas a 30.7 per cent stake in the company.
sParebanK 1 aLLianceSpareBank 1 Alliance’s object is to acquire and provide competi-tive financial services and products and to exploit economies of scale in the form of lower costs and/or higher quality. Thus, thealliance contributes to private individuals and companiesbenefiting from local roots, expertise and a simpler everyday life. Moreover, the alliance is to help secure the banks’ value creation to benefit their own regions and the banks’ owners. The SpareBank 1 banks manage the alliance cooperation and development of the product companies through SpareBank 1 Gruppen AS, a jointly owned holding company.
SpareBank 1 Gruppen AS is owned by SpareBank 1 SR-Bank(19.5 per cent), SpareBank 1 Nord-Norge (19.5 per cent),SpareBank 1 SMN (19.5 per cent), Sparebanken Hedmark (12 per cent), Samarbeidende Sparebanker AS (19.5 per cent, owned by11 savings banks in the south of Norway), together with theNorwegian Confederation of Trade Unions (LO)/trade unionsaffiliated to LO (10 per cent).
SpareBank 1 Gruppen AS owns SpareBank 1 LivsforsikringAS, SpareBank 1 Skadeforsikring AS, ODIN Forvaltning AS, SpareBank 1 Medlemskort AS, SpareBank 1 Gruppen Finans Holding AS, as well as 97.2 per cent of the shares in SpareBank 1 Markets AS (formerly Argo Securities AS). SpareBank 1Gruppen Finans Holding AS owns 100 per cent of the shares in Actor Fordringsforvaltning AS, 100 per cent of SpareBank 1 Factoring AS and 100 per cent of the shares in Actor Portefølje AS. With effect from 2010, Bank 1 Oslo Akershus AS was demerged from SpareBank 1 Gruppen, and is today owned directly by the banks with the same stakes as in SpareBank 1 Gruppen.
The weak performance of the securities market, work on building up SpareBank 1 Markets AS’ operations, together with significant
natural catastrophe and major claims resulted in after-tax profits falling from NOK 832 million in 2010 to NOK 479 million in 2011. SpareBank1 SR-Bank’s share of the profit was NOK 95.9 million in 2011, down NOK 165.8 million on 2010.
SpareBank 1 Gruppen AS has administrative responsibility for the cooperation processes in the SpareBank 1 Alliance, where technology, brands, expertise, common processes/application of best practice and procurement are key elements. The alliance is also engaged in development work through three centres of excellence for Learning (Tromsø), for Payments (Trondheim) and for Credit (Stavanger). SpareBank 1 banks are heavily involved in the development work in the common arena. In 2011, the alliance has focused, inter alia, on further developing self-service mobile solutions.
bn banK asa and banK 1 OsLO aKersHus asSpareBank 1 SR-Bank and the other savings banks in theSpareBank 1 Alliance acquired Glitnir Bank ASA and itssubsidiary Glitnir Factoring in the 4th quarter of 2008. The name was later changed to BN Bank ASA. SpareBank 1 SR-Bank’s stake rose from 20 per cent to 23.5 per cent in the 4th quarter of 2009. The share of BN Bank ASA’s profit rose from NOK 33.1 million in 2010 to NOK 36.1 million in 2011. In addition, NOK 28.2 million was taken to income as a result of the difference between BN Bank’s estimated equity and book equity, so that the totalcontribution to the Group’s profit was NOK 64.0 million. In 2010, total income recorded as a result of amortisation and the share of the profit was NOK 39.9 million.
The share of Bank 1 Oslo Akershus’ profit was NOK 16.0 million.
accOunting PrinciPLesSpareBank 1 SR-Bank prepares its parent company andconsolidated accounts in accordance with International Financial Reporting Standards (IFRS) as adopted by the EU.
The description of the accounting principles applied by the Group, in Note 2 to the accounts, sets out a more detailed account of important factors relating to the treatment for accounting purposes in accordance with IFRS.
cOrPOrate gOVernanceCorporate governance in SpareBank1 SR-Bank ASA comprises the objectives and overriding principles according to which the Group is governed and controlled, to secure the interests of shareholders, customers and other groups. Governance of the Group’s activities shall ensure prudent asset management and greater assurance that publicly declared goals and strategies are reached and realised.
SpareBank 1 SR-Bank’s corporate governance principles arebuilt on three primary pillars: openness, predictability and transparency. The Group has defined the following main corporate governance principles:

23
• Value creation for equity shareholders and other interest groups • A structure that ensures goal-oriented and independent management and control • Systems that ensure measurability and accountability• Effective risk management• Well set-out, clear and timely information• Equal treatment of equity shareholders and a balanced relationship to other interest Groups • Compliance with legislation, regulations and ethical standards
SpareBank 1 SR-Bank has no provisions in the articles ofassociation that restrict the right to negotiate shares. The Board of Directors is not aware of any agreements between shareholders that limit the opportunities to negotiate shares or to exercise voting rights for shares. The Board of Directors annually approves the guidelines for remuneration to senior executives. The guidingpolicies for the coming fiscal year are presented to the general meeting for an advisory vote, but the binding guidelines for the allocation of shares, subscription rights, etc. as part of the Group’s remuneration scheme for the coming financial year are presented to the general meeting for approval.
The Norwegian Code of Practice for Corporate Governance has been followed when preparing SpareBank 1 SR-Bank’s corporate governance policy. Further information on corporate governance, pursuant to section 3-3b of the Accounting Act, is to be found on SpareBank 1 SR-Bank’s web site (www.sr-bank.no).
risK ManageMentThe banking industry’s core activity is to create values byassuming recognised and acceptable risks. The Group invests, there-fore, significant resources in developing risk management systems and processes that are in line with leading international practice.
Risk and capital management in SpareBank 1 SR-Bankunderpins the Group’s strategic development and the achievement of its goals, while at the same time ensuring financial stabilityand prudent asset management. This is achieved through:
• A strong corporate culture that is characterised by a high awareness of risk management • A good understanding of which risks drive earnings • Striving for optimal capital utilisation within the adopted business strategy• Avoiding unexpected single incidents that can seriously harm the Group’s financial situation• Exploiting synergies and diversification effects
The Group’s risk is quantified, inter alia, by computing expected losses and risk-adjusted capital to be able to uncover anyunexpected losses. Expected losses describe the losses thatstatistically must be expected over a 12-month period.Risk-adjusted capital describes how much capital the Groupbelieves it needs to cover the real risk that the Group has assumed.
The most important risks the Group assumes are the credit risk, market risk, liquidity risk, operational risk and ownership risk. These risks are described in more detail below.
credit risKCredit risk is managed through the framework for credit granting, monitoring and portfolio management. The overriding creditstrategy stipulates that the Group shall have a moderate riskprofile. Defaults and losses have shown a positive trend in 2011 and the market area is characterised by persistent high activity and low unemployment. Together with constant focus on risk management, this contributes to the maintenance of portfolio’s good quality.
The quality of the corporate portfolio is solid and virtually un-changed. The quality of the retail market portfolio is very goodand the trend is characterised by stability where the low risk profile is maintained. Most of the portfolio is secured by mortgages on real property, and loan to value ratio is moderate. This implies a limited loss potential as long as these values are not significantly impaired.
MarKet risKManagement of market risk is based on conservative limits for positions in interest instruments and currencies, as well asinvestments in shares and bonds. The Board of Directors reviews and approves the limits at least once a year.
Part of the Group’s market risk is linked to investments in bonds and commercial papers. At the end of 2011, the Group had liquid assets in the form of bonds totalling NOK 19.8 billion of which NOK 7.8 billion was covered bonds used in the authorities’ swap scheme.
When quantifying risk linked to impairment in the value of the liquidity portfolio, SpareBank 1 SR-Bank distinguishes between systematic risk (market risk) and unsystematic risk (default risk). Default risk associated with the portfolio mentioned is quantified as credit risk.
Risk activities relating to trading in foreign exchange, interest rate instruments and securities arise within the limits that are adopted at any time, authorities and credit lines for counterparties.SpareBank 1 SR-Bank assumes, to a limited extent, the interest rate and foreign exchange risk in connection with trading activities for own account. As far as possible, income from operations is in the form of customer margins in order to ensure maximum stability and reliability of earnings.
The Group’s exposure to market risk is considered moderate.
LiQuiditY risKThe bank’s framework for managing liquidity risk shall reflectthe bank’s conservative risk profile. Liquidity risk shall be low.

24
The Group’s lending is financed primarily by way of customer deposits and long-term funding, including the sale of housing loan portfolios to SpareBank1 Boligkreditt AS. The liquidity risk is restricted through diversification of markets, funding sources, instruments and maturity periods
The Group had adequate access to liquidity in 2011. Deposits from customers are the most important funding source. For the Group as a whole, deposits grew by NOK 3.3 billion from the end of 2010 to the end of 2011. The deposit-to-loan ratio rose from 57.4 per cent at the end of 2010 to 63.2 per cent at the end of 2011.
Over the last year, the market situation was characterised by the debt challenges in Southern Europe and the fear of this spreading to the entire Eurozone. This has had an impact on the Group’s funding. At times, the market has been closed for new issuesand prices have risen. Because of the market challenges, andthe price difference between secured and unsecured debt, thebank has exploited reserves ready for securitisation. In 2011,the sale of high-quality mortgage loans to SpareBank 1Boligkreditt AS helped dampen the need for funding and thus SpareBank 1 SR-Bank’s liquidity risk. The Group’s securitiesdebt is evenly distributed among international and nationalcapital sources.
OPeratiOnaL risKThe processes for management of operational risk in SpareBank 1 SR-Bank shall ensure, as far as possible, that no single incident caused by operational risk is able to harm the Group’s financial position seriously. Risk management is based on insight, an understanding of what creates and drives operational risk in the Group, and to the extent possible reconciles effective processes with low risk exposure.
The Group uses a systematic process to identify and quantify operational risks that the Group is at any time exposed to, and it has established its own systems for reporting adverse events and follow-up of improvement measures. This helps SpareBank 1SR-Bank continue to be a dominant organisation over time, through proper prioritisation and continuous improvement.
As part of the on-going competence build-up, SpareBank 1SR-Bank has established a partnership with the Universityof Stavanger and the SpareBank 1 Alliance covering a researchand development project that will deliver new knowledge and specific tools for better management of operational risk in the financial industry. The project aims at establishing Norway asa professional centre in Europe for education, innovation andapplications relating to methods and processes for managingoperational risk in the financial industry, and to position thealliance and University of Stavanger as a leading environment within the management of operational risk in Europe. The project was started in the autumn of 2007 and is scheduled forcompletion in 2015.
OwnersHiP risKOwnership risk is the risk that SpareBank 1 SR-Bank bearsif it suffers negative results from stakes in strategically ownedcompanies and/or the need to inject fresh capital into thesecompanies. Ownership is defined as companies in whichSpareBank SR-Bank has a significant stake and influence.In principal, Sparebank 1 SR-Bank bears ownership riskprimarily through its stakes in SpareBank 1 Gruppen AS(19.5 per cent), SpareBank 1 Boligkreditt AS (34.4 per cent), SpareBank 1 Næringskreditt AS (30.7 per cent), Bank 1 OsloAkershus AS (19.5 per cent) and BN Bank ASA (23.5 per cent).
cOMPLiance SpareBank 1 SR-Bank is very cognisant of the need to havegood processes to ensure compliance with legislation andregulations. The Board of Directors adopts the Group’s compliance policy that describes the main principles for responsibilityand organisation.
EU’s deliberate work on the harmonisation of legislation within the EU/EEA imposes new regulations to which the Group must adapt. Work is on-going to assess the best adaptation to newregulations and new bodies of rules to ensure compliance andeffectiveness of the organisation. New regulations and new bodies of rules governing the operations of the Group shall continuously be included in routines and guidelines. Among other things, work on a new remuneration scheme for the Group was important in 2011. Furthermore, the monitoring of compliance with money laundering regulations has received much attention, in additionto the authorisation scheme for financial advisers.
SpareBank 1 SR-Bank’s compliance function is the responsibility of the Department for risk management and compliance and isorganised independently of the business units. The department has overall responsibility for the framework, monitoring and reporting within the compliance area.
caPitaL ManageMentCapital management shall ensure that SpareBank 1 SR-Bankbalances the relationship between:
• Effective funding and capital allocation in relation to the Group’s strategic objectives and adopted business strategy • Competitive return on equity• Satisfactory capital adequacy on the basis of the adopted risk profile and the regulations issued by the authorities, as well as the demands of market players at any time • Competitive terms and ample access to long-term funding from the capital markets• Exploitation of growth opportunities in the Group’s defined market area, and• That no single incident is able to harm the Group’s financial position seriously
25
A capital plan is drawn up every year, to ensure long-term and effective capital management. These projections take into account both expected developments in the coming years and a situation involving a serious economic recession over several years. Stress tests are an important tool for analysing a situation with a serious recession. Stress tests are carried out of both individual factors and scenario analyses where the Group is exposed to a range of different negative macro-economic proceedings over several years. In addition, SpareBank 1 SR-Bank has prepared contingency plans to be able to deal with such crises as effectively as possible should they nevertheless arise.
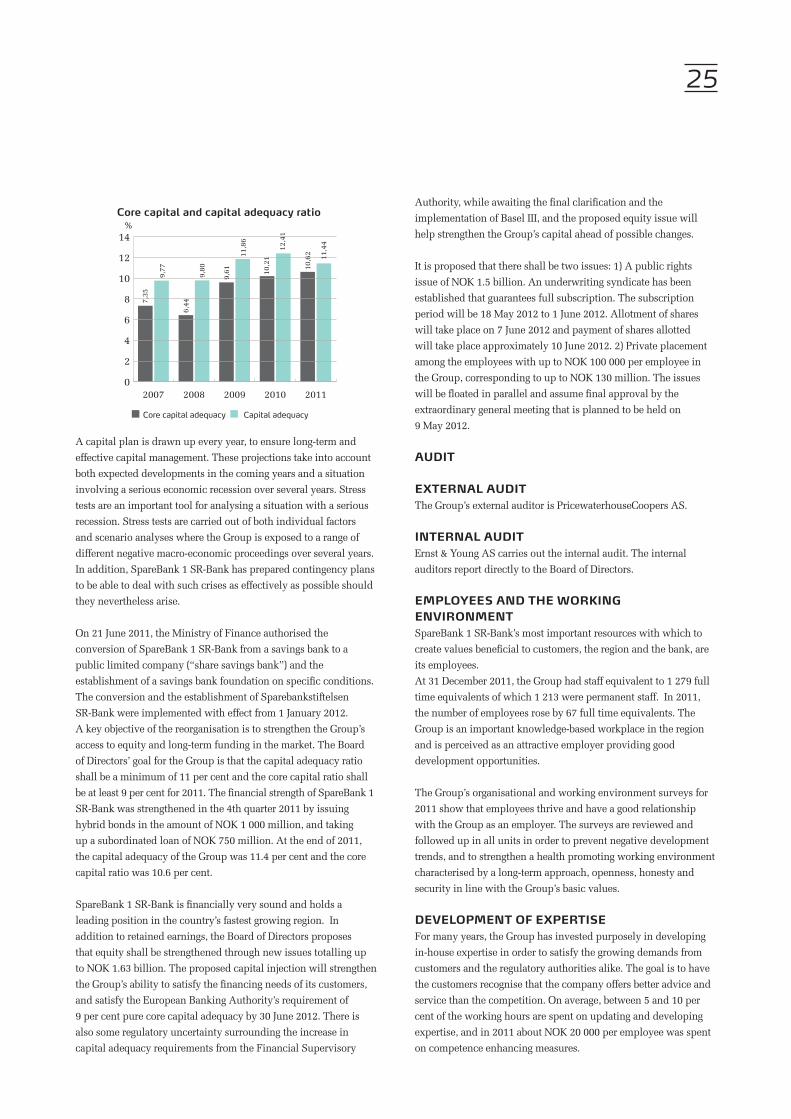
On 21 June 2011, the Ministry of Finance authorised theconversion of SpareBank 1 SR-Bank from a savings bank to apublic limited company (“share savings bank”) and theestablishment of a savings bank foundation on specific conditions. The conversion and the establishment of SparebankstiftelsenSR-Bank were implemented with effect from 1 January 2012.A key objective of the reorganisation is to strengthen the Group’s access to equity and long-term funding in the market. The Boardof Directors’ goal for the Group is that the capital adequacy ratio shall be a minimum of 11 per cent and the core capital ratio shall be at least 9 per cent for 2011. The financial strength of SpareBank 1SR-Bank was strengthened in the 4th quarter 2011 by issuing hybrid bonds in the amount of NOK 1 000 million, and taking up a subordinated loan of NOK 750 million. At the end of 2011, the capital adequacy of the Group was 11.4 per cent and the core capital ratio was 10.6 per cent.
SpareBank 1 SR-Bank is financially very sound and holds a leading position in the country’s fastest growing region. In addition to retained earnings, the Board of Directors proposes that equity shall be strengthened through new issues totalling up to NOK 1.63 billion. The proposed capital injection will strengthen the Group’s ability to satisfy the financing needs of its customers, and satisfy the European Banking Authority’s requirement of 9 per cent pure core capital adequacy by 30 June 2012. There is also some regulatory uncertainty surrounding the increase in capital adequacy requirements from the Financial Supervisory
Authority, while awaiting the final clarification and the implementation of Basel III, and the proposed equity issue will help strengthen the Group’s capital ahead of possible changes.
It is proposed that there shall be two issues: 1) A public rights issue of NOK 1.5 billion. An underwriting syndicate has been established that guarantees full subscription. The subscription period will be 18 May 2012 to 1 June 2012. Allotment of shares will take place on 7 June 2012 and payment of shares allotted will take place approximately 10 June 2012. 2) Private placement among the employees with up to NOK 100 000 per employee in the Group, corresponding to up to NOK 130 million. The issues will be floated in parallel and assume final approval by the extraordinary general meeting that is planned to be held on 9 May 2012.
audit
eXternaL auditThe Group’s external auditor is PricewaterhouseCoopers AS.
internaL auditErnst & Young AS carries out the internal audit. The internal auditors report directly to the Board of Directors.
eMPLOYees and tHe wOrKing enVirOnMent SpareBank 1 SR-Bank’s most important resources with which to create values beneficial to customers, the region and the bank, are its employees. At 31 December 2011, the Group had staff equivalent to 1 279 full time equivalents of which 1 213 were permanent staff. In 2011, the number of employees rose by 67 full time equivalents. The Group is an important knowledge-based workplace in the region and is perceived as an attractive employer providing good development opportunities.
The Group’s organisational and working environment surveys for 2011 show that employees thrive and have a good relationship with the Group as an employer. The surveys are reviewed and followed up in all units in order to prevent negative development trends, and to strengthen a health promoting working environment characterised by a long-term approach, openness, honesty and security in line with the Group’s basic values.
deVeLOPMent Of eXPertiseFor many years, the Group has invested purposely in developing in-house expertise in order to satisfy the growing demands from customers and the regulatory authorities alike. The goal is to have the customers recognise that the company offers better advice and service than the competition. On average, between 5 and 10 per cent of the working hours are spent on updating and developing expertise, and in 2011 about NOK 20 000 per employee was spent on competence enhancing measures.
Core capital adequacy Capital adequacy
Core capital and capital adequacy ratio%
0
2
4
6
8
10
12
14
20112010200920082007
10,2
1
7,35
6,44
9,61
12,4
1
10,6
2 11,4
4
9,77
9,80
11,8
6
26
At the end of 2011, 81 per cent of the bank’s financial advisers and investment consultants were authorised, compared to the national average of 63 per cent. EiendomsMegler1 SR-Eiendom AS has carried out a similar training scheme for its real estate agents pursuant to new regulatory requirements.
SpareBank 1 SR-Bank participates in the insurance industry’s authorisation scheme for specialists and advisers that provide non-life insurance solutions in Norway. At year-end, 70 per cent of the specialists were authorised, as were 75 per cent of the advisers, which is in line with the plans adopted at the beginning of the year.
HeaLtH, tHe enVirOnMent and safetYWork on health, the environment and safety (HES) is given high priority by the Group. A good working structure has been established and we consider that cooperation with the employees’ representatives is very good. In 2011, 12 robbery exercises were carried out. 14 threats against employees were reported. All these incidents have been studied, but they have not called for the introduction of any extra security measures. In the same period, six accidents/near-accidents were reported. These were reported and have been followed up in accordance with the current guidelines.
The Group strives to ensure sustainable environmental management and seeks to contribute both through its own operations and by influencing customers and suppliers to make environmental and climate-friendly choices. The Group’s direct environmental impact is primarily related to greenhouse gas emissions and waste production through office operations, while the indirect impact is through the purchase of goods and services and demands made on customers and suppliers
sicK LeaVe and tHe incLusiVe wOrKPLace scHeMeThe Group has long-time goal of less than 3 per cent absence from work due to illness, i.e. 97 per cent presence. At the end of 2011, this stood at 96.6 per cent.
Over time, the Group has worked comprehensively andsystemically to promote and improve the employees’ health, maintain this over time and help those who become sick to return to work. Through participation in the Inclusive Workplace scheme (IA) and good follow-up by managers, we are continually working to decrease sick leave due to illness.
SpareBank 1 SR-Bank has prepared a life-phase document that was revised in 2011. The purpose of the life-phase document is to offer employees a range of measures that are suited to the individual’s life-phase, which on the whole will improve the employee’s everyday life and ensure a rise in the retirement age. The goal of a retirement age of 63 years was reached in 2011 and has been maintained in 2011 through individual adjustments and flexibility.
eQuaL OPPOrtunitiesSpareBank 1 SR-Bank shall provide men and women with equal opportunities for personal development, pay and other career-related issues. In 2011, women accounted for 56.8 per cent of the full time equivalents in the Group and 43.2 per cent were men. This is virtually the same gender distribution as in 2010. Theaverage age is 43 years and the average length of service is12 years. Group management comprises 8 men and 1 woman.In 2011, 41 per cent of the Group’s managers were women.
A range of measures has been implemented to promote gender equality:
• Diversity and equal opportunity are subjects in management development programmes and management groups• All vacant positions are advertised internally• Schemes are available with flexible working hours• Mandatory implementation of goals and development reviews for all who have leave of absence• Participation in FUTURA (a development programme for women in finance) or other management training programmes for women with a view to developing future female management talents in the financial industry
banK adVisOrY cOunciLsSpareBank 1 SR-Bank has local bank advisory councils in all of the municipalities in which the Group is represented. These advisory councils shall help recognise opportunities and identify signals regarding the bank’s activities in the local markets. They are made up of local resource persons and they act as listening posts and as advisers to the local offices in their marketing work. The bankadvisory councils administer portions of the bank’s endowment fund for public benefit, and have committed themselves toensuring that the funds are put to good use in the local community.
tHe banK’s eQuitY certificates/sHaresThe conversion of SpareBank 1 SR-Bank from and equitycertificate bank to a public limited company (ASA) took placewith effect from 2012. The last day that ROGG was listed was30 December 2011. With effect from 2 January 2012, the tickeron Oslo Stock Exchange was changed to SRBANK. The pricefell from NOK 57.0 to NOK 40.70 in 2011. This representeda negative return of 23.8 per cent in 2011, taking into accountdividend paid, NOK 2.75. The Oslo Stock Exchange Benchmark Index fell approximately 12.5 per cent in the same period.The equity certificate index fell 21.6 per cent in 2011.
There were 11 887 (12 031) owners of ROGG at the end of 2011. 9.6 per cent (9.7 per cent) were held by companies and individu-als abroad, while 46.8 per cent (47.5 per cent) were held by people and companies from Rogaland, the Agder counties and Hordaland. The 20 largest holders held 40.3 per cent (43.0 per cent) of the certificates at 31 December 2011. The bank owned 133 248 of its own equity certificates. Group employees owned 3.5 per cent of the equity certificates at the end of the year.

27
Sparebankstiftelsen SR-Bank was established in connection with the conversion and on establishment it received 72 176 308 shares. This number of shares corresponded to the relative ownership of the former primary capital in SpareBank 1 SR-Bank. Former owners of ROGG received, at the time of the conversion, one share for each equity certificate they held. This aggregated 127 313 361 shares. Subsequent to the conversion the number of shares issued is 199 489 669.
Earnings per share in the Group were NOK 5.42. The parent bank’s profit available for distribution, which forms the basis for thedistribution of dividend, was somewhat lower at NOK 4.70 per share in 2011. In accordance with the Group’s dividend policy,the Board of Directors proposes that NOK 1.50 per share be paidin dividend for 2011. The dividend for the 2010 accounting year was NOK 2.75.
gOing cOncernThe Group’s financial health was further strengthened in 2010. Earnings prospects and macro-economic business fundamentals also appear to be relatively good. Together with implemented and planned measures, this contributes to good prospects of further progress for the Group in 2012. The annual accounts are therefore prepared on the basis of a going concern assumption.
aLLOcatiOn Of PrOfitfOr tHe Year/diVidend SpareBank 1 SR-Bank’s financial goal for its activity is to achieve results that provide a good and stable return on the bank’s equity, thus creating values for the owners in the form of a competitive dividend and increase in the share value. When deciding on the annual dividend, consideration is given to financial needs including the capital adequacy requirements, and the Group’s targets and strategic plans. Unless capital adequacy requirements require otherwise, the Board of Directors goal is that half of the profit for the year after tax shall be distributed as dividend.
The parent’s company profit available for distribution is the point of departure for distribution of the dividend. The parent
company’s available profit for the 2011 accounting year wasNOK 936 million or NOK 4.70 per share (taking into accountthe number of shares at 2 January 2012, subsequent to theconversion into a public limited company and the establishment of the foundation Sparebankstiftelsen SR-Bank). On the basis of an overall assessment, the Board of Directors of Sparebank 1 SR-Bank proposes a dividend of NOK 1.50 per share. This represents apay-out ratio of 32 per cent. .
The Board proposes the following allocation of the profit for 2011:
In addition to retained earnings, SpareBank 1 SR-Bankstrengthened its solvency in the 4th quarter of 2011 by issuing hybrid bonds for NOK 1 000 million and the issuance ofsubordinated debt in the amount of NOK 750 million. The Board of Directors considers that SpareBank 1 SR-Bank, after theproposed allocations, and other completed and planned actions, has good financial strength and sufficient flexibility to supportthe Group’s business in the time to come.
OutLOOK fOr 2011Norwegian state finances are sound. At the beginning of 2012, Norway was among those countries in the world with the highest trade surplus, mainly because of the export of oil and gas. This contributes to an ever-growing petroleum fund and gives thecountry economic room to manoeuvre. Gross domestic product (GDP) for mainland Norway grew by approximately 2 per cent in 2011. The Norwegian economy is assumed to be moving up to a normal activity level again, investments in the mainland economy are rising and the unemployment level seems to have stabilised at a low level. Nevertheless, uncertainty is high, if Norwegian trade and industry were to be affected by the international recession more than has been the case so far, this could result in higher losses and a decline in credit demand. The Board of Directors would stress that there is a great deal of uncertainty surrounding the assessment of future conditions.
Expectations of a rise in national key performance indicatorsin 2012 are also confirmed regionally, where the business surveys for Rogaland, published inter alia by SpareBank 1 SR-Bank, confirm expectations of a higher activity level, low unemployment and a growth particularly in the offshore industry.
While domestic expectations for 2012 point toward continued growth, there is a great deal of focus on the unsolved national debt situation for a number of European countries. Risk pricing is
Dividend per PCC NOK
Direct yield %
Dividend per PCC and direct yieldNOK %
0
1
2
3
4
5
20112010200920082007
0
2
4
6
8
NOK million
Parent company profit after tax 936
Transferred from the revaluation reserve 0
Available for allocation 936
Dividend (NOK 1.50 per share) 299
Retained earnings 637
Total 936

28
higher in the international market at the beginning of 2012 than it was at the beginning of 2011. SpareBank 1 SR-Bank still expects to have good access to funding, but the price level is not expected to return to the level it was prior to the financial crisis, because, among other things, changes in framework conditions contribute to a significantly greater funding need for the banking sector as a whole. On the whole, it is expected that the European banking sector will continue to have a need for larger liquidity and capital buffers than was the case prior to the financial crisis in 2008.
However, national and regional key indicators give grounds for expecting the Group’s overall activity to develop well in 2012. SpareBank 1 SR-Bank’s primary markets are largely influenced, directly and indirectly, by the activity in the petroleum sector. This activity was high in 2011 as well. Generally, prospects appear to be relatively good for this sector’s activity inter alia as a result of new field discoveries on the Norwegian Continental Shelf in 2011. Norges Bank’s estimate for petroleum investments in the years to come indicates that the sound investment level will probably persist, with good field development and further development of fields in operation. This is confirmed by the latest forecast from Statistics Norway. It is expected that the development in the Group’s market area in 2012 will reflect a moderate growth in the Norwegian mainland economy and high investments in the petroleum sector. In light of this, we expect a moderate increase in lending volume and good profit development for the Group, with loan loss provisions at the same level as in 2011.
SpareBank 1 SR-Bank has a sound financial position and a leading position in the nation’s strongest growth region. Planned capital injections will strengthen the Group’s ability to continue meeting the customers’ financing requirements in an offensive manner.
SpareBank 1 SR-Bank’s liquidity is good and it has focus onefficient operations and income from many product and service areas. Through high customer satisfaction, SpareBank 1 SR-Bank has a good base on which to further strengthen its market position. The Board of Directors believes the Group is well positioned to take advantage of interesting business opportunities and growth. The Board of Directors expects continued strong underlyingoperations and the Group will further consolidate its leading position in 2012 and emerge as a profitable and solid Group that contributes to value creation for customers, shareholders,employees and local communities
The Board of Directors would like to thank the Group’semployees and elected representatives for their good efforts and positive cooperation in 2011. The positive interaction between inhabitants, the business community and the bank is importantfor the development of our market region. In conjunction with this, the Board of Directors would like to thank the Group’s customers, owners and other partners for their loyal support of SpareBank 1 SR-Bank in 2011 and will make every effort toensure that this interaction continues in 2011.
Kristian EidesvikOdd Torland Birthe Cecilie Lepsøe Oddvar Rettedal Sally Lund-Andersen
more information about the board members on www.sr-bank.no under investor Relations.

29
Kristian EidesvikStyreleder
Gunn-Jane Håland Erling Øverland
Erik Edvard Tønnesen Birthe Cecilie Lepsøe Catharina Hellerud
Odd Torland Sally Lund-AndersenAnsattes representant
Arne AustreidAdministrerende direktør
Oddvar RettedalAnsattes representant
Stavanger, 29.2.2012
Erik Edvard Tønnesen Gunn-Jane Håland Erling Øverland Catharina HellerudKristian Eidesvik

iNcome statemeNt 31balaNce sheet 32chaNGes iN equity 33cash flow statemeNt 35Note 1 GeNeral iNformatioN 36Note 2 accouNtiNG priNciples 36Note 3 fiNaNcial risK maNaGemeNt 42Note 4 critical estimates aNd assessmeNts reGardiNG the use of
accouNtiNG priNciples losses oN loaNs aNd GuaraNtees 46Note 5 seGmeNt iNformatioN 47Note 6 Net iNterest iNcome 49Note 7 Net commissioN aNd other iNcome 50Note 8 Net iNcome from fiNaNcial iNstrumeNts 50Note 9 persoNNel costs, remuNeratioN statemeNt aNd beNefits to
the executive employees aNd elected represeNtatives 51Note 10 other operatiNG expeNses 55Note 11 taxes 56Note 12 credit iNstitutioNs- receivables aNd liabilities 57Note 13 leNdiNG to aNd receivables from customers 58Note 14 aGe breaKdowN of loaNs falleN due but Not writteN dowN 61Note 15 losses oN loaNs aNd GuaraNtees 62Note 16 credit exposure for each iNterNal risK ratiNG 64Note 17 maximum credit risK exposure 65Note 18 credit quality per class of fiNaNcial assets 66Note 19 certificates aNd boNds 68Note 20 fiNaNcial derivatives 70Note 21 shares, uNits aNd other equity iNterests 71Note 22 classificatioNs of fiNaNcial iNstrumeNts 74Note 23 restricted fuNds 77Note 24 iNvestmeNts iN owNership iNterests 77Note 25 busiNess combiNatioNs 81Note 26 siGNificaNt traNsactioNs betweeN related parties 82Note 27 taNGible fixed assets 84Note 28 iNtaNGible assets 86Note 29 other assets 86Note 30 deposits from customers 87Note 31 debt raised by issuaNce of securities 88Note 32 other liabilities 89Note 33 peNsioNs (with direct recoGNitioN of actuarial
estimate deviatioNs) 90Note 34 subordiNated loaN capital 93Note 35 KapitaldeKNiNG 94Note 36 equity capital represeNted by equity capital certificates
aNd owNership structure 95Note 37 maturity aNalysis of assets aNd liabilities 98Note 38 liquidity risK 100Note 39 marKet risK liNKed to iNterest rate risK 102Note 40 marKet risK related to curreNcy risK 102Note 41 activities to be sold 103Note 42 chaNGes iN equity oN coNversioN to a public limited compaNy 104Note 43 eveNts after the balaNce sheet date 105iNdepeNdeNt auditor´s report 106statmeNt from the board of directors aNd ceo 107audit committee´s statemeNt for 2011 107
AnnuAl Accounts

31incOMe stateMent
Parent bank group2009 2010 2011 (figures in NOK million) Note 2011 2010 2009
4 821 4 655 5 132 Interest income 6 5 287 4 820 5 015 3 346 3 087 3 543 Interest expenses 6 3 531 3 078 3 339 1 475 1 568 1 589 net interest income 1 756 1 742 1 676
718 743 791 Commission income 7 834 792 760 -86 -70 -74 Commission expenses 7 -71 -71 -87 11 10 5 Other operating income 7 429 380 325
643 683 722 net commission and other operating income 1 192 1 101 998
22 54 20 Dividends 21 47 23 244 214 269 Income from ownership interests 24 209 267 298 390 249 70 Net income from financial instruments 8 89 257 384 656 517 359 net yield from financial investments 319 571 705
2 774 2 768 2 670 total net income 3 267 3 414 3 379
666 632 604 Personnel expenses 9 828 870 881 560 535 631 Other operating expenses 10 805 696 698
1 226 1 167 1 235 total operating expenses before loan losses 1 633 1 566 1 579
1 548 1 601 1 435 Operating profit before loan losses 1 634 1 848 1 800
333 187 121 Losses on loans and guarantees 15 139 234 368 1 215 1 414 1 314 Profit before tax 1 495 1 614 1 432
273 288 378 Taxes 11 414 297 321 942 1 126 936 Profit after taxes available for distribution 1 081 1 317 1 111 942 1 126 936 Majority interests 1 081 1 317 1 109
- - - Minority interests - - 2
earnings per equity certificate (majority) 5,85 5,85 4,70 Earnings per equity certificate 1) 5,42 6,84 6,88 5,85 5,85 4,70 Diluted earnings per equity certificate 5,42 6,84 6,88
1) Earnings multiplied by equity certificate percentage divided by average number of outstanding certificates. (Earnings * 63.1 per cent / 127 180)
expanded accounts 942 1 126 936 Profit before tax 1 081 1 317 1 111 -143 -49 -291 Estimate deviations/pensions -346 -73 -139
40 14 82 Tax effect estimate deviations/pensions 97 20 39 - 1 - Change in value of financial assets held for sale - 1 -
Share of expanded profit in associated - - - companies and joint ventures -19 -12 -1
-103 -34 -209 total profit items recorded against equity -268 -64 -101 839 1 092 727 total profit 813 1 253 1 010
distribution of total profit: 839 1 092 727 Majority interests 813 1 253 1 008
- - - Minority interests - - 2

32baLance sHeet
Parent bank group2009 2010 2011 (figures in NOK million) 2011 2010 2009
assets 781 1 235 263 Cash and balances at central bank 23 263 1 235 781
5 747 5 611 5 391 Loans to and deposits with credit institutions 12 723 1 273 1 301 88 301 100 069 95 278 Net loans to customers 13,16,18 100 588 105 033 92 824 22 558 18 736 19 846 Certificates and bonds 19 19 850 18 742 22 582
2 444 3 247 3 728 Financial derivatives 20 3 716 3 241 2 438 441 541 491 Shares, units and other equity interests 21 631 661 439
23 92 84 Activities to be sold 41 85 93 23 2 253 2 448 3 352 Investments in ownership interests 24 4 389 3 499 3 127
574 694 716 Investments in Group companies 24 - - - - - - Intangible assets 28 54 60 40
309 366 380 Fixed assets 27 401 392 935 330 435 277 Other assets 29 442 549 419
123 761 133 474 129 806 total assets 131 142 134 778 124 909
Liabilities 8 854 7 361 4 785 Debt to credit institutions 12 4 782 7 359 8 852 8 832 8 832 7 395 Debt to Norwegian authorities relating to covered bond scheme 7 395 8 832 8 832
54 512 60 939 64 214 Deposits from customers 30 64 042 60 770 54 336 37 523 40 307 36 338 Debt raised through issuance of securities 31 36 338 40 307 37 523
1 576 2 212 2 010 Financial derivatives 20 2 010 2 212 1 576 221 289 58 Taxes payable 11 130 326 223
91 64 296 Deferred tax 11 329 138 162 1 210 1 063 1 161 Other liabilities 32,33 1 384 1 288 1 461 3 871 4 144 4 975 Subordinated loan capital 34 4 975 4 144 3 871
116 690 125 211 121 232 total liabilities 121 385 125 376 116 836
equity 3 014 3 180 3 180 Equity capital 36 3 180 3 180 3 014
458 625 625 Premium reserve 625 625 458 759 1 175 1 448 Dividend equalisation reserve 1 448 1 175 759 212 336 191 Allocated to dividend 191 336 212
2 241 2 477 2 631 Savings bank reserve 2 631 2 477 2 241 20 55 55 Compensation fund 55 55 20
240 372 293 Endowment fund 293 372 240 - - 108 Allocated to dividend to Sparebankstiftelsen SR-Bank 108 - -
127 43 43 Other equity 43 43 127 - - - Minority interests 1 183 1 139 1 002
7 071 8 263 8 574 total equity 9 757 9 402 8 073 123 761 133 474 129 806 total liabilities and equity 131 142 134 778 124 909
Kristian EidesvikChairman of the Board
Gunn-Jane Håland
Stavanger 29.2.2012
Sally Lund-AndersenEmployee-elected
Erik Edvard Tønnesen Birthe Cecilie Lepsøe Arne AustreidChief Executive Officer
Catharina Hellerud Odd Torland
Oddvar RettedalEmployee-elected
Erling Øverland

33
Arne AustreidChief Executive Officer
cHanges in eQuitY(figures in NOK million)
Paid in equity earned equity
Parent bankequity certifi-cate capital
Premium reserve
compensation fund
savings bank's reserve
endowment fund
dividend equalisation
reserve
reserve for unrealised
gains Other equity total equity
Equity as at 31.12.2008 1 865 92 - 2 066 122 913 69 - 5 127 Bonus issue 373 -50 - - - -323 - - - Private placement 776 432 20 - - - - - 1 228 Issue costs - -16 - - - - - - -16 Grants from endowment fund - - - - -41 - - - -41 Price adjustment own equity certificates - - - - - 8 - - 8 Dividend 2008, finally resolved 2009 - - - - - -75 - - -75 Profit after tax - - - 220 159 505 58 - 942 Estimate deviation after tax on pension schemes - - - -45 - -57 - - -102 Total income statement items recorded against equity - - - -45 - -57 - - -102 Total profit - - - 175 159 448 58 - 840 Equity s at 31.12.2009 3 014 458 20 2 241 240 971 127 - 7 071 Turnover of own equity certificates 6 -1 - - - 7 - - 12 Issue Kvinnherad Sparebank 152 161 35 - - - - - 348 Private placement with employees 8 8 - - - - - - 16 Issue costs - -1 - - - - - - -1 Grants from endowment fund - - - - -65 - - - -65 Corrections - - - - - 2 - - 2 Dividend 2009, finally resolved 2010 - - - - - -212 - - -212 Profit after tax - - - 250 197 765 -86 - 1 126 Estimate deviation after tax on pension schemes - - - -14 - -22 - - -36 Financial assets held for sale - - - - - - 2 - 2 Total income statement items recorded against equity - - - -14 - -22 2 - -34 Total profit - - - 236 197 743 -84 - 1 092 Equity as at 31.12.2010 3 180 625 55 2 477 372 1 511 43 - 8 263 Grants from endowment fund - - - - -79 - - - -79 Corrections - - - - - -1 - - -1 Dividend 2010, finally resolved in 2011 - - - - - -336 - - -336 Profit after tax - - - 339 - 597 - - 936 Estimate deviation after tax on pension schemes - - - -77 - -132 - - -209 total income statement items recordedagainst equity - - - -77 - -132 - - -209 total profit - - - 262 - 465 - - 727 equity as at 31.12.2011 3 180 625 55 2 739 293 1 639 43 - 8 574
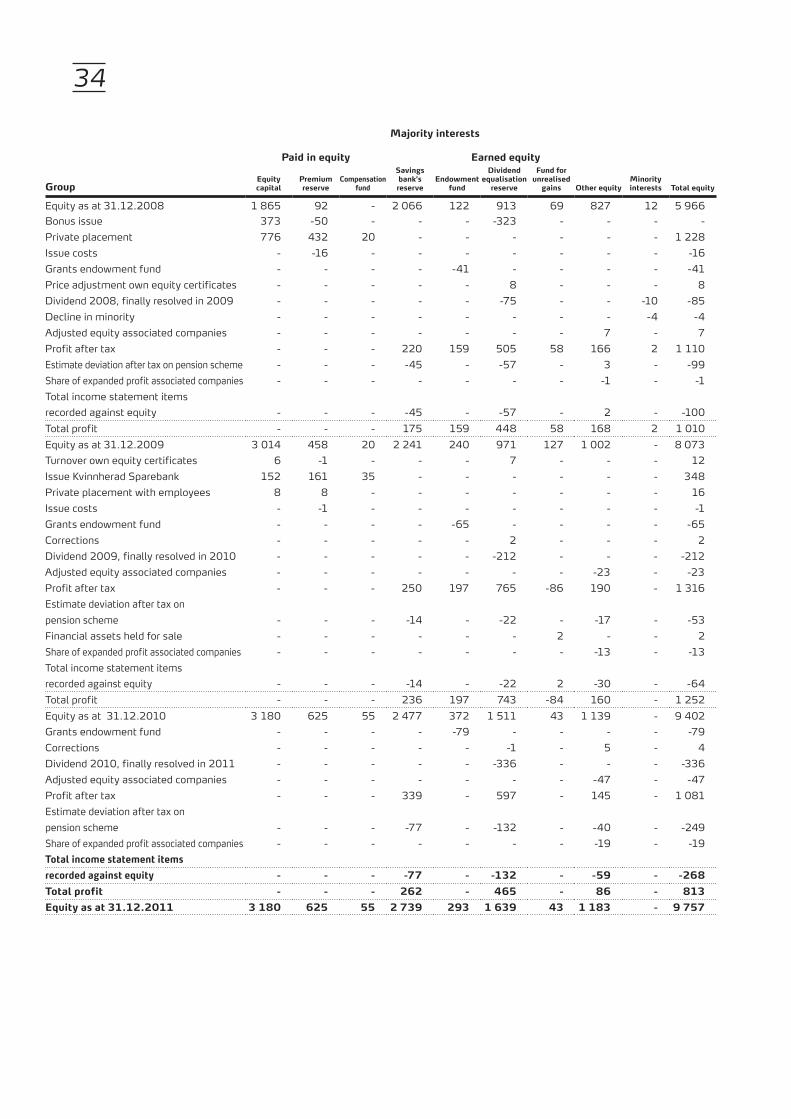
34
Majority interests
Paid in equity earned equity
groupequity capital
Premium reserve
compensation fund
savings bank's reserve
endowment fund
dividend equalisation
reserve
fund for unrealised
gains Other equityMinority interests total equity
Equity as at 31.12.2008 1 865 92 - 2 066 122 913 69 827 12 5 966 Bonus issue 373 -50 - - - -323 - - - - Private placement 776 432 20 - - - - - - 1 228 Issue costs - -16 - - - - - - - -16 Grants endowment fund - - - - -41 - - - - -41 Price adjustment own equity certificates - - - - - 8 - - - 8 Dividend 2008, finally resolved in 2009 - - - - - -75 - - -10 -85 Decline in minority - - - - - - - - -4 -4 Adjusted equity associated companies - - - - - - - 7 - 7 Profit after tax - - - 220 159 505 58 166 2 1 110 Estimate deviation after tax on pension scheme - - - -45 - -57 - 3 - -99 Share of expanded profit associated companies - - - - - - - -1 - -1 Total income statement itemsrecorded against equity - - - -45 - -57 - 2 - -100 Total profit - - - 175 159 448 58 168 2 1 010 Equity as at 31.12.2009 3 014 458 20 2 241 240 971 127 1 002 - 8 073 Turnover own equity certificates 6 -1 - - - 7 - - - 12 Issue Kvinnherad Sparebank 152 161 35 - - - - - - 348 Private placement with employees 8 8 - - - - - - - 16 Issue costs - -1 - - - - - - - -1 Grants endowment fund - - - - -65 - - - - -65 Corrections - - - - - 2 - - - 2 Dividend 2009, finally resolved in 2010 - - - - - -212 - - - -212 Adjusted equity associated companies - - - - - - - -23 - -23 Profit after tax - - - 250 197 765 -86 190 - 1 316 Estimate deviation after tax onpension scheme - - - -14 - -22 - -17 - -53 Financial assets held for sale - - - - - - 2 - - 2 Share of expanded profit associated companies - - - - - - - -13 - -13 Total income statement itemsrecorded against equity - - - -14 - -22 2 -30 - -64 Total profit - - - 236 197 743 -84 160 - 1 252 Equity as at 31.12.2010 3 180 625 55 2 477 372 1 511 43 1 139 - 9 402 Grants endowment fund - - - - -79 - - - - -79 Corrections - - - - - -1 - 5 - 4 Dividend 2010, finally resolved in 2011 - - - - - -336 - - - -336 Adjusted equity associated companies - - - - - - - -47 - -47 Profit after tax - - - 339 - 597 - 145 - 1 081 Estimate deviation after tax onpension scheme - - - -77 - -132 - -40 - -249 Share of expanded profit associated companies - - - - - - - -19 - -19 total income statement itemsrecorded against equity - - - -77 - -132 - -59 - -268 total profit - - - 262 - 465 - 86 - 813 equity as at 31.12.2011 3 180 625 55 2 739 293 1 639 43 1 183 - 9 757

35casH fLOw stateMent(figures in NOK million)
Parent bank group2009 2010 2011 Note 2011 2010 2009
1 215 1 414 1 314 Profit before tax 1 495 1 614 1 432 - - - Income from ownership interests 24 -209 -267 -298
Changes in pension liabilities over - - -185 income statement 33 -224 - -
-8 -8 - Gain on disposal of non-financial assets 27 - -10 -8 65 62 68 Write-down of non-financial assets 27, 28 80 72 69
333 187 121 Losses on loans 15 139 234 368 -9 -221 -291 Taxes paid 11 -307 -223 -22
1 596 1 434 1 027 cash flow from operations 974 1 420 1 541
6 695 -11 846 4 779 Change in gross lending to customers 13 4 424 -12 319 6 598 Change in receivables from credit
84 242 -5 institutions 12 317 134 26 829 6 427 3 275 Change in deposits from customers 30 3 272 6 434 1 286
Change in debt to Norwegian authorities 7 396 - -1 437 relating to covered bond scheme -1 437 - 7 396
-2 318 -1 493 -2 576 Change in debt to credit institutions 12 -2 577 -1 493 -2 318 -13 468 3 822 -1 110 Change in certificates and bonds 19 -1 108 3 840 -13 451
-2 313 1 285 -505 Other accruals -412 1 438 -2 042 -1 499 -129 3 448 a net change in liquidity from operations 3 453 -546 -964
-67 -119 -82 Investments in tangible fixed assets 27 -103 477 -686 16 10 - Proceeds from sale of tangible fixed assets 27 - 10 16
-1 294 -415 -876 Change in shares and ownership interests 21,24 -861 -594 -1 209 -1 345 -524 -958 b net change in liquidity from investments -964 -107 -1 879
3 029 10 756 2 032 Debt raised by issuance of securities 31 2 032 10 756 3 029 -7 789 -9 427 -6 350 Redemption – issuance of securities -6 350 -9 427 -7 789
786 - 1 750 Subordinated loan capital raised 34 1 750 - 786 -641 - -783 Repayment – subordinated loan capital 34 -783 - -641
1 228 160 - Issue equity capital certificates 36 - 160 1 228 -75 -212 -336 Dividend to equity capital certificate holders -336 -212 -75
-3 462 1 277 -3 687 c net change in liquidity from financing -3 687 1 277 -3 462
-6 306 624 -1 197 a + b + c net change in liquidity for the year -1 198 624 -6 305
7 260 954 1 578 Cash and cash equivalents 1 January 1 586 962 7 267 954 1 578 381 Cash and cash equivalents 31 December 388 1 586 962
-6 306 624 -1 197 net change in liquid capital for the year -1 198 624 -6 305
specification of liquid holdings 781 1 235 263 Cash and balances with central banks 263 1 235 781 173 343 118 Deposits with credit institutions at call 125 351 181 954 1 578 381 Liquid holdings 31.12. 388 1 586 962
The liquid holdings include cash and balances with central banks, and the share of loans and deposits with credit institutions that refer to pure placements in credit institutions. The cash flow statement shows how the Parent bank and the Group generated liquid assets and how these were applied. In all, liquid holdings in the Group rose by NOK 1 198 million in 2011.

36nOte 1 generaL infOrMatiOnSpareBank 1 SR-Bank Group comprises the parent bank, SpareBank 1 SR-Bank (”the bank”), and its subsidiaries SpareBank 1 SR-Finans AS, EiendomsMegler 1 SR-Eiendom AS, SR-Investering AS, SR-Forretningsservice AS, SR-Forvaltning AS, Kvinnherad Sparebank Eigedom AS and the subsidiaries’ subsidiary EiendomsMegler 1 Drift AS. The former subsidiary EiendomsMegler 1 Sunnhordland AS was merged with EiendomsMegler 1 SR-Eiendom with effect from 1 September 2011.
As at 31 December 2011, the bank owns 34.3 per cent of SpareBank 1 Boligkreditt AS and 30.7 per cent of SpareBank 1 Næringskreditt AS. The Group treats these as associated companies.
The bank also has a 19.5 per cent stake in SpareBank 1 Gruppen AS, owns 19.5 per cent of Bank 1 Oslo Akershus AS, 23.5 per cent of BN Bank ASA and 17.7 per cent of the alliance cooperation SpareBank 1 DA. These shareholdings are dealt with as joint ventures.SpareBank 1 SR-Bank, SpareBank 1 SMN, SpareBank 1 Nord-Norge and Samarbeidende Sparebanker AS each own 19.5 per cent of Sparebank 1 Gruppen AS and Bank 1 Oslo Akershus AS. The other owners are Sparebanken Hedmark (12.0 per cent) and The Norwegian Confederation of Trade Unions (LO) (10.0 per cent). The management structure for the SpareBank 1 cooperation is regulated by an agreement between the owners. SpareBank 1 SR-Bank and SpareBank 1 Nord-Norge each own 23.5 per cent of BN Bank ASA. SpareBank 1 SMN owns 33.0 per cent while Samarbeidende Sparebanker AS owns 20.0 per cent. The management structure of BN Bank ASA is governed by an agreement between the owners.
The bank’s registered head office is in Stavanger, and has 53 offices in Rogaland, Vest-Agder, Aust-Agder and Hordaland. Some of the offices are co-located with EiendomsMegler 1 SR-Eiendom AS. All of the subsidiaries have their head offices in Stavanger.
SpareBank 1 SR-Bank was a savings bank through to 31.12.2011, but was converted into a public limited company from 1 January 2012. Please refer to note 42 regarding the conversion.
The Group’s core activities are sales and brokering of financial products and services, as well as leasing and real estate brokering.
The General Meeting adopted the Group’s accounts on 29 March 2012. The General Meeting is the bank’s highest body.
nOte 2 accOunting PrinciPLes
basis fOr PreParatiOn Of tHe accOunts fOr tHe YearThe parent bank’s and the Group’s accounts for 2011 for SpareBank 1 SR-Bank (”the Group”) have been prepared in
accordance with International Finance Reporting Standards (IFRS) as adopted by the EU. This includes interpretations from the International Financial Reporting Interpretations Committee (IFRIC) and its predecessor the Standing Interpretations Committee (SIC).
The consolidated Group accounts for SpareBank 1 SR-Bank have been prepared in accordance with IFRS since 1 January 2005. These standards could only be applied to the savings bank’s accounts with effect from 1 January 2007. Hence, the financial statements for 2011 are presented according to IFRS for both the parent bank and the Group.
The basis for both the parent bank’s accounts and the consolidated accounts is historical costs with the following modifications: financial derivatives, financial assets and financial liabilities are recorded at fair value with changes in value through profit or loss. The preparation of the accounts in accordance with IFRS calls for the use of estimates. Furthermore, the application of the international reporting standards calls for management to exercise discretion. Areas that involve a great deal of discretionary estimates, a high degree of complexity, or areas where assumptions and estimates are significant for the parent bank’s and the Group’s accounts are described in note 4.
The annual accounts are presented in accordance with IFRS and interpretations that are obligatory for accounts presented as at 31 December 2011. The annual accounts are presented under the going concern assumption.
The following standards have been implemented in the accounts for 2011:
• IAS 24 Related parties disclosure. There are significant amendments and clarifications in the definition of related parties. The change has resulted in more extensive notes for information on related parties.
• IFRS 7 Financial Instruments - Disclosure. There was an easing of the requirements for note disclosures about credit risk.
• IAS 19 Employee Benefits was amended in June 2011. The amendments mean that all actuarial gains and losses are recognised in extended profit and loss account. This has no effect on the company’s accounts as estimate deviations have been recognised in the extended accounts since the implementation of IFRS.
The following standards, interpretations and amendments are obligatory for accounts that start on 1 January 2009 or later, but are not considered relevant for the 2011 accounts:
• IFRS 9 Financial Instruments regulates the classification, measurement and accounting of financial assets and financial liabilities. IFRS 9 was published in November 2009 and October 2010, and replaces those parts of IAS 39 which deal with accounting, classification and measurement of financial instruments. Under IFRS 9, financial assets are divided into two categories based on the measurement
37method: those that are measured at fair value and those measured at amortised cost. Classification assessment takes place at the time of the initial recognition. The classification will depend on the company’s business model for dealing with its financial instruments and the characteristics of the contractual cash flows generated by the instrument. For financial liabilities, the requirements are generally the same as for IAS 39. The main change, in cases where the company has chosen the fair value of financial liabilities, is that the part of a change in fair value due to changes in the company’s own credit risk are recognised in the extended accounts instead of income statement, if this does not involve accrual errors in measuring the profit. The Group plans to apply IFRS 9 when the standard comes into force and is approved by the EU. The standard is effective for accounting periods beginning on or after 1.1.2015.
• IFRS 10 Consolidated Financial Statements is based on the current principles of using the control concept as the key criterion for determining whether a company should be included in the consolidated financial statements of the parent company. The standard provides expanded guidance on determining whether control exists in cases where this is difficult. The Group has not considered all the possible consequences of IFRS 10. The Group plans to apply the standard for accounting periods beginning on 1.1.2013 and later.
• IFRS 12 Disclosures of Interest in Other Entities contains disclosure requirements for financial interests in subsidiaries, joint ventures, associated companies, special purpose entities (SPE) and other companies not recognised in the balance sheet. The Group has not considered the full impact of IFRS 12. The Group plans to apply the standard for accounting periods beginning 1.1.2013 and later.
• IFRS 13 Fair Value Measurement defines what is meant by fair value when the term is used in IFRS, provides a unified description of how fair value should be determined by IFRS, and defines what additional information is to be provided when fair value is used. The standard does not expand the scope of accounting at fair value, but provides guidance on the application method in which the use is already required or permitted by other IFRSs. The Group applies fair value as the measurement criterion for certain assets and liabilities. The Group has not considered the full impact of IFRS 13. The Group plans to (pre) apply IFRS 13 for accounting periods beginning on 1.1.2012 and later.
Otherwise, no other IFRSs and IFRIC interpretations not yet in force are expected to have a material impact on the accounts.
PresentatiOn currencYThe presentation currency is Norwegian kroner (NOK), which is also the Group’s functional currency. All figures are in NOK million unless otherwise stated.
subsidiariesIn the parent bank’s accounts, subsidiaries’ assets are valued in accordance with the cost method of accounting. Investments are
assessed at the acquisition cost of the shares assuming that no write-down has been necessary.
Dividends, group contribution and other distributions are taken to income in the year that they are resolved by the general meeting. If the dividend/group contribution exceeds the share of the retained profit after the acquisition, the excessive amount represents a repayment on invested capital, but pursuant to the amendment of IAS 27 is taken to income in the year that it is paid.
cOnsOLidatiOnThe Group accounts include all the subsidiaries. Subsidiaries are defined as units in which the Group has a decisive influence on the entity’s financial and operational strategy, normally through direct or indirect ownership of more than half of the voting capital. When deciding whether there is a decisive influence, the effect of potential voting rights that can be exercised or converted on the balance sheet date is included. Subsidiaries are consolidated from the date the bank has taken over control and are no longer consolidated from the date the bank relinquishes control.
The purchasing method is applied when recording the acquisition of subsidiaries. On acquisition of control of an enterprise (business combination), all identifiable assets and liabilities are recognised at fair value in accordance with IFRS 3. A positive difference between the fair value of the purchase price and fair value of identifiable assets and liabilities is carried as goodwill, while any negative difference (badwill) is recorded as income at the time of the acquisition. The Group has not applied IFRS 3 retrospectively to business combinations that were carried out prior to 1.1. 2004.
Intra-group transactions, intra-company balances and realised and unrealised profit between Group companies are eliminated. The accounting principles applied to the subsidiaries are changed when this is necessary to ensure consistency in the Group’s accounting principles.
The minority interests’ share of the Group’s profit is presented on a separate line in the income statement under profit after tax. Their share of the equity is shown as a separate item.
assOciated cOMPaniesAssociated companies are entities in which the Group has a significant interest but not control. Normally, significant influence arises when the Group has a stake of between 20 and 50 per cent of the voting capital. Associated companies are recorded in accordance with the cost method of accounting in the company’s accounts and the equity method in the Group accounts.
In the Group accounts, new investments are recorded at acquisition cost. Investments in associated companies include goodwill/badwill identified at the time of the acquisition, reduced by any possible later write-downs. The Group’s share of profits or losses in associated companies are recorded and added to the book value of the investments, together with the share of unrecognised changes in equity.
38JOint VenturesJoint ventures can be jointly owned operations, jointly controlled assets or jointly controlled enterprises. Joint control implies that the Group, by agreement, exercises control together with other participants. Jointly controlled enterprises are dealt with in accordance with the cost method of accounting in the company’s accounts and the equity method in the Group accounts.
LOans and LOsses On LOansLoans with floating interest rates are measured at amortised cost in accordance with IAS 39. Amortised cost is acquisition cost minus repayments on the principal takes into account transaction costs, plus or minus cumulative amortisation using the effective interest method, less any amount for impairment in value or exposure to loss. The effective interest is the interest that exactly discounts estimated future cash receipts and payments over the expected life of the financial instrument.
Fixed interest loans to customers are earmarked upon initial recognition at fair value, with value changes through profit or loss, in accordance with IAS 39.9. Gains and losses resulting from changes in fair value are recorded through profit or loss as a change in value. Earned interest and premiums/discounts are recorded as interest. The interest risk inherent in fixed interest loans is managed by way of operational interest rate swaps that are recorded at fair value. The bank uses the fair value option for measuring fixed interest loans, as this largely will eliminate inconsistency in measuring other instruments Groups in the balance sheet.
assessMent Of iMPairMent Of financiaL assetsOn each balance sheet date, the Group assesses whether there is any objective evidence that the expected cash flow when initially recording the item will not be realised and that the value of the financial asset or group of financial assets has been reduced. An impairment in value of a financial asset assessed at amortised cost or group of financial assets assessed at amortised cost has been incurred if, and only if, there is objective evidence of impairment that can result in a reduction in future cash flows to service the commitment. The impairment must be the result of one or more events that have occurred after the initial recognition (a loss event) and it must be possible to measure the result of the loss event (or events) in a reliable manner. Objective evidence that the value of a financial asset or group of financial assets has been reduced includes observable data that is known to the Group relating to the following loss events:• Significant financial difficulty for the issuer or borrower• Breach of contract, such as a default or delinquency in
payment of instalments and interest• The bank granting the borrower special terms on the basis of
financial or legal reasons relating to borrower’s financial situation
• Likelihood of the debtor entering into debt negotiations or other financial reorganisation
• Disappearance of an active market for the financial asset because of financial difficulties
• Observable data indicating that there is a measurable decline in future cash flows from a group of financial assets since the initial recognition of those assets, even though the decline cannot yet be fully identified with the individual financial assets in the Group including: – adverse changes in the payment status of the borrowers in
the group – national or local economic conditions that correlate with
defaults of the assets in the group
The Group first considers whether there is individual objective evidence of impairment of financial assets that are significant individually. For financial assets that are not individually significant, the objective evidence of impairment is considered individually or collectively. If the Group decides that there is no objective evidence of impairment of an individually assessed financial asset, significant or not, the asset is included in a portfolio of financial assets with the same credit risk characteristics. The group is tested for any impairment on a portfolio basis. Assets that are tested individually for impairment and where impairment can be identified or is still identified are not included in the portfolio assessment of impairment. See note 4.
If there is objective evidence that impairment has occurred, the amount of the loss is calculated as the difference between the asset’s book (carrying) value and the present value of estimated future cash flows (excluding future credit losses that have not been incurred) discounted at the financial asset’s latest effective interest rate. The book value (carrying value) of the asset is reduced using an allowance account and the loss is recorded in the income statement.
Future cash flows from a group of financial assets that are tested for impairment on a portfolio basis are estimated on the basis of the contractual cash flows for the group and historical losses on assets with a similar credit risk. Historical losses are adjusted for existing observable data in order to take into account the effects of existing circumstances that were not present at the time of the historical losses and to adjust for the effect of earlier circumstances that do not exist today.
cOMPLeX financiaL instruMentsIn the case of structured capital-guaranteed products, gains, including subscription costs and possible structuring gains, are recorded as day 1 gains. Structuring gains are calculated by discounting the Group’s future receivables (option premium) and liabilities (guaranteed capital) using the swap curve. The Group no longer offers these products.
nOn-PerfOrMing cOMMitMents/dOubtfuL LOansThe total commitment to a customer is considered to be in default (non-performing) and included in the Group’s summaries of defaulted loans when an instalment or interest is not paid 90 days after due date or a line of credit is overdrawn for 90 days or more. Loans and other commitments that are not in default, but where the customer’s financial situation makes it likely that the Group will incur a loss, are classified as doubtful loans.
39reaLised LOssesWhen it is highly probable that the losses are final, the losses are classified as realised losses. Realised losses that are covered by earlier specific loss provisions are recorded against the provisions. Realised losses without cover by way of loan loss provisions and over or under coverage in relation to previous loan loss provisions are recognised in profit or loss.
rePOssessed assetsAs part of the handling of non-performing loans and guarantees, the Group acquires, in some cases, assets that have been lodged as collateral security for such commitments. At the time of takeover, the assets are valued at their assumed realisation value and the value of the loan commitment is adjusted accordingly. Repossessed assets that are to be realised are classified as holdings or fixed assets held for sale and recorded in accordance with the relevant IFRS standards (normally IAS 16, IAS 38, IAS 39 or IFRS 5).
LeasesFinancial leases are recorded in the balance sheet under the main item ”Gross loans to customers” in the balance sheet and recognised in accordance with the amortised cost principle. All fixed income during the expected term of the lease is included when calculating the lease’s effective interest.
The Group has no sale and lease back contracts covering property, plant and equipment.
securitiesSecurities comprise shares and units, commercial paper and bonds. Shares and units are recognised either as held for sale or at fair value with change in value through profit or loss. Commercial papers and bonds are classified either as held for sale, at fair value with value change through profit or loss, as held to maturity or as a receivable. The Group uses the price on the trade date upon initial recognition of securities. All financial instruments that are classified as held for sale or at fair value with value change through profit or loss, are measured at fair value, and changes in the value from the opening balance are recorded as income from financial investments. The Group is of the opinion that financial instruments classified at fair value with value change through profit or loss provide more relevant information about the values in these items in the balance sheet than if they were assessed at amortised cost. The financial instruments included in this category are regularly reported and managed based on fair value.Certificates and bonds that are classified as held to maturity or as a receivable are measured at amortised cost using an effective interest method. See description of this method in the section on loans.
In conjunction with the extraordinary and negative developments in the world’s financial markets in the 3rd quarter of 2008, the IASB adopted on 13 October 2008 amendments to IAS 39 Financial instruments – Recognition and measurement and IFRS 7
Financial instruments - Disclosure. The amendments were approved by the EU on 15 October 2008 and adopted by the Norwegian Ministry of Finance through a regulation dated 16 October 2008. The amendments resulted in permission, under certain conditions, to reclassify financial assets in the categories held for sale at fair value with change in value through profit or loss and available for sale to the categories held to maturity, and loans and receivables with effect from 1 July 2008. The bank chose to make use of this option.
Instruments that are traded in an active market where observable market prices usually exist were reclassified to the category held to maturity, whilst instruments where market prices do not exist and the value is normally determined based on alternative valuation methods, were reclassified to the category loans and receivables. The reclassification called for a reversal of unrealised losses at the time of reclassification. The reversed amount is amortised over the individual instrument’s remaining term and is included in the line interest income/interest expenses.The reclassification is carried out based on major and abnormal fluctuations that have arisen owing to the turbulent financial markets. The bank has traditionally deposited a large part of the portfolio in Norges Bank and held these bonds to maturity. These bonds have generally had extremely high creditworthiness and therefore, in the bank’s opinion, abnormal price fluctuations have adversely affected the result in the period. The bank is both willing and able to hold the reclassified portfolio to maturity.
deriVatiVes and HedgingDerivatives comprise currency and interest rate instruments as well as instruments linked to structured products. Derivatives are recognised at fair value through profit or loss.
The Group uses derivatives for hedging purposes to minimise the interest rate risk inherent in fixed interest instruments (bonds and commercial papers). The efficiency of the hedging is assessed and documented both when the initial classification is made and on an on-going basis. In the case of complete hedging, both the hedging instrument and the hedged object are recognised at fair value, and changes in these values compared to the opening balance are recorded in the income statement. See note 20 for further information.
gOOdwiLL/badwiLLGoodwill is the positive difference between the cost of acquiring a business and the fair value of the bank’s share of the net identifiable assets in the business at the time of acquisition. Goodwill on the acquisition of subsidiaries is classified as intangible assets. Goodwill on the acquisition of shares in associated companies and joint ventures is included in the investment and tested for depreciation as part of the book (carrying) value of the investment. Goodwill is not amortised, but is subject to an annual impairment test with a view to ascertaining any impairment in value, pursuant to IAS 36. When assessing any impairment, the assessment is carried out at the lowest level where it is possible to identify cash flows. Any write-down of goodwill is not reversible.

40In those cases where the cost of acquiring a business is lower than the fair value of the bank’s share of net identifiable assets at the time of acquisition, so-called badwill, the difference is immediately recorded as income and included in income from ownership interests.
tangibLe fiXed assetsFixed assets comprise buildings, plots of land and operating equipment. Buildings and operating equipment are recognised at cost less depreciation and write-downs. Plots of land are recorded at cost price less write-downs. The cost price includes all direct costs related to the acquisition of the asset. Depreciation is on a straight-line basis in order to allocate the cost price, less possible residual value, over the useful life of the operating equipment.
Plots of land, buildings or sections of buildings owned by the Group with rental income and/or capital gains in mind are classified as investment properties. In the case of buildings where the Group uses a significant part for its own operations, no part of the property is dealt with as an investment property, even though a minor part is rented out. The bank has elected to recognise investment properties in accordance with the cost method of accounting.
actiVities tO be sOLdThese items in the balance sheet are the Group’s activities that are resolved sold. The items include assets and liabilities relating to repossessed properties and property companies that are to be syndicated and disposed of by selling parts to customers. The items are recognised at fair value.
fundingFunding is initially recorded at the cost at which it is raised, which is fair value of the proceeds received after deducting transaction costs. Loans raised with floating interest are thereafter measured at amortised cost, and any discount/premium is accrued over the term of the loan. Fixed interest funding is assessed at fair value with discounting according to the applicable interest curve, though not taking into account changes in credit spreads and transaction costs. The Group applies the fair value option when measuring fixed interest loans, since this largely eliminates inconsistency in measuring of comparable instruments in the balance sheet. The same applies to derivatives on the liability side. Deposits from customers are assessed at amortised cost.
PensiOnsCurrently, Sparebank 1 SR-Bank has two types of pension schemes.
defined benefits schemesAll Group companies have pension schemes linked to the Group’s own pension fund. The agreements are secured through payments to the pension fund, and are determined by periodic calculations carried out by an actuary. A defined benefit plan is a pension scheme that entitles the insured to a defined future benefit on reaching retirement age, normally fixed by factors such as age, number of years of service and salary. The liability recorded in the balance sheet in respect of a defined benefit plan is the present
value of the defined liability reduced by the fair value of pension assets. Independent actuaries calculate the liability relating to the defined benefit plan annually. The present value of future defined benefits is calculated by discounting future payments using the interest rate for Norwegian government bonds adjusted for differences in maturity dates.
With effect from 2005, IAS 19 allowed for recording actuarial gains and losses (estimate deviations) directly against equity. The Group has elected to apply this principle.
The defined benefits plan was closed for new members with effect from 1 April 2011.
defined contribution schemeIn the case of defined contribution plans, the company pays a contribution to an insurance company. The company has no further payment obligations after the subscriptions have been paid. The subscriptions are recorded as a wage cost. Any pre-paid subscription is recorded as an asset (pension asset) to the extent that the subscription can be refunded or reduces future subscription payments.
cOntingent LiabiLitiesThe Group issues financial guarantees as part of its ordinary business. Gross latent liability is set out in note 32. The assessment of losses is part of the assessment of losses on loans, and follows the same principles and is reported together with these, cf. note 15. Provisions are made for other contingent liabilities if it is probable that a liability will materialise and the financial consequences of this can be reliably calculated. Information is given on contingent liabilities that do not satisfy the criteria for balance sheet recording if they are significant.
Allocations for restructuring costs are made when the Group has a contractual or legal obligation.
subOrdinated LOans and tier i PerPetuaL bOnds (HYbrid instruMents)Subordinated loans have a lower priority than all other debt. 50 per cent of the non-perpetual subordinated loans can be regarded as core capital in the capital adequacy ratio, whilst 100 per cent of perpetual subordinated loans can be included in core capital. Subordinated loans are classified as subordinated loan capital in the balance sheet and are measured at fair value with value change through profit or loss or amortised cost in the same way as other long-term loans. The bank applies the fair value option when measuring fixed interest rate loans as this largely eliminates inconsistency in measuring comparable instruments in the balance sheet.
A Tier I perpetual bond (hybrid instrument) is a bond with nominal interest, but the Group is not obliged to pay any interest in periods when no dividend is paid and the investor cannot later claim any interest that has not been paid, i.e. interest is not accumulated. Hybrid instruments are approved as core capital elements limited upward to 15 per cent or 35 per cent of the total core capital depending on the type of hybrid instrument. The Financial

41Supervisory Authority of Norway (Finanstilsynet) can demand that hybrid instruments are written down proportionally with equity if the bank’s core capital adequacy falls below 5 per cent, or the capital adequacy falls below 8 per cent. Write-downs on hybrid instruments must be written up again before any dividend can be paid to shareholders or the equity capital is written up. Hybrid instruments are classified as subordinated loan capital in the balance sheet and are measured at fair value with changes in value through profit or loss.
diVidendDividend on equity certificates is recognised as equity in the period through to it being adopted by the bank’s General Meeting.
interest incOMe and interest eXPensesInterest income and interest expenses related to assets and liabilities that are measured at amortised cost are recorded continuously in the income statement in accordance with the effective interest rate method. The effective interest rate is the interest rate that results in the present value of the expected cash flow over the expected life of a financial asset or liability being equal to the book value (carrying value) of the respective financial asset or liability. When calculating an effective interest rate, the cash flow effect inherent in the agreement is estimated, without taking into account future impairment. The calculations take therefore into account inter alia fees, transaction costs, premiums and discounts.
If a financial asset is written down due to impairment, a new effective interest rate is calculated based on adjusted estimated cash flows.
Interest income and interest expenses on financial instruments that are measured at fair value are classified as interest income or interest expenses respectively. Other changes in value are classified as income from financial instruments.
cOMMissiOn incOMe and cOMMissiOn eXPensesCommission income and commission expenses are generally accrued in line with the delivery/receipt of a service. Fees relating to interest-bearing instruments are not recognised as commissions, but are included in the calculation of the effective interest rate and recognised accordingly in profit and loss. Advisory/consultancy fees are accrued in accordance with the agreement, typically at the time the service is delivered. The same applies to day-to-day management services. Fees and charges related to the sale or brokerage of financial instruments, properties or other investment objects that do not generate balance sheet items in the Group’s accounts, are recognised when the transaction is completed.
transactiOns and baLance sHeet iteMs in fOreign currencYTransactions involving foreign currencies are converted into Norwegian kroner using the exchange rates at the time of the transactions. Gains and losses related to completed transactions, or to the conversion of balance sheet items in foreign currencies
on the balance sheet date, are recognised through profit or loss. Gains and losses on non-monetary items are included in the income statement in the same way as the corresponding balance sheet item. The exchange rate on the balance sheet date is used when converting balance sheet items.
taXesTaxes consist of the tax payable and deferred taxes. Taxes payable are the estimated taxes on the year’s taxable profit.
Deferred taxes are accounted for by means of the liability method in accordance with IAS 12. Deferred tax assets or liabilities are calculated based on all the temporary differences, which are the differences between the book values of assets and liabilities for accounting purposes and for taxation purposes. However, no liabilities or assets are calculated for deferred taxes on goodwill that do not give a tax deduction, nor items that are recognised for the first time and do not affect the financial or taxable profit. Deferred tax assets are calculated for tax loss carry forwards. Assets with deferred tax are included only to the extent that future taxable profits are expected to make it possible to exploit the related tax benefit.
Under IFRS, the company’s wealth tax is not defined as a tax cost. This is therefore recognised as an operating expense.
segMent rePOrtingA business segment is part of an entity that is engaged in providing individual products or services that are subject to risks and returns that are different from those of other business segments. A geographic market (segment) is a part of a business that supplies products and services within a limited geographic area that is subject to risks and returns that are different from other geographic markets. As regards segment reporting, Group management is considered to be the highest decisive body. The figures in the segment reporting are based on internal reporting to Group management.
eVents after tHe baLance sHeet dateThe annual accounts are published after the Board of Directors has approved them. The Supervisory Board, the general meeting and the regulatory authorities may refuse to approve the published annual accounts subsequent to this but they cannot change them. Events occurring up to the time when the annual accounts are approved for publication involving issues that were already known on the balance sheet date will form part of the information basis for determining accounting estimates and will thus be fully reflected in the financial statements. Events that were not known on the balance sheet date will be reported if they are significant.
The annual accounts have been prepared on the assumption that the Group will continue as a going concern. In the Board of Directors’ opinion, this assumption was valid at the time the financial statements were approved for publication.
The Board’s dividend proposal is stated in the Directors’ Report and in note 43. Proposed dividends are classified as equity until they are finally resolved.

42nOte 3 financiaL risK ManageMent The banking industry’s core activity is to create values by accepting recognised and acceptable risks. SpareBank 1 SR-Bank invests, therefore, significant resources in developing risk management systems and processes in line with leading international practice.
SpareBank 1 SR-Bank is exposed to several types of risk:
• Credit risk: the risk of loss resulting from the customer’s inability or unwillingness to fulfil his obligations
• Liquidity risk: The risk that the Group is unable to refinance its debt or does not have the ability to fund increases in assets without significant additional costs
• Market risk: The risk of loss due to changes in observable market variables such as interest rates, foreign exchange rates and securities markets
• Operational risk: the risk of loss resulting from inadequate or failed internal processes or systems, human error or external events
• Ownership risk: the risk that the bank might incur negative results from its holdings in strategic companies owned and/or must provide these companies with fresh capital. Ownership is defined as companies in which SpareBank 1 SR-Bank has a substantial interest and influence
• Compliance risk: the risk that the Group incurs public sanctions/penalties or financial loss as a result of non-compliance with legislation and regulations
• Business risk: the risk of unexpected revenue and cost variations due to changes in external factors such as market conditions or government regulations
• Reputation risk: the risk of failure in earnings and access to capital because of lack of trust and reputation in the market, i.e. customers, counterparties, stock market and authorities
• Strategic risk: the risk of loss resulting from failure of strategic initiatives
Risk and capital management in SpareBank 1 SR-Bank underpins the Group’s strategic development and the achievement of its goals. Risk management ensures financial stability and prudent asset management. This is achieved through a strong organisational culture that is characterised by:
• A high awareness of risk management • A good understanding of which risks drive earnings • Striving for optimal capital utilisation within the restraints of
the adopted business strategy• Avoiding unexpected single events that can seriously
damage the Group’s financial situation• Exploiting synergies and diversification effects
In order to ensure an effective and adequate process for risk and capital management, the framework is based on a variety of elements that reflect the manner in which the Board of Directors and the management run the company. The principal elements are described below:
the group’s strategic targets: SpareBank 1 SR-Bank shall be the most attractive provider of financial services in the south and west of Norway based on:• Good customer experiences• A strong team spirit and professionalism• Local roots and decision-making power• Financial soundness, profitability and market confidence
risk identification and analysis: The process for risk identification is based on the Group’s strategic target. The process is forward-looking and covers all of the Group’s significant risk areas. In areas where the effect of the established control and management measures is not considered satisfactory, improvement measures are implemented. Probability-reducing measures shall be given priority ahead of measures aimed at reducing consequences.
capital allocation: The return on risk-adjusted capital is one of the most important strategic performance goals in the internal management of SpareBank 1 SR-Bank. This implies that capital is allocated to business areas in accordance with the calculated risk of the operation and the return on capital is monitored continually.
The Group’s risk is quantified, inter alia, through calculations of expected losses and the need for risk-adjusted capital to be able to cover any unexpected losses. Expected losses describe the loss that statistically must be expected on a portfolio over a 12-month period (long-term outcome). Risk-adjusted capital describes how much capital the Group believes it needs to cover the real risk that the Group has assumed.
The Group has decided that the risk-adjusted capital, in principle, shall cover 99.97 per cent of possible unexpected losses. In the case of ownership risk in SpareBank1 Gruppen AS the Group has elected a confidence level of 99.5 per cent as a result of the risk being, to a great extent, insurance risk with a different loss distribution. A 99.5 per cent confidence level for insurance risk is in line with the international Solvency II rules. This has been applied to statistic methods for calculating risk-adjusted capital, and qualitative assessments are also carried out.
financial projections and stress tests:, Projections of expected financial development are made for the next 5 years, based on the strategic targets and the business plan. In addition, projections are made of a situation involving a serious economic recession. To assess consequences of an economic recession on SpareBank 1 SR-Bank, the Group focuses sharply on those areas of the economy that impact the financial development. These are primarily credit demand trends, stock market performance, the interest market and changes in credit risk. In addition to having an impact on the yield of the underlying assets, an economic recession will also have an impact on the customer savings habits. The purpose of these projections is to calculate how the financial development in activities and the macro-economic situation will impact on the Group’ financial development, including the return on equity, the funding situation and capital adequacy.
43evaluation and measures: The above-mentioned financial projections provide management and the Board of Directors with sufficient understanding of the risk so that they can assess whether the Group has an acceptable risk profile, and ensure that the Group is adequately capitalised in light of the risk profile and strategic targets.
SpareBank 1 SR-Bank prepares capital plans in order to achieve long-term and effective capital management and ensure that the Group’s capital adequacy is acceptable taking into account the risk exposure. The capital plan takes into account both expected developments and a situation with a serious economic downturn over a number of years. In addition, SpareBank 1 SR-Bank prepares contingency plans to tackle such crises in the best possible manner.
reporting and follow-up: The Group’s overriding risk exposure and risk development are followed up through periodic risk reports that are submitted to the executive management and the Board of Directors. The overriding risk monitoring and reporting is the responsibility of the Department for Risk Management and Compliance, which is independent of the business units. The department reports directly to the Chief Executive Officer.
Organisation and corporate culture: SpareBank 1 SR-Bank strives to have a strong and robust corporate culture that is characterised by a high degree of awareness for risk management. The corporate culture comprises management philosophy and the people in the organisation with their personal attributes, such as integrity, basic values and ethics. It is difficult to compensate for an inadequate organisational culture by using other control and management measures. SpareBank 1 SR-Bank has established clear basic values and ethical guidelines and made the entire organisation aware of them.
SpareBank 1 SR-Bank seeks independence in its risk management and the responsibility for risk management is therefore split between various roles in the organisation.
risK eXPOsure in sParebanK 1 sr-banKSpareBank 1 SR-Bank is exposed to various types of risk and the most important risk groups are described below.
credit risk is managed through the limits for granting credit, commitment follow-up and portfolio management. The Group’s credit strategy comprises overriding credit strategy limits to ensure a diversified portfolio and a satisfactory risk profile. This limits the probability of default, expected losses, risk adjusted capital and how high the total loan exposure can be in the corporate market.
Concentration risk is defined as the risk that arises by concentrating exposure to a single customer, industry or geographic area. The Group has special focus on exposure to large individual customers and certain industries. In order to avoid undesirable concentration risk, the strategic credit limits also set restrictions linked to exposure and risk profile at portfolio level,
and for different industries and individual customers. These restrictions are additional to the limits stipulated by the Regulation regarding major commitments. The Group’s credit-political guidelines stipulate minimum requirements that apply to all types of financing, except commitments granted as part of the exercise of special credit hedging authorities. In addition to the general credit policy guidelines, a series of more specific credit policy guidelines have been prepared relating to industries or segments that might involve special risks. For example, for financing of property commitments, minimum requirements are imposed for equity, advance sales of housing projects and degree of financing in relation to rental income on rental property.
The Board of Directors is responsible for the Group’s granting of loans and credit, but delegates the responsibility to the Chief Executive Office, within certain limits. The CEO then delegates these within his own authority. The delegated authorities are linked to a commitment’s expected loss and probability of default. The authorities are personal. Credit management procedures regulate all issues related to the Group’s granting of credit and commitment follow-up in detail.
The Group uses credit models for risk classification, risk pricing and portfolio management. The risk models are based on three main components:
1. Probability of default: Customers are classified in a default class on the basis of the probability that the customer will default on his obligations during a period of 12 months, based on a long-term outcome. The probability of default is calculated based on historical data series for key financial figures linked to earnings and losses, as well as non-financial criteria such as behaviour and age. Nine default classes (A – I) are used to classify the customers according to the probability of default. In addition, the Group has two default classes (J and K) for customers with defaulted and/or written down commitments.
2. Exposure at default: This is an estimate of what the Group’s exposure will be if a customer were to default. This exposure consists of lending volume, guarantees and approved, but not drawn limits respectively. Guarantees and approved, but not drawn limits on the corporate market are multiplied by a conversion factor of 75 per cent. For the retail market, approved, but not drawn limits are multiplied by a conversion factor of 100 per cent.
3. Loss given default: This is an estimate of how much the Group can potentially lose if the customer defaults on his obligations. This estimate takes into account the value of underlying collateral security and the costs that the Group will incur in collecting defaulted commitments. The Group sets realisation values on collateral security lodged based on experience over time, and such that these, based on a conservative assessment reflect the expected realisation value in a period of recession. Seven classes (1 – 7) are used for classifying commitments in respect to loss in the event of default.
44The Group carries out continuous further development and testing of the risk management system and credit procedures to ensure that this maintains a high quality over time. The quantitative validation is to ensure that the estimates utilised for probability of default, exposure at default and loss given default maintain a sufficiently high quality. Analyses are carried out to assess the models’ ability to rank the customers according to risk (discrimination ability), and the ability to determine the correct level for the risk parameters. In addition, the stability in the models’ estimates is analysed as is the models’ cyclical sensitivity. In some cases, the quantitative validation will be supplemented by more qualitative assessments especially if the amount of statistical data available is limited.
In addition to the credit risk in the lending portfolio, the Group has credit risk through exposure in the liquidity reserve portfolio. This portfolio consists mainly of low risk bonds and certificates that qualify for loans from Norges Bank. The Group is also exposed to credit risk through the portfolio in SpareBank 1 SR-Finans AS, which consists principally of leasing and car loans. The portfolio accounts for around 5 per cent of total lending exposure.
For further information, see notes 13, 14, 16, 17 and 18.
Liquidity risk is managed through the Group’s overriding liquidity strategy that is reviewed and adopted by the Board of Directors at least once a year. Liquidity management builds on conservative limits and reflects the Group’s moderate risk profile. The Group’s Treasury Department is responsible for liquidity management, while the Department for Risk Management and Compliance monitors and reports on the utilisation of limits in accordance with the liquidity strategy.
Customer deposits and long-term securities debt principally finance the Group’s lending. Liquidity risk is restricted by the securities debt being distributed between different markets, funding sources, instruments and maturity dates. Sales of well-secured housing loans to SpareBank 1 Boligkreditt help dampen the funding needs and thus the liquidity risk that SpareBank 1 SR-Bank is exposed to. For further information please see note 38.
Market risk is managed through the market risk strategy, which defines the Group’s willingness to assume risk. The strategy, with related specifications of necessary risk ceilings, reporting procedures and authorities are reviewed and adopted by the Board at least once a year.
Market risk in SpareBank 1 SR-Bank relates primarily to the Group’s long-term investments in securities. In addition, the Group has a certain exposure to market risk from trading activities in the interest rate and currency markets, as well as from activities that underpin ordinary funding and lending activities. The Group’s market risk is measured and monitored based on conservative limits that the Board of Directors reviews and approves at least once a year. The size of the limits is determined based on stress tests and analyses of negative market movements. The Group’s exposure to market risk is moderate.
Interest rate risk is the risk of losses because of interest rate fluctuations. The Group’s interest rate risk is regulated by limits for maximum value change following a change in the interest rate level of one per cent. The interest rate commitments for the Group’s instruments are mostly short term and the Group’s interest rate risk is low.
Currency rate risk is the risk of losses due to fluctuations in foreign exchange rates. The Group measures the currency risk based on the net positions of the various currencies to which the bank is exposed. The currency risk is regulated by nominal limits for maximum aggregate currency positions and maximum positions in individual currencies. The scope of the Group’s trading in foreign currency is modest and the currency rate risk is considered moderate.
The securities risk is the risk of losses that arise following changes in the value of the Group’s bonds, commercial papers and equity capital instruments. In quantifying of risk attached to a fall in value of the liquidity portfolio, SpareBank 1 SR-Bank distinguishes between systematic risk (market risk) and unsystematic risk (default risk). Default risk is quantified as credit risk. Of the liquidity portfolio’s total holdings amounting to NOK 19.9 billion, bonds classified as held to maturity account for NOK 8.5 billion. These investments are recognised at amortised cost and are therefore not exposed to market risk from an accounting point of view. The Group’s risk exposure to this type of risk is regulated through limits for maximum investments in the different portfolios.
For further details, reference is made to notes 20, 39 and 40.
Operational risk is managed through the risk strategy for operational risk which is adopted annually be the Board and which sets ceilings for expected losses and risk-adjusted capital. The processes for management of operational risk in SpareBank 1 SR-Bank shall ensure, as far as possible, that no single incident caused by operational risk is able to damage seriously the Group’s financial position. Risk management shall be based on insight and an understanding of what create and drives the Group’s operational risk, and to the extent possible reconciles effective processes with low risk exposure.
As part of its continual development of knowhow, SpareBank 1 SR-Bank entered into a cooperation with the University of Stavanger and SpareBank 1 Alliance regarding an R&D project that will provide access to new methods and expertise in the work of managing operational risk. The project started in 2007 and is expected to be completed in 2012.
The Group has a system for reporting and monitoring undesirable incidents. In order to learn from own mistakes, and the mistakes of others, and to ensure continual focus on quality and never-ending improvement, SpareBank 1 SR-Bank uses a separate system for registering and monitoring improvement measures. This will ensure that the Group remains a potent organisation over time, by giving priority and by continually
45improving the organisation’s total ability to be innovative and to perform.
Ownership risk is managed through limits for risk-adjusted capital that are reviewed and adopted by the Board at least once a year. Ownership is defined as companies in which SpareBank SR-Bank has a significant stake and influence. Sparebank 1 SR-Bank’s principal ownership risk relates to its stakes in SpareBank 1 Gruppen AS (19.5 per cent), Bank 1 Oslo Akershus AS (19.5%), BN Bank ASA (23.5 per cent), SpareBank 1 Boligkreditt AS (34.4 per cent) and SpareBank 1 Næringskreditt AS (30.7 per cent).
compliance risk is managed through the framework regulations for compliance that are built primarily on EBA’s internal governance, Basel Committee on Banking Supervision, Compliance and the compliance function in banks, and the FSA’s Module for evaluating overriding management and control. Sparebank 1 SR-Bank’s compliance policy shall ensure that Group does not incur any public sanctions/penalties, or any financial loss, as a result of it failing to implement or comply with legislation and regulations. The Group’s compliance policy is adopted by the Board and defines the main principles for responsibility and organisation.
SpareBank 1 SR-Bank seeks to have good processes to ensure compliance with applicable laws and regulations.One of the most important areas in 2011 has been working on a new remuneration scheme for the Group. Other areas include the monitoring of compliance with money laundering regulations, technical adjustments in accordance with the specification of a license for the treatment of personal information and the authorisation system for financial advisers.
Sparebank 1 SR-Bank’s compliance function lies in the Department for Risk Management and Compliance, which is organised in such a way that it is independent of the business units. The department has the overriding responsibility for framework, following up and reporting on matters in the compliance field.

46nOte 4 criticaL estiMates and assessMents regarding tHe use Of accOunting PrinciPLes LOsses On LOans and guarantees
The Group assesses its entire corporate market portfolio annually. Large commitments, non-performing loans and high-risk exposures are subject to quarterly assessments. Loans to private customers are subject to evaluation when they are in default for more than 60 days. Large non-performing loans are evaluated on a quarterly basis.
The Group’s risk classification systems are described under financial risk management.
The Group makes write-downs if there is objective evidence that can be identified for an individual commitment, and the objective evidence entails a reduction in future cash flows for servicing the commitment. Objective evidence may be default, bankruptcy, insolvency or other significant financial difficulties.
Individual write-downs are calculated as the difference between the loan’s book (carrying) value and the present value of future cash flows based on the effective interest rate at the time of the calculation of the initial individual write-down. Subsequent changes in interest rates are taken into account for loan agreements with floating interest rates if these changes affect the expected cash flow.
Group write-downs are calculated on groups of loans where there is objective evidence indicating that a loss event has occurred after the initial recording of the loans. Objective evidence comprises observable data that result in a measurable reduction in estimated future cash flows from the loan group. The development of probability for default is one such objective evidence that is used to identify a possible need to make a write-down. Where a need to make group write-downs has been identified, losses on loans shall be calculated as the difference between the carrying value (book value) and the present value of the estimated future cash flows, discounted at the effective interest rate. The basis for calculating this difference (which corresponds to the level of the group write-downs) is based on the loans’ expected losses.
The assessment of individual and group write-downs will always call for a considerable degree of discretionary judgment. Predictions based on historical data may prove to be incorrect because of the uncertainty of the relevance of historical data as a decision-making basis. When the value of assets pledged as collateral is linked to special objects or industrial sectors in a crisis, it may be necessary to realise the collateral in markets that are rather illiquid and, therefore, the assessment of collateral securities’ values may be subject to considerable uncertainty.
fair VaLue Of eQuitY interestsFinancial assets assessed at fair value through profit or loss will normally be traded in active markets and the fair value can thus be determined with reasonable certainty. For assets classified as held for sale, this is not necessarily the case. Similarly, market values for assets and liabilities that are recognised at amortised cost and
appear in notes may be estimates based on discounted expected future cash flows, multiplier analyses or other calculation methods. Such methods can be subject to significant uncertainty. With the exception of a few shares, liquidity in the Norwegian stock market is poor. Share prices will under most circumstances be the last known traded price.
fair VaLue Of deriVatiVesThe fair value of derivatives is usually determined by using valuation methods where the price of the underlying object, for example, interest and currency rates, is obtained from the market. In the case of share options, volatility will be either observed implicit volatility or calculated volatility based on historical share price movements for the underlying object. If the Group’s risk position is relatively neutral, middle rates will be used. A neutral risk position means, for example, that the interest rate risk within a re-pricing interval is approximately zero. Otherwise, the relevant purchase or sales price is used to assess the net position. For derivatives where the other party has a weaker credit rating than the Group, the price will reflect the underlying credit risk. To the extent that market prices are obtained from transactions with a lower credit risk, this will be taken into account by amortising the original price difference measured against such transactions with a lower credit risk over the maturity period.
PensiOnsNet pension liabilities and the pension expenses for the year are based on a number of estimates, the most important of which are the yield on pension assets, future interest and inflation rates, future wage development, staff turnover, development in the Norwegian National Insurance base amount (G) and the general development in the number of persons receiving disability benefits and life expectancy. Uncertainty is largely related to gross liabilities and not to net liabilities that are shown in the balance sheet. Changes in estimates because of changes in the above parameters will be recorded directly against equity on an on-going basis.
incOMe taXWhen calculating the Group’s income tax, a considerable degree of discretion is called for. For many transactions and calculations, uncertainty will be linked to the final tax liability. The Group records tax liabilities linked to future decisions in tax cases and disputes based on the additional tax liability that will accrue. If the final outcome of a case differs from the amount originally allocated amount, the difference will affect the recorded tax costs and allocations for deferred tax in the period the difference is established.
significant acQuisitiOnsKvinnherad Sparebank was acquired with, for accounting purposes, effect from 1 November 2010 by Sparebank 1 SR-Bank taking over all of Kvinnherad Sparebank’s assets and liabilities. See note 25.
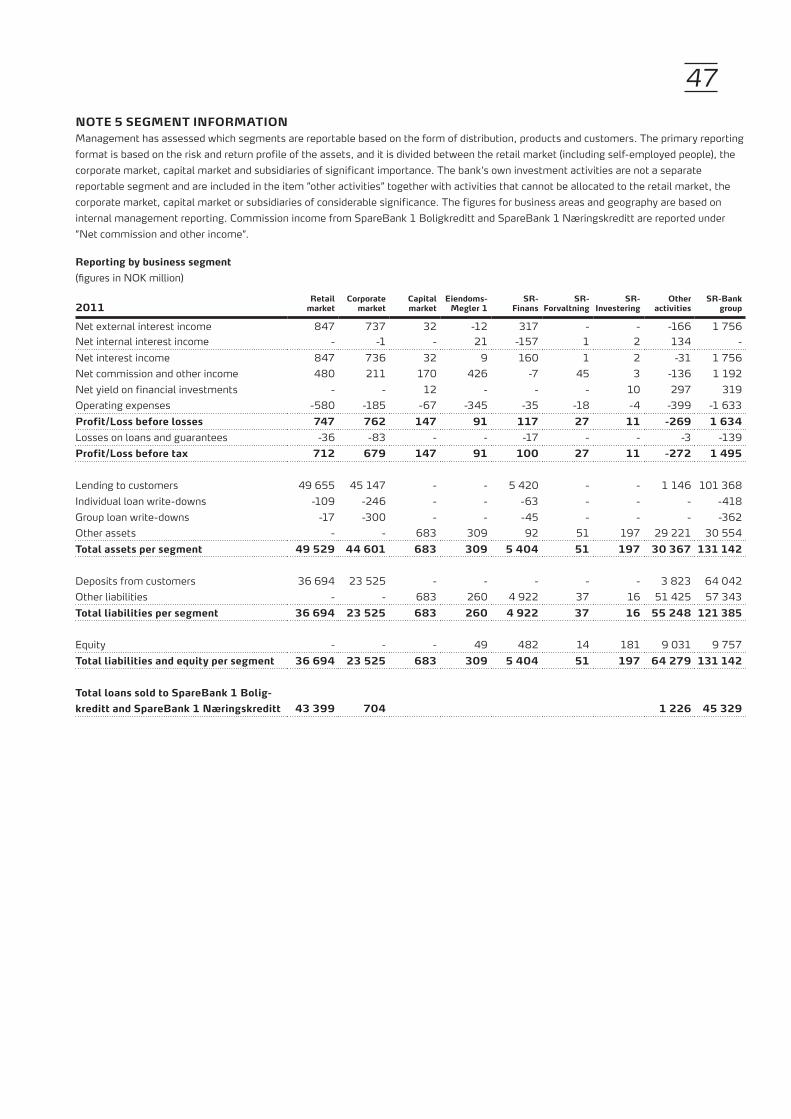
47nOte 5 segMent infOrMatiOnManagement has assessed which segments are reportable based on the form of distribution, products and customers. The primary reporting format is based on the risk and return profile of the assets, and it is divided between the retail market (including self-employed people), the corporate market, capital market and subsidiaries of significant importance. The bank’s own investment activities are not a separate reportable segment and are included in the item ”other activities” together with activities that cannot be allocated to the retail market, the corporate market, capital market or subsidiaries of considerable significance. The figures for business areas and geography are based on internal management reporting. Commission income from SpareBank 1 Boligkreditt and SpareBank 1 Næringskreditt are reported under ”Net commission and other income”.
reporting by business segment(figures in NOK million)
2011 retail market
corporate market
capital market
eiendoms- Megler 1
sr-finans
sr-forvaltning
sr-investering
Other activities
sr-bankgroup
Net external interest income 847 737 32 -12 317 - - -166 1 756 Net internal interest income - -1 - 21 -157 1 2 134 - Net interest income 847 736 32 9 160 1 2 -31 1 756 Net commission and other income 480 211 170 426 -7 45 3 -136 1 192 Net yield on financial investments - - 12 - - - 10 297 319 Operating expenses -580 -185 -67 -345 -35 -18 -4 -399 -1 633 Profit/Loss before losses 747 762 147 91 117 27 11 -269 1 634 Losses on loans and guarantees -36 -83 - - -17 - - -3 -139 Profit/Loss before tax 712 679 147 91 100 27 11 -272 1 495
Lending to customers 49 655 45 147 - - 5 420 - - 1 146 101 368 Individual loan write-downs -109 -246 - - -63 - - - -418 Group loan write-downs -17 -300 - - -45 - - - -362 Other assets - - 683 309 92 51 197 29 221 30 554 total assets per segment 49 529 44 601 683 309 5 404 51 197 30 367 131 142
Deposits from customers 36 694 23 525 - - - - - 3 823 64 042 Other liabilities - - 683 260 4 922 37 16 51 425 57 343 total liabilities per segment 36 694 23 525 683 260 4 922 37 16 55 248 121 385
Equity - - - 49 482 14 181 9 031 9 757 total liabilities and equity per segment 36 694 23 525 683 309 5 404 51 197 64 279 131 142
total loans sold to sparebank 1 bolig-kreditt and sparebank 1 næringskreditt 43 399 704 1 226 45 329
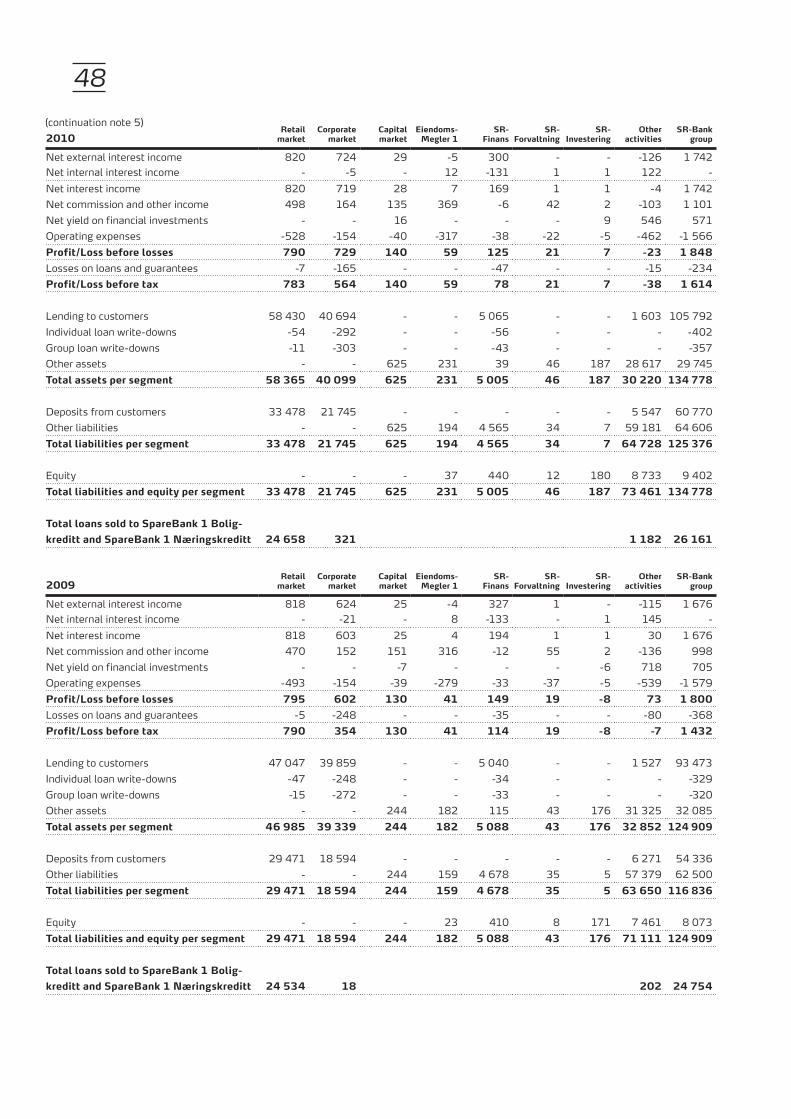
48
2010 retail market
corporate market
capital market
eiendoms- Megler 1
sr-finans
sr-forvaltning
sr-investering
Other activities
sr-bankgroup
Net external interest income 820 724 29 -5 300 - - -126 1 742 Net internal interest income - -5 - 12 -131 1 1 122 - Net interest income 820 719 28 7 169 1 1 -4 1 742 Net commission and other income 498 164 135 369 -6 42 2 -103 1 101 Net yield on financial investments - - 16 - - - 9 546 571 Operating expenses -528 -154 -40 -317 -38 -22 -5 -462 -1 566 Profit/Loss before losses 790 729 140 59 125 21 7 -23 1 848 Losses on loans and guarantees -7 -165 - - -47 - - -15 -234 Profit/Loss before tax 783 564 140 59 78 21 7 -38 1 614
Lending to customers 58 430 40 694 - - 5 065 - - 1 603 105 792 Individual loan write-downs -54 -292 - - -56 - - - -402 Group loan write-downs -11 -303 - - -43 - - - -357 Other assets - - 625 231 39 46 187 28 617 29 745 total assets per segment 58 365 40 099 625 231 5 005 46 187 30 220 134 778
Deposits from customers 33 478 21 745 - - - - - 5 547 60 770 Other liabilities - - 625 194 4 565 34 7 59 181 64 606 total liabilities per segment 33 478 21 745 625 194 4 565 34 7 64 728 125 376
Equity - - - 37 440 12 180 8 733 9 402 total liabilities and equity per segment 33 478 21 745 625 231 5 005 46 187 73 461 134 778
total loans sold to sparebank 1 bolig-kreditt and sparebank 1 næringskreditt 24 658 321 1 182 26 161
2009 retail market
corporate market
capital market
eiendoms- Megler 1
sr-finans
sr-forvaltning
sr-investering
Other activities
sr-bankgroup
Net external interest income 818 624 25 -4 327 1 - -115 1 676 Net internal interest income - -21 - 8 -133 - 1 145 - Net interest income 818 603 25 4 194 1 1 30 1 676 Net commission and other income 470 152 151 316 -12 55 2 -136 998 Net yield on financial investments - - -7 - - - -6 718 705 Operating expenses -493 -154 -39 -279 -33 -37 -5 -539 -1 579 Profit/Loss before losses 795 602 130 41 149 19 -8 73 1 800 Losses on loans and guarantees -5 -248 - - -35 - - -80 -368 Profit/Loss before tax 790 354 130 41 114 19 -8 -7 1 432
Lending to customers 47 047 39 859 - - 5 040 - - 1 527 93 473 Individual loan write-downs -47 -248 - - -34 - - - -329 Group loan write-downs -15 -272 - - -33 - - - -320 Other assets - - 244 182 115 43 176 31 325 32 085 total assets per segment 46 985 39 339 244 182 5 088 43 176 32 852 124 909
Deposits from customers 29 471 18 594 - - - - - 6 271 54 336 Other liabilities - - 244 159 4 678 35 5 57 379 62 500 total liabilities per segment 29 471 18 594 244 159 4 678 35 5 63 650 116 836
Equity - - - 23 410 8 171 7 461 8 073 total liabilities and equity per segment 29 471 18 594 244 182 5 088 43 176 71 111 124 909
total loans sold to sparebank 1 bolig-kreditt and sparebank 1 næringskreditt 24 534 18 202 24 754
(continuation note 5)
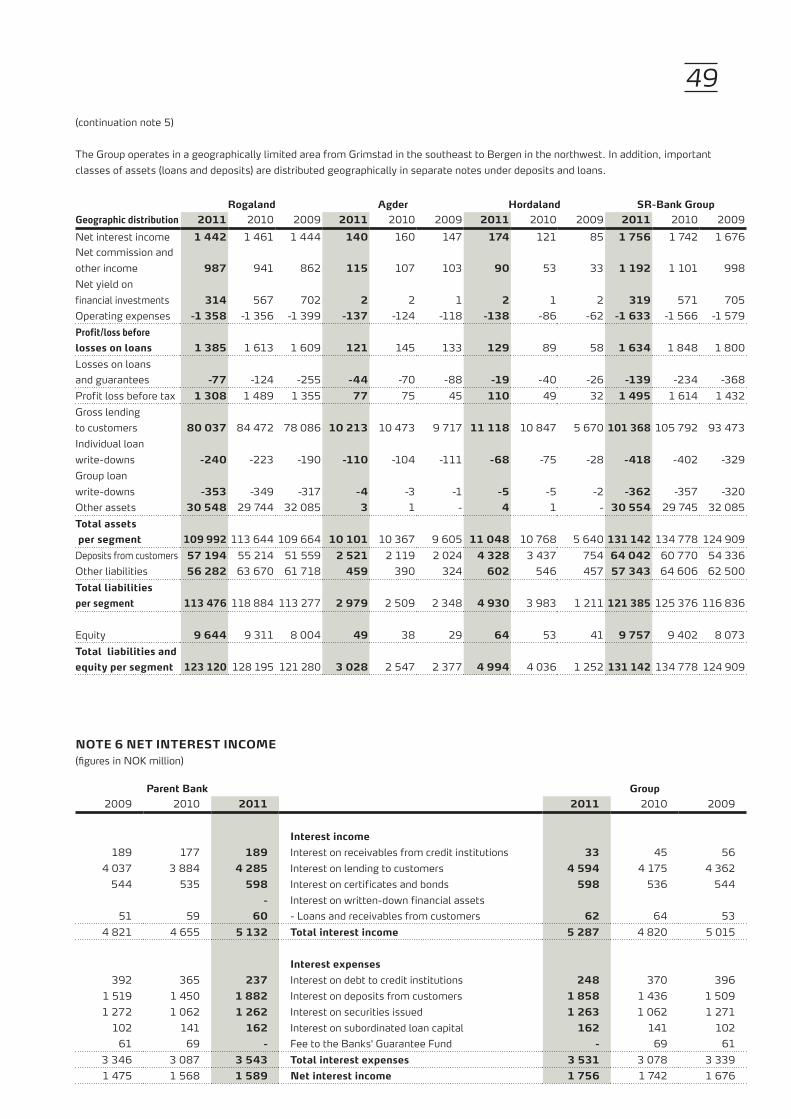
49
rogaland agder Hordaland sr-bank groupgeographic distribution 2011 2010 2009 2011 2010 2009 2011 2010 2009 2011 2010 2009Net interest income 1 442 1 461 1 444 140 160 147 174 121 85 1 756 1 742 1 676 Net commission andother income 987 941 862 115 107 103 90 53 33 1 192 1 101 998 Net yield on financial investments 314 567 702 2 2 1 2 1 2 319 571 705 Operating expenses -1 358 -1 356 -1 399 -137 -124 -118 -138 -86 -62 -1 633 -1 566 -1 579 Profit/loss beforelosses on loans 1 385 1 613 1 609 121 145 133 129 89 58 1 634 1 848 1 800 Losses on loansand guarantees -77 -124 -255 -44 -70 -88 -19 -40 -26 -139 -234 -368 Profit loss before tax 1 308 1 489 1 355 77 75 45 110 49 32 1 495 1 614 1 432 Gross lendingto customers 80 037 84 472 78 086 10 213 10 473 9 717 11 118 10 847 5 670 101 368 105 792 93 473 Individual loanwrite-downs -240 -223 -190 -110 -104 -111 -68 -75 -28 -418 -402 -329 Group loanwrite-downs -353 -349 -317 -4 -3 -1 -5 -5 -2 -362 -357 -320 Other assets 30 548 29 744 32 085 3 1 - 4 1 - 30 554 29 745 32 085 total assets per segment 109 992 113 644 109 664 10 101 10 367 9 605 11 048 10 768 5 640 131 142 134 778 124 909 Deposits from customers 57 194 55 214 51 559 2 521 2 119 2 024 4 328 3 437 754 64 042 60 770 54 336 Other liabilities 56 282 63 670 61 718 459 390 324 602 546 457 57 343 64 606 62 500 total liabilitiesper segment 113 476 118 884 113 277 2 979 2 509 2 348 4 930 3 983 1 211 121 385 125 376 116 836
Equity 9 644 9 311 8 004 49 38 29 64 53 41 9 757 9 402 8 073 total liabilities andequity per segment 123 120 128 195 121 280 3 028 2 547 2 377 4 994 4 036 1 252 131 142 134 778 124 909
(continuation note 5)
nOte 6 net interest incOMe(figures in NOK million)
Parent bank group2009 2010 2011 2011 2010 2009
interest income 189 177 189 Interest on receivables from credit institutions 33 45 56
4 037 3 884 4 285 Interest on lending to customers 4 594 4 175 4 362 544 535 598 Interest on certificates and bonds 598 536 544
- Interest on written-down financial assets 51 59 60 - Loans and receivables from customers 62 64 53
4 821 4 655 5 132 total interest income 5 287 4 820 5 015
interest expenses 392 365 237 Interest on debt to credit institutions 248 370 396
1 519 1 450 1 882 Interest on deposits from customers 1 858 1 436 1 509 1 272 1 062 1 262 Interest on securities issued 1 263 1 062 1 271
102 141 162 Interest on subordinated loan capital 162 141 102 61 69 - Fee to the Banks' Guarantee Fund - 69 61
3 346 3 087 3 543 total interest expenses 3 531 3 078 3 339 1 475 1 568 1 589 net interest income 1 756 1 742 1 676
The Group operates in a geographically limited area from Grimstad in the southeast to Bergen in the northwest. In addition, important classes of assets (loans and deposits) are distributed geographically in separate notes under deposits and loans.

50nOte 7 net cOMMissiOn and OtHer incOMe(figures in NOK million)
Parent bank group2009 2010 2011 2011 2010 2009
56 60 81 Guarantee commissions 78 57 52 13 13 14 Interbank commissions 14 13 13 34 19 22 Securities trading 18 13 28
- - - Management 68 73 57 59 83 87 Brokerage commission 56 54 37
Commission from SpareBank 1 Boligkreditt AS 146 157 87 and SpareBank 1 Næringskreditt 87 157 146
246 248 254 Money transfers 254 248 246 107 110 149 Insurance services 153 113 108
57 53 97 Other commission income 106 64 73 718 743 791 total commission income 834 792 760
6 - - Guarantee commissions - - 6 15 13 11 Interbank commissions 11 13 15 64 56 60 Money transfers 60 56 64
1 1 3 Other commission expenses - 2 2 86 70 74 total commission expenses 71 71 87
3 3 5 Operating income from real estate 5 1 2 - - - Real estate brokerage 424 369 315 8 7 - Other operating income - 10 8
11 10 5 total other operating income 429 380 325 643 683 722 net commission and other income 1 192 1 101 998
nOte 8 net incOMe frOM financiaL instruMents(figures in NOK million)
Parent bank group2009 2010 2011 2011 2010 2009
changes in value of interest rate instruments 122 11 -12 Bonds and certificates – held for sale -13 11 122 -90 48 65 Net change in value hedged fixed interest loans 65 48 -90 421 -252 -278 Net change in value hedged bond debt -278 -252 421
changes in values hedging and derivatives -6 -4 -15 Net change in values derivatives hedged against bonds (assets) -15 -4 -6
Net change in value of derivatives hedged 96 -53 -47 against fixed interest lending -47 -53 96
-377 241 274 Net change in value of derivatives hedged against bonds (debt) 274 241 -377
change in value of equity instruments 18 8 -59 Equity instruments held for sale -59 8 18 59 119 4 Equity instruments at fair value 24 127 53
total net income from financial instruments at 243 118 -68 fair value -49 126 237
- - - Realised instruments held for sale - - - - - - total net income from securities held for sale - - -
currency trading 147 131 138 Net gain foreign exchange 138 131 147
390 249 70 net income from financial instruments 89 257 384

51
bOard stateMent Of deterMinatiOn Of saLaries and reMuneratiOn Of seniOr eXecutiVes
sparebank 1 sr-bank asa’s remuneration policySparebank 1 SR-bank ASA has established a remuneration scheme that applies to all employees.
The Group’s remuneration scheme shall:• be consistent with the Group’s overall objectives, risk
tolerance and long-term interests• help to promote and provide incentives for good
management and control of the Group’s risk, discourage excessive or unwanted risk taking, and help to avoid conflicts of interest
• comply with the Regulations governing remuneration schemes in financial institutions, investment firms and management companies dated 1 December 2010
The total remuneration shall be competitive but the Group shall not be a wage leader. It shall ensure that the Group attracts, develops and retains the most competent employees over time. The scheme will ensure a reward model that is perceived to be fair, predictable and future-oriented and motivating.
decision ProcessBoard of SpareBank 1 SR-Bank ASA has established a Remuneration Committee consisting of three Board members.
The Remuneration Committee prepares matters for the Board and has mainly responsible for:• Annually reviewing and proposing the total salary and
remuneration for the CEO• Annually considering proposals for corporate scorecard
(CEO’s scorecard)• Annually considering the Group’s remuneration scheme,
including strategy and guiding principles for variable remune-ration
• Advising the CEO on matters relating to remuneration and other key benefits and other personnel-related issues for the Group’s senior management
• Ensuring that the practice of the Group’s remuneration arrangements are reviewed annually by an independent control function
• Prepare statement of fixing of salaries and other remuneration to senior executives (cf. Public Limited Companies Act, section 6-16 a)
• Considering other conditions as determined by the Board and/or the Remuneration Committee
• Reviewing other personnel-related matters concerning the Group’s remuneration scheme that are likely to involve significant reputation risk.
guidelines for the coming fiscal yearremuneration to the chief executive Officer
The CEO’s salary and other financial benefits shall be determined annually by the Board on the recommendation of the Remuneration Committee. Fixed salary is determined on the basis of results achieved, and market trends for similar positions. The CEO’s variable remuneration is determined on the basis of a comprehensive assessment based on the following factors: customer/market perspective, internal processes, organisation and competence and the financial perspective. Variable compensation can be earned annually, but must be based on goals achieved in the last two years. The CEO can receive group bonuses on a par with other employees. Any variable compensation, including group bonus (excluding any loyalty shares), may amount to up to 25 per cent of fixed salary including holiday pay. No performance-based benefits are paid over and above the said schemes. Variable pay is not included in pensionable salary.
Half of the variable remuneration is paid in the form of shares in SpareBank 1 SR-Bank ASA, where 1/3 can be disposed of each of the next three years. Group bonus received in the form of shares may be disposed of when allotted. That part of the variable remuneration that is paid in shares will be reduced if the recalculation basis for calculating the variable remuneration in the qualifying year shows that the calculation basis is considerably lower than the calculation basis that was assumed in the qualifying year.
The CEO may also receive benefits in kind to the extent that the benefits are naturally related to the CEO’s function in the Group and are in line with market practice in general.
A life-long pension scheme has been entered into for the CEO with pensionable age being the end of the year in which he reaches the age of 64 years, and then with an annual salary up to the age of 67 representing 67 per cent of pensionable salary. From the age of 67, the CEO will receive a supplementary retirement pension which, together with the SpareBank 1 SR-Bank’s pension fund pension, pension from NIS and early retirement (AFP) will constitute 67 per cent of pensionable pay, assuming full earning period.
The CEO has no agreement covering severance pay if he leaves his post prior to reaching retirement age.
remuneration to other senior executivesThe CEO determines the remuneration of senior executives in accordance with SpareBank 1 SR-Bank’s at any time adopted remuneration scheme. With senior management means employees who report to the CEO, that is corporate management.
Salaries are determined after considering the performance and conditions in the market for the various areas. Salary will promote good performance and ensure that the Group achieves its strategic goals. Remuneration should not be detrimental to the Group’s
nOte 9 PersOnneL cOsts, reMuneratiOn stateMent and benefits tO tHe eXecutiVe eMPLOYees and eLected rePresentatiVes

52
reputation nor shall the Group be a market leader. Salaries should ensure that the Group has the ability to attract and retain executives with the skills and experience required.Variable remuneration is determined on the basis of a comprehensive assessment based on the following factors: customer/market perspective, internal processes, organisation and competence and financial perspective. Variable compensation can be earned annually, but must be based on goals achieved over the last two years. Executives may receive a group bonus on a par with other employees. Any variable remuneration, including group bonuses, may amount to up to 25 per cent of fixed salary including holiday pay. For the Executive Vice President Capital Markets variable pay, including group bonus may be up to 50 per cent of fixed salary including holiday pay. No performance-based benefits are paid over and above the said schemes. Variable pay is not included in pensionable salary.
Half of the variable remuneration is paid in the form of shares in SpareBank 1 SR-Bank ASA, where 1/3 can be disposed of each of the next three years. Group bonus received in the form of shares may be disposed of when allotted. That part of the variable remuneration that is paid in shares will be reduced if the recalculation basis for calculating the variable remuneration in the qualifying year shows that the calculation basis is considerably lower than the calculation basis that was assumed in the qualifying year
Benefits in kind can be offered to senior employees to the extent that benefits are naturally linked to each function in the Group and are in line with market practice in general.
The pension schemes should be seen in the context of other remuneration and should provide competitive terms. Members of the executive management have a retirement age of 62 years, with the exception of the last member to be employed, who has a retirement age of 67. Corporate executives are members of the closed defined benefit plan which, with full pension earnings, entitles them to a pension of 70 per cent of pensionable income, including pension from National Insurance and AFP from the age of 67. This does not apply to the last member to be employed, where the pension is limited to 12G. Members of the executive management who have a retirement age of 62 years are entitled to a pension equivalent to 70 per cent of pensionable income in the form of service pension, from age 62 to age 67.
No senior executives have an agreement on severance pay on leaving his/her post prior to reaching retirement age.
Variable remuneration of other employees Group bonusThe Group has a bonus scheme which includes all employees. Group bonuses are set at an equal percentage of salary, and can, as a maximum, amount to 1.5 months salary. The Group bonus is determined on the basis of corporate scorecards set by the Board and in relation to financial and non-financial targets that are weighted 70 per cent and 30 per cent respectively. The Group
bonus will be paid half in cash and half in the form of shares issued by SpareBank 1 SR-Bank ASA. For employees who do not have a lock-in period pursuant to legislation or regulations for allotted shares, there is no lock-in period, but employees who elect to keep allotted shares for a minimum of one year will be allotted ½ extra share (loyalty share) for every share previously allotted.
Individual bonusIndividual bonuses can be used as a tool for the Group to reward extraordinary achievements while at the same time they may be a good tool to maintain a reasonable fixed salary development. Any individual bonus will follow the same principles as for variable remuneration to executive management in relation to the criteria for allocation and disbursement and as a maximum may amount to 25 per cent of fixed salary including bonus group.
Special schemesThe competitive situation and market practice may indicate that it is desirable to establish special arrangements related to variable remuneration in some areas. For employees covered by special schemes who are to be regarded as senior management, employees with duties essential to the company’s risk exposure or other employees and representatives with similar remuneration (according to the Regulations on remuneration schemes in financial institutions, investment firms and management companies of 1 December 2010) , the same principles that apply to executive management in relation to criteria for the allocation and payment of variable remuneration shall apply. Employees with control functions cannot be covered by special arrangements.
binding guidelines for shares, subscription rights, options, etc. for the coming fiscal yearThe CEO and senior management are given, on an equal footing with other employees, access to participate in private placements among employees.
Of all variable pay CEO and executive management have earned in 2012, half will be paid in the form of shares issued by SpareBank 1 SR-Bank ASA. Group bonus, including any loyalty shares, may be disposed of on allocation. For other shares that are allotted as variable remuneration, up to 1/3 of the shares could be traded in each of the next three years.
report on executive pay policy in the preceding financial yearThe Board confirms that the guidelines on executive pay for 2011 given in last year’s declaration have been followed.
(continuation note 9)

53
Personnel expenses(figures in NOK million)
Parent bank group2009 2010 2011 2011 2010 2009 472 486 589 Salaries 795 672 637
96 35 - 116 Pension costs (defined benefits plan, note 33) - 138 47 115 65 68 78 Social benefits 109 94 88 33 43 53 Other personnel expenses 62 57 41
666 632 604 total personnel expenses 828 870 881
929 997 1 039 Average number of employees 1 306 1 237 1 178 867 952 1 023 No. of employees (full time equivalents) as at 31.12. 1 213 1 163 1 093 941 1 004 1 075 No. of employees as at 31.12. 1 350 1 268 1 183
(continuation note 9)
remuneration to group management(Amounts in NOK 000s)
2011
salary and other
short-term
benefitsOf which
bonus 2)
Other remune-
ration
earned pension
rights Loans
no. of equity
certifica-tes 1)
Pension cost
Arne Austreid Chief Executive Officer 2 613 - 121 2 726 - 5 000 2 664Terje Vareberg (to 31.12.2010) Chief Executive Officer 511 Stian Helgøy EVP Capital Market 2 008 292 262 7 084 7 540 14 799 500Inge Reinertsen CFO 1 978 292 224 7 236 3 800 18 154 548Tore Medhus EVP Corporate Market 2 008 292 184 12 482 3 893 19 132 572Rolf Aarsheim (to 10.08.2011) EVP Retail Market 1 324 292 349 15 016 259Jan Friestad (from 11.08.2011) EVP Retail Market 1 490 224 151 9 023 3 749 16 489 127Glenn Sæther EVP Business support and development 1 652 235 219 1 678 7 950 4 040 225Thor-Christian Haugland EVP Communication 1 444 210 201 6 662 4 248 6 736 509Frode Bø EVP Risk management and compliance 1 597 219 135 6 442 1 321 8 641 451Wenche Mikalsen EVP organisation and HR 1 502 219 204 4 468 2 434 3 390 696
2010Terje Vareberg Chief Executive Officer 2 822 - 303 34 378 7 828 137 780 2 404Stian Helgøy EVP Capital Market 4 995 3 220 192 5 306 7 792 14 799 382Inge Reinertsen (from 01.02.2010) CFO 1 329 20 218 5 547 3 450 13 154 218Tore Medhus EVP Corporate Market 1 624 20 189 10 241 3 900 19 132 612Rolf Aarsheim EVP Retail Market 1 621 20 231 18 375 3 540 58 980 803Glenn Sæther EVP Business support and development 1 292 20 159 1 668 7 950 4 040 344Thor-Christian Haugland EVP Communication 1 175 20 177 5 707 4 263 6 732 614Frode Bø EVP Risk management and compliance 1 286 20 152 4 709 924 8 641 453Wenche Mikalsen EVP organisation and HR 1 174 20 198 3 332 2 396 3 390 725Erling Øverland (to 15.02.2010) CFO - - 1773)
2009Terje Vareberg Chief Executive Officer Executive Officer 2 649 - 321 25 972 7 918 132 030 2 821 Sveinung Hestnes EVP Capital Market 1 588 - 206 13 801 2 405 44 324 1 032 Erling Øverland CFO - - 1 9833) - - 8 648 - Tore Medhus EVP Corporate Market 1 484 - 125 8 495 2 075 18 182 624 Rolf Aarsheim EVP Retail Market 1 491 - 205 15 403 3 507 58 030 833 Svein Ivar Førland (to 27.11.2009) EVP Business support and development 1 154 - 173 591 549 Glenn Sæther (from 28.11.2009) EVP Business support and development 158 - 26 1 354 4 950 3 090 291 Thor-Christian Haugland EVP Communication 1 112 - 169 4 895 4 273 5 786 629 Frode Bø E Risk management and compliance 1 028 - 122 3 473 2 117 7 691 457 Wenche Mikalsen (from 01.05.2009)EVP organisation and HR 715 - 128 2 104 2 295 3 190 269 Arild L. Johannessen (to 30.04.2009) EVP organisation and HR 350 - 36
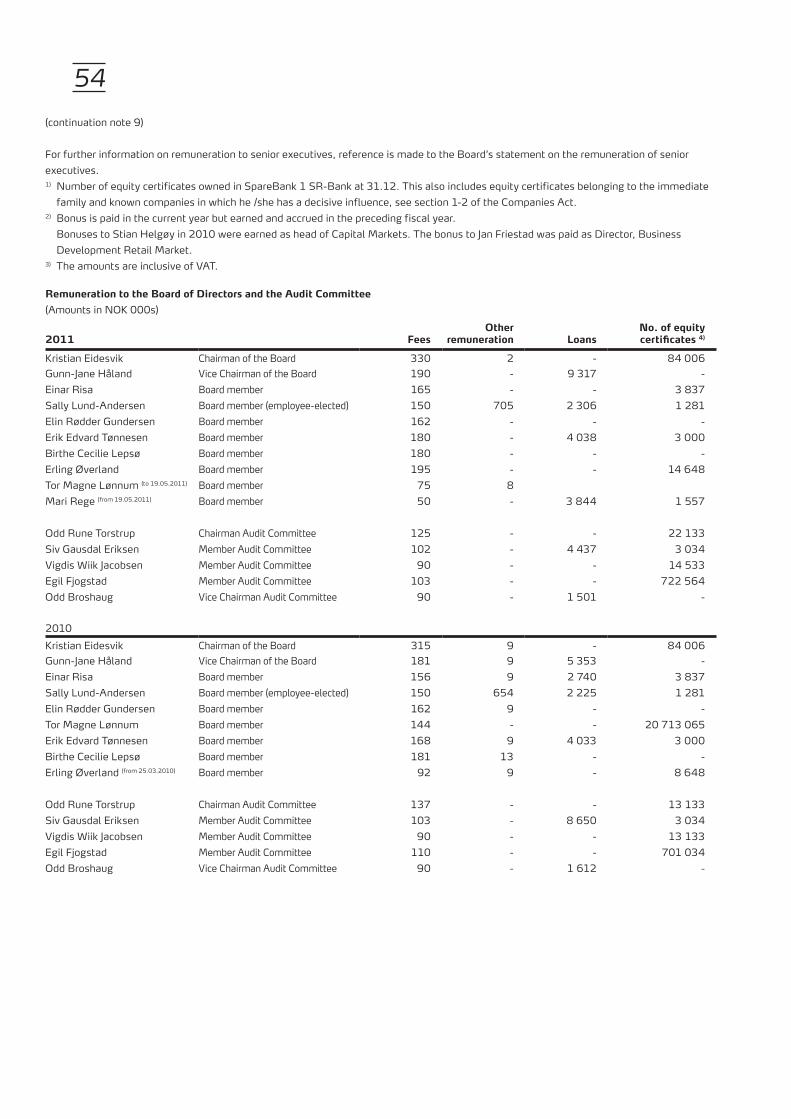
54
For further information on remuneration to senior executives, reference is made to the Board’s statement on the remuneration of senior executives.1) Number of equity certificates owned in SpareBank 1 SR-Bank at 31.12. This also includes equity certificates belonging to the immediate
family and known companies in which he /she has a decisive influence, see section 1-2 of the Companies Act.2) Bonus is paid in the current year but earned and accrued in the preceding fiscal year.
Bonuses to Stian Helgøy in 2010 were earned as head of Capital Markets. The bonus to Jan Friestad was paid as Director, Business Development Retail Market.
3) The amounts are inclusive of VAT.
remuneration to the board of directors and the audit committee(Amounts in NOK 000s)
2011 feesOther
remuneration Loansno. of equity certificates 4)
Kristian Eidesvik Chairman of the Board 330 2 - 84 006 Gunn-Jane Håland Vice Chairman of the Board 190 - 9 317 - Einar Risa Board member 165 - - 3 837 Sally Lund-Andersen Board member (employee-elected) 150 705 2 306 1 281 Elin Rødder Gundersen Board member 162 - - - Erik Edvard Tønnesen Board member 180 - 4 038 3 000Birthe Cecilie Lepsø Board member 180 - - - Erling Øverland Board member 195 - - 14 648Tor Magne Lønnum (to 19.05.2011) Board member 75 8 Mari Rege (from 19.05.2011) Board member 50 - 3 844 1 557
Odd Rune Torstrup Chairman Audit Committee 125 - - 22 133 Siv Gausdal Eriksen Member Audit Committee 102 - 4 437 3 034 Vigdis Wiik Jacobsen Member Audit Committee 90 - - 14 533 Egil Fjogstad Member Audit Committee 103 - - 722 564 Odd Broshaug Vice Chairman Audit Committee 90 - 1 501 -
2010Kristian Eidesvik Chairman of the Board 315 9 - 84 006 Gunn-Jane Håland Vice Chairman of the Board 181 9 5 353 - Einar Risa Board member 156 9 2 740 3 837 Sally Lund-Andersen Board member (employee-elected) 150 654 2 225 1 281 Elin Rødder Gundersen Board member 162 9 - - Tor Magne Lønnum Board member 144 - - 20 713 065 Erik Edvard Tønnesen Board member 168 9 4 033 3 000 Birthe Cecilie Lepsø Board member 181 13 - - Erling Øverland (from 25.03.2010) Board member 92 9 - 8 648
Odd Rune Torstrup Chairman Audit Committee 137 - - 13 133 Siv Gausdal Eriksen Member Audit Committee 103 - 8 650 3 034 Vigdis Wiik Jacobsen Member Audit Committee 90 - - 13 133 Egil Fjogstad Member Audit Committee 110 - - 701 034 Odd Broshaug Vice Chairman Audit Committee 90 - 1 612 -
(continuation note 9)

55
2009Kristian Eidesvik Chairman of the Board 300 - - 84 006 Gunn-Jane Håland Vice Chairman of the Board 178 - 1 005 - Einar Risa Board member 153 - 2 500 5 837 Sally Lund-Andersen Board member (employee-elected) 150 561 2 105 1 081 Elin Rødder Gundersen (from 01.04.2009) Board member 75 - - - Tor Magne Lønnum (from 01.11.2009) Board member - - - - Erik Edvard Tønnesen Board member 162 - 4 006 - Birthe Cecilie Lepsø Board member 181 - - - Ingrid Landråk (to 31.03.2009) Board member 87 - - - Erling Øverland (to 12.1.2009) Board member 44 - - 8 648
Odd Rune Torstrup Chairman Audit Committee 125 - - 13 133 Odd Broshaug Member Audit Committee 90 - 1 615 - Vigdis Wiik Jacobsen Member Audit Committee 90 - - 13 133 Siv Gausdal Eriksen Member Audit Committee 103 - 4 731 3 034 Egil Fjogstad Vice Chairman Audit Committee 103 - - 722 564
4) Number of equity certificates owned in SpareBank 1 SR-Bank at 31.12. This also includes equity certificates belonging to the immediate family and known companies in which he/she has a decisive influence, see section 1-2 of the Companies Act. . In addition, it includes equity certificates owned by the institution on whose behalf the person is elected.
(continuation note 9)
nOte 10 OtHer OPerating eXPenses(figures in NOK million)
Parent bank group2009 2010 2011 2011 2010 2009
173 176 212 IT expenses 223 184 180 48 58 65 Marketing 88 76 63 89 84 81 Other administration expenses 99 102 103 65 62 68 Ordinary depreciation (note 27 and 28) 80 72 69 68 36 61 Operating expenses real estate 60 39 70
8 8 14 Wealth tax 14 8 8 30 33 42 External fees 51 39 34 79 78 88 Other operating expenses 190 176 171
560 535 631 total operating expenses 805 696 698
specification of fees for external audit(figures in NOK 000s)
2 297 2 152 2 536 Statutory audit 3 615 3 042 3 192 130 292 135 Tax advice 1) 298 497 355 313 605 1 141 Other attestation services 1 141 656 329 345 566 393 Other services that are not audit 1) 499 647 400
3 085 3 615 4 205 total 5 553 4 842 4 276 1) Tax advice and other services other than audit for 2011 includes fees to the law firm PriceWaterhouseCoopers AS, with NOK 0.1 million
for the parent bank and NOK 0.3 million for the Group. In 2010, services other than audit include fees to the law firm PriceWaterhouseCoopers AS, with NOK 0.3 million for the parent bank and NOK 0.5 million for the Group. In 2009, services other than audit include fees to the law firm PriceWaterhouseCoopers AS, with NOK 0.1 million. All figures include VAT.
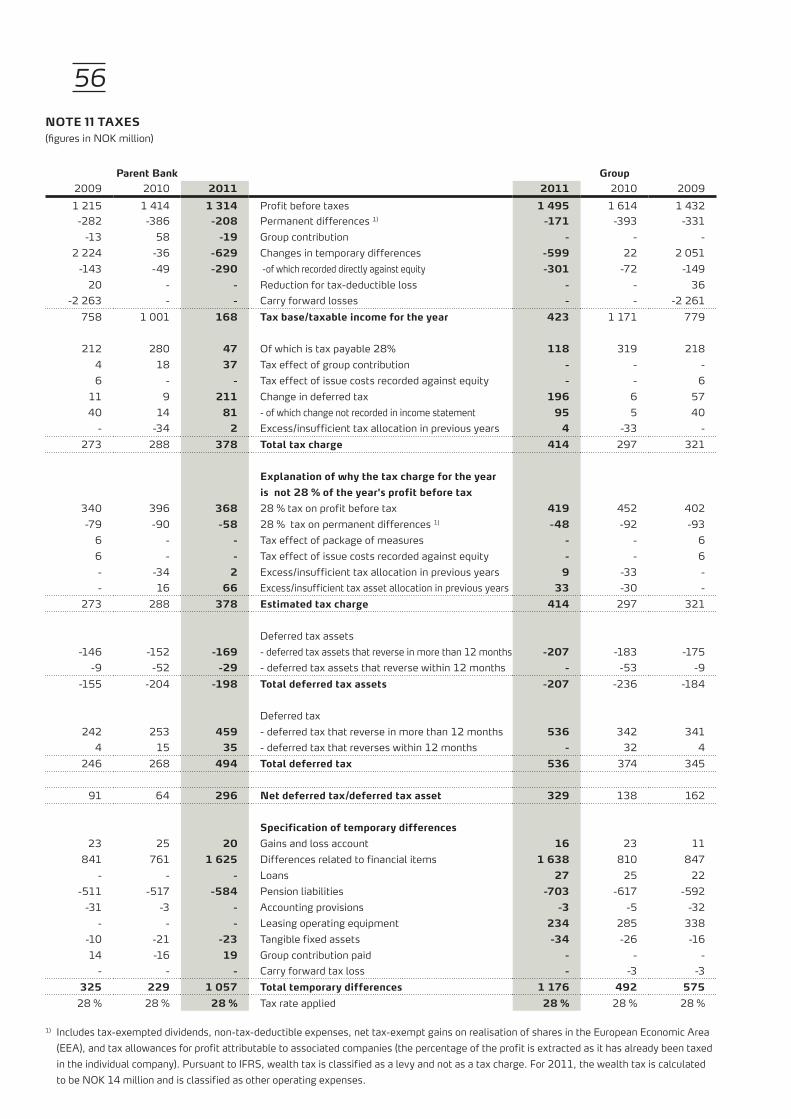
56nOte 11 taXes(figures in NOK million)
Parent bank group2009 2010 2011 2011 2010 2009
1 215 1 414 1 314 Profit before taxes 1 495 1 614 1 432 -282 -386 -208 Permanent differences 1) -171 -393 -331
-13 58 -19 Group contribution - - - 2 224 -36 -629 Changes in temporary differences -599 22 2 051
-143 -49 -290 -of which recorded directly against equity -301 -72 -149 20 - - Reduction for tax-deductible loss - - 36
-2 263 - - Carry forward losses - - -2 261 758 1 001 168 tax base/taxable income for the year 423 1 171 779
212 280 47 Of which is tax payable 28% 118 319 218 4 18 37 Tax effect of group contribution - - - 6 - - Tax effect of issue costs recorded against equity - - 6
11 9 211 Change in deferred tax 196 6 57 40 14 81 - of which change not recorded in income statement 95 5 40
- -34 2 Excess/insufficient tax allocation in previous years 4 -33 - 273 288 378 total tax charge 414 297 321
explanation of why the tax charge for the yearis not 28 % of the year's profit before tax
340 396 368 28 % tax on profit before tax 419 452 402 -79 -90 -58 28 % tax on permanent differences 1) -48 -92 -93
6 - - Tax effect of package of measures - - 6 6 - - Tax effect of issue costs recorded against equity - - 6 - -34 2 Excess/insufficient tax allocation in previous years 9 -33 - - 16 66 Excess/insufficient tax asset allocation in previous years 33 -30 -
273 288 378 estimated tax charge 414 297 321
Deferred tax assets -146 -152 -169 - deferred tax assets that reverse in more than 12 months -207 -183 -175
-9 -52 -29 - deferred tax assets that reverse within 12 months - -53 -9 -155 -204 -198 total deferred tax assets -207 -236 -184
Deferred tax 242 253 459 - deferred tax that reverse in more than 12 months 536 342 341
4 15 35 - deferred tax that reverses within 12 months - 32 4 246 268 494 total deferred tax 536 374 345
91 64 296 net deferred tax/deferred tax asset 329 138 162
specification of temporary differences 23 25 20 Gains and loss account 16 23 11
841 761 1 625 Differences related to financial items 1 638 810 847 - - - Loans 27 25 22
-511 -517 -584 Pension liabilities -703 -617 -592 -31 -3 - Accounting provisions -3 -5 -32
- - - Leasing operating equipment 234 285 338 -10 -21 -23 Tangible fixed assets -34 -26 -16 14 -16 19 Group contribution paid - - -
- - - Carry forward tax loss - -3 -3 325 229 1 057 total temporary differences 1 176 492 575 28 % 28 % 28 % Tax rate applied 28 % 28 % 28 %
1) Includes tax-exempted dividends, non-tax-deductible expenses, net tax-exempt gains on realisation of shares in the European Economic Area (EEA), and tax allowances for profit attributable to associated companies (the percentage of the profit is extracted as it has already been taxed in the individual company). Pursuant to IFRS, wealth tax is classified as a levy and not as a tax charge. For 2011, the wealth tax is calculated to be NOK 14 million and is classified as other operating expenses.

57nOte 12 credit institutiOns- receiVabLes and LiabiLities (figures in NOK million)
Parent bank group2009 2010 2011 2011 2010 2009
Loans to and deposits with credit institutions 173 343 118 Loans and deposits at call 125 351 181
5 574 5 268 5 273 Loans and deposits with agreed maturities or notice 598 922 1 120 5 747 5 611 5 391 total 723 1 273 1 301
specified by major currencies 4 533 4 114 4 279 NOK 51 108 447
284 919 615 EUR 566 858 240 757 305 324 USD 22 34 441 173 273 173 Other currencies 84 273 173
5 747 5 611 5 391 total 723 1 273 1 301
2,5 % 2,3 % 2,7 % average interest rate 2,7 % 2,3 % 2,5 %
debt to credit institutions 3 157 4 474 1 652 Debt to credit institutions at call 1 650 4 473 3 155
Debt to credit institutions with agreed 5 585 2 795 3 038 maturities or notice 3 037 2 794 5 585
112 92 95 Earned interest 95 92 112 8 854 7 361 4 785 total 4 782 7 359 8 852
specified by major currencies 6 848 5 518 3 360 NOK 3 357 5 516 6 846 1 694 759 971 EUR 971 759 1 694
184 992 351 USD 351 992 184 16 - 8 Other currencies 8 - 16
112 92 95 Interest earned 95 92 112 8 854 7 361 4 785 total 4 782 7 359 8 852
2,2 % 2,4 % 2,2 % average interest rate 2,2 % 2,4 % 2,2 %
The average interest rate is calculated on the actual interest expense during the year as a percentage of the average outstanding debt to credit institutions.

58nOte 13 Lending tO and receiVabLes frOM custOMers (figures in NOK million)
Parent bank group2009 2010 2011 2011 2010 2009
distribution by type of receivable - - - Financial leasing 4 118 3 917 3 868
16 836 19 988 14 099 Overdraft facilities and operating credits 14 099 19 988 16 8363 741 3 228 3 978 Building loans 4 090 3 279 3 930
68 034 77 190 77 420 Instalment loans 78 595 78 286 68 562Excess value of fixed interest lending/amortisation
51 87 150 of front-end fees 150 76 56221 236 303 Earned interest 316 246 221
88 883 100 729 95 950 gross lending 101 368 105 792 93 473-295 -346 -355 Individual write-downs -418 -402 -329-287 -314 -317 Write-downs on groups of loans -362 -357 -320
88 301 100 069 95 278 net lending 100 588 105 033 92 824
distribution by market44 950 55 516 46 547 Retail market 47 593 56 492 45 84743 590 44 845 48 453 Corporate market 52 563 48 736 47 063
71 45 497 Public sector 746 241 28651 87 150 Undistributed 150 76 56
221 236 303 Earned interest 316 247 22188 883 100 729 95 950 gross lending 101 368 105 792 93 473
-295 -346 -355 Individual write-downs -418 -402 -329-287 -314 -317 Write-downs on groups of loans -362 -357 -320
88 301 100 069 95 278 net lending 100 588 105 033 92 824
Of which subordinated loan capital60 60 60 Subordinated loan capital in credit institutions - - - 42 43 43 Subordinated loan capital in other credit institutions 43 43 42
102 103 103 subordinated loan capital recorded as lending 43 43 42
1 776 1 856 1 693 Loans to employees 2 197 2 457 2 242313 539 877 Of which loans in SpareBank 1 Boligkreditt AS 1 131 690 376
The terms are one percentage point lower than thestandardised rate set by the Ministry of Finance
24 754 25 857 44 694 Loans sold to SpareBank 1 Boligkreditt 44 694 25 857 24 754146 156 85 Commission received from SpareBank 1 Boligkreditt 85 156 146
- 304 635 Loans sold to SpareBank 1 Næringskreditt 635 304 -- 1 2 Commission received from SpareBank 1 Næringskreditt 2 1 -
total lending distributed by risk class52 383 69 383 61 213 Lowest risk 62 075 71 226 54 290 35 390 39 390 40 447 Low risk 43 255 41 506 37 290 13 932 8 509 11 461 Medium risk 12 697 9 148 14 654
418 1 209 304 High risk 382 1 342 656 2 556 1 599 2 777 Highest risk 3 005 1 790 2 783 1 075 1 063 966 Non-performing loans 1 172 1 205 1 118
105 754 121 153 117 168 total 122 586 126 217 110 791
gross lending by risk group45 120 26 291 48 206 Lowest risk 49 063 28 242 47 022 29 084 64 012 32 950 Low risk 35 754 66 025 30 984 10 941 6 948 10 599 Medium risk 11 833 7 587 11 216
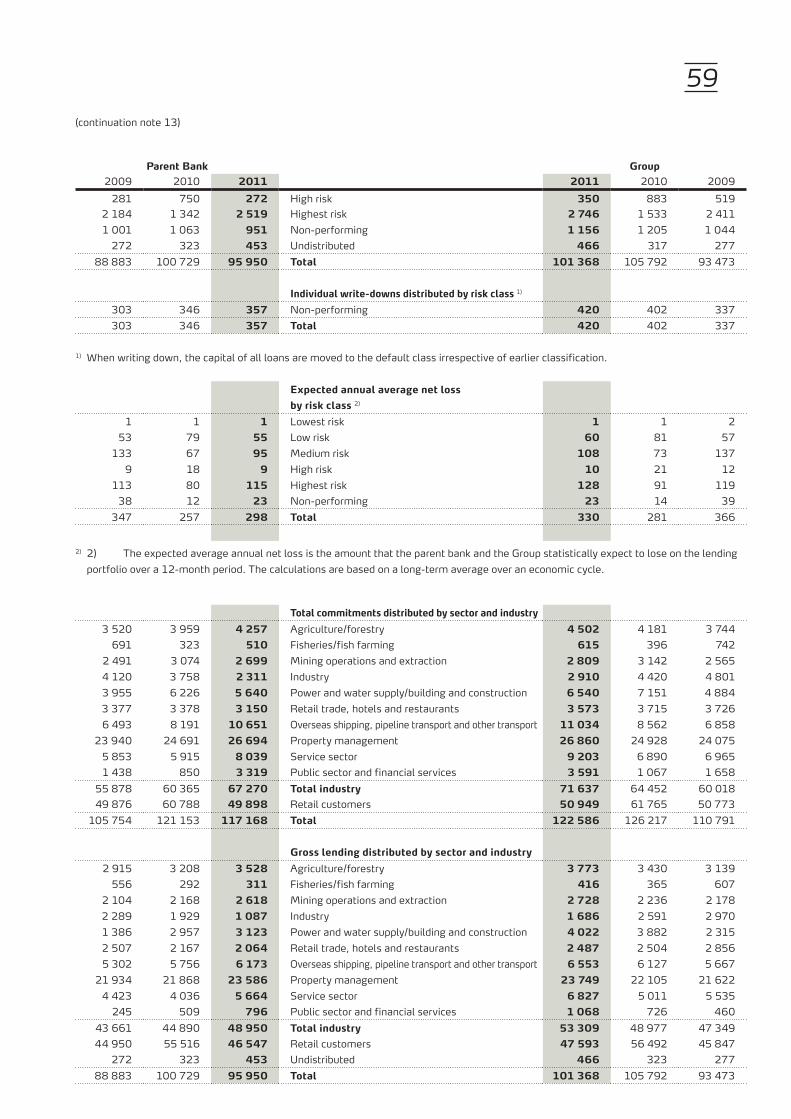
59
Parent bank group2009 2010 2011 2011 2010 2009
281 750 272 High risk 350 883 519 2 184 1 342 2 519 Highest risk 2 746 1 533 2 411 1 001 1 063 951 Non-performing 1 156 1 205 1 044
272 323 453 Undistributed 466 317 277 88 883 100 729 95 950 total 101 368 105 792 93 473
individual write-downs distributed by risk class 1)
303 346 357 Non-performing 420 402 337 303 346 357 total 420 402 337
1) When writing down, the capital of all loans are moved to the default class irrespective of earlier classification.
expected annual average net loss by risk class 2)
1 1 1 Lowest risk 1 1 2 53 79 55 Low risk 60 81 57
133 67 95 Medium risk 108 73 137 9 18 9 High risk 10 21 12
113 80 115 Highest risk 128 91 119 38 12 23 Non-performing 23 14 39
347 257 298 total 330 281 366
2) 2) The expected average annual net loss is the amount that the parent bank and the Group statistically expect to lose on the lending portfolio over a 12-month period. The calculations are based on a long-term average over an economic cycle.
total commitments distributed by sector and industry3 520 3 959 4 257 Agriculture/forestry 4 502 4 181 3 744
691 323 510 Fisheries/fish farming 615 396 742 2 491 3 074 2 699 Mining operations and extraction 2 809 3 142 2 565 4 120 3 758 2 311 Industry 2 910 4 420 4 801 3 955 6 226 5 640 Power and water supply/building and construction 6 540 7 151 4 884 3 377 3 378 3 150 Retail trade, hotels and restaurants 3 573 3 715 3 726 6 493 8 191 10 651 Overseas shipping, pipeline transport and other transport 11 034 8 562 6 858
23 940 24 691 26 694 Property management 26 860 24 928 24 075 5 853 5 915 8 039 Service sector 9 203 6 890 6 965 1 438 850 3 319 Public sector and financial services 3 591 1 067 1 658
55 878 60 365 67 270 total industry 71 637 64 452 60 018 49 876 60 788 49 898 Retail customers 50 949 61 765 50 773
105 754 121 153 117 168 total 122 586 126 217 110 791
gross lending distributed by sector and industry 2 915 3 208 3 528 Agriculture/forestry 3 773 3 430 3 139
556 292 311 Fisheries/fish farming 416 365 607 2 104 2 168 2 618 Mining operations and extraction 2 728 2 236 2 178 2 289 1 929 1 087 Industry 1 686 2 591 2 970 1 386 2 957 3 123 Power and water supply/building and construction 4 022 3 882 2 315 2 507 2 167 2 064 Retail trade, hotels and restaurants 2 487 2 504 2 856 5 302 5 756 6 173 Overseas shipping, pipeline transport and other transport 6 553 6 127 5 667
21 934 21 868 23 586 Property management 23 749 22 105 21 622 4 423 4 036 5 664 Service sector 6 827 5 011 5 535
245 509 796 Public sector and financial services 1 068 726 460 43 661 44 890 48 950 total industry 53 309 48 977 47 349 44 950 55 516 46 547 Retail customers 47 593 56 492 45 847
272 323 453 Undistributed 466 323 277 88 883 100 729 95 950 total 101 368 105 792 93 473
(continuation note 13)
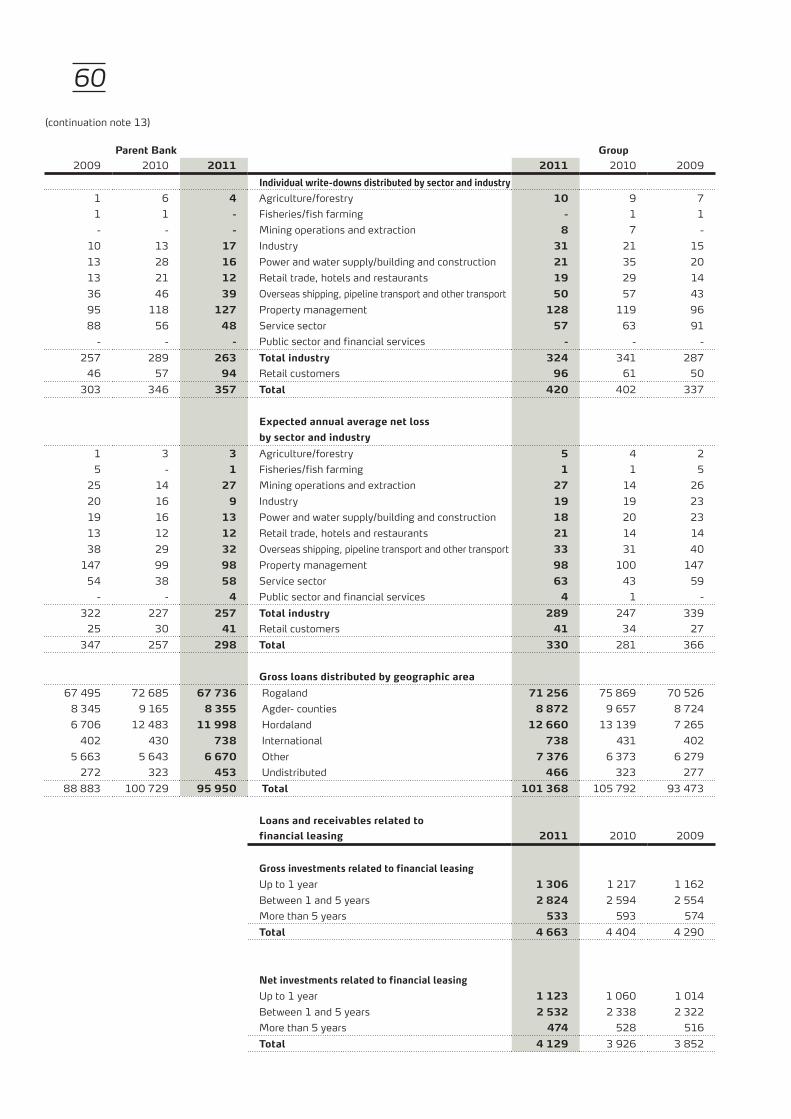
60
Parent bank group2009 2010 2011 2011 2010 2009
individual write-downs distributed by sector and industry 1 6 4 Agriculture/forestry 10 9 7 1 1 - Fisheries/fish farming - 1 1
- - - Mining operations and extraction 8 7 - 10 13 17 Industry 31 21 15 13 28 16 Power and water supply/building and construction 21 35 20 13 21 12 Retail trade, hotels and restaurants 19 29 14 36 46 39 Overseas shipping, pipeline transport and other transport 50 57 43 95 118 127 Property management 128 119 96 88 56 48 Service sector 57 63 91 - - - Public sector and financial services - - -
257 289 263 total industry 324 341 287 46 57 94 Retail customers 96 61 50
303 346 357 total 420 402 337
expected annual average net lossby sector and industry
1 3 3 Agriculture/forestry 5 4 2 5 - 1 Fisheries/fish farming 1 1 5
25 14 27 Mining operations and extraction 27 14 26 20 16 9 Industry 19 19 23 19 16 13 Power and water supply/building and construction 18 20 23 13 12 12 Retail trade, hotels and restaurants 21 14 14 38 29 32 Overseas shipping, pipeline transport and other transport 33 31 40
147 99 98 Property management 98 100 147 54 38 58 Service sector 63 43 59 - - 4 Public sector and financial services 4 1 -
322 227 257 total industry 289 247 339 25 30 41 Retail customers 41 34 27
347 257 298 total 330 281 366
gross loans distributed by geographic area67 495 72 685 67 736 Rogaland 71 256 75 869 70 526
8 345 9 165 8 355 Agder- counties 8 872 9 657 8 724 6 706 12 483 11 998 Hordaland 12 660 13 139 7 265
402 430 738 International 738 431 402 5 663 5 643 6 670 Other 7 376 6 373 6 279
272 323 453 Undistributed 466 323 277 88 883 100 729 95 950 total 101 368 105 792 93 473
Loans and receivables related to financial leasing 2011 2010 2009
gross investments related to financial leasingUp to 1 year 1 306 1 217 1 162 Between 1 and 5 years 2 824 2 594 2 554 More than 5 years 533 593 574 total 4 663 4 404 4 290
net investments related to financial leasingUp to 1 year 1 123 1 060 1 014 Between 1 and 5 years 2 532 2 338 2 322 More than 5 years 474 528 516 total 4 129 3 926 3 852
(continuation note 13)

61nOte 14 age breaKdOwn Of LOans faLLen due but nOt written dOwn(figures in NOK million)
The table shows the amounts fallen due on loans and overdrafts /deposits by number of days after due date that are not a result of delays in payment services.
Parent bankLess than
30 days 31 - 60
days61 - 90
daysMore than
91 days total2011
Loans to and receivables from customers- Retail market 1 298 45 18 60 1 421 - Corporate market 583 29 42 60 714 total 1 881 74 60 120 2 135
2010
Loans to and receivables from customers- Retail market 732 72 36 77 917 - Corporate market 718 35 17 88 858 total 1 450 107 53 165 1 775
2009
Loans to and receivables from customers- Retail market 360 29 11 34 434 - Corporate market 107 9 - 79 195 total 467 38 11 113 629
Of the total amount of gross loans fallen due but not written down and receivables from customers, the fair value of the associated collateral security was NOK 1 923 mill at 31.12.2011 (NOK 1 685 million and NOK 513 million for 2010 and 2009 respectively).
groupLess than
30 days 31 - 60
days61 - 90
daysMore than
91 days total2011
Loans to and receivables from customers- Retail market 1 298 48 18 72 1 436 - Corporate market 583 46 51 64 744 total 1 881 94 69 136 2 180
2010
Loans to and receivables from customers- Retail market 732 78 37 81 928 - Corporate market 718 74 19 95 906 total 1 450 152 56 176 1 834
2009
Loans to and receivables from customers- Retail market 360 38 11 38 447 - Corporate market 107 197 7 81 392 total 467 235 18 119 839
Of the total amount of gross loans fallen due but not written down and receivables from customers, the fair value of the associated collateral security was NOK 1 966 mill kroner at 31.12.2011 (NOK 1 744 million and NOK 723 million for 2010 and 2009 respectively).

62nOte 15 LOsses On LOans and guarantees (figures in NOK million)
Parent bank group2009 2010 2011 2011 2010 2009
RM CM Total RM CM Total rM cM totalt Losses on loans and guarantees rM cM total RM CM Total RM CM Total -3 -18 -21 4 11 15 39 -30 9 Change in individual write-downs in the period 37 -21 16 5 33 38 -2 -10 -12 -1 82 81 -4 18 14 6 -3 3 Change in group write-downs in the period 8 -3 5 -3 27 24 - 91 91
13 207 220 5 162 167 9 53 62 Realised losses on commitments previously written down 9 57 66 6 169 175 14 213 227 2 50 52 1 18 19 - 64 64 Realised losses on commitments not previously written down 3 71 74 4 26 30 5 58 63 - - - - - - - 7 7 Change in losses on repossessed assets in the period - 7 7 - - - - - - 4 13 17 1 5 6 2 4 6 Amortised loans 2 4 6 1 5 6 4 13 17
-13 -3 -16 -5 -29 -34 -2 -28 -30 Recoveries on loans and guarantees previously written down -5 -30 -35 -6 -33 -39 -13 -5 -18 2 331 333 2 185 187 54 67 121 total losses on loans and guarantees 54 85 139 7 227 234 8 360 368
individual write-downs 46 278 324 42 261 303 50 296 346 Individual write-downs to cover losses on loans and guarantees as at 1.1 54 349 403 49 288 337 50 299 349
Realised losses in the period on loans and guarantees previously -13 -207 -220 -5 -162 -167 -9 -53 -62 written down individually -9 -57 -66 -6 -169 -175 -14 -213 -227 -14 -99 -113 -13 -58 -71 -16 -80 -96 Reversal of write-downs in previous years -19 -89 -108 -14 -69 -83 -15 -111 -126
Increase in write-downs on commitments previously 2 97 99 2 64 66 4 26 30 written down individually 4 28 32 2 65 67 2 97 99 3 13 16 -1 -6 -7 - 1 1 Amortised costs - - - -1 -7 -8 3 13 16
Write-down of commitments not previously 18 175 193 20 167 187 61 77 138 written down individually 63 96 159 24 205 229 23 199 222
Write-down of guarantees not previously - 4 4 - - - - - - written down individually - - - - - - - 4 4 - - - 5 30 35 - - - Write-down relating to acquisition of Kvinnherad Sparebank - - - 5 30 35 - - -
42 261 303 50 296 346 90 267 357 individual write-downs to cover losses on loans and guarantees as at 31.12. 93 327 420 59 343 402 49 288 337
write-downs on groups of loans 16 190 206 15 272 287 11 303 314 Write-downs to cover losses on loans and guarantees as at 1.1 19 338 357 22 298 320 22 207 229 -1 82 81 -4 18 14 6 -3 3 Write-downs to cover losses and loans and guarantees in the period 8 -3 5 -4 28 24 - 91 91
- - - - 13 13 - - - Write-down relating to acquisition of Kvinnherad Sparebank - - - - 13 13 - - - 15 272 287 11 303 314 17 300 317 group write-downs to cover losses on loans and guarantees as at31 december 27 335 362 18 339 357 22 298 320
Losses by sector and industry0 % 1 2 % 4 -1 % -1 Agriculture/forestry -1 % -1 2 % 5 1 % 4 0 % - 0 % - -1 % -1 Fisheries/fish farming -1 % -1 0 % - 0 % - 0 % - 0 % - 0 % - Mining operations and extraction 0 % - 0 % - 0 % -
21 % 71 -10 % -19 -3 % -4 Industry 3 % 4 -3 % -8 20 % 75 2 % 8 7 % 13 2 % 3 Power and water supply/building and construction 4 % 6 6 % 15 1 % 4 8 % 25 2 % 4 2 % 3 Retail trade, hotels and restaurants 3 % 4 6 % 13 8 % 28
11 % 38 2 % 4 11 % 13 Overseas shipping, pipeline transport and other transport 11 % 15 2 % 4 13 % 46 26 % 88 73 % 137 24 % 29 Property management 22 % 30 62 % 144 24 % 90
5 % 18 13 % 25 23 % 28 Service sector 22 % 31 13 % 31 6 % 22 24 % 81 7 % 13 2 % 3 Transferred from write-downs of groups of loans 4 % 5 10 % 23 25 % 91
1 % 3 3 % 6 40 % 48 Retail customers 33 % 46 3 % 7 2 % 8 100 % 333 100 % 187 100 % 121 Losses on loans to customers 100 % 139 100 % 234 100 % 368
2007 2008 2009 2010 2011 non-performing and doubtful commitments 2011 2010 2009 2008 2007 90 332 355 408 384 Non-performing commitments 415 443 395 348 92
617 1 214 696 656 587 Other doubtful commitments 696 762 753 1 264 647 707 1 546 1 051 1064 971 total doubtful commitments 1 111 1 205 1 148 1 612 739 -92 -324 -303 -346 -357 Individual write-downs - 420 -402 -337 -349 -105
9 7 1 13 11 Interest on reversal of discounted write-downs 11 13 1 7 9 624 1 229 749 731 625 net doubtful commitments 702 816 812 1 270 641
Interest income from non-performing and written down commitments totals NOK 60 million in the parent bank and NOK 62 million in the Group in 2011. Fair value of collateral security furnished for loans and receivables that are subject to individual write-down is equal to the book value plus write-downs. Collateral security is in the form of cash, securities, guarantees and properties.
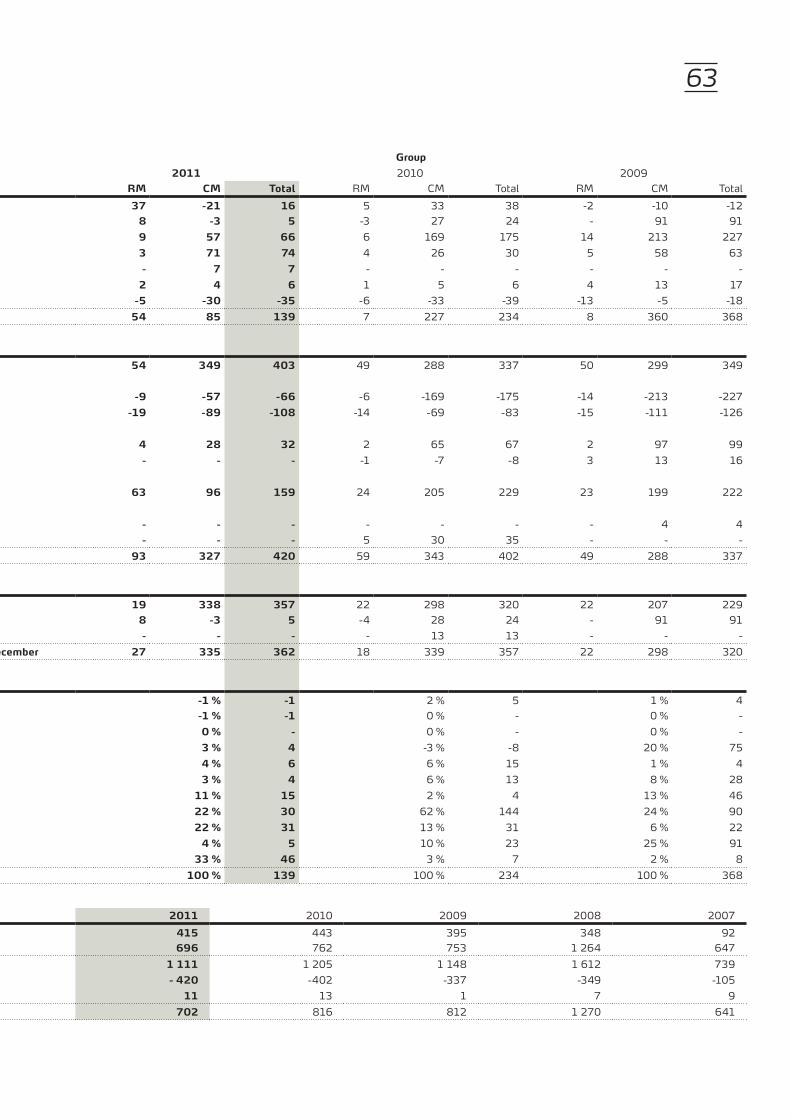
63nOte 15 LOsses On LOans and guarantees (figures in NOK million)
Parent bank group2009 2010 2011 2011 2010 2009
RM CM Total RM CM Total rM cM totalt Losses on loans and guarantees rM cM total RM CM Total RM CM Total -3 -18 -21 4 11 15 39 -30 9 Change in individual write-downs in the period 37 -21 16 5 33 38 -2 -10 -12 -1 82 81 -4 18 14 6 -3 3 Change in group write-downs in the period 8 -3 5 -3 27 24 - 91 91
13 207 220 5 162 167 9 53 62 Realised losses on commitments previously written down 9 57 66 6 169 175 14 213 227 2 50 52 1 18 19 - 64 64 Realised losses on commitments not previously written down 3 71 74 4 26 30 5 58 63 - - - - - - - 7 7 Change in losses on repossessed assets in the period - 7 7 - - - - - - 4 13 17 1 5 6 2 4 6 Amortised loans 2 4 6 1 5 6 4 13 17
-13 -3 -16 -5 -29 -34 -2 -28 -30 Recoveries on loans and guarantees previously written down -5 -30 -35 -6 -33 -39 -13 -5 -18 2 331 333 2 185 187 54 67 121 total losses on loans and guarantees 54 85 139 7 227 234 8 360 368
individual write-downs 46 278 324 42 261 303 50 296 346 Individual write-downs to cover losses on loans and guarantees as at 1.1 54 349 403 49 288 337 50 299 349
Realised losses in the period on loans and guarantees previously -13 -207 -220 -5 -162 -167 -9 -53 -62 written down individually -9 -57 -66 -6 -169 -175 -14 -213 -227 -14 -99 -113 -13 -58 -71 -16 -80 -96 Reversal of write-downs in previous years -19 -89 -108 -14 -69 -83 -15 -111 -126
Increase in write-downs on commitments previously 2 97 99 2 64 66 4 26 30 written down individually 4 28 32 2 65 67 2 97 99 3 13 16 -1 -6 -7 - 1 1 Amortised costs - - - -1 -7 -8 3 13 16
Write-down of commitments not previously 18 175 193 20 167 187 61 77 138 written down individually 63 96 159 24 205 229 23 199 222
Write-down of guarantees not previously - 4 4 - - - - - - written down individually - - - - - - - 4 4 - - - 5 30 35 - - - Write-down relating to acquisition of Kvinnherad Sparebank - - - 5 30 35 - - -
42 261 303 50 296 346 90 267 357 individual write-downs to cover losses on loans and guarantees as at 31.12. 93 327 420 59 343 402 49 288 337
write-downs on groups of loans 16 190 206 15 272 287 11 303 314 Write-downs to cover losses on loans and guarantees as at 1.1 19 338 357 22 298 320 22 207 229 -1 82 81 -4 18 14 6 -3 3 Write-downs to cover losses and loans and guarantees in the period 8 -3 5 -4 28 24 - 91 91
- - - - 13 13 - - - Write-down relating to acquisition of Kvinnherad Sparebank - - - - 13 13 - - - 15 272 287 11 303 314 17 300 317 group write-downs to cover losses on loans and guarantees as at31 december 27 335 362 18 339 357 22 298 320
Losses by sector and industry0 % 1 2 % 4 -1 % -1 Agriculture/forestry -1 % -1 2 % 5 1 % 4 0 % - 0 % - -1 % -1 Fisheries/fish farming -1 % -1 0 % - 0 % - 0 % - 0 % - 0 % - Mining operations and extraction 0 % - 0 % - 0 % -
21 % 71 -10 % -19 -3 % -4 Industry 3 % 4 -3 % -8 20 % 75 2 % 8 7 % 13 2 % 3 Power and water supply/building and construction 4 % 6 6 % 15 1 % 4 8 % 25 2 % 4 2 % 3 Retail trade, hotels and restaurants 3 % 4 6 % 13 8 % 28
11 % 38 2 % 4 11 % 13 Overseas shipping, pipeline transport and other transport 11 % 15 2 % 4 13 % 46 26 % 88 73 % 137 24 % 29 Property management 22 % 30 62 % 144 24 % 90
5 % 18 13 % 25 23 % 28 Service sector 22 % 31 13 % 31 6 % 22 24 % 81 7 % 13 2 % 3 Transferred from write-downs of groups of loans 4 % 5 10 % 23 25 % 91
1 % 3 3 % 6 40 % 48 Retail customers 33 % 46 3 % 7 2 % 8 100 % 333 100 % 187 100 % 121 Losses on loans to customers 100 % 139 100 % 234 100 % 368
2007 2008 2009 2010 2011 non-performing and doubtful commitments 2011 2010 2009 2008 2007 90 332 355 408 384 Non-performing commitments 415 443 395 348 92
617 1 214 696 656 587 Other doubtful commitments 696 762 753 1 264 647 707 1 546 1 051 1064 971 total doubtful commitments 1 111 1 205 1 148 1 612 739 -92 -324 -303 -346 -357 Individual write-downs - 420 -402 -337 -349 -105
9 7 1 13 11 Interest on reversal of discounted write-downs 11 13 1 7 9 624 1 229 749 731 625 net doubtful commitments 702 816 812 1 270 641
Interest income from non-performing and written down commitments totals NOK 60 million in the parent bank and NOK 62 million in the Group in 2011. Fair value of collateral security furnished for loans and receivables that are subject to individual write-down is equal to the book value plus write-downs. Collateral security is in the form of cash, securities, guarantees and properties.
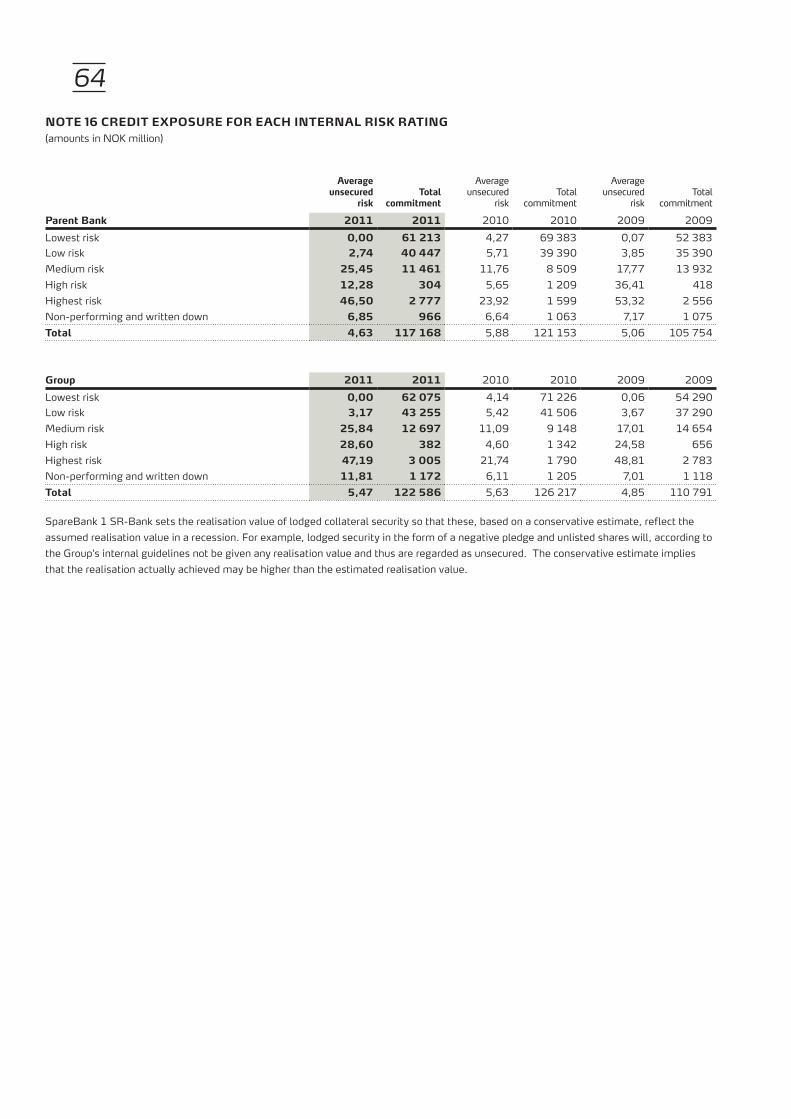
64nOte 16 credit eXPOsure fOr eacH internaL risK rating(amounts in NOK million)
average unsecured
risk total
commitment
average unsecured
risk total
commitment
average unsecured
risk total
commitment
Parent bank 2011 2011 2010 2010 2009 2009Lowest risk 0,00 61 213 4,27 69 383 0,07 52 383Low risk 2,74 40 447 5,71 39 390 3,85 35 390Medium risk 25,45 11 461 11,76 8 509 17,77 13 932High risk 12,28 304 5,65 1 209 36,41 418Highest risk 46,50 2 777 23,92 1 599 53,32 2 556Non-performing and written down 6,85 966 6,64 1 063 7,17 1 075total 4,63 117 168 5,88 121 153 5,06 105 754
group 2011 2011 2010 2010 2009 2009Lowest risk 0,00 62 075 4,14 71 226 0,06 54 290Low risk 3,17 43 255 5,42 41 506 3,67 37 290Medium risk 25,84 12 697 11,09 9 148 17,01 14 654High risk 28,60 382 4,60 1 342 24,58 656Highest risk 47,19 3 005 21,74 1 790 48,81 2 783Non-performing and written down 11,81 1 172 6,11 1 205 7,01 1 118total 5,47 122 586 5,63 126 217 4,85 110 791
SpareBank 1 SR-Bank sets the realisation value of lodged collateral security so that these, based on a conservative estimate, reflect the assumed realisation value in a recession. For example, lodged security in the form of a negative pledge and unlisted shares will, according to the Group’s internal guidelines not be given any realisation value and thus are regarded as unsecured. The conservative estimate implies that the realisation actually achieved may be higher than the estimated realisation value.
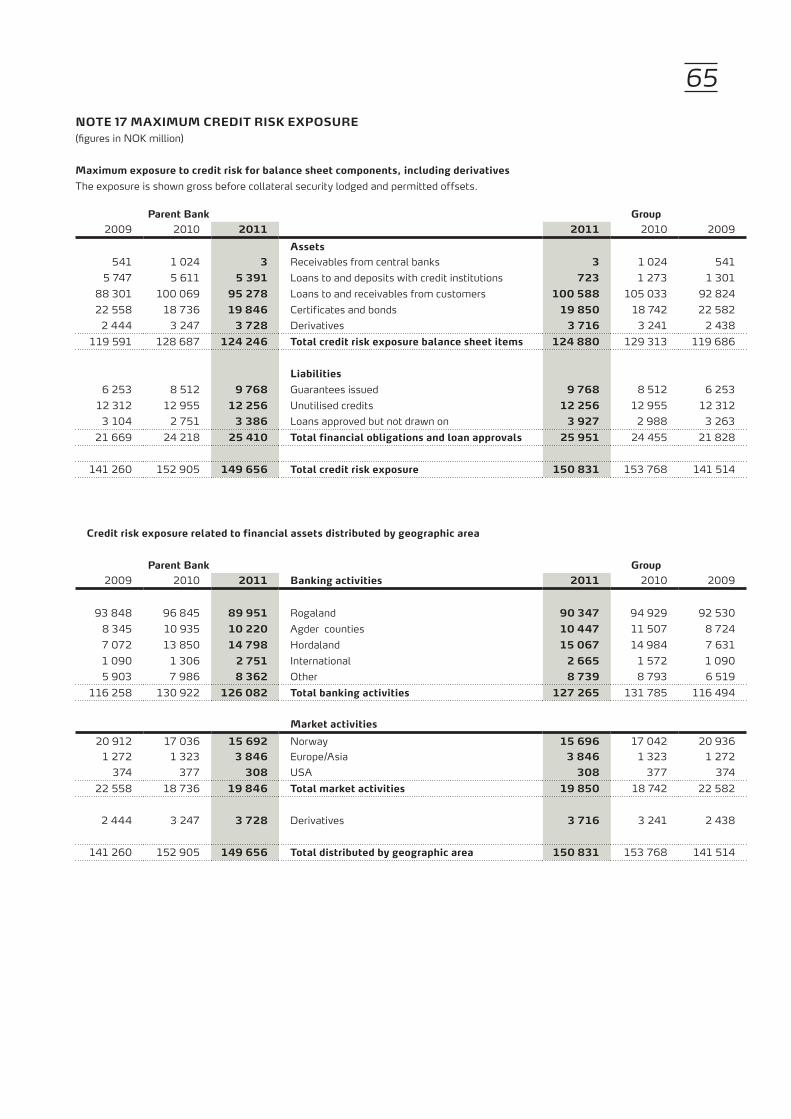
65nOte 17 MaXiMuM credit risK eXPOsure(figures in NOK million)
Maximum exposure to credit risk for balance sheet components, including derivatives The exposure is shown gross before collateral security lodged and permitted offsets.
Parent bank group 2009 2010 2011 2011 2010 2009
assets 541 1 024 3 Receivables from central banks 3 1 024 541
5 747 5 611 5 391 Loans to and deposits with credit institutions 723 1 273 1 301 88 301 100 069 95 278 Loans to and receivables from customers 100 588 105 033 92 824 22 558 18 736 19 846 Certificates and bonds 19 850 18 742 22 582
2 444 3 247 3 728 Derivatives 3 716 3 241 2 438 119 591 128 687 124 246 total credit risk exposure balance sheet items 124 880 129 313 119 686
Liabilities 6 253 8 512 9 768 Guarantees issued 9 768 8 512 6 253
12 312 12 955 12 256 Unutilised credits 12 256 12 955 12 312 3 104 2 751 3 386 Loans approved but not drawn on 3 927 2 988 3 263
21 669 24 218 25 410 total financial obligations and loan approvals 25 951 24 455 21 828
141 260 152 905 149 656 total credit risk exposure 150 831 153 768 141 514
credit risk exposure related to financial assets distributed by geographic area
Parent bank group 2009 2010 2011 banking activities 2011 2010 2009
93 848 96 845 89 951 Rogaland 90 347 94 929 92 530 8 345 10 935 10 220 Agder counties 10 447 11 507 8 724 7 072 13 850 14 798 Hordaland 15 067 14 984 7 631 1 090 1 306 2 751 International 2 665 1 572 1 090 5 903 7 986 8 362 Other 8 739 8 793 6 519
116 258 130 922 126 082 total banking activities 127 265 131 785 116 494
Market activities 20 912 17 036 15 692 Norway 15 696 17 042 20 936
1 272 1 323 3 846 Europe/Asia 3 846 1 323 1 272 374 377 308 USA 308 377 374
22 558 18 736 19 846 total market activities 19 850 18 742 22 582
2 444 3 247 3 728 Derivatives 3 716 3 241 2 438
141 260 152 905 149 656 total distributed by geographic area 150 831 153 768 141 514

66nOte 18 credit QuaLitY Per cLass Of financiaL assets(figures in NOK million) The bank handles the credit quality of financial assets in accordance with its internal guidelines for credit ratings. The table shows the credit quality per class of assets for loan-related assets in the balance sheet, based on the bank’s own credit rating system.
Parent bank neither defaulted nor written down defaulted and individually
written downLowest
risk
Low riskMedium
risk High riskHighest
risk2011 totalLoansLoans to and receivable from credit institutions 5 391 - - - - - 5 391 Loans to and receivables from customers- Retail market 32 757 11 212 705 56 173 1 645 46 548 - Corporate market 14 116 21 242 9 956 199 2 340 1 097 48 950 - Undistributed - - - - - - 453 total loans 52 264 32 454 10 661 255 2 513 2 742 101 342
financial investmentsNorwegian government bonds 3 321 - - - - - 3 321 Quoted bonds and certificates 14 591 698 411 163 90 - 15 953 Unquoted bonds and certificates 95 2 148 117 87 - 449 Earned interest - - - - - - 123 total financial investments 18 007 700 559 280 177 - 19 846 total loan-related assets 70 271 33 154 11 220 535 2 690 2 742 121 188
2010LoansLoans to and receivable from credit institutions 5 611 - - - - - 5 611 Loans to and receivables from customers- Retail market 10 481 43 438 378 13 58 1 148 55 516 - Corporate market 15 523 19 638 6 420 718 1 212 1 379 44 890 - Undistributed - - - - - - 323 total loans 31 615 63 076 6 798 731 1 270 2 527 106 340
financial investmentsNorwegian government bonds 2 165 - - - - - 2 165 Quoted bonds and certificates 11 424 935 318 119 61 - 12 857 Unquoted bonds and certificates 2 308 628 532 84 108 - 3 660 Earned interest - - - - - - 54 total financial investments 15 897 1 563 850 203 169 - 18 736 total loan-related assets 47 512 64 639 7 648 934 1 439 2 527 125 076
2009LoansLoans to and receivable from credit institutions 5 747 - - - - - 5 747 Loans to and receivables from customers- Retail market 32 697 11 436 512 27 76 202 44 950 - Corporate market 12 423 17 648 10 429 254 2 108 799 43 661 - Undistributed - - - - - - 272 total loans 50 867 29 084 10 941 281 2 184 1 001 94 630
financial investmentsNorwegian government bonds 6 363 - - - - - 6 363 Quoted bonds and certificates 11 001 993 369 103 12 - 12 478 Unquoted bonds and certificates 1 702 1 413 403 109 45 - 3 672 Earned interest - - - - - - 45 total financial investments 19 066 2 406 772 212 57 - 22 558 total loan-related assets 69 933 31 490 11 713 493 2 241 1 001 117 188
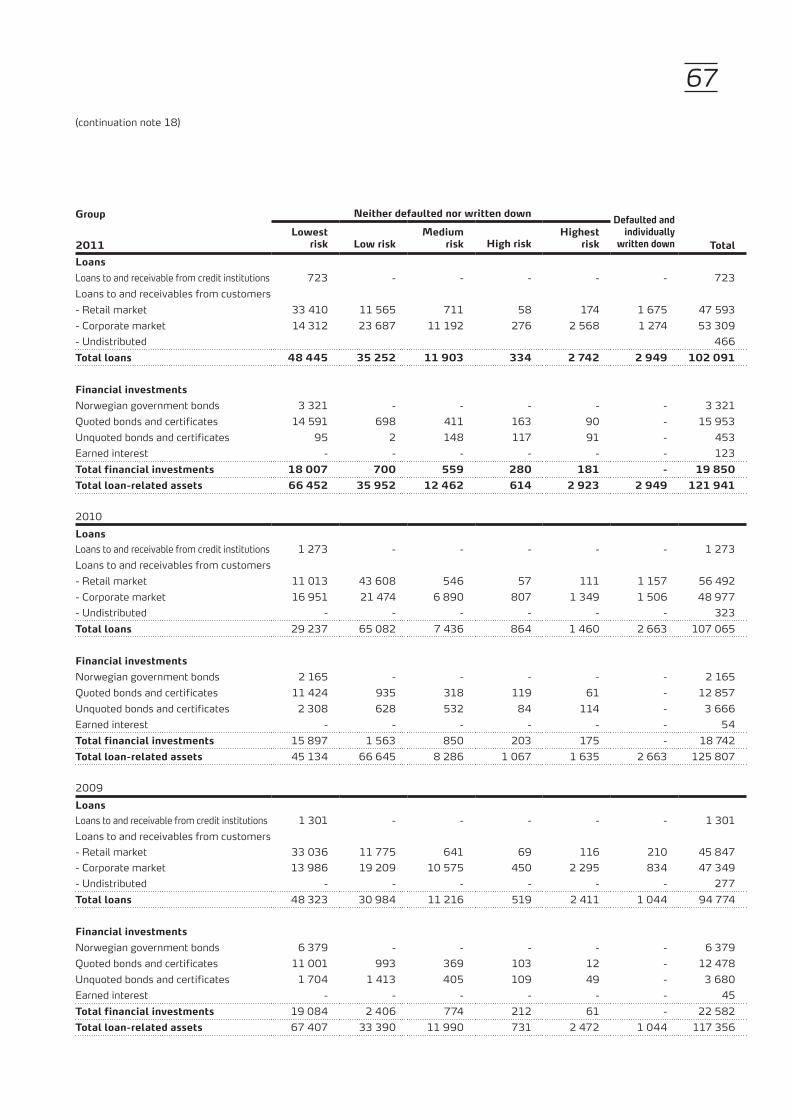
67
group neither defaulted nor written down defaulted and individually
written downLowest
risk
Low riskMedium
risk High riskHighest
risk2011 totalLoansLoans to and receivable from credit institutions 723 - - - - - 723 Loans to and receivables from customers- Retail market 33 410 11 565 711 58 174 1 675 47 593 - Corporate market 14 312 23 687 11 192 276 2 568 1 274 53 309 - Undistributed 466 total loans 48 445 35 252 11 903 334 2 742 2 949 102 091
financial investmentsNorwegian government bonds 3 321 - - - - - 3 321 Quoted bonds and certificates 14 591 698 411 163 90 - 15 953 Unquoted bonds and certificates 95 2 148 117 91 - 453 Earned interest - - - - - - 123 total financial investments 18 007 700 559 280 181 - 19 850 total loan-related assets 66 452 35 952 12 462 614 2 923 2 949 121 941
2010LoansLoans to and receivable from credit institutions 1 273 - - - - - 1 273 Loans to and receivables from customers- Retail market 11 013 43 608 546 57 111 1 157 56 492 - Corporate market 16 951 21 474 6 890 807 1 349 1 506 48 977 - Undistributed - - - - - - 323 total loans 29 237 65 082 7 436 864 1 460 2 663 107 065
financial investmentsNorwegian government bonds 2 165 - - - - - 2 165 Quoted bonds and certificates 11 424 935 318 119 61 - 12 857 Unquoted bonds and certificates 2 308 628 532 84 114 - 3 666 Earned interest - - - - - - 54 total financial investments 15 897 1 563 850 203 175 - 18 742 total loan-related assets 45 134 66 645 8 286 1 067 1 635 2 663 125 807
2009LoansLoans to and receivable from credit institutions 1 301 - - - - - 1 301 Loans to and receivables from customers- Retail market 33 036 11 775 641 69 116 210 45 847 - Corporate market 13 986 19 209 10 575 450 2 295 834 47 349 - Undistributed - - - - - - 277 total loans 48 323 30 984 11 216 519 2 411 1 044 94 774
financial investmentsNorwegian government bonds 6 379 - - - - - 6 379 Quoted bonds and certificates 11 001 993 369 103 12 - 12 478 Unquoted bonds and certificates 1 704 1 413 405 109 49 - 3 680 Earned interest - - - - - - 45 total financial investments 19 084 2 406 774 212 61 - 22 582 total loan-related assets 67 407 33 390 11 990 731 2 472 1 044 117 356
(continuation note 18)

68
classification of financial investments:Bonds are allocated to SpareBank 1 SR-Bank’s own risk classes based on external ratings. If a security has an official rating, this is to be applied, but if no official rating exists, external brokers’ shadow ratings are used as the basis for risk classification. The list below illustrates the relationship between SpareBank 1 SR-Bank’s risk classes and Standard & Poor’s rating matrix (Long-Term Credit Ratings).
the bank's credit risk classes s&P ratingLowest risk AAA, AA+, AA and AA-Low risk A+, A and A-Medium risk BBB+, BBB, BBB-High risk BB+, BB, BB-Highest risk B+ and lower
(continuation note 18)
nOte 19 certificates and bOnds (figures in NOK million)
Parent bank group2009 2010 2011 certificates and bonds at fair value 2011 2010 2009
government 6 414 2 187 3 677 Nominal value 3 677 2 187 6 430 6 363 2 165 3 677 Fair value 3 677 2 165 6 379
Other public sector issuers 53 - 52 Nominal value 52 - 53 53 - 52 Fair value 52 - 53
financial enterprises 3 803 5 223 6 982 Nominal value 6 982 5 223 3 807 3 874 5 257 6 970 Fair value 6 970 5 257 3 878
non-financial enterprises 329 475 514 Nominal value 523 485 333 314 461 507 Fair value 511 467 318
10 599 7 885 11 225 total certificates and bonds at nominal value 11 234 7 895 10 623 10 604 7 883 11 206 total certificates and bonds at fair value 11 210 7 889 10 628
certificates and bonds at amortised cost financial enterprises
11 691 10 608 8 396 Nominal value 8 396 10 608 11 691 11 663 10 592 8 389 Book value 8 389 10 592 11 663
non-financial enterprises 248 208 128 Nominal value 128 208 248 246 207 128 Book value 128 207 246
11 939 10 816 8 524 total certificates and bonds at nominal value 8 524 10 816 11 939 11 909 10 799 8 517 total certificates and bonds at amortised cost 8 517 10 799 11 909
45 54 123 Earned interest 123 54 45 22 558 18 736 19 846 total certificates and bonds 19 850 18 742 22 582
reclassification of financial assetsIn conjunction with the extraordinary and negative developments in the world’s financial markets in third quarter 2008, IASB adopted amendments to IAS 39 and IFRS 7 on 13 October 2008. The changes allowed for the reclassification of parts or the whole of the portfolio of financial assets with retrospective effect to 1 July 2008. SpareBank 1 SR-Bank has chosen to make use of this opportunity and has chosen to reclassify parts of the bond portfolio to categories that are assessed at amortised cost, i.e. ”Held to maturity” or ”Loans and receivables”. A corresponding reclassification has not been carried out in subsidiaries.
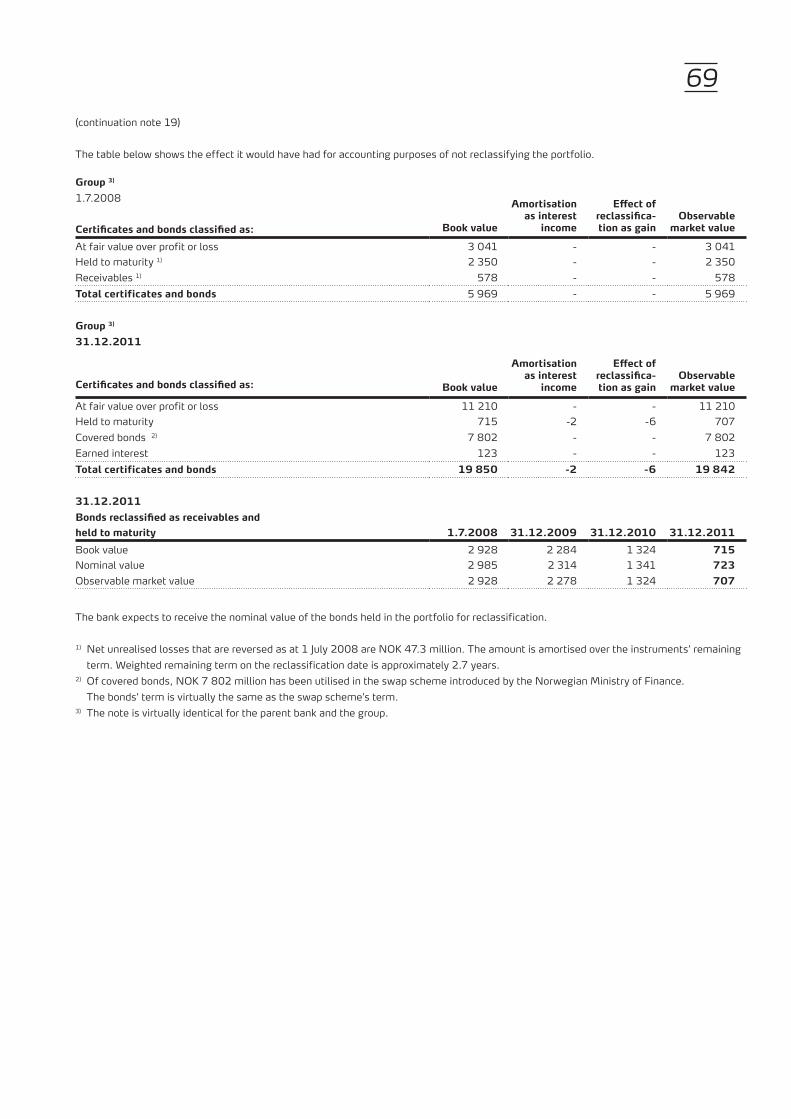
69
group 3)
1.7.2008
book value
amortisation as interest
income
effect of reclassifica-tion as gain
Observable market valuecertificates and bonds classified as:
At fair value over profit or loss 3 041 - - 3 041 Held to maturity 1) 2 350 - - 2 350 Receivables 1) 578 - - 578 total certificates and bonds 5 969 - - 5 969
group 3)
31.12.2011
book value
amortisation as interest
income
effect of reclassifica-tion as gain
Observable market valuecertificates and bonds classified as:
At fair value over profit or loss 11 210 - - 11 210 Held to maturity 715 -2 -6 707 Covered bonds 2) 7 802 - - 7 802 Earned interest 123 - - 123 total certificates and bonds 19 850 -2 -6 19 842
31.12.2011bonds reclassified as receivables and held to maturity 1.7.2008 31.12.2009 31.12.2010 31.12.2011Book value 2 928 2 284 1 324 715Nominal value 2 985 2 314 1 341 723Observable market value 2 928 2 278 1 324 707
The table below shows the effect it would have had for accounting purposes of not reclassifying the portfolio.
(continuation note 19)
The bank expects to receive the nominal value of the bonds held in the portfolio for reclassification.
1) Net unrealised losses that are reversed as at 1 July 2008 are NOK 47.3 million. The amount is amortised over the instruments’ remaining term. Weighted remaining term on the reclassification date is approximately 2.7 years.
2) Of covered bonds, NOK 7 802 million has been utilised in the swap scheme introduced by the Norwegian Ministry of Finance. The bonds’ term is virtually the same as the swap scheme’s term.
3) The note is virtually identical for the parent bank and the group.

70nOte 20 financiaL deriVatiVes
general description:The fair value of financial derivatives is usually determined by using valuation methods where the price of the underlying object, for example interest and currency rates, is obtained from the market. If the Group’s risk position is approximately neutral, middle rates will be used. A neutral risk position means, for example, that the interest rate risk within a re-pricing interval is approximately zero. Otherwise, the relevant purchase or sales price is used to assess the net position. For derivatives where the other party has a weaker credit rating than the Group, the price will reflect the underlying credit risk. If market prices are obtained based on transactions with a lower credit risk, this will be taken into account by accruing the original price difference for future credit losses.
The Group has hedged certain fixed-rate borrowings. Each hedge is documented with a reference to the Group’s risk management strategy, a clear identification of the item being hedged, the hedging instrument used, a description of the hedged risk, a description of why hedging is regarded as highly probable and a description of how and when the Group shall determine the efficiency of the hedge during the accounting period and that it is expected to be very effective during the next accounting period. The Group has defined the hedged risk as value changes linked to the NIBOR component of the hedged fixed interest rates in NOK and value changes linked to LIBOR and the currency components of the hedged fixed interest rates in foreign currencies.
The Group uses interest rate swaps as hedging instruments, where the Group receives fixed interest in NOK or a foreign currency and makes payments based on a floating (for the most part 3 months) NIBOR rate. As of 31 December 2011, the net fair value of hedging instruments was NOK 1 549 million, (NOK 1 680 million in assets and NOK 131 million in liabilities). In 2010, the corresponding figures were NOK 1 307 million (NOK 1 486 million in assets and NOK 179 million in liabilities) and in 2009 the figures were NOK 912 million (NOK 1 073 million in assets and NOK 161 million in liabilities. In 2011, the ineffective result on hedging instruments was minus NOK 4 million.
group 1)
(figures in NOK million)2011 2010
fair value fair valueat fair value over profit or loss contract amount assets Liabilities contract amount assets liabilities
currency instrumentsForward contracts 3 470 52 79 3 972 69 126 Currency swaps 13 817 193 325 14 845 240 452 Currency options 80 - - 94 2 2 total currency instruments 17 367 245 404 18 911 311 580
interest rate instrumentsInterest rate swaps (swaps and cross currency) 99 699 1 357 1 253 97 528 1 001 1 224 Other interest rate contracts 1 000 - 2 6 391 1 - interest rate instruments 100 699 1 357 1 255 103 919 1 002 1 224
interest rate instruments, hedgingInterest rate swaps (swaps and cross currency) 24 697 1 680 131 25 250 1 486 179 total interest rate instruments, hedging 24 697 1 680 131 25 250 1 486 179
earned interestEarned interest - 434 220 - 442 229 total earned interest - 434 220 - 442 229
Total currency instruments 17 367 245 404 18 911 311 580 Total interest rate instruments 125 396 3 037 1 386 129 169 2 488 1 403 Total earned interest - 434 220 - 442 229 total currency and interest rate instruments 142 763 3 716 2 010 148 080 3 241 2 212

71
2009fair value
at fair value over profit or loss contract amount assets liabilities
currency instrumentsForward contracts 3 813 80 96 Currency swaps 9 029 231 206 Currency options - - - total currency instruments 12 842 311 302
interest rate instrumentsInterest rate swaps (swaps and cross currency) 93 032 543 748 Other interest rate contracts - - - interest rate instruments 93 032 543 748
interest rate instruments, hedgingInterest rate swaps (swaps and cross currency) 19 780 1 073 161 total interest rate instruments, hedging 19 780 1 073 161
earned interestEarned interest - 511 365 total earned interest - 511 365
Total currency instruments 12 842 311 302 Total interest rate instruments 112 812 1 616 909 Total earned interest - 511 365 total currency and interest rate instruments 125 654 2 438 1 576
1) The note is virtually the same for the parent bank.
(continuation note 20)
nOte 21 sHares, units and OtHer eQuitY interests (figures in NOK million)
Parent bank group2009 2010 2011 2011 2010 2009
At fair value through profit or loss9 73 172 - Listed 173 79 14
430 464 316 - Unlisted 454 578 423439 537 488 total at fair value through profit or loss 627 657 437
Available for sale2 4 3 - Unlisted 4 4 22 4 3 total available for sale 4 4 2
total shares, units 441 541 491 and other equity interests 631 661 439
Shares, units and other equity interests are classified in the categories fair value and held for sale. Securities that can be measured in a reliable manner and reported internally at fair value are classified at fair value through profit or loss. Other shares are classified as available for sale.
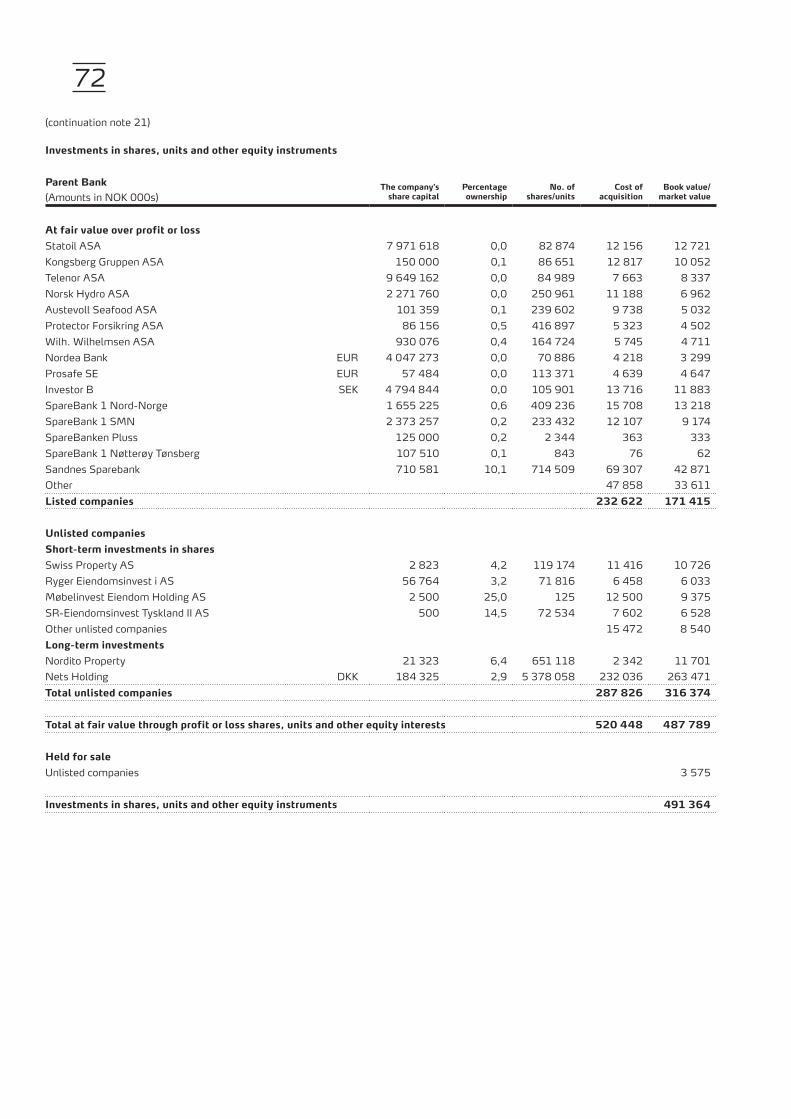
72
investments in shares, units and other equity instruments
Parent bank the company’s share capital
Percentage ownership
no. of shares/units
cost of acquisition
book value/market value(Amounts in NOK 000s)
at fair value over profit or lossStatoil ASA 7 971 618 0,0 82 874 12 156 12 721Kongsberg Gruppen ASA 150 000 0,1 86 651 12 817 10 052Telenor ASA 9 649 162 0,0 84 989 7 663 8 337Norsk Hydro ASA 2 271 760 0,0 250 961 11 188 6 962Austevoll Seafood ASA 101 359 0,1 239 602 9 738 5 032Protector Forsikring ASA 86 156 0,5 416 897 5 323 4 502Wilh. Wilhelmsen ASA 930 076 0,4 164 724 5 745 4 711Nordea Bank EUR 4 047 273 0,0 70 886 4 218 3 299Prosafe SE EUR 57 484 0,0 113 371 4 639 4 647Investor B SEK 4 794 844 0,0 105 901 13 716 11 883SpareBank 1 Nord-Norge 1 655 225 0,6 409 236 15 708 13 218SpareBank 1 SMN 2 373 257 0,2 233 432 12 107 9 174SpareBanken Pluss 125 000 0,2 2 344 363 333SpareBank 1 Nøtterøy Tønsberg 107 510 0,1 843 76 62Sandnes Sparebank 710 581 10,1 714 509 69 307 42 871Other 47 858 33 611Listed companies 232 622 171 415
unlisted companies short-term investments in sharesSwiss Property AS 2 823 4,2 119 174 11 416 10 726Ryger Eiendomsinvest i AS 56 764 3,2 71 816 6 458 6 033Møbelinvest Eiendom Holding AS 2 500 25,0 125 12 500 9 375SR-Eiendomsinvest Tyskland II AS 500 14,5 72 534 7 602 6 528Other unlisted companies 15 472 8 540Long-term investmentsNordito Property 21 323 6,4 651 118 2 342 11 701Nets Holding DKK 184 325 2,9 5 378 058 232 036 263 471total unlisted companies 287 826 316 374 total at fair value through profit or loss shares, units and other equity interests 520 448 487 789
Held for sale Unlisted companies 3 575 investments in shares, units and other equity instruments 491 364
(continuation note 21)

73
investments in shares, units and other equity instruments
group the company’s share capital
Percentage ownership
no. of shares/units
cost of acquisition
book value/market value(Amounts in NOK 000s)
at fair value over profit or losstotal listed companies parent bank 232 622 171 415Austevoll Seafood 101 359 0,0 81 000 3 159 1 701Codfarmers ASA 42 284 0,1 47 588 - 120total listed companies subsidiaries 3 159 1 821total listed companies group 235 781 173 236
total unlisted companies parent bank 287 826 316 374Borea Opportunity II 314 720 2,2 7 000 7 000 9 520Progressus 2 766 4,2 117 139 11 714 15 931Viking Venture II 3 422 1,4 47 525 4 676 2 329HitecVision Private Equity IV LP 2,0 23 693 30 718HitecVision Asset Solution 1,2 10 074 10 067OptiMarin 1 998 13,0 260 041 11 024 20 075Energy Ventures III 1,1 9 170 8 974Reiten & Co AS 0,5 7 100 7 154Skagerak Ventures AS 3,9 7 791 4 710SR Feeder KS 26,9 5 732 6 936SR PE-Feeder II KS 9,8 7 931 9 309SR PE-Feeder III KS 40,5 4 968 4 968Other unlisted companies in subsidiaries 17 195 6 699total unlisted in subsidiaries 128 068 137 390total unlisted in group 415 894 453 764total at fair value through profit or loss shares, units and other equity interests 651 675 627 000
Held for sale Unlisted companies parent bank 3 575Total unlisted companies in subsidiaries 441total shares, units and other equity interests group 631 016
(continuation note 21)
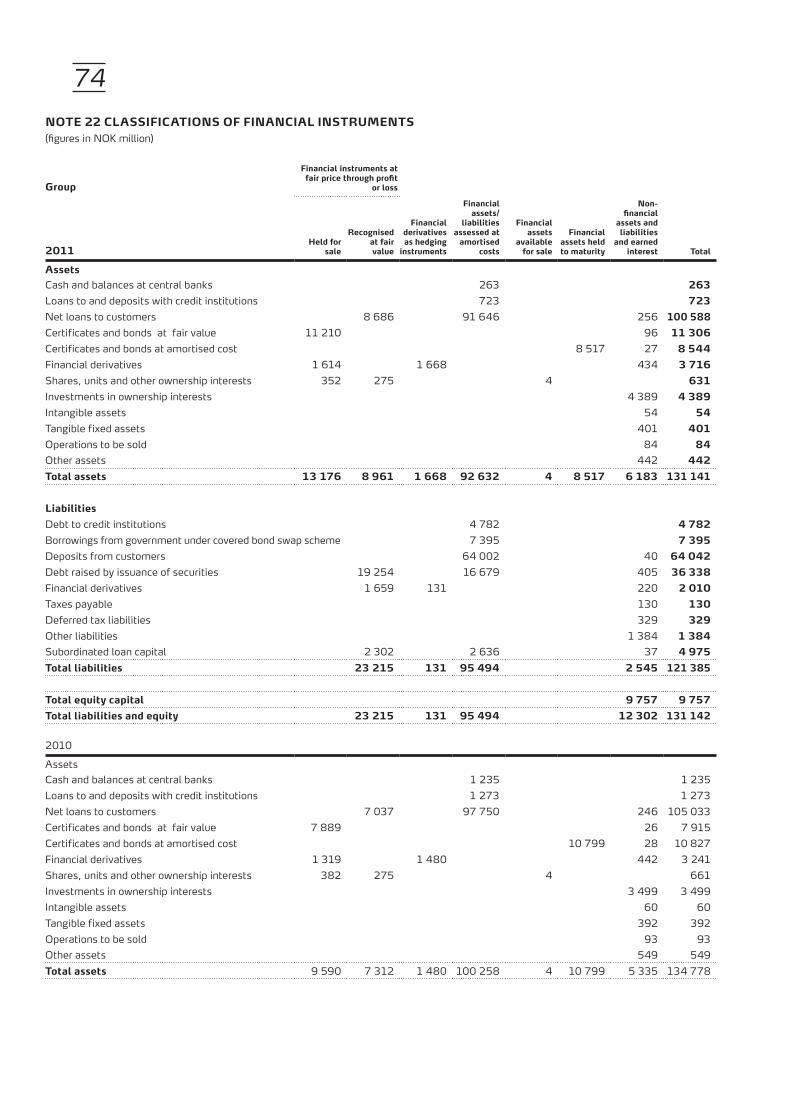
74nOte 22 cLassificatiOns Of financiaL instruMents (figures in NOK million)
group
financial instruments at fair price through profit
or loss
2011Held for
sale
recognised at fair value
financial derivatives as hedging
instruments
financial assets/
liabilities assessed at
amortised costs
financial assets
available for sale
financial assets held to maturity
non-financial
assets and liabilities
and earned interest total
assetsCash and balances at central banks 263 263 Loans to and deposits with credit institutions 723 723 Net loans to customers 8 686 91 646 256 100 588 Certificates and bonds at fair value 11 210 96 11 306 Certificates and bonds at amortised cost 8 517 27 8 544 Financial derivatives 1 614 1 668 434 3 716 Shares, units and other ownership interests 352 275 4 631 Investments in ownership interests 4 389 4 389 Intangible assets 54 54 Tangible fixed assets 401 401 Operations to be sold 84 84 Other assets 442 442 total assets 13 176 8 961 1 668 92 632 4 8 517 6 183 131 141
LiabilitiesDebt to credit institutions 4 782 4 782 Borrowings from government under covered bond swap scheme 7 395 7 395 Deposits from customers 64 002 40 64 042 Debt raised by issuance of securities 19 254 16 679 405 36 338 Financial derivatives 1 659 131 220 2 010 Taxes payable 130 130 Deferred tax liabilities 329 329 Other liabilities 1 384 1 384 Subordinated loan capital 2 302 2 636 37 4 975 total liabilities 23 215 131 95 494 2 545 121 385
total equity capital 9 757 9 757 total liabilities and equity 23 215 131 95 494 12 302 131 142
2010
AssetsCash and balances at central banks 1 235 1 235 Loans to and deposits with credit institutions 1 273 1 273 Net loans to customers 7 037 97 750 246 105 033 Certificates and bonds at fair value 7 889 26 7 915Certificates and bonds at amortised cost 10 799 28 10 827 Financial derivatives 1 319 1 480 442 3 241 Shares, units and other ownership interests 382 275 4 661 Investments in ownership interests 3 499 3 499 Intangible assets 60 60 Tangible fixed assets 392 392 Operations to be sold 93 93 Other assets 549 549 total assets 9 590 7 312 1 480 100 258 4 10 799 5 335 134 778

75
financial instruments at fair price through profit
or loss
Liabilities Held for
sale
recognised at fair value
financial derivatives as hedging
instruments
financial assets/
liabilities assessed at
amortised costs
financial assets
available for sale
financial assets held to maturity
non-financial
assets and liabilities
and earned interest total
Debt to credit institutions 7 359 7 359 Borrowings from government under covered bond swap scheme 8 832 8 832 Deposits from customers 60 737 33 60 770 Debt raised by issuance of securities 19 277 20 666 364 40 307 Financial derivatives 1 804 179 229 2 212 Taxes payable 326 326 Deferred tax liabilities 138 138 Other liabilities 1 288 1 288 Subordinated loan capital 2 407 1 712 25 4 144 total liabilities 23 488 179 99 306 2 403 125 376
total equity capital 9 402 9 402 total liabilities and equity 23 488 179 99 306 11 805 134 778
2009
assetsCash and balances at central banks 781 781 Loans to and deposits with credit institutions 1 301 1 301 Net loans to customers 7 106 85 505 213 92 824 Certificates and bonds at fair value 10 628 19 10 647 Certificates and bonds at amortised cost 11 909 26 11 935 Financial derivatives 854 1 073 511 2 438 Shares, units and other ownership interests 286 151 2 439 Investments in ownership interests 3 127 3 127 Intangible assets 40 40 Tangible fixed assets 935 935 Operations to be sold 23 23 Other assets 419 419 total assets 10 914 8 111 1 073 87 587 2 11 909 5 313 124 909
Liabilities Debt to credit institutions 8 852 8 852 Borrowings from government under covered bond swap scheme 8 832 8 832 Deposits from customers 54 286 50 54 336 Debt raised by issuance of securities 11 380 25 923 220 37 523 Financial derivatives 1 050 161 365 1 576 Taxes payable 223 223 Deferred tax liabilities 162 162 Other liabilities 1 461 1 461 Subordinated loan capital 1 662 2 187 22 3 871 total liabilities 14 092 161 100 080 2 503 116 836
total equity capital 8 073 8 073 total liabilities and equity 14 092 161 100 080 10 576 124 909
(continuation note 22)

76
information on fair valuegroup
2011
Value according to prices in an active
market
Value according to observable market
data
Value on basis other than observa-
ble market data total
assetsNet lending to customers - 8 686 - 8 686 Certificates and bonds at fair value 9 263 1 947 - 11 210 Financial derivatives - 1 614 - 1 614 Shares, unit and other equity instruments 352 - 275 627
LiabilitiesDebt raised on issuance of securities 19 254 - - 19 254 Financial derivatives 1 659 - - 1 659 Subordinated loan 2 302 - - 2 302
2010assetsNet lending to customers - 7 037 - 7 037 Certificates and bonds at fair value 444 7 445 - 7 889 Financial derivatives - 1 319 - 1 319 Shares, unit and other equity instruments 382 - 275 657
LiabilitiesDebt raised on issuance of securities 19 277 - - 19 277 Financial derivatives 1 804 - - 1 804 Subordinated loan 2 407 - - 2 407
2009assetsNet lending to customers - 7 106 - 7 106 Certificates and bonds at fair value 3 461 7 167 - 10 628 Financial derivatives - 1 927 - 1 927 Shares, unit and other equity instruments 286 - 151 437
LiabilitiesDebt raised on issuance of securities - 11 380 - 11 380 Financial derivatives - 1 050 - 1 050 Subordinated loan - 1 662 - 1 662
change in holding during the accounting year of assets valued using other than observable market datagroup
shares, units and other equity instruments 2009 2010 2011Balance as at 1.1. 92 151 275Additions - 234 -Disposals - -151 -Change in value 59 41 - balance as at 31.12. 151 275 275
Financial instruments valued at other than observable market data are included in change in holding in accordance with IFRS 7.
(continuation note 22)

77
Parent bank group2009 2010 2011 2011 2010 2009
27 31 34 Taxes withheld 49 44 38 27 31 34 total restricted funds 49 44 38
nOte 23 restricted funds(figures in NOK million)
subsidiaries, associated companies and joint ventures
company acquisition dateregisteredhead office
Percentage ownership 1)
investments in subsidiariesshares held by the parent bankSpareBank 1 SR-Finans 1987 Stavanger 100,00EiendomsMegler 1 SR-Eiendom 1990 Stavanger 100,00Westbroker Finans 1990 Stavanger 100,00SR-Forvaltning 2001 Stavanger 100,00SR-Investering 2005 Stavanger 100,00SR-Forretningsservice 2007 Stavanger 100,00Kvinnherad Sparebank Eigedom 2010 Stavanger 100,00shares held by subsidiariesJærmegleren 2007 Stavanger 100,00EiendomsMegler 1 Drift 2006 Stavanger 100,00investments in associated companiesAdmi-senteret 1984 Jørpeland 50,00SpareBank 1 Boligkreditt 2005 Stavanger 34,40SpareBank 1 Næringskreditt 2009 Stavanger 30,71Samarbeidende Sparebanker Bankinvest 2010 Oslo 3,15investments in joint ventures SpareBank 1 Gruppen 1996 Oslo 19,50Alliansesamarbeidet SpareBank 1 2004 Oslo 17,74BN Bank 2008 Trondheim 23,50Bank 1 Oslo Akershus 2010 Oslo 19,50
1) Voting rights and ownership share are equal in all companies 2) See note 25 for further information relating to the acquisition of Kvinnherad Sparebank
nOte 24 inVestMents in OwnersHiP interests

78
subsidiaries
shares in subsidiaries parent bankInvestments are recognised at the parent bank’s acquisition cost. These items are fully consolidated in the group accounts. (Amounts in NOK 000s)
share capital
Percentage stake
no. ofshares
nominal value assets Liabilities
total income
totalexpenses
Profit orloss for
the yearbook value2011
SpareBank 1 SR-Finans 167 000 100,00 334 000 167 000 5 404 334 4 922 366 152 269 35 122 71 748 439 566 total investments in credit institutions 167 000 5 404 334 4 922 366 152 269 35 122 71 748 439 566 EiendomsMegler 1 SR-Eiendom 1 500 100,00 150 1 500 309 320 260 541 435 545 344 508 61 082 56 885 Westbroker Finans 100 100,00 100 100 - - - - - - SR-Investering 35 000 100,00 3 500 35 000 197 284 16 013 15 122 3 939 10 530 175 527 SR-Forvaltning 6 000 100,00 6 000 6 000 50 616 36 766 45 877 18 482 19 687 29 019 SR-Forretningsservice 100 100,00 1 000 100 1 212 350 705 396 222 125 Kvinnherad Sparebank Eigedom 15 000 100,00 3 000 15 000 19 500 263 1 131 683 323 15 061 total other investments 57 700 577 932 313 933 498 380 368 008 91 844 276 617 total investments in subsidiaries parent bank 224 700 5 982 266 5 236 299 650 649 403 130 163 592 716 183
2010
SpareBank 1 SR-Finans 167 000 100,00 334 000 167 000 5 005 119 4 564 790 163 212 38 413 55 882 418 686 total investments in credit institutions 167 000 5 005 119 4 564 790 163 212 38 413 55 882 418 686 EiendomsMegler 1 SR-Eiendom 1 500 100,00 150 1 500 231 508 194 190 376 412 317 814 42 012 45 365 Westbroker Finans 100 100,00 100 100 - - - - - - SR-Investering 35 000 100,00 3 500 35 000 186 692 7 094 12 249 4 755 7 276 174 087 SR-Forvaltning 6 000 100,00 6 000 6 000 46 428 34 065 43 002 22 123 14 997 29 019 SR-Forretningsservice 100 100,00 1 000 100 817 177 695 447 178 125 SpareBank 1 SR-Fondsforvaltning 1 000 100,00 10 000 1 000 11 900 3 878 4 351 10 902 -4 719 11 636 Kvinnherad Sparebank Eigedom 15 000 100,00 3 000 15 000 23 606 231 1 048 878 122 15 061 total other investments 58 700 500 951 239 635 437 757 356 919 59 866 275 293 total investments in subsidiaries parent bank 225 700 5 506 070 4 804 425 600 969 395 332 115 748 693 979
2009
SpareBank 1 SR-Finans 167 000 100,00 334 000 167 000 5 088 748 4 678 748 182 068 33 185 82 183 337 233 total investments in credit institutions 167 000 5 088 748 4 678 748 182 068 33 185 82 183 337 233 EiendomsMegler 1 SR-Eiendom 1 500 100,00 150 1 500 182 425 159 775 319 539 278 536 29 443 18 120 Westbroker Finans 100 100,00 100 100 - - - - - - SR-Investering 35 000 100,00 3 500 35 000 176 302 5 379 -3 207 4 858 -7 402 161 847 SR-Forvaltning 6 000 100,00 6 000 6 000 42 713 34 678 40 154 21 228 13 588 29 019 SR-Forretningsservice 100 100,00 1 000 100 945 481 2 177 1 822 259 125 Vågen Eiendomsforvaltning 500 100,00 5 000 500 6 172 3 903 13 402 11 455 1 381 19 639 SpareBank 1 SR-Fondsforvaltning 1 000 100,00 10 000 1 000 8 649 832 1 449 6 700 -3 782 8 036 total other investments 44 200 417 206 205 048 373 514 324 599 33 487 236 786 total investments in subsidiaries parent bank 211 200 5 505 954 4 883 796 555 582 357 784 115 670 574 019
(continuation note 24)

79
investments in associated companies and joint ventures
Parent bank group2009 2010 2011 2011 2010 2009
1 204 2 253 2 448 Book value as at 1.1. 3 499 3 127 1 953 925 174 904 Additions/disposals 904 174 925 124 21 - Acquisitions - 21 124
- - - Change in equity -66 -35 3 - - - Dilution gain - - 1 - - - Badwill - - 44 - - - PPA amortisation 28 7 22 - - - Share of profit/loss 181 260 219 - - - Dividend paid -157 -55 -164
2 253 2 448 3 352 book value as at 31.12. 4 389 3 499 3 127
- - - Share of profit from SpareBank 1 Gruppen 96 166 162 - - - Share of profit from SpareBank 1 Boligkreditt 24 25 28 - - - Share of profit from SpareBank 1 Næringskreditt 7 2 - - - - Share of profit from BN Bank 36 33 29 - - - Share of profit from Bank 1 Oslo Akershus 16 37 - - - - Share of profit from Alliansesamarbeidet SpareBank 1 - -3 - - - - Share of profit from Samarbeidende Sparebanker Bankinvest 2 - -
156 23 86 Dividend from SpareBank 1 Gruppen - - - 7 32 26 Dividend from SpareBank 1 Boligkreditt - - - - - 2 Dividend from SpareBank 1 Næringskreditt - - - - - 7 Dividend from Bank 1 Oslo Akershus - - - - - 36 Dividend from BN Bank - - - 1 - - Dividend from Vågen Eiendomsmegling - - -
164 55 157 total income 181 260 219
Investments in all the companies are assessed using the cost method in the parent bank and the equity method in the Group. Investments in associated companies in the Group as at 31.12.2011 includes goodwill amounting to NOK 23 million (NOK 23 million in 2010).
(continuation note 24)

80
the group’s ownership interests in associated companies and joint ventures(figures in NOK million)
2011 assets Liabilities income expenses Profit or loss
book value
31.12. Percentage
stake no. of shares
SpareBank 1 Gruppen Oslo 8 188 7 234 1 750 1 674 93 977 19,50 364 728Alliansesamarbeidet SpareBank 1 Oslo 97 78 101 101 - 18 17,74SpareBank 1 Boligkreditt Stavanger 50 795 48 820 42 9 24 1 970 34,40 12 969 461Admi-senteret Jørpeland - - - - - 2 50,00 80BN Bank Trondheim 9 572 8 830 115 55 36 724 23,50 3 052 258SpareBank 1 Næringskreditt Stavanger 2 861 2 492 14 3 7 370 30,71 2 898 722Bank 1 Oslo Akershus Oslo 5 498 5 188 155 122 16 310 19,50 665 709Samarbeidene Sparebanker Bankinvest Oslo 19 - 2 - 2 18 3,15 327total 77 030 72 642 2 179 1 964 178 4 389
2010SpareBank 1 Gruppen Oslo 7 909 6 974 1 997 1 805 160 951 19,50 347 568Alliansesamarbeidet SpareBank 1 Oslo 68 49 73 73 - 18 17,74SpareBank 1 Boligkreditt Stavanger 30 021 28 648 43 8 25 1 376 28,57 8 999 754Admi-senteret Jørpeland 11 9 3 3 - 2 50,00 80BN Bank Trondheim 9 700 8 995 111 58 33 661 23,50 2 909 378SpareBank 1 Næringskreditt Stavanger 2 016 1 838 4 1 2 178 24,13 1 409 184Bank 1 Oslo Akershus Oslo 5 252 4 955 166 107 37 296 19,50 665 709Samarbeidene Sparebanker Bankinvest Oslo 18 - 1 - 1 17 3,15 315total 54 995 51 468 2 398 2 055 258 3 499
2009SpareBank 1 Gruppen Oslo 11 969 10 922 2 109 1 881 172 1 061 19,50 347 568Alliansesamarbeidet SpareBank 1 Oslo 56 35 89 92 -3 21 17,74SpareBank 1 Boligkreditt Stavanger 28 445 27 202 46 7 29 1 244 33,77 8 073 803Vågen Eiendomsmegling Stavanger 1 1 2 2 - 3 49,00 490Admi-senteret Jørpeland 11 9 2 2 - 1 50,00 80BN Bank Trondheim 11 174 10 496 119 63 29 625 23,50 2 909 378SpareBank 1 Næringskreditt Stavanger 1 948 1 776 2 1 - 172 23,50 1 372 400total 53 604 50 441 2 369 2 048 227 3 127
(continuation note 24)

81nOte 25 business cOMbinatiOns
Kvinnherad Sparebank was acquired with accounting effect from 1.11.2010 inasmuch as SpareBank 1 SR-Bank acquired all of the assets and liabilities of Kvinnherad Sparebank. In connection with the acquisition, SpareBank 1 SR-Bank has paid the following, at fair value:
acquisition analysis
Kvinnherad sparebank
31.10.2010
excess of pur chase
price over net assets
acquired
sparebank 1 sr-bank
1.11.2010
PaymentFair value of equity certificates issued (6 069 934) 348total payment 348
Cash with and receivables from central banks 20 20Loans to and receivables from credit institutions 99 99Net loans to customers 3 338 39 3377Securities 275 38 313Tangible fixed assets 21 21Other assets 22 22Deferred tax benefit 3 11 14Debt to credit institutions -140 -140Deposits from customers -2 381 -2381Debt raised through issuance of securities -840 -840Other liabilities -12 -30 -42Subordinated loan capital -115 -115
290 58 348
Kvinnherad Sparebank was converted into a foundation - SpareBank 1-Stiftinga Kvinnherad. In connection with SpareBank 1 SR-Bank taking over Kvinnherad Sparebank NOK 20 mill kroner was transferred to SpareBank 1 Stiftinga Kvinnherad from SpareBank 1 SR-Bank’s endowment fund.In addition, NOK 10 million was granted to Stiftelsen SR-Bank Næringsutvikling Sunnhordland and Odda (a business development foundation).
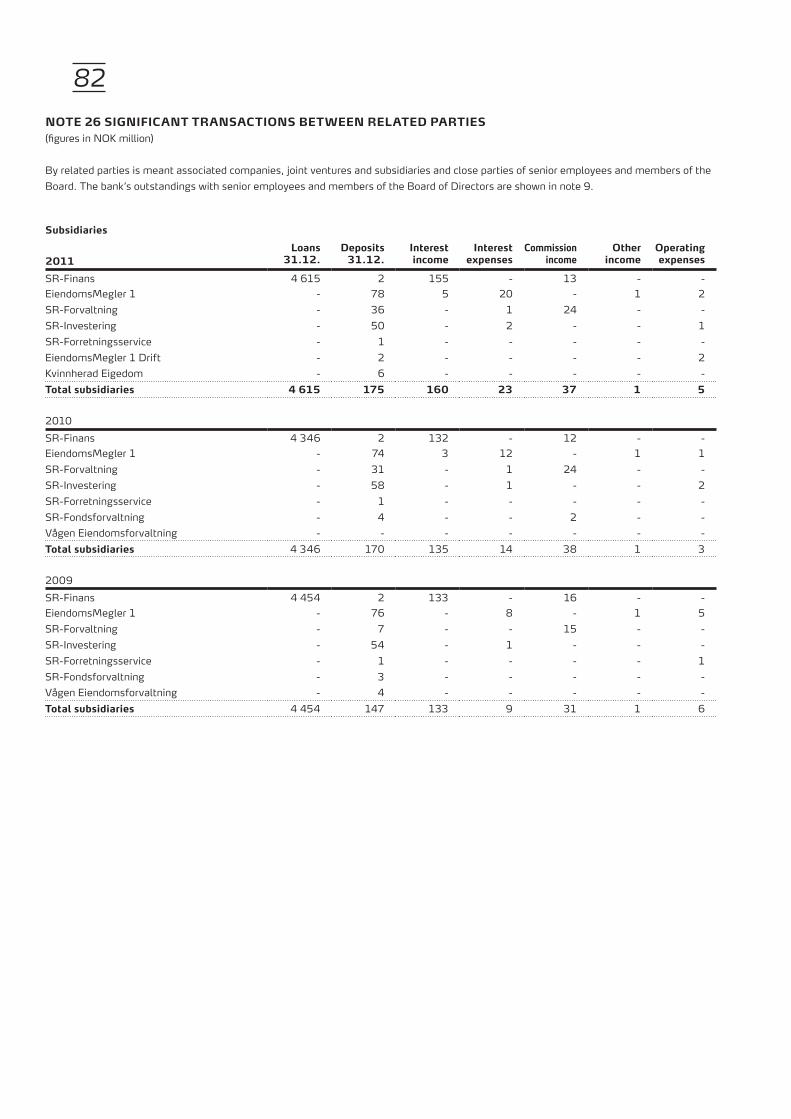
82
subsidiariesLoans
31.12.deposits
31.12.interest income
interest expenses
commission income
Other income
Operating expenses2011
SR-Finans 4 615 2 155 - 13 - - EiendomsMegler 1 - 78 5 20 - 1 2SR-Forvaltning - 36 - 1 24 - - SR-Investering - 50 - 2 - - 1SR-Forretningsservice - 1 - - - - - EiendomsMegler 1 Drift - 2 - - - - 2Kvinnherad Eigedom - 6 - - - - - total subsidiaries 4 615 175 160 23 37 1 5
2010SR-Finans 4 346 2 132 - 12 - - EiendomsMegler 1 - 74 3 12 - 1 1SR-Forvaltning - 31 - 1 24 - - SR-Investering - 58 - 1 - - 2SR-Forretningsservice - 1 - - - - - SR-Fondsforvaltning - 4 - - 2 - - Vågen Eiendomsforvaltning - - - - - - - total subsidiaries 4 346 170 135 14 38 1 3
2009SR-Finans 4 454 2 133 - 16 - - EiendomsMegler 1 - 76 - 8 - 1 5SR-Forvaltning - 7 - - 15 - - SR-Investering - 54 - 1 - - - SR-Forretningsservice - 1 - - - - 1SR-Fondsforvaltning - 3 - - - - - Vågen Eiendomsforvaltning - 4 - - - - - total subsidiaries 4 454 147 133 9 31 1 6
nOte 26 significant transactiOns between reLated Parties(figures in NOK million)
By related parties is meant associated companies, joint ventures and subsidiaries and close parties of senior employees and members of the Board. The bank’s outstandings with senior employees and members of the Board of Directors are shown in note 9.

83(continuation note 26)
transactions with parties closely related to executive management.There are no transactions with parties closely related to the executive management.
transactions with parties closely related to the boardThere are no transactions with parties closely related to the Board except for parties close to Board member Erik Edward Tønnesen who has loans of NOK 11.7 million and interest on loans by NOK 0.7 million.
associated companies and joint ventures
Loans31.12.
deposits 31.12.
interest income
interest expenses
commission income
Other income
Operating expenses2011
SpareBank 1 Gruppen 42 10 1 - 210 - - Alliansesamarbeidet SB1 - - - - - - 132SpareBank 1 Boligkreditt - 1 084 - 37 85 - - Admisenteret 17 1 1 - - - - SpareBank 1 Næringskreditt - 291 - 15 2 - - total associated companies and joint ventures 59 1 386 2 52 297 - 132
2010SpareBank 1 Gruppen 59 8 1 - 165 - - Alliansesamarbeidet SB1 - - - - - - 92SpareBank 1 Boligkreditt - 3 545 - 91 156 - - Admisenteret 18 1 1 - - - - Vågen Eiendomsmegling - - - - - - - SpareBank 1 Næringskreditt - 99 - 1 1 - - total associated companies and joint ventures 77 3 653 2 92 322 - 92
2009SpareBank 1 Gruppen 59 14 1 - 158 - - Alliansesamarbeidet SB1 - - - - - - 93SpareBank 1 Boligkreditt - 2 728 - 63 146 - - Admisenteret 19 - 1 - - - - Vågen Eiendomsmegling - 1 - - - - total associated companies and joint ventures 78 2 743 2 63 304 - 93

84nOte 27 tangibLe fiXed assets(figures in NOK million)
Parent bank group
buildings and real
estateinvestment
property
Machinery, fixture and
fittings total
buildings and real
estateinvestment
property
Machinery, fixture and
fittings total
265 22 545 832 Acquisition cost 1.1.2011 280 23 608 911 22 -10 70 82 Additions 2) 22 -10 78 90
- - - - Disposals 7 - 1 8 287 12 615 914 Acquisition cost 31.12.2011 295 13 685 993
Accumulated depreciation 96 12 358 466 and write-downs 1.1.2011 97 13 409 519
5 - 63 68 The year's depreciation 7 - 67 74 - - - - The year's disposals - - 1 1
Accumulated depreciation 101 12 421 534 and write-downs 31.12.2011 104 13 475 592
186 - 194 380 book value 31.12.2011 191 - 210 401
437 fair value 437
196 22 495 713 Acquisition cost 1.1.2010 196 639 553 1 388 69 - 50 119 Additions 1) 84 - 56 140
- - - - Disposals - 616 1 617 265 22 545 832 Acquisition cost 31.12.2010 280 23 608 911
Accumulated depreciation 94 10 300 404 and write-downs 1.1.2010 94 11 348 453
2 2 58 62 The year's depreciation 3 5 62 70 - - - - The year's disposals - 3 1 4
Accumulated depreciation 96 12 358 466 and write-downs 31.12.2010 97 13 409 519
169 10 187 366 Book value 31.12.2010 183 10 199 392
326 42 Fair value 341 42
212 19 541 772 Acquisition cost 1.1.2009 211 20 597 828 - 3 67 70 Additions 1) 1 619 69 689
16 - 113 129 Disposals 16 - 113 129 196 22 495 713 Acquisition cost 31.12.2009 196 639 553 1 388
Accumulated depreciation 92 10 344 446 and write-downs 1.1.2009 91 11 389 491
4 - 61 65 The year's depreciation 5 - 64 69 2 - 105 107 The year's disposals 2 - 105 107
Accumulated depreciation 94 10 300 404 and write-downs 31.12.2009 94 11 348 453
102 12 195 309 Book value 31.12.2009 102 628 205 935
239 39 Fair value 241 655
1) Includes the acquisition of Kvinnherad Sparebank, NOK 21 million. See note 25. 2) In previous years, buildings in which a small portion of the building has been leased out, have been classified as investment property. In
2011, they have been transferred to buildings and real estate. The Group uses significant parts for its own business, and these properties are therefore, not considered to be investment properties.

85
PledgesThe Group has not mortgaged/pledged or accepted any other disposal restrictions on its tangible fixed assets.
revaluation/ depreciationThe Group does not make regular revaluations of tangible fixed assets. In connection with the initial implementation of IFRS, buildings were valued at cost less accumulated depreciation in accordance with current Norwegian legislation. Percentage rate of depreciation is 14 to 33 per cent for machinery, equipment and vehicles, and 2 per cent for bank buildings, investment property and other real estate.
buildings, real estate and investment propertiesOf the total book value of buildings and real estate NOK 166 million is for use in the banking business. The fair value of buildings is determined by appraisal. Sites, buildings and parts of buildings that are owned by the Group in order to achieve rental income and/or an appreciation in value are defined as investment property. In the case of properties where the Group occupies a significant share for its own business, no part of the property is considered investment property, even if a smaller part is leased out. The Group has elected to account for the investment properties using the cost method.
Operational leasesThe group has no significant operational leases.
inVestMent PrOPertiesParent bank group
Value 1.1.2011
additions/ disposals/
depreciationValue
31.12.2011rental
income.Leased as at
31.12.2011Value
1.1.2011
additions/ disposals/
depreciationValue
31.12.2011rental
income.Leased as at
31.12.2011
5 -5 - - Bjergsted Terrasse 5 -5 - - 5 -5 - - Domkirkeplassen 5 -5 - -
10 -10 - - total 10 -10 - - -
Value 1.1.2010
additions/ disposals/
depreciationValue
31.12.2010rental
income.Leased as at
31.12.2010Value
1.1.2010
additions/ disposals/
depreciationValue
31.12.2010rental
income.Leased as at
31.12.2010
6 -1 5 1 10 % Bjergsted Terrasse 6 -1 5 - 10 % 6 -1 5 1 30 % Domkirkeplassen 6 -1 5 1 30 % - - - - - Energiveien 616 -616 - - -
12 -2 10 2 total 628 -618 10 1
Value 1.1.2009
additions/ disposals/
depreciationValue
31.12.2009rental
income.Leased as at
31.12.2009Value
1.1.2009
additions/ disposals/
depreciationValue
31.12.2009rental
income.Leased as at
31.12.2009
3 3 6 1 10 % Bjergsted Terrasse 3 3 6 - 10 % 6 - 6 1 30 % Domkirkeplassen 6 - 6 1 30 % - - - - - Energiveien - 616 616 44 100 %
9 3 12 2 total 9 619 628 45
(continuation note 27)

86
Parent bank group2009 2010 2011 2011 2010 2009
- - - Acquisition cost 1.1. 74 52 32 - - - Additions - 22 20 - - - Disposals - - - - - - Acquisition cost 31.12. 74 74 52
- - - Accumulated depreciation and write-down 1.1. 14 12 12 - - - Write down in the period 6 2 - - - - Accumulated depreciation and write-down 31.12. 20 14 12
- - - book value 31.12. 54 60 40
The amounts are the differences between identifiable assets including excess of purchase price over acquired assets in the acquired company, and the cost of the shares. The elements in the goodwill item relate to future earnings in the company supported by the calculations of the present value of expected future earnings, which document a future economic benefit from acquiring the company.
The book value as at 31.12.2011 is made up of NOK 19 million in goodwill linked to the acquisition of 100 per cent of the shares Vågen Eiendomsforvaltning AS in June 2007, and NOK 20 million linked to the acquisition of 33.3 per cent of the shares in SR-Forvaltning AS in May 2009.
NOK 1 million of the book value at 31.12.2011 relates to goodwill in EiendomsMegler 1 SR-Eiendom AS from previous years. The elements in the goodwill item are assessed annually and written down necessary. In 2011, based on a concrete assessment, a write-down of NOK 1 million was made.
NOK 7 million of the book value relates to goodwill and NOK 3 million to excess value in Eiendomsmegler 1 SR-Eiendom AS’s customer portfolio in connection with the acquisition of Boligbyrået AS in 2010. In 2010 and 2011, the excess in the customer portfolio was written down by NOK 2 million and NOK 3 million respectively, totalling NOK 5 million. The elements in the goodwill item are assessed annually and written down if necessary. In 2011, no such write-downs were made.
NOK 5 million of the book value relates to goodwill in EiendomsMegler 1 SR-Eiendom AS relating to the acquisition of 51 per cent of Vågen Eiendomsmegling AS in 2010. The elements in the goodwill item are assessed annually and written down if necessary. In 2011, no such write-downs were made.
NOK 2 million of the book value at 31.12.2010 was related to goodwill in EiendomsMegler 1 SR-Eiendom AS from to the acquisition of 100 per cent of Eiendomsmegler 1 Sunnhordland AS in 2010. The elements in the goodwill item are assessed annually and written down if necessary . In 2011, following a specific assessment, a write-down of NOK 2 million was made.
nOte 28 intangibLe assets(figures in NOK million)
nOte 29 OtHer assets(figures in NOK million)
Parent bank group2009 2010 2011 2011 2010 2009
35 35 35 Paid in capital SR-Bank Pension Fund 35 35 35 110 63 35 Other assets 189 166 187 170 335 207 Other income earned but not received 214 342 177
15 2 - Pre-paid expenses 4 6 20 330 435 277 total other assets 442 549 419

87nOte 30 dePOsits frOM custOMers(figures in NOK million)
Parent bank group2009 2010 2011 2011 2010 2009
44 692 55 450 53 276 Deposits from and debt to customers, at call 53 118 55 281 44 5279 770 5 456 10 898 Deposits from and debt to customers, with agreed maturity 10 884 5 456 9 759
50 33 40 Accrued interest 40 33 5054 512 60 939 64 214 total deposits from customers 64 042 60 770 54 336
deposits by sector and industry 893 969 1 019 Agriculture/forestry 1 019 969 893101 132 161 Fisheries/fish farming 161 132 101
1 022 1 080 1 233 Mining operations and extraction 1 233 1 080 1 0221 245 1 378 942 Industry 942 1 378 1 2451 850 3 190 1 418 Power and water supply/building and construction 1 418 3 190 1 8501 855 1 848 1 977 Retail trade, hotels and restaurants 1 977 1 848 1 8551 334 1 391 1 149 Overseas shipping, pipeline transport and other transport 1 149 1 391 1 3343 998 4 075 4 600 Property management 4 600 4 075 3 9696 703 7 213 8 234 Service sector 8 234 7 044 6 556
10 281 10 947 11 996 Public sector and financial services 11 824 10 947 10 28129 282 32 223 32 729 total industry 32 557 32 054 29 10625 180 28 683 31 445 Retail customers 31 445 28 683 25 180
50 33 40 Accrued interest industry and retail customers 40 33 5054 512 60 939 64 214 total deposits distributed by sector and industry 64 042 60 770 54 336
deposits distributed by geographic area43 511 46 341 50 084 Rogaland 49 912 46 172 43 335
2 114 2 295 2 705 Agder counties 2 705 2 295 2 1141 578 4 719 5 557 Hordaland 5 557 4 719 1 578
610 1 340 635 International 635 1 340 6106 699 6 244 5 233 Other 5 233 6 244 6 699
54 512 60 939 64 214 total deposits distributed by geographic area 64 042 60 770 54 336

88
change in debt raised by issuing securities 2)balance
31.12.2010issued2010
Matured/redeemed
2011
exchange rate and
other changes
2011balance
31.12.2011
Bonds, nominal value 38 900 2 032 6 350 11 34 593 Value adjustments 1 043 - - 297 1 340 Accrued interest 364 - - 41 405 total debt raised by issuance of securities 40 307 2 032 6 350 349 36 338
2) The note is identical for the parent bank.
debt raised by issuing securities distributed by maturity date 1) forfall
6 362 - - 2010 - - 6 362 6 196 5 378 - 2011 - 5 378 6 196 6 040 5 985 5 893 2012 5 893 5 985 6 040
10 341 10 350 10 035 2013 10 035 10 350 10 341 5 600 5 558 5 723 2014 5 723 5 558 5 600
- 5 024 5 106 2015 5 106 5 024 - 1 040 5 678 7 046 2016 7 046 5 678 1 040
397 176 180 2017 180 176 397 579 587 605 2018 605 587 579 147 150 213 2019 213 150 147
- 630 669 2020 669 630 - 110 17 17 2024 17 17 110
86 - - 2035 - - 86 209 208 239 2037 239 208 209 196 202 207 2046 207 202 196 220 364 405 Accrued interest 405 364 220
37 523 40 307 36 338 total debt raised by issuance of securities 36 338 40 307 37 523
debt raised by issuance of securities by currency 1)
19 178 18 744 17 688 NOK 17 688 18 744 19 178 14 305 20 432 17 721 EUR 17 721 20 432 14 305
2 719 - - USD - - 2 719 607 523 524 SEK 524 523 607 494 244 - Other - 244 494 220 364 405 Accrued interest 405 364 220
37 523 40 307 36 338 total debt raised by issuance of securities 36 338 40 307 37 523
1) Own bonds and certificates have been deducted
Parent bank group2009 2010 2011 2011 2010 2009
36 527 38 900 34 593 Bonds 1) 34 593 38 900 36 527 776 1 043 1 340 Value adjustments 1 340 1 043 776 220 364 405 Accrued interest 405 364 220
37 523 40 307 36 338 total debt raised by issuance of securities 36 338 40 307 37 523
3,3 % 2,8 % 3,4 % Average interest rate 3,4 % 2,8 % 3,3 %
nOte 31 debt raised bY issuance Of securities(figures in NOK million)
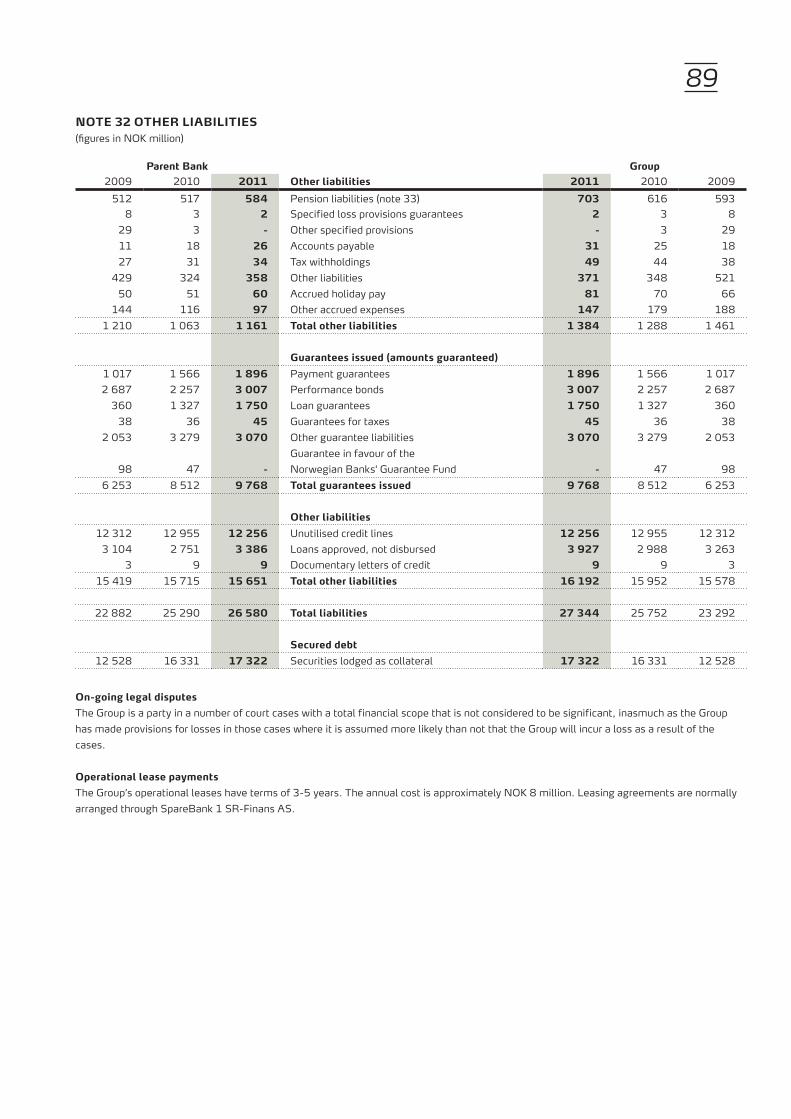
89nOte 32 OtHer LiabiLities(figures in NOK million)
Parent bank group2009 2010 2011 Other liabilities 2011 2010 2009 512 517 584 Pension liabilities (note 33) 703 616 593
8 3 2 Specified loss provisions guarantees 2 3 8 29 3 - Other specified provisions - 3 29 11 18 26 Accounts payable 31 25 18 27 31 34 Tax withholdings 49 44 38
429 324 358 Other liabilities 371 348 521 50 51 60 Accrued holiday pay 81 70 66
144 116 97 Other accrued expenses 147 179 188 1 210 1 063 1 161 total other liabilities 1 384 1 288 1 461
guarantees issued (amounts guaranteed) 1 017 1 566 1 896 Payment guarantees 1 896 1 566 1 017 2 687 2 257 3 007 Performance bonds 3 007 2 257 2 687
360 1 327 1 750 Loan guarantees 1 750 1 327 360 38 36 45 Guarantees for taxes 45 36 38
2 053 3 279 3 070 Other guarantee liabilities 3 070 3 279 2 053 Guarantee in favour of the
98 47 - Norwegian Banks' Guarantee Fund - 47 98 6 253 8 512 9 768 total guarantees issued 9 768 8 512 6 253
Other liabilities 12 312 12 955 12 256 Unutilised credit lines 12 256 12 955 12 312
3 104 2 751 3 386 Loans approved, not disbursed 3 927 2 988 3 263 3 9 9 Documentary letters of credit 9 9 3
15 419 15 715 15 651 total other liabilities 16 192 15 952 15 578
22 882 25 290 26 580 total liabilities 27 344 25 752 23 292
secured debt 12 528 16 331 17 322 Securities lodged as collateral 17 322 16 331 12 528
On-going legal disputesThe Group is a party in a number of court cases with a total financial scope that is not considered to be significant, inasmuch as the Group has made provisions for losses in those cases where it is assumed more likely than not that the Group will incur a loss as a result of the cases.
Operational lease paymentsThe Group’s operational leases have terms of 3-5 years. The annual cost is approximately NOK 8 million. Leasing agreements are normally arranged through SpareBank 1 SR-Finans AS.

90nOte 33 PensiOns (witH direct recOgnitiOn Of actuariaL estiMate deViatiOns)
SpareBank 1 SR-Bank Group has collective pension schemes for its employees. The pension schemes for SpareBank 1 SR-Bank, SR-Forvaltning AS, SR-Investering AS, SR-Finans AS, EiendomsMegler 1 SR-Eiendom AS and EiendomsMegler 1 Drift AS are covered by the Group’s pension fund. The company’s and the Group’s pension schemes comply with the requirements in the Act on mandatory occupational insurance.
SpareBank 1 SR-Bank, SR-Forvaltning AS, SR-Investering AS, SR-Finans AS, EiendomsMegler 1 SR-Eiendom AS and EiendomsMegler 1 Drift AS have uniform schemes in which the principal terms are a contribution period of 30 years, 70 per cent pension relative to the pension basis as at 1 January in the year the employee reaches the age of 67, as well as a disability and children’s pension. All pension benefits are coordinated with expected National Insurance benefits. If changes are made to the National Insurance scheme that entail a reduction in benefits, such reductions will not be compensated through the pension schemes. As at 31 December 2011, the pension schemes had 1,257 active members (826 active members in the bank) and 385 pensioners (361 bank pensioners).
In addition to the pension liabilities that are covered through the pension fund, the Group has uncovered pension liabilities that cannot be covered by the assets in the collective schemes. The liabilities apply to people that are not enrolled in the insurance schemes, supplementary pensions in excess of 12G (G = the National Insurance basic amount), ordinary early retirement pensions and contractual early retirement pension (AFP)
The Group also has a defined contributions scheme.
On 24 March 2011, the Supervisory Board resolved changes in the current pensions scheme for SpareBank 1 SR-Bank Group. The defined benefit scheme was closed with the possibility of a voluntary transition to a defined contribution plan for employees who were members before the closing date, 1 April 2011. No changes were made in old-age pension coverage in the remaining defined benefit plan, otherwise, the following changes made: Surviving spouse pension/partner pension ceased and a paid-up policy was issued for pension rights earned up to 1 April 2011. Disability and children’s pensions continued as before, but without paid-up policy earnings for the employees. Premium exemption for new disability pensioners and children were continued as before.
The new AFP scheme, which applies with effect from 1.1.2011, is to be regarded as a defined benefit multi-company scheme, but is accounted for as a defined contribution scheme until adequate reliable information is available to allow the bank and the Group to account for its proportional share of the pension costs, the pension liabilities and the pension funds in the scheme. Thus, the bank’s and the Group’s liabilities are not recognised in the balance sheet as liabilities as at 31 December 2010. The AFP liability under the old scheme was recorded as a liability and was taken to income in 2010 with the exception of the liability linked to the former employees who are now pensioners under the scheme. Estimated values are used when assessing pension assets and measuring accrued liabilities. These estimates are corrected every year in accordance with the fair value of the pension assets in the pension fund, statements of the transfer value of pension assets from the insurance company, and actuarial calculations regarding the size of the liabilities. The calculation of future pensions is based on the following assumptions:
The following economic assumptions have been made when calculating pension liabilities:
2011 2010 2009Discount rate 2,40 % 4,00 % 4,40 %Expected yield on assets 6,00 % 6,00 % 6,00 %Future wage developments 4,00 % 4,00 % 4,50 %Adjustment of basic amount (G) 3,75 % 4,25 % 4,25 %Pension adjustment 2,00 % 3,75 % 3,50 %Employer's Nat. Ins. contribution 14,10 % 14,10 % 14,10 %Voluntary retirement 5% before 45 years. 2% after 45 years 5% before 45 years. 2% after 45 years 5% before 45 years. 2% after 45 years Expected contractual early retirement from 62 years 25% at 62 years and a
further 25% at 64 years The assumptions for mortality are based on published statistics and historical data.Average life expectancy (in number of years) on the balance sheet date for a person who retires at the age of 65 is as follows::Male 19,3 years 19,3 years 19,3yearsFemale 21,8 years 21,8 years 21,8 years
Average life expectancy (in number of years) 20 years after the balance sheet date for a person who retires at the age of 65 is as follows::Male 19,3 years 19,3 years 19,3 yearsFemale 21,8 years 21,8 years 21,8 years
The calculations are based on standardised assumptions regarding mortality and disability trends and other demographic factors prepared by the Association of Norwegian Insurance Companies (Norges Forsikringsforbund). The mortality assumptions are based on published statistics and historical data.

91
(figures in NOK million)
Parent bank group 2009 2010 2011 2011 2010 2009
book value of liabilities 328 358 412 Pension benefits – insured scheme 521 440 388 184 159 171 Pension benefits – uninsured scheme 182 176 205 512 517 584 total book value of liabilities 703 616 593
expenses charged to profit and loss 76 90 -131 Pension benefits – insured scheme -154 111 93 20 -55 13 Pension benefits – uninsured scheme 13 -64 22 96 35 -118 total expenses charged to profit and loss -141 47 115
Pension liabilities in defined benefit pension schemes 1 165 1 271 1 500 Present value of pension liabilities 1.1 1 684 1 424 1 308
81 94 72 Pension benefits earned in the period 86 112 96 50 56 49 Interest expense accrued on pension liabilities 55 62 56 16 122 212 Actuarial gains and losses (estimate deviations) 262 142 8
-41 -42 -54 Benefits paid -56 -46 -44 -68 -258 Reductions and settlements -355 -78
- - - Change in earlier periods' earnings 55 - - - 68 - Other changes - 68 -
1 271 1 501 1 521 Present value of pension liabilities 31.12. 1 730 1 684 1 424 1 105 1 356 1 366 of which fund based 1 566 1 525 1 241
166 145 155 of which not fund based 164 159 184
Pension assets 853 823 1 047 Pension assets 1.1. 1 143 905 929
47 58 62 Expected yield in the period 69 64 51 -109 71 -43 Actuarial gains and losses (estimate deviation) -43 73 -114
73 93 95 Employer's contribution 108 104 74 -41 -42 -52 Benefits paid -56 -47 -35
-97 Reductions and settlements -104 - 44 - Other changes - 44 -
823 1 047 1 012 Pension assets 31.12. 1 116 1 143 905 net pension liabilities in balance sheet
1 271 1 501 1 521 Present value of pension liabilities 31.12. 1 730 1 684 1 424 823 1 047 1 012 Pension assets 31.12. 1 116 1 143 905 448 454 509 Net pension liabilities 31.12. 614 541 519
64 63 75 Employer's Nat. Insurance contribution 89 75 73 512 517 584 net pension liabilities in balance sheet 703 616 592
Pension costs for the period 81 94 72 Defined benefits earned in period 86 112 96 50 54 49 Interest costs accrued in period 55 62 56
-47 -58 -62 Expected yield on pension assets -69 -64 -51 -68 -162 Reductions and settlements -251 -78
- - - Benefits earned in prior periods included in the period 55 - - 84 22 -103 Net defined benefit pension costs excluding employer's Nat. Ins. contribution -123 32 101 12 13 -15 Accrued employer's Nat. Insurance contribution -18 15 14 96 35 -118 Net defined benefit pension expenses recognised in profit and loss -141 47 115
- - 2 Contribution based pension costs 3 - - 96 35 -116 the period's pension costs recorded over profit and loss -138 47 115
actuarial gains and losses (estimate deviations) 143 49 291 Actuarial gains and losses included in equity for period 346 68 140 348 397 688 Cumulative actuarial gains and losses included in equity 804 458 390
47 58 62 Expected yield on pension assets 69 64 51 69 53 Actual yield on pension assets 59 75
(continuation note 33)

92
The expected yield on assets is the expected yield taking into account the investment strategy adopted in the plans. The expected yield on fixed income securities is based on the effective interest rate of the securities at the balance sheet date. The expected yield on equity instruments and investments in real estate reflects the long-term return achieved in the respective markets.
composition of the group's pension assets 2011 2010 2009Real estate 19 17 17 - of which used by the bank - - Shares 198 239 128 Other assets 899 887 760 total pension assets 1 116 1 143 905
development the last five years in defined benefit pension schemes in group 2011 2010 2009 2008 2007Present value of pension liabilities as at 31 December 1 730 1 684 1 424 1 308 1 071 Pension assets as at 31 December. 1 116 1 143 905 929 847 net deficit 614 541 519 379 224
Expected premium paid for 2012 is NOK 65 million for the parent bank and NOK 74 million for the Group.
(continuation note 33)
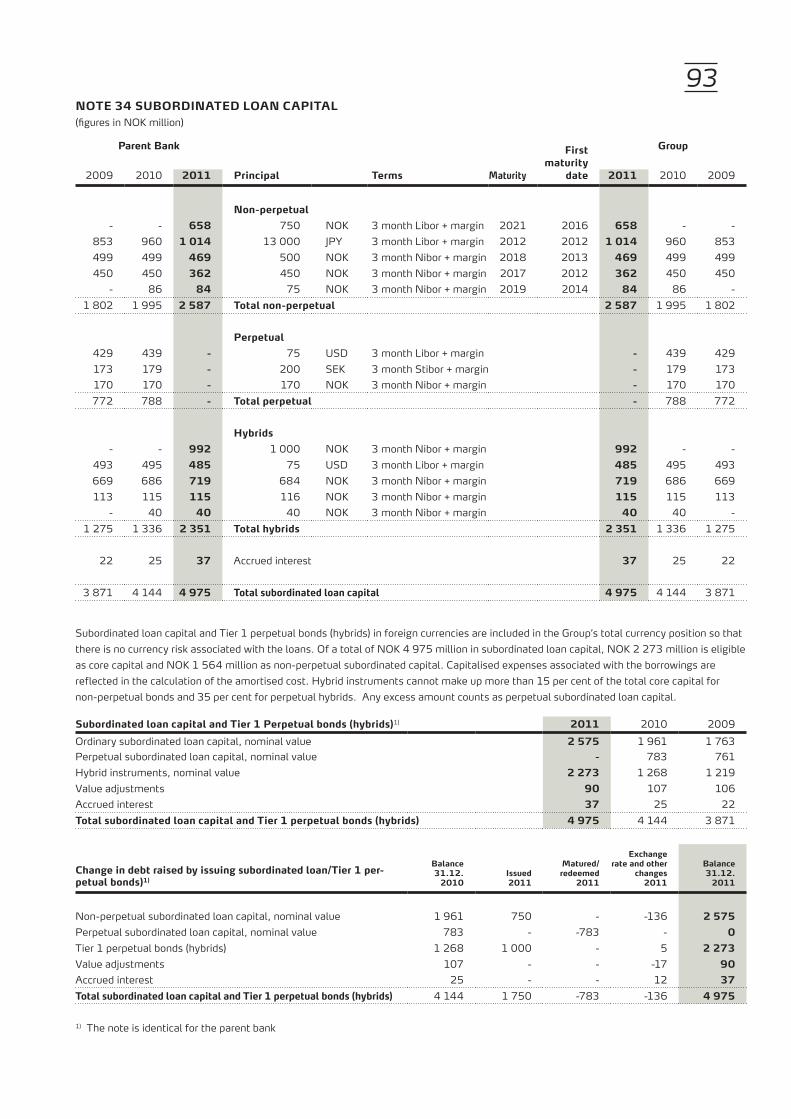
93nOte 34 subOrdinated LOan caPitaL(figures in NOK million)
Parent bank first maturity
date
group
2009 2010 2011 Principal terms Maturity 2011 2010 2009
non-perpetual - - 658 750 NOK 3 month Libor + margin 2021 2016 658 - -
853 960 1 014 13 000 JPY 3 month Libor + margin 2012 2012 1 014 960 853499 499 469 500 NOK 3 month Nibor + margin 2018 2013 469 499 499450 450 362 450 NOK 3 month Nibor + margin 2017 2012 362 450 450
- 86 84 75 NOK 3 month Nibor + margin 2019 2014 84 86 - 1 802 1 995 2 587 total non-perpetual 2 587 1 995 1 802
Perpetual 429 439 - 75 USD 3 month Libor + margin - 439 429173 179 - 200 SEK 3 month Stibor + margin - 179 173170 170 - 170 NOK 3 month Nibor + margin - 170 170772 788 - total perpetual - 788 772
Hybrids - - 992 1 000 NOK 3 month Nibor + margin 992 - -
493 495 485 75 USD 3 month Libor + margin 485 495 493669 686 719 684 NOK 3 month Nibor + margin 719 686 669113 115 115 116 NOK 3 month Nibor + margin 115 115 113
- 40 40 40 NOK 3 month Nibor + margin 40 40 - 1 275 1 336 2 351 total hybrids 2 351 1 336 1 275
22 25 37 Accrued interest 37 25 22
3 871 4 144 4 975 total subordinated loan capital 4 975 4 144 3 871
Subordinated loan capital and Tier 1 perpetual bonds (hybrids) in foreign currencies are included in the Group’s total currency position so that there is no currency risk associated with the loans. Of a total of NOK 4 975 million in subordinated loan capital, NOK 2 273 million is eligible as core capital and NOK 1 564 million as non-perpetual subordinated capital. Capitalised expenses associated with the borrowings are reflected in the calculation of the amortised cost. Hybrid instruments cannot make up more than 15 per cent of the total core capital for non-perpetual bonds and 35 per cent for perpetual hybrids. Any excess amount counts as perpetual subordinated loan capital.
subordinated loan capital and tier 1 Perpetual bonds (hybrids)1) 2011 2010 2009Ordinary subordinated loan capital, nominal value 2 575 1 961 1 763Perpetual subordinated loan capital, nominal value - 783 761Hybrid instruments, nominal value 2 273 1 268 1 219Value adjustments 90 107 106Accrued interest 37 25 22total subordinated loan capital and tier 1 perpetual bonds (hybrids) 4 975 4 144 3 871
change in debt raised by issuing subordinated loan/tier 1 per-petual bonds)1)
balance31.12.
2010issued2011
Matured/redeemed
2011
exchange rate and other
changes2011
balance31.12.
2011
Non-perpetual subordinated loan capital, nominal value 1 961 750 - -136 2 575Perpetual subordinated loan capital, nominal value 783 - -783 - 0Tier 1 perpetual bonds (hybrids) 1 268 1 000 - 5 2 273Value adjustments 107 - - -17 90Accrued interest 25 - - 12 37total subordinated loan capital and tier 1 perpetual bonds (hybrids) 4 144 1 750 -783 -136 4 975
1) The note is identical for the parent bank
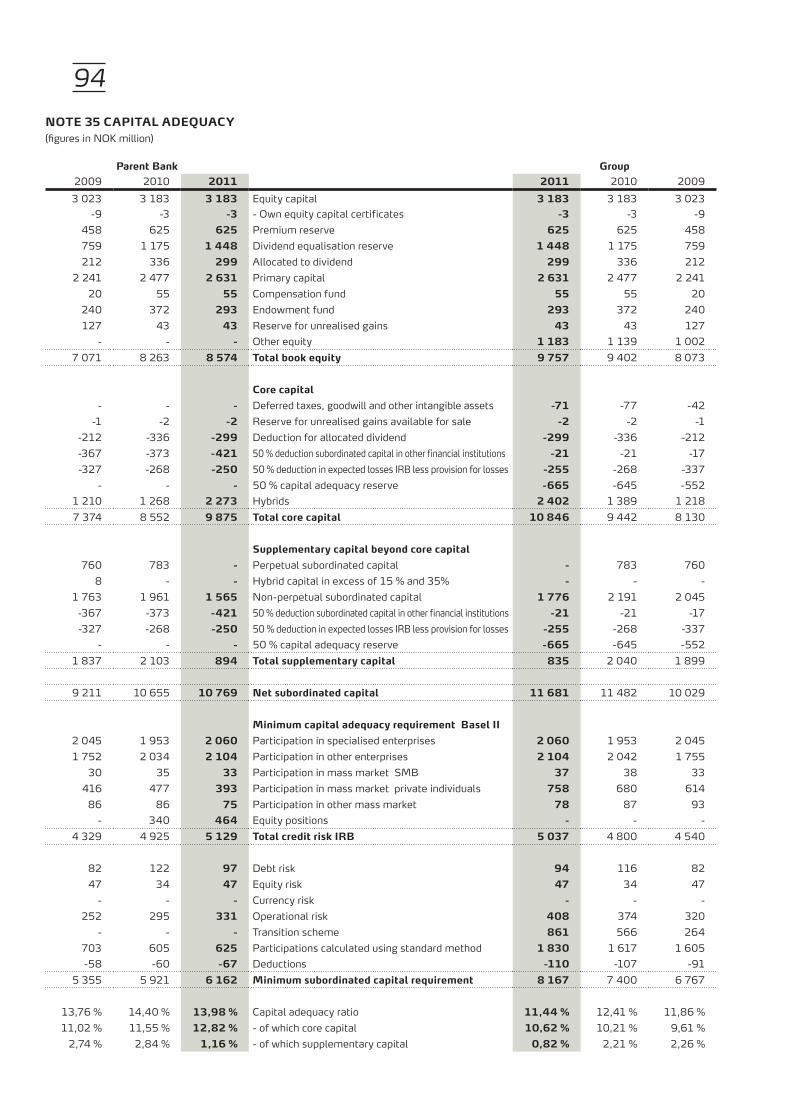
94
Parent bank group2009 2010 2011 2011 2010 2009
3 023 3 183 3 183 Equity capital 3 183 3 183 3 023 -9 -3 -3 - Own equity capital certificates -3 -3 -9
458 625 625 Premium reserve 625 625 458 759 1 175 1 448 Dividend equalisation reserve 1 448 1 175 759 212 336 299 Allocated to dividend 299 336 212
2 241 2 477 2 631 Primary capital 2 631 2 477 2 241 20 55 55 Compensation fund 55 55 20
240 372 293 Endowment fund 293 372 240 127 43 43 Reserve for unrealised gains 43 43 127
- - - Other equity 1 183 1 139 1 002 7 071 8 263 8 574 total book equity 9 757 9 402 8 073
core capital - - - Deferred taxes, goodwill and other intangible assets -71 -77 -42
-1 -2 -2 Reserve for unrealised gains available for sale -2 -2 -1 -212 -336 -299 Deduction for allocated dividend -299 -336 -212 -367 -373 -421 50 % deduction subordinated capital in other financial institutions -21 -21 -17 -327 -268 -250 50 % deduction in expected losses IRB less provision for losses -255 -268 -337
- - - 50 % capital adequacy reserve -665 -645 -552 1 210 1 268 2 273 Hybrids 2 402 1 389 1 218 7 374 8 552 9 875 total core capital 10 846 9 442 8 130
supplementary capital beyond core capital 760 783 - Perpetual subordinated capital - 783 760
8 - - Hybrid capital in excess of 15 % and 35% - - - 1 763 1 961 1 565 Non-perpetual subordinated capital 1 776 2 191 2 045
-367 -373 -421 50 % deduction subordinated capital in other financial institutions -21 -21 -17 -327 -268 -250 50 % deduction in expected losses IRB less provision for losses -255 -268 -337
- - - 50 % capital adequacy reserve -665 -645 -552 1 837 2 103 894 total supplementary capital 835 2 040 1 899
9 211 10 655 10 769 net subordinated capital 11 681 11 482 10 029
Minimum capital adequacy requirement basel ii 2 045 1 953 2 060 Participation in specialised enterprises 2 060 1 953 2 045 1 752 2 034 2 104 Participation in other enterprises 2 104 2 042 1 755
30 35 33 Participation in mass market SMB 37 38 33 416 477 393 Participation in mass market private individuals 758 680 614
86 86 75 Participation in other mass market 78 87 93 - 340 464 Equity positions - - -
4 329 4 925 5 129 total credit risk irb 5 037 4 800 4 540
82 122 97 Debt risk 94 116 82 47 34 47 Equity risk 47 34 47
- - - Currency risk - - - 252 295 331 Operational risk 408 374 320
- - - Transition scheme 861 566 264 703 605 625 Participations calculated using standard method 1 830 1 617 1 605 -58 -60 -67 Deductions -110 -107 -91
5 355 5 921 6 162 Minimum subordinated capital requirement 8 167 7 400 6 767
13,76 % 14,40 % 13,98 % Capital adequacy ratio 11,44 % 12,41 % 11,86 %11,02 % 11,55 % 12,82 % - of which core capital 10,62 % 10,21 % 9,61 %
2,74 % 2,84 % 1,16 % - of which supplementary capital 0,82 % 2,21 % 2,26 %
nOte 35 caPitaL adeQuacY(figures in NOK million)

95The capital adequacy ratio shall be at least 8 per cent. The equity value of non-perpetual subordinated loans is reduced by 20 per cent every year the last five years prior to maturity. To the extent that the Group has subordinated capital in other financial institutions, this is deducted directly from the Group’s own subordinated capital for that part that exceeds 2 per cent of the recipient financial institution’s subordinated capital. If the Group has subordinated capital in other financial institutions that amounts to less than 2 per cent of the individual financial institution’s subordinated capital, the total of such capital is deducted from the Group’s subordinated capital for that part that exceeds 10 per cent of the Group’s subordinated capital. In the event that the Group has been ordered to maintain a 100 per cent capital adequacy ratio for specific assets, an amount equal to the asset’s book (carrying) value shall be deducted from the subordinated capital and from the basis for the calculation. The basis for the calculation is risk-weighted. The core capital adequacy ratio is 10.62 per cent in 2011 compared with 10.21 per cent in 2010.
nOte 36 eQuitY caPitaL rePresented bY eQuitY caPitaL certificates and OwnersHiP structure
equity capitalSpareBank 1 SR-Bank’s equity capital amounts to NOK 3 182 834 025 divided into 127 313 361 equity certificates each with a nominal value of NOK 25. The equity capital was raised/increased in the following manner and on the following dates.
Yearchange in
equity capitaltotal equity
capital
number of equity capital
certificates
1994 Public issue 744,0 744,0 7 440 0002000 Private placement with employees 5,0 749,0 7 489 6862001 Private placement with employees 4,8 753,8 7 538 1942004 Bonus issue 150,8 904,6 9 045 8342005 Bonus issue/split 226,1 1 130,7 22 614 5852007 Private placement 200,0 1 330,7 26 613 7162007 Bonus issue/split 443,5 1 774,2 70 969 9092008 Dividend issue 91,7 1 866,0 74 638 5072008 Private placement with employees 6,6 1 872,6 74 903 3452009 Bonus issue/split 374,5 2 247,1 89 884 0142009 Private placement 776,2 3 023,3 120 933 7302010 Private placement with employees 7,8 3 031,1 121 243 4272010 Private placement with Kvinnherad Sparebank 151,7 3 182,8 127 313 361
In addition to equity capital represented by equity capital certificates, the equity capital certificate holders’ share of the equity in SpareBank 1 SR-Bank consists of an equalisation reserve and a premium reserve. The equalisation reserve is accumulated retained earnings not distributed as annual dividends. This equity is used to stabilise cash dividends or for bonus issues. Other equity includes the savings bank’s reserve, the compensation reserve, the endowment fund and fund for unrealised gains. The following was adopted by the Board of Directors of SpareBank 1 SR-Bank on 19 October 2009 as the bank’s policy relating to dividends and endowments: ”SpareBank 1 SR-Bank aims at paying about half of the profit belonging to the equity certificate holders as dividend and about half of the profit belonging to the savings bank’s reserve is distributed as bequests or transferred to foundations for public benefit assuming that the capital strength is satisfactory. When fixing the dividend or deciding on endowments, consideration will be given to the bank’s profits trend, the market situation, the stability of dividends as well as the need for core capital. When assessing the distribution of the profit for the year as dividends and as endowments respectively, emphasis will be placed on ensuring that the equity certificate holders’ share of the total equity (fractional ownership) remains stable.”
equity capital certificate holders’ share of profit/lossEarnings per equity certificate are calculated by dividing the profit/loss attributable to the holders of equity certificates by the average number of outstanding equity certificates. The profit attributable to equity certificate holders corresponds to the equity capital’s, equalisation reserve’s and premium reserve’s share of the bank’s total equity less the fund for unrealised gains.
trading in own equity certificates in 2011(figures in NOK 000s)Holding as at 31.12.2010 3 331Traded in 2011 -Holding as at 31.12.2011 3 331

96
The total number of equity certificate holders as at 31.12.2011 was 11 887. This is 144 fewer than at the end of the preceding year. Equity certificate holders residing in Rogaland, Hordaland and the Agder counties account for 46.8 per cent, and foreign owners for 9.6 per cent. Reference is also made to the list of equity certificate holders on the Board of Directors and the Supervisory Board. For further details regarding equity certificates, please refer to the separate chapter in the annual report.
the 20 largest equity capital certificate holders as at 31 december 2010equity Percentage
Holder certificates ownershipGjensidige Forsikring ASA 20 713 065 16,3%SpareBank 1-stiftinga Kvinnherad 6 069 934 4,8%Odin Norge 3 197 672 2,5%Odin Norden 3 066 253 2,4%Køhlergruppen AS 1 923 657 1,5%Clipper AS 1 685 357 1,3%Frank Mohn AS 1 666 142 1,3%Trygve Stangeland 1 632 048 1,3%State Street Bank and Trust, U.S.A. 1 355 970 1,1%SHB Stockholm Clients Account, Sweden 1 340 000 1,1%JPMorgan Chase Bank, U.K. 1 221 914 1,0%Trygves Holding AS 1 070 939 0,8%Brown Brothers Harriman, U.S.A. 1 061 327 0,8%The Northern Trust, U.K. 1 005 116 0,8%Bank of New York, U.S.A. 984 594 0,8%Coil Investment Group AS 954 993 0,8%Nordea Bank Norge ASA 918 892 0,7%Westco AS 885 352 0,7%Bjergsted Investering AS 720 055 0,6%Solvang Shipping AS 701 034 0,6%Total 20 largest 52 174 314 41,0%Other owners 75 139 047 59,0%total equity certificates issued 127 313 361 100,0 %
the 20 largest equity capital certificate holders as at 31 december 2011equity Percentage
Holder certificates ownershipGjensidige Forsikring ASA 20 713 065 16,3%SpareBank 1-stiftinga Kvinnherad 6 069 934 4,8%Odin Norge 3 598 122 2,8%Odin Norden 3 091 553 2,4%Clipper AS 1 685 357 1,3%Frank Mohn AS 1 666 142 1,3%Trygve Stangeland 's estate 1 632 048 1,3%JPMorgan Chase Bank, U.K. 1 598 223 1,3%Varma Mutual Pension Insurance, Finland 1 496 091 1,2%State Street Bank and Trust, U.S.A. 1 080 213 0,8%Trygves Holding AS 1 070 939 0,8%SHB Stockholm Clients Account, Sweden 1 070 000 0,8%Fidelity Low-Priced Stock Fund, U.S.A. 1 061 327 0,8%Westco AS 1 030 091 0,8%Køhlergruppen AS 1 000 000 0,8%Forsand Municipality 769 230 0,6%Tveteraas Finans AS 722 000 0,6%Solvang Shipping AS 701 034 0,6%Leif Inge Slethei AS 672 772 0,5%Pareto AS 638 046 0,5%Total 20 largest 51 366 187 40,3%Other owners 75 947 174 59,7%total equity certificates issued 127 313 361 100,0 %
(continuation note 36)

97
the 20 largest equity capital certificate holders as at 31 december 2009equity Percentage
Holder certificates ownershipGjensidige Forsikring BA 20 713 065 17,1%Odin Norge 2 341 693 1,9%Odin Norden 2 319 625 1,9%Køhlergruppen AS 1 923 657 1,6%Coil Investment Group AS 1 904 993 1,6%Clipper AS 1 685 357 1,4%Frank Mohn AS 1 666 142 1,4%Trygve Stangeland 1 622 428 1,3%State Street Bank and Trust, U.S.A. 1 414 363 1,2%Lærdal AS 1 222 915 1,0%Grunnfond Invest AS 1 100 000 0,9%Brown Brothers Harriman, U.S.A. 1 061 327 0,9%The Northern Trust, U.K. 1 021 456 0,8%Verdipapirfondet Nordea Norway 893 740 0,7%Bjergsted Investering AS 839 497 0,7%Westco AS 829 968 0,7%Solvang Shipping AS 701 034 0,6%Forsand Municipality 682 230 0,6%Bank of New York, U.S.A. 675 128 0,6%Tveteraas Finans AS 673 587 0,6%Total 20 largest 45 292 205 37,5%Other owners 75 641 525 62,5%total equity certificates issued 120 933 730 100,0 %
(continuation note 36)

98nOte 37 MaturitY anaLYsis Of assets and LiabiLities(figures in NOK million)
Overdraft facilities, operating credits and consumer credits (including flexiloans) and accrued interest are included in the interval ”at call”.
Parent bankat call
Less than 3 months
3-12 months 1 - 5 year
More than 5 years total31.12.2011
assetsCash and balances at central banks 263 - - - - 263 Loans to and deposits with credit institutions 4 655 736 - - - 5 391 Gross loans to customers 33 216 807 2 805 11 605 47 517 95 950 - Individual write-downs -355 - - - - -355 - Write-downs on groups of loans -317 - - - - -317 net loans to customers 32 544 807 2 805 11 605 47 517 95 278 Certificates and bonds at fair value 96 1 997 2 568 5 739 902 11 302 Certificates and bonds at amortised cost 27 167 243 8 107 - 8 544 Financial derivatives 434 400 261 1 482 1 151 3 728 Shares, units and other equity interests 491 - - - - 491 Activities to be sold 84 - - - - 84 Investments in ownership interests 3 352 - - - - 3 352 Investments in Group companies 716 - - - - 716 Fixed assets 380 - - - - 380 Other assets 277 - - - - 277 total assets 43 319 4 107 5 877 26 933 49 570 129 806
LiabilitiesDebt to credit institutions 1 914 2 027 269 575 - 4 785 Borrowings from government., under covered bond swap scheme - - 96 7 299 - 7 395 Deposits from customers 60 252 1 705 2 257 - - 64 214 Debt raised through issuance of securities 405 3 760 2 133 27 910 2 130 36 338 Financial derivatives 220 306 166 575 743 2 010 Taxes payable - - 58 - - 58 Deferred tax liabilities - - - 296 - 296 Other liabilities 1 161 - - - - 1 161 Subordinated loan capital 37 1 014 - - 3 924 4 975 total liabilities 63 989 8 812 4 979 36 655 6 797 121 232

99
groupat call
Less than 3 months
3-12 months 1 - 5 year
More than 5 years total31.12.2011
assetsCash and balances at central banks 263 - - - - 263 Loans to and deposits with credit institutions 47 676 - - - 723 Gross loans to customers 33 216 859 3 012 15 161 49 120 101 368 - Individual write-downs -418 - - - - -418 - Write-downs on groups of loans -362 - - - - -362 net loans to customers 32 436 859 3 012 15 161 49 120 100 588 Certificates and bonds at fair value 96 1 997 2 568 5 739 906 11 306 Certificates and bonds at amortised cost 27 167 243 8 107 - 8 544 Financial derivatives 434 400 261 1 470 1 151 3 716 Shares, units and other equity interests 631 - - - - 631 Activities to be sold 85 - - - - 85 Investments in ownership interests 4 389 - - - - 4 389 Investments in Group companies - - - - - - Fixed assets 455 - - - - 455 Other assets 442 - - - - 442 assets 39 305 4 099 6 084 30 477 51 177 131 142
LiabilitiesDebt to credit institutions 1 911 2 027 269 575 - 4 782 Borrowings from government., under covered bond swap scheme - - 96 7 299 - 7 395 Deposits from customers 60 080 1 705 2 257 - - 64 042 Debt raised through issuance of securities 405 3 760 2 133 27 910 2 130 36 338 Financial derivatives 220 306 166 575 743 2 010 Taxes payable - - 130 - - 130 Deferred tax liabilities - - - 329 - 329 Other liabilities 1 384 - - - - 1 384 Subordinated loan capital 37 1 014 - - 3 924 4 975 total liabilities 64 037 8 812 5 051 36 688 6 797 121 385
(continuation note 37)
1) For presentation purposes, non-financial assets are included in the column ”At call”.

100nOte 38 LiQuiditY risK(figures in NOK million)
Parent bank 1)
at callLess than 3 months
3-12 months 1 - 5 year
More than 5 years total2011
Debt to credit institutions 1 914 2 027 269 622 - 4 832 Borrowing from government for covered bond swap scheme - - 98 7 768 - 7 866 Deposits from customers 60 252 1 705 2 257 - - 64 214 Debt raised by issuance of securities 405 3 772 2 178 29 871 2 684 38 910 Subordinated loan capital 37 1 014 - - 5 127 6 178 total liabilities 62 608 8 518 4 802 38 261 7 811 122 000
DerivativesContractual cash flows out - -9 542 -4 369 -10 059 -1 361 -25 331Contractual cash flows in - 9 059 4 065 8 889 904 22 917
2010Debt to credit institutions 4 262 999 495 1 694 - 7 450 Borrowing from government for covered bond swap scheme - - 1 475 8 036 - 9 511 Deposits from customers 55 483 2 202 3 254 - - 60 939 Debt raised by issuance of securities 364 852 4 564 29 249 9 089 44 118 Subordinated loan capital - - - - 4 998 4 998 total liabilities 60 109 4 053 9 788 38 979 14 087 127 016
DerivativesContractual cash flows out - -11 221 -8 096 -19 784 -1 782 -40 883Contractual cash flows in - 10 349 7 474 18 968 1 419 38 210
2009Debt to credit institutions 129 5 872 1 257 1 599 96 8 953 Borrowing from government for covered bond swap scheme - - - 9 658 - 9 658 Deposits from customers 51 235 1 532 1 745 - - 54 512 Debt raised by issuance of securities 220 690 5 786 30 253 2 801 39 750 Subordinated loan capital - - - - 4 801 4 801 total liabilities 51 584 8 094 8 788 41 510 7 698 117 674
DerivativesContractual cash flows out - -3 433 -4 025 -18 442 -1 784 -27 684Contractual cash flows in - 2 692 3 053 17 320 1 386 24 451

101
group 1)
at callLess than 3 months
3-12 months 1 - 5 year
More than 5 years total2011
Debt to credit institutions 1 911 2 027 269 622 - 4 829 Borrowing from government for covered bond swap scheme - - 98 7 768 - 7 866 Deposits from customers 60 080 1 705 2 257 - - 64 042 Debt raised by issuance of securities 405 3 772 2 178 29 871 2 684 38 910 Subordinated loan capital 37 1 014 - - 5 127 6 178 total liabilities 62 433 8 518 4 802 38 261 7 811 121 825
DerivativesContractual cash flows out - -9 264 -4 369 -10 059 -1 361 -25 053Contractual cash flows in - 9 059 4 065 8 611 904 22 639
2010Debt to credit institutions 4 260 999 495 1 694 - 7 448 Borrowing from government for covered bond swap scheme - - 1 475 8 036 - 9 511 Deposits from customers 55 314 2 202 3 254 - - 60 770 Debt raised by issuance of securities 364 852 4 564 29 249 9 089 44 118 Subordinated loan capital - - - - 4 998 4 998 total liabilities 59 938 4 053 9 788 38 979 14 087 126 845
DerivativesContractual cash flows out - -11 108 -8 096 -19 784 -1 782 -40 770Contractual cash flows in - 10 349 7 474 18 855 1 419 38 097
2009Debt to credit institutions 127 5 872 1 257 1 599 96 8 951 Borrowing from government for covered bond swap scheme - - - 9 658 - 9 658 Deposits from customers 51 059 1 532 1 745 - - 54 336 Debt raised by issuance of securities 220 690 5 786 30 253 2 801 39 750 Subordinated loan capital - - - - 4 801 4 801 total liabilities 51 406 8 094 8 788 41 510 7 698 117 496
DerivativesContractual cash flows out - -3 315 -4 025 -18 442 -1 784 -27 566Contractual cash flows in - 2 692 3 053 17 202 1 386 24 333
See also Note 3 Financial risk management
(continuation note 38)

102nOte 39 MarKet risK LinKed tO interest rate risK(figures in NOK million)
The table shows sensitivity of net interest cost before tax (interest change of one percentage point) at the end of each of the last three years, when all financial instruments are assessed at fair value.
Parent bank group 2009 2010 2011 2011 2010 2009
currency 14 17 -2 NOK -2 17 14
- 3 1 EUR 1 3 - - 1 -13 USD -13 1 -
-2 - -2 CHF -2 - -2 1 1 -1 Other -1 1 1
An interest rate risk arises when the Group has different interest lock-in periods for its assets and liabilities. Trading activities linked to interest rate instruments shall at all times take place within adopted limits and authorities. The Group defines, therefore, quantitative goals for maximum potential loss. The commercial risk is continuously quantified and monitored.
The Group’s overriding guidelines for interest rate risk define the maximum loss arising from a 1-percentage point change in interest rates. The maximum aggregate loss shall not exceed NOK 60 million on the kroner balance, and within each interest rate periods 0-3 months and 3-6 month the maximum loss shall not exceed NOK 50 million, 6-9 months and 9-12 months NOK 40 million, and each pursuing year (1-10 years) NOK 30 million, and the maximum loss over 10 years must not exceed NOK 30 million.
nOte 40 MarKet risK reLated tO currencY risK(figures in NOK million)
The table shows net currency exposure including financial derivatives in accordance with definition given by Norges Bank.
Parent bank group 2009 2010 2011 2011 2010 2009
currency 5 22 5 EUR 5 22 5 1 15 1 USD 1 15 1 1 4 1 CHF 1 4 1
-1 26 -1 GBP -1 26 -1 32 11 32 Other 32 11 32 38 78 38 total 38 78 38
1 2 1 Effect on profit or loss of a 3% change before tax 1 2 1
Currency risk arises when the Group has differences in assets and liabilities in an individual currency. Foreign exchange trading shall always take place within the adopted guidelines and authorities at any time. The Group’s limits define quantitative goals for maximum net currency exposure, measured in NOK. The commercial risk is quantified and monitored continuously.
The Group has set limits for the net exposure in each individual currency, and limits for aggregate net currency exposure (expressed as the highest of total long and short positions). The net overnight currency risk for spot trading must not exceed NOK 100 million per individual currency and NOK 125 million on aggregate.

103nOte 41 actiVities tO be sOLd
SpareBank 1 SR-Bank establishes, as part of its business activity, investment projects for sale to its customers. SpareBank 1 SR-Bank must also, as part of its business activities, take over assets, for one reason or another, from its customers. Energiveien Eiendom Holding AS was taken over in 2008 and was assessed as an activity to be sold as at 31 December 2008. This item was recognised at fair value in the accounts as at 31 December 2008. The project was planned to be sold during the first six months of 2009, but was not sold and was included in the item tangible fixed assets as at 31 December 2009. In the autumn of 2010, parts of this project were sold. After the sale in 2010, SpareBank 1 SR-Bank owns 49.86 per cent of the shares in Energiveien Eiendom Holding AS. This item is assessed at fair value in the accounts, NOK 74 million in the parent bank and NOK 75 million in the Group’s accounts and was classified as an activity to be sold on 31 December 2010 and 31 December 2011.
Artemeris Shipping AS was taken over in 2011, and was considered an activity to be sold. This item is recognised at fair value in the accounts, with NOK 10 million in the parent bank’s accounts and NOK 10 million in the Group accounts. At 31 December 2011 it is considered an activity to be sold.
As at 31 December 2010, assets taken over in completed but unsold apartments are also included in activities for sale. The apartments were sold or planned sold in 2011. They were written down by NOK 4.8 million in 2010. This item is recognised at fair value (NOK 18 million) in the parent bank’s and the Group’s accounts a 31 December 2010. The apartments were sold in 2011.

104
Parent bank
(figures in NOK million)equity capital
Own shares
share capital
Premium reserve
dividend equali-sation
reserve
dividend to equity
capital owners
Primary capital
compens-ation fund
endow- ment fund
dividend to primary
capital owners
reserve for unrea-
lised gains
Other equity
total equity
equity 30.9.2011 3 183 -3 625 1 077 2 420 55 293 43 728 8 421Redistribution onconversion -3 183 3 4 987 668 -1 077 -2 420 -55 -293 1 370 -equity 30.9.2011basis for opening balance - - 4 987 1 293 - - - - 43 2 098 8 421
equity 31.12.2011 3 183 -3 625 1 448 191 2 631 55 293 108 43 - 8 574Redistribution onconversion -3 183 4 987 882 -1 448 -2 631 -55 -293 1 741 -equity 1.1.2012 - -3 4 987 1 507 - 191 - - - 108 43 1 741 8 574
Change in equity from 31 December 2011 to 1 January 2012 is based on accounts prepared on 30 September 2011 and the resolution passed by the Supervisory Board on 23 November 2011.
calculation of the fractional ownership The share capital is distributed at the time of the implementation between the owners of equity certificates and the savings bank foundation in accordance with their ownership of equity capital and primary capital as these capital variables are defined in the Section 2b-1 of the Financial Institutions Act. The share premium reserve is included in the calculation of the equity capital and the compensation funds is included in the calculation of the primary capital. The distribution of the share capital will be in proportion to the ownership fraction. Distribution of shares between capital classes is conducted on the basis of financial statements prepared as at 30 September 2011 for SpareBank 1 SR-Bank.
Fractional ownership
fractional ownership
30-09-2011 31-12-2011Equity certificates 3 180 3 180 Dividend equalisation reserve 1 077 1 448 Share premium reserve 625 625 Dividend - 191 a. total equity certificate holders' capital 4 882 5 444
Savings bank's fund 2 420 2 631 Compensation fund 55 55 Endowment fund 293 293 Dividend - 108 b. total savings bank fund 2 768 3 087
Fractional ownership (A/(A+B)) 63,82 % 63,82 %
calculation of the number of shares and distributionOwners of equity certificates in SpareBank 1 SR-Bank shall, on the date of the conversion, have their equity certificates replaced by shares in SpareBank 1 SR-Bank ASA. SpareBank 1 SR-Bank has issued 127 313 361 equity certificates that at the time of conversion, which will be swapped for a corresponding number of shares of SpareBank 1 SR-Bank ASA. The Savings Bank Foundation will be allocated shares in accordance with the fractional ownership, see above.This means that Sparebankstiftelsen SR-Bank will be allocated 72 176 308 shares. That part of the primary capital that does not provide a basis for allocation of shares to Sparebankstiftelsen will be added to SpareBank 1 SR Bank ASA’s premium reserve.
nOte 42 cHanges in eQuitY On cOnVersiOn tO a PubLic LiMited cOMPanY
105
No. of old equity certificates 127 313 361Ownership fraction 63,82 %Total no. of new shares after the conversion 199 489 669New shares Foundation 72 176 308 36,18 %Existing owners 127 313 361 63,82 %Nominal value of shares 25Total share capital 4 987 241 725
comments to the opening balance sparebank 1 sr-bank asaThe opening balance sheet has been prepared in accordance with International Financial Reporting Standards (IFRS).The opening balance is set up on the basis of the resolution passed by the Board of SpareBank 1 SR-Bank on 27 October 2011 and recommendation for a resolution to be passed by the Supervisory Board of SpareBank 1 SR-Bank on 23 November 2011.The resolutions were passed in accordance with Section 2c-17 of the Act on Financial Activity and Financial Institutions, cf. Companies Act, Chapter 15 on conversions.The opening balance has been prepared on the basis of SpareBank 1 SR-Bank’s financial statements at 30 September 2011. When preparing the opening balance, the continuity principle has been applied. The equity composition subsequent to the conversion has the same relative composition of restricted and unrestricted equity as prior to the conversion.
distributions of dividends 2011As at 31 December 2011, SpareBank 1 SR-Bank is a savings bank which complies with the Act on Financing Activity and Financial Institutions. Distributions of dividends must therefore comply with this section 2b-18 of this act. Because the ”owner fraction” (defined as the ratio of equety certificate capital to total equity capital) and numbers of shares are set by 30 September 2011, the same ”owner fraction” will be used for distribution of dividends by 31 December 2011.
nOte 43 eVents after tHe baLance sHeet date
The conversion of SpareBank 1 SR-Bank from an equity certificate bank into a public limited company (ASA) was implemented with effect from 2012. Sparebankstiftelsen SR-Bank was established as part of the conversion and received at the time of conversion 72.2 million shares. The total number of issued shares at the time of the conversion was 199.5 million.
The Board of Directors of SpareBank 1 SR-Bank ASA proposes to strengthen the equity capital by up to NOK 1.5 billion by way of issuing new ordinary shares following a rights issue. The issue is guaranteed by the company’s largest shareholders and companies in the SpareBank 1 Alliance.In addition to the rights issue, the Board of Directors proposes a private placement among the Group’s employees of up to NOK 100 000 per employee, equivalent to NOK 130 million kroner.
On 6 February 2012, SpareBank 1 SR-Bank exercised its right to redeem subordinated bonds at par. The outstanding volume is NOK 450 million. The call date is 20 March 2012. The FSA has approved the redemption.
There have been no significant events after balance date 31 December 2011 that affect the annual consolidated financial statements.
The proposed dividend is $ 1.50 per share, aggregating NOK 299 million kroner. The fractional ownership and the number of shares are given at 30.09.2011. The same ownership ratio is used when distributing the dividend per 31 December 2011.
(continuation note 42)
To the Annual Shareholders’ Meeting of SpareBank 1 SR-Bank
indePendent auditOr’s rePOrt
Report on the Financial StatementsWe have audited the accompanying financial statements of SpareBank 1 SR-Bank, which comprise the financial statements of the parent company and the financial statements of the group. The financial statements of the parent company and the financial statements for of group comprise the balance sheet as at 31 December 2011, income statement, changes in equity and cash flows for the year then ended, and a summary of significant accounting policies and other explanatory information.
The Board of Directors and the Managing Director’s Responsibility for the Financial StatementsThe Board of Directors and the Managing Director are responsible for the preparation and fair presentation of these financial statements in accord-ance with International Financial Reporting Standards as adopted by EU, and for such internal control as the Board of Directors and the Managing Director determine is necessary to enable the preparation of financial statements that are free from material misstatement, whether due to fraud or error.
Auditor’s ResponsibilityOur responsibility is to express an opinion on these financial statements based on our audit. We conducted our audit in accordance with laws, regu-lations, and auditing standards and practices generally accepted in Norway, including International Standards on Auditing. Those standards require that we comply with ethical requirements and plan and perform the audit to obtain reasonable assurance about whether the financial statements are free from material misstatement.
An audit involves performing procedures to obtain audit evidence about the amounts and disclosures in the financial statements. Theprocedures selected depend on the auditor’s judgment, including the assessment of the risks of material misstatement of the financialstatements, whether due to fraud or error. In making those risk assessments, the auditor considers internal control relevant to the entity’s preparation and fair presentation of the financial statements in order to design audit procedures that are appropriate in the circumstances,but not for the purpose of expressing an opinion on the effectiveness of the entity’s internal control. An audit also includes evaluating the appropri-ateness of accounting policies used and the reasonableness of accounting estimates made by management, as well as evaluating the overall presenta-tion of the financial statements.
We believe that the audit evidence we have obtained is sufficient and appropriate to provide a basis for our audit opinion.
Opinion In our opinion, the financial statements are prepared in accordance with the law and regulations and present fairly, in all material respects, the finan-cial position for the parent company and the group SpareBank 1 SR-Bank as at 31 December 2011, and its financial performance and its cash flows for the year then ended in accordance with International Financial Reporting Standards as adopted by EU.
Report on Other Legal and Regulatory Requirements
Opinion on the Board of Directors’ report and statement of corporate governance principles and practicesBased on our audit of the financial statements as described above, it is our opinion that the information presented in the Board of Directors report and statement of corporate governance principles and practices concerning the financial statements and the going concern assumption, and the proposal for the allocation of the profit is consistent with the financial statements and complies with the law and regulations.
Opinion on Registration and DocumentationBased on our audit of the financial statements as described above, and control procedures we have considered necessary in accordance with the International Standard on Assurance Engagements ISAE 3000 “Assurance Engagements Other than Audits or Reviews of Historical Financial Infor-mation”, it is our opinion that management has fulfilled its duty to produce a proper and clearly set out registration anddocumentation of the company’s accounting information in accordance with the law and bookkeeping standards and practices generally accepted in Norway.
Stavanger, 29 February 2012PricewaterhouseCoopers AS
Gunnar SlettebøState Authorised Public Accountant (Norway)
Note: This translation from Norwegian has been prepared for information purposes only.
106
The Control Committee has performed its duties in compliance with the Norwegian Savings Banks Act and the instructions to the Committee.
The bank’s activities in 2011 were in accordance with the Savings Banks Act, the bank’s Articles of Association andother regulations the bank must comply with.
The annual report and accounts that are presented have been prepared in compliance with the Norwegian Savings Banks Act and the regulations issued by Finans (The Financial Supervisory Authority of Norway). The Control Committee may recommend that the annual accounts and annual report for 2011 as well as proposals for the allocation of profits is adopted.
Control CoMMIttee’S StateMent For 2011
Stavanger, 29 February 2012
We declare that, to the best of our knowledge, the annual accounts for the period 1 January to 31 December 2011 have been prepared in accordance with current accountingstandards, and that the information in the accounts provides an accurate picture of the company’s and the group’s assets, liabili-ties, financial position and overall results.
We also declare that the annual report provides an accurate summary of the development, results and the position of the company and the group, together with a description of the key risk factors and uncertain factors faced by the company and the group.
Kristian EidesvikChairman of the Board
Gunn-Jane Håland
StateMent FroM tHe BoarD oF DIreCtorS anD tHe Ceo
Stavanger, 29 February 2012
Arne AustreidChief Executive Officer
Erik Edvard Tønnesen Birthe Cecilie Lepsøe
Erling Øverland
Odd Torland
Sally Lund-AndersenEmployee representative
Oddvar RettedalEmployee representative
Catharina Hellerud
Odd Jo Forsell Chairman of the
Control Committee
Egil Fjogstad Vigdis Wiik Jacobsen
107

nOrwegian cOde Of Practice fOrcOrPOrate gOVernanceThe Board of Directors of SpareBank 1 SR-Bank ASA annually reviews the principles of corporate governance and how they function in the group. SpareBank 1 SR-Bank ASA presents its report in accordance with the Accounting Act, section 3-3b and the Norwegian Code of Practice for Corporate Governance dated 20.10.2010, as amended on 20.10.2011 regarding accounting of the principles and practices of corporate governance.
(SpareBank 1 SR-Bank was converted from a savings bank to public limited company as of 1.1.2012 and the Board’s reportis based on the new organisational structure.)
Section 3-3b, 2nd sub-section of the Norwegian AccountingAct The description below explains how the Accounting Act, section 3-3b, 2nd sub-section is dealt with by SpareBank 1 SR-Bank ASA. The classification refers to the numbering inthe Act.
1-3. Statement on the practice that is followed by SpareBank 1 SR-Bank ASA, information of where the practice is to be found and justification of any deviation from the code. The structure for corporate governance in SpareBank 1 SR-Bank ASA group is based on Norwegian legislation. SpareBank 1 SR-Bank ASA follows the Norwegian Code of Practice for Corporate Governance issued by the Norwegian Corporate Governance Board (NCGB). The code is available on their website: www.nues.no. Any deviation from the code iscommented on under the report below on how the code is complied with.
4. Description on the main elements in the group’s systemsfor internal control and risk management relating to the accounting process See section 10 under Norwegian Code of Practice for Corporate Governance below.
5. Provisions in the Articles of Association that partlyor wholly extend or deviate from the provisions in Chapter 5of the Companies ActSparebank 1 SR-Bank ASA has no provisions in its Articles of Association that deviate from Chapter 5 of the Companies Act that deals with the General Meeting.
6. Composition of leading bodies and a description of the main elements relating to instructions and guidelinesSee sections 6, 7, 8 and 9 of the Norwegian Code of Practice for Corporate Governance below.
7. Provisions in the Articles of Association that regulate the appointment of and replacement of members of the Boardof Directors See section 8 of the Norwegian Code of Practice for Corporate Governance below.
8. Provisions in the Articles of Association and powersof attorney that provide the Board of Directors with theauthority to repurchase or to issue own shares See section 3 of the Norwegian Code of Practice for Corporate Governance below.
The description below explains how SpareBank 1 SR-Bank ASA complies with the 15 topics in the Code of Practice.
1. iMPLeMentatiOn Of cOde Of Practice fOr cOrPOrate gOVernanceThere are no significant deviations between the code of practice and how it is complied with by SpareBank 1 SR-Bank ASA.Two deviations, under topics respectively sections 7 and 14 are reported on below.
SpareBank 1 SR-Bank’s vision is: “Recommended by thecustomer.” The purpose of SpareBank 1 SR-Bank ASA is to create value for the region of which the bank is a part. To achieve this, three aspects are important: be recommended by the customer, have competitive access to capital as a result of good profitability and to be an attractive workplace. Customers shall perceive SpareBank 1 SR-Bank ASA as a bank that is efficient, competent and aggressive.
The vision and values form the basis for the group’s code of ethics and social responsibility. SpareBank 1 SR-Bank ASA shall be characterised by high ethical standards and goodcorporate governance. The code of ethics states that employees in the group shall show respect and consideration, and that communication shall be open, truthful and clear. The group’s code of ethics also addresses guidelines for impartiality,confidentiality and the duty to report, conflicts of interest,relationships with customers and suppliers, relationships to media, trading in securities, insider trading and relevant personal financial relationships. The regulations apply to all employees, contracted staff, the Board of SpareBank 1 SR-Bank ASA and to the extent they are relevant also for other members of the group’s other governing bodies.
Local added value is a major goal for SpareBank 1 SR-Bank ASA. The group’s main task is to supply the region’s businesses and private individuals with capital. In this way, the group
CORPORATE GOvERNANCE
108
ensures that the region maintains its natural growth and does not stagnate. In this way, the group helps create new jobs and residential buildings in the region. Local communities with diverse opportunities and leisure facilities are needed ifeveryone is to have an opportunity to develop. The group therefore supports good causes in the fields of sport, culture, research, education and upbringing.
The group aims to achieve competitive advantage by being the best to attract, challenge and develop the most competent employees. As a financial institution, SpareBank 1 SR-Bank ASA is keen to reduce the risk of a negative reputation and the risk of loss of confidence. High ethical standards among staff and elected officers will help strengthen the faith people have in the group. Employees and elected officers of SpareBank 1 SR-Bank ASA group, are obliged, in accordance with group’s guidelines for handlinginformation, to keep all information that they become privy toin their work, about the group or customers, strictly confidential. This duty of confidentiality applies not only vis-à-vis outsid-ers, but also to colleagues who do not need such information in their work. The rules also apply to information about the group’s strategy and marketing plans and other matters of competitive significance. The individual employees or elected representatives are responsible for keeping abreast of the general and special rules of confidentiality that apply in their work. Furthermore, no one working for SpareBank 1 SR-Bank ASA shall actively seekinformation about other employees, customers or third parties through computer systems or in any other manner, when this is not necessary for his or her work in the company. The group’scode of ethics states that an employee shall immediately inform his superiors or the Chairman of the Board or the Supervisory Board, if he or she becomes cognisant of circumstances that are inconsistent with applicable rules adopted by the authorities or a material breach of internal regulations. Employees who properly notify of the unacceptable circumstances in accordance with this paragraph shall not be subjected to strain as a result of thenotification. Violations of the code of ethics may result inimpacts on employment.
Deviation from the Code of Practice: None
2. OPeratiOnsSpareBank 1 SR-Bank ASA’s object is to manage the funds controlled by the group in a prudent manner in accordance with legislation applicable at any time. SpareBank 1 SR-Bank ASA can perform all normal banking transactions and banking services in accordance with current legislation. Furthermore, the bank can provide investment services within the limits of the current licences. The articles of association, in extenso, are available on the group’s website. The group’s goals and main strategies are described in the annual report.
Deviation from the Code of Practice: None 3. eQuitY caPitaL and diVidendsAs at 31 December 2011, SpareBank 1 SR-Bank had equity capital totalling NOK 9.8 billion. In accordance with stipulated
calculation rules for capital adequacy for financial institutions, the group had an overall capital adequacy of 11.4 per cent and a core capital adequacy of 10.6 per cent. The authorities’ minimum requirements for such capital adequacy are 8 and 4 per cent respectively. The Board of Directors assesses the capital situation on an ongoing basis in light of the company’sobjectives, strategies and desired risk profile. The Board of Directors considers the capital adequacy as at 31 December 2011 to be satisfactory, but has resolved to propose to the General Meeting that the bank’s pure core capital bestrengthened, in the first half of 2012, through a rights issueof up to NOK 1.5 billion and a private placement among group employees of up to NOK 130 million. The reason for this is that the European Banking Authority (EBA), has adopted a formal recommendation that important European banks should increase their capital adequacy to at least 9 per cent pure core capital by the end of June 2012. In Norway, the Financial Supervisory Authority decided that the requirement shall apply to all banks and finance companies. The strengthening of the bank’s capital base through the planned rights issue makes the bank even better equipped to exploit profitable businessopportunities in a region with significant growth.
For more information on the capital adequacy regulations, see www.sr-bank.no.
DividendsSpareBank 1 SR-Bank ASA’s financial goals are to achieve results that provide good and stable returns on the bank’sequity and thereby create value for shareholders by way of a competitive return in the form of dividends and capitalgains on shares. When determining the size of annualdividends consideration shall be given to the group’s capital needs, including capital adequacy requirements, as well as the group’s goals and strategic plans. Unless capital requirements dictate otherwise, the Board’s goal is that about half of the profit after tax shall be distributed as dividends.
AuthoritiesThe Board of Directors of SpareBank 1 SR-Bank ASA has the authority to purchase and register liens on the bank’s own shares for up to 10 per cent of the bank’s share capital. The shares shall be acquired in the securities market via Oslo Børs. Each share can be purchased at a price of between one and NOK 150 million. The authorisation is valid for 12 months from the date it is adopted by the General Assembly.
Furthermore, the Board is authorised to carry out a capital increase of up to NOK 25 million through a private placement of shares among the bank’s employees. The authorisation is valid until 1 June 2012.
Deviations from the Code: None
109
4. eQuaL treatMent Of sHareHOLders and transactiOns witH cLOseLY reLated Parties All shares have equal voting rights. In the event of an increase in equity capital, existing shareholders have pre-emptive rights, unless special circumstances dictate that these rights can be waived. Such a waiver would then be justified. In cases where the Board asks the General Meeting to authorise the repurchase of own shares, any such repurchase shall be carried out in the market at market price.
The largest shareholderSparebankstiftelsen SR-Bank is SpareBank 1 SR-Bank ASA’s largest shareholder. The Foundation was established on 1 January 2012 when SpareBank 1 SR-Bank was converted into a public limited company. At the time of the conversion, thefoundation had a stake of 36.18 per cent. Pursuant to thefoundation’s articles of association, the object is to managethe shares that were transferred to the foundation on itsestablishment and to exercise and maintain a significantlong-term and stable ownership in SpareBank 1 SR-Bank ASA. The foundation may also invest funds in an appropriate and satisfactory manner taking into account security, riskdiversification, liquidity and yield , with a view to achieving a market rate of return on equity. The foundation may allocate profits and distribute dividends funds for charitable purposes. The foundation, when distributing the dividends it receives, shall primarily consider those districts that have built up primary capital in the former SpareBank 1 SR-Bank. The ownership stake must be at least 25 per cent of the shares issued by SpareBank 1 SR-Bank ASA. Through it activities, the foundation shall continue the savings bank tradition by participating in capital increases in SpareBank 1 SR-Bank ASA and in other ways. Furthermore, the foundation can engage in other activities that are consistent with the stated objects and within the regulations for savings bank foundations as they apply at any time.
Transactions with related partiesThe instructions issued to the Board of SpareBank 1 SR-Bank ASA stipulates that the Board shall ensure that the company complies with sections 3-8 and 3-9 of the Companies Act in agreements between the company and parties listed there. When non-immaterial agreements are entered into betweenthe company and shareholders, directors or members ofcorporate management or related parties, the Board will obtain an independent third party assessment. Any member of the Board or member of executive management shall immediately notify the Board if he or she directly or indirectly has aninterest in a transaction or agreement entered into orconsidered by the company. This applies even if the board member is deemed disqualified to deal with the issue.
Deviations from the Code: None
5. freeLY negOtiabLe sHaresThe bank’s shares are listed on Oslo Børs with ticker SRBANK and may be freely negotiated. The Articles of Association contain no restrictions on negotiation.
Deviations from the Code: None
6. generaL Meeting
General MeetingPursuant to the Articles of Association, the Annual General Meeting shall be held before the end of April each year. The notice and registration form will be sent to shareholders and published on the group’s website no later than 21 days before the date of the meeting.
Procedures for voting and for submitting proposals arespecified in the notice. According to the Articles of Association, the Chairman of the Supervisory Board acts as chairman of the General Meeting. At the General Meeting, at least the Chairman of the Board must represent the Board of Directors, at least one member of the Nomination Committee must attend, as must the external auditor. Other Board members may attend. From the executive management, the Chief Executive Officer and the Chief Financial Officer must attend. General Meeting minutes are available at www.sr-bank.no.
In general, resolutions call for a simple majority. Decisions about the disposals of shares, mergers, demergers, sales ofa substantial part of SpareBank 1 SR-Bank ASA’s operationsor the issuance of shares in the bank, require approval fromat least two-thirds of the votes and the share capital represented at the General Meeting.
Voting procedure allow for voting separately on each member of the various bodies. It is possible for shareholders to issue a proxy to others. A person is also appointed to act as a proxy for shareholders. To the extent possible, the proxy form is designed in such a way that it allows for voting on each subject matter and for each candidate to be elected.
Deviations from the Code: None
7. tHe nOMinatiOn cOMMitteeThe Supervisory Board appoints a Nominating Committee that will provide a detailed recommendation to the Supervisory Board on proposals for election of members of the Board of Directors. The committee should have members from both groups on the Supervisory Board (shareholders andemployees). Sparebankstiftelsen SR-Bank shall berepresented on the Nomination Committee. The Supervisory Board Chairman is Chairman of the Nomination Committee.
The General Meeting appoints a Nomination Committee that will provide a detailed recommendation on proposals for the election of members of the Supervisory Board and Audit Committee to the Supervisory Board. The recommendations should provide pertinent information about the candidates’ background and independence. Members of the Nomination Committees are elected for two years at a time.
Pursuant to the bank’s Articles of Association, the General Meeting has issued instructions relating to the
110

committees’ work. No Board members or members of theexecutive management can be members of Nomination Committees. The Nomination Committee proposes theremuneration for members of the bodies mentioned above. The General Meeting determines the Nomination Committee’s remuneration. Information on the Nomination Committees and deadlines for providing input can be found on www.sr-bank.no.
Deviations from the Code: All members of the bank’s Nomination Committees are members of the bank’s Supervisory Board. So far, no decision has been taken as regards to whether at least one member of the Nomination Committee should not be a member of the Supervisory Board or the Board of Directors.
8. suPerVisOrY bOard and bOardOf directOrs, cOMPOsitiOnand indePendence
Supervisory BoardThe Supervisory Board’s main task is to supervise the Board of Directors’ and the Chief Executive Officer’s management of the group. The Supervisory Board has 30 members, of whom 22 are shareholder-elected members elected by the General Meeting. Emphasis is on broad representation from the company’s shareholders. Furthermore, eight representatives are elected by and from among the employees. Three of the shareholder-elected members represent the foundation, Sparebankstiftelsen SR-Bank.
Board of DirectorsThe Board of Directors has up to 9 members, two of whomrepresent the employees. No member of the executivemanagement is a Board member. One of the members represents Sparebankstiftelsen SR-Bank.
The Supervisory Board elects the Board of Directors. When selecting board members, one seeks the need for continuityand independence, as well as a balanced composition of the board. Members are elected for up to two years at a time.Four of the members are women, one of whom is an employeerepresentative. The individual board members’ backgroundsare described on the bank’s website. All board members are independent of the bank’s executive management andimportant business connections. Otherwise, reference is made to the overview of the governing bodies and Chapter 3 of the Articles of Association www.sr-bank.no.
Deviations from the Code: None
9. tHe wOrK Of tHe bOard Of directOrs
The Board’s tasksThe Board has adopted a set of regulations that provide rules for the Board’s work and procedures, including the matters to be considered by the Board, the CEO’s duties and obligations to the Board and rules governing notice of Board meetings and procedures. The Board’s regulations and instructions are
available at www.sr-bank.no. The Board prepares an annual plan for its work. The Board has also issued instructions tothe CEO. The Board conducts an annual evaluation of itsperformance and working methods. The Board has overall responsibility for the management of SpareBank 1 SR-Bank ASA and through the CEO ensure a prudent organisation ofthe business. The Board determines, among other things, plans and forecasts for the business and keeps abreast of the bank’sfinancial position and development through the approvalof quarterly and annual reports and a monthly review of thefinancial position and development. The Board shall further ensure that the business is subject to adequate control and that the group’s capital status is appropriate to the scope of the operations and the inherent risks.
Meeting structureThe CEO prepares matters to be considered by the Board inconsultation with the Chairman of the Board. Emphasis is placed on preparing and presenting issues to be dealt with by the Board in manner that ensures that Board has an adequate basis on which to consider the matter. The Chairman of the Board of Directors chairs the meetings. If neither the Chairman nor Deputy Chairman is present, the Board shall elect achairman for the meeting.
Audit CommitteeThe Board of Directors of SpareBank 1 SR-Bank ASA hasan Audit Committee consisting of three Board members.It normally meets six times a year. The Audit Committeeis a preparatory and advisory committee for the Board. Thechairman and members shall be appointed for one year at a time. The Audit Committee shall collectively have the expertise that is necessary, based on the bank’s organisation andoperations, for them to fulfil their responsibilities. At least one of the members must have relevant accounting or auditing expertise. The Audit Committee’s objectives, tasks andfunctions are further regulated by the Board’s instructions.
Remuneration CommitteeThe Board of Directors of SpareBank 1 SR-Bank ASA hasa Remuneration Committee consisting of three members of the Board. It normally meets four times a year. The committeerecommends, on the basis of the Board’s guidelines,remuneration to senior executives in accordance withSection 6-16a of the Public Limited Companies Act. The Remuneration Committee’s objectives, tasks and functionsare further regulated by the Board’s instructions.
Deviations from the Code: None
10. risK ManageMentand internaL cOntrOL The Board of Directors of SpareBank 1 SR-Bank ASA focuseson risk management and this is an integral part of its work.The bank’s Department of Economics and Finance prepares financial reports for SpareBank 1 SR-Bank ASA and ensures that reporting is in accordance with applicable laws, accounting standards, set accounting policies and Board guidelines.
111
Processes and controls have been established to ensure the quality assurance of financial reporting.
The banking industry’s core activity is to create values by assuming recognised and acceptable risks. The group invests, therefore, significant resources in developing risk management systems and processes that are in line with leading international practice.
Risk and capital management in SpareBank 1 SR-Bankunderpins the group’s strategic development and theachievement of its goals, while at the same time ensuringfinancial stability and prudent asset management. This is achieved through a strong corporate culture that ischaracterised by:
• A high awareness of risk management • A good understanding of which risks drive earnings • Striving for optimal capital utilisation within the adopted business strategy• Avoiding unexpected single incidents that can seriously harm the group’s financial situation• Exploiting synergies and diversification effects
To ensure effective and appropriate processes for risk and capital management the framework is based on various elements that reflect the way the Board and management control of the group. The main elements are:
• Strategic targets• Risk identification and analysis• Capital Allocation• Financial projections• Evaluation and measures• Reporting and monitoring• Organising and organisational culture
The framework is described in Note 3 to the financialstatements, as well as in the Pillar III document for SpareBank 1 SR-Bank ASA, which is available on-www.sr-bank.no.
SpareBank 1 SR-Bank ASA is concerned with independence in management and control, and responsibility is divided between the different roles in the organisation.
The Board sets the group’s risk profile, the overall limits, authorities and guidelines for risk management, and ensures that the group has a capital base that is satisfactory based on the risk borne by the group as well as regulatory requirements. The Board has adopted a code of ethics that contributes to raising awareness and compliance with the ethical standardsset for the group.
The first line of defence (Day-to-day risk management)The CEO is responsible for the group’s risk management being followed up within the framework adopted by the Board of Directors. Business units are responsible for the overallrisk management within their business area.
Second line of defence (Overall risk reporting and follow-up)The Department for Risk Management and Compliance isorganised independent of the business units and reports directly to CEO. The department is responsible for developing the framework for risk management including risk models and risk management systems. The department is also responsible for the independent monitoring and reporting of risk exposure, and for the group compliance with applicable laws and regulations.
The third line of defence (Independent confirmation)The Internal Auditor monitors that the risk management processes are targeted, effective and function as intended. The group’s internal audit function carried out by Ernst & Young, and this secures independence, competence and capacity. Internal audit reports to the Board of Directors. Internal audit reports and recommendations for improvements in the group’s risk management are continuously reviewed in the group. Financial institutions are required to have their own elected Audit Committee. The Audit Committee is independent of the Board and the executive management, and holds meetings regularly. It ensures that the company complies with applicable laws, regulations and other rules issued by the authorities, the company’s Articles of Association and resolutions adopted by decision-making bodies. The Committee has full insight into the operations and consists of three members. Details of the Audit Committee’s members, as well as the Audit Committee’sinstructions are available on-www.sr-bank.no.
Internal Audit and systems also include the company’s basic values, the Code of Ethics and social responsibility.
Deviations from the Code: None.
11. reMuneratiOn tO tHe bOardOf directOrsBoard members receive an annual compensation fixed by the Supervisory Board. Board members’ remuneration is not linked to results or the like. None of the directors, other than the employee representatives, has responsibilities to the company beyond their board duties. See also note 9 of the Annual Report for 2011.
Deviations from the Code: None
12. reMuneratiOn Of seniOr eXecutiVesSparebank 1 SR-bank ASA has established a remuneration scheme that applies to all employees. The group’s remuneration scheme shall be consistent with the Group’s overall objectives, risk tolerance and long-term interests and shall help to promote and provide incentives for good management and control of the group’s risk, discourage excessive or unwanted risk taking, and help to avoid conflicts of interest, and shall comply with the Regulations governing remuneration schemes in financialinstitutions, investment firms and management companies dated 1 December 2010. The total remuneration shall becompetitive but the group shall not be a wage leader. It shall ensure that the group attracts, develops and retains the most competent employees over time. The scheme will ensure a
112

reward model that is perceived to be fair, predictable and future-oriented and motivating. Fixed salaries shall be the main element of the total remuneration, which also consists ofvariable pay, pensions and benefits in kind. The Board of Sparebank 1 SR-Bank ASA has established a Remuneration Committee consisting of three Board members. The Remuneration Committee’s responsibilities are stipulated inthe Board instructions. The Board’s guidelines for remuneration to senior executives are disclosed in note 9 of the annual report for 2011.
Deviations from the Code: None
13. infOrMatiOn and cOMMunicatiOnSpareBank 1 SR-Bank ASA makes every effort to ensure that correct, relevant and timely information about the group’s performance and results inspires investor market confidence. Information to the market is distributed through quarterlyinvestor presentations. Regular presentations are made tointernational partners, lenders and investors. All reportingis based on openness and equal treatment of players in thesecurities market. The group’s financial calendar is published on the bank’s website. All quarterly reports, annual reports, press releases and quarterly presentations can be found atwww.sr-bank.no.
Deviations from the Code: None
14. cOrPOrate taKeOVerThe Board of Directors of SpareBank 1 SR-Bank ASA will deal with any takeover bid in accordance with the principle of equal treatment of shareholders. At the same time, the Board will ensure that shareholders get the most comprehensiveinformation in all situations that affect the interests ofshareholders. On acquiring shares in a financial institution involving any ownership over 10 per cent of the share capital
one must apply for permission from the Norwegian FSA. In connection with SpareBank 1 SR-Bank ASA receiving a license for the conversion to public limited company, a condition was set that Sparebankstiftelsen SR-Bank shall have an ownership stake, which must be at least 25 per cent of issued shares in SpareBank 1 SR-Bank ASA.
Deviations from the Code: The Board has not established explicit principles for the handling of a takeover bid. The reason for this is the Financial Institutions Act’s restrictions on ownership of financial institutions and the licensing conditions in connection with the conversion to ASA. The Board endorses the Code’s wording on this point.
15. eXternaL auditOrThe external auditor presents an annual audit plan to the Audit Committee. The Audit Committee recommends the election of an auditor to the Board of Directors. This proposal is submit-ted to the Supervisory Board, which makes a recommendation to the General Meeting. The Audit Committee or the Board of Directors holds at least one annual meeting with the auditor without the executive management being present. The Audit Committee recommends to the Board the approval of the external auditor’s fees. The Board then presents the proposals for fees to the Supervisory Board and the General Meeting for approval.
The external auditor shall provide the Audit Committee a report on the main elements of the audit of the previous financial year, including, in particular, any material weaknesses identified in respect of internal control relating to the financial reporting process.
Deviations from the Code: None
113
The banking industry’s core activity is to create values by accepting consious and acceptable risks. The group invests, therefore, significant resources in developing risk management systems and processes that are in line with leading international practice.
SpareBank 1 SR-Bank is exposed to a range of different risks and the most important of them are: • Credit risk: the risk of losses as a result of customers’/ counterparties’ inability or unwillingness to fulfil their obligations • Market risk: the risk of losses due to changes in observable market variables such as interest rates, foreign exchange rates and securities markets• Operational risk: the risk of losses as a result of inadequate or failing internal processes or systems, human error or external events • Liquidity risk: the risk of the group not being able refinance its debt or being unable to finance growth in assets without a substantial increase in costs • Ownership risk: the risk of SpareBank 1 SR-Bank incurring negative results from ownerships in strategically-owned companies and/or the need to provide these companies with fresh equity. The companies thus owned are defined as companies in which SpareBank 1 SR-Bank has a significant stake and influence• Commercial risk: the risk of unexpected fluctuations in revenues and expenses as a result of changes in external conditions such as the market situation or mandatory regulations • Reputation risk: the risk of a decline in earnings and access to capital owing to declining confidence and reputation in the market, i.e. customers, counterparties, the stock market and the authorities • Strategic risk: the risk of losses as a result of the failure of strategic initiatives • Compliance risk: the risk of the group incurring official sanctions/penalties or financial losses as a result of failure to comply with legislation and regulations
Risk and capital management in SpareBank 1 SR-Bank underpins the group’s strategic development and achievement of its goals. Risk management ensures financial stability and prudent asset management. This is achieved through a strong organisational culture that is characterised by:
• A high awareness of risk management • A good understanding of which risks drive earnings • Striving for optimal capital utilisation within the adopted business strategy• Avoiding unexpected single events that can seriously damage the group’s financial situation• Exploiting synergies and diversification effects
In order to ensure an effective and adequate process for risk and capital management, the framework is based on a variety of elements that reflect the manner in which the Board of Directors and management govern the company. The principal elements are described below:
The group’s strategic target: SpareBank 1 SR-Bank is to be the most attractive supplier of financial services in the West and South of Norway, based on
• Good customer experiences• A strong team feeling and professionality• Local roots and decision-making powers• Financial strength, profitability and market trust
Risk identification and analysis: The process for risk identification is based on the group’s strategic target. The process is forward-looking and covers all of the group’s significant risk areas. In areas where the effect of the established control and management measures is not considered to be satisfactory, improvement measures are implemented. Probability-reducing measures shall be given priority ahead of measures aimed at reducing consequences.
Capital allocation: The return on risk-adjusted capital is one of the most important strategic performance goals in the internal management of SpareBank 1 SR-Bank. This implies that capital is allocated to business areas in accordance with the calculated risk of the operation and that the return on the capital is monitored continually.
Financial projections: Projections of expected financial development are made for the next 5 years, based on thestrategic target and the business plan. In addition, projections are made of a situation involving a serious economic recession.
RISK AND CAPITAL MANAGEMENT
114
In order to assess the consequences that a serious economic down-turn would have on SpareBank 1 SR-Bank, the group focuses strongly on areas of the economy that impact the financial development. These are mainly development in credit demand, the stock market, the interest market and credit risk trends. In addition to having an impact on the returns from the underlying assets, a economic down-turn will have an impact on customer savings behaviour. The purpose of the projections is to calculate how the financial development in the activities and macro-economy will impact the group’s financialdevelopment, including return on equity, the fundingsituation and capital adequacy.
Evaluation and measures: The analyses shall providemanagement and the Board of Directors sufficient riskunderstanding so that they can consider whether the grouphas an acceptable risk profile, and whether it is adequatelycapitalised in light of the risk profile and strategic targets.
SpareBank 1 SR-Bank prepares capital plans in order to ensure long-term and effective capital management and to ensure that the group’s capital adequacy is acceptable based on the risk exposure. The capital plan takes into consideration both the
expected development and a situation with a serious recession over several years. In addition, SpareBank 1 SR-Bank prepares contingency plans in order to tackle such critical situations in the best possible manner.
Reporting and monitoring: The group’s overriding riskexposure and risk development is monitored through periodic risk reports to management and the Board of Directors. Theoverriding risk monitoring and reporting is the responsibilityof the Department for Risk Management and Compliance.
Organisation and organisational culture: SpareBank 1 SR-Bank strives to have a strong organisational culture that ischaracterised by awareness for risk management. Theorganisational culture comprises management philosophyand the people in the organisation with their personalattributes, such as integrity basic values and ethics. It is difficult to compensate for an inadequate organisational culture by using other control and management measures. Therefore, SpareBank 1 SR-Bank has established clear basic values and ethicalguidelines that are clearly communicated and published throughout the entire organisation.
115
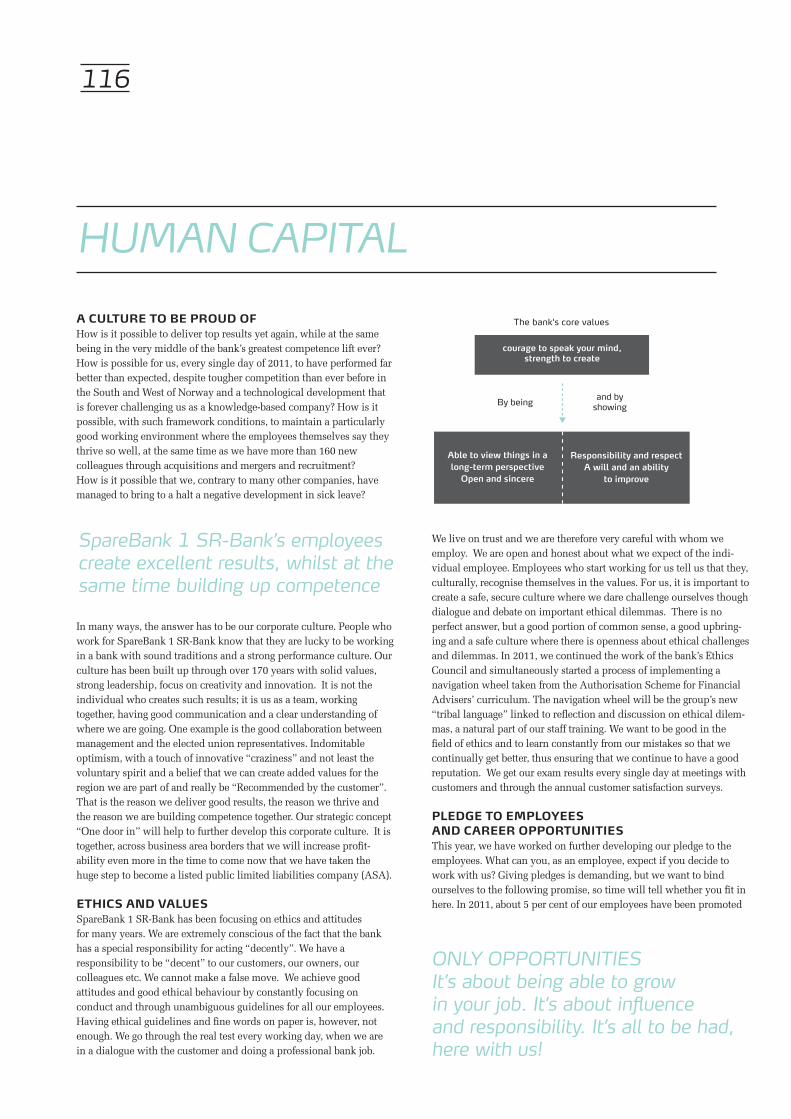
a cuLture tO be PrOud OfHow is it possible to deliver top results yet again, while at the same being in the very middle of the bank’s greatest competence lift ever? How is possible for us, every single day of 2011, to have performed far better than expected, despite tougher competition than ever before in the South and West of Norway and a technological development that is forever challenging us as a knowledge-based company? How is it possible, with such framework conditions, to maintain a particularly good working environment where the employees themselves say they thrive so well, at the same time as we have more than 160 newcolleagues through acquisitions and mergers and recruitment?How is it possible that we, contrary to many other companies, have managed to bring to a halt a negative development in sick leave?
In many ways, the answer has to be our corporate culture. People who work for SpareBank 1 SR-Bank know that they are lucky to be working in a bank with sound traditions and a strong performance culture. Our culture has been built up through over 170 years with solid values, strong leadership, focus on creativity and innovation. It is not the individual who creates such results; it is us as a team, working together, having good communication and a clear understanding of where we are going. One example is the good collaboration between management and the elected union representatives. Indomitable optimism, with a touch of innovative “craziness” and not least the voluntary spirit and a belief that we can create added values for the region we are part of and really be “Recommended by the customer”. That is the reason we deliver good results, the reason we thrive and the reason we are building competence together. Our strategic concept “One door in” will help to further develop this corporate culture. It is together, across business area borders that we will increase profit- ability even more in the time to come now that we have taken the huge step to become a listed public limited liabilities company (ASA). etHics and VaLuesSpareBank 1 SR-Bank has been focusing on ethics and attitudesfor many years. We are extremely conscious of the fact that the bank has a special responsibility for acting “decently”. We have a responsibility to be “decent” to our customers, our owners, our colleagues etc. We cannot make a false move. We achieve good attitudes and good ethical behaviour by constantly focusing on conduct and through unambiguous guidelines for all our employees. Having ethical guidelines and fine words on paper is, however, not enough. We go through the real test every working day, when we are in a dialogue with the customer and doing a professional bank job.
We live on trust and we are therefore very careful with whom we employ. We are open and honest about what we expect of the indi-vidual employee. Employees who start working for us tell us that they, culturally, recognise themselves in the values. For us, it is important to create a safe, secure culture where we dare challenge ourselves though dialogue and debate on important ethical dilemmas. There is no perfect answer, but a good portion of common sense, a good upbring-ing and a safe culture where there is openness about ethical challenges and dilemmas. In 2011, we continued the work of the bank’s Ethics Council and simultaneously started a process of implementing a navigation wheel taken from the Authorisation Scheme for Financial Advisers’ curriculum. The navigation wheel will be the group’s new “tribal language” linked to reflection and discussion on ethical dilem-mas, a natural part of our staff training. We want to be good in the field of ethics and to learn constantly from our mistakes so that we continually get better, thus ensuring that we continue to have a good reputation. We get our exam results every single day at meetings with customers and through the annual customer satisfaction surveys. PLedge tO eMPLOYeesand career OPPOrtunities This year, we have worked on further developing our pledge to the employees. What can you, as an employee, expect if you decide to work with us? Giving pledges is demanding, but we want to bind ourselves to the following promise, so time will tell whether you fit in here. In 2011, about 5 per cent of our employees have been promoted
HuMAN CAPITAL
SpareBank 1 SR-Bank’s employees create excellent results, whilst at the same time building up competence
ONLY OPPORTUNITIESIt’s about being able to growin your job. It’s about influenceand responsibility. It’s all to be had,here with us!
116

as a result of documented results. This proves that we focus on staff members who will and who can. Over the last decade, SpareBank 1 SR-Bank has grown into an environment with a much broader range of expertise and is now a complete finance house. Here, you can find jobs involving financial advisory services, corporate advisory services, real estate brokering, commercial real estate, various positions in thecorporate finance field, stock broking and many excitingmanagerial jobs and key positions in staff and support, tomention but a few. We want the most capable people, simply because it is our employees who will ensure that we are a customer-orientated and profitable bank in the foreseeable future.
deVeLOPing cOMPetence– an inVestMent in tHe futureHow are we planning for tomorrow? We know that competitionis getting tougher; we know that the demands from ourcustomers will increase; we also know that the authorities’ and owners’ framework conditions will change. Market structure is changing and providing new opportunities. New technologyprovides new ways to work and creates exciting opportunitiesfor our employees. Social media have come to stay and are chal-lenging us, as a traditional bank, in a completely new manner. This creates new opportunities. In the future, focus will be on holding a safe and steady course while at the same time daring to face the future with an opportunity-oriented focus. Demands oncompetence will increase. Some employees will decide to develop themselves in line with the requirements, while others will seek new challenges outside of the group. Our greatest challenge will be the timing of this adjustment, so that we undergo a constantpositive adjustment that best serves the individual and theorganisation. In 2010, we got many new colleagues as a result of growth in both core areas of the bank and subsidiaries. Therefore, 2011 has for many of our employees resulted in an extraordinary competence lift in line with the quality standards that we setourselves as a modern house. In general, this has been seen as a
positive journey, where employees have taken these challengesin their stride and succeeded. Another key skills developmentinitiative in 2011 was a new internal school, SpareBank 1 SR-School including a brand new programme for newly recruited staff. A new Manager Development Programme that will help us implement new management principles in the group was also
initiated. We can safely call ourselves a competence company now that over 70 per cent of the group’s employees have a bachelor’s degree or higher, and more than 80 per cent of our advisers are authorised in accordance with AFR. In 2011 about 50 of our employees completed their college education funded by us as an employer.
We have a good corporate culture, where we care about each other. In a labour market where performance demands are steadily becoming greater, there will always be some who quit, some who get sick and/or some who feel that they cannot cope. As a large organisation, we will always have colleagues who become ill or experience stressful situations where they, for a period, perform under par. We also see signs that tell us that some colleagues are struggling to cope with their commitments to work and home simultaneously. Do we have managers with the ability to see the individual? Do we have colleagues who care, who take a break in their day-to-day activities and take contact? Are we good enough at looking after our health and ourselves? Are we physically active, and do we put enough effort into watching our diets? Are we good at preventing, detecting and addressing problems related to substance abuse? These will be important areas to focus on in the future if we are to maintain good profitability, low sick-leave figures and a good working environment. We do not believe our employees shirk, nor do they have bad attitudes. Rather, we believe in a good and inclusive working environment were the basic philosophy is that we all want to do a good job in SpareBank 1 SR-Bank.
Fundamentally, we must respect the fact that anyone and everyone can be sick, in which case we must arrange for the individual to accept responsibility and to tackle the situation, and that we, as colleagues and managers meet everyone with good dialogue and care. In this way, we maintain our good corporate culture and pave the way for continued good profitability for our owners and the society of which we are a part. We have therefore revised our Life Phase policy in 2011, and spent on average approximately NOK 2 000 per employee on health-promoting activities. We have also introduced a new insurance scheme for the group’s staff – corpo-rate health insurance.
Strategy
Law
s and
gui
delin
es
KNO
WLE
DGE
SKILLS
Values
Vision
ATTITUDES
Strategy
Law
s and
gui
delin
es
KNO
WLE
DGE
COMPETENCE
SKILLS
Values
Vision
ATTITUDES
By living to achieve our visionand by making our values into rules rather than just pretty words, we can create a culture that we canbe proud of and can rely on.A vibrant working day.An effective, competentand offensive working day.
117

OutLine Of 2010 • Good results despite tough competition• Net growth in new customers over 18 years of age citing us as main bank, 6 500 • Good rise in volumes, namely 11.2 per cent in lending and 9.6 per cent in deposits • Good sales and an increase in the number of product sales per customer• Insurance-related commission income rose by 32 per cent compared with 2010• The quality of the lending portfolio is still good with extremely low loan losses
effectiVe serVicesand cOMPetent adVisersCustomers are to perceive SpareBank 1 SR-Bank asa close, competent and offensive bank with which theycan cooperate effectively. The combination of self-servicesolutions, the Group’s state-of-the-art customer centre and a well-developed branch network with strong local offices provide the customers with good access to financial services.
Customers are to experience that SpareBank 1 SR-Bank takes relevant initiatives and is available to the customer on request. Training of financial advisers and a continiously improvement of advisory tools are given high priority, in order to create good customer experiences. This commitment is confirmed by the Group now having more than 308 publicly authorised financial advisers.
The combination of effective services and access toprofessional advice shall result in an increasing numberof people recommending SpareBank 1 SR-Bank to theirfriends and acquaintances. This, together with the constantlyimproving service range offered, is considered an important reason for the division’s customer and income growth.
eMPLOYeesThe Retail Market Division employs 540 full time equivalents. In addition, there are 211 full time equivalentsin EiendomsMegler 1 SR-Eiendom AS. The division recruited 65 new employees in 2011. The average age of the employees is 31.2 years. 308 of the employees are now publicly authorised financial advisers and 220 are publicly authorised insurance advisers.
custOMers and MarKetsStability in the existing customer base combined with a deliberate commitment to new sales resulted in a good net
growth in the number of customers in 2011. Measured in terms of customers and volume the growth was highest in Rogaland, whilst the relative growth was highest in Hordaland.
The growth in both lending and deposits were higher than the national average and this is naturally linked to the general increase in the number of customers. The growth in lending (including loans sold to SpareBank 1 Boligkreditt) was 11.2per cent in 2011, while deposits grew by 9.6 per cent.
Low unemployment, net migration to the market area thepersistent low interest rate level contributed to good activityin the housing and leisure home markets in 2011. Focus onco-location of the banking and real estate services paves the way for good interaction and good results in both banking and real estate brokerage.
Overall, the Group’s market share of deposits and loans in Rogaland was just under 40 per cent.
agricuLture and sMaLL cOMPanies SpareBank 1 SR-Bank’s goal is to be the best agricultural bank in the region and, in a market with increasing competition, the customer portfolio developed well in 2011. Total growth in lending and deposits of about 12 per cent confirms our position in this segment. Growth has been strongest in Jæren and Ytre Ryfylke. The development is complemented by relatively strong growth in Agder, which is a relatively new area for the bank as far as agriculture is concerned.
SpareBank 1 SR-Bank participates actively in many agricultural arenas. Using dedicated specialists has had a good result.
The agricultural industry’s economy was better in 2011 than it was in 2010, even though in an industry with small profit margins there are also some enterprises and individual
RETAIL MARKET DIvISION
* Including loans sold to SpareBank 1 Boligkreditt aS
•no. of retail customers: 266 710•no. of agricultural customers: 3 126•no. of small and medium size businesses: 6 600•no. of clubs and associations: 3 299•*lending (noK million): 93 054•Deposits (noK million): 36 694
118

No. of customers: 8 000*Growth in lending: 11.8%Growth in deposits: 8.2%*Gross lending: MNOK 45 852Deposits: MNOK 23 525
* Including loans sold to Sparebank 1 Næringskreditt AS
customers who are experiencing financial challenges. In the borderland between private individuals and companies are many forms of organisation and complex issues. In 2011, the small company segment has had good customer and volume growth in loans and deposits. Specialists in the small company segment, who meet the customers in the bank’s local offices, have also been successful with regard to additional sales. More active use of the call centre has also freed up capacity which has been used to provide even better advice to customers with growth potential.
PrOducts and serVices SpareBank 1 SR-Bank wants to provide a wide range offinancial services to the general public. Through systematic customer follow-up and a constant development of the service range, we aim at increasing the product coverage per customer. In 2011, the number of sold products rose by 11 per cent compared with 2010. The growth in insurance income, 32 per cent, was particularly linked to good insurance portfolio quality, a growth in sales of personal insurance and a portfolio in Hordaland that was acquired in 2010.
The launching of a new online bank in the second half of2011 was very well received by the customers. The range of self-service solutions was further developed in 2011 and the use of these services is rising. We will continue to launch new self-service services in 2012, with, among other things, new solutions for savings and financing.
Retail customers with a larger business volume and investment portfolios are served through the “Private Bank”. The product and service range is adapted to the needs of this customer segment and is provided through a combination of personal
advisers and good access to investment counselling. In a demanding market for investment services, SpareBank 1 SR-Bank increased sales of investment products amongst the largest retail customers.
deVeLOPMent in credit QuaLitYThe quality of the portfolio is very good. Good activity in the region resulted in low unemployment and good solvency for most people. Close customer relationships and good routines for monitoring customers, combined with good marketconditions, contributed to a low default level. Gross non-performing loans measured in terms of gross lending stood at 0.3 per cent at the end of 2011, unchanged from the preceding year. SpareBank 1 Boligkreditt AS was yet again an important source of funding for secure housing loans in 2011. At the end of the year, SpareBank 1 SR-Bank had transferred approximately NOK 44.7 billion to SpareBank 1 Boligkreditt AS.
OutLOOK fOr 2012Activity in the retail market is good also at the beginning of 2012. Low interest rates, low unemployment and population growth contribute to continued optimism. Competition from established and new players is strong. New regulatoryrequirements from the authorities, with somewhat detailed control of the banks’ lending practices, have resulted indevelopments in the mortgage market being less predictable than before. Along with increased funding costs andinternational unrest, uncertainty surrounding future market conditions is slightly higher than it was last year. In future,the division will prioritise measures aimed at continuedcustomer growth and have reinforced focus on increasing product coverage. By delivering good customer experiences,we create conditions for continued growth.
119
OutLine Of 2011 • High activity level and demand for our products and services• Sound profitability• Good growth in other income• Focus on strengthening good customer relations and finding good solutions for our customers • Good loan portfolio quality and low losses
we create VaLues LOcaLLYThe Group has a strong and prominent position in trade and industry in the region and its ambition is to grow further in the coming years. SpareBank 1 SR-Bank serves corporate customers in all the Group’s market areas. The division has five regional corporate market departments, as well as two specialist departments devoted to the energy and maritime sector, and the public sector. Good and broad distribution nets are available to the division’s 8 000 customers. In addition to the regular advisers, these customers are served through internet-based services, an advanced telephone-based customer centre and a large office network. In addition to being an important service channel, the customer centre is also an increasingly important distribution channel for products relating to pensions, insurance, money transfers and financing.
eMPLOYeesThe Corporate Market Division employs 165 full time equivalents spread from Bergen in the north to Kristiansand in the south. Every year, significant funds are invested in skills enhancement and sharing experience and know-how internally, inter alia by way of internal and external courses. The goal is to strengthen the competence and skills of the division’s competent employees in order to benefit the customers. During 2011, the Corporate Market Division has implemented internal changes by moving the special competence relating to advice about non-life insurance and pension products even closer to the customers. In order to strengthen the advisory services, several new people were recruited, both internally and externally, in 2011.
custOMers and MarKetsThe lending volume in the Corporate Market Division rose by almost 12 per cent in 2011. This growth came from several markets. In the deposits market, the division has been successful in the public sector and won tenders for several
new municipalities in 2011. Deposits rose by slightly less than NOK 1.8 billion during the course of the year, or slightly more than 8 per cent. The PRO School programme was a great success yet again in 2011. The Group developed the concept and the target group is senior management, middle management and other key staff in small and medium-sized businesses. Focus of the PRO School is profitability, competence and network building for the customers. The division arranged gatherings in Bergen, Odda, Stavanger, Bryne and Flekkefjord and in total the PRO School had 270 participants in 2011. Feedback from our customers has been extremely positive.
The Group has focus on contributing to shed light on important social and economic issues and has accordingly again published the Retail Trading Report, the Economic Barometer for Agder and the Economic Barometer for Rogaland in 2010. There is a great deal of interest shown in these reports by the bank’s customers and by other interested parties.
The Retail Trading Report looks at status, challenges and trends in the retail trade. The report was prepared and presented at seminars in the major cities in the region. SpareBank 1 SR-Bank is responsible for the publication, in close association with local trade and industry associations. Three issues of the Economic Barometer were published in Rogaland and one issue was published in Agder in 2011. The Economic Barometer is published in association with the three county administrations, Greater Stavanger, Innovation Norway, the Norwegian Confederation of Trade Unions (LO), the Norwegian Labour and Welfare Organisation (NAV), and the Confederation of Norwegian Enterprise (NHO).
CORPORATE MARKET DIvISION
No. of customers: 8 000
*Growth in lending: 11.8%
Growth in deposits: 8.2%
*Gross lending: mNOK 45 852
Deposits: mNOK 23 525
* including loans sold to Sparebank 1 Næringskreditt AS
120
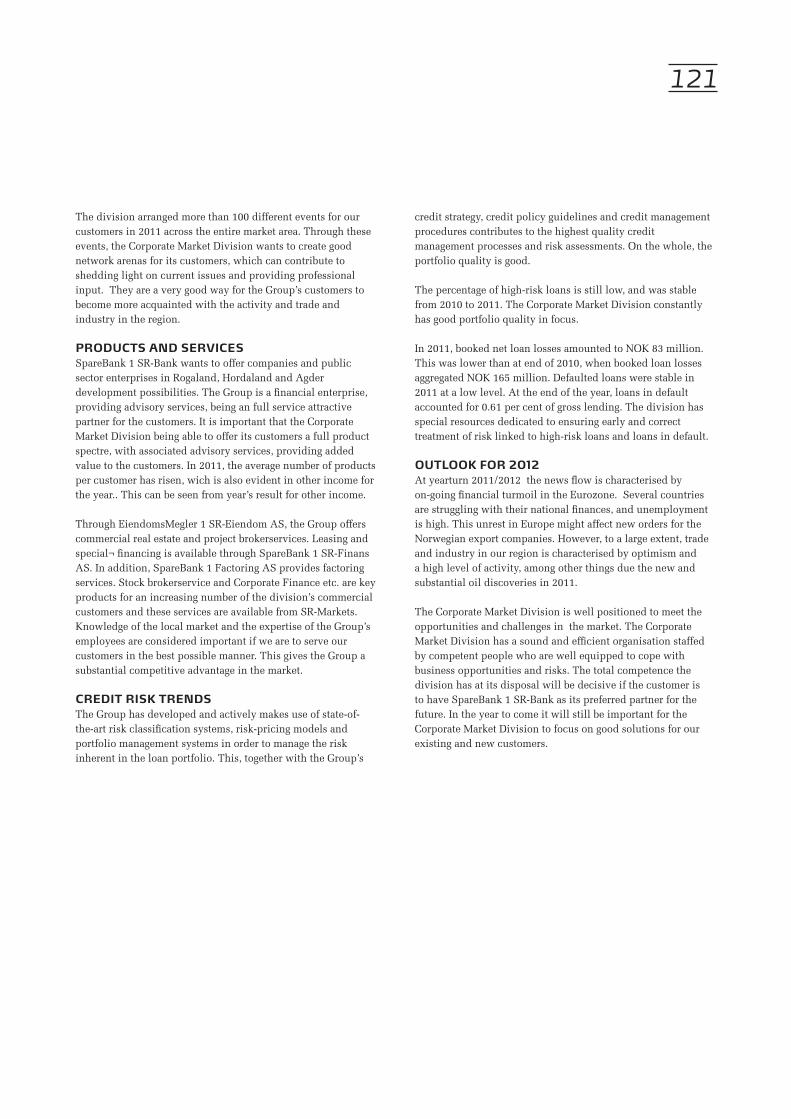
The division arranged more than 100 different events for our customers in 2011 across the entire market area. Through these events, the Corporate Market Division wants to create good network arenas for its customers, which can contribute to shedding light on current issues and providing professional input. They are a very good way for the Group’s customers to become more acquainted with the activity and trade and industry in the region.
PrOducts and serVicesSpareBank 1 SR-Bank wants to offer companies and public sector enterprises in Rogaland, Hordaland and Agder development possibilities. The Group is a financial enterprise, providing advisory services, being an full service attractive partner for the customers. It is important that the Corporate Market Division being able to offer its customers a full product spectre, with associated advisory services, providing added value to the customers. In 2011, the average number of products per customer has risen, wich is also evident in other income for the year.. This can be seen from year’s result for other income.
Through EiendomsMegler 1 SR-Eiendom AS, the Group offers commercial real estate and project brokerservices. Leasing and special¬ financing is available through SpareBank 1 SR-Finans AS. In addition, SpareBank 1 Factoring AS provides factoring services. Stock brokerservice and Corporate Finance etc. are key products for an increasing number of the division’s commercial customers and these services are available from SR-Markets. Knowledge of the local market and the expertise of the Group’s employees are considered important if we are to serve our customers in the best possible manner. This gives the Group a substantial competitive advantage in the market.
credit risK trendsThe Group has developed and actively makes use of state-of-the-art risk classification systems, risk-pricing models and portfolio management systems in order to manage the risk inherent in the loan portfolio. This, together with the Group’s
credit strategy, credit policy guidelines and credit management procedures contributes to the highest quality credit management processes and risk assessments. On the whole, the portfolio quality is good.
The percentage of high-risk loans is still low, and was stable from 2010 to 2011. The Corporate Market Division constantly has good portfolio quality in focus.
In 2011, booked net loan losses amounted to NOK 83 million. This was lower than at end of 2010, when booked loan losses aggregated NOK 165 million. Defaulted loans were stable in 2011 at a low level. At the end of the year, loans in default accounted for 0.61 per cent of gross lending. The division has special resources dedicated to ensuring early and correct treatment of risk linked to high-risk loans and loans in default.
OutLOOK fOr 2012At yearturn 2011/2012 the news flow is characterised by on-going financial turmoil in the Eurozone. Several countries are struggling with their national finances, and unemployment is high. This unrest in Europe might affect new orders for the Norwegian export companies. However, to a large extent, trade and industry in our region is characterised by optimism and a high level of activity, among other things due the new and substantial oil discoveries in 2011.
The Corporate Market Division is well positioned to meet the opportunities and challenges in the market. The Corporate Market Division has a sound and efficient organisation staffed by competent people who are well equipped to cope with business opportunities and risks. The total competence the division has at its disposal will be decisive if the customer is to have SpareBank 1 SR-Bank as its preferred partner for the future. In the year to come it will still be important for the Corporate Market Division to focus on good solutions for our existing and new customers.
121

OutLine Of 2012• First full operating year as a compete securities firm• The ambition of being the leading securities firm in the south and west of Norway is upheld• The division still enjoys good growth and a good level of activity• The Corporate Finance Department has completed several major projects and is well fitted for further growth
caPitaL MarKet diVisiOnThe Group’s securities firm is organised into a separate division and marketed under the trade name SR-Markets. The securities business includes trading of fixed income, currencies and equities for own account and for account of customers, corporate finance services as well as settlement functions and investment management services. Asset management is organised into a separate subsidiary, SR-Management AS.
SR-Markets is currently the largest securities firm outside Oslo, and aims to be market leader in the south and west of Norway. The division provides large companies in our region a complete range of capital market services and products, and shall be a fully-fledged alternative for local individuals and businesses that need access to the capital market and capital market services. By utilising these skills in combination with products and services from other business areas in the Group, we can effectively arrange and distribute capital to our customers. In addition, we have access to the entire SpareBank 1 Alliance in cases where national distribution is required. The division has a large and competent organisation and bases its advisory services on trust from customers and the
market. The advisors are available to customers irrespective of whether they are looking for project financing or want to invest in various securities. Short decision-making routes and efficient processes are characteristics of the organisation and its working methods.
In 2011, the division delivered its largest profit contribution to the Group, when revenues were NOK 213 million (NOK 180 million). The bulk part of the revenue still comes from customer trading in fixed income and currency instruments. The bond portfolio as a whole ended 2011 with a profit of NOK 5 million (NOK 23 million), and the newly established stock brokerage trading desk recorded a profit in its first full year of operation.
In general, the division enjoyed a high activity level in 2011. The Corporate Finance Department arranged and completed several major projects and the department’s revenues more than doubled compared with 2010. At the end of 2011, the department strengthened the workforce and is, consequently well positioned for further growth together with the rest of the SR-Markets.
SR-Markets provides a complete range of services that will help realise our customers’ projects in an efficient manner. By being the best in terms of combining specialist expertise, local knowledge and understanding, SR-Markets contributes to wealth creation. The division will make every effort to understand their client’s unique needs and find the best solution that can help create and realise added value for the Group’s customers.
Equity
Liabilities
Analysis
Advisory services
Investments
Corporate Finance
• New issues and IPOS• Acquisitions and restructuring• Structured sales processes• Valuations• Bank financing• High Yield• Property syndicates• Project financing
Stock broking
• Online trading• Advisory service and monitoring by brokers• Trading in bonds and derivatives• Securities financing• Reports and analyses• Access to investments
Foreign exchange/fixed income
• Interest rate hedging/ SWAP• Currency/FX• Derivatives• Trading• Reports and analyses• Monitoring by brokers• Access to investments
Operations
• Settlement• Securities services• Risk management• Reporting
Underwriting of and guarantees for new issues
CAPITAL MARKET DIvISION
122
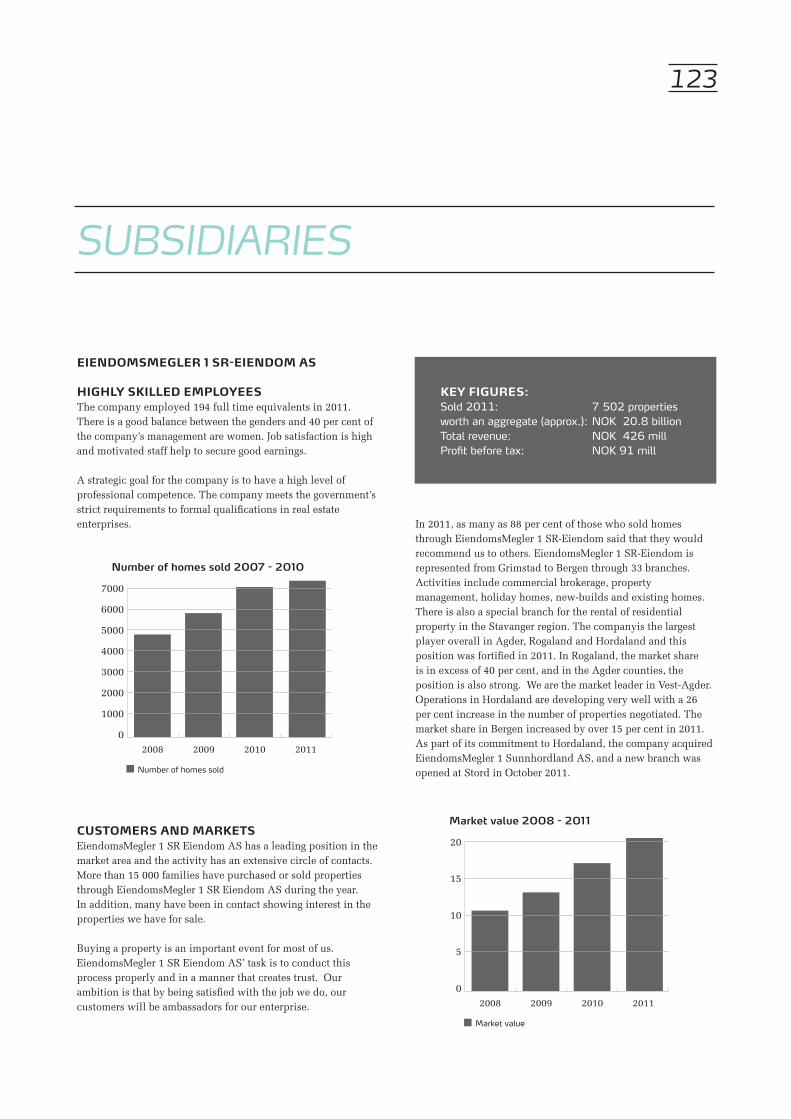
eiendOMsMegLer 1 sr-eiendOM as
HigHLY sKiLLed eMPLOYeesThe company employed 194 full time equivalents in 2011. There is a good balance between the genders and 40 per cent of the company’s management are women. Job satisfaction is high and motivated staff help to secure good earnings.
A strategic goal for the company is to have a high level ofprofessional competence. The company meets the government’s strict requirements to formal qualifications in real estateenterprises.
custOMers and MarKetsEiendomsMegler 1 SR Eiendom AS has a leading position in the market area and the activity has an extensive circle of contacts. More than 15 000 families have purchased or sold properties through EiendomsMegler 1 SR Eiendom AS during the year. In addition, many have been in contact showing interest in the properties we have for sale.
Buying a property is an important event for most of us. EiendomsMegler 1 SR Eiendom AS’ task is to conduct this process properly and in a manner that creates trust. Ourambition is that by being satisfied with the job we do, ourcustomers will be ambassadors for our enterprise.
In 2011, as many as 88 per cent of those who sold homes through EiendomsMegler 1 SR-Eiendom said that they would recommend us to others. EiendomsMegler 1 SR-Eiendom is represented from Grimstad to Bergen through 33 branches. Activities include commercial brokerage, propertymanagement, holiday homes, new-builds and existing homes. There is also a special branch for the rental of residentialproperty in the Stavanger region. The companyis the largest player overall in Agder, Rogaland and Hordaland and thisposition was fortified in 2011. In Rogaland, the market shareis in excess of 40 per cent, and in the Agder counties, theposition is also strong. We are the market leader in Vest-Agder. Operations in Hordaland are developing very well with a 26 per cent increase in the number of properties negotiated. The market share in Bergen increased by over 15 per cent in 2011. As part of its commitment to Hordaland, the company acquired EiendomsMegler 1 Sunnhordland AS, and a new branch was opened at Stord in October 2011.
SuBSIDIARIES
KeY figures:Sold 2011: 7 502 properties worth an aggregate (approx.): NOK 20.8 billion Total revenue: NOK 426 millProfit before tax: NOK 91 mill
Number of homes sold
Number of homes sold 2007 - 2010
0
1000
2000
3000
4000
5000
6000
7000
2011201020092008
Market value
Market value 2008 - 2011
0
5
10
15
20
2011201020092008
123

House rentals are also an area that the company is focusing on in the Stavanger area. The company’s position as the leading player in this market was strengthened in 2011. In the course of the year, approximately 600 rental properties were negotiated, mainly with companies as tenants.
The company has a sound position in the field of commercial real estate brokering and commercial real estate managementin Rogaland. The activities were further expanded byestablishing a separate department for commercial real estate brokering in Kristiansand. The activity within propertymanagement is on the rise and during the course of the year,the market for commercial rentals was good. Commercialproperty turnover is cyclically sensitive and the financialunrest has somewhat dampened activity in this market.
ProspectsThe housing market in our market area has been little affected by the turmoil in the global economy. High regionalemployment, the prospect of continuing low interest rates,and a shortage of homes for sale indicate a continued good market for used and new homes in 2012. After several years of strong price increases for housing, it is expected that the rate at which prices rise will flatten somewhat.
We expect the rental market for commercial property to remain buoyant, as forecasts for the activity in the oil and oil service companies are very positive.
sr-inVestering asSR-Investering AS’ object is to contribute to long-term valuecreation through investments in trade and industry in the Group’s market area. The company primarily invests in private equity funds and companies in the SMB segment that have a need for capital if they are to develop and grow further.
In 2011, the profit after tax was NOK 10.5 million against NOK 7.3 million in 2010. The result comes from realised investments and the appreciation of the company’s investment portfolio. At the end of 2011, SR-Investering AS had total investments of NOK 143.2 million and outstanding commitments relating to these of NOK 112.3 million, spread over 23 companies and private equity funds.
The outlook for companies in the region is good. It is believed that the high activity in the oil and gas sector will provide high investment activity in the immediate future, and that portfolio companies in our private equity funds will benefit positively from this. SR-Investment AS expects the portfolio to perform well in 2012.
sr-fOrVaLtning asSR-Forvaltning AS is a securities firm with a licence to provide asset management services. The company’s goal is to be a local alternative with a high level of competence in assetmanagement.
The company has a staff of 13 and manages SpareBank 1 SR-Bank’s pension fund portfolio, SpareBank 1 SR-Bank’s short term investments, as well as portfolios for about 3 000 external customers. SR-Forvaltning AS has now managed its customers’ funds for 12 years.
The external customer base comprises pension funds, public and private enterprises and affluent individuals. SR-Forvaltning AS’s activities are based on a conservative philosophy and a long-term approach. A range of portfolio models forms the basis for building up and adjusting the management of the assets to generate a good risk-adjusted result for the individual investor.
In 2011, the profit before tax was NOK 27.4 million, compared with NOK 20.9 million in 2010. Total assets amounted to approximately NOK 5.9 billion at year-end, of whichapproximately NOK 1 billion referred to the managementof SpareBank 1 SR-Bank’s pension fund.
Existing and new customers invested some NOK 460 million in fresh capital in 2011. Customers withdrew approximately NOK 430 million during the year. Thus, net customer assets increased by approximately NOK 30 million.
History shows that the customers have received a goodrisk-adjusted return, with better results than comparablebenchmarks, and at the same time lower underlying portfolio risk. During this period, SR-Forvaltning AS has enjoyeda high degree of customer loyalty.
The company’s performance, quality of service and good,effective operations are considered key factors for gooddevelopment also in 2012.
sParebanK 1 sr-finans asThe company offers lease financing to business and industry and car loans to retail customers. Profit before tax was NOK 99.9 million in 2011, compared with NOK 77.8 million in
Assets in NOK billion
SR-Forvaltning, development of assets under management 2007-2010
NOK billion
0,00,51,01,52,02,53,03,54,04,55,05,56,06,5
2011201020092008
124
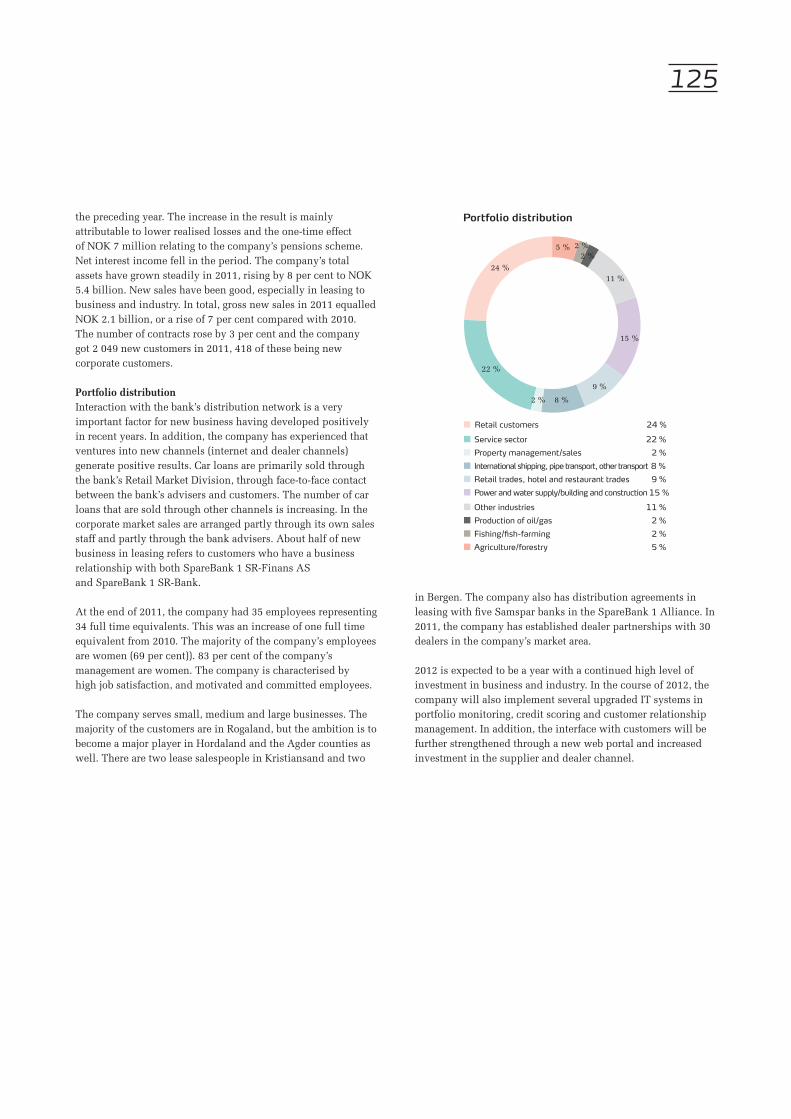
the preceding year. The increase in the result is mainlyattributable to lower realised losses and the one-time effectof NOK 7 million relating to the company’s pensions scheme. Net interest income fell in the period. The company’s total assets have grown steadily in 2011, rising by 8 per cent to NOK 5.4 billion. New sales have been good, especially in leasing to business and industry. In total, gross new sales in 2011 equalled NOK 2.1 billion, or a rise of 7 per cent compared with 2010. The number of contracts rose by 3 per cent and the companygot 2 049 new customers in 2011, 418 of these being newcorporate customers.
Portfolio distributionInteraction with the bank’s distribution network is a very important factor for new business having developed positively in recent years. In addition, the company has experienced that ventures into new channels (internet and dealer channels) generate positive results. Car loans are primarily sold through the bank’s Retail Market Division, through face-to-face contact between the bank’s advisers and customers. The number of car loans that are sold through other channels is increasing. In the corporate market sales are arranged partly through its own sales staff and partly through the bank advisers. About half of new business in leasing refers to customers who have a business relationship with both SpareBank 1 SR-Finans ASand SpareBank 1 SR-Bank.
At the end of 2011, the company had 35 employees representing 34 full time equivalents. This was an increase of one full time equivalent from 2010. The majority of the company’s employees are women (69 per cent)). 83 per cent of the company’smanagement are women. The company is characterised byhigh job satisfaction, and motivated and committed employees.
The company serves small, medium and large businesses. The majority of the customers are in Rogaland, but the ambition is to become a major player in Hordaland and the Agder counties as well. There are two lease salespeople in Kristiansand and two
in Bergen. The company also has distribution agreements in leasing with five Samspar banks in the SpareBank 1 Alliance. In 2011, the company has established dealer partnerships with 30 dealers in the company’s market area.
2012 is expected to be a year with a continued high level of investment in business and industry. In the course of 2012, the company will also implement several upgraded IT systems in portfolio monitoring, credit scoring and customer relationship management. In addition, the interface with customers will be further strengthened through a new web portal and increased investment in the supplier and dealer channel.
Retail customers 24 %
Service sector 22 %Property management/sales 2 %International shipping, pipe transport, other transport 8 %Retail trades, hotel and restaurant trades 9 %Power and water supply/building and construction 15 %
Other industries 11 %Production of oil/gas 2 %Fishing/fish-farming 2 %Agriculture/forestry 5 %
Portfolio distribution
5 % 2 %2 %
11 %
15 %
9 %
8 %2 %
24 %
22 %
125
FROM EQuITY CERTIFICATES TO SHARES
cOnVersiOn tO LiMited LiabiLitYsaVings banK frOM 1 JanuarY 2012At its meeting on 28 June 2010 the Supervisory Board of SpareBank 1 SR-Bank requested that the executive management consider the advantages and disadvantages of a conversion of SpareBank 1 SR-Bank into limited liability savings bank. Based on an overall assessment, the Board concluded that it would be best for SpareBank 1 SR-Bank to strengthen itself in the equity and external finance markets if it were to continue to lead the development of the region in which the group is active. The Board resolved, therefore, on 28 October 2010 to submit a proposal at the Supervisory Board meeting to convert SpareBank 1 SR-Bank into a limited liability savings bank. In its evaluations the Board has stressed maintaining the bank’s regional roots, the bank’s history and the savings bank tradition.
The Supervisory Board discussed the conversion of SpareBank 1 SR-Bank into a public limited company at in two subsequent meetings on 25.11.2010. The decisions were unanimous. The application for conversion permit was submitted to the Financial Supervisory Authority of Norway as the advisory authority in December 2010. The FSA, in its recommendation to the Ministry of Finance dated 17 March 2011, recommended that SpareBank 1 SR-Bank be given permission to convert the bank to the limited liability savings bank.
On 21 June 2011, pursuant to the Financing Activity and Financial Institutions Act (Financial Institutions Act) of 10 June 1988 No. 40, Section 2c-13, second paragraph, the Ministry of Finance issued a permit to carry out the conversion, and to create a savings bank foundation. Tax relief was granted on 1 July 2011, so theconversion does not trigger taxation of SpareBank 1 SR-Bank.
SpareBank 1 SR-Bank was converted from an equity certificate to the limited liability savings bank on 1 January 2012. The share capital is NOK 4 987 241 725 , divided into 199 489 669 shares with a nominal value of NOK 25 each. Former equity certificate holders received one share in exchange for each equity certificate they held in SpareBank 1 SR-Bank at the time of conversion. This amounted to a total of 127 313 361 shares, representing 63.8 per cent of the shares.
estabLisHMentOf sParebanKstifteLsen sr-banKAs a result of the conversion, Sparebankstiftelsen SR-Bank (Savings Bank Foundation) was established. On its establishment, Sparebankstiftelsen SR-Bank received a number
of shares corresponding to the relative stake in the former primary capital of SpareBank 1 SR-Bank. This amounted to a total of 72 176 308 shares, representing 36.2 per cent of the shares issued. Sparebankstiftelsen SR-Bank has the following object clause in its Articles of Association: The foundation’s object is to administer the shares it was allocated on its establishment and to exercise and maintain a significant, long-term and stable ownership of SpareBank 1 SR-Bank ASA.
The foundation may also place funds in an appropriate and satisfactory manner having in mind the interests of safety, risk diversification, liquidity and yield, and with a view toachieving market rate of return on equity. The foundation may allocate profits and distribute dividends funds for charitablepurposes. The foundation shall, in its distribution of fundspreferably take into account the districts that have built up the primary capital in the former SpareBank 1 SR-Bank.
The foundation owns 72 176 308 shares of SpareBank 1 SR-Bank. Ownership is to be exercised in accordance with generally accepted corporate governance principles, and within the limits and guidelines set by the General Meeting. The ownership must be at least 25 per cent of the issued shares of SpareBank 1 SR-Bank.
The foundation shall, in its business activities, continue the savings bank tradition by participating in capital increases in SpareBank 1 SR-Bank and by other means. Otherwise, thefoundation can perform other activities that are consistent withthe stated object and the framework set at any time by theregulations governing savings bank foundations.
frOM rOgg tO srbanKThe last day of trading for the bank’s former equity certificates was 30 December 2011. As of 2 January 2012, the ticker on Oslo Børs changed from ROGG to SRBANK. SRBANK is part of OSEAXAll-share index and sector index OSE40 Financials/OSE4010 Banks. The Liquidity segment is Match.
diVidend POLicYSpareBank 1 SR-Bank’s economic objective for its operation is to achieve results that yield a healthy and stable return on the bank’s total equity, thus creating value for shareholders in the form of a competitive return by way of dividends and a capital gain on the shares. When deciding on the annual dividend, consideration is given to financial needs, including the capital adequacy requirements, and the group’s targets and strategic plans. Unless capital adequacy requirements require otherwise, the
126

Board’s goal is that about half of the profit for the year after tax shall be distributed as dividend. The parent company’savailable profit for the 2011 accounting year was NOK 936million or NOK 4.70 per share (taking into account the numberof shares at 2 January 2012, subsequent to the conversion intoa public limited company and the establishment of the foundation Sparebankstiftelsen SR-Bank). In line with SpareBank 1 SR-Bank’s dividend policy, various aspects are taken into consideration when fixing the dividend, with special emphasis on financial strength and core capital adequacy. The Board of Directors of Sparebank 1 SR-Bank proposes a dividend of NOK 1.50 per share. This repre-sents a payout ratio of 32 per cent.
inVestOr POLicYIt is crucial to the bank that accurate, relevant and timelyinformation about the bank’s development and result inspires confidence in the investor market. Information is conveyed tothe market through quarterly investor presentations, websites, press releases and accounting reports. Regular presentations are also held for international partners, rating agencies, lenders and investors.
It is in SpareBank 1 SR-Bank’s own interest to publish current financial analyses of the highest possible quality. All analysts, irrespective of their recommendations and viewpoints regarding the bank’s shares (SRBANK) are treated equally at all times. At the end of 2011, there were eight brokerage houses with officialcoverage of SRBANK. Updated contact information etc. about these is available at all times on our IR pages.
infOrMatiOn addressesSpareBank 1 SR-Bank disseminates information to the market through the internet.
SpareBank 1 SR-Bank’s website: www.sr-bank.no. Other links for financial information: www.huginonline.no, www.ose.no (Oslo Børs)
Preliminary accounts for 2012 will be published in February 2013.
OwnersHiPSpareBank 1 SR-Bank aims to ensure good liquidity in it shares and achieve a good diversity of holders who represent customers, regional investors, as well as Norwegian and internationalinvestors.
At the end of 2011, there were 11 887 (12 031) owners of the former ROGG. The percentage owned by foreigners was 9.6 per cent (9.7 per cent), whilst the percentage held in Rogaland, Agder and Hordaland was 46.8 (47.5 per cent). The bank’s owned 133 248 of its own equity certificates. The group’s employees owned 3.5 per cent of the equity certificates at year-end.
The 20 largest owners owned a total of 40.3 per cent (41.0per cent) of the former equity certificates at 31 December 2011 (see note 36). On 17 February 2012, Sparebankstiftelsen SR-Bank flagged,in a press release to Oslo Børs, the sale of 6 million shares. Sparebankstifelsen SR-Bank also sold 4,5 million shares on 21 March 2012. The following shows the 20 largest shareholders:
% of totalshare-
20 largest shareholders as of 27.03.2012 Holdings holdersSparebankstiftelsen Sr-Bank 61 676 308 30,9%Gjensidige Forsikring aSa 20 713 065 10,4%SpareBank 1-stiftinga Kvinnherad 6 069 934 3,0%Folketrygdfondet 4 554 921 2,3%odin norge 4 262 184 2,1%Frank Mohn aS 4 202 587 2,1%odin norden 3 222 064 1,6%Clipper aS 1 685 357 0,8%JpMorgan Chase Bank, u.K. 1 598 223 0,8%Maaseide promotion aS 1 100 000 0,6%Fidelity low-priced Stock Fund, u.S.a. 1 061 327 0,5%olav Stangeland 1 039 034 0,5%Westco aS 1 030 091 0,5%SHB Stockholm Clients account, Sverige 1 009 500 0,5%Køhlergruppen aS 1 000 000 0,5%Varma Mutual pension Insurance, Finland 976 091 0,5%Forsand kommune 769 230 0,4%Solvang Shipping aS 701 034 0,4%leif Inge Slethei aS 672 772 0,3%Fondsfinans Spar 650 000 0,3%total 20 largest 117 993 722 59,1%
Financial calendar for 2012
ex dividend date: 30.3.20121st quarter 3.5.2012 2nd quarter 9.8.2012 3rd quarter 1.11 2012
127

YieLd On tHe banK’s fOrMer eQuitYcertificates (rOgg) in 201117.4 per cent (14.8 per cent) of the bank’s equity certificates were traded in 2011. The market price of the bank’s equity certificate fell from NOK 57.00 to NOK 40.70 in 2011. This represents a negative effective yield of 23.8 per cent in 2011 (taking into account the dividend paid NOK 2.75). Oslo Børs’ Benchmark index fell by approximately 12.5 per cent in the same period. The equitycertificate index fell by 21.6 per cent in 2011.
credit ratingMoody’s Investor Services’ credit rating of SpareBank 1 SR-Bank was A1 with a stable outlook by the end of 2011 (unchanged from 2010). Rating on short-term financing remained unchanged through 2011 at Prime 1.
In 2011, Fitch Ratings has downgraded its credit rating of SpareBank 1 SR-Bank from A to A- (long-term) and from F1 to F2 (short-term). The change was made after the outlook for 2009 was changed to negative outlook. After the change the outlook has been maintained as stable.
Key figures 2011 2010 2009 2008 2007Market price 31.12, noK 40,70 57,00 50,00 27,08 55,21Value for tax purposes 01.01 following year, noK 41,40 57,50 50,25 32,70 56,10Dividend per equity certificate, noK 1,50 2,75 1,75 0,83 3,96Direct return 1) 3,7 % 4,8 % 3,5 % 3,1 % 7,2 %effective return 2) -23,8 % 17,5 % 87,7 % -43,8 % 3,2 %Book value per equity certificate, noK 3) 48,75 47,45 42,07 37,23 37,64earnings per equity certificate, noK 4) 5,42 6,84 6,88 3,00 6,54payout ratio, net 5) 32 % 44 % 42 % 33 % 84 %equity certificate ratio 6) 63,8 % 63,2 % 62,9 % 56,1 % 54,9 %no. of certificates issued 31.12 127 313 361 127 313 361 120 933 730 74 903 345 70 969 909Holding of own certificates 31.12 133 248 133 248 353 116 294 264 294 264no. of outstanding certificates 31.12 127 180 113 127 180 113 120 580 614 74 609 081 70 675 645Certificates traded per year (% of issued certificates) 17 % 15 % 19 % 30 % 23 %
1) Dividend as percentage of market price at year-end2) Appreciation during the year plus dividend paid as percentage of market price at the beginning of the year3) Equity certificate holders’ equity divided by number of certificates issued. 4) Equity certificate holders’ share of the group profit after tax.5) Dividend as a percentage of the equity certificate holders’ share of the profit available for distribution. 6) Ownership capital, dividend equalisation reserve and premium reserve as a percentage of the parent bank’s equity at year-end (excluding dividend allocations and reserve for unrealised gains).
%
Effective yield OSEBX yield
Historic yield – ROGG
-60
-40
-20
0
20
40
60
80
100
20112010200920082007
17,5
3,2
-43,8
87,7
18,311,5
-54,1
-23,8-12,5
55,3
Certificates sold per year (% of certificates issued)
Historic turnover – ROGG%
0
5
10
15
20
25
30
35
20112010200920082007
2011 2010 2009 2008 2007regional share 47 % 47 % 47 % 62 % 65 %other norwegian owners 43 % 46 % 31 % 26 %Foreign owners 10 10 % 7 % 7 % 9 %total owners 11 887 12 031 12 219 11 482 11 232
128

we dO it witH a PurPOse in MindWe shall create values for the region of which we are part. This is SpareBank 1 SR-bank’s object, the very foundation for our business model. The allocation of capital, to both business development and housing, is our most important social duty. We have been done this for more than 170 years. We are also a significant contributor in that we annually plough back large amounts to our local communities. It is also in our own interest to contribute to a robust environment for business and trade and good conditions for growing up and living.
In 2011, we created quantifiable values worth approximately NOK 2.5 billion.
• NOK 877 million (35 per cent) was transferred back to society by way of direct and indirect taxes paid by the company and its employees• NOK 718 million (28 per cent) benefitted the employees in the form of net pay, pensions and other benefits• NOK 299 million (12 per cent) went to our shareholders in the form of cash dividends• NOK 637 million (25 per cent) was retained by the Group to support further growth in our market area.
gOOds and serVices are PurcHased LOcaLLYIn addition to the direct creation of values, the Group’s operations also have ripple effects because of our need for goods and services from the local business communities in Rogaland, Hordaland and the Agder counties.
In 2011, SpareBank 1 SR-Bank purchased goods and services worth more than NOK 805 million. In addition to being a large-scaleconsumer of IT services, the Group spends substantial amounts on communications (telephony, postage and freight). The large number of buildings we have in the Group’s catchment area need to be maintained, which means work for craftsmen of all types. We purchase the majority of goods and services from regional and local suppliers provided these are competitive.
we create VaLues tHat deVOLVe On Our regiOnSpareBank 1 SR-Bank is one of the region’s biggest taxpayers. NOK 414 million of last year’s profit devolves on society in the form of taxes. The employees paid a total of NOK 280 million in tax in 2010. This is an addition to the NOK 414 million paid by the Group, and in turn, help to maintain the well-developed supply of good public services in the region. As a whole, the Group and its employees contributed NOK 694 million in tax.
In addition to direct income taxes, the Group pays substantial amounts in indirect taxes, mainly employer’s social security contributions and value added tax. In total, indirect taxesaggregate some NOK 183 million.
creatiOn Of VaLues bY tHe eMPLOYeesApproximately 1 300 people worked in SpareBank 1 SR-Bank in 2011. Together, they received NOK 718 million in net pay, pensions and other personnel benefits. We are one of the largest employers in the district, and we do our utmost to be an attractive employer that can attract knowledgeable and competent people. Our employees also play an importnat major role beside of the value creation they contribute to for the Group. Their skills and expertise benefit society inasmuch as a large part of the staff is engaged in various external networks and are members of non-profit organisations and clubs.
VersatiLe cOntributiOns MaKea rObust sOcietYSpareBank 1 SR-Bank has a comprehensive social commitment.We support local initiative in the fields of culture, sport, researchand education. This is done by making active use of the endowment fund for public benefit and through a large range of different sponsor agreements. During 2011, some NOK 60 million was granted to various charitable projects in our region. In addition, we have contributed more thanNOK 16 million through various sponsor agreements especiallyaimed at children and teenagers within sports and culture.
In 2011, we allocated NOK 10 million for development of infrastructure in and around Lysefjorden with the purpose of increasing the fjord’s attractiveness through better and easier accessibility. In 2011, parts of this grant were earmarked for renovation of the 4 444 steps from the bottom to the top of Flørli, as well as a new facility for leisure boats. Work is already underway. We believe that our contribution to the development of the fjord will benefit the community as a whole as more people will have the opportunity to climb the many steps to the top of Flørli. In addition, increased visits to Lysefjorden provide newopportunities for tourism in the area. We did it intentionally.
CORPORATE SOCIAL COMMITMENT
12 %
25 %
28 %
35 %
Employees
Society
The group
Owners
Distribution of value added
129
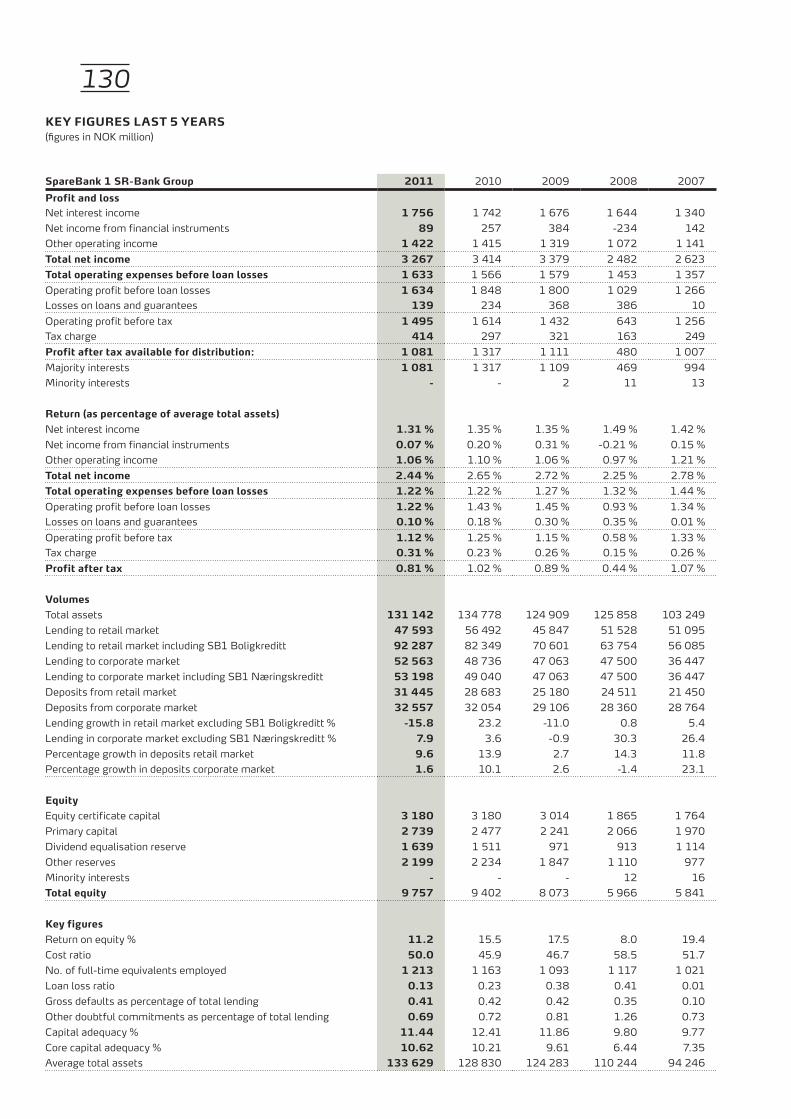
KeY figures Last 5 Years(figures in NOK million)
sparebank 1 sr-bank group 2011 2010 2009 2008 2007Profit and lossNet interest income 1 756 1 742 1 676 1 644 1 340Net income from financial instruments 89 257 384 -234 142Other operating income 1 422 1 415 1 319 1 072 1 141total net income 3 267 3 414 3 379 2 482 2 623total operating expenses before loan losses 1 633 1 566 1 579 1 453 1 357Operating profit before loan losses 1 634 1 848 1 800 1 029 1 266Losses on loans and guarantees 139 234 368 386 10Operating profit before tax 1 495 1 614 1 432 643 1 256Tax charge 414 297 321 163 249Profit after tax available for distribution: 1 081 1 317 1 111 480 1 007Majority interests 1 081 1 317 1 109 469 994Minority interests - - 2 11 13
return (as percentage of average total assets)Net interest income 1.31 % 1.35 % 1.35 % 1.49 % 1.42 %Net income from financial instruments 0.07 % 0.20 % 0.31 % -0.21 % 0.15 %Other operating income 1.06 % 1.10 % 1.06 % 0.97 % 1.21 %total net income 2.44 % 2.65 % 2.72 % 2.25 % 2.78 %total operating expenses before loan losses 1.22 % 1.22 % 1.27 % 1.32 % 1.44 %Operating profit before loan losses 1.22 % 1.43 % 1.45 % 0.93 % 1.34 %Losses on loans and guarantees 0.10 % 0.18 % 0.30 % 0.35 % 0.01 %Operating profit before tax 1.12 % 1.25 % 1.15 % 0.58 % 1.33 %Tax charge 0.31 % 0.23 % 0.26 % 0.15 % 0.26 %Profit after tax 0.81 % 1.02 % 0.89 % 0.44 % 1.07 %
Volumes Total assets 131 142 134 778 124 909 125 858 103 249Lending to retail market 47 593 56 492 45 847 51 528 51 095Lending to retail market including SB1 Boligkreditt 92 287 82 349 70 601 63 754 56 085Lending to corporate market 52 563 48 736 47 063 47 500 36 447Lending to corporate market including SB1 Næringskreditt 53 198 49 040 47 063 47 500 36 447Deposits from retail market 31 445 28 683 25 180 24 511 21 450Deposits from corporate market 32 557 32 054 29 106 28 360 28 764Lending growth in retail market excluding SB1 Boligkreditt % -15.8 23.2 -11.0 0.8 5.4Lending in corporate market excluding SB1 Næringskreditt % 7.9 3.6 -0.9 30.3 26.4Percentage growth in deposits retail market 9.6 13.9 2.7 14.3 11.8Percentage growth in deposits corporate market 1.6 10.1 2.6 -1.4 23.1
equity Equity certificate capital 3 180 3 180 3 014 1 865 1 764Primary capital 2 739 2 477 2 241 2 066 1 970Dividend equalisation reserve 1 639 1 511 971 913 1 114Other reserves 2 199 2 234 1 847 1 110 977Minority interests - - - 12 16total equity 9 757 9 402 8 073 5 966 5 841
Key figuresReturn on equity % 11.2 15.5 17.5 8.0 19.4Cost ratio 50.0 45.9 46.7 58.5 51.7No. of full-time equivalents employed 1 213 1 163 1 093 1 117 1 021Loan loss ratio 0.13 0.23 0.38 0.41 0.01Gross defaults as percentage of total lending 0.41 0.42 0.42 0.35 0.10Other doubtful commitments as percentage of total lending 0.69 0.72 0.81 1.26 0.73Capital adequacy % 11.44 12.41 11.86 9.80 9.77Core capital adequacy % 10.62 10.21 9.61 6.44 7.35Average total assets 133 629 128 830 124 283 110 244 94 246
130

%
Operating expenses
Operating expenses% of average total assets
0,0
0,3
0,6
0,9
1,2
1,5
20112010200920082007
%
20112010200920082007
Return on equity
Return on equity
0
5
10
15
20
Deposits Loans incl. Boligkreditt
Loans and depositsNOK million
30000
60000
90000
120000
150000
20112010200920082007
1093
1163 1213
10211117
Number of man-years
Number of man-years, the group
0
300
600
900
1200
1500
20112010200920082007
-500
0
500
1000
1500
2000
20112010200920082007
Profit before tax Losses on loans and guarantees
Profit and lossNOK million
%
Net interest income, NOK millionInterest margin
Net interest income and interest marginNOK million
0
500
1000
1500
2000
201120102009200820071,20
1,25
1,30
1,35
1,40
1,45
1,50
1,55
131

Disse guides viser minimums området som skal være rundt logoen.Logoen må plasseres på riktig mørkeblå farge.For mer info om bruk, formater og spesialvarianter, se designmanual.NB; husk å gjøre navnet om til “outline” før du lagrer den nye logoen.