Embed Size (px)
Citation preview

ANNUAL PERFORMANCE PLAN2015 - 2016


ANNUAL PERFORMANCE PLANfor
2015/2016


3 ANNUAL PERFORMANCE PLAN 2015-16
Table of contents
List of Acronyms 4
Foreword 6
Official sign-off 8
Part A: Strategic overview 9
1 Updated situational analysis 17
1 1 PERFORMANCE DELIVERY ENVIRONMENT 17
1 2 ORGANISATIONAL ENVIRONMENT 18
2 Revisions to legislative and other mandates 20
2 1 Regulations 20
2 2 Pending court cases 20
3 Overview of 2015/2016 budget and MTEF estimates 21
3 1 Expenditure Estimates 21
3 2 Relating expenditure trends to strategic outcome-oriented goals 22
Part B: Programme and sub-programme plans 26
4 Departmental Programmes: Strategic Objectives, Programme Performance Indicators and Annual Targets for 2015/2016 26
4 1 Programme 1: Administration 26
4 2 Programme 2: Curriculum Policy, Support and Monitoring 31
4 3 Programme 3: Teachers, Education Human Resources and Institutional Development 43
4 4 Programme 4: Planning, Information and Assessment 50
4 5 Programme 5: Educational Enrichment Services 60
Part C: Links to other plans 68
5 Links to long-term infrastructure and other capital plans 68
5 1 Accelerated Schools Infrastructure Delivery Initiative (ASIDI) 68
5 2 Conditional grants 68
5 3 Public Entities 70
5 4 Public-private partnerships 71
Part D: Annexures 72
6 Updates in the Department of Basic Education Strategic Plan 72
7 Technical Indicator Descriptions 72

4DEPARTMENT OF BASIC EDUCATION
List of AcronymsAIDS Acquired Immune Deficiency Syndrome
AMESA Association of Maths Educators of South Africa
ANA Annual National Assessments
ASIDI Accelerated Schools Infrastructure Delivery Initiative
BSNSW Board of Studies New South Wales
CAPS Curriculum and Assessment Policy Statements
CAT Common Assessment Tasks
CIE Cambridge International Examinations
CoE Compensation of Employees
CSI Corporate Social Investment
DBE Department of Basic Education
DCMS District Coordination Monitoring Support
DOC Department of Communication
DPME Department of Performance Monitoring and Evaluation
DSD Department of Social Development
DST Department of Science and Technology
ECD Early Childhood Development
EFA Education for All
EMIS Education Management Information Systems
ECDoE Eastern Cape Department of Education
ELRC Education Labour Relations Council
ETDP SETA Education, Training and Development Practices Sector Education and Training Authority
FET Further Education and Training
GEM/BEM Girls and Boys Education Movement
GDP Gross Domestic Product
GET General Education and Training
GFET General and Further Education and Training
GHS General Household Survey
HEDCOM Heads of Education Committee
HEI Higher Education Institution
HIV Human Immuno-Deficiency Virus
IIAL Incremental Introduction of African Languages
IQMS Integrated Quality Management System
ISHP Integrated School Health Programme
ISPFTED Integrated Strategic Planning Framework for Teacher Education and Development
IEEE Institute of Electrical and Electronics Engineers
JICA Japan International Cooperation Agency
LDoE Limpopo Department of Education
LoLT Language of Learning and Teaching
LTSM Learning and Teaching Support Materials
LURITS Learner Unit Record Information and Tracking System
MDG Millenium Development Goals

5 ANNUAL PERFORMANCE PLAN 2015-16
MPAT Management Performance Assessment Tool
MST Maths, Science and Technology
MTEF Medium-Term Expenditure Framework
MTSF Medium-Term Strategic Framework
NDP National Development Plan
NEAC National Examinations Assessment Committee
NECT National Education Collaboration Trust
NEDLAC National Economic Development and Labour Council
NEEDU National Education Evaluation and Development Unit
NEPA National Education Policy Act
NEIMS National Education Infrastructure Management System
NGO Non Governmental Organisation
NICPD National Institute for Curriculum and Professional Development
NSC National Senior Certificate
NSFAS National Student Financial Aid Scheme
NSNP National School Nutrition Programme
NSLA National Strategy for Learner Attainment
PED Provincial Education Department
PICC Presidential Infrastructure Coordinating Commission
PIRLS Progress in Reading and Literacy Sudy
PMDS Performance Management and Development Scheme
PPN Post Provisioning Norm
PSS Psycho-Social Strategy
QCTO Quality Council for Trades and Occupations
QLTC Quality Learning and Teaching Campaign
RPL Recognition of Prior Learning
SAASTE South African Association for Science and Technology Educators
SACE South African Council of Educators
SACMEQ Southern and Eastern Africa Consortium for Monitoring Educational Quality
SAIA South African Institute of Architects
SAICE South African Institute of Civil Engineering
SAMF South African Maths Foundation
SA-SAMS South African School Administration Management System
SASCE South African Schools Choral Eisteddfod
SBA School Based Assessment
SGB School Governing Body
SIBG School Infrastructure Backlog Grant
SIP Strategic Integrated Project
SMS Senior Management Services
SQA Scottish Qualification Authority
TIMSS Trends in International Mathematics and Science Study
VVOB Flemish Association for Development and Technical Assistance
WSE Whole School Evaluation

6DEPARTMENT OF BASIC EDUCATION
FOREWORD BY THE MINISTRY OF BASIC EDUCATION
The focus of the Department of Basic Education for the 2015/2016 financial year will be to consolidate achievements made so far while expediting strategies for improvement We remain resolute in our quest to improve quality and efficiency throughout the schooling sector, with a renewed emphasis on curriculum coverage and the need to strengthen quality, efficiency and accountability in our provinces, districts and schools
For the basic education sector to transform, radical changes and appropriate interventions to turn our education system around are of paramount importance We have moved boldly, therefore, to reconfigure the Basic Education Department internally to improve performance In line with heightening accountability and enhancing service delivery the Department will hold the districts and provinces that are not performing accountable
The National Development Plan 2030 (NDP) states that education is a means to building an inclusive society and providing opportunities for South Africans to realise their full potential It further states that education provides the tools for people to solve their problems We are therefore very encouraged that Government has continued to rate basic education as the apex priority for this term In an effort to fast-track quality education, the Department will use the ‘Big Fast Results’ methodology termed Operation Phakisa by the Cabinet, to develop comprehensive plans for optimum results This planning will result in focused implementation and monitoring, especially in the area of Information and Communications Technology (ICT), which we believe will yield positive results in challenged areas of our operations
We are determined to promote universal access to education by ensuring that all children between ages seven and 15 years are in school We must strive to ensure that the approximately 15% of South African children who do not complete Grade 9 do so and to improve retention rates for learners in the FET band (Grades 10–12)
Our own internal assessments and international benchmarking assessments confirm that while progress has been made on access, equity and redress, the emphasis for this administration will be on attaining quality We will endeavour to increase the number of Grade 12 learners who can gain entrance to university, moving incrementally from 172 000 in 2013 to 250 000 in 2019, and work to improve the quality and quantity of passes
We will continue to eradicate mud schools and other inappropriate structures, particularly in the Eastern Cape, and to provide the necessary resources needed for proper schooling to take place
The current MTSF outputs have been aligned to the NDP priorities for the sector, and it is these milestones that will be used to track the performance of the entire sector Our areas of focus for 2015, which we are convinced will have a lasting impact at classroom level and beyond, have been communicated throughout the sector
The DBE is responding to inequalities in the teaching and learning environment through various initiatives that are aligned to the National Development Plan 2030 and the Action Plan 2019: Towards the Realisation of Schooling 2030 Included in these initiatives are the replacement of inappropriate school structures, including mud schools; capacitating provincial education infrastructure units and school beautification programmes to improve the schooling environment; strengthening monitoring capacity; and operationalising the Infrastructure Delivery Management System to monitor the life-cycle provision of infrastructure
We aim to increase the capacity of the state to develop, print and deliver learning and teaching support materials (LTSM) in the basic education sector The sector has developed, printed and delivered Grades R to 9 Language and Mathematics workbooks to over 23 000 public schools, twice a year since 2011, and will continue to do so in the coming years A total of 204 million workbooks have been delivered to date
Education districts have a pivotal role in supporting schools, improving their functionality and developing the country’s education institutions in order that national learning outcomes are achieved Our district monitoring unit has been strengthened and will now constitute a branch which will focus carefully on the capacity, systems and processes required to strengthen district planning, management, support, reporting and accountability

7 ANNUAL PERFORMANCE PLAN 2015-16
Teacher placement, deployment and development remain high on our strategic interventions agenda We will continue to build our teacher development strategies to address gaps identified during assessments This will ensure that our teacher development initiatives address the content gaps and improve classroom practices
We salute the class of 2014 for achieving a 75 8% pass rate in the National Senior Certificate examinations This was the first class to have sat for the National Senior Certificate under the re-packaged curriculum called the Curriculum and Assessment Policy Statement (CAPS) We challenge the class of 2015 to work even harder in order to improve the pass percentage and the quality of results
The Department will forge ahead with its pro-poor policies such as no-fee schools and the National School Nutrition Programme, as a means to push back the scourges of poverty, inequality and unemployment which beset our country
In respect of Early Childhood Development, the National Development Plan underlines the need for access to at least two years of pre-school education for all children The ruling party committed to making two years of pre-school education compulsory in its election manifesto and, due to success in rolling out early childhood development programmes, the legislative review to make schooling for young people aged five to 15 years compulsory is planned
Improvement of learner well-being through the National School Nutrition Programme (NSNP) has seen over 9 1 million learners being provided with a daily meal, and this programme is also creating at least 50 000 work opportunities The Department has made strides to meet the basic right to nutrition of millions of learners in schools It has become necessary to consider a national deworming programme linked to the NSNP, to maximise the health and cognitive benefits of school meals The target of the deworming programme for 2015 will be Grade R–7 learners in quintile 1 schools in KwaZulu-Natal, Eastern Cape, Mpumalanga, Western Cape and Gauteng
We will continue to enhance learner safety and wellbeing by fighting drug and substance abuse as well as youth criminality in our schools and communities
A country that chooses to hide its heritage and history from its children takes the risk of having them repeat the mistakes of the past We are currently conducting comparative studies and research on countries offering History as a compulsory subject Research indicates that, when taught as a subject, History has a number of positive effects including contributing to nation building, national pride, patriotism, social cohesion and cultural heritage
We are further encouraged by the immediate positive response of partners, especially in business, following the meeting between President Jacob Zuma on 22 August 2014 and the Minister and Deputy Minister of Basic Education, Education MECs and HODs, the CEO and Trustees of the National Education Collaboration Trust (NECT), a number of Cabinet Ministers and 15 top South African business leaders, under the auspices of the NECT The NECT was conceived in the Education Collaboration Framework, which was developed by a range of stakeholders in response to the National Development Plan The intention of the meeting was to exchange views on the implementation of the Education Chapter of the National Development Plan
We are confident that the plans articulated in this Annual Performance Plan are a solid step towards improving our education system
____________________ ____________________
Mrs Angie Motshekga, MP Mr Enver Surty, MP
Minister Deputy Minister

8DEPARTMENT OF BASIC EDUCATION
Official sign-off
It is hereby certified that this Annual Performance Plan:
Was developed by the management of the Department of Basic Education under the guidance of the Minister of Basic Education;
Was prepared in line with the current Strategic Plan of the Department of Basic Education; and
Accurately reflects the performance targets which the Department of Basic Education will endeavour to achieve given the resources made available in the budget for 2015/2016
____________________
N Molalekoa
Chief Financial Officer
_____________________
VC Carelse
Deputy Director-General, Office of the Director-General
_____________________
SG Padayachee
Acting Director-General
Approved by:
______________________
Mrs Angie Motshekga, MP
Minister

9 ANNUAL PERFORMANCE PLAN 2015-16
Part A: Strategic overview
DBE Initiatives to respond to the National Development Plan (NDP)
As a response to the NDP, the Department has developed its five-year Strategic Plan and the 2015/16 Annual Performance Plan based on the 2014–2019 Medium-Term Strategic Framework (MTSF) and the Action Plan to 2019: Towards the Realisation Schooling 2030
The Strategic and Annual Performance Plans represent the first segment of activities towards realising the country’s adopted long-term plan, The National Development Plan 2030: Our future – make it work The Minister of Basic Education has identified ten ‘non-negotiable’ services (discussed below) for effective joint sectoral planning and monitoring that will enable the basic education sector to use the NDP as a platform to accelerate the transformation of the schooling sector
Improved quality teaching and learning through the development, supply and effective utilisation of teachers
A constant inflow of young and qualified teachers into the profession will ensure that all classes have a qualified teacher, as well as ensure continued interest in the profession In 2014/2015 the Department improved the systems and processes aimed at improving the efficiency and effectiveness of the placement, deployment and utilisation of educators by completing the profiling of teacher qualifications and amending the post provisioning norms and model
The NDP makes these recommendations for ECD: short-term teacher development based on workbooks, longer-term teacher development, system support and self-development, use of technology, and support of professional associations and teacher unions
The DBE has developed a plan for Grade R teachers with qualifications below level 6, with targets and details of training possibilities, qualifications and institutions offering them The programme needs to be accelerated and strengthened by focussing on RPL processes, provincial planning, inter-departmental and inter-sectoral coordination, and increasing PED and HEI capacity to deliver on these and other short programmes
For the short-term requirement to support teachers in the use of workbooks, the DBE has trained subject advisors on teacher guides for the workbooks in 2013 (except the Limpopo Department of Education) and distributed the teacher guides to district offices on the understanding that PEDs will provide training and support to teachers The programme should be vigorously applied to districts and schools that are performing below 70%
For longer-term teacher development, DBE and PEDs have agreed on a targeted approach involving strengthening needs identification, and short course and qualification-based programmes, as outlined in the Integrated Strategic Planning Framework for Teacher Education and Development in South Africa Evidence from the NSC and ANA diagnostic reports and related reports should be used as the basis for targeted teacher development programmes Five categories of personnel have been identified to participate in qualification and non-qualification-based programmes (school leaders, practising teachers, mentor and lead teachers, unqualified and under-qualified teachers and special needs teachers) Longer-term programmes need to strengthen planning, subsidisation, skills capacity and implementation of teacher development programmes in schools performing below 70% and/or in poor socio-economic contexts
System support and self-development
The DBE, PEDs and unions are currently involved in planning and organising teacher development activities, jointly and separately through the following structures: the National Teacher Education and Development Committee where all these bodies are represented; the nine Provincial Teacher Education and Development Committees; the HEDCOM sub-committees for Curriculum and Teacher Development, Skills Development, Inclusive Education, among others; and the committees of the Teacher Union Collaboration

10DEPARTMENT OF BASIC EDUCATION
The IQMS and WSE system provides opportunities for identification of teacher development needs but this needs strengthening The DBE has done extensive distribution of ANA/NSC results and provided planning support to PEDs to take forward the support and development work necessary at district and school levels The district support offices will continue to facilitate and support this process The Workplace Skills Plan and additional PED funding is intended to subsidise teacher development needs, as is the teacher union collaboration programme Strengthening all of these areas will be undertaken as a high priority within the DBE The emergent DBE-NICPD has developed diagnostic assessments for teachers in maths in all phases and identified an English language proficiency tests to assist with identifying teacher needs An English First Additional Language programme for FP, IP, SP and FET has also been developed in collaboration with the British Council Subject advisors, HEI specialists and union lead teachers have been trained to take the programme forward to all EFAL teachers The teacher development points system is being incrementally introduced with principals and deputy principals starting their three-year cycle of 150 points in 2014, HODs starting their cycle in 2015, and Level 1 teachers in 2016
The monitoring and evaluation of programmes delivered need to be strengthened and skilled human resource capacity needs to be developed to deal with the multiple challenges and contexts for training SACE will be supported and strengthened to implement the points system as well as to play a stronger role as a professional body
DBE has intensified efforts to strengthen teacher centres with ICT capacity enhancement being a key feature of these improvements The DBE and PEDs have created partnerships that have led to Vodacom sponsoring equipment and training for 40 teacher centres and 1 000 schools with a commitment to 20 more centres and more schools The DBE hopes to develop more such public private partnerships to leverage funding and expertise for education improvement
A programme to train teachers in the use of ICT devices to plan, deliver and access lessons has been developed The programmes initiated through the Laptop Initiative have been slow to take off Coordination and scalability of the ICT equipment and capacity are key challenges
The Integrated Strategic Planning Framework for Teacher Education and Development (ISPFTED) makes a commitment to involve teachers in self-development with professional associations playing a key role Currently, the Association of Maths Educators of South Africa (AMESA), the South African Maths Foundation (SAMF) and the South African Association for Science and Technology Educators (SAASTE) are the well-established subject associations The DBE has developed a programme in partnership with the Flemish Association for Development Cooperation and Technical Assistance (VVOB) and the British Council to stimulate and support the establishment of professional learning communities, in order to professionalise and support teaching
The DBE has initiated a teacher union collaboration which funds teacher unions to train teachers in priority areas supplementary to PED plans This programme has trained approximately 80 000 teachers in priority areas and has assisted unions to set up teacher development institutes
Improved quality teaching and learning through provision of adequate, quality infrastructure and learning and teaching support materials
According to Statistics South Africa’s General Household Survey, 2002–2011 report on the lack of books as a problem experienced at schools, in 2011 at least 6% of learners nationally indicated they had experienced a shortage of books, compared to approximately 21% in 2002 The 2011 School Monitoring Survey indicated an increase in the provision of literacy textbooks to 78% and Mathematics textbooks to 83%
The Basic Education Sector has been procuring commercially produced textbooks since 2011 at a cost of more than R7 7 billion However, this amount must be understood against the fact that these textbooks were bought as part of implementing CAPS over the past three years Despite the increase in provisioning of LTSM, the allocation and different modalities for LTSM procurement and delivery in respect of provinces, the objective of every learner having a textbook for every subject in each grade is still a challenge

11 ANNUAL PERFORMANCE PLAN 2015-16
Improving assessment for learning to ensure quality and efficiency in academic achievement
Annual National Assessment (ANA)
The Annual National Assessment (ANA) is a critical measure for monitoring progress in learner achievement as was outlined in the Education Sector Plan, Action Plan to 2014: Towards the Realisation of Schooling 2025 As a monitoring tool, ANA is in its fourth year of implementation and there is much that needs to be done to strengthen the reliability and validity of the data emanating from the ANA There have certainly been learner weaknesses at national, provincial, district and school level
The Department of Basic Education (DBE) administered the Annual National Assessment (ANA) in September 2014 ANA was written by learners in Grades 1–6 and Grade 9 in Language and Mathematics The total number of learners who registered for ANA 2014 was 7 376 334
National Senior Certificate (NSC) results
Over the past 20 years, there have been notable achievements in national examinations At its inception, the examination system was provincially based, and as such question papers were developed by the respective provinces, which resulted in a fragmented education system as well as varying examination standards This created biases in the admission of learners into higher education institutions and the work environment To address this, the former national Department of Education was mandated to standardise examinations in line with the national curriculum, by setting national question papers that would be written by all learners in the country This effort has not only resulted in high quality and improved credibility of the Grade 12 examinations but has also become a unifying national force The national examinations are cognitively sound and robust in assessing higher order thinking skills, and aligned to further education and workplace demands The Quality Assurance Council, Umalusi, plays a critical role in protecting the integrity of the National Senior Certificate examinations through its rigorous verification of all examination processes
The National Senior Certificate Report is one of the crucial sources of data to indicate whether quality education is in fact being realised The NSC is in its seventh year of implementation as an exit certificate measuring learner performance at the Grade 12 level, which marks the end of formal schooling In addition, the NSC is a critical barometer of success given that it captures the achievements of the system over twelve years
The 2014 National Senior Certificate examination was written by 532 860 full-time candidates and 94 884 part-time candidates of the fulltime candidates who wrote the examinations, 403 874 candidates attained National Senior Certificate, which constitutes a 75 8% pass rate which is the second highest since the advent of democracy The nine Provincial Departments performed as follows: Eastern Cape 65 4%; Free State 82 8%; Gauteng 84 7%; KwaZulu-Natal 69 7%; Limpopo 72 9%; Mpumalanga 79 0%; North West 84 6%; Northern Cape 76 4%; Western Cape 82 2%
Expanded access to Early Childhood Development and quality improvement of Grade R, with support for pre-Grade R provision
Government Gazette No 36752: Draft Policy Framework for Universal Access to Grade R was published for public comment on 15 August 2013 Twenty-two responses were received which were addressed in the development of the Framework for Implementation of Grade R
The key outcome of the process is aligned to the recommendations made in the National Development Plan as well as the Medium-Term Strategic Framework, namely, amending legislation to make Grade R and Pre-Grade R compulsory by 2019
The Basic Education Laws Review Task Team was commissioned by the Minister of Basic Education to finalise the amendments to the South African Schools Act A presentation was made to the task team with recommendations for the finalisation of the compulsory provisioning of Grade R in respect of the age of admission and making Grade R part of compulsory schooling
During that process it was agreed that the Framework for Implementation of Grade R be finalised to inform the realisation of universal access towards compulsory schooling by 2019

12DEPARTMENT OF BASIC EDUCATION
The Department will focus on quality provisioning in terms of qualified practitioners and quality learning and teaching materials over the 2014–2019 Medium-Term Strategic Framework
Strengthen accountability and improve management at the school, community and district level
The Department will continue strengthening accountability at school level by enhancing the monitoring of performance management systems The Integrated Quality Management System for school-based educators (IQMS) and the Performance Management and Development Scheme (PMDS) for office-based educators should therefore be strengthened and used as a tool to identify the specific developmental needs of educators
There is an ever-increasing need to address the under-utilisation of the skills development budget in the provinces Monitoring the utilisation of the skills development budget will be prioritised so that educators are the primary beneficiaries of training and support
The implementation of the Whole School Evaluation (WSE) processes should be closely monitored so that evaluated schools that have been identified as ‘high risk’ schools and in need of urgent intervention are provided with the required support The intervention should be targeted at the ‘risks’ in order to improve basic functionality and management in schools as well as effective teaching and learning in the classroom
Following the promulgation of the South African Standards for Principalship, the Department will complete standards for every level of school management, i e standards for both Heads of Departments and Deputy Principals The standards will inform the development of appointment criteria for the two levels of school managers and the development of competency assessment tests to ensure that only competent teachers are appointed at management level
DBE will strengthen the physical and regulatory environment within which districts operate for improved education service delivery to schools under their care The accountability of officials will be under scrutiny for improved delivery of identified key sector priorities
NON-NEGOTIABLES FOR JOINT SECTORAL PLANNING
The Minister’s assessment of the past five years revealed the need to focus attention on some areas of services being offered for the new Medium-Term Strategic Framework period The Minister, therefore, pronounced that the services discussed below will be treated as non-negotiables for the new five-year term All these non-negotiables are directly linked to MTSF priorities for the sector and form part of the key deliverables that will find expression in the DBE plans and in provincial plans (funding must be sought from within the existing programmes, from National Treasury and through other means for implementation) in order to fast-track some of the imperatives of government in the basic education sector The non-negotiables are discussed below
Learning and Teaching Support Materials (LTSM)
MTSF Output 2: Improved quality of teaching and learning through provision of adequate, quality infrastructure and learning materials.
The Department has made great strides in the last term to augment the provision of textbooks to learners through the development and distribution of workbooks throughout South African schools This has assisted a great deal with the implementation of the CAPS curriculum Emphasis in the new term is on the following:
• Provision of core textbooks per learner, per subject and per grade
• The need to centralise procurement of learning and teaching support materials in order to gain from economies of scale for provinces
• The development and strengthening of norms and standards for retrieval of textbooks at school level
13 ANNUAL PERFORMANCE PLAN 2015-16
• Evaluation of the utility of workbooks across the sector
• Limiting titles and capping prices to improve value for money and efficiency
Infrastructure
MTSF Output 2: Improved quality of teaching and learning through provision of adequate, quality infrastructure and learning materials.
South African public schools’ infrastructure backlog remains a big challenge for the sector In order to support the improvement of learning, emphasis will be placed on the following:
• Reducing inappropriate school structures by constructing new ones and maintaining existing structures
• Prioritising the provision of basic services to schools (water, sanitation and electricity)
• Implementation and adherence to the Infrastructure Norms and Standards in all new projects (this may make some projects more costly than before)
• Progressive maintenance and provision of school furniture for each learner
• Finding alternative funding methods for other school infrastructure projects
• Developing and supporting the roll-out of a school maintenance strategy for schools to maintain upgraded structures
Districts
MTSF Output 5: Strengthening accountability and improving management at the school, community and district level.
District management improvement is one of the critical focal points, especially in terms of support offered to schools, and strengthened monitoring of the curriculum at school level to turn learner performance around This calls for better provincial-district coordination in the following respects:
• Making sure that norms and standards for interaction between the provincial offices and districts and between districts ad schools are applied These norms guide all operations of the 82 districts
• Improving districts’ operations in terms of staff capacity, planning, monitoring and evaluation, curriculum oversight, and HRM operations, in order to bring about the desired change in schools and building this as a core support function within the system
• Implementation of the Integrated Quality Management Systems and Whole School Evaluation policies
• Improving schools’ capacity in terms of curriculum monitoring, oversight roles of principals and school management teams, ensuring that all principals are competent and enthusiastic in their management functions
• Heightened participation of the community through School Governing Bodies (SGBs) and parents
• Strengthening appointment of principals and possible signing of performance contracts by school management teams
• Management and leadership training to enhance skills that will enable all managers to be competent in performing their core duties

14DEPARTMENT OF BASIC EDUCATION
Teachers’ Placement, Deployment and Development
MTSF Output 1: Improved quality of teaching and learning through development, supply and effective utilisation of teachers.
The introduction of African languages is a reality that has begun with a pilot process that is already underway in a sample of schools Full implementation of this initiative in 2016 will require sufficient language teachers
Strengthening and expanding pre-Grade R and Grade R necessitates better training of ECD practitioners to improve the quality of ECD services
Better and complete placement of Funza Lushaka graduates needs to be strengthened in all provinces
Implementation of a teacher development framework includes ensuring that content-related training is offered to teachers on an ongoing basis This should be partly based on ANA diagnostic reports where possible
Teacher recruitment, deployment and utilisation through the post provisioning policy should address issues of large classes and issues of filling vacant posts where there is a need
Attracting young educators into the system has become a necessity given the aging teacher profile Programmes such as Funza Lushaka need to be strengthened at provincial level by ensuring that all Funza Lushaka bursary holders graduate with the necessary subjects so that they may be absorbed into the system
Grade R expansion in schools necessitates a fast-tracked development of Grade R educators/practitioners to meet the requirements of Foundation Phase teaching The allocation to Grade R grant will be reviewed on an ongoing basis Currently, provinces are training at different levels in terms of the National Qualifications Framework Increased remuneration of ECD teachers will soon put a strain on provincial personnel budgets in this regard This points to the need for a well conceptualised systemic approach to the quality improvement of Grade R with all associated aspects taken into consideration, including teacher development and professionalisation, resource requirements for Compensation of Employees (CoE) and LTSM, as well as incentive structures and pay progression, and a broad range of teaching resources to enrich this critical learning phase
Information and Communication Technology
MTSF Output 1: Improved quality of teaching and learning through development, supply and effective utilisation of teachers.
MTSF Output 2: Improved quality of teaching and learning through provision of adequate, quality infrastructure and learning materials.
The greatest concern is that the roll-out of ICT in schools has not been implemented as expeditiously as required in the last 10 years Schools are faced with children who have been born in an era of advanced technology, and it makes sense for the sector to provide education that conforms to these developments Access to ICT resources is no longer a nice-to-have but an urgent requirement for advancing teaching and learning
• Providing teachers with ICT infrastructure, e g laptops, a project that was unsuccessful in the past term due to the modalities of funding these laptops, therefore, needs to be resuscitated with some sense of urgency
• Making sure that teacher resource centres in all provinces have ICT programmes for the professional development of teachers, exposing them to the use of technology in the classroom

15 ANNUAL PERFORMANCE PLAN 2015-16
Kha Ri Gude
MTSF Output 1: Improved quality of teaching and learning through development, supply and effective utilisation of teachers.
A mass literacy campaign offering basic literacy and numeracy education to South African illiterate adults, Kha Ri Gude is one of the flagship programmes of the sector, increasing access to literacy over the last five years Because of the nature of its coverage and target clients, it has been inundated with implementation challenges and especially needs monitoring and evaluation to ensure it is achieving its intended purpose The programme can also be utilised to provide youth employment at a local level, contributing positively to economic empowerment of the youth
Library Services
MTSF Output 2: Improved quality of teaching and learning through provision of adequate, quality infrastructure and learning materials.
The majority of South African schools still do not have proper infrastructure for the provision of library services to support curriculum implementation This service will be improved in the new term with a focus on reading and increasing library resourcing in schools Citizens will be mobilised to participate in promoting reading through donations of reading materials for younger children to mark Madiba Day The sector should partner with other providers (e g Department of Arts and Culture) and partnerships for the provision of libraries and library books must be explored
Rural Focus
MTSF Output 1: Improved quality of teaching and learning through development, supply and effective utilisation of teachers.
MTSF Output 2: Improved quality of teaching and learning through provision of adequate, quality infrastructure and learning materials.
Rural and urban non-viable schools are still prevalent in the education sector, and a number of programmes must be closely monitored to make sure that affected learners are not disadvantaged in the provision of education Multi-grade teaching will need to continue in the short-term and should be supported through specific and appropriate training of teachers to improve their technical skills in this regard Small and farm schools need to be merged where possible and provided with hostels In the absence of hostels, learner transport must be provided, working in collaboration with the Departments of Transport in provinces
Curriculum
MTSF Output 1: Improved quality of teaching and learning through development, supply and effective utilisation of teachers.
MTSF Output 3: Regular annual national assessments to track improvements in the quality of teaching and learning.
MTSF Output 4: Improved Grade R and planning for extension of ECD.
The implementation of CAPS is continuing after its successful implementation in the last five-year planning period Below are some of the critical focus areas:
• Early Childhood Development: The focus is on improving the current quality of Grade R by strengthening the provision of Grade R workbooks and their implementation in all schools, and achieving 100% Grade R incorporation in public schools There is also a need to begin to prepare for the implementation of the two-year pre-grade 1 programme

16DEPARTMENT OF BASIC EDUCATION
• Mathematics, Science and Technology: Participation in these gateway subjects has been declining in some schools in the recent years A significant priority in this area is to provide the support and teacher development necessary to ensure that more schools offer mathematics as a subject, and that learners are encouraged to complete the subject rather than maths literacy, to stand them in the best possible stead for their future careers The target is to reach full provision of mathematics in all schools However, significant teacher development is required to reach this target Progression has to be improved from grade to grade, and performance strengthened from lower levels, beginning with strengthening the provision of basic numeracy and literacy, to ensure a better success rate in the National Senior Certificate Technical subjects are to be supported through recapitalised technical secondary schools There is an urgent need to identify schools which do not offer Mathematics, Science and Technology and to support their development in provision of these subjects by carefully redirecting grants
Incremental Introduction of African languages: This should be seen as a social cohesion issue and a curriculum intervention initiative All schools in this term will incrementally introduce an African language starting with a pilot that started in the 2014 academic year
Improving Annual National Assessments for learning to ensure quality and efficiency in academic achievement: The focus for the next five years is on using the ANA to drive classroom performance and learner attainment at all levels, not just Grades 3, 6 and 9 This standardised test should assist classroom accountability at school level, but it must also drive and inform districts’ monitoring and evaluation processes At another level, ANA testing needs to be improved in terms of the quality and relevance of questions – to make sure the system is rigorous and scientific in order to effectively track system performance
Partnerships and social mobilisation
MTSF Output 6: Partnerships for a strong education system.
Partnerships in education delivery are critical to close the gaps that cannot be met due to either financial or capacity constraints, and this can be achieved through:
• Strengthening partnerships with other stakeholders to improve the delivery of education through collaboration The establishment of the NECT involves all stakeholders to create a strategic Dialogue in Education and expand collaboration and partnerships to improve the quality of basic education
• Utilisation of inter-departmental collaboration to deliver support programmes on social cohesion, learner well-being and safety, transport and basic literacy could all yield excellent outcomes
• Deworming programmes are being introduced to consolidate the nutrition programme Health promotion activities will continue to improve learner wellbeing and the introduction of TB testing is anticipated, with a possibility of introducing a grant for the programme
• Promotion of active citizenry could help to pave the way toward a collective effort at education delivery where all children can enjoy a rich and lively education

17 ANNUAL PERFORMANCE PLAN 2015-16
1. Updated situational analysis
1.1 PERFORMANCE DELIVERY ENVIRONMENT
Key Issues in the Delivery Environment
• Access to education
The South African Schools Act, Act 84 of 1996, requires parents to ensure that their children attend school from the first school day of the year in which they turn 7, until the last school day of the year in which they turn 15, or the end of Grade 9, whichever comes first In 2012, Stats SA’s General Household Survey (GHS) findings showed that 98 8% of 7 to 15-year-old children were attending educational institutions There were 236 811 fewer children (as a whole) who were out of school in our country in 2012 than in 2002 In 2012, approximately 548 776 children aged 7 to 18 years were not attending any education institution The majority (4 in 5) were in the 16 to 18 age group; and 1 in 5 was disabled While there has been improvement in access, there is a small gap (1 2%) that still needs to be bridged to ensure that all children access compulsory basic education The current challenge is to ensure that the approximately 15% of South African children who do not complete Grade 9 do so and to improve retention rates for learners in the FET band (Grades 10–12)
• Contribution to the South African Economy
The South African economy relies heavily on the availability of skilled human capital The education sector must ensure that the necessary skills should be attained in the key subjects that drive the development of a healthy economy The sector needs to improve all learning outcomes, especially given the size of its budget in relation to the size of the economy – in 2010/2011 expenditure by the Education Departments amounted to R165 billion, which equaled 6 0% of GDP and 19 5% of consolidated government spending In nominal terms, spending on education more than tripled from 2000/2001 to 2010/2011 However, the quality of education for black children is still largely poor, meaning their prospects of securing employment, high earning potential and career mobility is reduced for these learners, limiting the growth of the South African economy As outlined in the Finance Minister‘s Budget policy statement in 2013, delivery is subject to fiscal and other constraints The global economic crisis that began five years ago was more severe and persistent than anyone could have foreseen While the economy has continued to grow at a moderate pace, reflecting global and domestic factors, it will still be necessary to enable growth and structural reforms over the medium term As there is the strong possibility that many of the factors within the system which constrain its development are linked to systemic and structural issues not necessarily related to budget provision, it is on these areas that the medium-term strategy should focus, such that the system is geared for quality delivery in education to optimise the growth of the economy as a whole when financial pressures reduce in the coming years
• Partnerships in education delivery
In order to implement the transformational reforms, a clear strategy and commitment to redress the injustices within the education system are required The National Development plan provides a platform for building new national partnerships that involve the government, the private sector, labour and civil society
As part of implementing the National Development Plan, the Department has established a National Education Collaboration Trust (NECT), which is a partnership of business, government and civil society working on a whole district developmental approach to the schooling system This has the potential to leverage significant expertise and the monitoring and evaluation systems required to alter the growth trajectory of education delivery in the country by harnessing resources not previously available within the sector

18DEPARTMENT OF BASIC EDUCATION
• Building an efficient state
Initiatives are underway to strengthen infrastructure planning and implementation, to attack inefficiency, waste and fraud, and to strengthen public procurement Cost containment measures were announced and implemented in December 2013 by the Minister of Finance to limit elements of the recurrent spending in the public sector Government has maintained a strong commitment to supporting the economy, enhancing the social wage, and protecting the poorest and most vulnerable in general and in the schooling system in particular
Accountability for implementation and the quality of learning outcomes is paramount in the basic education system and with the major interventions introduced in the last five years (CAPS, ANA, workbooks and infrastructure), the focus will be on how these are translated into improvements in classrooms and in schools across our country – particularly those which serve the poorest learners Everything that happens in the basic education system will be related to shifting the system in support of the sector plan: Action Plan to 2019: Towards Realisation of Schooling 2030
• Benchmarking Learner Performance: Participation in International Assessments
Since 1994, the DBE has been committed to participating in international testing programmes such as Trends in International Mathematics and Science Study (TIMSS), Progress in Reading and Literacy Study (PIRLS) and Southern and Eastern Africa Consortium for Monitoring Educational Quality (SACMEQ) South Africa participates in international assessments in order to benchmark learner performance South Africa’s country report on the results of PIRLS, and TIMSS was released in December 2012 The PIRLS reported on the performance of Grade 4 and 5 learners in literacy while the TIMSS study reported performance in Mathematics and Science in Grade 9 The TIMSS showed that South Africa improved by 50% more than the average expected improvement over a four-year period The PIRLS study showed that the baseline performance at Grade 4 level was fairly low and lower than the performance of other countries in the same category, particularly in the indigenous languages
• School infrastructure developments
School infrastructure should provide a safe environment for effective teaching and learning While funding has been made available to deal with school infrastructure backlogs, provincial education departments have not been able to drive school infrastructure projects with the anticipated momentum Capacity, market conditions and provider constraints have been cited as the main challenges in the provision of infrastructure
The Presidential Infrastructure Coordinating Commission (PICC) announced by the President in his 2012 State of the Nation Address, as well as the appointment of implementing agencies in different provinces, will improve delivery and provision of school infrastructure The Department will continue to eradicate mud and unsafe school structures through the ASIDI project Recruitment of qualified personnel with built environment expertise in the provinces is expected to add impetus to the planning and delivery of infrastructure
1.2 ORGANISATIONAL ENVIRONMENT
Structure of the Institution
• Size of structure
The DBE has a fluid structure which evolves and changes as the needs dictate In the last two years, due to pressure emanating from poorly-managed provinces and the lack of accountability systems in certain pockets of our system, certain critical adjustments were made to ensure that there is accountability and monitoring of provinces, schools and districts The scenario of managing concurrent functions with provincial education departments does not make the oversight role of the national Department any easier, hence the need arose to set up a Branch District Coordination Monitoring and Support (DCMS) system that would be responsible for this oversight role so that provincial and district performance matters are kept on the radar

19 ANNUAL PERFORMANCE PLAN 2015-16
The DBE has completed the reconfiguration process after the split of the Department of Education into the Department of Basic Education and the Department of Higher Education and Training Reconfiguration has helped the Department to meet its strategic intent, especially as far as Action Plan to 2019 is concerned The organisational structure of the DBE is being reviewed constantly to meet the challenges the DBE is facing, particularly in connection with the infrastructure demands of the sector The Department has moved expeditiously towards filling all vacant posts as a result of the restructuring process By the end of June 2014 the vacancy rate was below 2% A bulk advertisement will go out to fill all vacancies, thereby bolstering capacity in the DBE
Capacity has also been developed through the Workplace Skills Plan and the Personal Development Plans of officials in the DBE Training interventions for employees were informed by the Department’s performance management outcomes, as well as the demands of Action Plan to 2019 In response to natural attrition at middle and senior management levels, the Department has put in place a development plan to address the issues related to career-pathing and succession planning To this end the DBE sends over 250 officials a year to attend courses for professional and personal development The DBE has established a dedicated unit which is responsible for coordinating all health and wellness matters in the Department The unit has secured the services of an on-site doctor to assist officials
The age profile of employees reveals that the majority of the employees in the DBE fall in the age category 30 to 54 years There are 49 employees in the category 60 to 64 years This constitutes 6 2% of staff who will be retiring shortly This figure does not pose any risk to the DBE in terms of losing critical skills
The Department is in a process of internal reconfiguration stemming from the mandate of the Minister after the elections This process required Deputy Directors-General and Acting Deputy Directors-General to provide input in terms of staffing requirements and the re-organisation of Branches to meet the strategic intent of the Department The Department is still in the process of finalising the organisational structure and will go through due processes in terms of tabling the structure at a workplace forum once the proposal has been finalised
The DBE’s oversight role and responsibility to provinces
The past period saw the DBE having to implement Section 100 (1) (b) of the South African Constitution in two provinces due to concurrent functions not being clearly managed 2013 provided an opportunity to focus on the service delivery oversight role of the Department in respect of key functions such as LTSM provisioning processes, gradient helpdesk function and district reporting processes The Department improved accountability in the system through engagement structures with the provinces and districts The Department has finalised areas for reporting in order to guide the sector towards the reporting requirements expected by government oversight bodies and departments Working closely with provinces enabled the DBE to assess management at the classroom, school, district and provincial levels This engagement will continue in the 2015-

20DEPARTMENT OF BASIC EDUCATION
2019 period to heighten accountability at all levels of the system A more deliberate effort will be made to strengthen DBE’s capacity to monitor and support provincial departments
Alleviation of Provincial Budget Pressures
The main challenge with most provincial budgets is the considerable size of the compensation of employees’ component This exerts pressure on non-personnel expenditure Support will be given to provinces for budget monitoring and proper administration of Post Provisioning Norms (PPN) to ensure that budget and system controls are in place to give early warning signs of over-expenditure and under-expenditure A diagnostic assessment will be carried out in a sample of districts to formalise solutions to some longstanding challenges of teacher provisioning Support will be offered through the conditional grant system outside of the provinces’ allocations to ensure that sector priorities are implemented
2. Revisions to legislative and other mandates
2.1 Regulations
There are no significant changes to the legislative and other mandates
2.2 Pending court cases
There are currently no pending court cases that will have significant implications

21 ANNUAL PERFORMANCE PLAN 2015-16
3.
Ov
erv
iew
of
20
15/2
016
bu
dg
et
an
d M
TE
F e
stim
ate
s
3.1
E
xp
en
dit
ure
Est
imate
s
Prog
ram
me
Audi
ted
Outc
omes
R’00
0
Adju
sted
ap
prop
riatio
nR’
000
Medi
um-te
rm ex
pend
iture
estim
ate
R’00
0
2011
/1220
12/13
2013
/1420
14/15
2015
/1620
16/17
2017
/18
1.Ad
minis
tratio
n26
8 595
307 7
1536
6 500
351 4
4835
7 697
376 4
4939
6 320
2.Cu
rricu
lum P
olicy
, Sup
port
and M
onito
ring
1 700
304
1 701
634
1 469
592
1 895
927
1 877
765
1 944
181
1 926
617
3.Te
ache
rs, E
duca
tion H
uman
Res
ource
s and
Ins
titutio
nal D
evelo
pmen
t54
8 023
827 9
571 0
10 82
91 2
81 24
71 1
71 48
41 1
63 98
61 2
23 24
7
4.Pl
annin
g, Inf
orma
tion a
nd A
sses
smen
t5 5
74 82
26 8
97 87
68 4
35 60
910
420 3
6912
129 7
3812
754 3
2313
706 6
03
5.Ed
ucati
onal
Enric
hmen
t Ser
vices
4 809
170
5 150
702
5 728
564
5 740
882
5 974
456
6 289
699
6 607
586
TOTA
L12
900 9
1414
885 8
8417
011 0
9419
689 8
7321
511 1
4022
528 6
3823
860 3
73

22DEPARTMENT OF BASIC EDUCATION
3.2. Relating expenditure trends to strategic outcome-oriented goals
The NDP’s vision for 2030 is that South Africans should have access to training and education of the highest quality, characterised by significantly improved learning outcomes Education then becomes an important instrument in equalising individuals’ life chances, ensuring economic mobility and success and advancing our key goals of economic growth, employment creation, poverty eradication and the reduction of inequality Basic education, comprising Early Childhood Development (for children age 0 to 4) and school education (from Grade R at age 5 up to Grade 12), forms the bedrock of the education system
The compulsory ages for enrolment of school learners are from five years to 15 years This has been practically achieved, with enrolment of children in this age group having increased to 99% by 2011 However, coverage of young children in the ECD system, in spite of a massive expansion of access to Grade R, is still low Relatively few learners complete Grade 12 In 2011, 86% of Africans were enrolled at school but only 44% of Africans aged 23 to 24 years had attained matric In addition, a range of assessments – the Annual National Assessment for Grades 3, 6 and 9, international tests and the matriculation examination – confirm that quality, in terms of the cognitive achievement of learners, is inadequate Twenty years into democracy, inequalities still remain in terms of the quality of education to which most children have access Children of the lower-income-earning Africans are still the most disadvantaged in the system
To address these challenges, and building on recent sector plans, the NDP sets enrolment (improved learner retention) and quality (improved outcomes) targets and describes a framework for actions and strategies to realise these by 2030 The MTSF sets targets for the next five years: All children between ages 7 and 15 should be in school, increasingly learners should be in class groups appropriate to their age (65% in 2019, 80% in 2030) By 2019, 80% of each age cohort should achieve either a National Senior Certificate or an alternative vocational or further education and training qualification Quality targets for 2019 are that 75% of learners tested in Grades 3, 6, and 9 should achieve above 50% in both literacy and numeracy and that the number of matriculants who qualify to access university should increase to 250 000 (from 172 000 in 2013) and there should be appropriate increases in the numbers passing Mathematics and Physical Science
The South African average performance in the Trends in International Mathematics and Science Study (TIMSS) of Grade 9 learners increased from 285 to 352 between 2002 and 2011 with the world average being 500 There are also positive signs at the Grade 12 level with the number of learners qualifying for university entrance increasing from 110 000 in 2009 to 172 000 in 2013
As part of the preparation for the new five-year term, a new Medium-Term Strategic Framework was drafted in 2013 and approved by Cabinet in August 2014 The MTSF outputs have been aligned to the NDP priorities for the sector, and it is the milestones in this document that will be used to track the performance of the Minister and the sector The Department has therefore aligned its strategic and annual performance plans to the following six MTSF-aligned sub-outcomes of the sectoral Action Plan:
• Improved quality teaching and learning, through development, supply and effective utilisation of teachers;
• Improved quality teaching and learning, through provision of adequate, quality infrastructure and learning and teaching support materials;
• Improving assessment for learning to ensure quality and efficiency in academic achievement;
• Expanded access to Early Childhood Development and improvement of the quality of Grade R, with support for pre-Grade R provision;
• Strengthen accountability and improve management at the school, community and district level;
• Partnerships for education reform and improved quality

23 ANNUAL PERFORMANCE PLAN 2015-16
The Department has a funded establishment of 797 posts In order to enable the Department to fulfil the enhanced mandates of the education sector, the Department has begun re-configuring the organisational structure to provide for the expansion of priorities, such as infrastructure development, curriculum enhancement (Mathematics, Science, Technology and Literacy), teacher development and LTSM The Department will attempt to use its current personnel budget to cover the cost of the expansion
Workbooks
The spending focus over the MTEF will be the printing and distribution of high-quality workbooks for Grades R–9 in responding to Goal 19, ensuring that every learner has access to workbooks for targeted subjects
Workbooks (volumes 1 and 2) will be printed and distributed to 23 562 public schools The key focus subjects will be Numeracy/Mathematics, Literacy/Language, English First Additional Language and Life Skills Over the period, the Department will provide Braille workbooks for learners with visual impairment in 22 special schools
For the 2015 school academic year, 28 4 million workbooks (volume 1) for Grades R to 9 were printed and distributed to 15 294 schools by 30 September 2014 The printing and distribution of workbooks (volume 2) was scheduled for completion by January 2015 The allocation for this activity over the MTEF period amounts to R3 billion
Kha Ri Gude mass literacy campaign
Operating payments (within spending on goods and services) are second to infrastructure spending over the medium term mainly due to funding of the Kha Ri Gude mass literacy campaign The literacy campaign caters for illiterate adult learners aged 15 years and above in the 11 official languages The project was allocated R1 4 billion over the MTEF period and was expected to reach 4 7 million adult learners by 2017
By the end of the 2013/2014 financial year, the project had already reached 3 4 million adults who became numerate and literate For the 2014/2015 financial year, the project targeted over 600 000 learners and was expected to create temporary employment of an average of 40 000 volunteer facilitators – mostly youth – that would receive a stipend Nine additional Deputy Directors have been employed on contract to assist with coordination and monitoring of the Kha Ri Gude Campaign in the provinces
Introduction of the Maths, Science and Technology conditional grant
The Department reconfigured the Dinaledi Schools and Technical Secondary Schools Recapitalisation conditional grants into one grant that will be known as the Mathematics, Sciences and Technology Conditional Grant Over the MTEF period, the grant will focus on strengthening the implementation of the National Development Plan (NDP) and the Action Plan to 2019 by increasing the number of learners taking Mathematics, Science and Technology subjects and improving the pass rates
The Maths, Science and Technology conditional grant is been introduced to the provinces in 2015/2016 with the total allocated budget amounting to R1 1 billion over the MTEF period (R347 2 million in 2015/2016, R362 4 million in 2016/2017 and R385 1 million in 2017/2018) This allocation is taken from the Technical Secondary School Recapitalisation Grant (R771 4 million over MTEF) and Dinaledi Schools Grant (R367 million over MTEF)
For 2015 the grant will focus on providing resources in the form of Information and Communication Technology (ICT) equipment, tools, workshop and laboratory equipment, machinery, improving teacher capabilities by providing training, and the establishment and functioning of the dedicated MST Directorate and Institutes

24DEPARTMENT OF BASIC EDUCATION
Funza Lushaka bursaries
The Department offers Funza Lushaka bursaries to prospective teachers to ensure an adequate supply of qualified recruits to the education system in specific areas, such as Mathematics, Science and Technology The bursaries are provided through the National Student Financial Aid Scheme (NSFAS) The number of bursaries awarded in 2014 dropped slightly from 14 512 in 2013 to 14 349 The costs of tuition fees and accommodation, including meals, at universities increase annually and this directly impacts on the number of bursaries that can be awarded In part this is offset by the increased funding received from National Treasury
The Medium-Term Expenditure Framework (MTEF) indicates that the available funds for disbursement to the NSFAS for Funza Lushaka bursaries in the 2015/2016 financial year will be R991 million While this is an increase in the amount available, the actual number of additional bursaries that can be awarded will be offset by the expected increase in university fees The current estimate is that a total of 13 000 bursaries will be awarded in 2015 The Funza Lushaka bursary scheme has been allocated a budget amounting to R3 1 billion over the MTEF period
Integrated Quality Management System (IQMS)
The Integrated Quality Management System (IQMS) is a key initiative to strengthen accountability and performance management systems, and in particular the quality of education The IQMS provides for the evaluation of school-based educators including School Management Team members (Collective Agreement No 8 of 2003) The IQMS makes provision for the evaluation of principals by circuit managers, thereby entrenching accountability It also allows for the identification of the professional development needs of teachers
The IQMS has gradually expanded and strengthened since its inception in 2003 Its implementation has been closely monitored since the deployment of external IQMS moderators in 2008 In recent years, at least 8 000 schools were monitored annually on the implementation of the performance management system and support was provided to schools where necessary The percentage of educators whose performances were evaluated increased from 86% in 2010 to 96% in 2013
Education Infrastructure Grant
With regard to infrastructure funding, R29 6 billion is allocated to this grant over the MTEF period through the Education Infrastructure Grant and the Accelerated School Infrastructure Backlogs grant These grants account for the bulk of spending increases over the medium term, particularly spending in the Planning, Information and Assessment Programme to further accelerate the delivery and improvement of school infrastructure
The Education Infrastructure Grant is used to supplement the infrastructure programme in provinces to accelerate construction, maintenance, upgrading and rehabilitation of new and existing school infrastructure The grant is also used to enhance capacity to deliver infrastructure projects in education
The School Infrastructure Backlogs Grant, which was introduced in 2011/2012, has been allocated R7 4 billion over the MTEF period This grant aims to eradicate and replace schools built with inappropriate materials, such as mud schools, and other unsafe structures It also ensures that all schools have access to basic services such as water, sanitation and electricity Ninety-two schools were rolled out through the School Infrastructure Backlogs indirect grant, of the 150 schools targeted To date 82 schools have been completed, 270 schools received water, 275 schools received electricity and 289 schools received basic sanitation services for the first time

25 ANNUAL PERFORMANCE PLAN 2015-16
National School Nutrition Programme (NSNP)
The National School Nutrition Programme (NSNP) has three focus areas, namely, school feeding, promotion of nutrition education and school food gardens The programme is conducting an impact evaluation in collaboration with the Department of Monitoring and Evaluation A total of 170 workshops will be conducted on meal planning and hygiene, financial management as well as school food gardens The annual NSNP Best School Awards will be hosted to recognise schools with the best nutrition programmes nationwide The awards promote best practice among schools and districts while also providing advocacy opportunities on the programme
The Department’s new mandate will focus on the National Schools Deworming Programme as well as the continuation of the Integrated School Health Programme These programmes will increase the pressure for additional funding R18 billion has been allocated over the MTEF period for this activity
Overall Expenditure trend and reprioritisation
The 2015 Budget provides an amount reprioritised away from the budget baseline, and amounts reprioritised to the budget baseline The net changes on the budget baseline amount to reductions of R379 1 million in 2015/2016, R568 9 million in 2016/2017 and 398 1 million in 2017/2018 Funds reprioritised towards the vote amount to R200 million over the MTEF (R20 million in 2015/2016, R30 million in 2016/2017 and R150 million in 2017/2018) to be added to the transfer to the National Education Collaboration Trust – these funds were reduced from the Kha Ri Gude Literacy project accordingly
The Department also effected Cabinet-approved budget baseline reductions in respect of the following areas:
R413 6 million (R120 6 million in 2015/2016, R176 3 million in 2016/2017 and R116 6 million in 2017/2018) from the School Infrastructure Backlog Grant;
R142 7 million through efficiency savings in goods and services across all programmes (R30 6 million in 2015/2016, R53 3 million in 2016/2017 and R58 7 million in 2017/2018);
R1 3 million (R273 000 in 2015/2016, R479 000 in 2016/2017 and R528 000 in 2017/2018) from the payments for capital assets;
R17 8 million (R5 3 million in 2015/2016, R7 5 million in 2016/2017 and R5 million in 2017/2018) from the HIV and AIDS (Life Skills Education) Grant; and
R742 5 million (R213 9 million in 2015/2016, R319 3 million in 2016/2017 and R209 3 million in 2017/2018) from the Education Infrastructure Grant

26DEPARTMENT OF BASIC EDUCATION
Part B: Programme and sub-programme plans
4. Departmental Programmes: Strategic Objectives, Programme Performance Indicators and Annual Targets for 2015/2016
Changes to the budget programme structure:
None
4.1. Programme 1: Administration
Programme Purpose: to manage the Department and provide strategic and administrative support services
Sub-programmes: Ministry; Department Management; Corporate Services; Office of the Chief Financial Officer; Internal Audit and Risk Management; and Office Accommodation
Strategic objective:
To improve the capacity of the DBE
Programme performance indicators and annual targets for 2015/2016 to 2017/2018
The Programme: Administration is responsible for managing the Department through the provision of strategic and administrative support services The programme contributes to quality in the basic education system through effective institutional service delivery processes, planning and provisioning Vacancy management, human resources development and performance management have been prioritised to increase the efficiency and capacity of the Department to deliver its mandate in terms of delivery of services to the public and the professional development of staff The indicators in this programme are directed towards performance improvement and development, compliance, accountability and sound financial systems The activities of the programme support Action Plan to 2019: Towards the realisation of schooling 2030 and cut across all its goals
Key processes will be strengthened in 2015 to support the Department in respect of administrative procedures and systems The Management Performance Assessment Tool (MPAT) is coordinated by the Department of Performance Monitoring and Evaluation (DPME) The DPME conducts annual assessments of the quality of generic management practices in departments The aim of these assessments is to get managers to regularly monitor the effectiveness of their management practices and to implement improvement plans where necessary Following through on the recommendations of the 2014 MPAT and responding to the findings of the Auditor-General in respect of institutional performance improvements will be priorities in the 2015/2016 financial year
The DBE will strengthen the use of and systems associated with performance information and data in 2015, with the assistance of the office of the Chief Information Officer and internal auditing procedures, to improve institutional management and outcomes at national level and in provincial education departments
The DBE will strive for an unqualified audit report with no matters of emphasis The Internal Audit function will be supported to strengthen good governance and control processes and compliance with regulations The Department will strengthen the management of litigation through its legal unit, which will provide legal advice and monitor and support provincial education departments in the management of court cases
The Department is currently undergoing a reconfiguration process in line with the mandates of the new administration This process is meant to assist the Department to expedite service delivery

27 ANNUAL PERFORMANCE PLAN 2015-16
Stra
tegi
c Obj
ectiv
ePr
ogra
mm
e Per
form
ance
Indi
cato
rSt
rate
gic
Plan
Targ
etAu
dite
d/Ac
tual
perfo
rman
ceEs
timat
ed
perfo
rman
ceMe
dium
-term
targ
ets
2011
/1220
12/13
2013
/1420
14/15
2015
/1620
16/17
2017
/18
1.1 T
o im
prov
e the
ca
pacit
y of t
he
Depa
rtmen
t of
Basic
Edu
catio
n.
1.1.1
Numb
er of
staff
deve
lopme
nt op
portu
nities
offer
ed to
offic
ials i
n the
DB
E.30
--
--
1520
25
1.1.2
Numb
er of
inter
nship
s imp
lemen
ted in
the
Depa
rtmen
t.75
-87
6365
6570
72
1.1.3
Sign
ed fin
ancia
l disc
losur
e for
ms fo
r all
DBE
SMS
memb
ers s
ubmi
tted b
y due
da
te ev
ery y
ear.
All S
MS
memb
ers
--
-Al
l SMS
me
mber
sAl
l SMS
me
mber
sAl
l SMS
me
mber
sAl
l SMS
me
mber
s
1.1.4
Sign
ed P
erfor
manc
e Agr
eeme
nts by
all
DBE
SMS
memb
ers s
ubmi
tted b
y due
da
te ev
ery y
ear.
All S
MS
memb
ers
--
-Al
l SMS
me
mber
sAl
l SMS
me
mber
sAl
l SMS
me
mber
sAl
l SMS
me
mber
s

28DEPARTMENT OF BASIC EDUCATION
Programme Performance Indicator Reporting period
Annual target 2015/16
Quarterly targets
1st 2nd 3rd 4th
Number of staff development opportunities offered to officials in the DBE. Annual 15 15
Number of internships implemented in the Department. Annual 65 65
Signed Financial Disclosure forms for all DBE SMS members submitted by due date every year.
Annual All SMS members
All SMS members
Signed Performance Agreements by all DBE SMS members submitted by due date every year.
Annual All SMS members
All SMS members

29 ANNUAL PERFORMANCE PLAN 2015-16
Reco
ncili
ng p
erfo
rman
ce ta
rget
s w
ith
the
Budg
et a
nd M
TEF
Sub-
Prog
ram
me
Audi
ted
Outc
omes
R’00
0Ad
just
ed
appr
opria
tion
R’00
0Me
dium
-term
expe
nditu
re es
timat
eR’
000
2011
/1220
12/13
2013
/1420
14/15
2015
/1620
16/17
2017
/18
Minis
try24
723
22 87
529
748
24 59
225
640
27 16
328
746
Depa
rtmen
tal M
anag
emen
t37
362
60 44
261
831
66 76
365
378
68 28
071
847
Corp
orate
Ser
vices
39 23
744
775
86 11
448
615
48 97
651
393
54 15
3
Offic
e of th
e Chie
f Fina
ncial
Offic
er34
701
36 26
834
495
46 38
546
215
48 97
351
835
Inter
nal A
udit a
nd R
isk M
anag
emen
t2 4
334 3
175 3
976 2
805 3
705 7
186 0
71
Offic
e Acc
ommo
datio
n13
0 139
139 0
3814
8 915
158 8
1316
6 118
174 9
2218
3 668
Tota
l26
8 595
307 7
1536
6 500
351 4
4835
7 697
376 4
4939
6 320
Econ
omic
Clas
sifica
tion
Curre
nt p
aym
ents
255 6
5429
1 017
334 3
5233
2 780
339 3
2236
5 466
384 8
08
Comp
ensa
tion o
f emp
loyee
s81
068
97 50
111
4 402
124 1
2812
6 981
135 3
6314
3 891
Good
s and
servi
ces
122 0
6714
2 051
169 7
6015
9 670
164 8
1718
3 782
192 2
80
Comp
uter s
ervic
es15
506
15 62
618
340
16 07
415
823
16 71
717
455
Leas
e pay
ments
72
668
941
1 172
1 579
1 658
1 720
Prop
erty
paym
ents
67 36
773
862
84 18
890
716
99 84
511
7 622
125 5
61
Trav
el an
d sub
sisten
ce
13 23
517
152
23 81
015
723
19 08
619
717
20 79
5
Inter
est a
nd re
nt on
land
of w
hich:
52 51
951
465
50 29
048
982
47 52
446
321
48 63
7
Tran
sfers
and s
ubsid
ies58
629
215
421
177
185
195
205
Depa
rtmen
tal ag
encie
s and
acco
unts
157
184
167
177
185
195
205
Fore
ign go
vern
menta
l and
inter
natio
nal o
rgan
isatio
ns-
-15
063
--
--
Hous
ehold
s42
910
819
1-
--
Paym
ents
for ca
pital
asse
ts12
355
16 40
616
622
18 37
518
190
10 78
811
307
Build
ings a
nd ot
her fi
xed s
tructu
res
9 230
12 86
55 2
1712
768
14 22
57 2
16
7 577

30DEPARTMENT OF BASIC EDUCATION
Sub-
Prog
ram
me
Audi
ted
Outc
omes
R’00
0Ad
just
ed
appr
opria
tion
R’00
0Me
dium
-term
expe
nditu
re es
timat
eR’
000
2011
/1220
12/13
2013
/1420
14/15
2015
/1620
16/17
2017
/18
Mach
inery
and e
quipm
ent
3 072
3 476
11 22
25 5
183 8
653 4
443 5
96
Softw
are a
nd ot
her in
tangib
le as
sets
5365
183
8910
012
813
4
Paym
ents
for fin
ancia
l ass
ets-
-5
--
--
Tota
l26
8 595
307 7
1536
6 500
351 4
48
357 6
97
376 4
49
396 3
20
Deta
ils o
f sele
cted
tran
sfer
s and
subs
idies
Curre
nt42
910
819
1-
--
-
Hous
ehold
s Soc
ial B
enefi
ts42
910
819
1-
--
-
Fore
ign go
vern
ment
and i
ntern
ation
al or
ganis
ation
s-
--
--
--
Curre
nt-
-14
956
--
--

31 ANNUAL PERFORMANCE PLAN 2015-16
Performance and expenditure trends: Programme 1
The bulk of spending in this programme over the medium term is in the Office Accommodation sub-programme, from where the public-private partnership unitary fee is paid for the office building the Department occupied in February 2010
The Department has a funded establishment of 797 posts In order to enable the Department to fulfil the enhanced mandates of the education sector, the Department has embarked on a process of re-configuring the organisational structure to provide for the expansion of priorities such as infrastructure development, curriculum enhancement (Maths, Science, Technology and Literacy), teacher development and LTSM The Department will attempt to use its current personnel budget to cover the cost of the expansion
4.2. Programme 2: Curriculum Policy, Support and Monitoring
Programme Purpose: Develop curriculum and assessment policy and support; monitor and evaluate curriculum implementation
Sub-programmes: Programme Management: Curriculum Policy, Support and Monitoring; Curriculum Implementation and Monitoring; Curriculum Enhancement Programmes; Kha Ri Gude Literacy Project
Strategic objectives:
To improve the quality of early childhood development
To increase the supply of high-quality learning materials
To improve curriculum implementation in all schools, but especially in multi-grade schools
Programme performance indicators and annual targets for 2015/2016 to 2017/2018
Action Plan Goals on Learner Performance
Goal 1 ▶ Increase the number of learners in Grade 3 who, by the end of the year, have mastered the minimum language and numeracy competencies for Grade 3.
Goal 2 ▶ Increase the number of learners in Grade 6 who, by the end of the year, have mastered the minimum language and mathematics competencies for Grade 6.
Goal 3 ▶ Increase the number of learners in Grade 9 who, by the end of the year, have mastered the minimum language and mathematics competencies for Grade 9.
Goal 4 ▶ Increase the number of Grade 12 learners who become eligible for a Bachelor’s programme at a university.
Goal 5 ▶ Increase the number of Grade 12 learners who pass Mathematics.
Goal 6 ▶ Increase the number of Grade 12 learners who pass Physical Science.
Goal 7 ▶ Improve the average performance of Grade 6 learners in languages.
Goal 8 ▶ Improve the average performance of Grade 6 learners in Mathematics.
Goal 9 ▶ Improve the average performance of Grade 8 learners in Mathematics.
Goal10 ▶ Ensure that all children remain effectively enrolled in school at least up to the year in which they turn 15.
Goal 11 ▶ improve the access of children to quality Early Childhood Development (ECD) below Grade 1.
Goal 12 ▶ Improve the grade promotion of learners through Grades 1 to 9.
Goal 13 ▶ Improve the access of the youth to further Education and Training (FET) beyond Grade 9.

32DEPARTMENT OF BASIC EDUCATION
EARLY CHILDHOOD DEVELOPMENT (ECD)
Universal access to Grade R (Reception Grade) by 2014 is in sight Grade R has become institutionalised, with investment in the public provision of Grade R at public schools countrywide in response to the need for the development of foundational skills for cognitive development The focus over the 2014–2019 MTSF is to ensure quality through providing teaching and learning resources and suitably qualified practitioners, as part of working towards achieving Goal 11 of the Action Plan to 2019: Towards the Realisation of Schooling 2030
Plans for ECD in 2015/2016 include the implementation of norms and standards for the employment of Grade R practitioners; approved programmes for a National Diploma in Grade R; workbooks and resource packs aligned to CAPS, and the cognitive science on how children learn; guidelines for school management teams on supporting Grade R and monitoring of curriculum coverage; and Grade R workbook distribution and use While the NDP proposes a two-year programme before Grade 1, the sector needs to fully close the current gaps in the ECD sector in educator quality and appropriate learning materials before introducing a second year
LTSM
The National Catalogue for CAPS-aligned textbooks (Grades R to 12) will facilitate the timely procurement of LTSM in all grades The Department will monitor and support provinces to manage the procurement and delivery of textbooks and stationery for the 2015 academic year through a Basic Education sector plan for the procurement and delivery of LTSM, that will include regular reporting to ensure adherence to time frames Challenges will be addressed through a risk management plan The aim of the plan is to achieve a greater measure of uniformity across provinces in respect of deadlines, as well as better value for money and tighter controls over the delivery of quality education Together with close monitoring of provincial procurement by the Department, the plan will ensure that LTSM of the right quality and quantity are procured efficiently, on time and at the lowest overall cost in all provinces
The Department will continue to work with provincial and district officials to improve teacher capacity and practices in e-education This includes the systematic expansion of access to interactive technologies, basic computer literacy and electronic content for teacher development, using teacher resource centres with a focus on subject knowledge, teaching practices, materials use and annual assessment training
The Department will provide approximately 54 million workbooks to learners in public schools in the following grades and subjects:
• Grade R workbooks (one per learner per term);
• Grades 1–3 Mathematics in 11 official languages;
• Grades 1–3 Life Skills in 11 official languages;
• Grades 1–6 Languages in all official languages;
• Grades 1–6 English First Additional Language; and
• Grades 4–9 Mathematics in Afrikaans and English
The Department aims to fill 100% of workbook orders received from provinces This will be made possible by provincial commitment to print 5% of stock for use as a buffer to addressing shortages in coming years The Department will print and deliver the Incremental Introduction of African Languages workbooks for Grade 1 learners in public schools that do not offer an African language

33 ANNUAL PERFORMANCE PLAN 2015-16
MATHEMATICS, SCIENCE AND TECHNOLOGY IMPROVEMENT STRATEGY
The strategy includes identifying ground-breaking activities to improve learning outcomes in Mathematics, Science and Technology The activities are aimed at increasing learner participation and success rates; addressing teacher demand, supply, utilisation, development and support; strengthening partnerships for education reform and improved quality; and providing resources to schools to support effective teaching of MST subjects
Drawing on the findings of the 2013 Annual National Assessment (ANA) and the National Senior Certificate (NSC) Diagnostic Reports, the focus in this MTEF will be on the Intermediate and Senior Phases, consolidating gains to ensure utilisation of materials, training and development to strengthen the quality of learning and teaching
To ensure learner participation and success the following initiatives will be implemented:
• The reduction of the number of learners selecting Mathematical Literacy through the subject combination circular when registering for NSC in Grades 10–12
• The development of norms and standards for Technology Education for effective implementation in provinces to strengthen articulation between GET and FET technology subjects and schools of skills
• Strengthening learner support for subject choice and career guidance as early as Grade 7
• Encouraging schools and learners to participate in MST Olympiads, exhibitions, Expos and National Science Week
• Developing Mathematics, Sciences and Technology workbooks with Sasol Inzalo Foundation
• Implement strategies to improve School-Based Assessment in MST
• Improve the quality of passes of girl learners in Mathematics, Science and Technology
• Support learners in preparation for TIMSS 2015
Teacher demand, supply, utilisation, development and support
The Department will support teachers through the following activities:
• Training of FET Mathematics teachers in Euclidean Geometry and Probability to strengthen the teaching and learning of new content in FET CAPS
• Conducting an audit of current pre and in-service teacher development and training programmes and collaborating with HEIs, NGOs, professional associations, industry and other social partners in the development of programmes for teachers and subject advisors
• Utilising the services of HEIs, NGOs and industry in the development and support of competent teachers through in-service training
• Training school HoDs/Subject heads and senior teachers in the management of MST curricula and resources
• Identifying and placing teachers and subject advisors/specialists with potential in exchange programmes attached to Chinese institutions of higher learning
• Establishing clusters to facilitate professional development programmes
• Placing teachers in subjects that they are appropriately qualified to teach
• Incentivising MST teachers to teach in rural areas
• Monitoring of curriculum coverage
• Using broadcast centres and DVDs to broadcast lessons where there are no teachers

34DEPARTMENT OF BASIC EDUCATION
▶ 12
Partnerships
The Department will strengthen collaboration with strategic partners to support the teaching and learning of MST through the following partnerships:
• Collaboration with Sasol Inzalo Foundation to strengthen pedagogical content knowledge (PCK) in Mathematics, Sciences and Technology and support CAPS implementation in the Senior Phase
• Collaboration with SAASTA to train Technology (Grade 7–9) teachers and subject advisors to benefit both the mainstream and multi-grade learners
• Partnerships for Technology Grades 7 to 12 with professional institutions such as NRF, ETDP SETA, professional associations, and national and international NGOs
• Strengthened partnership in collaboration with the Institute of Electrical and Electronics Engineers (IEEE), the Quality Council for Trades and Occupations (QCTO), the South African Institution of Civil Engineering (SAICE) and the South African Institute of Architects (SAIA)
• Collaboration with China to develop a strategy on the mobilisation, use and maintenance of resources
• Support for the teaching of Mathematics in primary schools through the DBE-JICA project
• Partnership with Germany and Siemens on the donation of MST equipment
• Recruiting of Cuban tutors to support MST teachers and district officials
• Exposure of DBE specialists and provincial coordinators to the Chinese education system through visits to Chinese MST centres, universities and/or community colleges
• Updating MST Strategy (2001) and developing a trilateral MST Integrated Strategy with DHET and DST to increase success rates in MST and skills development
• Partnership with China to develop a strategy to increase participation in vocational and technical education and to develop a model of addressing articulation between GET, FET, industry and university education
• MST stakeholder Indaba convened to scale up MST activities and partnerships
Resources
• The Department aims to focus on the areas below to ensure maximum utilisation of resources:
• Review of Dinaledi Schools grant, transversal and central procurement
• Finalise policy on CAPS for technical schools
• Conduct audit of technical schools for the supply of equipment and instruments
• Develop models of appropriate ICT solutions and technology support systems for MST and other subjects where applicable
• Monitor provincial plans for utilisation and management of MST equipment and resources
• Develop minimum norms and standards for apparatus utilisation and storage in schools
• Provide self-study guides on content and Physical Science experiments (CAPS Science practical work)
• Procure Mathematics, Science and Technology resources from China
• Conduct an audit of and provide Mathematics, Science and Technology supplementary resources
• Provide past NSC examination question papers and memoranda
• Share Grades 6, 9, 10 and 11 MST June provincial/district examination papers with all provinces
• Establish and resource the MST directorate/office/institute
• Establish the nine provincial institutes aligned to the national institute
35 ANNUAL PERFORMANCE PLAN 2015-16
Information and Communication Technology (ICT)
Increasing ICT access and utilisation by learners and teachers in support of curriculum implementation for improved learning outcomes will involve the following actions:
• Monitor and support curriculum innovation throughout the sector
• Ensure infrastructure roll-out to all public institutions and offices
• Ensure connectivity to all public institutions and offices
• Ensure effective ICT teacher development programmes for teachers
• Develop and make available quality ICT digital content for all grades
• Develop and implement the ICT strategy and implementation plan
• Ensure collaboration with DST, DOC, the private sector and NGOs to increase ICT access and utilisation
• Ensure cost-effective and appropriate broadband connectivity
• Ensure the alignment of PEDs’ ICT plans to the sector ICT plan
• Measure the impact of ICT support for curriculum implementation in terms of learner performance
• Develop and ensure implementation of Norms and Standards in line with section 3 and 8 of the National Education Policy Act
• Develop and implement a strategy to promote the utilisation of data to enhance quality and efficiency
• Develop and implement business processes on the work done to inform Norms and Standards
LIBRARY SERVICES
The 2012 Report on the National School Monitoring Survey reports separately on primary and secondary schools per province At the primary level nationally, about 60% of learners in South Africa are in schools that meet the minimum standard set for this indicator, i e about 60% of learners are in schools that have either a school library or a classroom library, or that are serviced by a mobile library The national average of 59% means that 41% of primary level learners nationally are not in schools with access to a library
While more than 80% of primary school learners are in schools with access to libraries in Gauteng, the Western Cape and the Northern Cape, fewer than 70% of primary school learners in the remaining six provinces are in schools with access to libraries The situation is particularly severe in Limpopo and the Eastern Cape where fewer than a third of learners are in schools that have access to libraries
The national average for secondary schools that meet the minimum standard set for this indicator is 53% This is six percentage points lower than the national average for primary schools Only in the Free State and the Western Cape are more than 70% of secondary school learners in schools that meet the minimum standard for libraries As is the case for primary school learners, fewer than 40% of secondary school learners in Limpopo and the Eastern Cape are in schools that meet the minimum standards for libraries Approximately 800 000 learners in these two provinces are in secondary schools that do not meet the minimum standard set for libraries The national average of 53% is low, due to the high number of learners in the provinces with fewer than 50% of their learners in secondary schools that are not meeting the minimum standards for libraries (Limpopo, the Eastern Cape and KwaZulu-Natal)
Both the National Education Evaluation Development Unit (NEEDU) reports of 2012–13 and the Ministerial Reading Report 2013 concluded that classroom teaching, reading methodologies and practices, as well as the provisioning of quality reading material in the early grades, are causes for concern
36DEPARTMENT OF BASIC EDUCATION
The Progress in International Reading Literacy Study (PIRLS) 2011 concluded that Grade 4 learners, particularly those tested in African languages, achieved well below the international benchmark The PIRLS 2011 findings show that learners whose home language is not the language of learning and teaching (LoLT) achieved low scores in the English tests when compared to English home language speakers The Annual National Assessment (ANA) findings also show that learner performance declines from Grade 3 to 4 due to the change in the LoLT
The NEEDU report asserts that the “reading fluency of the top six learners in schools visited in 2012 was disappointing ” Most learners were found to be reading below the average benchmark for their grade The NEEDU report recommends the implementation of reading and writing norms given in the Curriculum and Assessment Policy Statement (CAPS) The plan will be achieved by collaborating with stakeholders, NGOs and business partners who offer donations of libraries and resources through CSI projects to extend services to more schools; conducting campaigns to collect books; collaborating with government departments to support initiatives to provide access to LIS; and strengthening reading and literacy interventions in Grades R–12 to improve outcomes
INCREMENTAL INTRODUCTION OF AFRICAN LANGUAGES (IIAL)
The Department of Basic Education, as a way of concretising the commitment to promote and develop previously marginalised languages, initiated the Incremental Introduction of African Languages (IIAL) The IIAL aims to strengthen the use of African languages at Home Language and First Additional Language levels, thereby increasing access to languages beyond English and Afrikaans
The IIAL requires learners to be offered three languages, one of which should be an African language It will be implemented incrementally from Grade 1 in 2016 and in subsequent years reaching Grade 12 in 2026 The IIAL is currently being piloted in 228 schools countrywide The pilot commenced on 1 February 2015 and will continue during the 2015 school year The evaluation of the pilot and policy comments will guide the way forward thereafter
In 2016 the IIAL will be implemented in 4 000 schools (Grade 1) that are currently not offering African languages Schools, depending on their needs, will use different models of sourcing teachers, i e teachers from existing staff establishments, teachers in addition, retired teachers, itinerant teachers or temporary teachers DBE will provide LTSM (workbooks, lesson plans, Big Books, conversational posters and audio clips) to all schools DBE, provinces and districts will monitor and support all schools that will be implementing IIAL in 2016
INCLUSIVE EDUCATION
The Department will ensure that schools effectively implement the Inclusive Education policy and have access to specialised support by:
• Implementing the Inclusive Education and Home Education policies;
• Monitoring and supporting the implementation of the Curriculum and Assessment Policy Statements (CAPS) for South African Sign Language curricula for Grades R–12;
• Implementing screening, identification, assessment and support (SIAS) policy as a mechanism for early identification of barriers to learning and early intervention;
• Implementing Curriculum Differentiation in order to reduce the dropout rate and increase the retention rate;
• Monitoring and supporting the implementation of the National Strategy for Learner Attainment (NSLA) including performance in the assigned underperforming districts;
• Developing and ensuring the implementation of Norms and Standards in line with section 3 and 8 of the National Education Policy Act
• Strengthening School-Based Assessment (SBA) to enhance teaching practice

37 ANNUAL PERFORMANCE PLAN 2015-16
KHA RI GUDE
The Kha Ri Gude Literacy Campaign is informed by the Constitution of South Africa, which states that “Everyone has the right to a basic education, including adult basic education (Chapter 2, Clause 29, 1a) According to Statistics SA (2001), there were 9 6 million illiterate adults in South Africa above the age of 15 Of these, 4 7 million, including people living with disabilities, were illiterate and innumerate in one of the 11 official languages
The Kha Ri Gude Literacy Campaign was intended to reduce the national rate of illiteracy by 50% by 2015 This was in line with the government’s Education for All (EFA) commitment made in Dakar in 2000 as well as its commitment to achieve the Millennium Development Goals (MDGs) on poverty reduction, women’s empowerment, HIV and AIDS eradication, environmental protection, and sustainable democratisation and peace building
Of the seven million children in South Africa aged six and younger, approximately 3 8 million children (55%) live in circumstances of poverty (Government Priority: Education) In recognising the importance of ECD, Government has committed to ensuring universal access to Grade R and doubling the number of 0 to 4-year-olds in ECD centres by 2014 Kha Ri Gude is targeting the 0 to 4-year-olds who live in circumstances of poverty by training 1 500 Kha Ri Gude graduates in ECD stimulation
The aim of Kha Ri Gude is to empower (skills development) socially disadvantaged people to become self-reliant and to be able to participate more effectively in the economy and society
From 2008 to 2013 Kha Ri Gude (KRG) produced 3 4 million graduates and targeted 684 000 adults in 2014/2015 The following plans are being implemented in the current phase:
• Community and faith leaders, unions, SALGA and other organisations will be utilised to promote the campaign and assist with recruitment of unemployed graduate youth
• Road shows will be held in all provinces to increase awareness of Kha Ri Gude and use the broader civil society to recruit 40 000 unemployed graduates and youth with matric as well as 684 000 illiterate learners to the KRG programme
• These 40 000 graduates and youth will be deployed to municipalities where 1 500 KRG graduates would be trained in ECD 0–4 stimulation in 2014/2015 This intervention will ensure that we achieve universal Grade R provision by 2015
• The offerings to the blind and deaf sector are being strengthened and intensified
• The campaign will employ nine monitors across the country at Deputy Director level to monitor the campaign and ensure that targets are met
• Kha Ri Gude graduates will be encouraged to register for ABET classes to improve their education skills and work opportunities, and the number of graduates that registered and completed ABET classes will be tracked
• Working with the SETAs, work opportunities and more opportunities for skills development are being created

38DEPARTMENT OF BASIC EDUCATION
RURAL SCHOOLING
The Department will coordinate a multi-disciplinary approach in supporting rural schools to provide quality education by:
• Monitoring and supporting curriculum implementation in multi and mono-grade teaching schools
• Developing and implementing teacher development models suitable for rural schools
• Providing ICT access and utilisation by teacher and learners to support curriculum implementation
• Ensuring the development and implementation of suitable human resource provisioning models
• Paying special attention to service delivery of the NSNP, learner transport and general curriculum and school support services, to ensure that these children receive quality education
• Coordinating learner transport and infrastructure development and maintenance
• Monitoring and supporting the consolidation of schools that are not educationally viable
• Monitoring and supporting the implementation of SASA section 14 agreements
• Coordinating inter-departmental, sectoral and NGO programmes

39 ANNUAL PERFORMANCE PLAN 2015-16
Stra
tegi
c Obj
ectiv
ePr
ogra
mm
e Per
form
ance
Indi
cato
rSt
rate
gic
Plan
Ta
rget
Audi
ted/
Actu
al pe
rform
ance
Estim
ated
pe
rform
ance
Medi
um-te
rm ta
rget
s
2011
/1220
12/13
2013
/1420
14/15
2015
/1620
16/17
2017
/18
2.1 Im
prov
e the
qua
lity
of E
arly
Child
hood
De
velo
pmen
t (EC
D).
2.1.1
Perce
ntage
of qu
alifyi
ng pu
blic s
choo
ls wi
th wo
rkboo
ks fo
r Gra
de R
lear
ners.
97–1
00%
--
--
97–1
00%
97–1
00%
97–1
00%
2.1.2
Perce
ntage
of G
rade
R pr
actiti
oner
s with
NQ
F lev
el 6.
25%
--
--
20%
20%
20%
2.1.3
Perce
ntage
of G
rade
R pr
actiti
oner
s with
NQ
F lev
el 4 a
nd 5.
30%
--
--
50%
45%
40%
2.2 T
o in
crea
se th
e sup
ply
of h
igh-
quali
ty le
arni
ng
mat
erial
s.
2.2.1
Perce
ntage
of pu
blic s
choo
ls wi
th Ho
me
Lang
uage
wor
kboo
ks fo
r lear
ners
in Gr
ades
1-6.
97–1
00%
--
-97
–100
%97
–100
%97
–100
%97
–100
%
2.2.2
Perce
ntage
of pu
blic s
choo
ls wi
th Ma
thema
tics w
orkb
ooks
for le
arne
rs in
Grad
es 1–
9.97
–100
%-
--
-97
–100
%97
–100
%97
–100
%
2.3 T
o in
crea
se le
arne
r co
mpl
etio
n ra
tes.
2.3.1
Numb
er of
lear
ners
comp
letin g
the K
ha R
i Gu
de pr
ogra
mme.
573 0
00-
--
545 3
8643
0 441
430 5
00
2.3.2
Perce
ntage
of le
arne
rs wh
o obta
in a
Natio
nal S
enior
Cer
tifica
te.
82%
70.2%
73.9%
80.8%
75%
76%
78%
79%
2.4 T
o im
prov
e cur
ricul
um
impl
emen
tatio
n in
m
ulti-
grad
e sch
ools.
2.4.1
Numb
er of
teac
hers
traine
d in m
ulti-g
rade
tea
ching
.2 5
00-
--
-50
050
050
0

40DEPARTMENT OF BASIC EDUCATION
Programme Performance Indicator Reporting period
Annual target
2015/16
Quarterly targets
1st 2nd 3rd 4th
Percentage of qualifying public schools with workbooks for Grade R learners. Annual 97–100% 97–100%
Percentage of Grade R practitioners with NQF level 6. Annual 20% 20%
Percentage of Grade R practitioners with NQF level 4 and 5. Annual 50% 50%
Percentage of public schools with Home Language workbooks for learners in Grades 1-6.
Annual 97–100% 97–100%
Percentage of public schools with Mathematics workbooks for learners in Grades 1–9.
Annual 97–100% 97–100%
Number of learners completing the Kha Ri Gude programme. Annual 430 441 430 441
Percentage of learners who obtain a National Senior Certificate. Annual 76% 76%
Number of teachers trained in multi-grade teaching. Annual 500 500

41 ANNUAL PERFORMANCE PLAN 2015-16
Reco
ncili
ng p
erfo
rman
ce ta
rget
s w
ith
the
Budg
et a
nd M
TEF
Expe
ndit
ure
esti
mat
es
Sub-
Prog
ram
me
Audi
ted
Outc
omes
R’00
0Ad
just
ed ap
prop
riatio
nR’
000
Medi
um-te
rm ex
pend
iture
estim
ate
R’00
0
2011
/1220
12/13
2013
/1420
14/15
2015
/1620
16/17
2017
/18
Prog
ramm
e Man
agem
ent: C
urric
ulum
Polic
y, Su
ppor
t and
Mo
nitor
ing2 0
022 7
272 5
972 4
55
2 590
2 756
2 925
Curri
culum
Imple
menta
tion a
nd M
onito
ring
237 7
0722
8 565
34 93
488
294
36 16
538
495
40 86
0
Kha R
i Gud
e Lite
racy
Pro
ject
497 3
3957
2 457
598 7
6656
9 939
504 6
8350
0 545
405 1
23
Curri
culum
and Q
uality
Enh
ance
ment
Prog
ramm
es93
6 256
897 8
8583
3 295
1 235
239
1 334
327
1 402
385
1 477
709
Tota
l1 7
00 30
41 7
01 63
41 4
69 59
21 8
95 92
71 8
77 76
51 9
44 18
11 9
26 61
7
Chan
ge to
2012
budg
et es
timate
s
Econ
omic
class
ifica
tion
Curre
nt P
aym
ents
1 421
428
1 406
418
1 469
021
1 550
554
1 524
894
1 580
955
1 540
654
Comp
ensa
tion o
f emp
loyee
s63
911
65 76
375
547
78 08
985
833
91 46
197
195
Good
s and
servi
ces o
f whic
h:1 3
57 51
71 3
40 65
51 3
93 47
61 4
72 46
51 4
43 86
11 4
89 49
41 4
43 45
9
Agen
cy an
d sup
port/
outso
urce
d ser
vices
35 26
835
843
33 97
831
184
24 61
223
222
22 86
9
Cons
umab
le: st
ation
ery,
ing an
d off s
upp
508 0
2466
6 000
576 1
4433
738
24 69
520
452
10 42
8
Trav
el an
d sub
sisten
ce16
944
9 690
8 914
12 26
09 6
9610
301
9 665
Oper
ating
expe
nditu
re78
3 954
610 6
6672
1 916
724 2
6572
9 095
744 0
7871
0 648
Tran
sfer
s and
subs
idies
278 6
1529
4 712
296
344 7
9734
7 303
362 5
6838
5 275
MST
278 6
1529
4 712
296
344 7
9734
7 185
362
444
385 1
45
Hous
ehold
s23
939
029
6-
--
Fore
ign go
vern
ments
and i
ntern
ation
al or
ganis
ation
--
--
--
-
Guida
nce C
ouns
elling
and Y
outh
Deve
lopme
nt Ce
ntre,
Malaw
i-
93-
113
118
124
130
Paym
ents
for ca
pital
asse
ts26
141
127
257
676
865
868
8

42DEPARTMENT OF BASIC EDUCATION
Sub-
Prog
ram
me
Audi
ted
Outc
omes
R’00
0Ad
just
ed ap
prop
riatio
nR’
000
Medi
um-te
rm ex
pend
iture
estim
ate
R’00
0
2011
/1220
12/13
2013
/1420
14/15
2015
/1620
16/17
2017
/18
Mach
inery
and e
quipm
ent
261
398
272
576
738
648
678
Softw
are a
nd ot
her in
tangib
le as
sets
-13
--
3010
10
Paym
ents
for fin
ancia
l ass
ets-
--
--
--
Tota
l17
00 30
41 7
01 63
41 4
69 59
21 8
95 92
7 1
877 7
65
1 944
181
1 92
6 617
43 ANNUAL PERFORMANCE PLAN 2015-16
Performance and expenditure trends: Programme 2
The spending focus over the MTEF period will be on improving curriculum delivery, particularly through ensuring access to high-quality learning and teaching support materials Workbooks (volumes 1 and 2) will be printed and distributed to 23 562 public schools The key focus subjects will be Numeracy/Mathematics, Literacy/Language, English First Additional Language and Life Skills Over the period the Department will provide Braille workbooks for learners with visual impairment in 22 special schools
The spending on Kha Ri Gude Literacy Project sub-programme increased between 2010/2011 and 2014/2015, mainly due to additional allocations for the project through the introduction of the expanded public works incentive grant in 2011/2012 As additional funds could be accessed through this grant if specified job opportunity targets for volunteer facilitators were met, this increased expenditure on goods and services over this period and is expected to have the same effect in 2015/2016 With an allocation of R1 4 billion over the medium term, this project had, by the end of 2013/2014, reached 3 4 million adults who became numerate and literate in one of the 11 official languages As the project expects to reach the initial target of 4 7 million over the medium term (2017), it will begin to wind down as a mass-based intervention
The Department reconfigured the Dinaledi Schools and Technical Schools Recapitalisation conditional grants into one grant that will be known as the Mathematics, Sciences and Technology Conditional Grant Over the 2015 MTEF, the grant will focus on strengthening the implementation of the National Development Plan (NDP) and Action Plan 2019 by increasing the number of learners taking Mathematics, Science and Technology subjects and improving the pass rates
The Maths, Science and Technology Conditional Grant is being introduced to the provinces in 2015/2016 with the total allocated budget amounting to R1 1 billion over the MTEF period (R347 2 million in 2015/2016, R362 4 million in 2016/2017 and R385 1 million in 2017/2018) This allocation is taken from the Technical Secondary Schools Recapitalisation Grant (R771 4 million over MTEF) and the Dinaledi Schools Grant (R367 million over MTEF)
For 2015 the grant will focus on providing resources in the form of Information and Communication Technology (ICT) equipment, tools, workshop and laboratory equipment, machinery improving teacher capabilities by providing training, and the establishment and functioning of the dedicated MST Directorate and Institutes
4.3. Programme 3: Teachers, Education Human Resources and Institutional Development
Programme Purpose: To promote quality teaching and institutional performance through the effective supply, development and utilisation of human resources
Sub-programmes: Programme Management: Teacher and Professional Development; Labour Relations and Human Resources Planning; Education Human Resources Development; and Curriculum and Professional Development Institute and Educator Performance Management & Development and Whole School Evaluation
Strategic objectives:
• To improve the recruitment and placement of educators in the education system
• To improve the capacity of teachers through diagnostic testing and the Integrated Quality Management System, and the implementation of teacher development courses to improve content and pedagogical knowledge
• To improve the monitoring of school effectiveness and accountability through individual performance and school governance
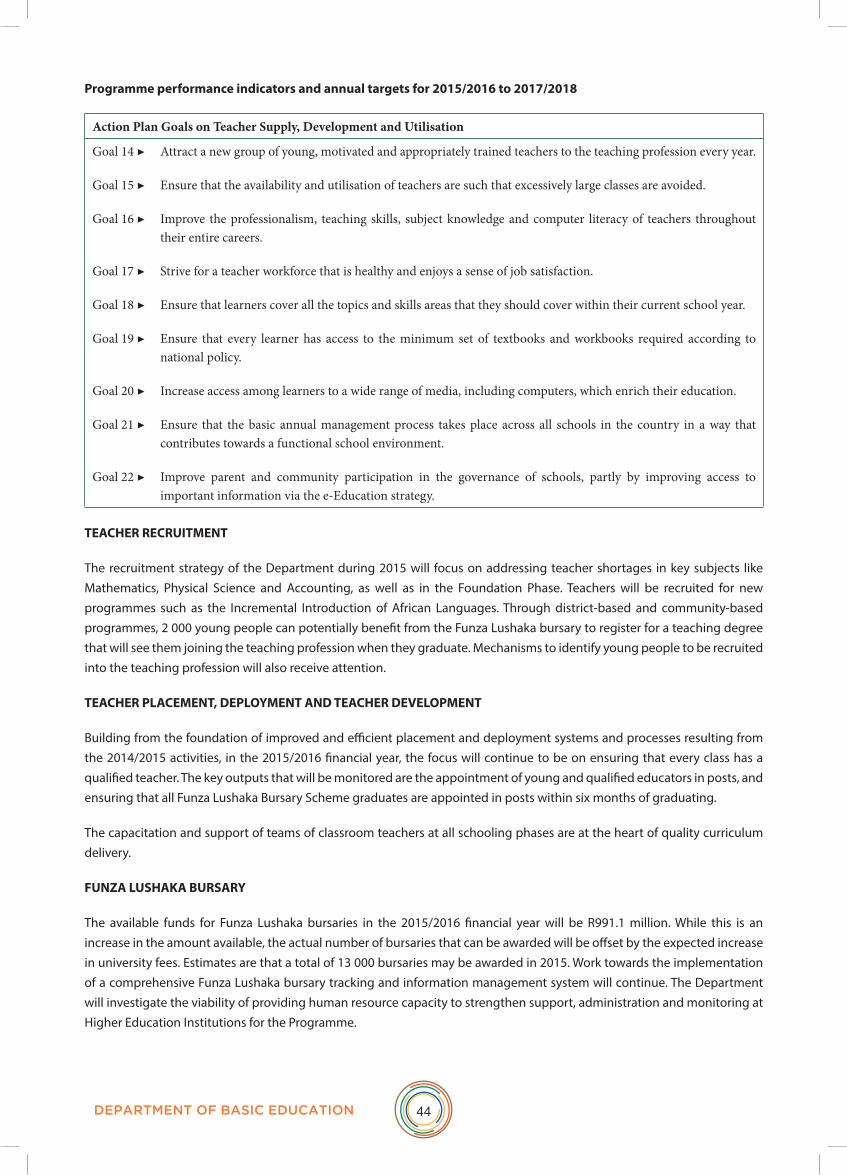
44DEPARTMENT OF BASIC EDUCATION
Programme performance indicators and annual targets for 2015/2016 to 2017/2018
Action Plan Goals on Teacher Supply, Development and Utilisation
Goal 14 ▶ Attract a new group of young, motivated and appropriately trained teachers to the teaching profession every year.
Goal 15 ▶ Ensure that the availability and utilisation of teachers are such that excessively large classes are avoided.
Goal 16 ▶ Improve the professionalism, teaching skills, subject knowledge and computer literacy of teachers throughout their entire careers.
Goal 17 ▶ Strive for a teacher workforce that is healthy and enjoys a sense of job satisfaction.
Goal 18 ▶ Ensure that learners cover all the topics and skills areas that they should cover within their current school year.
Goal 19 ▶ Ensure that every learner has access to the minimum set of textbooks and workbooks required according to national policy.
Goal 20 ▶ Increase access among learners to a wide range of media, including computers, which enrich their education.
Goal 21 ▶ Ensure that the basic annual management process takes place across all schools in the country in a way that contributes towards a functional school environment.
Goal 22 ▶ Improve parent and community participation in the governance of schools, partly by improving access to important information via the e-Education strategy.
TEACHER RECRUITMENT
The recruitment strategy of the Department during 2015 will focus on addressing teacher shortages in key subjects like Mathematics, Physical Science and Accounting, as well as in the Foundation Phase Teachers will be recruited for new programmes such as the Incremental Introduction of African Languages Through district-based and community-based programmes, 2 000 young people can potentially benefit from the Funza Lushaka bursary to register for a teaching degree that will see them joining the teaching profession when they graduate Mechanisms to identify young people to be recruited into the teaching profession will also receive attention
TEACHER PLACEMENT, DEPLOYMENT AND TEACHER DEVELOPMENT
Building from the foundation of improved and efficient placement and deployment systems and processes resulting from the 2014/2015 activities, in the 2015/2016 financial year, the focus will continue to be on ensuring that every class has a qualified teacher The key outputs that will be monitored are the appointment of young and qualified educators in posts, and ensuring that all Funza Lushaka Bursary Scheme graduates are appointed in posts within six months of graduating
The capacitation and support of teams of classroom teachers at all schooling phases are at the heart of quality curriculum delivery
FUNZA LUSHAKA BURSARY
The available funds for Funza Lushaka bursaries in the 2015/2016 financial year will be R991 1 million While this is an increase in the amount available, the actual number of bursaries that can be awarded will be offset by the expected increase in university fees Estimates are that a total of 13 000 bursaries may be awarded in 2015 Work towards the implementation of a comprehensive Funza Lushaka bursary tracking and information management system will continue The Department will investigate the viability of providing human resource capacity to strengthen support, administration and monitoring at Higher Education Institutions for the Programme

45 ANNUAL PERFORMANCE PLAN 2015-16
PERFORMANCE MANAGEMENT
Despite many positive changes since 1994, the legacy of low quality education in historically disadvantaged parts of the school system persists School performance is crucially linked to the leadership role of teachers and principals The National Development Plan (NDP) emphasises the importance of enhancing accountability in the education sector and specifically mentions the importance of mutual accountability between schools, districts and communities for overall improvement on key indicators that enhance teaching and learning in schools
Three key initiatives are in place to strengthen accountability and performance management systems These are:
a) The Integrated Quality Management System (IQMS) which provides for the evaluation of school-based educators, including School Management Team (SMTs) members (Collective Agreement No. 8 of 2003) The IQMS makes provision for the evaluation of principals by circuit managers – an area that has never really taken off effectively in the system It also allows for the identification of the professional development needs of teachers
b) The national policy (Government Gazette Vol. 433, No. 22512) on Whole School Evaluation (WSE) aims to evaluate the effectiveness of a school in terms of national goals as well as to increase the level of accountability within the education system This is intended to enable schools to improve the overall quality of the education they provide as well as to increase learner attainment
c) The Performance Management and Development Scheme (PMDS) provides for the evaluation of office-based educators (Collective Agreement No. 3 of 2002) The PMDS makes provision for the identification of the developmental needs of office-based educators (e g circuit managers and subject advisors), thereby preparing the way for their professional development in order to provide efficient and effective support to teachers
While the IQMS, WSE and PMDS have had various levels of success over the years, there is a need for the Collective Agreements and the policy to be reviewed in line with the changing education landscape in order to achieve the desired vision of the NDP Furthermore, the need for the effective and efficient utilisation of the available skills development budget in the provinces for the professional development of teachers is critical
While the above are being negotiated with labour partners, the existing performance evaluation systems (i e the IQMS, PMDS and WSE) will be used to improve educator and school performance PEDs will be provided with the required training and support in performance management Steps will be taken to enhance performance evaluation systems, operational processes and interventions that can augment accountability at all levels
SCHOOL GOVERNING BODY ELECTIONS
School Governing Body elections take place in March 2015 After the elections, elected members in all schools will be taken through induction programmes to make them understand the roles and responsibilities of governing bodies in public schools The induction of governors is followed by comprehensive training on all aspects of governance in schools The Department will develop and distribute guidelines on the capacity building programmes of SGBs The guidelines will be an indication to provincial education departments on what they need to train SGBs on
The Department has been inundated with calls to review the term of office of School Governing Bodies which currently is three years The recommendation is to increase the term of office to five years This would allow governing bodies to be provided with training that would enable them to perform their roles and responsibilities effectively over a longer period of time due to the increased continuity provided by the extended term

46DEPARTMENT OF BASIC EDUCATION
Stra
tegi
c Obj
ectiv
ePr
ogra
mm
e Per
form
ance
In
dica
tor
Stra
tegi
c Plan
Ta
rget
Audi
ted/
Actu
al pe
rform
ance
Estim
ated
pe
rform
ance
Me
dium
-term
targ
ets
2011
/1220
12/13
2013
/1420
14/15
2015
/1620
16/17
2017
/18
3.1 Im
prov
e the
re
crui
tmen
t and
pl
acem
ent o
f ed
ucat
ors i
n th
e ed
ucat
ion
syst
em.
3.1.1
Numb
er of
Fun
za Lu
shak
a bu
rsarie
s awa
rded
to st
uden
ts en
rolle
d for
initia
l teac
her
educ
ation
.
13 50
08 7
3311
500
14 50
013
500
13 00
012
500
12 50
0
3.1.2
Perce
ntage
of F
unza
Lush
aka
bursa
ry ho
lders
place
d with
in six
mon
ths of
their
grad
uatio
n.10
0%-
--
75%
85%
90%
100%
3.1.3
Numb
er of
quali
fied t
each
ers
aged
30 an
d belo
w , en
tering
the
publi
c ser
vice a
s tea
cher
s du
ring t
he fin
ancia
l yea
r.
12 00
07 7
448 2
276 7
628 0
008 6
009 2
0010
200
3.1.4
Perce
ntage
of pr
incipa
ls ap
point
ed ba
sed o
n co
mpete
ncy a
sses
smen
t pr
oces
ses.
100%
of
adve
rtised
posts
.-
--
-75
% of
ad
vertis
ed
posts
.
100%
of
adve
rtised
po
sts.
100%
of
adve
rtised
po
sts.
3.2 T
o im
prov
e the
ca
pacit
y of t
each
ers
thro
ugh
diag
nost
ic te
stin
g an
d th
e In
tegr
ated
Qua
lity
Mana
gem
ent s
yste
m.
3.2.1
Numb
er of
teac
hers
who h
ave
writte
n the
Self
-Diag
nosti
c As
sess
ments
for E
nglis
h Firs
t Ad
dition
al La
ngua
ge (E
FAL)
an
d Math
emati
cs.
EFAL
: 100
000
Maths
: 100
000
--
--
EFAL
: 20
000
Maths
: 20
000
EFAL
: 20
000
Maths
: 20
000
EFAL
: 20
000
Maths
: 20
000
3.3 T
o im
prov
e m
onito
ring
of sc
hool
ef
fect
ivene
ss an
d ac
coun
tabi
lity
thro
ugh
indi
vidua
l pe
rform
ance
and
scho
ol g
over
nanc
e.
3.3.1
Perce
ntage
of S
GBs t
hat
meet
minim
um cr
iteria
in
terms
of ef
fectiv
enes
s (in
samp
led sc
hools
).
70%
of sa
mpled
SG
Bs.
52%
of
samp
led
SGBs
.
55%
of
samp
led
SGBs
.
60%
of
samp
led
SGBs
.
70%
of
samp
led
SGBs
.
50%
of
samp
led
SGBs
.
70%
of
samp
led
SGBs
.
3.3.2
Numb
er of
publi
c sch
ools
supp
orted
by ex
terna
l mo
dera
tors t
o mon
itor t
he
utilis
ation
of fin
dings
of sc
hool
profi
les to
impr
ove l
earn
er
perfo
rman
ce.
24 00
0-
--
-6 0
006 0
006 0
00
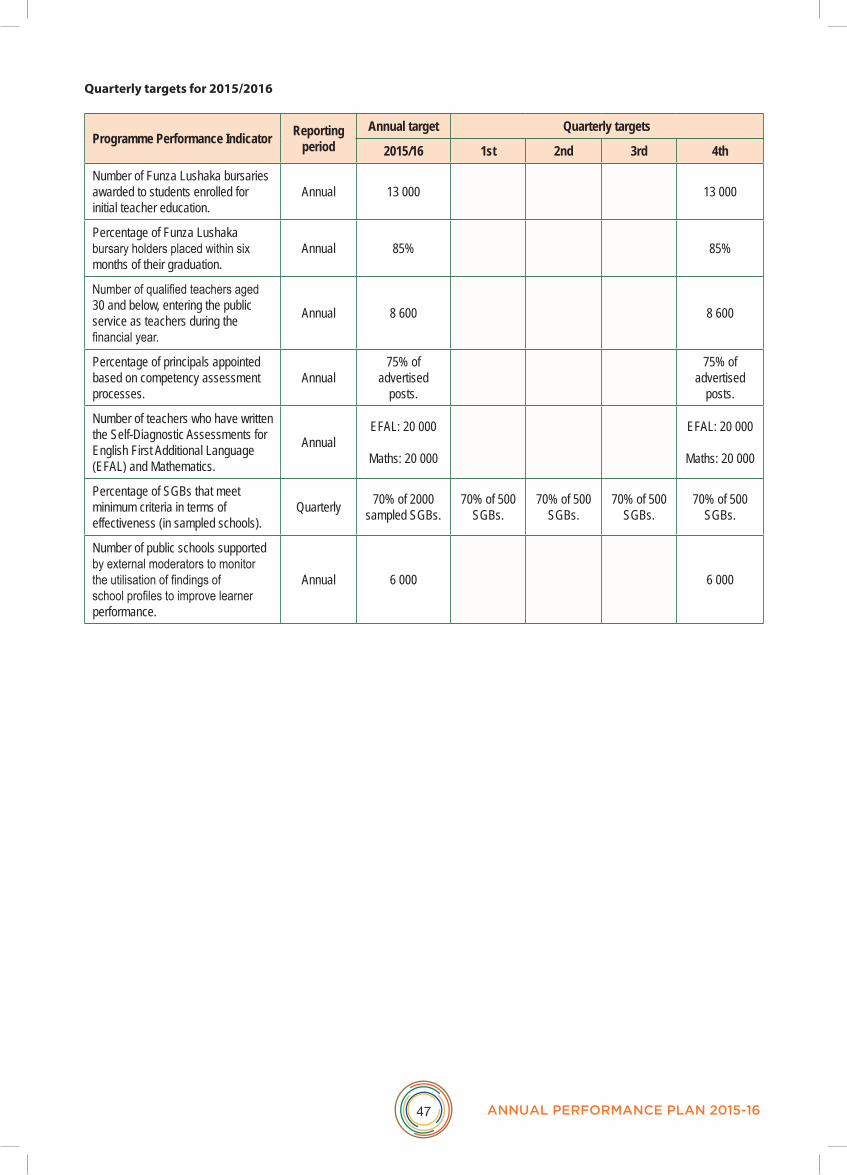
47 ANNUAL PERFORMANCE PLAN 2015-16
Quarterly targets for 2015/2016
Programme Performance Indicator Reporting period
Annual target Quarterly targets
2015/16 1st 2nd 3rd 4th
Number of Funza Lushaka bursaries awarded to students enrolled for initial teacher education.
Annual 13 000 13 000
Percentage of Funza Lushaka bursary holders placed within six months of their graduation.
Annual 85% 85%
Number of qualified teachers aged 30 and below, entering the public service as teachers during the financial year.
Annual 8 600 8 600
Percentage of principals appointed based on competency assessment processes.
Annual75% of
advertised posts.
75% of advertised
posts.
Number of teachers who have written the Self-Diagnostic Assessments for English First Additional Language (EFAL) and Mathematics.
AnnualEFAL: 20 000
Maths: 20 000
EFAL: 20 000
Maths: 20 000
Percentage of SGBs that meet minimum criteria in terms of effectiveness (in sampled schools).
Quarterly 70% of 2000 sampled SGBs.
70% of 500 SGBs.
70% of 500 SGBs.
70% of 500 SGBs.
70% of 500 SGBs.
Number of public schools supported by external moderators to monitor the utilisation of findings of school profiles to improve learner performance.
Annual 6 000 6 000

48DEPARTMENT OF BASIC EDUCATION
Reco
ncili
ng p
erfo
rman
ce ta
rget
s w
ith
the
Budg
et a
nd M
TEF
Expe
ndit
ure
esti
mat
es
Sub-
Prog
ram
me
Audi
ted
Outc
omes
R’00
0
Adju
sted
ap
prop
riatio
nR’
000
Medi
um-te
rm ex
pend
iture
estim
ate
R’00
0
2011
/1220
12/13
2013
/1420
14/15
2015
/1620
16/17
2017
/18
Prog
ramm
e Ma
nage
ment:
Teac
hers,
Edu
catio
n Hum
an R
esou
rces
and I
nstitu
tiona
l Dev
elopm
ent
3 013
2 486
686
1 909
1 9
51
2 076
2
203
Educ
ation
Hum
an R
esou
rces M
anag
emen
t55
735
61 96
451
011
277 7
91
142 6
44
80 32
2 85
051
Educ
ation
Hum
an R
esou
rces D
evelo
pmen
t48
9 275
759 7
6295
4 476
969 4
66
1 01
4 216
1 0
68 19
8 1 1
21 85
2
Curri
culum
and P
rofes
siona
l Dev
elopm
ent U
nit-
3 745
4 656
32 08
1 12
673
13 39
0 14
141
Total
548 0
2382
7 957
1 010
829
1 281
247
1 171
484
1 163
986
1 223
247
Econ
omic
class
ificati
on
Curre
nt pa
ymen
ts87
866
136 1
1111
5 587
107 4
8599
673
105 9
2411
2 282
Comp
ensa
tion o
f emp
loyee
s51
653
48 82
653
971
65 44
076
586
81 64
186
784
Good
s and
servi
ces o
f whic
h:36
213
87 28
561
616
42 04
523
087
24 28
325
498
Comm
unica
tion (
G&S)
415
320
1 183
400
516
552
591
Cons
ultan
ts an
d spe
cial s
ervic
es: b
usine
ss an
d adv
isory
servi
ces
233
2 294
22 10
7-
3 101
2 578
2 682
Cons
umab
le: st
ation
ery,
ing an
d off s
upp
4 308
8 443
4 544
2 902
1 714
1 998
2 125
Trav
el an
d sub
sisten
ce21
505
26 66
323
427
22 63
314
312
15 24
016
024
Tran
sfers
and s
ubsid
ies45
9 968
691 5
7889
4 998
1 173
222
1 071
308
1 057
536
1 110
413
Prov
inces
and M
unici
paliti
es-
--
213 0
0067
000
--
Depa
rtmen
tal ag
encie
s and
acco
unts
449 4
4067
1 912
893 8
6794
7 499
991 0
841 0
43 61
11 0
95 79
2
Fore
ign go
vern
ment
and i
ntern
ation
al or
ganis
ation
s10
455
11 89
4-
12 64
213
224
13 92
514
621
Unite
d Nati
ons E
duca
tiona
l, Scie
ntific
and C
ultur
al Or
ganis
ation
10 45
511
894
-12
642
13 22
413
925
14 62
1
Non-
profi
t insti
tution
s-
6 000
--
--
-
Hous
ehold
s73
1 772
1 131
--
--
Paym
ents
for ca
pital
asse
ts18
926
824
454
050
352
655
2

49 ANNUAL PERFORMANCE PLAN 2015-16
Sub-
Prog
ram
me
Audi
ted
Outc
omes
R’00
0
Adju
sted
ap
prop
riatio
nR’
000
Medi
um-te
rm ex
pend
iture
estim
ate
R’00
0
2011
/1220
12/13
2013
/1420
14/15
2015
/1620
16/17
2017
/18
Mach
inery
and e
quipm
ent
189
268
244
540
503
526
552
Paym
ents
for fin
ancia
l ass
ets-
--
--
--
Tota
l54
8 023
827 9
571 0
10 82
91 2
81 24
71 1
71 48
41 1
63 98
61 2
23 24
7
Curre
nt45
9 855
683 8
0689
3 867
960 1
411 0
04 30
81 0
57 53
61 1
10 41
3
Natio
nal S
tuden
t Fina
ncial
Aid
Sche
me44
9 400
671 9
1289
3 867
947 4
9999
1 084
1 043
611
1 095
792
Unite
d Nati
ons E
duca
tiona
l, Scie
ntific
and C
ultur
al Or
ganis
ation
10 45
511
894
-12
642
13 22
413
925
14 62
1
Hous
ehold
s93
1 172
1 131
--
--
Socia
l ben
efits
Curre
nt93
1 172
1 131
--
--

50DEPARTMENT OF BASIC EDUCATION
Performance and expenditure trends: Programme 3
The Department offers Funza Lushaka bursaries to prospective teachers to ensure an adequate supply of qualified recruits to the education system in specific areas, such as Mathematics, Science and Technology The bursaries are provided through the National Student Financial Aid Scheme (NSFAS) The number of bursaries awarded in 2014 dropped slightly from 14 512 in 2013 to 14 349 The costs of tuition fees and accommodation, including meals, at universities increase annually and this directly impacts on the number of bursaries that can be awarded In part this is offset by the increased funding received from National Treasury
The Medium-Term Expenditure Framework (MTEF) indicates that the available funds for disbursement to the NSFAS for Funza Lushaka bursaries in the 2015/2016 financial year will be R991 1 million While this is an increase in the amount available, the actual number of additional bursaries that can be awarded will be offset by the expected increase in university fees The current estimate is that a total of 13 000 bursaries will be awarded in 2015 The Funza Lushaka bursary scheme has been allocated a budget amounting to R3 1 billion over the MTEF period
The Integrated Quality Management System (IQMS) is a key initiative to strengthen accountability and performance management systems, and in particular the quality of education The IQMS provides for the evaluation of school-based educators including School Management Team members (Collective Agreement No 8 of 2003) The IQMS makes provision for the evaluation of principals by circuit managers, thereby entrenching accountability It also allows for the identification of the professional development needs of teachers
The IQMS has gradually expanded and strengthened since its inception in 2003 Its implementation has been closely monitored since the deployment of external IQMS moderators in 2008 In recent years, at least 8 000 schools were monitored annually on the implementation of the performance management system and support was provided to schools where necessary The percentage of educators whose performances were evaluated increased from 86% in 2010 to 96% in 2013
4.4. Programme 4: Planning, Information and Assessment
Programme Purpose: to promote education quality and effective service delivery in the basic education system through monitoring and evaluation, planning and assessment
Sub-programmes: Programme Management: Planning, Information and Assessment; Financial Planning, Information and Management Systems; National Assessment and Public Examinations; School Infrastructure; National Education Evaluation and Development Unit; and the Planning and Delivery Oversight Unit
Strategic objectives:
• Administer, monitor and report on all standardised national assessments
• Provide schools with basic infrastructure to contribute towards quality learning
• Strengthen the capacity of district offices to support schools
Programme performance indicators and annual targets for 2015/2016 to 2017/2018
Action Plan Goals on Physical and Financial Planning
Goal 23 ▶ Ensure that all schools are funded at least at the minimum per learner levels determined nationally and that funds are utilised transparently and effectively.
Goal 24 ▶ Ensure that the physical infrastructure and environment of every school inspire learners to want to come to school and learn, and teachers to come and teach.

51 ANNUAL PERFORMANCE PLAN 2015-16
The realisation of these goals is rooted in the work done within this programme in the core policy areas of:
a) Assessments;
b) School funding and infrastructure;
c) Education information systems; and
d) Programme management information systems
ANNUAL NATIONAL ASSESSMENT
The government of the South Africa has identified education as the top priority for providing a better life for all citizens The Education Sector Plan identifies annual national assessment (ANA) as the key source of information to be used in setting and tracking improvement targets for teaching and learning Since 2010, the results of these assessments have informed major interventions towards improving literacy and numeracy levels among all learners are Some of the interventions in response to the challenges that the ANA has highlighted are provision of workbooks for all learners in Grades R to 9, a focus on improving continuing professional development of teachers and support to schools to strengthen instructional management
Despite intensified focus on creating an environment that promotes teaching and learning of a high quality, there have not been significant improvements that match the investments made in the assessments The assessment results continue to indicate unacceptably low performance, especially in mathematics at the Senior Phase While there is still a need to track performance using rationalised assessment, focus in the next five years, will shift towards developing capacity for effective use of data to inform teaching and learning The DBE, working together with curriculum support personnel and subject advisors in the districts, will focus on providing assessment feedback in meaningful formats, providing support to teachers in various methods of using data to plan teaching strategies, and supply assessment exemplars that model high-quality testing, especially at the Senior Phase and in Grades 10–11 This does not in any way detract from the need to improve performance in the lower grades where the foundation for all learning is laid
NATIONAL SENIOR CERTIFICATE EXAMINATIONS
The National Senior Certificate and the Annual National Assessment (ANA) are vital in terms of measuring progress in achieving the targets outlined in the Action Plan to 2019: Towards the Realisation of Schooling 2030, and the National Development Plan The following three targets are directly measured through performance in the National Senior Certificate:
• Increase the number of Grade 12 learners who become eligible for a Bachelor’s programme at a university;
• Increase the number of Grade 12 learners who pass Mathematics; and
• Increase the number of learners who pass Physical Science
The national examination system has developed a high degree of stability given the continuous review and improvements of systems and processes over the past twenty years Substantial progress has been made in terms of the establishment and maintenance of a credible national examination system, founded on the following:
a) The development of a sound legislative framework that regulates the administration of the examinations across the nine Provincial Education Departments, and mandates the Department of Basic Education to set norms and standards and monitor the implementation
b) The setting of national standards through the setting of national question papers for all subjects by the Department of Basic Education (DBE), which are written by learners in all Provincial Education Departments This ensures that every learner in the country writes the same examination, and is therefore, assessed against a common yardstick

52DEPARTMENT OF BASIC EDUCATION
c) The development of a rigorous monitoring system that ensures that all PEDs comply with the policy and regulations relating to the administration of exams The monitoring system has over the years been extended to include an intensive system’s audit that covers the entire examination cycle
d) Strong collaboration between the DBE and the nine Provincial Education Departments, through the National Examinations and Assessment Committee (NEAC), which gives effect to the principle of cooperative governance enshrined in the Constitution The NEAC is not only responsible for policy proposals, but also for the establishment of structures to ensure that the whole examination process is successfully conducted
e) The establishment of national and provincial moderation systems for School-Based Assessments (SBA), which includes Life Orientation This has contributed to the improvement of the quality of School-Based Assessment although there is still much work that needs to be done in this area
f ) The provision of assessment exemplars that provide educators and subject advisors with samples of questions and tests pitched at the appropriate level, which has assisted in the setting of benchmarks for school assessment This has also been extended to Common Assessment Tasks (CATs) in Life Orientation and the provision of exemplars of learner evidence relating to learner responses to examination questions
g) The establishment of the Quality Assurance Council, Umalusi, that takes full and final responsibility for the quality assurance of the NSC examination and School-Based Assessment This allows Umalusi to issue a common National Certificate, if it is satisfied that the examinations and the assessments have complied with the national standard
h) To promote the international comparability of the NSC question papers, the DBE embarked on an international evaluation of question papers in 2007, 2011 and 2013, in which question papers for ten subjects were evaluated by three reputable assessment bodies, namely, Cambridge International Examinations (CIE), the Scottish Qualification Authority (SQA) and the Board of Studies New South Wales (BSNSW)
EDUCATIONAL MANAGEMENT INFORMATION SYSTEMS (EMIS)
The Department develops and maintains an Integrated Education Management Information System (EMIS) based on individual learner records through the implementation of business application and support; data management and quality assurance; reporting; publication and information dissemination; business analysis; policy monitoring and government partnerships; and management of EMIS projects EMIS responsibilities include:
• Publication of the annual Education Statistics in South Africa report, and the preliminary release of annual 10th School Day learner data (School Realities)
• Publishing the Register of Schools (master list) updated four times per annum and posted on the internet as stipulated in the standard
• The development and maintenance of a national Education Management Information System for the Schools (Ordinary and SNE) and ECD
• Development and provision of education management advice to provincial education departments on information systems
• Development of a strategy, and facilitation of capacity development and training on the Education Management Information System
• Facilitation of the development of national policy and guidelines on education management information systems
• Processing and disseminating education and training data
• Providing technical assistance for monitoring the performance of the education and training system

53 ANNUAL PERFORMANCE PLAN 2015-16
FINANCIAL PLANNING, ECONOMIC ANALYSIS AND PROVINCIAL BUDGET MONITORING
The Department will ensure the effective monitoring of provincial education departments’ budgets and spending in line with their Annual Performance Plans and Strategic Plans and will ensure that education norms and standards for funding policies are developed and monitored
• Reports on analysis of PEDs’ financial performance are produced
• Monitoring reports on the implementation of funding policies are produced
• Education funding policy is developed
PHYSICAL PLANNING
During 2013 the Department released the Regulations relating to Norms and Standards for Public Schools Infrastructure This puts the country on a much better footing to deal with the complex matter of standards and targeting in the improvement of school infrastructure The regulations envisage four key goals:
• By 2016 all schools should meet minimum standards with respect to water, toilets, electricity and the materials used for school buildings
• By 2020 all schools should have at least a minimum number of classrooms, relative to enrolments, as well as electronic connectivity and perimeter fencing
• By 2023 all schools should have the required libraries and laboratories
• By 2030 all remaining standards should have been met ASIDI schools comply with all standards and thus serve as models and the testing ground for the policy Part of the challenge in moving forward is to sustain the momentum of current initiatives Going forward the Department will emphasise maintenance, reporting and the introduction of more innovative approaches, to achieve greater success in the delivery of school infrastructure
ASIDI
The main objectives of ASIDI are to eradicate the Basic Safety Norms backlog in schools without water, sanitation and electricity and to replace those schools constructed from inappropriate material, including mud schools The Schools Infrastructure Backlog Grant (SIBG) funds the ASIDI programme
The ASIDI targets stated below were planned for implementation in four financial years:
• Eradication and replacement of 510 inappropriate schools throughout the country
• 1 120 schools provided with water and sanitation
• 741 schools provided with sanitation
• 916 schools provided with electricity
The overall ASIDI objective over the MTEF is to address the schools that need to be brought to basic safety functionality levels by 2016 and to replace all mud and other inappropriate school structures by 2016 It is envisaged that all the basic services projects will have been completed by the end of 2014/2015 financial year
Inappropriate structures include mud schools, ‘plankie’ schools, corrugated sheeting structures and prefabricated schools which are no longer fit-for-purpose New schools within the ASIDI programme are to adhere to the ‘Guidelines relating to planning for public school infrastructure’ as far as practically possible Currently there are 510 inappropriate structure projects nationally of which 74 were completed by July 2014 and others were at various stages of implementation

54DEPARTMENT OF BASIC EDUCATION
Through the ASIDI programme the Department is providing water to rural areas of South Africa that are not equipped with adequate water supplies to meet the schools’ requirements In those instances where schools have access to municipal supply, complete water reticulation and municipal connections are secured In those areas where there is sufficient ground water, boreholes are provided In schools where there is no ground water, facilities are created for rainwater harvesting and also to accommodate water delivered from municipalities where it is available By the end of July 2014, 224 schools have been provided with water 788 schools are at various stages of procurement of contractors and construction of the works
The Department has also provided different forms of sanitation to schools, which vary from water-borne sewerage systems where sufficient water is available, to enviro-loos as well as Ventilated Improved Pit (VIP) Latrines The supply of sanitation is in accordance with the requirements of the guidelines for public school infrastructure By the end of July 2014, 257 schools had been provided with sanitation 283 schools are at various stages of procurement of contractors and construction
The Department is supplying electricity connections to all schools identified for the ASIDI programme that do not have access to electricity supplies As far as is possible schools are connected to the electrical grid through Eskom In those instances where electricity is not available, solar electricity is provided By the end of July 2014, 253 schools had been provided with electrification and 271 schools were at various stages of design and procurement of contractors
DISTRICTS
The Department will continue to coordinate, monitor and support education districts by strengthening the regulatory environment and the capacity of district offices A key initiatives introduced by the programme that will require attention in 2015/2016 is the release and implementation of the norms and standards for districts

55 ANNUAL PERFORMANCE PLAN 2015-16
Stra
tegic
Objec
tive
Prog
ram
me
Perfo
rman
ce In
dicato
rSt
rate
gic P
lan
Targ
etAu
dite
d/Ac
tual
perfo
rman
ceEs
timat
ed
perfo
rman
ceMe
dium
-term
targ
ets
2011
/1220
12/13
2013
/1420
14/15
2015
/1620
16/17
2017
/18
4.1 A
dmini
ster,
mon
itor a
nd
repo
rt on
all
stand
ardis
ed
natio
nal
asse
ssm
ents.
4.1.1
Valid
and r
eliab
le da
ta on
learn
er
result
s on
perfo
rman
ce in
AN
A.
• Na
tiona
l ANA
re
port
• Di
agno
stic
repo
rt•
Annu
al AN
A dis
trict r
epor
t
-•
Natio
nal
ANA
repo
rt •
Diag
nosti
c re
port
• Na
tiona
l ANA
re
port
• Di
agno
stic
repo
rt
• Na
tiona
l ANA
re
port
• Di
agno
stic
repo
rt
• Na
tiona
l ANA
re
port
• Di
agno
stic
repo
rt •
Ann
ual A
NA
distric
t rep
ort
• Na
tiona
l ANA
re
port
• Di
agno
stic
repo
rt
• An
nual
ANA
distric
t rep
ort
• Na
tiona
l ANA
re
port
• Di
agno
stic
repo
rt•
Annu
al AN
A dis
trict r
epor
t
4.1.2
Valid
and r
eliab
le da
ta on
learn
er
result
s on
perfo
rman
ce in
NS
C.
4 Nati
onal
Exam
Re
ports
on le
arne
r pe
rform
ance
in
Grad
e 12:
a. Te
chnic
al Re
port;
b.
Detai
led S
choo
ls sta
tistic
s Rep
ort;
c. Di
agno
stic
repo
rt in
selec
ted
subje
cts; a
ndd.
Repo
rt on
sc
hools
stati
stics
ind
icatin
g 3-ye
ar
perfo
rman
ce
in se
lected
su
bjects
.
3 Nati
onal
Exam
Rep
orts
on le
arne
r pe
rform
ance
in
Grad
e 12:
a. Te
chnic
al Re
port;
b.
Detai
led
Scho
ols
statis
tics
Repo
rt;
c. Di
agno
stic
repo
rt in
selec
ted
subje
cts;
and
3 Nati
onal
Exam
Re
ports
on
lear
ner
perfo
rman
ce
in Gr
ade 1
2: a.
Tech
nical
Repo
rt;
b. De
tailed
Sc
hools
sta
tistic
s Re
port;
c.
Diag
nosti
c re
port
in se
lected
su
bjects
; an
d
4 Nati
onal
Exam
Re
ports
on le
arne
r pe
rform
ance
in
Grad
e 12:
a. Te
chnic
al Re
port;
b.
Detai
led S
choo
ls sta
tistic
s Rep
ort;
c. Di
agno
stic
repo
rt in
selec
ted
subje
cts; a
ndd.
Repo
rt on
sc
hools
stati
stics
ind
icatin
g 3-ye
ar
perfo
rman
ce
in se
lected
su
bjects
.
4 Nati
onal
Exam
Re
ports
on le
arne
r pe
rform
ance
in
Grad
e 12:
a. Te
chnic
al Re
port;
b.
Detai
led S
choo
ls sta
tistic
s Rep
ort;
c. Di
agno
stic
repo
rt in
selec
ted
subje
cts; a
ndd.
Repo
rt on
sc
hools
stati
stics
ind
icatin
g 3-ye
ar
perfo
rman
ce
in se
lected
su
bjects
.
4 Nati
onal
Exam
Re
ports
on le
arne
r pe
rform
ance
in
Grad
e 12:
a. Te
chnic
al Re
port;
b.
Detai
led S
choo
ls sta
tistic
s Rep
ort;
c. Di
agno
stic
repo
rt in
selec
ted
subje
cts; a
ndd.
Repo
rt on
sc
hools
stati
stics
ind
icatin
g 3-ye
ar
perfo
rman
ce
in se
lected
su
bjects
.
4 Nati
onal
Exam
Re
ports
on le
arne
r pe
rform
ance
in
Grad
e 12:
a. Te
chnic
al Re
port;
b.
Detai
led S
choo
ls sta
tistic
s Rep
ort;
c. Di
agno
stic
repo
rt in
selec
ted
subje
cts; a
ndd.
Repo
rt on
sc
hools
stati
stics
ind
icatin
g 3-ye
ar
perfo
rman
ce
in se
lected
su
bjects
.
4 Nati
onal
Exam
Re
ports
on le
arner
pe
rform
ance
in
Grad
e 12:
a. Te
chnic
al Re
port;
b. De
tailed
Sch
ools
statis
tics R
eport
; c.
Diag
nosti
c rep
ort
in se
lected
su
bjects
; and
d. Re
port o
n sc
hools
stati
stics
ind
icatin
g 3-ye
ar
perfo
rman
ce
in se
lected
su
bjects
.
4.2 P
rovid
e sc
hools
wi
th ba
sic
infra
struc
ture
to
cont
ribut
e to
ward
s qu
ality
lea
rning
.
4.2.1
Perce
ntage
of
scho
ols pr
ovide
d wi
th sa
nitati
on
faciliti
es.
100%
--
--
99%
100%
100%
4.2.2
Perce
ntage
of
scho
ols pr
ovide
d wi
th wa
ter.
100%
--
--
98%
100%
100%
4.2.3
Perce
ntage
of
scho
ols pr
ovide
d wi
th ele
ctrici
ty.10
0%-
--
-96
%10
0%10
0%

56DEPARTMENT OF BASIC EDUCATION
Stra
tegic
Objec
tive
Prog
ram
me
Perfo
rman
ce In
dicato
rSt
rate
gic P
lan
Targ
etAu
dite
d/Ac
tual
perfo
rman
ceEs
timat
ed
perfo
rman
ceMe
dium
-term
targ
ets
2011
/1220
12/13
2013
/1420
14/15
2015
/1620
16/17
2017
/18
4.3 S
treng
then
th
e utili
satio
n of
info
rmati
on
syste
ms
avail
able
in
scho
ols fo
r m
anag
emen
t pu
rpos
es.
4.3.1
Perce
ntage
of
publi
c sch
ools
that u
se
the sc
hools
ad
minis
tratio
n an
d man
agem
ent
syste
ms to
ele
ctron
ically
pro
vide d
ata
to the
natio
nal
learne
r trac
king
syste
m.
100%
--
--
60%
70%
85%
4.4 S
treng
then
th
e cap
acity
of
distr
ict
offic
es to
su
ppor
t sc
hools
.
4.4.1
Numb
er of
officia
ls fro
m dis
tricts
that
achie
ved l
ess
than 6
5% in
the
NSC
partic
ipatin
g in
a men
toring
pro
gramm
e.
10-
--
3024
1815
4.4.2
Perce
ntage
of
princ
ipals
rating
the
supp
ort of
dis
trict o
ffices
as
satis
factor
y.
75%
37 %
45 %
50%
55 %
60 %
65 %
70 %
4.4.3
Perce
ntage
of
distric
t man
agers
as
sess
ed ag
ainst
deve
loped
cri
teria.
95%
--
--
65%
75%
85%

57 ANNUAL PERFORMANCE PLAN 2015-16
Quarterly targets for 2015/2016
Programme Performance Indicator
Reporting period Annual target 2015/16
Quarterly targets
1st 2nd 3rd 4th
Valid and reliable data on learner results of performance in ANA.
Annually• National ANA report • Diagnostic report • Annual ANA district report
• National ANA report• Diagnostic report • Annual ANA district report
Valid and reliable data on learner results of performance in NSC.
Annually
4 National Exam Reports on learner performance in Grade 12: a. Technical Report,b. Detailed Schools statistics
Report; c. Diagnostic report in
selected subjects; andd. Report on schools
statistics indicating 3-year performance in selected subjects.
4 National Exam Reports on learner performance in Grade 12: a. Technical Report,b. Detailed Schools statistics
Report; c. Diagnostic report in
selected subjects; andd. Report on schools
statistics indicating 3-year performance in selected subjects.
Percentage of schools provided with sanitation facilities.
Annually 99% 99%
Percentage of schools provided with water. Annually 98% 98%
Percentage of schools provided with electricity.
Annually 96% 96%
Percentage of public schools that use the schools administration and management systems to electronically provide data to the national learner tracking system
Quarterly 60% 60% 60% 60% 60%
Number of officials from districts that achieved less than 65% in the NSC participating in a mentoring programme.
Annually 24 24
Percentage of principals rating the support of district offices as satisfactory.
Annually 60% 60%
Percentage of district managers assessed against developed criteria.
Annually 65% 65%

58DEPARTMENT OF BASIC EDUCATION
Reco
ncili
ng p
erfo
rman
ce ta
rget
s w
ith
the
Budg
et a
nd M
TEF
Expe
ndit
ure
esti
mat
es
Sub-
Prog
ram
me
Audi
ted
Outc
omes
R’
000
Adju
sted
ap
prop
riatio
n R’
000
Medi
um-te
rm ex
pend
iture
estim
ate
R’00
0
2011
/1220
12/13
2013
/1420
14/15
2015
/2016
2016
/2017
2017
/18
Prog
ramm
e Man
agem
ent: P
lannin
g Info
rmati
on an
d As
sess
ment
788
2 254
2 576
2 981
2 615
2 784
2 955
Infor
matio
n Man
agem
ent S
ystem
s38
224
34 98
025
589
37 34
441
329
43 75
446
192
Scho
ol Inf
rastr
uctur
e5 3
95 15
26 6
68 88
38 0
48 68
19 8
74 84
311
572 1
5012
156 8
6212
959 2
88
Natio
nal A
sses
smen
ts an
d Pub
lic E
xami
natio
n12
3 094
159 8
2029
6 063
394 6
0341
6 157
438 9
9046
1 771
Natio
nal E
duca
tion E
valua
tion a
nd D
evelo
pmen
t Unit
6 601
17 08
421
100
21 21
314
939
15 83
016
727
Plan
ning a
nd D
elive
ry Ov
ersig
ht Un
it10
963
14 85
541
600
89 38
582
548
96 10
321
9 670
Tota
l5 5
74 82
26 8
97 87
68 4
35 60
910
420 3
6912
129 7
3812
754 3
2313
706 6
03
Econ
omic
Clas
sifica
tion
Curre
nt P
aym
ents
167 5
6319
2 466
308 3
4640
1 623
413 8
0249
3 607
465 0
62
Comp
ensa
tion o
f emp
loyee
s71
611
86 44
994
572
112 5
6211
6 504
124 3
6713
2 453
Good
s and
Ser
vices
of w
hich:
95 95
210
6 017
213 7
7428
9 061
297 2
9831
5 240
332 6
09
Comp
uter s
ervic
es31
731
29 41
641
045
47 44
5 37
726
39 28
141
078
Cons
ultan
ts an
d pro
fessio
nal s
ervic
es: b
usine
ss an
d ad
visor
y ser
vices
4 465
874
2 513
35 30
57 8
647 1
356 0
48
Cons
umab
le: st
ation
ery,
ing an
d off s
upp
1 267
2 180
224 8
2511
7 804
17
1 912
181 1
5319
0 250
Trav
el an
d sub
sisten
ce40
484
50 09
278
389
60 28
351
213
55 21
759
855
Tran
sfer
s and
subs
idies
5 329
561
5 844
913
6 675
313
7 503
059
9 690
260
9 964
490
10 64
9 400
Prov
inces
and m
unici
paliti
es5 3
11 09
15 8
02 39
06 6
43 26
77 3
26 58
49 5
17 55
59 7
73 69
210
330 5
62
Depa
rtmen
tal ag
encie
s and
acco
unts
18 39
142
330
97 66
210
7 354
112 7
0511
8 678
124 6
12
Hous
ehold
s79
193
384
121
--
-
Paym
ents
for c
apita
l ass
ets
77 69
886
0 497
1 370
950
2 515
687
2 025
676
2 350
226
2 592
141
Build
ing an
d othe
r fixe
d stru
cture
76 08
485
9 658
1 370
124
2 513
627
2 024
310
2 348
744
2 590
590

59 ANNUAL PERFORMANCE PLAN 2015-16
Sub-
Prog
ram
me
Audi
ted
Outc
omes
R’
000
Adju
sted
ap
prop
riatio
n R’
000
Medi
um-te
rm ex
pend
iture
estim
ate
R’00
0
2011
/1220
12/13
2013
/1420
14/15
2015
/2016
2016
/2017
2017
/18
Mach
inery
and e
quipm
ent
1 614
869
812
2 060
1 366
1 482
1 551
Softw
are a
nd ot
her in
tangib
le as
sets
--
14-
--
-
Paym
ents
for fin
ancia
l ass
ets-
--
--
-
Tota
l5 5
74 82
26 8
97 87
68 4
35 60
910
420 3
6912
129 7
3812
754 3
2313
706 6
03
Umalu
si Co
uncil
for Q
uality
Ass
uran
ce an
d Fur
ther
Educ
ation
and T
raini
ngHu
man R
esou
rces R
esea
rch C
ounc
il
18 39
142
330
97 66
210
7 354
112 7
0511
8 678
124 6
12
Non
-pro
fit in
stit
utio
ns
Curre
nt
--
15 00
069
000
60 00
072
120
194 2
26
Natio
nal In
itiativ
e to i
mpro
ve le
arnin
g outc
omes
--
15 00
069
000
60 00
072
120
194 2
26
Prov
inci
al R
even
ue F
unds
Capi
tal
5 311
091
5 802
390
6 643
267
7 326
584
9 255
506
9 718
692
10 33
0 562
Educ
ation
Infra
struc
ture G
rant
5 311
091
5 802
390
6 643
267
7 326
584
9 517
555
9 773
692
10 33
0 562

60DEPARTMENT OF BASIC EDUCATION
Performance and expenditure trends: Programme 4
The spending focus over the medium term will be on the delivery of school infrastructure to meet the minimum basic school infrastructure norms and standards as laid out by government by 2016/2017 The bulk of expenditure in this programme is therefore on the Education Infrastructure Grant and School Infrastructure Backlogs Grant in the School Infrastructure sub-programme A significant amount is also spent in the National Assessments and Public Examinations sub-programme The spending in the rest of the programme is mainly on developing systems and procedures to support and maintain the integrated education management systems over the MTEF period through the Financial Planning, Information and Management Systems sub--programme
The increased spending on travel and subsistence over the medium term is for the monitoring and oversight of the delivery of school infrastructure in the School Infrastructure sub-programme Spending on this item also grew due to increased activity in the National Education Evaluation Unit sub-programme
With regard to infrastructure funding, R29 6 billion is allocated to this grant over the MTEF period through the Education Infrastructure Grant, and the Schools Infrastructure Backlogs Grant These grants account for the bulk of spending increases over the medium term, particularly spending in the Planning, Information and Assessment sub-programme to further accelerate the delivery and improvement of school infrastructure
The Education Infrastructure Grant is used to supplement the infrastructure programme in provinces to accelerate construction, maintenance, upgrading and rehabilitation of new and existing school infrastructure The grant is also used to enhance capacity to deliver infrastructure projects in education
The School Infrastructure Backlogs Grant, which was introduced in 2011/2012, has been allocated R7 4 billion over the MTEF period This grant aims to eradicate and replace schools built with inappropriate material and unsafe structures It also ensures that all schools have access to basic services such as water, sanitation and electricity Of the 150 school targeted through the School Infrastructure Backlogs indirect grant, 92 schools were rolled out To date 82 schools have been completed, 270 schools received water, 275 schools received electricity and 289 schools received basic sanitation services for the first time
The National Assessment and Public Examinations sub-programme promotes and administers national school assessments in Grades 1 to 6 and Grade 9, and public examinations in Grade 12, by setting and moderating all examination papers; moderating the Grade 12 Life Orientation school-based assessment at provincial and national levels; monitoring the examination writing processes in all provinces; and overseeing the Annual National Assessments
The spending focus of this sub-programme is to set, print and moderate question papers for the National Senior Certificate, Senior Certificate examinations and the Annual National Assessments, which accounts for the high proportion of expenditure on travel and subsistence for examiners and moderators, as well as on stationery and printing The increase in the transfer to the Umalusi Council for Quality Assurance in General and Further Education and Training, reflected under transfers and subsidies to departmental agencies and accounts, is to ensure that the entity is fully funded to deliver its mandate
4.5. Programme 5: Educational Enrichment Services
Programme Purpose: to develop policies and programmes to improve the quality of learning in schools
Sub-programmes are: Programme Management: Educational Enrichment Services; Care and Support in Schools; and Partnership in Education
Strategic objectives:
• To promote co-curricular activities, social cohesion programmes and safe school environments for holistic development of learners to enhance their learning experience and maximise their performance
• To address intrinsic (physical, mental and health-related) and societal (poverty, violence, alcohol and drug use) barriers within a larger collaborative and multifaceted response towards the multiple barriers to learning faced by vulnerable children

61 ANNUAL PERFORMANCE PLAN 2015-16
Programme performance indicators and annual targets for 2015/2016 to 2017/2018
Action Plan Goal on Learner Well-Being
Goal 25 ▶ Use schools as vehicles for promoting access to a range of public services among learners in areas such as health, poverty alleviation, psychosocial support, sport and culture.
LEARNER WELL-BEING
There are various aspects of learner well-being, including psychosocial well-being The Department of Basic Education is strengthening its work on psychosocial support to ensure that learners who experience psychological, emotional and social problems are supported The work on psychosocial support focuses on the following:
Developing the Psycho-Social Strategy (PSS); strengthening the capacity of provinces, districts and schools to institutionalise PSS; strengthening collaborative relations with stakeholders to ensure an effective referral system; monitoring and evaluation of strategies and programmes
The focus for the financial year 2015/2016 will be on:
1 Development of a strategy on psychosocial support for learners and educators: Conduct literature review on PSS to identify evidence-based approaches to inform the strategy and strengthen programmes for learners and educators in the schooling system
2 Printing information, education and communication pamphlets on identifying vulnerable learners
3 Develop pamphlets for educators to raise awareness on stress and burnout among educators
4 Promote referral of learners for psychosocial services, with a focus on Vhembe and Waterberg Districts Co-brand the child services directory with the Department of Social Development (DSD) and compile data on specialists in all provinces
5 Host two meetings of the national Technical Reference Group (TRG) on PSS in basic education
6 Develop interdepartmental partnerships for the development of strategies to improve the utilisation of libraries
SAFETY
The Department is committed to preventing, managing and responding to safety incidents, and in so doing, creating a safe and supportive learning and teaching environment – a learning environment that is characterised not only by good quality education, but that is also safe and free from insecurity and threats of violence Numerous aspects interact when it comes to ensuring a safe and supportive school environment that enables children to develop their full potential to become happy and productive citizens in South Africa
School safety programmes are aligned to local, specific and targeted interventions based on locally-identified needs They include safety protocols that are expected at a school, district and provincial level; standardised data collection and built-in monitoring tools; as well as standardised indicators of which data should be collected and reported on Programmes include addressing bullying in schools, implementing the DBE-SAPS Protocols, addressing gender-based violence in schools and implementing the national strategy for the management of drug and substance abuse

62DEPARTMENT OF BASIC EDUCATION
SCHOOL SPORT AND ENRCHMENT
School sport is integral to the holistic development of the learner and also a critical catalyst in fostering social cohesion, team building and youth development, as well as individual and group discipline Physical activity and sport advance good health and strengthen the child’s physical and social development Sport promotes and actions many of the values which underpin a modern democracy – those of fairness, equality, respect and compliance – all those beliefs, values and behaviours that make up healthy communities and responsible citizenry Participation in school sports and school sport leagues is an important vehicle to achieving our goals
The exploration of knowledge sources through libraries is a key mechanism for aiding literacy development More effective and inclusive utilisation of libraries and associated resources and public-private partnerships will allow the Department to encourage self-driven literacy development where libraries exist and the basis of creating awareness that will form the first critical step for the longer term strategy
Enrichment programmes contribute to reducing learner vulnerability and also provide opportunities in the otherwise crowded school day for creative and innovative ways to enhance and extend learning School enrichment programmes can reap a host of positive benefits in a number of interrelated outcome areas – academic, social-emotional, prevention, and health and wellness The Department is implementing the following enrichment programmes: South African School Choral Eisteddfod, the National Spelling Bee and Reading Clubs These programmes promote literacy, arts and culture through education enrichment
SOCIAL COHESION
Since 1994, South Africa has faced particular challenges relating to the building of a peaceful democracy, watched closely by the rest of the world The apartheid past was characterised by racial intolerance, state-sponsored political violence and mass resistance The current democratic government has attempted to address transformation through changes to legislation, redress and fundamental shifts in the education system The education system bears a particular responsibility in building a new peace-loving society, with a shared sense of national identity and greater social cohesion
The Department is focusing on the need to engage young people on the issues of values in society, and how these values form the basis for harmony, peace and well-being of the nation The Department has focused significant attention on strengthening social cohesion, promoting public history, the values of the constitution and a human rights culture in schools

63 ANNUAL PERFORMANCE PLAN 2015-16
Stra
tegi
c Ob
jectiv
ePr
ogra
mm
e Per
form
ance
Indi
cato
rSt
rate
gic P
lan
Targ
etAu
dite
d/Ac
tual
perfo
rman
ceEs
timat
ed
perfo
rman
ceMe
dium
-term
targ
ets
2011
/1220
12/13
2013
/1420
14/15
2015
/1620
16/17
2017
/18
5.1 Im
plem
ent
socia
l co
hesio
n an
d lea
rner
we
ll bein
g pr
ogra
mm
es.
5.1.1
Numb
er of
educ
ators,
offic
ials
and l
earn
ers p
artic
ipatin
g in
DBE-
orga
nised
activ
ities
on so
cial c
ohes
ion, n
ation
bu
ilding
, citiz
ensh
ip, rig
hts
& re
spon
sibilit
ies an
d co
nstitu
tiona
l valu
es.
20 50
0-
--
-5 0
006 0
007 0
00
5.1.2
Numb
er of
scho
ols th
at pr
ovide
lea
rner
s with
nutrit
ious m
eals.
19 80
0*8
850 2
08*9
159 7
73*8
827 4
1919
800
19 80
019
800
19 80
0
*The
indi
cato
r was
pre
viou
sly
the
num
ber o
f lea
rner
s

64DEPARTMENT OF BASIC EDUCATION
Quarterly targets for 2015/2016
Programme Performance Indicator
Reporting period
Annual target
2015/16
Quarterly targets
1st 2nd 3rd 4th
Number of educators, officials and learners participating in DBE-organised activities on social cohesion, nation building, citizenship, rights & responsibilities and constitutional values.
Annual 5 000 5 000
Number of schools that provide with nutritious meals. Quarterly 19 800 19 800 19 800 19 800 19 800

65 ANNUAL PERFORMANCE PLAN 2015-16
Reco
ncili
ng p
erfo
rman
ce ta
rget
s w
ith
the
Budg
et a
nd M
TEF
Expe
ndit
ure
esti
mat
es
Sub-
Prog
ram
me
Audi
ted
Outc
omes
R’00
0
Adju
sted
ap
prop
riatio
nR’
000
Medi
um-te
rm ex
pend
iture
estim
ate
R’00
0
2011
/1220
12/13
2013
/1420
14/15
2015
/1620
16/17
2017
/18
Prog
ramm
e Man
agem
ent: E
duca
tiona
l En
richm
ent S
ervic
es3 5
253 0
233 2
182 6
752 8
223 0
033 1
88
Partn
ersh
ip in
Educ
ation
19 85
517
579
9 867
22 93
8 23
087
24 50
525
934
Care
and S
uppo
rt in
Scho
ols4 7
85 79
05 1
30 10
05 2
03 29
95 7
15 26
95 9
48 54
76 2
62 19
16 5
78 46
4
Gran
t Imple
menta
tion,
Monit
oring
and R
epor
ting
--
512 1
80-
-
Tota
l4 8
09 17
05 1
50 70
25 7
28 56
45 7
40 88
25 9
74 45
66 2
89 69
96 6
07 58
6
Econ
omic
class
ifica
tion
Curre
nt pa
ymen
ts38
998
41 23
044
687
47 85
549
385
52 47
655
585
Comp
ensa
tion o
f emp
loyee
s27
180
26 67
133
230
34 18
135
041
37 35
439
707
Good
s and
servi
ces o
f whic
h:11
818
14 59
911
457
13 67
4 14
344
15 12
215
878
Asse
ts les
s tha
n the
capit
alisa
tion t
hres
hold
6320
3751
946
5563
Agen
cy an
d Sup
port/
outso
urce
d ser
vices
730
2 248
179
980
220
312
325
Cons
umab
le: st
ation
ery,
ing an
d off s
upp
1 233
4 200
1 218
2 452
1 981
1 664
1 703
Trav
el an
d sub
sisten
ce6 6
946 3
206 7
765 2
916 8
297 2
907 6
34
Tran
sfers
and s
ubsid
ies4 7
69 86
55 1
09 50
35 6
83 29
65 6
92 75
75 9
24 80
06 2
36 91
96 5
51 68
2
Prov
inces
and m
unici
paliti
es4 7
68 21
95 1
09 14
15 6
83 02
15 6
92 70
45 9
24 74
56 2
36 86
16 5
51 62
1
Depa
rtmen
tal ag
encie
s and
acco
unts
--
--
--
-
Non-
profi
t insti
tution
s50
5050
5355
5861
Paym
ents
for ca
pital
asse
ts30
716
944
527
027
130
431
9
Mach
inery
and E
quipm
ent
307
169
445
270
271
304
319
Softw
are a
nd ot
her in
tangib
le as
sets
--
--
--
-
Paym
ents
for fin
ancia
l ass
ets-
-13
7-
--
-

66DEPARTMENT OF BASIC EDUCATION
Sub-
Prog
ram
me
Audi
ted
Outc
omes
R’00
0
Adju
sted
ap
prop
riatio
nR’
000
Medi
um-te
rm ex
pend
iture
estim
ate
R’00
0
2011
/1220
12/13
2013
/1420
14/15
2015
/1620
16/17
2017
/18
Tota
l4 8
09 17
05 1
50 70
25 7
28 56
45 7
40 88
25 9
74 45
66 2
89 69
96 6
07 58
6
Deta
ils o
f sele
cted
tran
sfer
s and
subs
idies
Prov
ince
s and
mun
icipa
lities
--
--
--
-
Prov
ince
s-
--
--
--
Prov
incia
l Rev
enue
Fun
ds-
--
--
--
Det
ails
of s
elec
ted
tran
sfer
s an
d su
bsid
ies
Tran
sfer
s4 7
68 21
95 1
09 14
15 6
83 02
1 5
692 7
045 9
24 74
56 2
36 81
66 5
51 62
1
Natio
nal S
choo
l Nutr
ition P
rogr
amme
4 5
78 75
24 9
06 46
45 4
79 24
15 4
61 91
55 7
03 71
56 0
06 01
26 3
06 31
3
HIV
and A
IDS
(Life
Skil
ls Ed
ucato
rs) G
rant
189 4
6720
2 677
203 7
8023
0 789
221 0
3023
0 849
245 3
08
Capi
tal
--
--
--
-
Hou
seho
lds
Soci
al b
enefi
ts
Curre
nt
Emplo
yees
’ soc
ial be
nefits
-1 6
4622
5-
--
-

67 ANNUAL PERFORMANCE PLAN 2015-16
Performance and expenditure trends: Programme 5
The bulk of the Department’s contribution here is through conditional grant transfers to provinces, with the National School Nutrition Programme (NSNP) in the Care and Support in Schools sub-programme being the key initiative aimed at improving access and learning
The NSNP has three focus areas, namely, school feeding, promotion of nutrition education and school food gardens The programme is in the process of conducting an impact evaluation in collaboration with the Department of Monitoring and Evaluation A total of 170 workshops will be conducted on meal planning and hygiene, financial management as well as school food gardens The annual NSNP Best School Awards will be hosted to recognise the best schools nationwide The awards promote best practice among schools and districts while also providing advocacy on the programme
The Department’s new mandate will focus on the National Schools Deworming Programme as well as the continuation of the Integrated School Health Programme This will increase the pressure for additional funding to successfully fund programmes in these areas R18 billion has been allocated over the MTEF period for this activity

68DEPARTMENT OF BASIC EDUCATION
Part C: Links to other plans
Action Plan to 2019: Towards the Realisation of Schooling 2030, and the sectoral Basic Education Delivery Agreement for Outcome 1: Improved quality of basic education, will be the strategic drivers of all sector activities, based on credible research, evidence and consultation The focus on a credible diagnosis of priorities has enabled us to introduce interventions which have started to yield results Our engagement and interaction with all in the sector, along with our partners, has ensured that sectoral planning is coherent Together with our Strategic Plan 2015–2019, this Annual Performance Plan indicates how we will take the basic education mandate forward in 2015 and over the medium term
5. Links to long-term infrastructure and other capital plans
5.1. Accelerated Schools Infrastructure Delivery Initiative (ASIDI)
The main goal of ASIDI is to eradicate mud and unsafe structures and to provide existing schools with improved infrastructure such as laboratories, libraries and administration blocks To this end, the Norms and Standards for Basic School Functionality were approved for implementation in line with the ASIDI
A four-pronged strategy was established for rolling out ASIDI The first two elements involved an engagement with provincial education departments to explore how targets might be reprioritised from provincial allocations to more effectively address the 3 627 schools that needed to be brought to basic safety functionality levels by the end of 2014/2015, and the replacement of all inappropriate school structures by 2014 The third and fourth elements of ASIDI aimed to replace all 395 entirely mud schools situated in the Eastern Cape through an additional conditional grant allocation of R4 93 billion The Presidential Infrastructure Coordinating Commission (PICC) introduced in 2012 provided an opportunity to accelerate the eradication of backlogs at school level in a comprehensive way, through the Strategic Integrated Project (SIP) 13, which was launched on 10 December 2012
5.2 Conditional grants
5.2.1 National School Nutrition Programme Conditional Grant
Purpose To provide nutritious meals to targeted learners.
Performance indicator Numbers of schools provided with nutritious meals on all school days.
Continuation The National School Nutrition Programme (NSNP) is a government programme for poverty alleviation, specifically initiated to uphold the rights of children to basic food and education. The Conditional Grant Framework enables the Department of Basic Education (DBE) to play an oversight role in the implementation of all the NSNP activities in schools.
Motivation To enhance learning capacity and improve access to education by ensuring that the programme continues in all quintile 1 to 3 primary and secondary schools, as well as targeted special schools, on all school days.
69 ANNUAL PERFORMANCE PLAN 2015-16
5.2.2 HIV and AIDS (Life Skills Education) Conditional Grant
Purpose • To support South Africa’s HIV prevention strategy by increasing sexual and reproductive health knowledge, skills and appropriate decision making among learners and educators.
• To mitigate the impact of HIV and TB by providing a caring, supportive and enabling environment for learners and educators.
• To ensure the provision of a safe, rights-based environment in schools that is free of discrimination, stigma and any form of sexual harassment/abuse.
• To reduce the vulnerability of children to HIV, TB and Sexually Transmitted Infections (STIs), with a particular focus on orphaned and vulnerable children.
Performance indicator • Educators trained to implement Sexual and Reproductive Health (SRH) programmes for learners.• Number of LTSM on SRH are distributed to schools.
Continuation The grant will be reviewed on an ongoing basis in response to the nature of the pandemic.
Motivation To strengthen HIV and AIDS and TB programmes in schools by reviewing current interventions and developing a new integrated and comprehensive programme over the MTEF period.
5.2.3 Maths, Science and Technology conditional grant
Purpose To promote Mathematics and Physical Science teaching and learning and improve teachers’ content knowledge of Mathematics and Physical Science.
Performance indicator Improved learner numbers and performance in Mathematics and Physical Science.Continuation The grant will be reviewed on an ongoing basis.Motivation Over the MTEF period, the grant will focus on strengthening the implementation of the National Development
Plan (NDP) and the Action Plan to 2019 by increasing the number of learners taking Mathematics, Science and Technology subjects and improving the pass rates.
5.2.4 Education Infrastructure Conditional Grant to Provinces
Purpose To help accelerate construction, maintenance, upgrading and rehabilitation of new and existing infrastructure in education, address schools affected by disaster and enhance capacity to deliver infrastructure in education.
Performance indicator Timely delivery of all planned infrastructure.
Continuation Ongoing.
Motivation This grant has been awarded to supplement the ongoing infrastructure programme in provinces.
5.2.5 School Infrastructure Backlogs Grant
Purpose To eradicate the Basic Safety Norms backlog in schools without water, sanitation and electricity and to replace those schools constructed from inappropriate material, including mud schools, to contribute towards levels of optimum learning and teaching.
Performance indicator Eradication and replacement of 206 mud schools, 843 schools provided with water, sanitation provided to 421 schools and 618 schools electrified.
Continuation ASIDI is implemented through this grant. The projects in ASIDI are implemented over multiple years. The performance indicator projections above are for the delivery of ASIDI projects in the 2015/2016 financial year.
Motivation The grant has been awarded to eradicate the basic safety norms backlog in schools to ensure that schools reach basic functionality levels.

70DEPARTMENT OF BASIC EDUCATION
5.2.6 OSD for Practitioners
Purpose To establish parity in remuneration in compliance with ELRC Collective Agreement 1 of 2012. To augment the baseline compensation budget of the PDEs to enable them to comply with ELRC Collective Agreement 1 of 2012.
Performance indicator To ensure that provinces meet the payment obligations over a two-year period for educators covered by ELRC Collective Agreement 1 of 2012.
Continuation Two financial years namely, 2014/2015 and 2015/2016.
Motivation The grant has been awarded to meet the financial obligation to reach parity in term of CoE for qualifying educators covered by ELRC Collective agreement 1 of 2012.
5.3. Public Entities
Name of public entity Mandate Outputs
Current annual budget(R’000)
Education Labour Relations Council (ELRC)
To strive towards continuous maintenance and promotion of labour peace and contribute to the transformation and development of a quality South African Public Education Sector.
• Perform dispute resolution functions. • Conclude and enforce collective agreements. • Conclude, supervise, enforce and administer agreements.
R 67 795
South African Council of Educators (SACE)
To regulate, protect and promote the teaching profession.
• Register professionally qualified educators. • Develop the profession and promote standards of professional
ethics.
R 73 728
Umalusi The Council is the quality council for general and further education and training as contemplated in the National Qualifications Framework Act and has the functions contemplated in section 28 of that Act and section 2 of the General and Further Education and Training Quality Assurance Act, No. 58 of 2001 (GENFEQA).
• Promote quality and internationally comparative standards in GET.
• Maintain and improve educational standards through the development and evaluation of qualifications and curriculum.
• Quality assurance of assessment, and provision of education, training and assessment.
• Continually develop in-depth knowledge and expertise in mandated areas through rigorous research.
• Report on the quality of education and training within the mandate.
• Issue appropriate and credible certificates of learner achievement in terms of specific qualifications and subjects on the General Education and Training (GET) and Further Education and Training (FET) Framework of Qualifications.
• Provide reliable and credible leadership and guidance in standard setting and quality assurance.
R 170 892
71 ANNUAL PERFORMANCE PLAN 2015-16
5.4. Public-private partnerships
There are no public-private partnerships (PPP) that will end during the next three-year period

72DEPARTMENT OF BASIC EDUCATION
Part D: Annexures
6. Updates in the Department of Basic Education Strategic Plan
The Department is tabling a new five-year Strategic Plan for 2015/2016 – 2019/2020 This Annual Performance Plan should be read together with the DBE Strategic Plan and the sector plan Action Plan To 2019: Towards the realisation of Schooling 2030
7. Technical Indicator Descriptions
PROGRAMME 1: ADMINISTRATION
Indicator details 1.1.1 Number of staff development opportunities offered to officials in the DBE.
Short definition Total number of opportunities created for DBE officials to participate in development activities. This means training/development activities offered to official in the DBE. This training/development could be funded through sponsorships or through DBE allocated budget.
Purpose/Importance To increase the capacity of the DBE officials to perform their duties.
Source/Collection of data Attendance registers for development activities from DBE HR Manager reports.
Method of calculation Total number of opportunities created for officials to participate in staff development activities.
Data limitations None
Type of indicator Output
Calculation type Cumulative: Add up all the quarter outputs at the end of the year.
Reporting cycle Annually
New indicator No
Desired performance All employees who require upgrading of their skills are enrolled in staff development activities.
Indicator responsibility Branch A (Training and Social Responsibility Directorate)
Indicator details 1.1.2 Number of interns placed in the Department of Basic Education.
Short definition
Number of employees employed as interns in the Department in the current financial year. An internship may be defined as a career-specific work experience that one undertakes during or after (FET, tertiary and other post matric) studies in order to gain the practical experience required to operate and make a positive contribution with respect to the career path one eventually pursues.
Purpose/Importance To measure the implementation of the internship programme and offer career-specific experience in the Department.
Source/Collection of data Database of interns from the Training and Social Responsibility Directorate.
Method of calculation Count
Data limitations Data inconsistencies due to termination of internship if a graduate intern gained permanent employ-ment outside the Department.
Type of indicator Output
Calculation type Cumulative: Add up all the quarter outputs at the end of the year.
Reporting cycle Annually
New indicator No (adjusted slightly)
Desired performance DBE creates spaces and useful opportunities for graduate interns to gain technical and administrative skills.
Indicator responsibility Branch A (Training and Social Responsibility Directorate)

73 ANNUAL PERFORMANCE PLAN 2015-16
Indicator details 1.1.3 Signed financial disclosure forms for all DBE SMS members submitted by due date every year.
Short definition Total number of Senior Management Service officials who have signed financial disclosures forms and submitted them to the Human Resource Manager before the due date.
Purpose/Importance To measure SMS compliance with financial disclosure.
Source/Collection of data List of SMS members who submitted their financial disclosure forms to DBE’s HR Manager.
Method of calculation Count
Data limitations None : Due date sometimes changed based on DPSA circularResignation and new appointment may affect the reported output e.g when an appointment is made a month after the due date
Type of indicator Output
Calculation type Non-cumulative : Data reported once a year
Reporting cycle Annually (1st Quarter)
New indicator No
Desired performance All SMS members submit signed financial disclosure forms.
Indicator responsibility Branch A
Indicator details 1.1.4 Signed performance agreements by all DBE SMS members submitted by due date every year.
Short definition Total number of Senior Management Service officials who have signed performance agreements by due date.
Purpose/Importance To measure compliance with HR policies of SMS members.
Source/Collection of data List of SMS members was submitted and copies of signed performance agreements.
Method of calculation Count
Data limitations None
Type of indicator Process
Calculation type Non-cumulative: Data reported once a year
Reporting cycle Annually
New indicator No
Desired performance All SMS members sign performance agreements and submit on due date
Indicator responsibility Branch A

74DEPARTMENT OF BASIC EDUCATION
PROGRAMME 2: CURRICULUM POLICY, SUPPORT AND MONITORING
Indicator details 2.1.1 Percentage of qualifying public schools provided with workbooks for Grade R.
Short definition The percentage of qualifying public schools that are provided with Grade R workbooks. Qualifying public schools refers to public ordinary primary schools that offer Grade R. The indicator is about finding out schools offering grade R which have received Grade R workbooks. Grade R workbooks are produced and delivered as Volume 1-4 as follows:
Grades Description Delivery Plan
Grade R
Book 1Oct – Nov 2015
Book 2
Book 3Jan – Feb 2016
Book 4
Purpose/Importance This measure shows access to workbooks by schools.
Source/Collection of data Approved copies of workbooks/ proof of deliveries.
Method of calculation Total number of schools provided with workbooks divided by total number of all qualifying public schools multiplied by 100.
Data limitations none
Type of indicator Output
Calculation type Cumulative: based on the time specified under short definition.
Reporting cycle Annual
New indicator No (amended)
Desired performance All qualifying public schools with Grade R to have access to workbooks in the correct language.
Indicator responsibility Branch C
Indicator details 2.1.2 Percentage of Grade R practitioners with (NQF level 6)
Short definition Percentage of ECD practitioners with ECD NQF level 6 employed in the public Grade R sites. Out of the total number of ECD practitioners in the public schools.
This NQF level 6 includes B ED qualifications.
Purpose/Importance To measure the quality provision of the ECD programme in public ordinary Grade R classes by ensuring that the programme at ECD sites is in line with the CAPS and that suitably qualified personnel are teaching.
Source/Collection of data PERSAL and SAQA Database for verification
Method of calculation Number of ECD practitioners with ECD NQF level 6 divide by total number of ECD practitioners in public Grade R sites multiplied by 100
Data limitations PERSAL system may not be updated with other ECD practitioners who upgraded their qualifications.
Type of indicator Input
Calculation type Cumulative: Appointments of practitioners with NQF 6 may take place throughout the year
Reporting cycle Annually
New indicator Yes
Desired performance All ECD practitioners in public Grade R to be qualified at NQF level 6 or higher.
Indicator responsibility Branch T and Branch C

75 ANNUAL PERFORMANCE PLAN 2015-16
Indicator details 2.1.3 Grade R practitioners with at least NQF level 4 and 5.
Short definition Total number of ECD practitioners with NQF level 4 and 5 employed in the public Grade R sites.
Purpose/Importance To measure the quality provision of the ECD programme in public ordinary Grade R classes by ensuring that the programmes at ECD sites are in line with the CAPS and that and to further measure the need to move to a higher NQF level.
Source/Collection of data PERSAL ECD Database verified by SAQA
Method of calculation Number of ECD practitioners with at least ECD NQF level 4 employed at the public Grade R sites.
Data limitations PERSAL system may not be updated with other ECD practitioners who upgraded their qualifications.
Type of indicator Input
Calculation type Cumulative : Appointments of practitioners with NQF 6 may take place throughout the year
Reporting cycle Annually
New indicator Yes
Desired performance All ECD practitioners in public Grade R to be qualified at a minimum NQF level 4.
Indicator responsibility Branch C (ECD Directorate)
Indicator details 2.2.1 Percentage of public schools with Home Language workbooks for learners in Grades 1–6.
Short definition Percentage of public schools provided with Grades 1–6 Home Language workbooks. . Grade 1-6 work-books are produced and delivered are as follows:
Item Description Delivery PlanVolume 1 Volume 2
Grades 1 to 6 Home language Oct -Nov 2015 Jan - Feb 2016
Purpose/Importance This measure shows delivery of workbooks for grade 1- 6.
Source/Collection of data Approved copies of workbooks/ proof of deliveries.
Method of calculation Total number of schools provided with workbooks divided by total number of all public schools multiplied by 100.
Data limitations None
Type of indicator Output
Calculation type Non-cumulative: based on the time specified under short definition
Reporting cycle Annual
New indicator No (amended)
Desired performance All public schools with Grades 1-6 to have access to workbooks in the correct language.
Indicator responsibility Branch C

76DEPARTMENT OF BASIC EDUCATION
Indicator details 2.2.2 Percentage of public schools with Mathematics workbooks for learners in Grades 1–9.
Short definition Percentage of public schools provided with Grades 1–9 Mathematics workbooks. . Grade 1-9 workbooks are produced and delivered are as follows:
Item Description Delivery Plan
Volume 1 Volume 2
Grades 1 to 9 Mathematics Oct -Nov 2015 Jan - Feb 2016
Purpose/Importance This measure shows delivery of workbooks for grade 1- 9.
Source/Collection of data Approved copies of workbooks/ proof of deliveries.
Method of calculation Total number of schools provided with workbooks divided by total number of all public schools multi-plied by 100.
Data limitations None
Type of indicator Output
Calculation type Non-cumulative: based on the time specified under short definition
Reporting cycle Annual
New indicator No (amended)
Desired performance All public schools with Grades 1–9 to have access to workbooks.
Indicator responsibility Branch C
Indicator details 2.3.1 Number of learners completing the Kha Ri Gude programme.
Short definition Total number of learners completing the Kha Ri Gude literacy programme. By completed we refer to learners who have completed skills of basic writing, reading and perform simple basic mathematics which are assessed continually which form Learner Assessment Portfolio ( LAP).
Purpose/Importance To measure the annual completion rate of learners in the Kha Ri Gude programme.
Source/Collection of data Kha Ri Gude programme assessment forms and Learner Assessment Portfolio registers.
Method of calculation Count
Data limitations None
Type of indicator Output
Calculation type Non-cumulative: Data reported once a year
Reporting cycle Annually
New indicator No
Desired performance High number of enrolled learners completing the Kha Ri Gude programme.
Indicator responsibility Branch C (Kha Ri Gude Literacy Programme Manager)

77 ANNUAL PERFORMANCE PLAN 2015-16
Indicator details 2.3.2 Percentage of learners who obtain a National Senior Certificate.
Short definition Number of Grade 12 candidates who achieved the National Senior Certificate expressed as a percentage of all National Senior Certificate candidates who wrote NSC examinations.
Purpose/Importance To measure the number of candidates exiting the schooling system with a NSC certificate that allows them to enrol in colleges and higher education institutions or to enter the labour market.
Source/Collection of data NSC database
Method of calculation The number of Grade 12 candidates who achieved a National Senior Certificate in the NSC examinations divided by the number of Grade 12 candidates who wrote the NSC examinations multiplied by 100.
Data limitations None
Type of indicator Output
Calculation type Non-cumulative: Data reported once a year
Reporting cycle Annually
New indicator No
Desired performance At least 82% of candidates receive the NSC certificate.
Indicator responsibility Branch P
Indicator details 2.4.1 Number of teachers trained in multi-grade teaching.
Short definition Number of teachers trained in multi-grade teaching. This includes training multi-grade teachers on how to handle multi-grade classes. A multi-grade class is one in which learners in more than one grade are taught in the same classroom at the same time by one teacher.
Purpose/Importance To equip teachers with skills in order to deal with multi-grade classes.
Source/Collection of data Attendance registers from training in multi-grade teaching.
Method of calculation Count
Data limitations None
Type of indicator Output
Calculation type Cumulative: Add up all outputs at the end of the year.
Reporting cycle Annually
New indicator No
Desired performance A high number of teachers to be trained in multi-grade teaching.
Indicator responsibility Branch C

78DEPARTMENT OF BASIC EDUCATION
PROGRAMME 3: TEACHERS, EDUCATION HUMAN RESOURCES AND INSTITUTIONAL DEVELOPMENT
Indicator details 3.1.1 Number of Funza Lushaka bursaries awarded to students enrolled for initial teacher education.
Short definition Number of Funza Lushaka bursaries awarded to first, second, third and fourth-year students, as well as PGCE students, enrolled for initial teacher education programmes and programmes that offer teaching subjects but are not teacher education qualification in higher education institutions. The following are examples of qualifications awarded: (B.Ed or a Bachelor’s degree in B Com, B Sc, B Tech, Soc Sc followed by a PGCE)
Purpose/Importance To measure the number of beneficiaries of Funza Lushaka Bursary programme.
Source/Collection of data Database of beneficiaries of Funza Lushaka Programme from Initial Teacher Education Directorate.
Method of calculation Counting the number of Funza Lushaka bursaries awarded to first, second, third and fourth year students, as well as PGCE students, enrolled for initial teacher education programmes and programmes that offer teaching subjects but are not teacher education qualification in higher education institutions. The following are examples of qualifications awarded: (B.Ed or a Bachelor’s degree in B Com, B Sc, B Tech, Soc Sc followed by a PGCE)
Data limitations As a result of fees changes in institutions, the number of students awarded bursary may not be exact number enrolled.
Type of indicator Output
Calculation type Non-cumulative : registration happens once a year
Reporting cycle Annually. Awarding of bursaries and registration happens once a year.
New indicator No
Desired performance To utilise the bursary to train more graduates in the education profession.
Indicator responsibility Branch T
Indicator details 3.1.2 Percentage of Funza Lushaka bursary beneficiaries placed within six months of their graduation.
Short definition Percentage of Funza Lushaka graduates who are eligible and available for placement placed within six months of graduating.
Purpose/Importance This measure focuses on addressing the filling of vacancies to ensure that every class has a suitably qualified teacher and to ensure that there is value for money spent in the bursary scheme.
Source/Collection of data Appointments on PERSAL.
Method of calculation Number of graduates placed as a percentage of all graduates eligible and available for placement. Number placed/total number available for placement multiplied by 100 = percentage placed.
Data limitations None: PERSAL data has a 1 month lag.
Type of indicator Output
Calculation type Cumulative: Appointments happen at different times in the year.
Reporting cycle Annual in line with the school calendar year.
New indicator Yes
Desired performance All graduates to be placed within six months of completion of the programme.
Indicator responsibility Branch T

79 ANNUAL PERFORMANCE PLAN 2015-16
Indicator details 3.1.3 Number of qualified teachers aged 30 and below, entering the public service as teachers.
Short definition The total number of educators aged 30 and below possessing a minimum qualification level of REQV 13 who were appointed in posts during the financial year. The type of appointments made includes:• Permanent appointment: • Temporary Appointment: occupying a vacant position usually for a year or two.• Relieve Appointment occupying a post of a permanent teacher who is temporarily not at school due
to conditions such as ill health, maternity leave, suspension etc.• Part time: permanently appointed but only work for a limited number of hours
Purpose/Importance This measure focuses on addressing the filling of vacancies to ensure that every class has a suitably qualified teacher and to ensure that young graduates are given opportunities to enter the teaching profession.
Source/Collection of data Appointments on PERSAL.
Method of calculation Count
Data limitations Data is not always readily available at the time of reporting (up to one month time lag) thus affecting quarterly reporting.
Type of indicator Output
Calculation type Cumulative: Appointments of teachers are done throughout the year.
Reporting cycle Annual
New indicator Amended
Desired performance Increased number of teachers aged 30 and below entering the teaching profession.
Indicator responsibility Branch T
Indicator details 3.1.4 Percentage of principals appointed based on competency assessment processes.
Short definition The percentage of principals appointed after undergoing competency assessment. Principals are interviewed then taken through a competency assessment.
Purpose/Importance The measure focuses on ensuring that only competent managers are appointed as principals of schools.
Source/Collection of data Appointments on PERSAL and provincial reports. Provincial lists of principals from provinces who underwent competency assessment.
Method of calculation The total number of principals appointed after competency assessment divided by the total number of appointed principals multiplied by hundred to get a percentage (proportion)Total number of principals appointed who have taken X 100Total number of principals appointed
Data limitations Unavailability of data at the time of reporting. For confidentiality purposes competency reports may not be accessible.
Calculation type Cumulative: Appointments are done throughout the year.
Reporting cycle Annual
New indicator New
Desired performance All principals appointed on the bases of competency.
Indicator responsibility Branch T

80DEPARTMENT OF BASIC EDUCATION
Indicator details 3.2.1 Number of teachers who have written the Self-Diagnostic Assessments for English First Additional Language (EFAL) and Mathematics.
Short definition The number of English First Additional Language and Mathematics teachers that have written the diagnostic tests developed to test content knowledge of teachers.
Purpose/Importance To identify teachers’ content gaps in the subjects they teach with the intention of developing focused development programmes.
Source/Collection of data Database of all EFAL and Mathematics teachers that have participated in the diagnostic tests.
Method of calculation Count
Data limitations none
Type of indicator Output
Calculation type Cumulative: Testing cannot be done in one sitting
Reporting cycle Annually
New indicator Yes
Desired performance All EFAL and Mathematics teachers participate in the Self-Diagnostic Assessments.
Indicator responsibility Branch T
Indicator details 3.3.1 Percentage of SGBs that meet minimum criteria in terms of effectiveness (in sampled schools).
Short definition Number of schools where school governing bodies meet minimum criteria in terms of effectiveness expressed as a percentage of total number of schools. The following must be in place for the SGB to meet the minimum criteria for effectiveness: • Members must include: (a) educators, (b) non-teaching staff, (c) parents, and (d) learners (only if
the school is a secondary school) and (e) the number of parent members must be greater than the sum of the other members. The ideal mix depends on ratios – the parent contingent should always exceed the teacher contingent by 1 to ensure parent majority and public participation in school improvement.
• Minutes: minutes of SGB meetings must be recorded.• Function: the SGB must have (a) developed a mission statement for the school, (b) adopted a code
of conduct for learners, (c) determined the school’s admission policy, (d) adopted a constitution for the SGB and (e) have audited financial statements for the previous year.
Frequency of meetings: at least one meeting a term. By implication, the SGB must have met three or more times by the time the data for this project is collected.
Purpose/Importance To measure the effectiveness of SGBs in schools.
Source/Collection of data DBE Sample survey. The random samples (of schools, learners and educators) would be designed in such a way that the findings would be representative of the total population.
Method of calculation The number of schools where the School Governing Body meets minimum criteria in terms of effectiveness expressed as a percentage of the total number of schools sampled.
Data limitations Availability of data
Type of indicator Output
Calculation type Non-cumulative: Results of survey produced once a year.
Reporting cycle Annually
New indicator Yes
Desired performance All schools to have effective SGBs.
Indicator responsibility Branch T

81 ANNUAL PERFORMANCE PLAN 2015-16
Indicator details 3.3.2 Number of public schools supported by external moderators to monitor the utilisation of findings of school profiles to improve learner performance.
Short definition Number of schools supported by external moderators using the findings of school profiles to offer targeted support. By external moderator we refer to DBE assigned moderators supporting schools in the different provinces
Purpose/Importance To offer targeted support to areas identified in schools profiles.
Source/Collection of data • Reports from external moderators.• Lists of schools supported that is verified and signed off by the district director..
Method of calculation Number of schools supported annually.
Data limitations Inconsistencies in records available in schools.
Type of indicator Output
Calculation type Cumulative: Monitoring is an ongoing exercise. Adding up all outputs at the end of the year.
Reporting cycle Annually
New indicator Yes.
Desired performance Schools are supported based on the findings in the school profiles.To have school profiles that reflect improved learner performance.
Indicator responsibility Branch D
PROGRAMME 4: PLANNING, INFORMATION AND ASSESSMENT
Indicator details 4.1.1 Reliable and valid learner results on performance in the ANA.
Short definition Collecting learner performance data in the ANA examinations that is accurate and reliable to assist in identifying areas for improvement of learning and performance in Mathematics and Languages in Grades 1–6 and 9.
Purpose/Importance To support the improvement of the quality of learning and teaching.
Source/Collection of data National report on ANA learner performance – data is collected through PEDs and database is hosted by SITA.
Method of calculation Approved Annual National Assessments (ANA database) of learner performance (ANA Database hosted by SITA mainframe).
Data limitations None
Type of indicator Output
Calculation type Non-cumulative: ANA results released once a year.
Reporting cycle Annually
New indicator No
Desired performance Maintenance of a valid and credible ANA database.
Indicator responsibility Branch P

82DEPARTMENT OF BASIC EDUCATION
Indicator details 4.1.2 Reliable and valid data on learner performance in the National Senior Certificate (Grade 12) provided.
Short definition Collecting learner performance data in the NSC examinations that is accurate and reliable to assist in identifying areas for improvement of teaching and learning.
Purpose/Importance To support the improvement of the quality of teaching and learning.
Source/Collection of data Approved National NSC report on learner performance (database hosted by SITA mainframe).
Method of calculation Learner performance database and records submitted to the Department (exams database hosted by SITA mainframe).
Data limitations None
Type of indicator Output
Calculation type Non-cumulative: NSC results released once a year.
Reporting cycle Annually
New indicator No
Desired performance Maintenance of a valid and credible NSC database.
Indicator responsibility Branch P
Indicator details 4.2.1 Number of schools provided with sanitation facilities.
Short definition Number of public ordinary schools that are provided with different types of sanitation facilities based on assessment of the location of the school. This would determine the type of sanitation provided. The types of sanitation that are provided are:• Water borne sanitation• Septic or Conservancy Tank system• Ventilated Improved Pit Latrine• Composting Toilets• Small Bore Sewere Reticulation
Purpose/Importance To measure the number of schools that meet the basic sanitation standards.
Source/Collection of data NIEMS
Method of calculation Count.
Data limitations Vandalism and natural disasters may lead to more schools that do not meet minimum sanitation standards.
Type of indicator Output
Calculation type Cumulative: Projects are completed at different times in the year.
Reporting cycle Annually
New indicator Yes
Desired performance All schools to comply with nationally determined minimum sanitation standards.
Indicator responsibility Branch P

83 ANNUAL PERFORMANCE PLAN 2015-16
Indicator details 4.2.2 Number of schools provided with water.
Short definition Number of public ordinary schools provided with water.
Purpose/Importance To measure the number of schools where teachers and learners have access to water.
Source/Collection of data NIEMS
Method of calculation Count.
Data limitations None
Type of indicator Output
Calculation type Cumulative: Projects are completed at different times in the year.
Reporting cycle Annually
New indicator Yes
Desired performance All schools to be provided with water.
Indicator responsibility Branch P
Indicator details 4.2.3 Number of schools provided with electricity.
Short definition Number of public ordinary schools that have electricity.
Purpose/Importance To measure the number of schools that has electricity.
Source/Collection of data NIEMS Data
Method of calculation Count.
Data limitations Data from Department of Energy
Type of indicator Output
Calculation type Cumulative: Projects are completed at different times in the year.
Reporting cycle Annually
New indicator Yes
Desired performance All schools to have access to electricity.
Indicator responsibility Branch P

84DEPARTMENT OF BASIC EDUCATION
Indicator details 4.3.1 Percentage of public schools that use the schools administration and management systems to electronically provide data to the national learner tracking system
Short definition The South African Schools Administration and Management System (SA-SAMS) was introduced to assist schools in managing their administrative systems. Public schools in all provinces are expected to phase in usage of the system to record and report on their data. The system could include third party or other providers. This performance indicator measures the number of public schools that use electronic systems to provide data to the national learner tracking system. Public Schools: Refers to ordinary and special schools. It excludes independent schools.
Purpose/Importance Education information utilised for administrative requirements, education planning, reporting, accounting and monitoring plus evaluation.
Source/Collection of data EMIS database
Method of calculation Uploads of LURITS information records per province.
Data limitations Receiving information from PED late.
Accuracy of completion of field on the database from schools
Type of indicator Output
Calculation type Non-cumulative: Same number of schools is expected to upload data on LURITS every quarter.
Reporting cycle Quarterly
New indicator Yes
Desired performance All schools to report on data utilising the SA-SAMS system (collection of data, analysis and reporting) and other electronic administrative systems to upload data onto LURITS.
Indicator responsibility Branch P
Indicator details 4.4.1 Number of officials from districts that achieved less than 65% in the NSC participating in a mentoring programme.
Short definition Design, implement and manage a mentoring programme for district and circuit managers in districts that achieved less than 65% in the NSC results. Identified officials from underperforming districts are taken through a mentoring programme, where they are assigned a mentor to support them.
Purpose/Importance To support officials in the targeted districts to improve learner performance.
Source/Collection of data Reports from the mentors.Records of mentoring sessions where mentee signs for attending session. This may be one on one session, or group session in form of workshops, seminar and other forms of contact sessions.
Method of calculation Count of district officials mentored.
Data limitations None
Type of indicator Output
Calculation type Non-cumulative: Same number of officials are mentored every quarter.
Reporting cycle Annually
New indicator No
Desired performance Support districts to improve average learner performance in the NSC above the national average.
Indicator responsibility Branch DCMS
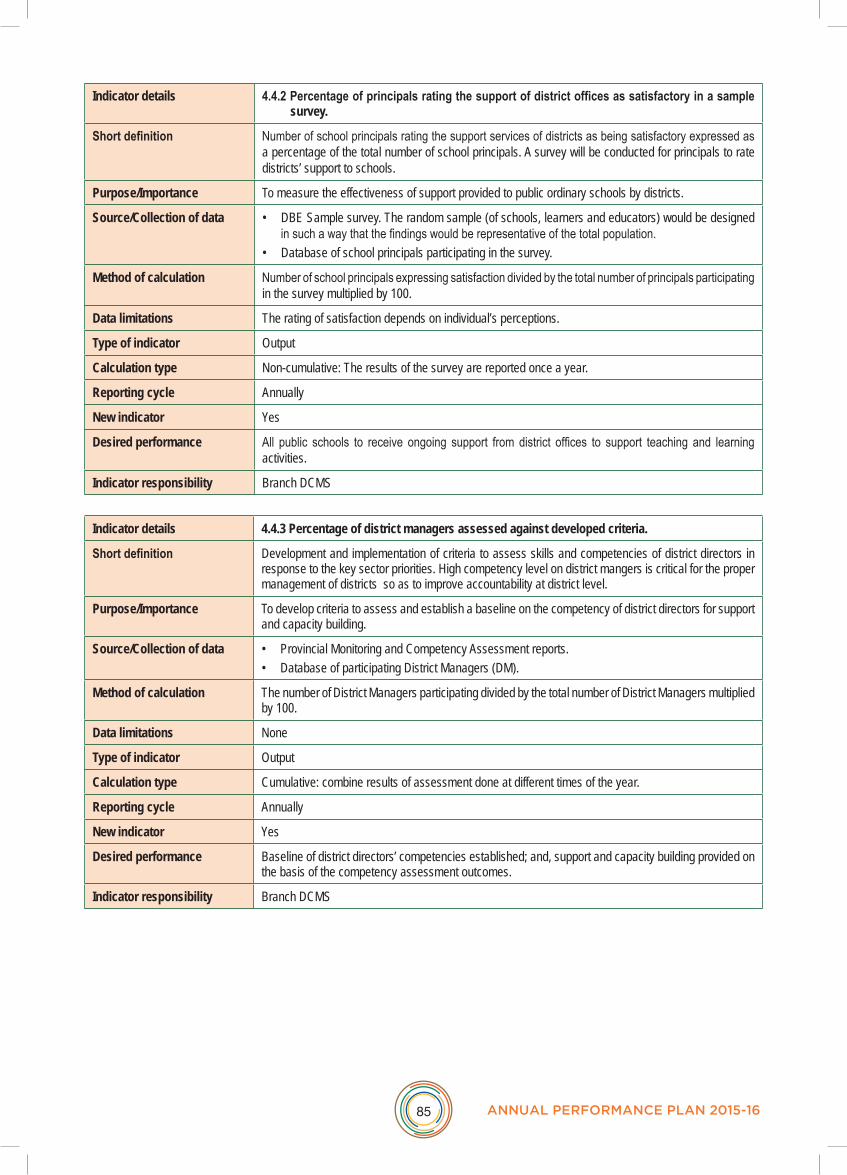
85 ANNUAL PERFORMANCE PLAN 2015-16
Indicator details 4.4.2 Percentage of principals rating the support of district offices as satisfactory in a sample survey.
Short definition Number of school principals rating the support services of districts as being satisfactory expressed as a percentage of the total number of school principals. A survey will be conducted for principals to rate districts’ support to schools.
Purpose/Importance To measure the effectiveness of support provided to public ordinary schools by districts.
Source/Collection of data • DBE Sample survey. The random sample (of schools, learners and educators) would be designed in such a way that the findings would be representative of the total population.
• Database of school principals participating in the survey.
Method of calculation Number of school principals expressing satisfaction divided by the total number of principals participating in the survey multiplied by 100.
Data limitations The rating of satisfaction depends on individual’s perceptions.
Type of indicator Output
Calculation type Non-cumulative: The results of the survey are reported once a year.
Reporting cycle Annually
New indicator Yes
Desired performance All public schools to receive ongoing support from district offices to support teaching and learning activities.
Indicator responsibility Branch DCMS
Indicator details 4.4.3 Percentage of district managers assessed against developed criteria.
Short definition Development and implementation of criteria to assess skills and competencies of district directors in response to the key sector priorities. High competency level on district mangers is critical for the proper management of districts so as to improve accountability at district level.
Purpose/Importance To develop criteria to assess and establish a baseline on the competency of district directors for support and capacity building.
Source/Collection of data • Provincial Monitoring and Competency Assessment reports.• Database of participating District Managers (DM).
Method of calculation The number of District Managers participating divided by the total number of District Managers multiplied by 100.
Data limitations None
Type of indicator Output
Calculation type Cumulative: combine results of assessment done at different times of the year.
Reporting cycle Annually
New indicator Yes
Desired performance Baseline of district directors’ competencies established; and, support and capacity building provided on the basis of the competency assessment outcomes.
Indicator responsibility Branch DCMS

86DEPARTMENT OF BASIC EDUCATION
PROGRAMME 5: EDUCATIONAL ENRICHMENT SERVICES
Indicator details 5.1.1 Number of learners, educators and officials participating in DBE-organised activities on social cohesion, citizenship, rights and responsibilities, and constitutional values.
Short definition Total number of learners, educators and officials who participate in the citizenship, rights and responsibilities, and constitutional values activities coordinated in collaboration with DBE and other Social Cohesion activities undertaken.
Purpose/Importance These activities are done to entrench social values, promote knowledge and understanding of rights and responsibilities, constitutional values and to promote patriotism.
Source/Collection of data Participation Registers
Method of calculation Count
Data limitations None
Type of indicator Output
Calculation type Cumulative: The output will be accumulation of all activities held throughout the year.
Reporting cycle Annual
New indicator No
Desired performance All learners, educators and officials in the schooling system participate in the citizenship, rights and responsibilities, and constitutional values activities.
Indicator responsibility Branch S
Indicator details 5.1.2 Number of schools that provide learners with nutritious meals.
Short definition Total number of public ordinary schools and identified special schools receiving nutritious meals through the government feeding programme. By identified special schools, it refers to schools for disabled learners identified by provinces for the NSNP programme. There are also public ordinary schools that are not classified as Quintile 1-3 that have been indentifies in serious need of NSNP.
Purpose/Importance To measure the coverage of the National School Nutrition Programme in schools.
Source/Collection of data • Approved NSNP provincial coordinators' reports to the Directorate.• Approved lists of schools offering NSNP.• Database of all schools participating in the nutrition programme.
Method of calculation Count
Data limitations None
Type of indicator Output
Calculation type Non-cumulative: The same number of schools are expected to participate quarterly
Reporting cycle Quarterly
New indicator No
Desired performance All learners in quintiles 1 to 3 schools and identified special schools benefit from the NSNP.
Indicator responsibility Branch S (National School Nutrition Programme Directorate)


Published by the Department of Basic Education
222 Struben Street
Private Bag X895, Pretoria, 0001
Telephone: 012 357 3000 Fax: 012 323 0601
ISBN: 978-1-4315-2130-2
© Department of Basic Education
website facebook twitterwww.education.gov.za www.facebook.com/BasicEd www.twitter.com/dbe_sa


