Embed Size (px)
Citation preview
Republic of the Philippines
COMMISSION ON AUDIT Commonwealth Avenue, Quezon City
2012 Annual Financial Report
National Government Agencies
Volume I - A
FY 2012
Annual Financial Report
National Government
Volume I-A
Page
I. INTRODUCTION 1
II. REPORT HIGHLIGHTS 5
III. APPROPRIATIONS, ALLOTMENTS, OBLIGATIONS AND BALANCES 18
Overview
Appropriations, Allotments, Obligations and Balances
IV. FINANCIAL STATEMENTS
Condensed Balance Sheet 46
Condensed Statement of Income and Expenses 47
Condensed Statement of Government Equity 48
Condensed Statement of Cash Flows 49
Notes to Financial Statements 50
V. FINANCIAL ANALYSES
Balance Sheet 61
Assets
Liabilities
Equity
Statement of Income and Expenses 96
Revenue/Income
Expenses
Statement of Cash Flows 122
Cash Inflows
Cash Outflows
Net Cash Provided By (Used)
Cash Balances
VI. NATIONAL GOVERNMENT DEBT 131
VII. SPECIAL ACCOUNTS IN THE GENERAL FUND 151
VIII. COMPREHENSIVE AGRARIAN REFORM PROGRAM 156
IX. SIGNIFICANT AND COMMON AUDIT OBSERVATIONS 170
AND RECOMMENDATIONS
TABLE OF CONTENTS
i
ii
List of Tables and Charts
Table No. Particulars Page
Report Highlights
II-1 Allotment by Source of Appropriations and Allotment Class 7
II-2 Obligations by Source of Appropriations and Expenditure Class 8
II-3 Unalloted/Unreleased Appropriations, by Source 9
II-4 Unobligated Allotments, by Source 10
II-5 Comparative Composition of Liabilities 13
Appropriations, Allotments, Obligations and Balances
III-1 Appropriations, Allotments, Obligations and Balances 20
III-2 Comparative Details of Appropriations 22
III-3 Comparative Regular Appropriations By Department/Agency 25
III-4 Appropriations for Special Purpose Funds 26
III-5 Appropriations for Unprogrammed Fund 27
III-6 Budgetary Support to Government Corporations 28
III-7 Comparative Details of Allocations to LGUs 31
III-8 Automatic Appropriations 32
III-9 Appropriations by Department/Agency Continuing and Source 33
III-10 Sources and Nature of Allotments 34
III-11 Regular Allotments, by Department/Agency and Allotment Class 35
III-12 Allotment from Special Purpose Funds 37
III-13 GOCCs with Budgetary Support from the National Government 38
III-14 Allotments from Allocations to LGUs 39
III-15 Allotment from Priority Development Assistance Fund 40
III-16 Allotments from Automatic Appropriations 40
III-17 Summary of Unreleased Appropriations 42
III-18 Summary of Allotments, Obligations and Balances 42
III-19 Obligations Covered by Allotments, by Department/Agency and Allotment
Class 43
III-20 Obligations Not Covered by Allotments, by Department/Agency and
Allotment Class 45
Financial Analyses
V.1-1 Assets, Liabilities and Equity 61
V.1-2 Annual Growth in Assets CYs 2008-2012 61
V.1-3 Comparative Composition of Cash 63
V.1-4 Departments/Offices with more than P1.0 billion Cash in Bank – Local
Currency 66
V.1-5 Departments/Offices with more than P100 million Cash in Bank – Foreign
Currency 68
iii
V.1-6 Details of Receivables by Account 69
V.1-7 Top Ten Departments with Huge Balances to Intra-Agency Receivable
Accounts 75
V.1-8 Composition of Investments 77
V.1-9 Major Classification of Property, Plant and Equipment 79
V.1-10 Components of Construction in Progress 80
V.1-11 Departments with more than P100 million worth of Public Infrastructures 81
V.1-12 Components of Land and Land Improvements 81
V.1-13 Components of Buildings 82
V.1-14 Components of Other Assets Group 82
V.1-15 Comparative Components of Current Liabilities 84
V.1-16 Top 10 Departments/Offices in Accounts Payable 85
V.1-17 Comparative Components of Long-term Liabilities 92
V.1-18 Departments/Offices/Agencies with Completed Public Infrastructures and
Reforestation Projects 94
V.2-1 Income/Revenue, Expenses, Subsidies and Net Loss 96
V.2-2 Comparative Income Taxes, By Source 98
V.2-3 Comparative Taxes on Goods and Services, By Source 98
V.2-4 Comparative Components of Property Taxes 99
V.2-5 Departments/Offices Which Reported Service Income 100
V.2-6 Components of Business Income 101
V.2-7 Components of Permits and Licenses 101
V.2-8 Components of Other Income 102
V.2-9 Departments/Offices which Reported Interest Income 102
V.2-10 GOCCs/GFIs with Dividend 103
V.2-11 Departments with Income from Grants and Donations 104
V.2-12 Departments/Offices which Reported Miscellaneous Income 105
V.2-13 Breakdown of Income, by Department/Office and by Book 105
V.2-14 Regional Breakdown of Income by Source 107
V.2-15 Departments/Offices with Highest Current Operating Expenses 108
V.2-16 Comparative Components of Personal Services 109
V.2-17 Departments/Offices with Big Expenses for Personal Services 109
V.2-18 Comparative Details of Maintenance and Other Operating Expenses 110
V.2-19 Departments/Offices with Big Maintenance and Other Operating
Expenses 111
V.2-20 Comparative Consumption of Supplies and Materials,
By Top Departments/Offices 112
V.2-21 Comparative Components of Repairs and Maintenance Expenses 113
V.2-22 Comparative Details of Subsidy To LGUs, GOCCs and NGOs/POs 114
V.2-23 Breakdown of Subsidy to LGUs as Reported by DBM CO and ROs 115
V.2-24 Breakdown of Subsidy to GOCCs as Reported by DOF-BTr 116
V.2-25 Comparative Components of Financial Expenses 118
V.2-26 Regional Breakdown of Expenses and Subsidies 118
V.2-27 Comparative Details of Subsidy From (To) National Government Agencies 119
iv
V.2-28 Comparative Details of Subsidy To NGAs as Reported by BTr 120
V.2-29 Comparative Details of Gains/(Losses) 121
V.2-30 Comparative Condensed Statement of Income and Expenses 121
V.3-1 Comparative Revenue Generated, by Agency 123
V.3-2 Receipt of NCA, By Department 124
V.3-3 Breakdown of Other Receipts 124
V.3-4 Breakdown of Inflows from Investing 125
V.3-5 Breakdown of Borrowings 125
V.3-6 Remittances to NT, by Agency 126
V.3-7 Payment of Operating Expenses, by Department 127
V.3-8 Subsidies and Donations to Other NGAs/LGUs, NGOs/POs 127
V.3-9 Investments in Stocks, Bonds and Other Securities, by Department/Office 128
V.3-10 Composition of Financing Outflows 129
National Government Debt
VI-1 National Government Financing 134
VI-2 Adjusted Balance of Outstanding NG Debt 135
VI-3 Outstanding NG Debt, Calendar Year 2012 136
VI-4 Comparative Outstanding NG Debt 138
VI-5 Composition of Domestic Issuances 140
VI-6 Foreign Debt Availments 141
VI-7 Repayments by Creditor 142
VI-8 Growth of Outstanding NG Debt 143
VI-9 Comparative Interest Payments of the NG 145
VI-10 Comparative Other Financial Expenses of the NG 146
VI-11 Appropriations for Foreign-Assisted Projects by Department/Agency 147
VI-12 Allotments for Foreign-Assisted Projects by Department/Agency 148
Special Account in the General Fund
VII-1 Appropriations, Allotments and Obligations, Special Account in the
General Fund (Net of CARP) 152
VII-2 Expenses by Department/Office Special Account in the General Fund
(Net of CARP) 155
Comprehensive Agrarian Reform Program
VIII-1 Appropriations for CARP 157
VIII-2 Statement of Appropriations, Allotments, Obligations and Balances 158
VIII-3 Balance Sheet 158
VIII-4 Statement of Income and Expenses 160
v
Chart No. Particulars Page
Report Highlights
II-1 Appropriations, Allotments and Obligations 5
II-2 Allotment by Class 8
II-3 Assets, Liabilities and Equity 12
II-4 Comparative Composition of Assets 12
II-5 Results of Current Operations 14
II-6 Cash Flows, by Activities 16
Appropriations, Allotments, Obligations and Balances
III-1 FY 2012 GAA Regular Appropriations by Sector 18
III-2 FY 2012 NG Budget by Allotment Class 21
III-3 Appropriations per GAA for FYs 2008 to 2012 23
III-4 Sources of Automatic Appropriations 31
III-5 Unreleased/Unallotted Appropriations 41
Financial Analyses
V.1-1 Percentage Distribution of the Major Categories of Assets 62
V.1-2 Trend of Cash 62
V.1-3 Percentage Distribution of Property, Plant and Equipment 79
V.1-4 Trend of Liabilities 83
V.2-1 Comparison of Actual and Programmed Revenue 97
V.2-2 Expenses of the National Government 108
V.3-1 Segment of Cash Flows 122
V.3-2 Trend of Net Cash Provided by (Used in) Operating, Investing and Financing
Activities CY 2003-2012 130
National Government Debt
VI-1 NG Debt By Source for FY 2012 137
VI-2 NG Debt Growth 143
VI-3 Actual Debt Service Expenditure of the NG 144
Special Account in the General Fund
VII-1 Total Assets, Liabilities and Equity, By Department, Special Account
in the General Fund (Net of CARP) 153
VII-2 Income by Department, Special Account in the General Fund (Net of CARP) 154
Significant and Common Audit Observations and Recommendations
IX-1 Summary of Audit Opinions Calendar Year 2012 171
ACRONYMS

AAB Authorized Agent Bank DPWH Department of Public Works and Highways
ACEF Agricultural Competitiveness Enhancement Fund DSF Debt Service Fund
ADB Asian Development Bank DSWD Department of Social Welfare and Development
AFAE Access Facilitation and Access Enhancement Services DTI Department of Trade and Industry
AFP Armed Forces of the Philippines E.O. Executive Order
AFPMATF AFP Modernization Act Trust Fund ECCDC Early Childhood Care and Development Council
AGDB Authorized Government Depository Bank EP Emancipation Patent
AGPF Agricultural Guarantee Pool Fund FAPs Foreign Assisted Projects
AGSBs Authorize Government Servicing Banks FDCP Film Development Council of the Philippines
AJD Agrarian Justice Delivery FE Financial Expenses
ALDA ARCs Level of Development Assessment FOREX Foreign Exchange
ALGU Allocations to Local Government Units FSP Foreign Service Post
AO Administrative Order FY Fiscal Year
ARBOs Agrarian Reform Beneficiaries Organizations GAA General Appropriations Act
ARBs Agrarian Reform Beneficiaries GE Government Equity
ARCs Agrarian Reform Communities GFIs Government Financial Institutions
ARF Agrarian Reform Fund GOCCs Government-Owned and/or Controlled Corporations
ARISP Agrarian Reform Infrasturture Support Projects GOP Government of the Philippines
ARMM Autonomous Region in Muslim Mindanao GSTLF Gasoline Station Training and Loan Fund
ASPs Approved Survey Plans GTEB Garments and Textile Export Board
BAC Bids and Award Committee HDMF Home Development Mutual Fund
BCDA Bases Conversion and Development Authority HEDF Higher Education Development Fund
BESF Budget of Expenditures and Sources of Financing HGC Home Guaranty Corporation
BFP Bureau of Fire Protection HSRC Human Settlement Regulatory Commission
BI Bureau of Immigration IACAT Inter Agency Council Against Trafficking
BIR Bureau of Internal Revenue IAs Implementing Agencies
BOC Bureau of Customs IBRD International Bank Reconstruction Development
BS Balance Sheet IMF International Monetary Fund
BSF Bond Sinking Fund IRA Internal Revenue Allotment
BSGC Budgetary Support to Government Corporations IT Information Technology
BSP Bangko Sentral ng Pilipinas JJWC Juvenile Justice Welfare Council
BSWM Bureau of Soils and Water Management KALAHI-CIDSS Kapit-Bisig Laban sa Kahirapan-Comprehensive
BTr Bureau of the Treasury and Integrated Delivery of Social Services
BTr-GOP Bureau of the Treasury-Government of the Phils. KKB Kapangyarihan at Kaunlaran sa Barangay
CARP Comprehensive Agrarian Reform Program LBP Land Bank of the Philippines
CB-BOL Central Bank of the Philippines – Board of Liquidators LGUs Local Government Units
CDC Cash Disbursement Ceiling LOI Letter of Instructions
CHED Commission on Higher Education LRA Land Registration Authority
CIDA Canadian International Development Agency LTO Land Transportation Office
CIP Construction in Progress MARINA Maritime Industry Authority
CLOAs Collective Land Owners Awards MDFO Municipal Development Fund Office
CO Capital Outlay MDS Modified Disbursement System
CO Central Office MIGA Multilateral Investment Guaranty Agency
COA Commission on Audit MMDA Metropolitan Manila Development Authority
COE Current Operating Expenses MOOE Maintenance and Other Operating Expenses
COMELEC Commission on Elections MPBF Miscellaneous Personnel Benefits Fund
COP Congress of the Philippines MRDP Mindanao Rural Development Program
CTU Cebu Technological University MRT Metro Rail Transit
CY Calendar Year MRTDC Metro Rail Transit Development Corporation
DA Department of Agriculture MVUC Motor Vehicle Users' Charge
DAP Disbursement Acceleration Program MWSS Metropolitan Waterworks and Sewerage System
DAR Department of Agrarian Reform NABCOR National Agribusiness Corporation
DBM Department of Budget and Management NBC National Budget Circular
DBP Development Bank of the Philippines NCA Notice of Cash Allocation
DDB Dangerous Drugs Board NCAA Non-Cash Availment Authority
DENR Department of Environment and Natural Resources NCCA National Commission for Culture and the Arts
DepEd Department of Education NCR National Capital Region
DFA Department of Foreign Affairs NDC National Development Company
DILG Department of the Interior and Local Government NEDA National Economic and Development Authority
DND Department of National Defense NFA National Food Authority
DOE Department of Energy NG National Government
DOF Department of Finance NGAs National Government Agencies
DOH Department of Health NGAS New Government Accounting System
DOJ Department of Justice NGDAD National Government Debt Accounting Division
DOLE Department of Labor and Employment NGOs Non-Governmental Organizations
DOST Department of Science and Technology NHA National Housing Authority
DOT Department of Tourism NIA National Irrigation Administration
DOTC Department of Transportation and Communications NIPAS National Integrated Protected Areas System
ACRONYMS
vi
NIRT National Internal Revenue Taxes
NORM Naturally Occuring Radio Active Materials
NPC National Power Corporation
NSDF National Sports Development Fund
NSO National Statistics Office
NT National Treasury
NTCA Notice of Transfer of Cash Allocation
OEO Other Executive Offices
OPSF Oil Price Stabilization Fund
OSEC Office of the Secretary
PAGCOR Philippine Amusement and Gaming Corporation
PAG-IBIG Pagtutulungan sa Kinabukasan: Ikaw, Bangko Industriya at Gobyerno
PARC Presidential Agrarian Reform Council
PBD Program Beneficiaries Development
PCAARRD Philippine Council for Agriculture, Aquatic and Natural Resources Research Development
PCGG Presidential Commission on Good Government
PCSO Philippine Charity Sweeptakes Office
PD Presidential Decree
PDAF Priority Development Assistance Fund
PDIC Philippine Deposit Insurance Corporation
PHIC/PHILHEALTH Philippine Health Insurance Corporation
PHILGUARANTEE Philippine Guarantee and Investment Corporation
PI/RP Public Infrastructure/Reforestation Project
PMO Privatization and Management Office
PNB Philippine National Bank
PNP Philippine National Police
PNPP Philippine Nuclear Power Plant
POs Peoples’ Organizations
PPA Philippine Ports Authority
PPE Property, Plant and Equipment
PPPP Pantawid Pamilyang Pilipino Program
PRRC Pasig River Rehabilitation Commission
PS Personal Services
PSC Philippine Sports Commission
PYA Prior Years' Adjustments
R.A. Republic Act
RA Regular Agency
RCO Regional Consular Offices
RFU Regional Field Unit
RLIP Retirement and Life Insurance Premium
ROP Republic of the Philippines
Ros Regional Offices
RPSU Regional Payroll Services Unit
SAAOB Statement of Appropriations, Allotments, Obligations & Balances
SAGF Special Account in the General Fund
SBGFC Small Business Guarantee and Finance Corporation
SCF Statement of Cash Flows
SGF Special Guaranty Fund
SILCAB Social Infrastructure and Local Capability Building
SING Subsidy Income from National Government
SPF Special Purpose Fund
SPTB Special Purpose Treasury Bonds
SRF Special Reserve Fund
SRTC Statistical Research and Training Center
SSF Securities Stabilization Fund
SUCs State Universities and Colleges
TDM Tax Debit Memo
TEF Tax Expenditure Fund
TOP Treasurer of the Philippines
TRAs Tax Remittance Advices
UF Unprogrammed Fund
UNDP United Nations Development Programme
UNFPA United Nations Population Fund
UP University of the Philippines
VAT Value Added Tax
WB World Bank
ACRONYMS
vii

I. INTRODUCTION
1
INTRODUCTION
1.1 Legal Bases
Section 4, Article IX-D of the Philippine Constitution directs the Commission on
Audit (COA) to submit to the President and Congress the Annual Financial Report
(AFR) of the National Government. Furthermore, Section 41 of Presidential Decree No.
1445, the Auditing Code of the Philippines, requires that annual report on the financial
condition and results of operations of all agencies of the government which shall
include recommendations of measures necessary to improve their effectiveness and
efficiency shall be submitted not later than September 30 of each year.
In compliance with this mandated function, the COA, through the Government
Accountancy Sector (GAS) submits to the President and Congress the Annual Financial
Report (AFR) of the National Government (NG) for calendar year (CY) 2012.
1.2 Objectives
The AFR provides information on the total approved budget, releases of
allotments, obligations incurred and Notice of Cash Allocations (NCA) and other
disbursement authorities received by national government agencies (NGAs), cash
inflows and outflows and the financial condition and results of operations as presented
in the consolidated financial statements of the NGAs. The budget informations serve as
useful tools for the Congress in the ratification of appropriations and other laws, while
the other financial data used guide the President, legislators, economic planners and
other government officials in the formulation of economic policies, in the development
of budget plans, and other deliberations in aid of legislation.
1.3 Contents/Features
The financial statements featured in the AFR are as follows: Balance Sheet (BS),
Statement of Income and Expenses (SIE), Statement of Government Equity (SGE) and
Statement of Cash Flows (SCF), in condensed and detailed form with comparative
figures for CYs 2011 and 2012.
It also shows the appropriations, allotments, obligations and balances by
department/agency and by source, and the common and significant audit observations
and recommendations.
The report comprises of the following:
Volume I-A – Contains the Report Highlights, Condensed Financial
Statements, and Financial Analyses, and write-ups on the
Appropriations, Allotments, Obligations and Balances, NG
Debt, Special Accounts in the General Fund, and
Comprehensive Agrarian Reform Program
2
Volume I- B – Includes the Detailed Financial Statements by Department/
Office, Schedules and Annexes
1.4 Methodologies
1.4.1 Appropriations, Allotments, Obligations and Balances
The budget data presented in this report comprise the total current year’s
appropriations, prior year’s continuing appropriations set by law to be available
until the end of the year and automatic appropriations which do not require
periodic action by Congress. The total allotments released by the Department of
Budget and Management (DBM) during the year are monitored and recorded in
the Registry of Appropriations and Allotments (RAPAL) maintained by COA-
GAS. These informations are consolidated together with the obligations incurred
sourced from the Statement of Allotments, Obligations and Balances submitted
by NGAs.
The appropriations and allotments were reconciled with the records of the
DBM and the NGAs and necessary corrections and adjustments were
communicated and effected accordingly. Similarly, obligations incurred by
agencies were confirmed to ascertain that such commitments were duly covered
by allotments and overdraft in allotments, if any, was properly coordinated with
the concerned agency.
1.4.2 Financial Statements
The overall consolidated financial data presented in the AFR were culled
from the 2012 financial reports of the NG which were prepared by agency
accountants in accordance with the rules and regulations under the New
Government Accounting System (NGAS). The accounts in the advance copies
of trial balances submitted by NGAs were uploaded into the AFR System from
which the individual agency BS, SIE as well as the SGE were generated and
compared with the audited FS submitted by the COA audit sector. The system
also generated the overall consolidated FS by department/office.
The elimination of inter-agency and intra-agency accounts was based on the
overall BS. The inter-agency receivables were eliminated with the inter-agency
payables to show the amount of cash expected to be realized from the
receivables and the actual payables subsisting between NGAs, LGUs and
GOCCs. On the other hand, the intra-agency receivables were also eliminated
with intra-agency payables to show the balances of reciprocal accounts
subsisting between the Central Offices (COs), the Regional Offices (ROs)/Staff
Bureaus, and the Operating Units (OUs). Inasmuch as the inter-agency and
intra-agency accounts are not reconciled at the agency level, these accounts still
reflect balances even after the elimination was done.
3
The aggregate income of the NG was based on the consolidated SIE
generated from the system presented by Regular Agency (RA) Book and
National Government (NG) Book. The details of the total income presented in
this report was based on the consolidated Report of Income (ROI) submitted by
the NGAs, since under the NG Book maintained by the Bureau of the Treasury
(BTr.), the various tax revenue accounts are categorized as Other National Taxes
while majority of non-tax revenue accounts are classified as Other Service
Income.
The SCF submitted by NGAs were analyzed and converted into the
prescribed format to expedite inputting and processing of data into the AFR
system. Due to the absence of a module to offset collections of income/revenue
against remittances to the National Treasury, manual computation was done.
The offsetting, however, was made on the overall SCF due to lack of
information as to the nature of remittances made. The intra-agency and inter-
agency transfers were likewise not eliminated in the absence of data as to the
transferor/donor and transferee/recipient. The system generated the overall
consolidated SCF by book, by department/office and by agency.
1.4.3 National Government Debt
The data on NG debt were based on the 2012 advance copy of the FS,
Actual Debt Service Expenditures provided by the BTr, Department of Finance.
Budget information were sourced from the 2013 Budget of Expenditures and
Sources of Financing (BESF) and the 2012 General Appropriations Act (GAA),
R.A. No. 10155, furnished by the Department of Budget and Management
(DBM). The National Government Debt Accounting Division (NGDAD), BTr
submits to COA-GAS the analyses of loans and bonds payable, both foreign and
domestic. Based on the analyses, the data on beginning balances of outstanding
NG debt are reconciled with the ending balances reflected in the 2011 report. The
availments and repayments during the year were also based on the NGDAD
analyses. The ending balance of NG debt is reconciled with the Loans and Bonds
Payable, foreign and domestic, appearing in the BS of the BTr - NG Book.
Appropriations for foreign assisted projects by department/agency were taken
from the 2012 GAA, while releases of allotments were based on the Agency
Budget Matrices (ABMs) and individual Special Allotment Release Orders
(SAROs) of the particular agencies. Comparative data between programmed and
actual budget for NG debt were based on the BESF and the COR.
1.4.4 Special Account in the General Fund (SAGF)
The financial information for SAGF as of December 31, 2012 were obtained
after the consolidation of the trial balances submitted by national government
agencies except the CARP (Fund 158) which is presented in Part VIII of this
report. Not included herein are the transactions pertaining to SAGF, which were
integrated in the General Fund 101 of the departments/agencies since no separate
books were maintained. However, the income collected by various NGAs and
remitted to the National Treasury was included based on the actual income
4
recorded in the books of the BTr either as Grants and Donations or Other Service
Income. The utilization of the amount is subject to the approval of special budget
released through SAROs and issuance of NCAs.
1.4.5 Comprehensive Agrarian Reform Fund (CARP)
The data on budget/appropriations, allotments and obligations exhibited in
this portion were gathered from the financial reports of implementing agencies
which received fund releases during the year to implement CARP projects,
materials submitted by the Presidential Agrarian Reform Council (PARC) and
reports from the DAR auditing unit in-charge of the consolidation of the CARP.
For Fiscal Year 2012, the entire budget data of DAR for all funds were
consolidated into the CARP inasmuch as it is its mandate. Besides it is difficult
to determine how much from Funds 101 and 102 are not CARP related.
Furthermore, two implementing agencies were no longer components of the data
on appropriations, allotments and obligations for this year since no releases of
allotments were made to the DPWH while the appropriation intended for DOF-
LBP was withdrawn by the DBM and transferred to the pooled savings.
However, there was transfer of funds to DOF-Municipal Development Fund
Office (MDFO) for CARP implementation.
This year’s consolidated data on assets, liabilities, equity, income and
expenses were based on the Balance Sheet and Statement of Income and
Expenses of all CARP implementing agencies including DOF-LBP and DOF-
MDFO.
1.5 Coverage
The financial information presented in this AFR were gathered from the audited
and advance copies of financial statements (FS)/reports of 323 national government
agencies (NGAs). There were 505 Preliminary Trial Balances (PTB)/FS of the cited
number of NGAs which were uploaded into the AFR System in order to generate the
Over-all Consolidated Financial Statements of the National Government. It is worth
mentioning that for Fiscal Year 2012, there was 100 percent submission of advanced
copies of FS by the NGAs’ accounting units compared to last year of 98.48 percent.
On the other hand, of the total 323 agencies, only 264 or 81.73 percent audited
financial reports were submitted by the auditors and downloaded from the COA Web.
Compared to last year audited FS of 224, there was an increment of 40 or 17.86
percent. This year’s unsubmitted audited FS of the 59 agencies/offices were received by
GAS after the cut-off date.

II. REPORT HIGHLIGHTS
5
REPORT HIGHLIGHTS
2.1 Budget Information
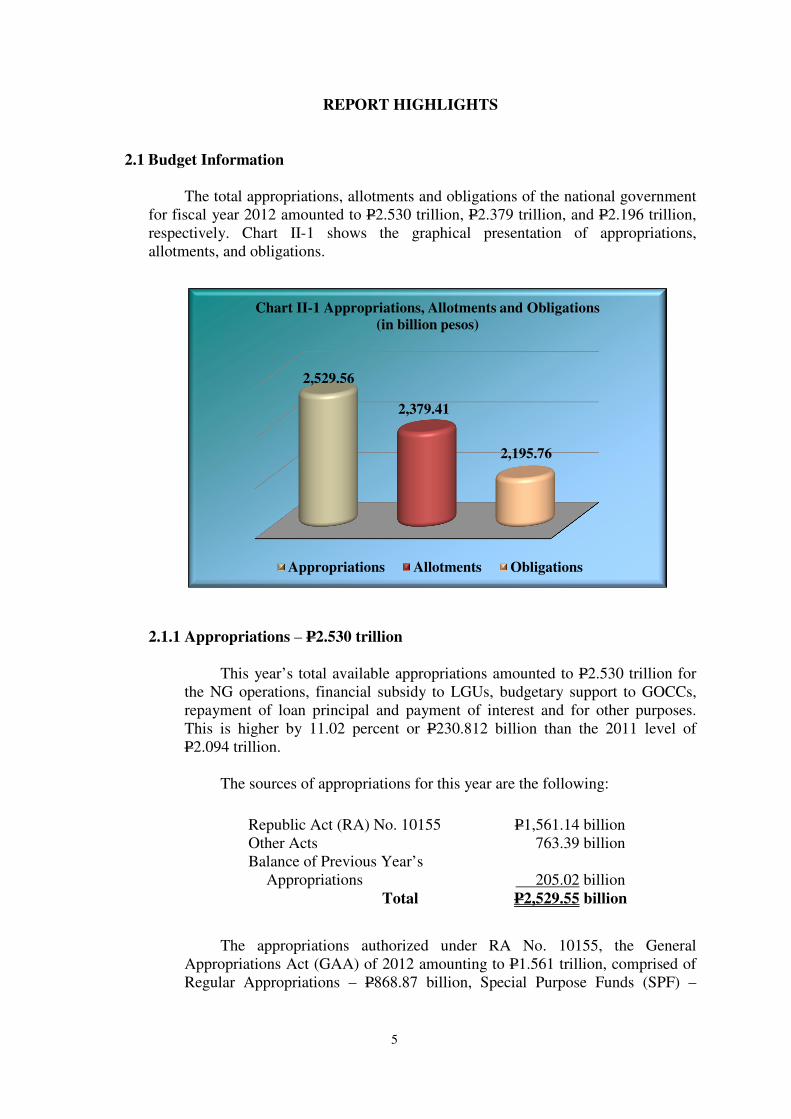
The total appropriations, allotments and obligations of the national government
for fiscal year 2012 amounted to P2.530 trillion, P2.379 trillion, and P2.196 trillion,
respectively. Chart II-1 shows the graphical presentation of appropriations,
allotments, and obligations.
2.1.1 Appropriations – P2.530 trillion
This year’s total available appropriations amounted to P2.530 trillion for
the NG operations, financial subsidy to LGUs, budgetary support to GOCCs,
repayment of loan principal and payment of interest and for other purposes.
This is higher by 11.02 percent or P230.812 billion than the 2011 level of
P2.094 trillion.
The sources of appropriations for this year are the following:
The appropriations authorized under RA No. 10155, the General
Appropriations Act (GAA) of 2012 amounting to P1.561 trillion, comprised of
Regular Appropriations – P868.87 billion, Special Purpose Funds (SPF) –
Republic Act (RA) No. 10155 P1,561.14 billion
Other Acts 763.39 billion
Balance of Previous Year’s
Appropriations
205.02 billion
Total P2,529.55 billion
2,529.56
2,379.41
2,195.76
Chart II-1 Appropriations, Allotments and Obligations
(in billion pesos)
Appropriations Allotments Obligations
6
P367.54 billion, Automatic Appropriations – P315.95 billion and Special
Account in the General Fund – P8.78 billion.
The details of appropriations authorized under Other Acts or laws for the
year totaling P763.39 billion are as follows:
Amount
(in million pesos)
1. Debt Service Fund (DSF) 706,139.31
Principal Repayment 398,313.81
Interest Payment 307,825.50
2. Special Account in the General Fund (SAGF) 29,637.87
3. Retirement and Life Insurance Premium 27,612.53
Total 763,389.70
Note: Difference between totals and sum of components is due to rounding off.
The unobligated/unreleased balance of the preceding year’s
appropriations authorized to be used in the current year under RA No. 10147,
the 2011 GAA, and other laws amounting to P205.02 billion consisted of the
following:
Amount
(in million pesos)
1. Unobligated Allotments
140,318.35
RA No. 10147 114,256.35
Regular Appropriations 96,627.92
Special Purpose Fund 14,050.12
Automatic Appropriations 1,951.92
Special Account in the General Fund 1,626.39
Other Acts 26,062.00
Regular Appropriations 5,224.14
Automatic Appropriations 20,837.85
2. Unreleased Appropriations 64,704.62
RA No. 10147 64,704.62
Regular Appropriations 12,537.32
Special Purpose Fund 51,167.29
Special Account in the General Fund 1,000.00
Total 205,022.97 Note: Difference between totals and sum of components is due to rounding off.
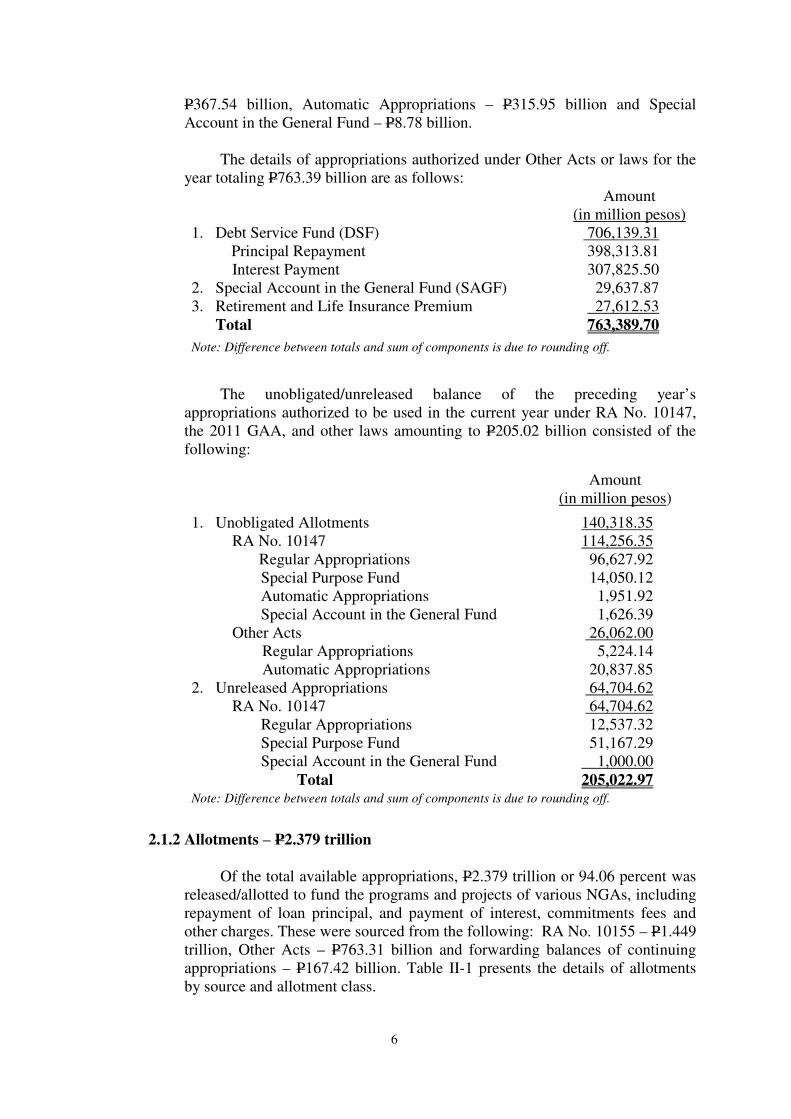
2.1.2 Allotments – P2.379 trillion
Of the total available appropriations, P2.379 trillion or 94.06 percent was
released/allotted to fund the programs and projects of various NGAs, including
repayment of loan principal, and payment of interest, commitments fees and
other charges. These were sourced from the following: RA No. 10155 – P1.449
trillion, Other Acts – P763.31 billion and forwarding balances of continuing
appropriations – P167.42 billion. Table II-1 presents the details of allotments
by source and allotment class.
7
Table II-1 Allotment by Source of Appropriations and Allotment Class
(in million pesos)
Source Allotment Class
Total PS MOOE FE CO
RA No. 10155 1,448,673.40 531,702.76 616,860.52 0.57 300,109.55
Regular 845,600.60 427,086.44 217,630.08 0.57 200,883.50
SPF 278,493.39 101,897.62 79,314.48 - 97,281.30
SAGF 8,629.99 2,483.74 5,956.30 - 189.95
Automatic 315,949.42 234.96 313,959.66 -_ 1,754.80
IRA 273,309.59 - 273,309.59 - -
Tax Subsidy 33,232.97 - 33,232.97 - -
Customs
Duties
4,938.63
-
4,938.63
-
-
SAGF 2,190.52 230.08 972.38 - 988.06
Grants and
Donations
1,612.97
4.87
849.21
-
758.89
Tax Refunds 599.76 - 599.76 - -
Sale of Assets 44.97 - 40.72 - 4.25
NIPAS 20.00 - 16.40 - 3.60
Other Acts
Automatic 763,310.96 27,626.54 7,996.77 307,825.50 419,862.15
DSF 706,139.31 - -__ 307,825.50 398,313.81
Principal 398,313.81 - - - 398,313.81
Interest 307,825.50 - - 307,825.50 -
SAGF 29,559.85 14.74 7,996.77 - 21,548.34
RLIP 27,611.80 27,611.80 - - -
Continuing 167,424.14 955.70 59,277.85 0.64 107,189.94
Unobligated 140,318.35 955.70 48,520.66 0.64 90,841.34
RA No. 10147 114,256.35 571.66 40,414.56 0.64 73,269.49
Regular 96,627.92 560.86 34,156.99 0.64 61,909.43
SPF 14,050.12 10.80 3,557.59 - 10,481.73
Automatic 1,951.92 - 1,149.75 - 802.17
SAGF 1,626.39 - 1,550.23 - 76.16
Other Acts 26,062.00 384.04 8,106.10 _- 17,571.85
Regular 5,224.14 375.48 825.71 - 4,022.96
Automatic 20,837.85 8.57 7,280.39 - 13,548.89
Unreleased 27,105.79 -_ 10,757.19 - 16,348.60
Regular 13,315.16 - 1,223.41 - 12,091.75
SPF 12,790.63 - 8,533.78 - 4,256.85
SAGF 1,000.00 - 1,000.00 - -
Grand Total 2,379,408.50 560,285.00 684,135.15 307,826.72 827,161.63
Note: Difference between totals and sum of components is due to rounding off.
Out of the total allotments for the year, 44.6 percent or P979.45 billion
was released for Debt Service and Internal Revenue Allotments with P706.14
billion and P273.31 billion, respectively. Debt Service was intended for the
payments of principal and interest of loans of the NG while the IRA was
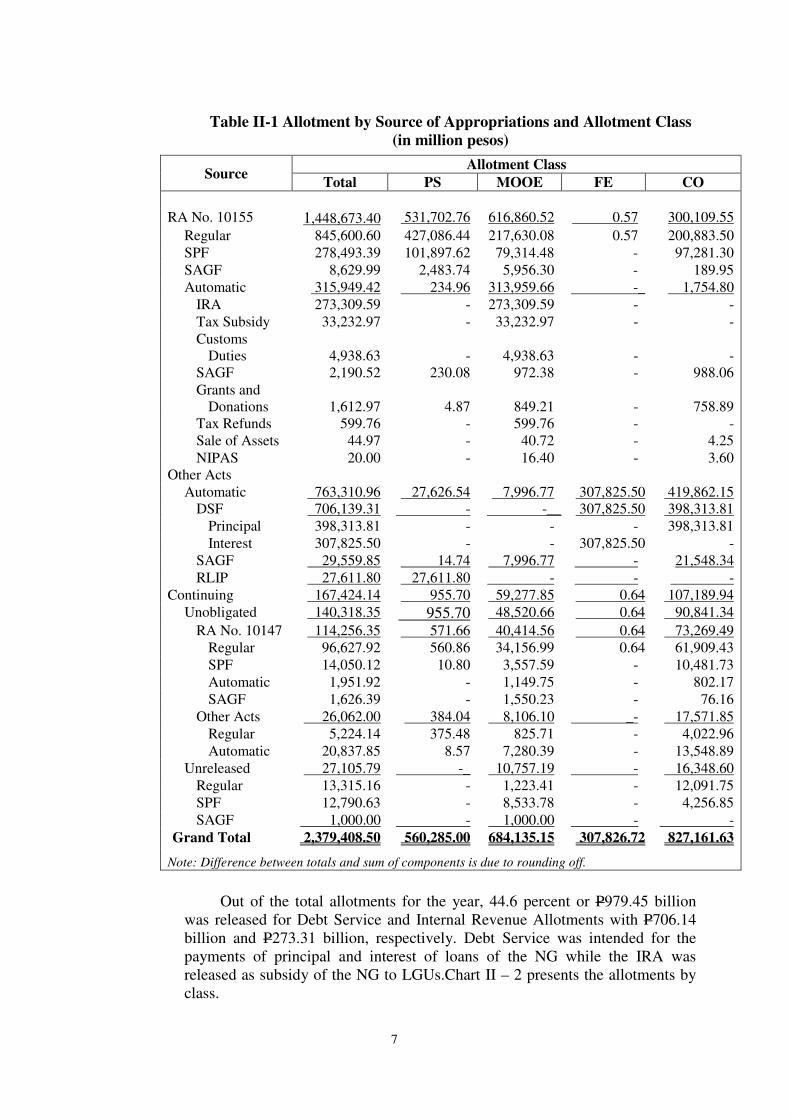
released as subsidy of the NG to LGUs.Chart II – 2 presents the allotments by
class.
8
By Expense Class, CO received the lion’s share of 34.76 percent or
P827.16 billion, of which P398.31 billion was allotted for loan principal
repayments.
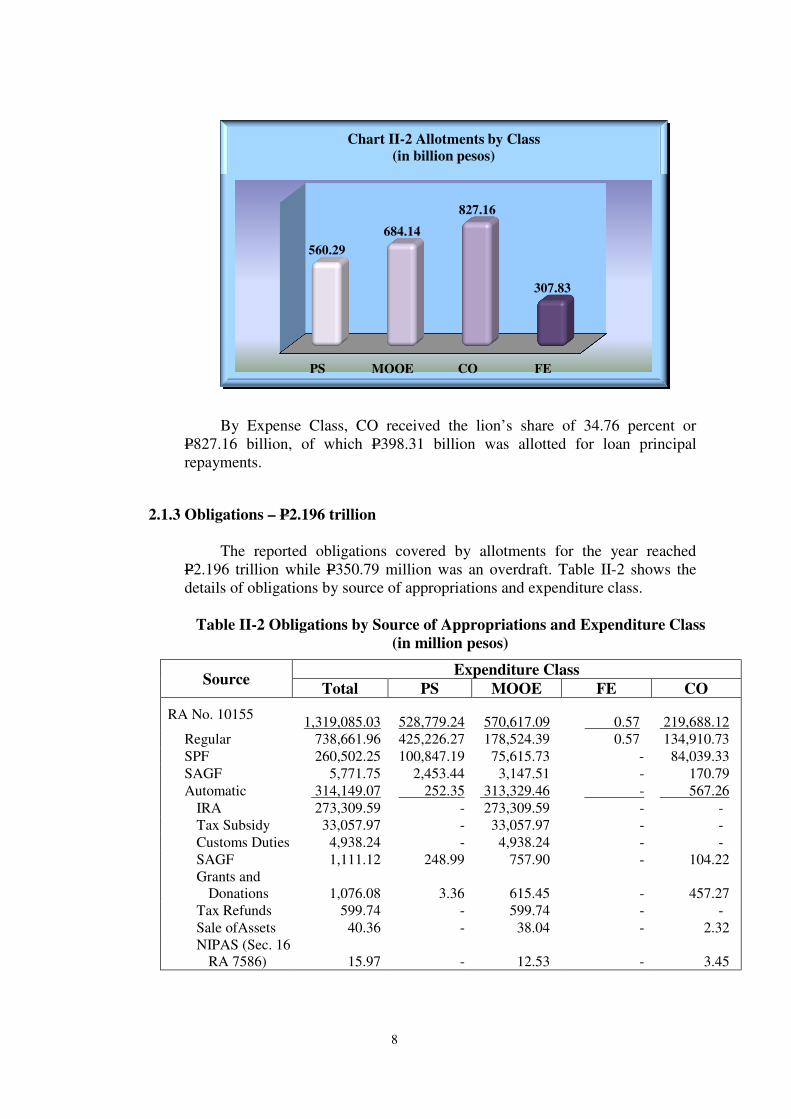
2.1.3 Obligations – P2.196 trillion
The reported obligations covered by allotments for the year reached
P2.196 trillion while P350.79 million was an overdraft. Table II-2 shows the
details of obligations by source of appropriations and expenditure class.
Table II-2 Obligations by Source of Appropriations and Expenditure Class
(in million pesos)
Source Expenditure Class
Total PS MOOE FE CO
RA No. 10155
1,319,085.03
528,779.24
570,617.09
0.57
219,688.12
Regular 738,661.96 425,226.27 178,524.39 0.57 134,910.73
SPF 260,502.25 100,847.19 75,615.73 - 84,039.33
SAGF 5,771.75 2,453.44 3,147.51 - 170.79
Automatic 314,149.07 252.35 313,329.46 - 567.26
IRA 273,309.59 - 273,309.59 - -
Tax Subsidy 33,057.97 - 33,057.97 - -
Customs Duties 4,938.24 - 4,938.24 - -
SAGF 1,111.12 248.99 757.90 - 104.22
Grants and
Donations
1,076.08
3.36
615.45
-
457.27
Tax Refunds 599.74 - 599.74 - -
Sale ofAssets 40.36 - 38.04 - 2.32
NIPAS (Sec. 16
RA 7586)
15.97
-
12.53
-
3.45
PS MOOE CO FE
560.29
684.14
827.16
307.83
Chart II-2 Allotments by Class
(in billion pesos)
9
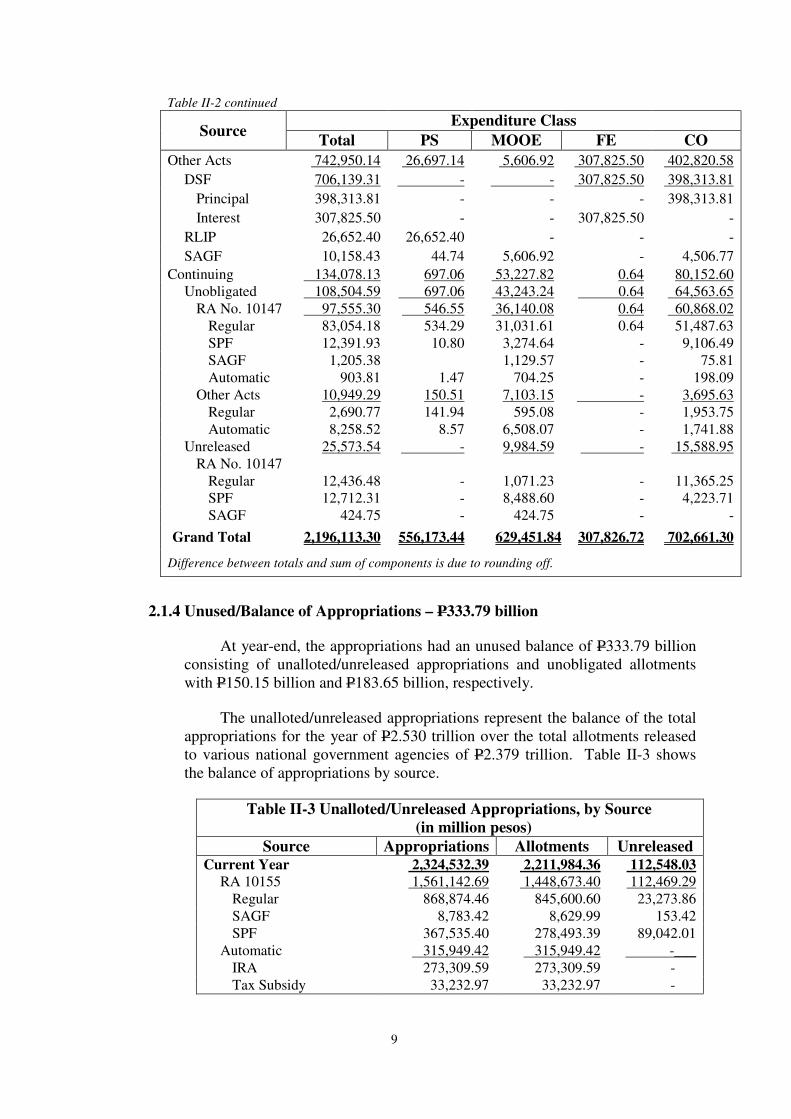
Table II-2 continued
Source Expenditure Class
Total PS MOOE FE CO
Other Acts 742,950.14 26,697.14 5,606.92 307,825.50 402,820.58
DSF 706,139.31 - - 307,825.50 398,313.81
Principal 398,313.81 - - - 398,313.81
Interest 307,825.50 - - 307,825.50 -
RLIP 26,652.40 26,652.40 - - -
SAGF 10,158.43 44.74 5,606.92 - 4,506.77
Continuing 134,078.13 697.06 53,227.82 0.64 80,152.60
Unobligated 108,504.59 697.06 43,243.24 0.64 64,563.65
RA No. 10147 97,555.30 546.55 36,140.08 0.64 60,868.02
Regular 83,054.18 534.29 31,031.61 0.64 51,487.63
SPF 12,391.93 10.80 3,274.64 - 9,106.49
SAGF 1,205.38 1,129.57 - 75.81
Automatic 903.81 1.47 704.25 - 198.09
Other Acts 10,949.29 150.51 7,103.15 - 3,695.63
Regular 2,690.77 141.94 595.08 - 1,953.75
Automatic 8,258.52 8.57 6,508.07 - 1,741.88
Unreleased 25,573.54 - 9,984.59 - 15,588.95
RA No. 10147
Regular 12,436.48 - 1,071.23 - 11,365.25
SPF 12,712.31 - 8,488.60 - 4,223.71
SAGF 424.75 - 424.75 - -
Grand Total 2,196,113.30 556,173.44 629,451.84 307,826.72 702,661.30
Difference between totals and sum of components is due to rounding off.
2.1.4 Unused/Balance of Appropriations – P333.79 billion
At year-end, the appropriations had an unused balance of P333.79 billion
consisting of unalloted/unreleased appropriations and unobligated allotments
with P150.15 billion and P183.65 billion, respectively.
The unalloted/unreleased appropriations represent the balance of the total
appropriations for the year of P2.530 trillion over the total allotments released
to various national government agencies of P2.379 trillion. Table II-3 shows
the balance of appropriations by source.
Table II-3 Unalloted/Unreleased Appropriations, by Source
(in million pesos)
Source Appropriations Allotments Unreleased Current Year 2,324,532.39 2,211,984.36 112,548.03
RA 10155 1,561,142.69 1,448,673.40 112,469.29
Regular 868,874.46 845,600.60 23,273.86
SAGF 8,783.42 8,629.99 153.42
SPF 367,535.40 278,493.39 89,042.01
Automatic 315,949.42 315,949.42 -___
IRA 273,309.59 273,309.59 -
Tax Subsidy 33,232.97 33,232.97 -
10
Table II-3 continued
Source Appropriations Allotments Unreleased
Customs Duties 4,938.63 4,938.63 -
SAGF 2,191.19 2,190.52 0.68
Grants and Donations 1,612.30 1,612.97 (0.68)
Tax Refunds 599.76 599.76 -
Sale of Assets 44.97 44.97 -
NIPAS 20.00 20.00 -
Other Acts 763,389.70 763,310.96 78.75
DSF 706,139.31 706,139.31 -
SAGF 29,637.87 29,559.85 78.02
RLIP 27,612.53 27,611.80 0.73
Continuing
Appropriations
205,022.97 167,424.14 0.04
RA 10147 178,960.97 141,362.14 37,598.83
Alloted 114,256.35 114,256.35 __ -__
Regular 96,627.92 96,627.92 -
SPF 14,050.12 14,050.12 -
Automatic 1,951.92 1,951.92 -
SAGF 1,626.39 1,626.39 -
Unalloted 64,704.62 27,105.79 37,598.83
Regular 12,537.32 13,315.16 (777.83)
SPF 51,167.29 12,790.63 38,376.66
SAGF 1,000.00 1,000.00 -
Other Acts 26,062.00 26,062.00 -__
Alloted 26,062.00 26,062.00 _ -__
Regular 5,224.14 5,224.14 -
Automatic 20,837.85 20,837.85 -
Total 2,529,555.36 2,379,408.50 150,146.86
Difference between totals and sum of components is due to rounding off.
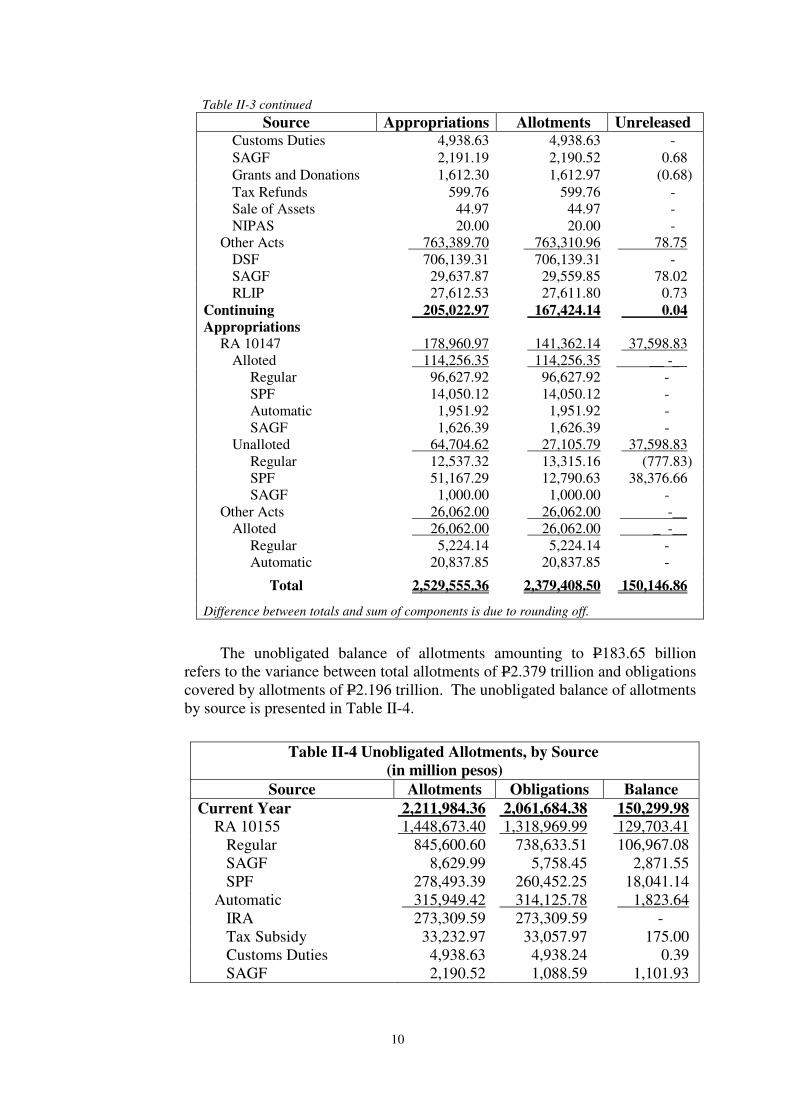
The unobligated balance of allotments amounting to P183.65 billion
refers to the variance between total allotments of P2.379 trillion and obligations
covered by allotments of P2.196 trillion. The unobligated balance of allotments
by source is presented in Table II-4.
Table II-4 Unobligated Allotments, by Source
(in million pesos)
Source Allotments Obligations Balance
Current Year 2,211,984.36 2,061,684.38 150,299.98
RA 10155 1,448,673.40 1,318,969.99 129,703.41
Regular 845,600.60 738,633.51 106,967.08
SAGF 8,629.99 5,758.45 2,871.55
SPF 278,493.39 260,452.25 18,041.14
Automatic 315,949.42 314,125.78 1,823.64
IRA 273,309.59 273,309.59 -
Tax Subsidy 33,232.97 33,057.97 175.00
Customs Duties 4,938.63 4,938.24 0.39
SAGF 2,190.52 1,088.59 1,101.93
11
Table II-4 continued
Source Allotments Obligations Balance
Grants and Donations 1,612.97 1,075.31 537.66
Tax Refunds 599.76 599.74 0.02
Sale of Assets 44.97 40.36 4.62
NIPAS 20.00 15.97 4.03
Other Acts 763,310.96 742,714.39 20,596.57
DSF 706,139.31 706,139.31 -
RLIP 27,611.80 26,635.85 975.95
SAGF 29,559.85 9,939.23 19,620.62
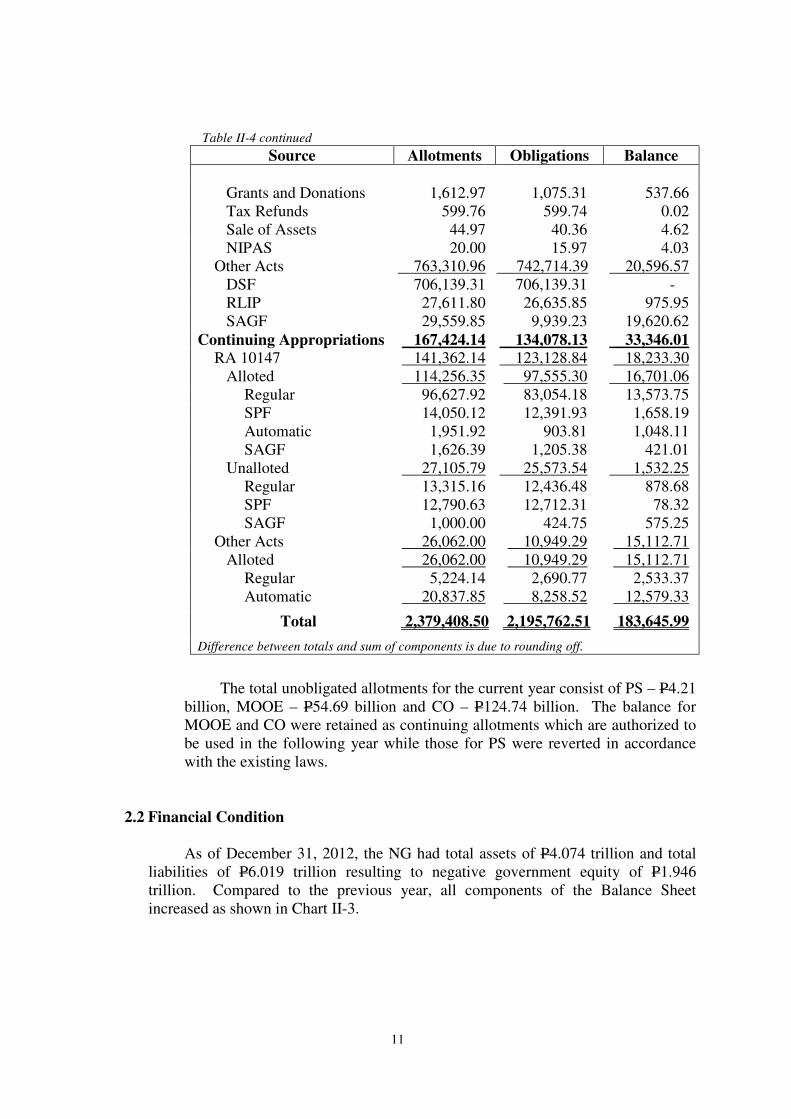
Continuing Appropriations 167,424.14 134,078.13 33,346.01
RA 10147 141,362.14 123,128.84 18,233.30
Alloted 114,256.35 97,555.30 16,701.06
Regular 96,627.92 83,054.18 13,573.75
SPF 14,050.12 12,391.93 1,658.19
Automatic 1,951.92 903.81 1,048.11
SAGF 1,626.39 1,205.38 421.01
Unalloted 27,105.79 25,573.54 1,532.25
Regular 13,315.16 12,436.48 878.68
SPF 12,790.63 12,712.31 78.32
SAGF 1,000.00 424.75 575.25
Other Acts 26,062.00 10,949.29 15,112.71
Alloted 26,062.00 10,949.29 15,112.71
Regular 5,224.14 2,690.77 2,533.37
Automatic 20,837.85 8,258.52 12,579.33
Total 2,379,408.50 2,195,762.51 183,645.99
Difference between totals and sum of components is due to rounding off.
The total unobligated allotments for the current year consist of PS – P4.21
billion, MOOE – P54.69 billion and CO – P124.74 billion. The balance for
MOOE and CO were retained as continuing allotments which are authorized to
be used in the following year while those for PS were reverted in accordance
with the existing laws.
2.2 Financial Condition
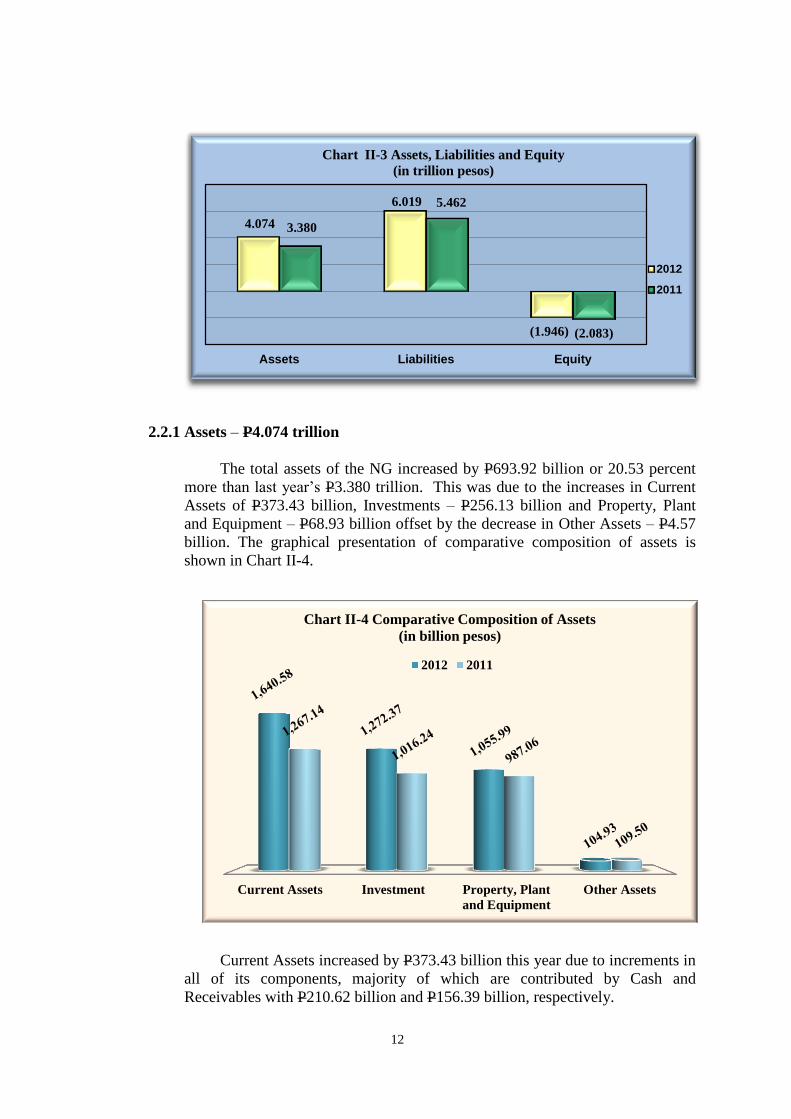
As of December 31, 2012, the NG had total assets of P4.074 trillion and total
liabilities of P6.019 trillion resulting to negative government equity of P1.946
trillion. Compared to the previous year, all components of the Balance Sheet
increased as shown in Chart II-3.
12
2.2.1 Assets – P4.074 trillion
The total assets of the NG increased by P693.92 billion or 20.53 percent
more than last year’s P3.380 trillion. This was due to the increases in Current
Assets of P373.43 billion, Investments – P256.13 billion and Property, Plant
and Equipment – P68.93 billion offset by the decrease in Other Assets – P4.57
billion. The graphical presentation of comparative composition of assets is
shown in Chart II-4.
Current Assets increased by P373.43 billion this year due to increments in
all of its components, majority of which are contributed by Cash and
Receivables with P210.62 billion and P156.39 billion, respectively.
Current Assets Investment Property, Plant
and Equipment
Other Assets
Chart II-4 Comparative Composition of Assets
(in billion pesos)
2012 2011
4.074
6.019
(1.946)
3.380
5.462
(2.083)
Assets Liabilities Equity
Chart II-3 Assets, Liabilities and Equity
(in trillion pesos)
2012
2011
13
Investments’ growth of P256.13 billion this year is brought about by the
P155.41 billion increments in Sinking Fund contributions and P100.72 billion
improvement in Investment in Securities.
Property, Plant and Equipment, net of accumulated depreciation showed
minimal increase of 6.98 percent or P68.93 billion while Other Assets
decreased by P4.57 billion.
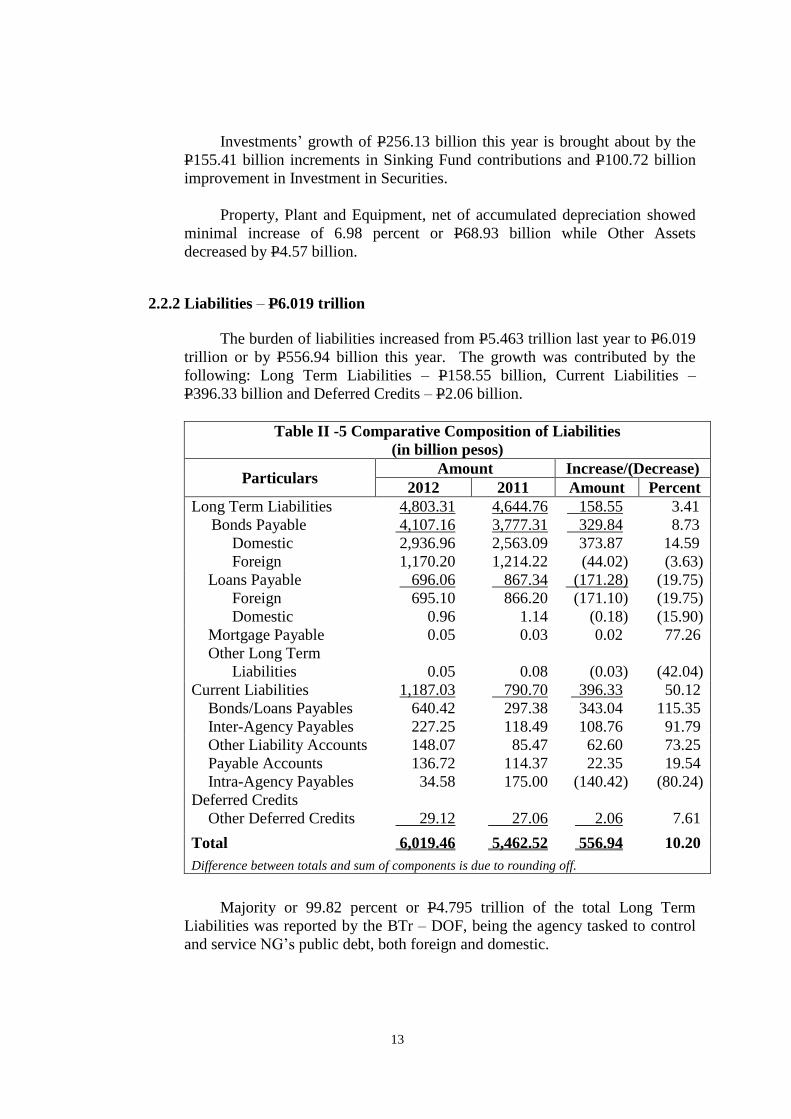
2.2.2 Liabilities – P6.019 trillion
The burden of liabilities increased from P5.463 trillion last year to P6.019
trillion or by P556.94 billion this year. The growth was contributed by the
following: Long Term Liabilities – P158.55 billion, Current Liabilities –
P396.33 billion and Deferred Credits – P2.06 billion.
Table II -5 Comparative Composition of Liabilities
(in billion pesos)
Particulars Amount Increase/(Decrease)
2012 2011 Amount Percent
Long Term Liabilities 4,803.31 4,644.76 158.55 3.41
Bonds Payable 4,107.16 3,777.31 329.84 8.73
Domestic 2,936.96 2,563.09 373.87 14.59
Foreign 1,170.20 1,214.22 (44.02) (3.63)
Loans Payable 696.06 867.34 (171.28) (19.75)
Foreign 695.10 866.20 (171.10) (19.75)
Domestic 0.96 1.14 (0.18) (15.90)
Mortgage Payable 0.05 0.03 0.02 77.26
Other Long Term
Liabilities
0.05
0.08
(0.03)
(42.04)
Current Liabilities 1,187.03 790.70 396.33 50.12
Bonds/Loans Payables 640.42 297.38 343.04 115.35
Inter-Agency Payables 227.25 118.49 108.76 91.79
Other Liability Accounts 148.07 85.47 62.60 73.25
Payable Accounts 136.72 114.37 22.35 19.54
Intra-Agency Payables 34.58 175.00 (140.42) (80.24)
Deferred Credits
Other Deferred Credits 29.12 27.06 2.06 7.61
Total 6,019.46 5,462.52 556.94 10.20
Difference between totals and sum of components is due to rounding off.
Majority or 99.82 percent or P4.795 trillion of the total Long Term
Liabilities was reported by the BTr – DOF, being the agency tasked to control
and service NG’s public debt, both foreign and domestic.
14
2.2.3 Government Equity – (P1.946 trillion)
As in previous years, liabilities of the NG exceeded the assets resulting to
negative balance of P1.946 trillion in equity. This year’s level posted a positive
increase of P136.98 billion or 6.58 per cent compared to negative P2.083
trillion reported in 2011.
The decrease in the negative balance was brought about by net income –
P239.97 billion offset by adjustments related to prior years’ transactions –
P25.42 billion, completed public infrastructures – P28.03 billion and
reforestation projects – P1.30 billion, which were transferred to the Registry of
Public Infrastructures and Registry of Reforestation Projects, respectively, and
the remittance to National Treasury for disposal of assets – P11.36 million.
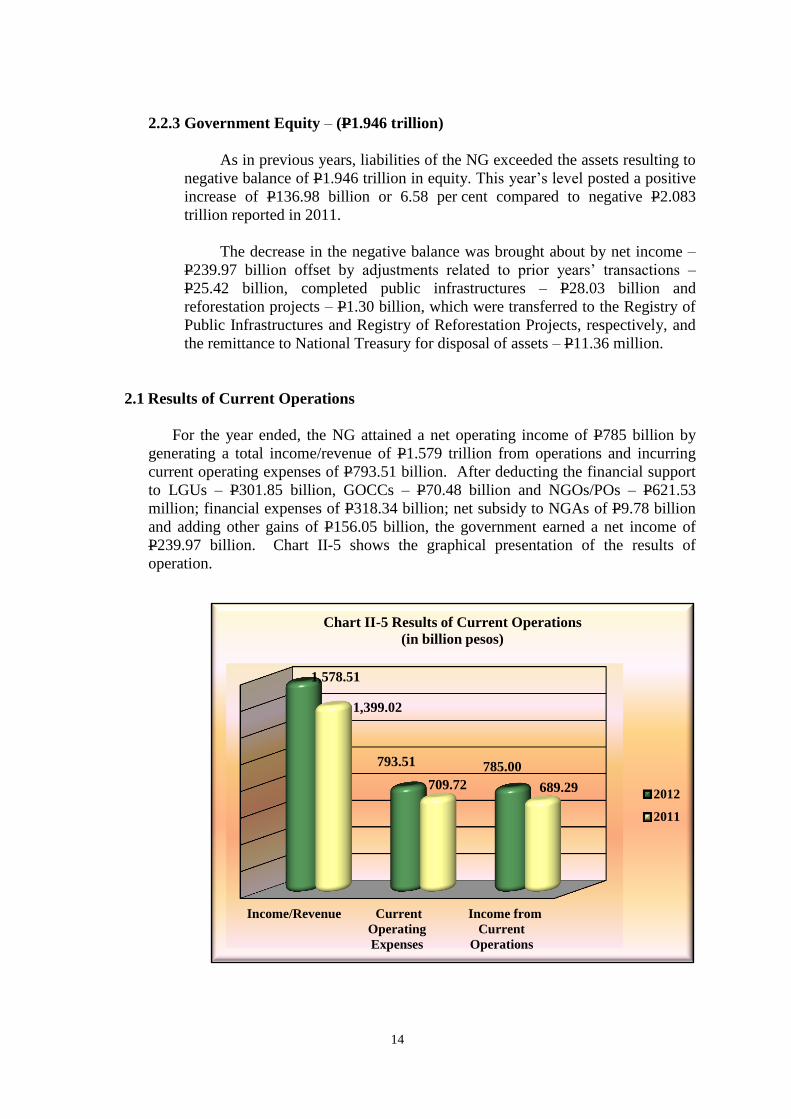
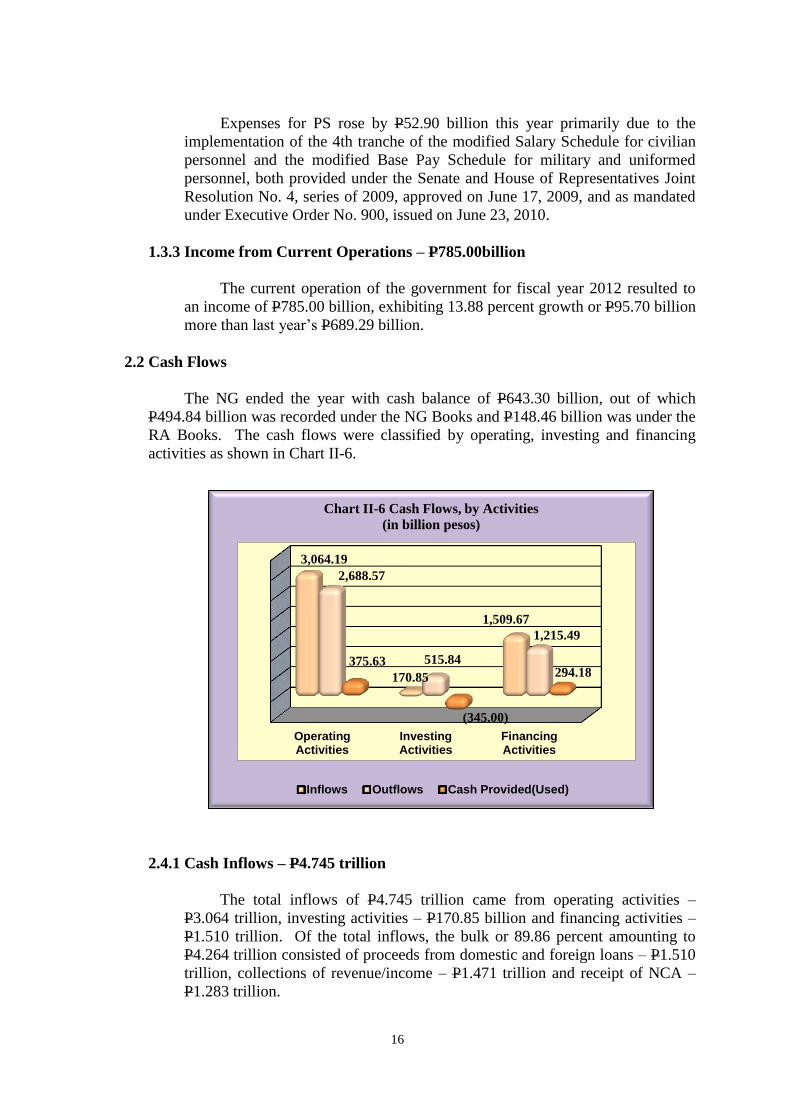
2.1 Results of Current Operations
For the year ended, the NG attained a net operating income of P785 billion by
generating a total income/revenue of P1.579 trillion from operations and incurring
current operating expenses of P793.51 billion. After deducting the financial support
to LGUs – P301.85 billion, GOCCs – P70.48 billion and NGOs/POs – P621.53
million; financial expenses of P318.34 billion; net subsidy to NGAs of P9.78 billion
and adding other gains of P156.05 billion, the government earned a net income of
P239.97 billion. Chart II-5 shows the graphical presentation of the results of
operation.
Income/Revenue Current
Operating
Expenses
Income from
Current
Operations
1,578.51
793.51 785.00
1,399.02
709.72 689.29
Chart II-5 Results of Current Operations
(in billion pesos)
2012
2011
15
1.3.1 Income/Revenue – P1.579 trillion
This year’s income/revenue of P1.579 trillion grew by P179.49 billion or
12.83 percent compared to previous year’s P1.399 trillion and surpassed the
projected amount of P1.561 trillion1 by P17.89 billion. The actual
income/revenue was generated from taxes – P1.357 trillion and non-taxes –
P221.98 billion.
The NG failed to realize its projected tax revenue of P1.427 trillion2 by
4.9 percent or P70.90 billion while general income of P221.98 billion exhibited
a 66.66 percent or P88.79 billion favorable variance over the estimated amount
of P133.20 billion.
Tax revenue of P1.357 trillion registered an increase of P134.58 billion
compared to last year’s figure of P1.222 trillion. This year’s tax revenue came
from the following sources:
Amount
(in million pesos)
Value Added Tax 365,316.80
Income Tax - Corporations 276,350.92
Income Tax - Individuals 179,033.03
Final Tax 162,304.09
Excise Tax on Articles 119,884.93
Value Added Tax - Expanded 80,484.26
Documentary Stamp Tax 54,678.11
Import Duties 42,386.03
Business Tax 54,134.95
Fines and Penalties - National Taxes 1,291.42
Motor Vehicles Users Charge 9,593.59
Capital Gains Tax 8,964.99
Other National Taxes 2,101.22
Total 1,356,524.34
Note: Difference between totals and sum of components is due to rounding off.
On the other hand, the general income increased by P44.91 billion from
P177.07 billion in 2011 to P221.98 billion this year. It is composed of Other
Income – P104.55 billion, Service Income – P62.50 billion, Business Income –
P45.83 billion and Permits and Licenses – P9.11 billion.
1.3.2 Current Operating Expenses – P793.51 billion
The current operating expenses of the NG totaling P793.51 billion
surpassed last year’s amount of P709.72 billion by 11.81 percent or P83.79
billion. The composition of the current operating expenses are as follows: PS –
P565.02 billion or 71.20 percent and MOOE – P228.50 billion or 28.80 percent.
1Table C.1, Revenue Program, by Source, 2011-2013, page 199,Budget of Expenditures and Sources of
Financing, Department of Budget and Management 2Ibid
16
Expenses for PS rose by P52.90 billion this year primarily due to the
implementation of the 4th tranche of the modified Salary Schedule for civilian
personnel and the modified Base Pay Schedule for military and uniformed
personnel, both provided under the Senate and House of Representatives Joint
Resolution No. 4, series of 2009, approved on June 17, 2009, and as mandated
under Executive Order No. 900, issued on June 23, 2010.
1.3.3 Income from Current Operations – P785.00billion
The current operation of the government for fiscal year 2012 resulted to
an income of P785.00 billion, exhibiting 13.88 percent growth or P95.70 billion
more than last year’s P689.29 billion.
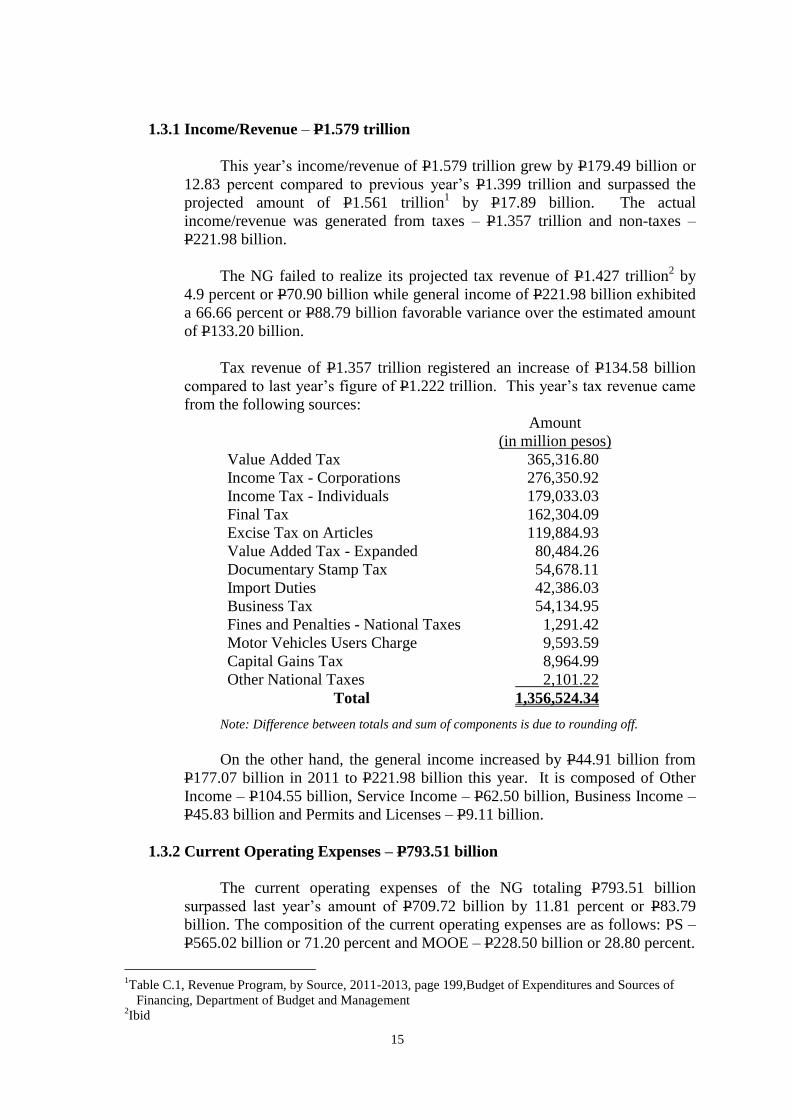
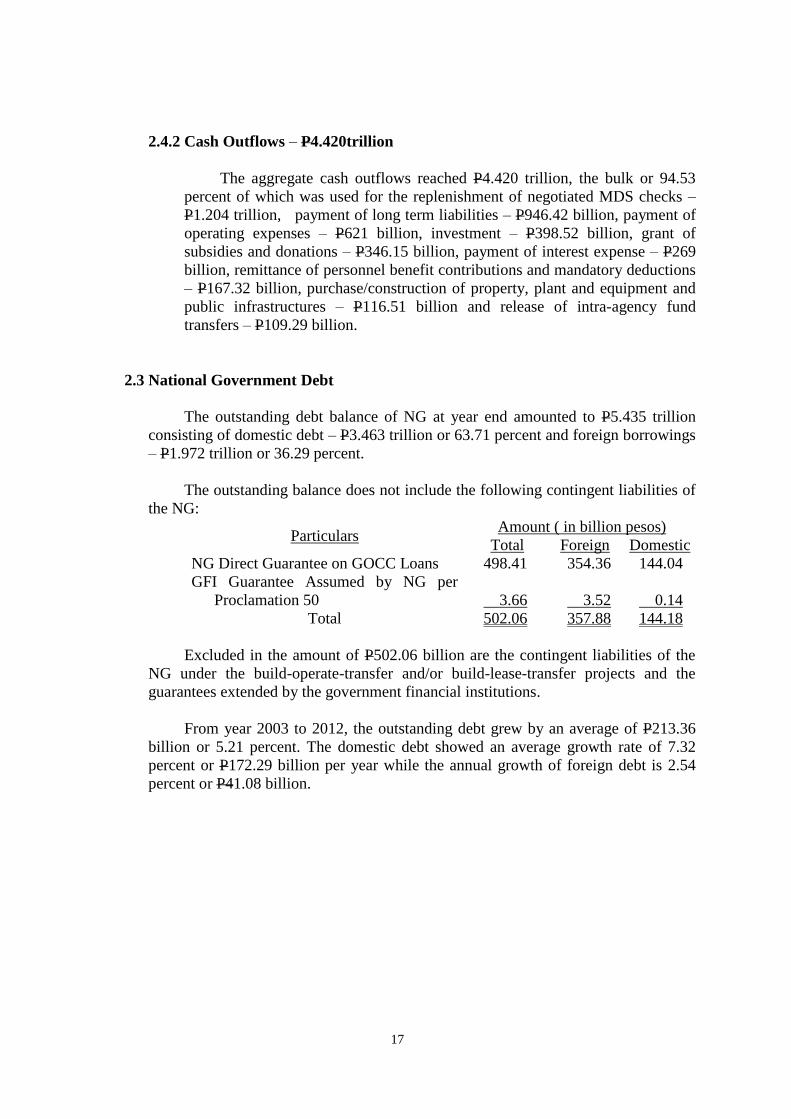
2.2 Cash Flows
The NG ended the year with cash balance of P643.30 billion, out of which
P494.84 billion was recorded under the NG Books and P148.46 billion was under the
RA Books. The cash flows were classified by operating, investing and financing
activities as shown in Chart II-6.
2.4.1 Cash Inflows – P4.745 trillion
The total inflows of P4.745 trillion came from operating activities –
P3.064 trillion, investing activities – P170.85 billion and financing activities –
P1.510 trillion. Of the total inflows, the bulk or 89.86 percent amounting to
P4.264 trillion consisted of proceeds from domestic and foreign loans – P1.510
trillion, collections of revenue/income – P1.471 trillion and receipt of NCA –
P1.283 trillion.
OperatingActivities
InvestingActivities
FinancingActivities
3,064.19
170.85
1,509.67
2,688.57
515.84
1,215.49
375.63
(345.00)
294.18
Chart II-6 Cash Flows, by Activities
(in billion pesos)
Inflows Outflows Cash Provided(Used)
17
2.4.2 Cash Outflows – P4.420trillion
The aggregate cash outflows reached P4.420 trillion, the bulk or 94.53
percent of which was used for the replenishment of negotiated MDS checks –
P1.204 trillion, payment of long term liabilities – P946.42 billion, payment of
operating expenses – P621 billion, investment – P398.52 billion, grant of
subsidies and donations – P346.15 billion, payment of interest expense – P269
billion, remittance of personnel benefit contributions and mandatory deductions
– P167.32 billion, purchase/construction of property, plant and equipment and
public infrastructures – P116.51 billion and release of intra-agency fund
transfers – P109.29 billion.
2.3 National Government Debt
The outstanding debt balance of NG at year end amounted to P5.435 trillion
consisting of domestic debt – P3.463 trillion or 63.71 percent and foreign borrowings
– P1.972 trillion or 36.29 percent.
The outstanding balance does not include the following contingent liabilities of
the NG:
Particulars Amount ( in billion pesos)
Total Foreign Domestic
NG Direct Guarantee on GOCC Loans 498.41 354.36 144.04
GFI Guarantee Assumed by NG per
Proclamation 50
3.66
3.52
0.14
Total 502.06 357.88 144.18
Excluded in the amount of P502.06 billion are the contingent liabilities of the
NG under the build-operate-transfer and/or build-lease-transfer projects and the
guarantees extended by the government financial institutions.
From year 2003 to 2012, the outstanding debt grew by an average of P213.36
billion or 5.21 percent. The domestic debt showed an average growth rate of 7.32
percent or P172.29 billion per year while the annual growth of foreign debt is 2.54
percent or P41.08 billion.
III. APPROPRIATIONS,
ALLOTMENTS,
OBLIGATIONS AND
BALANCES
18
APPROPRIATIONS, ALLOTMENTS, OBLIGATIONS AND BALANCES
3.1 Overview
The National Government (NG) budget for the year was described by
President Aquino as ‘Results-Focused Budget’ anchored on the five areas of priority
towards the achievement of his Administration’s Social Contract with the people,
namely: anti-corruption and good governance, poverty reduction and empowerment of
the poor, inclusive economic growth, just and lasting peace and the rule of law, and
integrity of the environment.
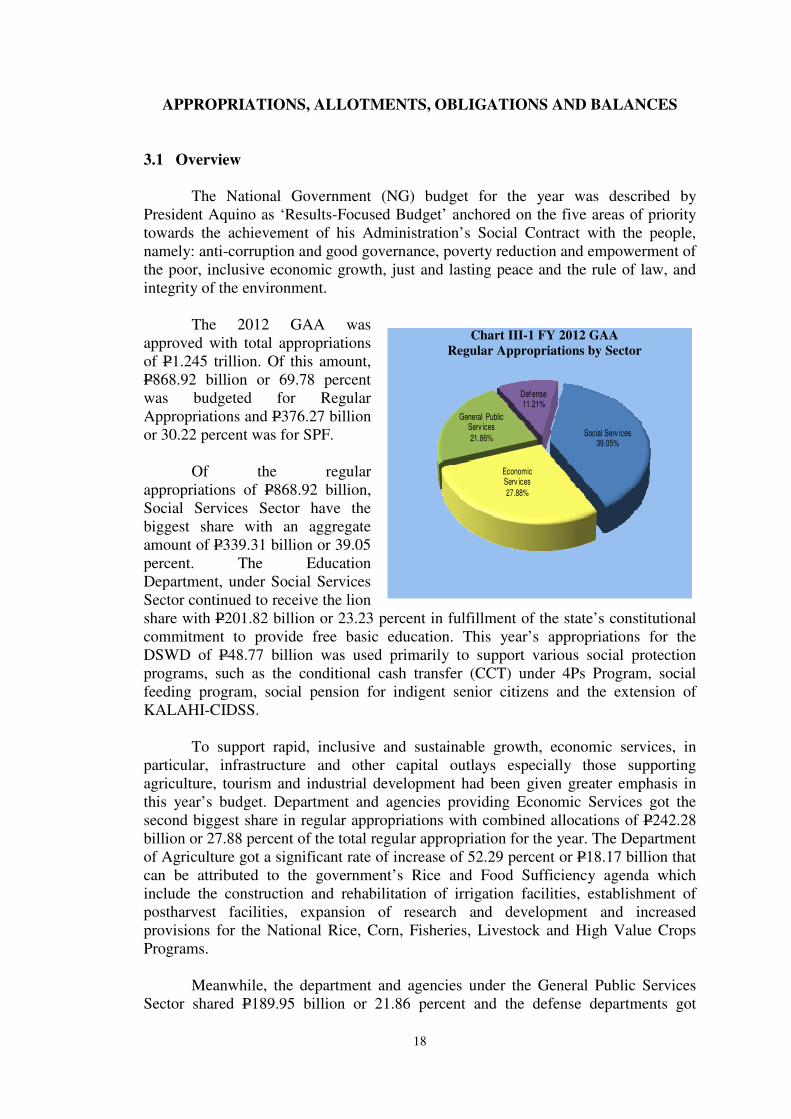
The 2012 GAA was
approved with total appropriations
of P1.245 trillion. Of this amount,
P868.92 billion or 69.78 percent
was budgeted for Regular
Appropriations and P376.27 billion
or 30.22 percent was for SPF.
Of the regular
appropriations of P868.92 billion,
Social Services Sector have the
biggest share with an aggregate
amount of P339.31 billion or 39.05
percent. The Education
Department, under Social Services
Sector continued to receive the lion
share with P201.82 billion or 23.23 percent in fulfillment of the state’s constitutional
commitment to provide free basic education. This year’s appropriations for the
DSWD of P48.77 billion was used primarily to support various social protection
programs, such as the conditional cash transfer (CCT) under 4Ps Program, social
feeding program, social pension for indigent senior citizens and the extension of
KALAHI-CIDSS.
To support rapid, inclusive and sustainable growth, economic services, in
particular, infrastructure and other capital outlays especially those supporting
agriculture, tourism and industrial development had been given greater emphasis in
this year’s budget. Department and agencies providing Economic Services got the
second biggest share in regular appropriations with combined allocations of P242.28
billion or 27.88 percent of the total regular appropriation for the year. The Department
of Agriculture got a significant rate of increase of 52.29 percent or P18.17 billion that
can be attributed to the government’s Rice and Food Sufficiency agenda which
include the construction and rehabilitation of irrigation facilities, establishment of
postharvest facilities, expansion of research and development and increased
provisions for the National Rice, Corn, Fisheries, Livestock and High Value Crops
Programs.
Meanwhile, the department and agencies under the General Public Services
Sector shared P189.95 billion or 21.86 percent and the defense departments got
Social Serv ices39.05%
Economic Serv ices
27.88%
General Public Serv ices
21.86%
Def ense11.21%
Chart III-1 FY 2012 GAA
Regular Appropriations by Sector
19
P97.37 billion or 11.21 percent of the total regular appropriation for the year. Chart
III-1 shows the sectoral distribution of the regular appropriations under the GAA for
2012.
3.2 Appropriations, Allotments, Obligations and Balances
An appropriation is an authorization under past Acts of Congress,
Presidential Decrees or other legislative enactments, for payments to be made with
funds of the government under specified condition and/or for specified purpose.
Allotments on the other hand, are the authorizations issued by the DBM to NGAs
to incur obligations or commitment to pay a sum of money for the implementation
of specific programs, projects and other expenditure items
In the Philippines, there are two sources of budgets being executed in a
given year, namely: the GAA for the current year which contains appropriations
intended to finance the programmed activities of departments and agencies and
special projects and other programs of the NG; and the balances of prior year’s
appropriations which are set by law to be available as continuing appropriations
until the end of the following year. In addition to these, automatic appropriations
provided by standing appropriation laws and Presidential Decrees also form part
of the total NG budget for the year.
The FY 2012 total NG budget aggregated at P2.529 trillion. Of this
amount, P1.245 trillion was provided under this year’s GAA, The balance was
sourced from Automatic Appropriations of P1.079 trillion and Continuing
Appropriations amounting to P205.02 billion.
Total allotments released by the DBM to carry out the functions of the NG
amounted to P2.379 trillion or 94.06 percent of the total NG budget for the year.
Of this amount, P1.133 trillion was released from this year’s GAA and the balance
was issued from the Automatic Appropriations of P1.079 trillion and Continuing
Appropriations of P167.42 billion.
Obligations incurred for the year aggregated to P2.196 trillion equivalent
to 92.28 percent of the total allotments released for the year. Of this amount,
P1.005 trillion was incurred under the GAA, P1.057 trillion for Automatic and
P134.08 billion for Continuing Appropriations.
The balances of unreleased appropriations and unobligated allotments for
this year’s budget stood at P150.15 billion and P183.64 billion, respectively, a
total of P333.79 billion.
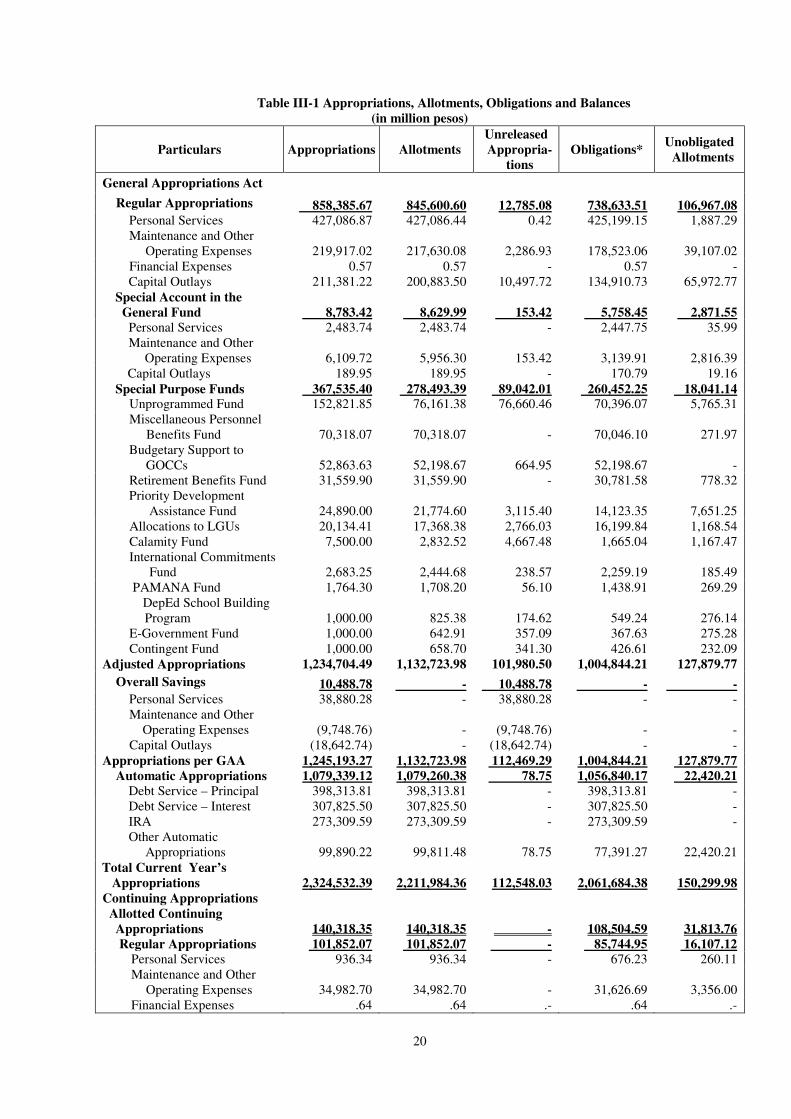
Table III-1 shows the summary of appropriations, allotments, obligations
incurred and balances for the year which are separately discussed in the
succeeding pages of this report. The details are presented by appropriation source
in Schedules 1 and 2, and by department/agency in Schedules 3 and 4, Volume I-
B.
20
Table III-1 Appropriations, Allotments, Obligations and Balances
(in million pesos)
Particulars Appropriations Allotments
Unreleased
Appropria-
tions
Obligations* Unobligated
Allotments
General Appropriations Act
Regular Appropriations 858,385.67 845,600.60 12,785.08 738,633.51 106,967.08 Personal Services 427,086.87 427,086.44 0.42 425,199.15 1,887.29
Maintenance and Other
Operating Expenses 219,917.02 217,630.08 2,286.93 178,523.06 39,107.02
Financial Expenses 0.57 0.57 - 0.57 -
Capital Outlays 211,381.22 200,883.50 10,497.72 134,910.73 65,972.77
Special Account in the
General Fund 8,783.42 8,629.99 153.42 5,758.45 2,871.55
Personal Services 2,483.74 2,483.74 - 2,447.75 35.99
Maintenance and Other
Operating Expenses 6,109.72 5,956.30 153.42 3,139.91 2,816.39
Capital Outlays 189.95 189.95 - 170.79 19.16
Special Purpose Funds 367,535.40 278,493.39 89,042.01 260,452.25 18,041.14 Unprogrammed Fund 152,821.85 76,161.38 76,660.46 70,396.07 5,765.31
Miscellaneous Personnel
Benefits Fund 70,318.07 70,318.07 - 70,046.10 271.97
Budgetary Support to
GOCCs 52,863.63 52,198.67 664.95 52,198.67 -
Retirement Benefits Fund 31,559.90 31,559.90 - 30,781.58 778.32
Priority Development
Assistance Fund 24,890.00 21,774.60 3,115.40 14,123.35 7,651.25
Allocations to LGUs 20,134.41 17,368.38 2,766.03 16,199.84 1,168.54
Calamity Fund 7,500.00 2,832.52 4,667.48 1,665.04 1,167.47
International Commitments
Fund
2,683.25 2,444.68 238.57 2,259.19 185.49
PAMANA Fund 1,764.30 1,708.20 56.10 1,438.91 269.29
DepEd School Building
Program
1,000.00 825.38 174.62 549.24 276.14
E-Government Fund 1,000.00 642.91 357.09 367.63 275.28
Contingent Fund 1,000.00 658.70 341.30 426.61 232.09
Adjusted Appropriations 1,234,704.49 1,132,723.98 101,980.50 1,004,844.21 127,879.77
Overall Savings 10,488.78 - 10,488.78 - -
Personal Services 38,880.28 - 38,880.28 - -
Maintenance and Other
Operating Expenses (9,748.76) - (9,748.76) - -
Capital Outlays (18,642.74) - (18,642.74) - -
Appropriations per GAA 1,245,193.27 1,132,723.98 112,469.29 1,004,844.21 127,879.77
Automatic Appropriations 1,079,339.12 1,079,260.38 78.75 1,056,840.17 22,420.21
Debt Service – Principal 398,313.81 398,313.81 - 398,313.81 -
Debt Service – Interest 307,825.50 307,825.50 - 307,825.50 -
IRA 273,309.59 273,309.59 - 273,309.59 -
Other Automatic
Appropriations
99,890.22 99,811.48 78.75 77,391.27 22,420.21
Total Current Year’s
Appropriations 2,324,532.39 2,211,984.36 112,548.03 2,061,684.38 150,299.98
Continuing Appropriations
Allotted Continuing
Appropriations
140,318.35
140,318.35
. -
108,504.59
31,813.76
Regular Appropriations 101,852.07 101,852.07 - 85,744.95 16,107.12
Personal Services 936.34 936.34 - 676.23 260.11
Maintenance and Other
Operating Expenses
34,982.70
34,982.70
-
31,626.69
3,356.00
Financial Expenses .64 .64 .- .64 .-
21
(Table III-1 continued)
Particulars Appropriations Allotments
Unreleased
Appropria-
tions
Obligations* Unobligated
Allotments
Capital Outlays 65,932.39 65,932.39 - 53,441.38 12,491.01
Special Account in the
General Fund 1,626.39 1,626.39 - 1,205.38 421.01
Personal Services - - - - -
Maintenance and Other
Operating Expenses 1,550.23 1,550.23 - 1,129.57 420.66
Capital Outlays 76.16 76.16 - 75.81 0.35
Special Purpose Funds 14,050.12 14,050.12 - 12,391.93 1,658.19 Personal Services 10.80 10.80 - 10.80 -
Maintenance and Other
Operating Expenses
3,557.59
3,557.59 -
3,274.64
282.95
Capital Outlays 10,481.73 10,481.73 - 9,106.49 1,375.24
Automatic Appropriations 22,789.77 22,789.77 - 9,162.32 13,627.45 Personal Services 8.57 8.57 - 10.03 (1.47)
Maintenance and Other
Operating Expenses
8,430.14
8,430.14
-
7,212.33
1,217.82
Capital Outlays 14,351.06 14,351.06 - 1,939.97 12,411.10
Unallotted Continuing
Appropriations
66,232.45
27,105.79
39,126.66
25,573.54
1,532.25
Regular Appropriations 14,065.16 13,315.16 750.00 12,436.48 878.68
Maintenance and Other
Operating Expenses
1,223.41
1,223.41
-
1,071.23
152.18
Capital Outlays 12,841.75 12,091.75 750.00 11,365.25 726.50
Special Account in the
General Fund
1,000.00
1,000.00 -
424.75
575.25
Maintenance and Other
Operating Expenses
1,000.00
1,000.00
-
424.75
575.25
Special Purpose Funds 51,167.29 12,790.63 38,376.66 12,712.31 78.32
Maintenance and Other
Operating Expenses
17,337.41
8,533.78
8,803.63
8,488.60
45.18
Capital Outlays 33,829.88 4,256.85 29,573.03 4,223.71 33.14
Overall Savings (1,527.83) - (1,527.83) - -
Total Continuing
Appropriations
205,022.97
167,424.14
37,598.83
134,078.13
33,346.01
Total NG Appropriations 2,529,555.36 2,379,408.50 150,146.86 2,195,762.51 183,645.99
* Does not include obligations not covered by allotments of P350.79 million
Difference between totals and sum of components is due to rounding off.
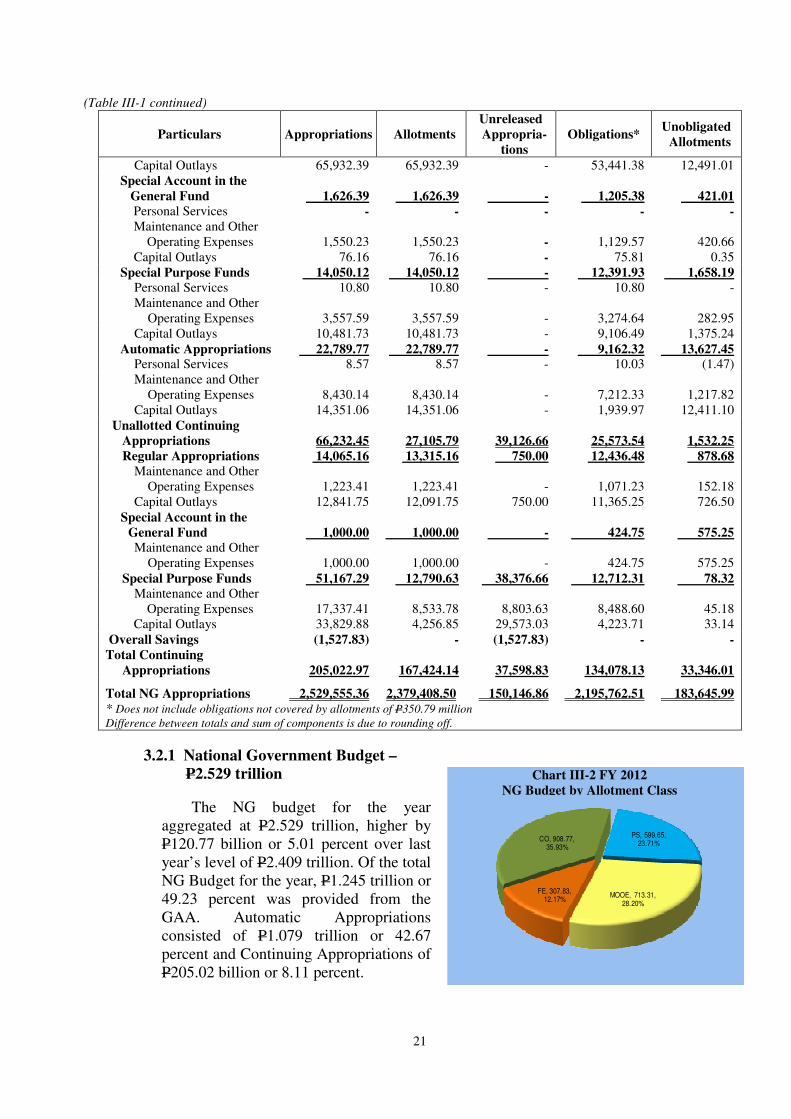
3.2.1 National Government Budget –
P2.529 trillion
The NG budget for the year
aggregated at P2.529 trillion, higher by
P120.77 billion or 5.01 percent over last
year’s level of P2.409 trillion. Of the total
NG Budget for the year, P1.245 trillion or
49.23 percent was provided from the
GAA. Automatic Appropriations
consisted of P1.079 trillion or 42.67
percent and Continuing Appropriations of
P205.02 billion or 8.11 percent.
PS, 599.65, 23.71%
MOOE, 713.31, 28.20%
FE, 307.83, 12.17%
CO, 908.77, 35.93%
Chart III-2 FY 2012
NG Budget by Allotment Class
22
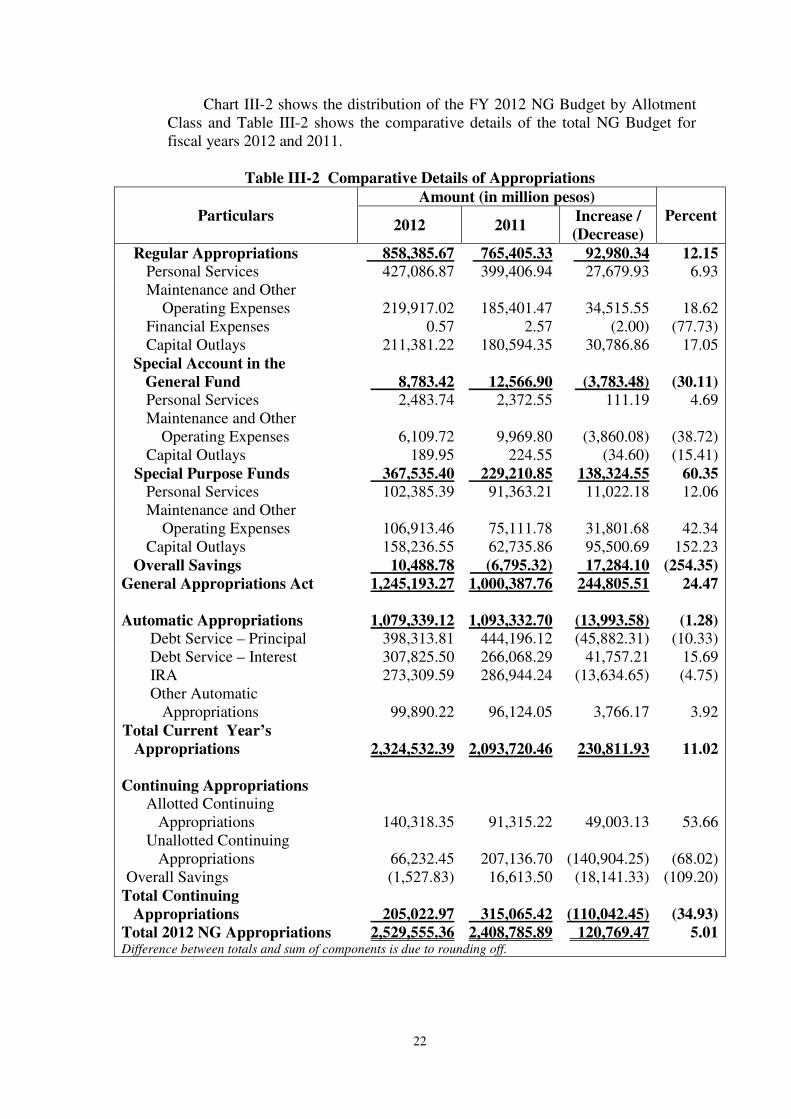
Chart III-2 shows the distribution of the FY 2012 NG Budget by Allotment
Class and Table III-2 shows the comparative details of the total NG Budget for
fiscal years 2012 and 2011.
Table III-2 Comparative Details of Appropriations
Particulars
Amount (in million pesos)
Percent 2012 2011
Increase /
(Decrease)
Regular Appropriations 858,385.67 765,405.33 92,980.34 12.15
Personal Services 427,086.87 399,406.94 27,679.93 6.93
Maintenance and Other
Operating Expenses 219,917.02 185,401.47 34,515.55 18.62
Financial Expenses 0.57 2.57 (2.00) (77.73)
Capital Outlays 211,381.22 180,594.35 30,786.86 17.05
Special Account in the
General Fund 8,783.42 12,566.90 (3,783.48) (30.11)
Personal Services 2,483.74 2,372.55 111.19 4.69
Maintenance and Other
Operating Expenses 6,109.72 9,969.80 (3,860.08) (38.72)
Capital Outlays 189.95 224.55 (34.60) (15.41)
Special Purpose Funds 367,535.40 229,210.85 138,324.55 60.35
Personal Services 102,385.39 91,363.21 11,022.18 12.06
Maintenance and Other
Operating Expenses 106,913.46 75,111.78 31,801.68 42.34
Capital Outlays 158,236.55 62,735.86 95,500.69 152.23
Overall Savings 10,488.78 (6,795.32) 17,284.10 (254.35)
General Appropriations Act 1,245,193.27 1,000,387.76 244,805.51 24.47
Automatic Appropriations 1,079,339.12 1,093,332.70 (13,993.58) (1.28)
Debt Service – Principal 398,313.81 444,196.12 (45,882.31) (10.33)
Debt Service – Interest 307,825.50 266,068.29 41,757.21 15.69
IRA 273,309.59 286,944.24 (13,634.65) (4.75)
Other Automatic
Appropriations 99,890.22 96,124.05 3,766.17 3.92
Total Current Year’s
Appropriations 2,324,532.39 2,093,720.46 230,811.93 11.02
Continuing Appropriations
Allotted Continuing
Appropriations 140,318.35 91,315.22 49,003.13 53.66
Unallotted Continuing
Appropriations 66,232.45 207,136.70 (140,904.25) (68.02)
Overall Savings (1,527.83) 16,613.50 (18,141.33) (109.20)
Total Continuing
Appropriations 205,022.97 315,065.42 (110,042.45) (34.93)
Total 2012 NG Appropriations 2,529,555.36 2,408,785.89 120,769.47 5.01 Difference between totals and sum of components is due to rounding off.
23
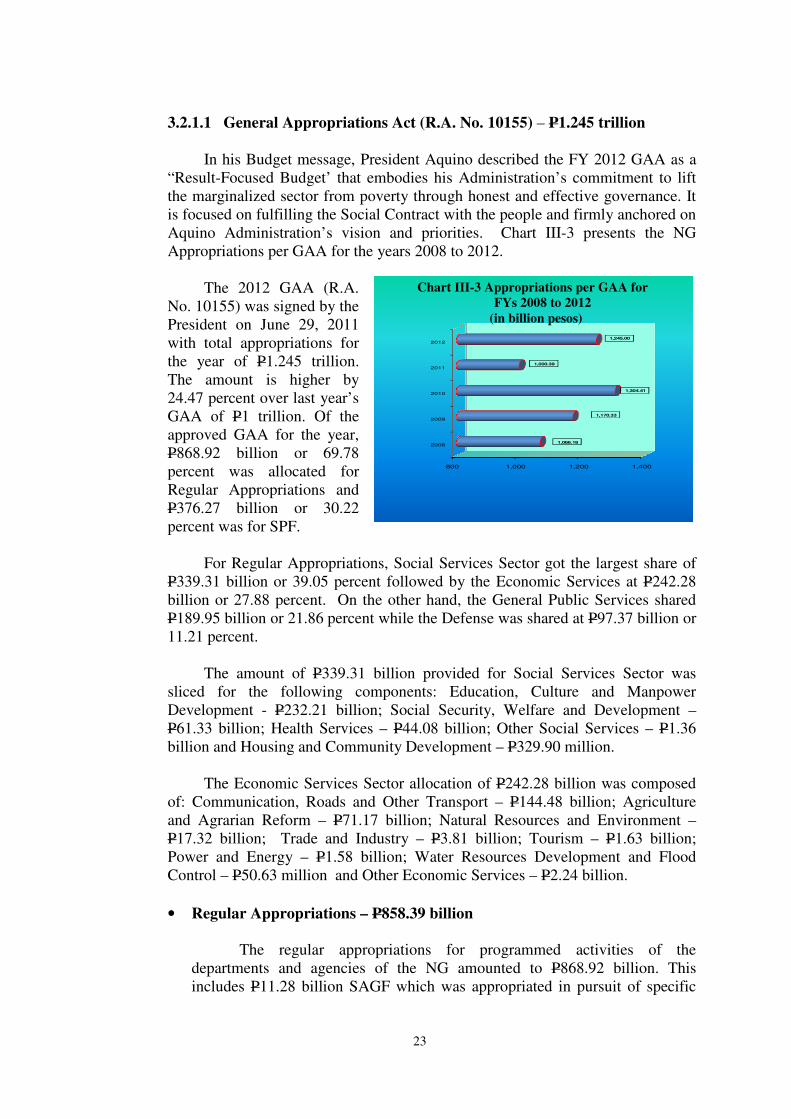
3.2.1.1 General Appropriations Act (R.A. No. 10155) – P1.245 trillion
In his Budget message, President Aquino described the FY 2012 GAA as a
“Result-Focused Budget’ that embodies his Administration’s commitment to lift
the marginalized sector from poverty through honest and effective governance. It
is focused on fulfilling the Social Contract with the people and firmly anchored on
Aquino Administration’s vision and priorities. Chart III-3 presents the NG
Appropriations per GAA for the years 2008 to 2012.
The 2012 GAA (R.A.
No. 10155) was signed by the
President on June 29, 2011
with total appropriations for
the year of P1.245 trillion.
The amount is higher by
24.47 percent over last year’s
GAA of P1 trillion. Of the
approved GAA for the year,
P868.92 billion or 69.78
percent was allocated for
Regular Appropriations and
P376.27 billion or 30.22
percent was for SPF.
For Regular Appropriations, Social Services Sector got the largest share of
P339.31 billion or 39.05 percent followed by the Economic Services at P242.28
billion or 27.88 percent. On the other hand, the General Public Services shared
P189.95 billion or 21.86 percent while the Defense was shared at P97.37 billion or
11.21 percent.
The amount of P339.31 billion provided for Social Services Sector was
sliced for the following components: Education, Culture and Manpower
Development - P232.21 billion; Social Security, Welfare and Development –
P61.33 billion; Health Services – P44.08 billion; Other Social Services – P1.36
billion and Housing and Community Development – P329.90 million.
The Economic Services Sector allocation of P242.28 billion was composed
of: Communication, Roads and Other Transport – P144.48 billion; Agriculture
and Agrarian Reform – P71.17 billion; Natural Resources and Environment –
P17.32 billion; Trade and Industry – P3.81 billion; Tourism – P1.63 billion;
Power and Energy – P1.58 billion; Water Resources Development and Flood
Control – P50.63 million and Other Economic Services – P2.24 billion.
• Regular Appropriations – P858.39 billion
The regular appropriations for programmed activities of the
departments and agencies of the NG amounted to P868.92 billion. This
includes P11.28 billion SAGF which was appropriated in pursuit of specific
800 1,000 1,200 1,400
2008
2009
2010
2011
2012
1,066.18
1,170.33
1,304.41
1,000.39
1,245.00
Chart III-3 Appropriations per GAA for
FYs 2008 to 2012
(in billion pesos)
24
programs provided in the Special Provisions of the GAA, leaving an available
allocation of P857.64 billion. Of this amount, P12.03 billion of the regular
appropriations of DOH was transferred to SPF particularly Budgetary Support
to GOCCs and transfers from Overall Savings of P12.78 billion were made.
Thus, the adjusted Regular Appropriations for the year stood at P858.39
billion higher by P92.98 billion or 12.15 percent than last year’s comparable
amount of P765.41 billion.
The DepEd remained on top with P200.80 billion, higher by P18.12
billion or 9.92 percent than last year’s P182.67 billion. This year’s
appropriations of the Education Department was utilized primarily for the
implementation of universal kindergarten program and hiring of new school
teachers to fill the gap for teachers shortages, procurement of more than 2.53
million school desks, chairs and textbooks, rehabilitation of classrooms, and
provision for other educational facilities. Meanwhile the largest rate of
budgetary increase for the Comelec at 528.27 percent can be attributed to the
preparations for the holding of the nationwide midterm elections of national
and local officials on May 2013.
The budget of the Social Welfare Department grew by 35.22 percent or
P13.09 billion from last year’s P37.16 billion. This year’s appropriations of
DSWD was expended for the implementation of various social protection
programs of the NG such as the expansion of the coverage of conditional cash
transfer under the 4Ps Program which supported three million households
(from 2.3 million last year), Social Feeding Program and the extension of the
KALAHI-CIDSS, rice subsidy, and pensions for indigent senior citizens,
among others. These are clear indications of the Aquino Administration’s
sincerity in alleviating the condition and protecting the interest of the
vulnerable sectors.
The significant 56.84 percent increase in the appropriations of the DA
from last year’s level of P33.39 billion to this year’s P52.37 billion was due
mainly to the government’s Rice and Food Sufficiency Program which
includes the construction and rehabilitation of irrigation facilities,
establishment of postharvest facilities, expansion of research and development
and provision for the National Rice, Corn, Fisheries, Livestocks and High
Value Crops Program.
The DBM had a substantial increase of 308.40 percent pertaining to the
transfers from pooled savings amounting to P3.46 billion needed to complete
the full requirement for the one-time payment of the unremmitted NG share in
the premium to the GSIS contribution of DepEd personnel.
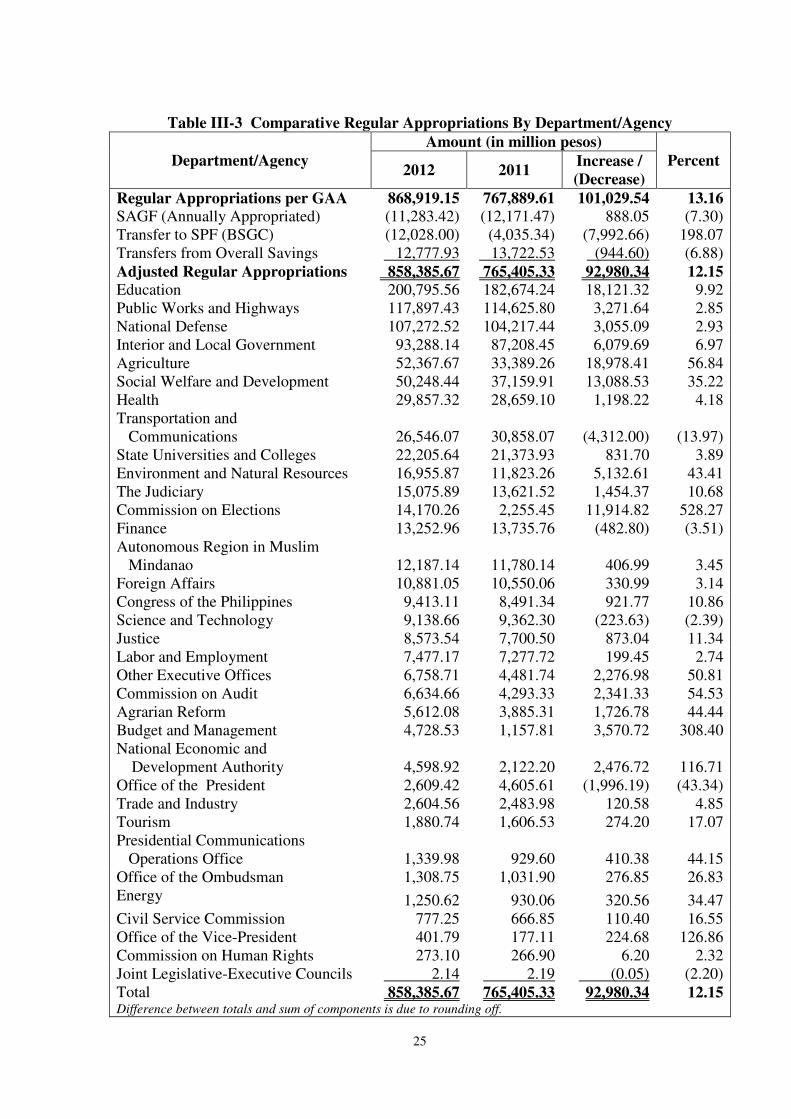
Comparative details of regular appropriations by department/agency
are shown in Table III-3.
25
Table III-3 Comparative Regular Appropriations By Department/Agency
Department/Agency
Amount (in million pesos)
Percent 2012 2011
Increase /
(Decrease)
Regular Appropriations per GAA 868,919.15 767,889.61 101,029.54 13.16
SAGF (Annually Appropriated) (11,283.42) (12,171.47) 888.05 (7.30)
Transfer to SPF (BSGC) (12,028.00) (4,035.34) (7,992.66) 198.07
Transfers from Overall Savings 12,777.93 13,722.53 (944.60) (6.88)
Adjusted Regular Appropriations 858,385.67 765,405.33 92,980.34 12.15
Education 200,795.56 182,674.24 18,121.32 9.92
Public Works and Highways 117,897.43 114,625.80 3,271.64 2.85
National Defense 107,272.52 104,217.44 3,055.09 2.93
Interior and Local Government 93,288.14 87,208.45 6,079.69 6.97
Agriculture 52,367.67 33,389.26 18,978.41 56.84
Social Welfare and Development 50,248.44 37,159.91 13,088.53 35.22
Health 29,857.32 28,659.10 1,198.22 4.18
Transportation and
Communications 26,546.07 30,858.07 (4,312.00) (13.97)
State Universities and Colleges 22,205.64 21,373.93 831.70 3.89
Environment and Natural Resources 16,955.87 11,823.26 5,132.61 43.41
The Judiciary 15,075.89 13,621.52 1,454.37 10.68
Commission on Elections 14,170.26 2,255.45 11,914.82 528.27
Finance 13,252.96 13,735.76 (482.80) (3.51)
Autonomous Region in Muslim
Mindanao 12,187.14
11,780.14 406.99 3.45
Foreign Affairs 10,881.05 10,550.06 330.99 3.14
Congress of the Philippines 9,413.11 8,491.34 921.77 10.86
Science and Technology 9,138.66 9,362.30 (223.63) (2.39)
Justice 8,573.54 7,700.50 873.04 11.34
Labor and Employment 7,477.17 7,277.72 199.45 2.74
Other Executive Offices 6,758.71 4,481.74 2,276.98 50.81
Commission on Audit 6,634.66 4,293.33 2,341.33 54.53
Agrarian Reform 5,612.08 3,885.31 1,726.78 44.44
Budget and Management 4,728.53 1,157.81 3,570.72 308.40
National Economic and
Development Authority
4,598.92
2,122.20
2,476.72
116.71
Office of the President 2,609.42 4,605.61 (1,996.19) (43.34)
Trade and Industry 2,604.56 2,483.98 120.58 4.85
Tourism 1,880.74 1,606.53 274.20 17.07
Presidential Communications
Operations Office
1,339.98
929.60
410.38
44.15
Office of the Ombudsman 1,308.75 1,031.90 276.85 26.83
Energy 1,250.62 930.06 320.56 34.47
Civil Service Commission 777.25 666.85 110.40 16.55
Office of the Vice-President 401.79 177.11 224.68 126.86
Commission on Human Rights 273.10 266.90 6.20 2.32
Joint Legislative-Executive Councils 2.14 2.19 (0.05) (2.20)
Total 858,385.67 765,405.33 92,980.34 12.15 Difference between totals and sum of components is due to rounding off.
26
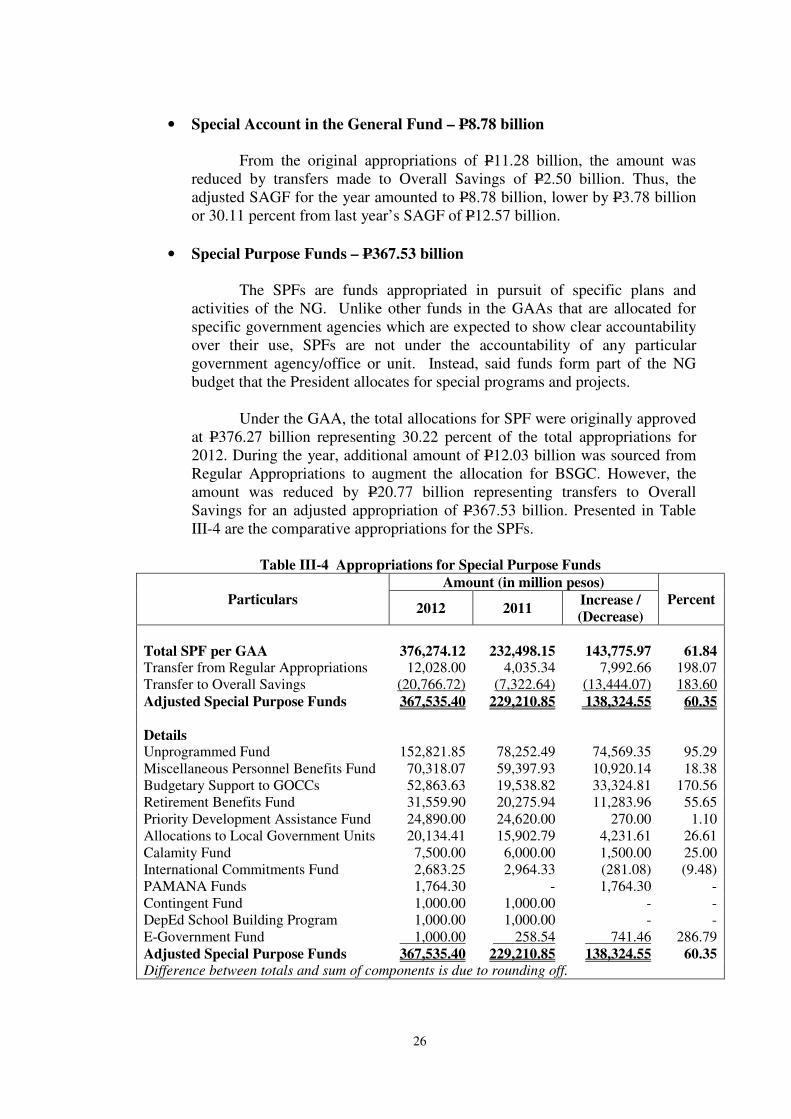
• Special Account in the General Fund – P8.78 billion
From the original appropriations of P11.28 billion, the amount was
reduced by transfers made to Overall Savings of P2.50 billion. Thus, the
adjusted SAGF for the year amounted to P8.78 billion, lower by P3.78 billion
or 30.11 percent from last year’s SAGF of P12.57 billion.
• Special Purpose Funds – P367.53 billion
The SPFs are funds appropriated in pursuit of specific plans and
activities of the NG. Unlike other funds in the GAAs that are allocated for
specific government agencies which are expected to show clear accountability
over their use, SPFs are not under the accountability of any particular
government agency/office or unit. Instead, said funds form part of the NG
budget that the President allocates for special programs and projects.
Under the GAA, the total allocations for SPF were originally approved
at P376.27 billion representing 30.22 percent of the total appropriations for
2012. During the year, additional amount of P12.03 billion was sourced from
Regular Appropriations to augment the allocation for BSGC. However, the
amount was reduced by P20.77 billion representing transfers to Overall
Savings for an adjusted appropriation of P367.53 billion. Presented in Table
III-4 are the comparative appropriations for the SPFs.
Table III-4 Appropriations for Special Purpose Funds
Particulars
Amount (in million pesos)
Percent 2012 2011
Increase /
(Decrease)
Total SPF per GAA 376,274.12 232,498.15 143,775.97 61.84 Transfer from Regular Appropriations 12,028.00 4,035.34 7,992.66 198.07
Transfer to Overall Savings (20,766.72) (7,322.64) (13,444.07) 183.60
Adjusted Special Purpose Funds 367,535.40 229,210.85 138,324.55 60.35
Details Unprogrammed Fund 152,821.85 78,252.49 74,569.35 95.29
Miscellaneous Personnel Benefits Fund 70,318.07 59,397.93 10,920.14 18.38
Budgetary Support to GOCCs 52,863.63 19,538.82 33,324.81 170.56
Retirement Benefits Fund 31,559.90 20,275.94 11,283.96 55.65
Priority Development Assistance Fund 24,890.00 24,620.00 270.00 1.10
Allocations to Local Government Units 20,134.41 15,902.79 4,231.61 26.61
Calamity Fund 7,500.00 6,000.00 1,500.00 25.00
International Commitments Fund 2,683.25 2,964.33 (281.08) (9.48)
PAMANA Funds 1,764.30 - 1,764.30 -
Contingent Fund 1,000.00 1,000.00 - -
DepEd School Building Program 1,000.00 1,000.00 - -
E-Government Fund 1,000.00 258.54 741.46 286.79
Adjusted Special Purpose Funds 367,535.40 229,210.85 138,324.55 60.35 Difference between totals and sum of components is due to rounding off.

27
� Unprogrammed Fund – P152.82 billion
Unprogrammed Fund (UF) is a standby appropriation for additional
agency expenditures for priority programs and projects on top of the original
budget. Subject to Presidential discretion, this fund shall be released only
when the revenue collections exceed the original revenue targets submitted by
the President pursuant to Section 22, Article VII of the 1987 Philippine
Constitution, including savings generated from programmed appropriations for
the year.
On the third year of the Aquino Administration, the budget for UF
reached P152.82 billion from last year’s amount of P78.25 billion. The
remarkable increase of 95.29 percent was attributed to the inclusion of the new
components namely: Debt Management Program that will allow access to
lower cost of borrowing and lower maturity period for GOCCs and Disaster
Risk Reduction Management to fund the disaster risk reduction and
management in some areas recently hit by disaster.
Of the existing components of the UF, Budgetary Support to GOCCs
had an increase of P16.60 billion or 192.72 percent due mainly to the
intensified support extended to GOCCs in the Agriculture Sector for the
implementation of the NG’s Rice Self-sufficiency Program.
The UF of P152.82 billion represents 6.57 percent of the current year’s
appropriations. Table III-5 shows the comparative appropriations for UF.
Table III-5 Appropriations for Unprogrammed Fund
Particulars
Amount (in million pesos)
Percent 2012 2011
Increase /
(Decrease)
Debt Management Program 85,182.51 - 85,182.51 -
Support to Infrastructure Projects and
Social Programs
25,446.05
37,942.00
(12,495.95) (32.93)
Budgetary Support to GOCCs 25,214.55 8,614.02 16,600.53 192.72
Disaster Risk Reduction and
Management 14,200.00 - 14,200.00 -
General Fund Adjustments 1,553.95 6,500.00 (4,946.05) (76.09)
Support to Foreign-Assisted Projects 1,224.79 10,806.66 (9,581.87) (88.67)
Collective Negotiation Agreement - 8,487.81 (8,487.81) (100.00)
Strategic Government Reforms - 2,000.00 (2,000.00) (100.00)
Payment of Total Administrative
Disability Pension -
3,000.00
(3,000.00) (100.00)
Support for Pre-School Education - 902.00 (902.00) (100.00)
Total 152,821.85 78,252.49 74,569.36 95.29 Difference between totals and sum of components is due to rounding off.
� Miscellaneous Personnel Benefits Fund – P70.32 billion
The MPBF was originally appropriated under the GAA at P109.30
billion. During the year, P38.98 billion was transferred to Overall Savings
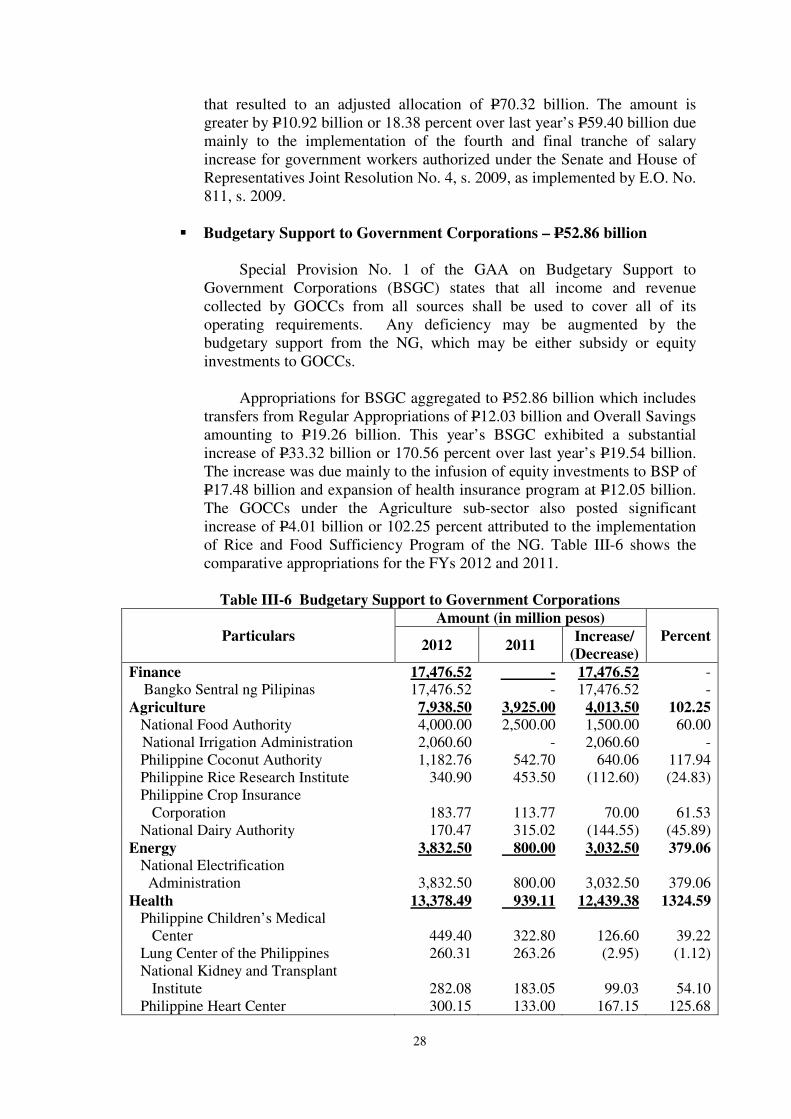
28
that resulted to an adjusted allocation of P70.32 billion. The amount is
greater by P10.92 billion or 18.38 percent over last year’s P59.40 billion due
mainly to the implementation of the fourth and final tranche of salary
increase for government workers authorized under the Senate and House of
Representatives Joint Resolution No. 4, s. 2009, as implemented by E.O. No.
811, s. 2009.
� Budgetary Support to Government Corporations – P52.86 billion
Special Provision No. 1 of the GAA on Budgetary Support to
Government Corporations (BSGC) states that all income and revenue
collected by GOCCs from all sources shall be used to cover all of its
operating requirements. Any deficiency may be augmented by the
budgetary support from the NG, which may be either subsidy or equity
investments to GOCCs.
Appropriations for BSGC aggregated to P52.86 billion which includes
transfers from Regular Appropriations of P12.03 billion and Overall Savings
amounting to P19.26 billion. This year’s BSGC exhibited a substantial
increase of P33.32 billion or 170.56 percent over last year’s P19.54 billion.
The increase was due mainly to the infusion of equity investments to BSP of
P17.48 billion and expansion of health insurance program at P12.05 billion.
The GOCCs under the Agriculture sub-sector also posted significant
increase of P4.01 billion or 102.25 percent attributed to the implementation
of Rice and Food Sufficiency Program of the NG. Table III-6 shows the
comparative appropriations for the FYs 2012 and 2011.
Table III-6 Budgetary Support to Government Corporations
Particulars
Amount (in million pesos)
Percent 2012 2011
Increase/
(Decrease)
Finance 17,476.52 - 17,476.52 -
Bangko Sentral ng Pilipinas 17,476.52 - 17,476.52 -
Agriculture 7,938.50 3,925.00 4,013.50 102.25
National Food Authority 4,000.00 2,500.00 1,500.00 60.00
National Irrigation Administration 2,060.60 - 2,060.60 -
Philippine Coconut Authority 1,182.76 542.70 640.06 117.94
Philippine Rice Research Institute 340.90 453.50 (112.60) (24.83)
Philippine Crop Insurance
Corporation 183.77 113.77 70.00 61.53
National Dairy Authority 170.47 315.02 (144.55) (45.89)
Energy 3,832.50 800.00 3,032.50 379.06
National Electrification
Administration 3,832.50 800.00 3,032.50 379.06
Health 13,378.49 939.11 12,439.38 1324.59
Philippine Children’s Medical
Center 449.40 322.80 126.60 39.22
Lung Center of the Philippines 260.31 263.26 (2.95) (1.12)
National Kidney and Transplant
Institute 282.08 183.05 99.03 54.10
Philippine Heart Center 300.15 133.00 167.15 125.68
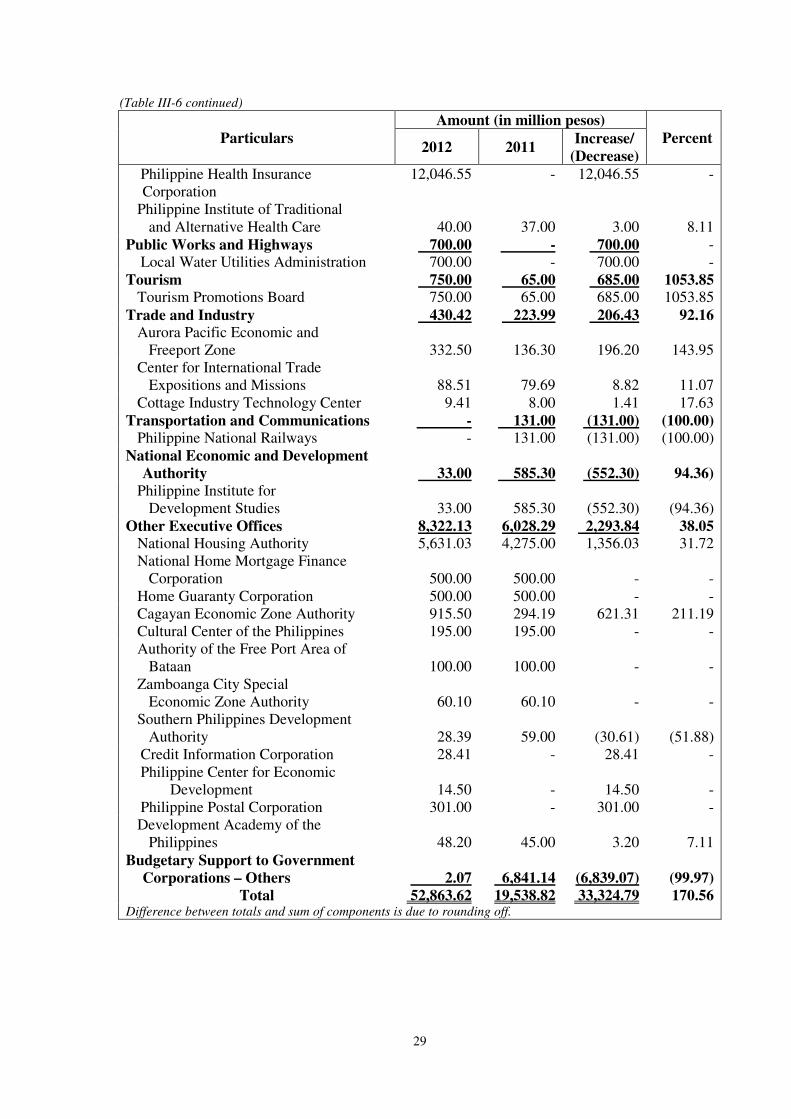
29
(Table III-6 continued)
Particulars
Amount (in million pesos)
Percent 2012 2011
Increase/
(Decrease)
Philippine Health Insurance
Corporation
12,046.55 - 12,046.55 -
Philippine Institute of Traditional
and Alternative Health Care 40.00 37.00 3.00 8.11
Public Works and Highways 700.00 - 700.00 -
Local Water Utilities Administration 700.00 - 700.00 -
Tourism 750.00 65.00 685.00 1053.85 Tourism Promotions Board 750.00 65.00 685.00 1053.85
Trade and Industry 430.42 223.99 206.43 92.16
Aurora Pacific Economic and
Freeport Zone 332.50 136.30 196.20 143.95
Center for International Trade
Expositions and Missions 88.51 79.69 8.82 11.07
Cottage Industry Technology Center 9.41 8.00 1.41 17.63
Transportation and Communications - 131.00 (131.00) (100.00) Philippine National Railways - 131.00 (131.00) (100.00)
National Economic and Development
Authority
33.00
585.30
(552.30)
94.36)
Philippine Institute for
Development Studies
33.00
585.30
(552.30)
(94.36)
Other Executive Offices 8,322.13 6,028.29 2,293.84 38.05
National Housing Authority 5,631.03 4,275.00 1,356.03 31.72
National Home Mortgage Finance
Corporation 500.00 500.00 - -
Home Guaranty Corporation 500.00 500.00 - -
Cagayan Economic Zone Authority 915.50 294.19 621.31 211.19
Cultural Center of the Philippines 195.00 195.00 - -
Authority of the Free Port Area of
Bataan 100.00 100.00 - -
Zamboanga City Special
Economic Zone Authority 60.10 60.10 - -
Southern Philippines Development
Authority 28.39 59.00 (30.61) (51.88)
Credit Information Corporation 28.41 - 28.41 -
Philippine Center for Economic
Development 14.50 - 14.50
-
Philippine Postal Corporation 301.00 - 301.00 -
Development Academy of the
Philippines 48.20 45.00 3.20 7.11
Budgetary Support to Government
Corporations – Others 2.07 6,841.14 (6,839.07) (99.97)
Total 52,863.62 19,538.82 33,324.79 170.56 Difference between totals and sum of components is due to rounding off.

30
� Retirement Benefits Fund – P31.56 billion
Retirement Benefits Fund is used for the payment of pension,
retirement and terminal leave benefits, incentive package for employees
availing of the Rationalization Program per E.O. No. 366, s. 2004, and
payment of monetization of leave credits.
For the year, appropriations for Retirement Benefits Fund stood at
P31.56 billion, net of transfers to Overall Savings of P2.88 billion, posting
an increase of P11.28 billion or 55.65 percent over last year’s budgeted
amount of P20.28 billion.
� Priority Development Assistance Fund – P24.89 billion
Over the years, the PDAF or the ‘pork barrel’ is one category under
the SPFs that enjoys hefty allocation. The main purpose of PDAF is to
finance the priority development programs and projects of individual
legislator. Those commonly referred to as "soft projects" are identified and
implemented under this Fund following a shortlist or menu as provided for
in the GAA such as scholarship programs, medical assistance to indigent
patients, livelihood support programs, purchase of IT equipment, rural
electrification, water supply, peace and order and financial assistance to
LGUs for their respective priority programs and projects. On the other hand,
“hard projects’’ include infrastructures such as roads and bridges, flood
control, school buildings, hospitals, health facilities, public markets, multi-
purpose buildings, and multi-purpose pavements.
The annual allocation of legislators shall not exceed the amount of P70
million for each Congressional District and Party list Representative; and
P200 million for each Senator.
For the year, appropriation for PDAF stood at P24.89 billion, slightly
higher by P270 million or 1.10 percent than last year’s amount of P24.62
billion.
� Allocations to Local Government Units – P20.13 billion
Appropriation for ALGU was originally approved at P18.30 billion.
During the year, transfers of P1.83 billion from Overall Savings were made
resulting to an adjusted amount of P20.13 billion. The ALGU serves as the
funding source for various development projects in the LGUs and the
MMDA.
The ALGU represents 5.48 percent of the total SPF or 1.62 percent of
the total appropriations in the GAA. Of the total allocations of P20.13
billion, 82.84 percent or P16.68 billion was budgeted for the Special Shares
of Local Government Units in the Proceeds of National Taxes defined under
Chapter 1, Section 285 of R.A. No. 7160, Local Government Code of 1991,

31
and P2.03 billion or 10.09 percent for Financial Subsidy to LGUs. Table III-
7 shows the comparative details of ALGU.
Table III-7 Comparative Details of Allocations to LGUs
Particulars
Amount (in million pesos)
Percent 2012 2011
Increase/
(Decrease)
Special Shares of LGUs in the
Proceeds of National Taxes 16,679.90 11,871.13 4,808.77 40.51
Financial Subsidy to LGUs 2,030.92 2,615.40 (584.49) (22.35)
Metropolitan Manila Development
Authority 1,373.60 1,209.18 164.41 13.60
Pasig River Rehabilitation
Commission
- 157.08 (157.08)
(100.00)
Barangay Officials Death Benefits
Fund
50.00
50.00
-
-
Total 20,134.42 15,902.79 4,231.63 26.61 Difference between totals and sum of components is due to rounding off.
3.2.1.2 Automatic Appropriations – P1.079 trillion
Automatic appropriations refer to
appropriations programmed annually
or for some other period prescribed by
law, by virtue of outstanding
legislation which does not require
periodic action by Congress. Falling
under this category are expenditures
authorized under PD No. 1967, R.A.
No. 4860 and R.A. No. 245, as
amended, for the servicing of domestic
and foreign debts, Commonwealth Act
186 and R.A. No. 660, for the
retirement and life insurance premiums
of government employees, PD No.
1177 and E.O. No. 292, for net lending
to government corporations, and PD No. 1234, for various special accounts and
funds.
The Automatic Appropriations of P1.079 trillion represents 46.43 percent of
the total current year’s appropriations.
Shown in Chart III-4 and Table III-8 are the sources and components of
automatic appropriations for the year.
Chart III-4 Sources of Automatic
Appropriations
GAA29.27%
Other Acts
70.73%
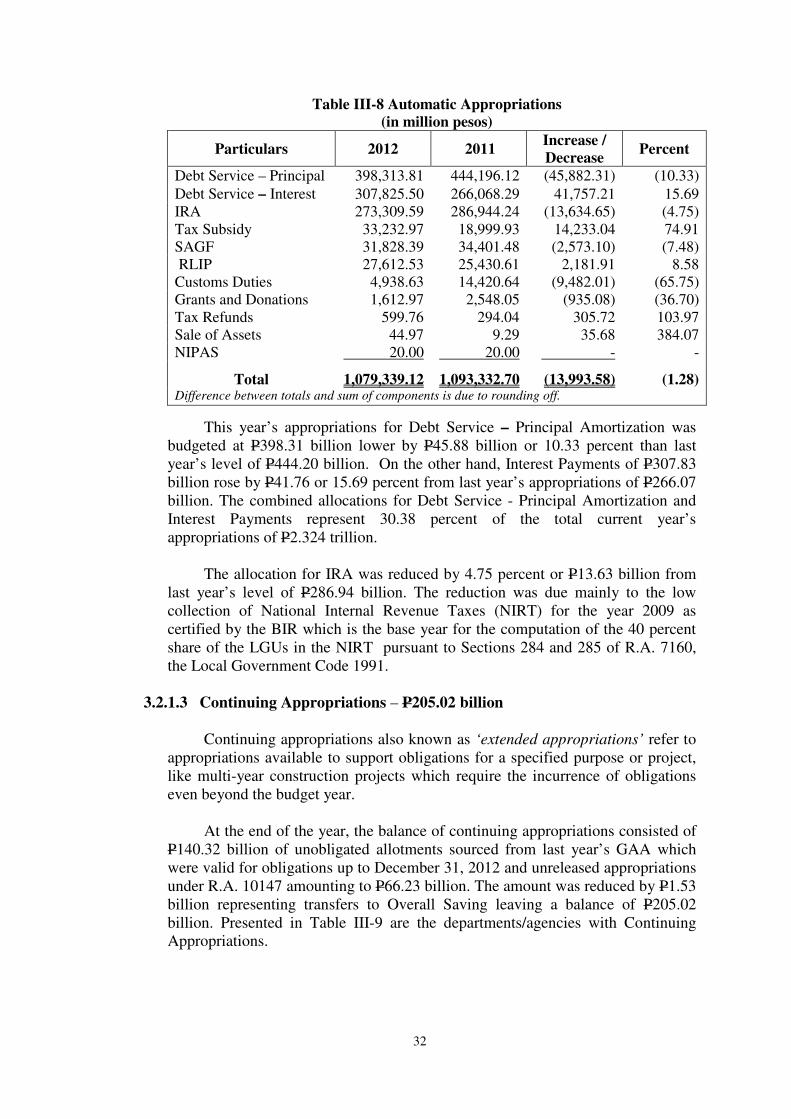
32
Table III-8 Automatic Appropriations
(in million pesos)
Particulars 2012 2011 Increase /
Decrease Percent
Debt Service – Principal 398,313.81 444,196.12 (45,882.31) (10.33)
Debt Service – Interest 307,825.50 266,068.29 41,757.21 15.69
IRA 273,309.59 286,944.24 (13,634.65) (4.75)
Tax Subsidy 33,232.97 18,999.93 14,233.04 74.91
SAGF 31,828.39 34,401.48 (2,573.10) (7.48)
RLIP 27,612.53 25,430.61 2,181.91 8.58
Customs Duties 4,938.63 14,420.64 (9,482.01) (65.75)
Grants and Donations 1,612.97 2,548.05 (935.08) (36.70)
Tax Refunds 599.76 294.04 305.72 103.97
Sale of Assets 44.97 9.29 35.68 384.07
NIPAS 20.00 20.00 - -
Total 1,079,339.12 1,093,332.70 (13,993.58) (1.28) Difference between totals and sum of components is due to rounding off.
This year’s appropriations for Debt Service – Principal Amortization was
budgeted at P398.31 billion lower by P45.88 billion or 10.33 percent than last
year’s level of P444.20 billion. On the other hand, Interest Payments of P307.83
billion rose by P41.76 or 15.69 percent from last year’s appropriations of P266.07
billion. The combined allocations for Debt Service - Principal Amortization and
Interest Payments represent 30.38 percent of the total current year’s
appropriations of P2.324 trillion.
The allocation for IRA was reduced by 4.75 percent or P13.63 billion from
last year’s level of P286.94 billion. The reduction was due mainly to the low
collection of National Internal Revenue Taxes (NIRT) for the year 2009 as
certified by the BIR which is the base year for the computation of the 40 percent
share of the LGUs in the NIRT pursuant to Sections 284 and 285 of R.A. 7160,
the Local Government Code 1991.
3.2.1.3 Continuing Appropriations – P205.02 billion
Continuing appropriations also known as ‘extended appropriations’ refer to
appropriations available to support obligations for a specified purpose or project,
like multi-year construction projects which require the incurrence of obligations
even beyond the budget year.
At the end of the year, the balance of continuing appropriations consisted of
P140.32 billion of unobligated allotments sourced from last year’s GAA which
were valid for obligations up to December 31, 2012 and unreleased appropriations
under R.A. 10147 amounting to P66.23 billion. The amount was reduced by P1.53
billion representing transfers to Overall Saving leaving a balance of P205.02
billion. Presented in Table III-9 are the departments/agencies with Continuing
Appropriations.
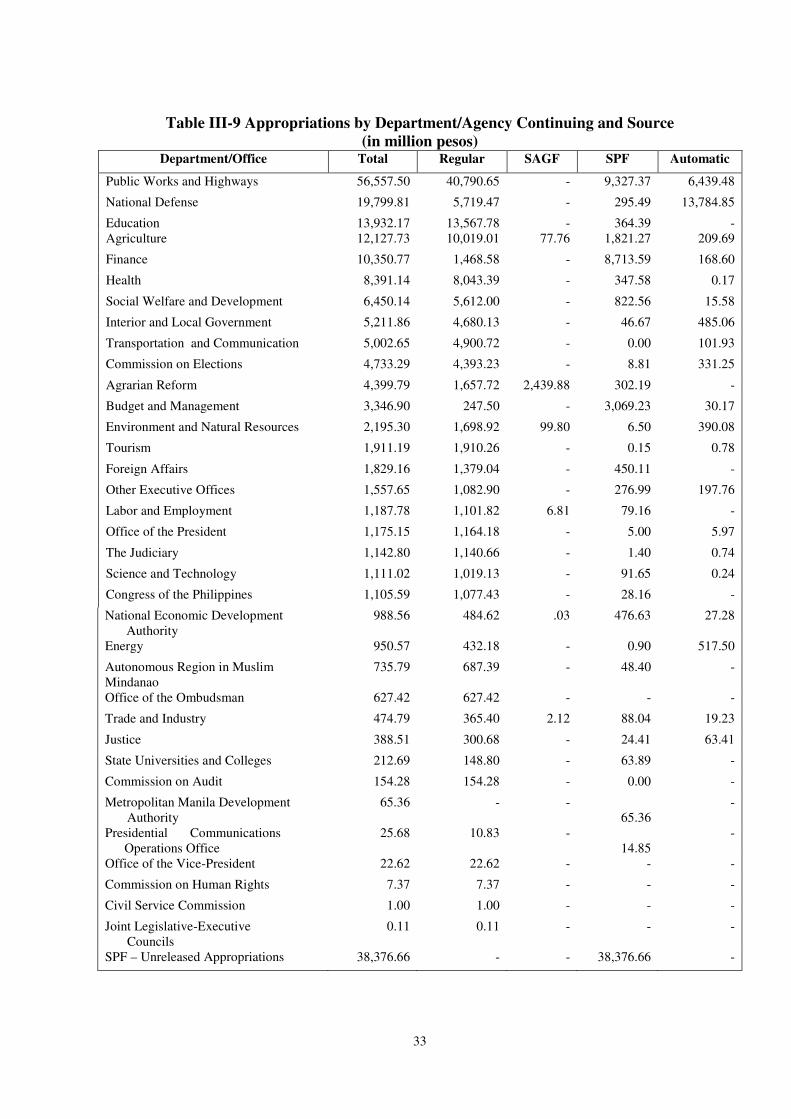
33
Table III-9 Appropriations by Department/Agency Continuing and Source
(in million pesos) Department/Office Total Regular SAGF SPF Automatic
Public Works and Highways 56,557.50 40,790.65 - 9,327.37 6,439.48
National Defense 19,799.81 5,719.47 - 295.49 13,784.85
Education 13,932.17 13,567.78 - 364.39 -
Agriculture 12,127.73 10,019.01 77.76 1,821.27 209.69
Finance 10,350.77 1,468.58 - 8,713.59 168.60
Health 8,391.14 8,043.39 - 347.58 0.17
Social Welfare and Development 6,450.14 5,612.00 - 822.56 15.58
Interior and Local Government 5,211.86 4,680.13 - 46.67 485.06
Transportation and Communication 5,002.65 4,900.72 - 0.00 101.93
Commission on Elections 4,733.29 4,393.23 - 8.81 331.25
Agrarian Reform 4,399.79 1,657.72 2,439.88 302.19 -
Budget and Management 3,346.90 247.50 - 3,069.23 30.17
Environment and Natural Resources 2,195.30 1,698.92 99.80 6.50 390.08
Tourism 1,911.19 1,910.26 - 0.15 0.78
Foreign Affairs 1,829.16 1,379.04 - 450.11 -
Other Executive Offices 1,557.65 1,082.90 - 276.99 197.76
Labor and Employment 1,187.78 1,101.82 6.81 79.16 -
Office of the President 1,175.15 1,164.18 - 5.00 5.97
The Judiciary 1,142.80 1,140.66 - 1.40 0.74
Science and Technology 1,111.02 1,019.13 - 91.65 0.24
Congress of the Philippines 1,105.59 1,077.43 - 28.16 -
National Economic Development
Authority
988.56 484.62 .03 476.63 27.28
Energy 950.57 432.18 - 0.90 517.50
Autonomous Region in Muslim
Mindanao
735.79 687.39 - 48.40 -
Office of the Ombudsman 627.42 627.42 - - -
Trade and Industry 474.79 365.40 2.12 88.04 19.23
Justice 388.51 300.68 - 24.41 63.41
State Universities and Colleges 212.69 148.80 - 63.89 -
Commission on Audit 154.28 154.28 - 0.00 -
Metropolitan Manila Development
Authority
65.36 - -
65.36
-
Presidential Communications
Operations Office
25.68 10.83 -
14.85
-
Office of the Vice-President 22.62 22.62 - - -
Commission on Human Rights 7.37 7.37 - - -
Civil Service Commission 1.00 1.00 - - -
Joint Legislative-Executive
Councils
0.11 0.11 - - -
SPF – Unreleased Appropriations 38,376.66 - - 38,376.66 -

34
(Table III-9 continued)
Department/Office Total Regular SAGF SPF Automatic
Overall Savings (1,527.83) - - (1,527.83) -
Total 205,022.97 115,917.23 2,626.39 63,689.58 22,789.77
Difference between totals and sum of components is due to rounding off.
3.2.2 ALLOTMENTS – P2.379 trillion
Allotments are authorizations issued by the DBM to NGAs to incur
obligations for the implementation of programs, projects and other expenditure
items. For 2012, allotments aggregated at P2.379 trillion or 94.06 percent of the
total NG budget for the year of P2.529 trillion. Of this amount, P2.212 trillion
was released under current year’s appropriations and the balance was from
Continuing Appropriations amounting to P167.42 billion.
Almost 49 percent of the total current year’s allotments were issued under
Automatic Appropriations mainly for the debt servicing requirements of the NG
consisting of Debt Service – Principal Amortization of P398.31 billion, and
Interest Payment of P307.83 billion. The allotments released for IRA amounted
to P273.31 billion and for other Automatic Appropriations totaling to P99.81
billion. Table III-10 shows the detailed sources and nature of allotments released
for the year including those releases/transfers from current year and prior year
pooled savings amounting to P61.25 billion primarily utilized for priority
expenditures of the NG as shown in Schedule 7, Volume I-B.
Table III-10 Sources and Nature of Allotments
(in million pesos)
Particulars Total PS MOOE FE CO
General Appropriations Act 1,132,723.98 531,467.80 302,900.86 0.57 298,354.75 Regular 845,600.60 427,086.44 217,630.08 0.57 200,883.50
SAGF 8,629.99 2,483.74 5,956.30 - 189.95
SPFs 278,493.39 101,897.62 79,314.48 - 97,281.30
Automatic Appropriations 1,079,260.38 27,861.50 321,956.43 307,825.50 421,616.95
Debt Service – Principal 398,313.81 - - - 398,313.81
Debt Service - Interest 307,825.50 - - 307,825.50 - IRA 273,309.59 - 273,309.59 - - Tax Subsidy 33,232.97 - 33,232.97 - - SAGF 31,750.37 244.83 8,969.15 - 22,536.39
RLIP 27,611.80 27,611.80 - - - Customs Duties 4,938.63 - 4,938.63 - -
Grants and Donations 1,612.97 4.87 849.21 - 758.89
Tax Refunds 599.76 - 599.76 - -
Sale of Assets 44.97 - 40.72 - 4.25
NIPAS 20.00 - 16.40 - 3.60 Total Current Year’s
Allotments 2,211,984.36 559,329.30 624,857.29 307,826.07
719,971.70 Continuing Appropriations 167,424.14 955.70 59,277.85 0.64 107,189.94
Unobligated Allotments 140,318.35 955.70 48,520.66 0.64 90,841.34
Unreleased Appropriations 27,105.79 - 10,757.19 - 16,348.60
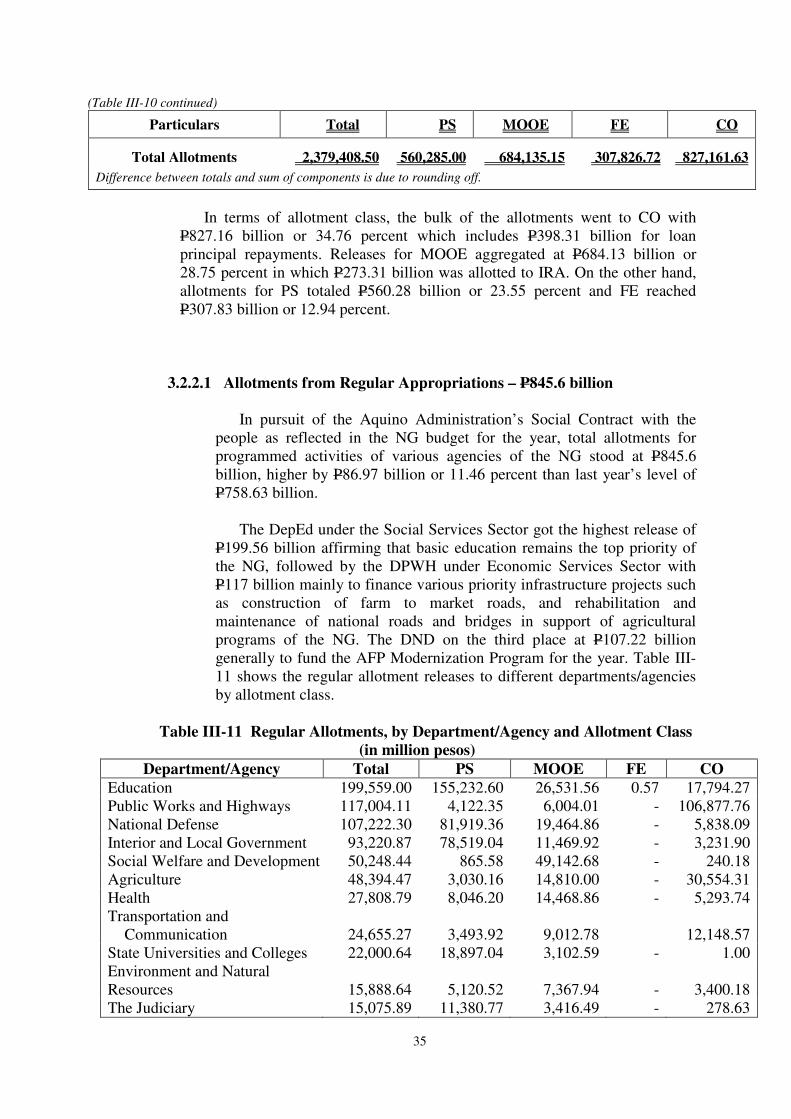
35
(Table III-10 continued)
Particulars Total PS MOOE FE CO
Total Allotments 2,379,408.50 560,285.00 684,135.15 307,826.72 827,161.63
Difference between totals and sum of components is due to rounding off.
In terms of allotment class, the bulk of the allotments went to CO with
P827.16 billion or 34.76 percent which includes P398.31 billion for loan
principal repayments. Releases for MOOE aggregated at P684.13 billion or
28.75 percent in which P273.31 billion was allotted to IRA. On the other hand,
allotments for PS totaled P560.28 billion or 23.55 percent and FE reached
P307.83 billion or 12.94 percent.
3.2.2.1 Allotments from Regular Appropriations – P845.6 billion
In pursuit of the Aquino Administration’s Social Contract with the
people as reflected in the NG budget for the year, total allotments for
programmed activities of various agencies of the NG stood at P845.6
billion, higher by P86.97 billion or 11.46 percent than last year’s level of
P758.63 billion.
The DepEd under the Social Services Sector got the highest release of
P199.56 billion affirming that basic education remains the top priority of
the NG, followed by the DPWH under Economic Services Sector with
P117 billion mainly to finance various priority infrastructure projects such
as construction of farm to market roads, and rehabilitation and
maintenance of national roads and bridges in support of agricultural
programs of the NG. The DND on the third place at P107.22 billion
generally to fund the AFP Modernization Program for the year. Table III-
11 shows the regular allotment releases to different departments/agencies
by allotment class.
Table III-11 Regular Allotments, by Department/Agency and Allotment Class
(in million pesos)
Department/Agency Total PS MOOE FE CO
Education 199,559.00 155,232.60 26,531.56 0.57 17,794.27
Public Works and Highways 117,004.11 4,122.35 6,004.01 - 106,877.76
National Defense 107,222.30 81,919.36 19,464.86 - 5,838.09
Interior and Local Government 93,220.87 78,519.04 11,469.92 - 3,231.90
Social Welfare and Development 50,248.44 865.58 49,142.68 - 240.18
Agriculture 48,394.47 3,030.16 14,810.00 - 30,554.31
Health 27,808.79 8,046.20 14,468.86 - 5,293.74
Transportation and
Communication 24,655.27 3,493.92 9,012.78 12,148.57
State Universities and Colleges 22,000.64 18,897.04 3,102.59 - 1.00
Environment and Natural
Resources 15,888.64 5,120.52 7,367.94 - 3,400.18
The Judiciary 15,075.89 11,380.77 3,416.49 - 278.63
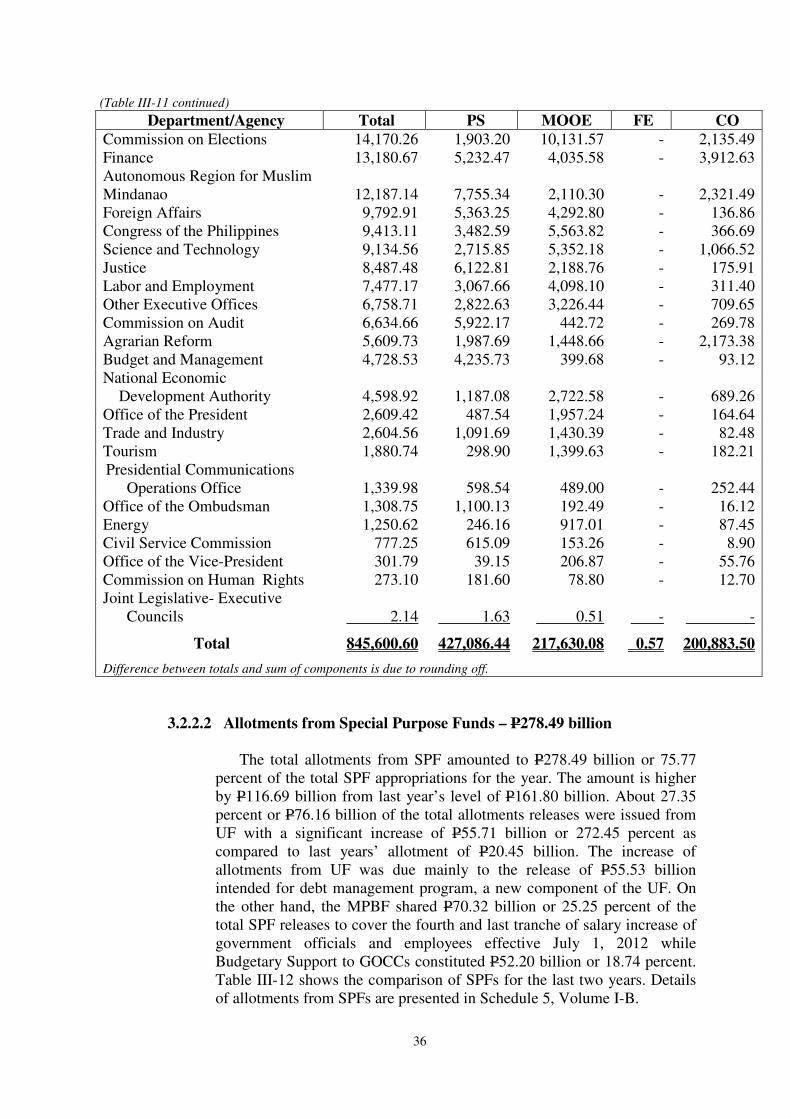
36
(Table III-11 continued)
Department/Agency Total PS MOOE FE CO
Commission on Elections 14,170.26 1,903.20 10,131.57 - 2,135.49
Finance 13,180.67 5,232.47 4,035.58 - 3,912.63
Autonomous Region for Muslim
Mindanao 12,187.14 7,755.34 2,110.30 - 2,321.49
Foreign Affairs 9,792.91 5,363.25 4,292.80 - 136.86
Congress of the Philippines 9,413.11 3,482.59 5,563.82 - 366.69
Science and Technology 9,134.56 2,715.85 5,352.18 - 1,066.52
Justice 8,487.48 6,122.81 2,188.76 - 175.91
Labor and Employment 7,477.17 3,067.66 4,098.10 - 311.40
Other Executive Offices 6,758.71 2,822.63 3,226.44 - 709.65
Commission on Audit 6,634.66 5,922.17 442.72 - 269.78
Agrarian Reform 5,609.73 1,987.69 1,448.66 - 2,173.38
Budget and Management 4,728.53 4,235.73 399.68 - 93.12
National Economic
Development Authority 4,598.92 1,187.08 2,722.58 - 689.26
Office of the President 2,609.42 487.54 1,957.24 - 164.64
Trade and Industry 2,604.56 1,091.69 1,430.39 - 82.48
Tourism 1,880.74 298.90 1,399.63 - 182.21
Presidential Communications
Operations Office 1,339.98 598.54 489.00 - 252.44
Office of the Ombudsman 1,308.75 1,100.13 192.49 - 16.12
Energy 1,250.62 246.16 917.01 - 87.45
Civil Service Commission 777.25 615.09 153.26 - 8.90
Office of the Vice-President 301.79 39.15 206.87 - 55.76
Commission on Human Rights 273.10 181.60 78.80 - 12.70
Joint Legislative- Executive
Councils 2.14 1.63 0.51 - -
Total 845,600.60 427,086.44 217,630.08 0.57 200,883.50
Difference between totals and sum of components is due to rounding off.
3.2.2.2 Allotments from Special Purpose Funds – P278.49 billion
The total allotments from SPF amounted to P278.49 billion or 75.77
percent of the total SPF appropriations for the year. The amount is higher
by P116.69 billion from last year’s level of P161.80 billion. About 27.35
percent or P76.16 billion of the total allotments releases were issued from
UF with a significant increase of P55.71 billion or 272.45 percent as
compared to last years’ allotment of P20.45 billion. The increase of
allotments from UF was due mainly to the release of P55.53 billion
intended for debt management program, a new component of the UF. On
the other hand, the MPBF shared P70.32 billion or 25.25 percent of the
total SPF releases to cover the fourth and last tranche of salary increase of
government officials and employees effective July 1, 2012 while
Budgetary Support to GOCCs constituted P52.20 billion or 18.74 percent.
Table III-12 shows the comparison of SPFs for the last two years. Details
of allotments from SPFs are presented in Schedule 5, Volume I-B.
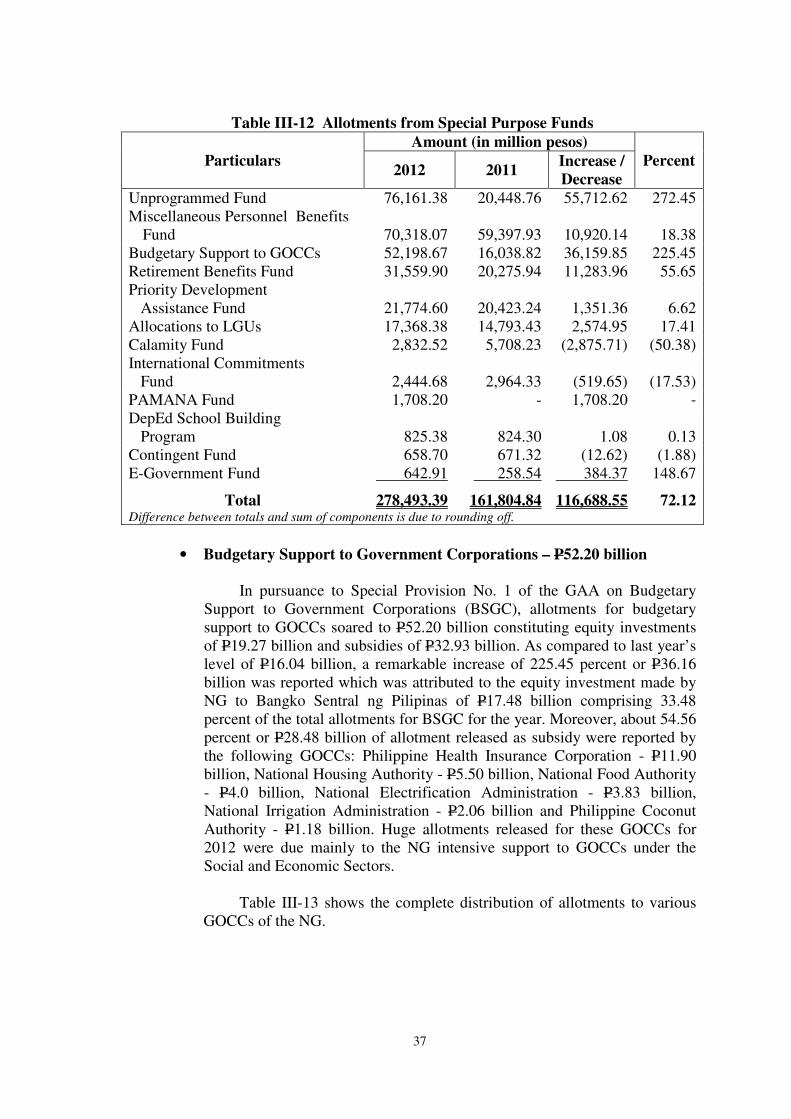
37
Table III-12 Allotments from Special Purpose Funds
Particulars
Amount (in million pesos)
Percent 2012 2011
Increase /
Decrease
Unprogrammed Fund 76,161.38 20,448.76 55,712.62 272.45
Miscellaneous Personnel Benefits
Fund 70,318.07 59,397.93 10,920.14 18.38
Budgetary Support to GOCCs 52,198.67 16,038.82 36,159.85 225.45
Retirement Benefits Fund 31,559.90 20,275.94 11,283.96 55.65
Priority Development
Assistance Fund 21,774.60
20,423.24 1,351.36 6.62
Allocations to LGUs 17,368.38 14,793.43 2,574.95 17.41
Calamity Fund 2,832.52 5,708.23 (2,875.71) (50.38)
International Commitments
Fund 2,444.68
2,964.33 (519.65) (17.53)
PAMANA Fund 1,708.20 - 1,708.20 -
DepEd School Building
Program 825.38
824.30 1.08 0.13
Contingent Fund 658.70 671.32 (12.62) (1.88)
E-Government Fund 642.91 258.54 384.37 148.67
Total 278,493.39 161,804.84 116,688.55 72.12 Difference between totals and sum of components is due to rounding off.
• Budgetary Support to Government Corporations – P52.20 billion
In pursuance to Special Provision No. 1 of the GAA on Budgetary
Support to Government Corporations (BSGC), allotments for budgetary
support to GOCCs soared to P52.20 billion constituting equity investments
of P19.27 billion and subsidies of P32.93 billion. As compared to last year’s
level of P16.04 billion, a remarkable increase of 225.45 percent or P36.16
billion was reported which was attributed to the equity investment made by
NG to Bangko Sentral ng Pilipinas of P17.48 billion comprising 33.48
percent of the total allotments for BSGC for the year. Moreover, about 54.56
percent or P28.48 billion of allotment released as subsidy were reported by
the following GOCCs: Philippine Health Insurance Corporation - P11.90
billion, National Housing Authority - P5.50 billion, National Food Authority
- P4.0 billion, National Electrification Administration - P3.83 billion,
National Irrigation Administration - P2.06 billion and Philippine Coconut
Authority - P1.18 billion. Huge allotments released for these GOCCs for
2012 were due mainly to the NG intensive support to GOCCs under the
Social and Economic Sectors.
Table III-13 shows the complete distribution of allotments to various
GOCCs of the NG.
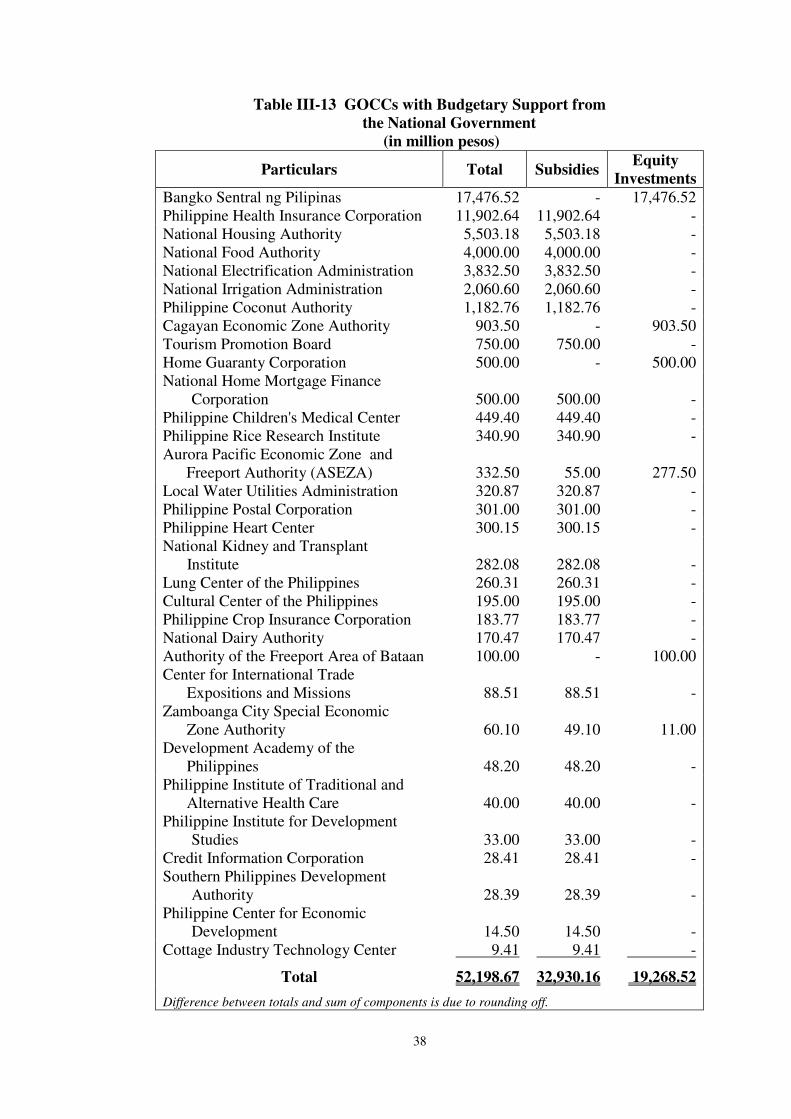
38
Table III-13 GOCCs with Budgetary Support from
the National Government
(in million pesos)
Particulars Total Subsidies Equity
Investments
Bangko Sentral ng Pilipinas 17,476.52 - 17,476.52
Philippine Health Insurance Corporation 11,902.64 11,902.64 -
National Housing Authority 5,503.18 5,503.18 -
National Food Authority 4,000.00 4,000.00 -
National Electrification Administration 3,832.50 3,832.50 -
National Irrigation Administration 2,060.60 2,060.60 -
Philippine Coconut Authority 1,182.76 1,182.76 -
Cagayan Economic Zone Authority 903.50 - 903.50
Tourism Promotion Board 750.00 750.00 -
Home Guaranty Corporation 500.00 - 500.00
National Home Mortgage Finance
Corporation 500.00 500.00 -
Philippine Children's Medical Center 449.40 449.40 -
Philippine Rice Research Institute 340.90 340.90 -
Aurora Pacific Economic Zone and
Freeport Authority (ASEZA) 332.50 55.00 277.50
Local Water Utilities Administration 320.87 320.87 -
Philippine Postal Corporation 301.00 301.00 -
Philippine Heart Center 300.15 300.15 -
National Kidney and Transplant
Institute 282.08 282.08 -
Lung Center of the Philippines 260.31 260.31 -
Cultural Center of the Philippines 195.00 195.00 -
Philippine Crop Insurance Corporation 183.77 183.77 -
National Dairy Authority 170.47 170.47 -
Authority of the Freeport Area of Bataan 100.00 - 100.00
Center for International Trade
Expositions and Missions 88.51 88.51 -
Zamboanga City Special Economic
Zone Authority 60.10 49.10 11.00
Development Academy of the
Philippines 48.20 48.20 -
Philippine Institute of Traditional and
Alternative Health Care 40.00 40.00 -
Philippine Institute for Development
Studies 33.00 33.00 -
Credit Information Corporation 28.41 28.41 -
Southern Philippines Development
Authority 28.39 28.39 -
Philippine Center for Economic
Development 14.50 14.50 -
Cottage Industry Technology Center 9.41 9.41 -
Total 52,198.67 32,930.16 19,268.52
Difference between totals and sum of components is due to rounding off.
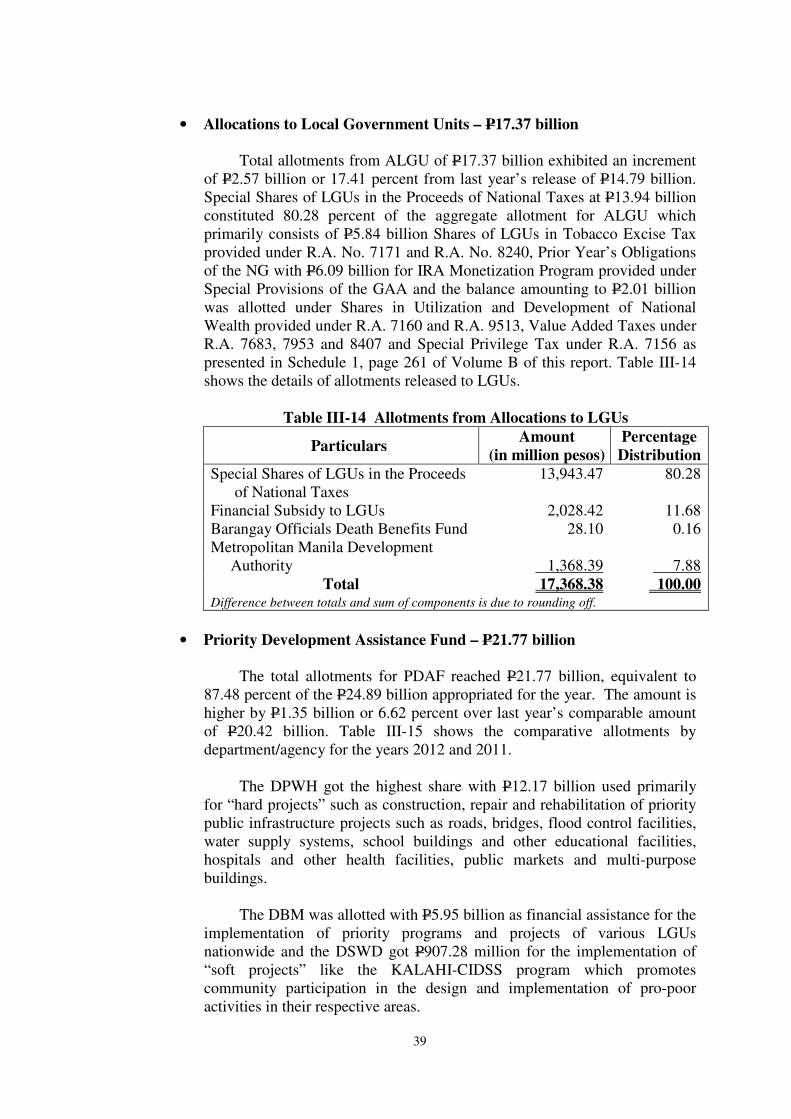
39
• Allocations to Local Government Units – P17.37 billion
Total allotments from ALGU of P17.37 billion exhibited an increment
of P2.57 billion or 17.41 percent from last year’s release of P14.79 billion.
Special Shares of LGUs in the Proceeds of National Taxes at P13.94 billion
constituted 80.28 percent of the aggregate allotment for ALGU which
primarily consists of P5.84 billion Shares of LGUs in Tobacco Excise Tax
provided under R.A. No. 7171 and R.A. No. 8240, Prior Year’s Obligations
of the NG with P6.09 billion for IRA Monetization Program provided under
Special Provisions of the GAA and the balance amounting to P2.01 billion
was allotted under Shares in Utilization and Development of National
Wealth provided under R.A. 7160 and R.A. 9513, Value Added Taxes under
R.A. 7683, 7953 and 8407 and Special Privilege Tax under R.A. 7156 as
presented in Schedule 1, page 261 of Volume B of this report. Table III-14
shows the details of allotments released to LGUs.
Table III-14 Allotments from Allocations to LGUs
Particulars Amount
(in million pesos)
Percentage
Distribution
Special Shares of LGUs in the Proceeds
of National Taxes
13,943.47 80.28
Financial Subsidy to LGUs 2,028.42 11.68
Barangay Officials Death Benefits Fund 28.10 0.16
Metropolitan Manila Development
Authority
1,368.39
7.88
Total 17,368.38 100.00 Difference between totals and sum of components is due to rounding off.
• Priority Development Assistance Fund – P21.77 billion
The total allotments for PDAF reached P21.77 billion, equivalent to
87.48 percent of the P24.89 billion appropriated for the year. The amount is
higher by P1.35 billion or 6.62 percent over last year’s comparable amount
of P20.42 billion. Table III-15 shows the comparative allotments by
department/agency for the years 2012 and 2011.
The DPWH got the highest share with P12.17 billion used primarily
for “hard projects” such as construction, repair and rehabilitation of priority
public infrastructure projects such as roads, bridges, flood control facilities,
water supply systems, school buildings and other educational facilities,
hospitals and other health facilities, public markets and multi-purpose
buildings.
The DBM was allotted with P5.95 billion as financial assistance for the
implementation of priority programs and projects of various LGUs
nationwide and the DSWD got P907.28 million for the implementation of
“soft projects” like the KALAHI-CIDSS program which promotes
community participation in the design and implementation of pro-poor
activities in their respective areas.
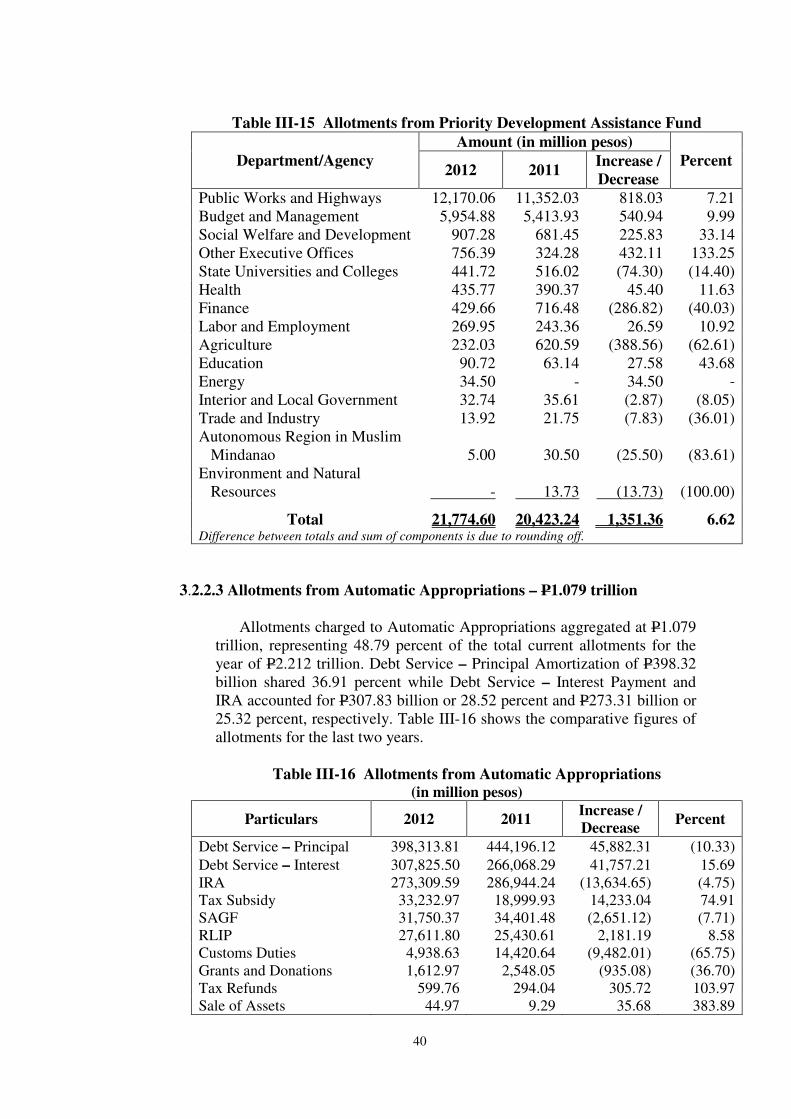
40
Table III-15 Allotments from Priority Development Assistance Fund
Department/Agency
Amount (in million pesos)
Percent 2012 2011
Increase /
Decrease
Public Works and Highways 12,170.06 11,352.03 818.03 7.21
Budget and Management 5,954.88 5,413.93 540.94 9.99
Social Welfare and Development 907.28 681.45 225.83 33.14
Other Executive Offices 756.39 324.28 432.11 133.25
State Universities and Colleges 441.72 516.02 (74.30) (14.40)
Health 435.77 390.37 45.40 11.63
Finance 429.66 716.48 (286.82) (40.03)
Labor and Employment 269.95 243.36 26.59 10.92
Agriculture 232.03 620.59 (388.56) (62.61)
Education 90.72 63.14 27.58 43.68
Energy 34.50 - 34.50 -
Interior and Local Government 32.74 35.61 (2.87) (8.05)
Trade and Industry 13.92 21.75 (7.83) (36.01)
Autonomous Region in Muslim
Mindanao 5.00
30.50 (25.50) (83.61)
Environment and Natural
Resources -
13.73 (13.73) (100.00)
Total 21,774.60 20,423.24 1,351.36 6.62 Difference between totals and sum of components is due to rounding off.
3.2.2.3 Allotments from Automatic Appropriations – P1.079 trillion
Allotments charged to Automatic Appropriations aggregated at P1.079
trillion, representing 48.79 percent of the total current allotments for the
year of P2.212 trillion. Debt Service – Principal Amortization of P398.32
billion shared 36.91 percent while Debt Service – Interest Payment and
IRA accounted for P307.83 billion or 28.52 percent and P273.31 billion or
25.32 percent, respectively. Table III-16 shows the comparative figures of
allotments for the last two years.
Table III-16 Allotments from Automatic Appropriations
(in million pesos)
Particulars 2012 2011 Increase /
Decrease Percent
Debt Service – Principal 398,313.81 444,196.12 45,882.31 (10.33)
Debt Service – Interest 307,825.50 266,068.29 41,757.21 15.69
IRA 273,309.59 286,944.24 (13,634.65) (4.75)
Tax Subsidy 33,232.97 18,999.93 14,233.04 74.91
SAGF 31,750.37 34,401.48 (2,651.12) (7.71)
RLIP 27,611.80 25,430.61 2,181.19 8.58
Customs Duties 4,938.63 14,420.64 (9,482.01) (65.75)
Grants and Donations 1,612.97 2,548.05 (935.08) (36.70)
Tax Refunds 599.76 294.04 305.72 103.97
Sale of Assets 44.97 9.29 35.68 383.89
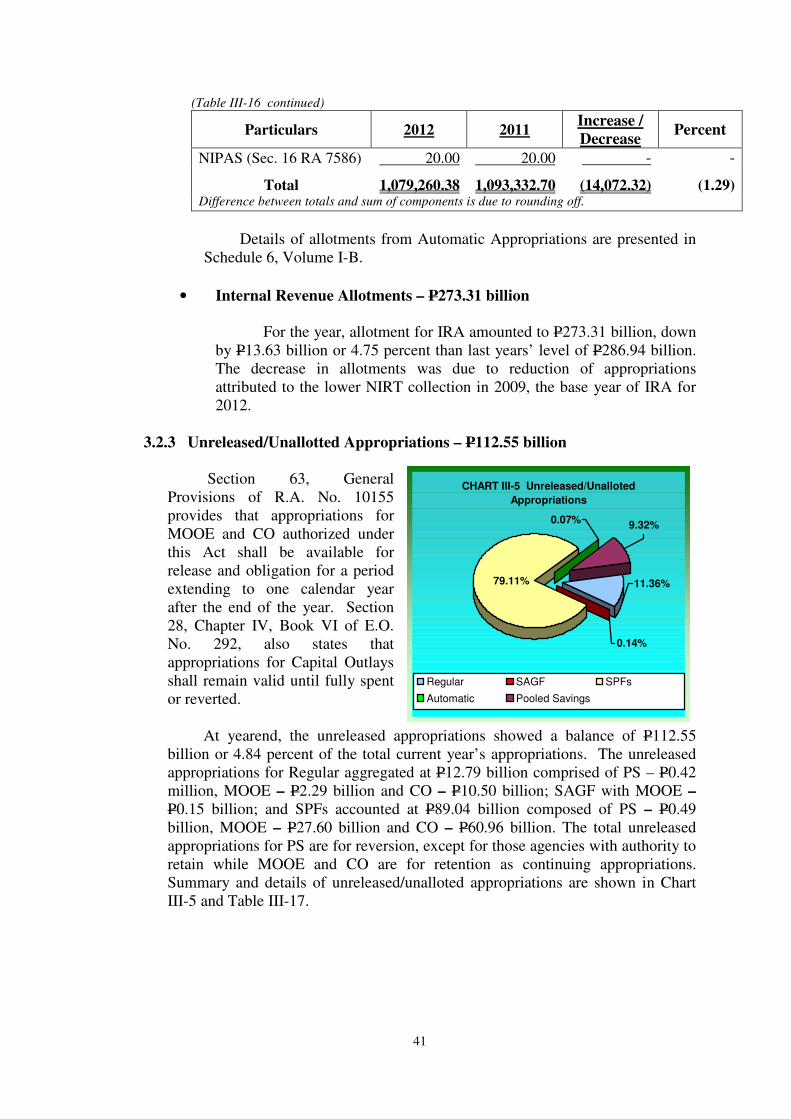
41
(Table III-16 continued)
Particulars 2012 2011 Increase /
Decrease Percent
NIPAS (Sec. 16 RA 7586) 20.00 20.00 - -
Total 1,079,260.38 1,093,332.70 (14,072.32) (1.29) Difference between totals and sum of components is due to rounding off.
Details of allotments from Automatic Appropriations are presented in
Schedule 6, Volume I-B.
• Internal Revenue Allotments – P273.31 billion
For the year, allotment for IRA amounted to P273.31 billion, down
by P13.63 billion or 4.75 percent than last years’ level of P286.94 billion.
The decrease in allotments was due to reduction of appropriations
attributed to the lower NIRT collection in 2009, the base year of IRA for
2012.
3.2.3 Unreleased/Unallotted Appropriations – P112.55 billion
Section 63, General
Provisions of R.A. No. 10155
provides that appropriations for
MOOE and CO authorized under
this Act shall be available for
release and obligation for a period
extending to one calendar year
after the end of the year. Section
28, Chapter IV, Book VI of E.O.
No. 292, also states that
appropriations for Capital Outlays
shall remain valid until fully spent
or reverted.
At yearend, the unreleased appropriations showed a balance of P112.55
billion or 4.84 percent of the total current year’s appropriations. The unreleased
appropriations for Regular aggregated at P12.79 billion comprised of PS – P0.42
million, MOOE – P2.29 billion and CO – P10.50 billion; SAGF with MOOE –
P0.15 billion; and SPFs accounted at P89.04 billion composed of PS – P0.49
billion, MOOE – P27.60 billion and CO – P60.96 billion. The total unreleased
appropriations for PS are for reversion, except for those agencies with authority to
retain while MOOE and CO are for retention as continuing appropriations.
Summary and details of unreleased/unalloted appropriations are shown in Chart
III-5 and Table III-17.
CHART III-5 Unreleased/Unalloted
Appropriations
79.11% 11.36%
0.14%
9.32%0.07%
Regular SAGF SPFs
Automatic Pooled Savings
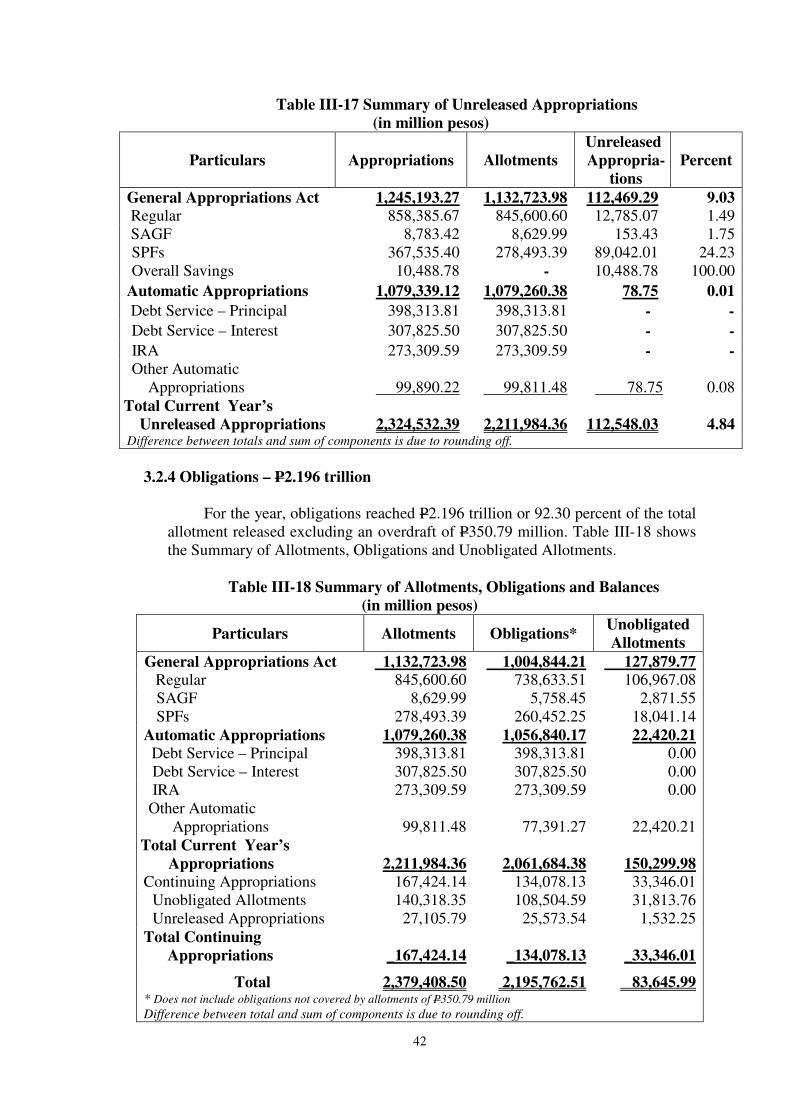
42
Table III-17 Summary of Unreleased Appropriations
(in million pesos)
Particulars Appropriations Allotments
Unreleased
Appropria-
tions
Percent
General Appropriations Act 1,245,193.27 1,132,723.98 112,469.29 9.03
Regular 858,385.67 845,600.60 12,785.07 1.49
SAGF 8,783.42 8,629.99 153.43 1.75
SPFs 367,535.40 278,493.39 89,042.01 24.23
Overall Savings 10,488.78 - 10,488.78 100.00
Automatic Appropriations 1,079,339.12 1,079,260.38 78.75 0.01
Debt Service – Principal 398,313.81 398,313.81 - -
Debt Service – Interest 307,825.50 307,825.50 - -
IRA 273,309.59 273,309.59 - -
Other Automatic
Appropriations 99,890.22 99,811.48 78.75 0.08
Total Current Year’s
Unreleased Appropriations 2,324,532.39 2,211,984.36 112,548.03 4.84 Difference between totals and sum of components is due to rounding off.
3.2.4 Obligations – P2.196 trillion
For the year, obligations reached P2.196 trillion or 92.30 percent of the total
allotment released excluding an overdraft of P350.79 million. Table III-18 shows
the Summary of Allotments, Obligations and Unobligated Allotments.
Table III-18 Summary of Allotments, Obligations and Balances
(in million pesos)
Particulars Allotments Obligations* Unobligated
Allotments
General Appropriations Act 1,132,723.98 1,004,844.21 127,879.77
Regular 845,600.60 738,633.51 106,967.08
SAGF 8,629.99 5,758.45 2,871.55
SPFs 278,493.39 260,452.25 18,041.14
Automatic Appropriations 1,079,260.38 1,056,840.17 22,420.21
Debt Service – Principal 398,313.81 398,313.81 0.00
Debt Service – Interest 307,825.50 307,825.50 0.00
IRA 273,309.59 273,309.59 0.00
Other Automatic
Appropriations 99,811.48 77,391.27 22,420.21
Total Current Year’s
Appropriations
2,211,984.36
2,061,684.38
150,299.98
Continuing Appropriations 167,424.14 134,078.13 33,346.01
Unobligated Allotments 140,318.35 108,504.59 31,813.76
Unreleased Appropriations 27,105.79 25,573.54 1,532.25
Total Continuing
Appropriations
_167,424.14
_134,078.13
_33,346.01
Total 2,379,408.50 2,195,762.51 83,645.99 * Does not include obligations not covered by allotments of P350.79 million
Difference between total and sum of components is due to rounding off.
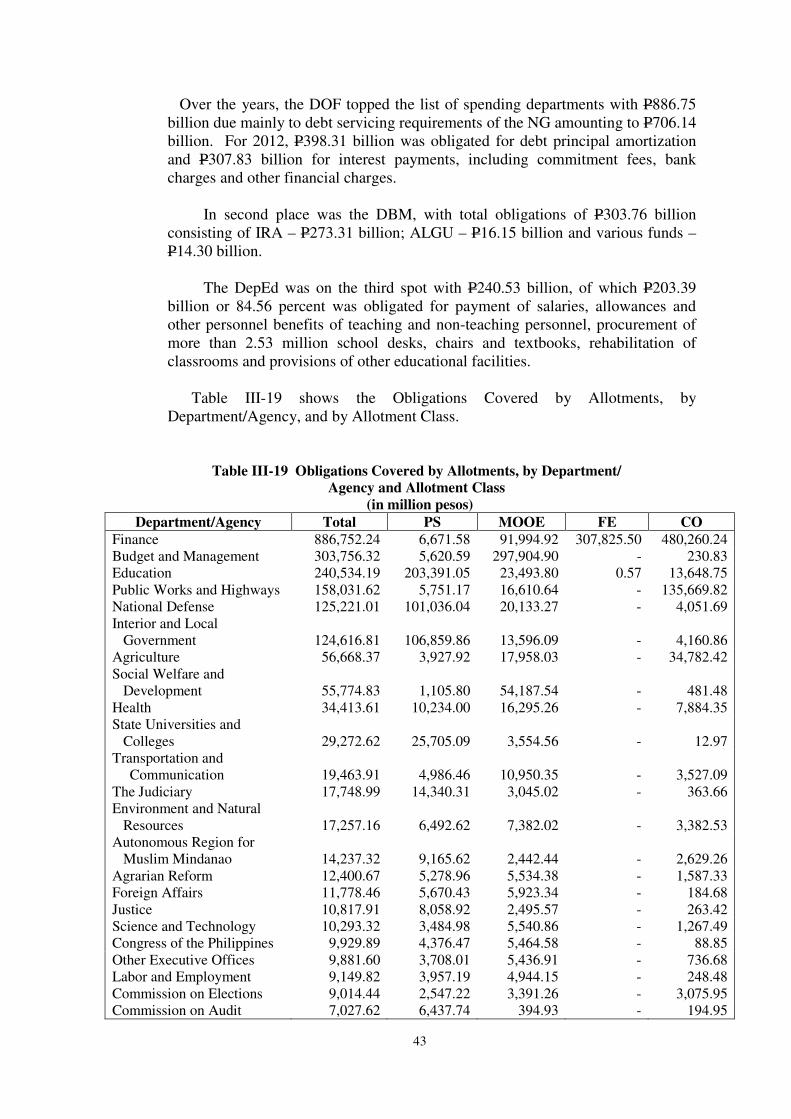
43
Over the years, the DOF topped the list of spending departments with P886.75
billion due mainly to debt servicing requirements of the NG amounting to P706.14
billion. For 2012, P398.31 billion was obligated for debt principal amortization
and P307.83 billion for interest payments, including commitment fees, bank
charges and other financial charges.
In second place was the DBM, with total obligations of P303.76 billion
consisting of IRA – P273.31 billion; ALGU – P16.15 billion and various funds –
P14.30 billion.
The DepEd was on the third spot with P240.53 billion, of which P203.39
billion or 84.56 percent was obligated for payment of salaries, allowances and
other personnel benefits of teaching and non-teaching personnel, procurement of
more than 2.53 million school desks, chairs and textbooks, rehabilitation of
classrooms and provisions of other educational facilities.
Table III-19 shows the Obligations Covered by Allotments, by
Department/Agency, and by Allotment Class.
Table III-19 Obligations Covered by Allotments, by Department/
Agency and Allotment Class (in million pesos)
Department/Agency Total PS MOOE FE CO Finance 886,752.24 6,671.58 91,994.92 307,825.50 480,260.24
Budget and Management 303,756.32 5,620.59 297,904.90 - 230.83
Education 240,534.19 203,391.05 23,493.80 0.57 13,648.75
Public Works and Highways 158,031.62 5,751.17 16,610.64 - 135,669.82
National Defense 125,221.01 101,036.04 20,133.27 - 4,051.69
Interior and Local
Government 124,616.81 106,859.86 13,596.09 - 4,160.86
Agriculture 56,668.37 3,927.92 17,958.03 - 34,782.42
Social Welfare and
Development 55,774.83 1,105.80 54,187.54 - 481.48
Health 34,413.61 10,234.00 16,295.26 - 7,884.35
State Universities and
Colleges 29,272.62 25,705.09 3,554.56 - 12.97
Transportation and
Communication 19,463.91 4,986.46 10,950.35 - 3,527.09
The Judiciary 17,748.99 14,340.31 3,045.02 - 363.66
Environment and Natural
Resources 17,257.16 6,492.62 7,382.02 - 3,382.53
Autonomous Region for
Muslim Mindanao 14,237.32 9,165.62 2,442.44 - 2,629.26
Agrarian Reform 12,400.67 5,278.96 5,534.38 - 1,587.33
Foreign Affairs 11,778.46 5,670.43 5,923.34 - 184.68
Justice 10,817.91 8,058.92 2,495.57 - 263.42
Science and Technology 10,293.32 3,484.98 5,540.86 - 1,267.49
Congress of the Philippines 9,929.89 4,376.47 5,464.58 - 88.85
Other Executive Offices 9,881.60 3,708.01 5,436.91 - 736.68
Labor and Employment 9,149.82 3,957.19 4,944.15 - 248.48
Commission on Elections 9,014.44 2,547.22 3,391.26 - 3,075.95
Commission on Audit 7,027.62 6,437.74 394.93 - 194.95
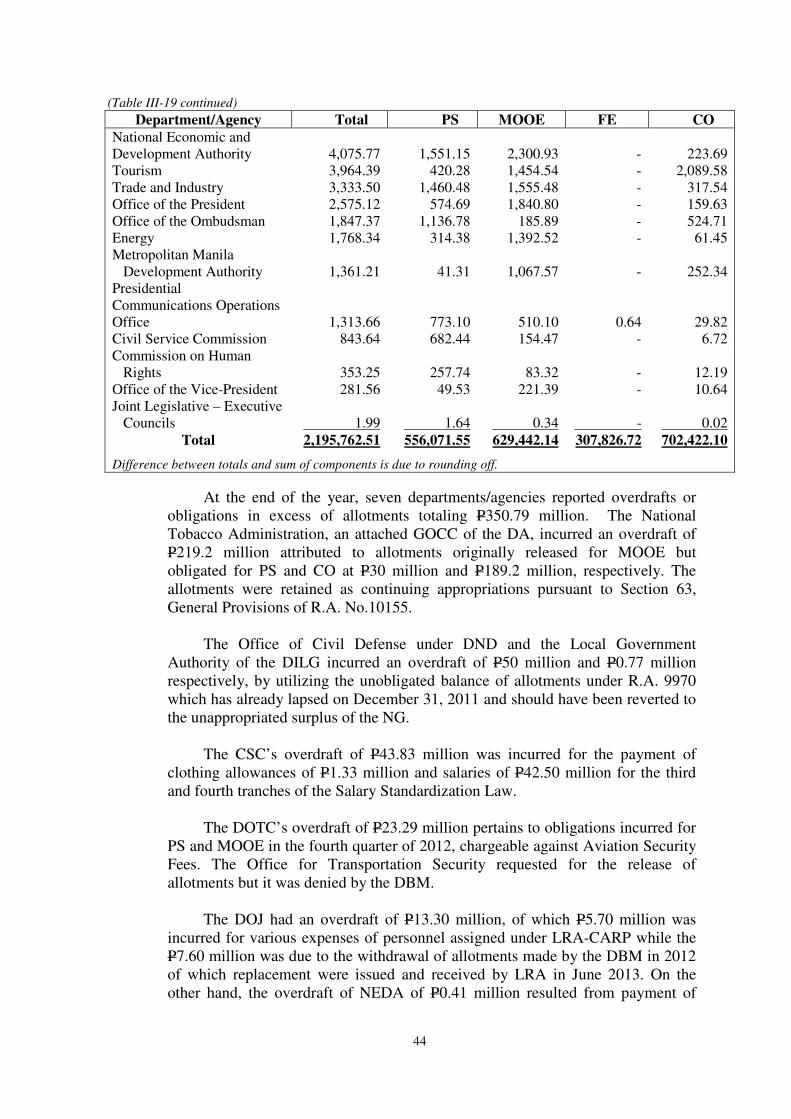
44
(Table III-19 continued) Department/Agency Total PS MOOE FE CO
National Economic and
Development Authority 4,075.77 1,551.15 2,300.93 - 223.69
Tourism 3,964.39 420.28 1,454.54 - 2,089.58
Trade and Industry 3,333.50 1,460.48 1,555.48 - 317.54
Office of the President 2,575.12 574.69 1,840.80 - 159.63
Office of the Ombudsman 1,847.37 1,136.78 185.89 - 524.71
Energy 1,768.34 314.38 1,392.52 - 61.45
Metropolitan Manila
Development Authority 1,361.21 41.31 1,067.57 - 252.34
Presidential
Communications Operations
Office 1,313.66 773.10 510.10 0.64 29.82
Civil Service Commission 843.64 682.44 154.47 - 6.72
Commission on Human
Rights 353.25 257.74 83.32 - 12.19 Office of the Vice-President 281.56 49.53 221.39 - 10.64
Joint Legislative – Executive
Councils 1.99 1.64 0.34 - 0.02
Total 2,195,762.51 556,071.55 629,442.14 307,826.72 702,422.10
Difference between totals and sum of components is due to rounding off.
At the end of the year, seven departments/agencies reported overdrafts or
obligations in excess of allotments totaling P350.79 million. The National
Tobacco Administration, an attached GOCC of the DA, incurred an overdraft of
P219.2 million attributed to allotments originally released for MOOE but
obligated for PS and CO at P30 million and P189.2 million, respectively. The
allotments were retained as continuing appropriations pursuant to Section 63,
General Provisions of R.A. No.10155.
The Office of Civil Defense under DND and the Local Government
Authority of the DILG incurred an overdraft of P50 million and P0.77 million
respectively, by utilizing the unobligated balance of allotments under R.A. 9970
which has already lapsed on December 31, 2011 and should have been reverted to
the unappropriated surplus of the NG.
The CSC’s overdraft of P43.83 million was incurred for the payment of
clothing allowances of P1.33 million and salaries of P42.50 million for the third
and fourth tranches of the Salary Standardization Law.
The DOTC’s overdraft of P23.29 million pertains to obligations incurred for
PS and MOOE in the fourth quarter of 2012, chargeable against Aviation Security
Fees. The Office for Transportation Security requested for the release of
allotments but it was denied by the DBM.
The DOJ had an overdraft of P13.30 million, of which P5.70 million was
incurred for various expenses of personnel assigned under LRA-CARP while the
P7.60 million was due to the withdrawal of allotments made by the DBM in 2012
of which replacement were issued and received by LRA in June 2013. On the
other hand, the overdraft of NEDA of P0.41 million resulted from payment of
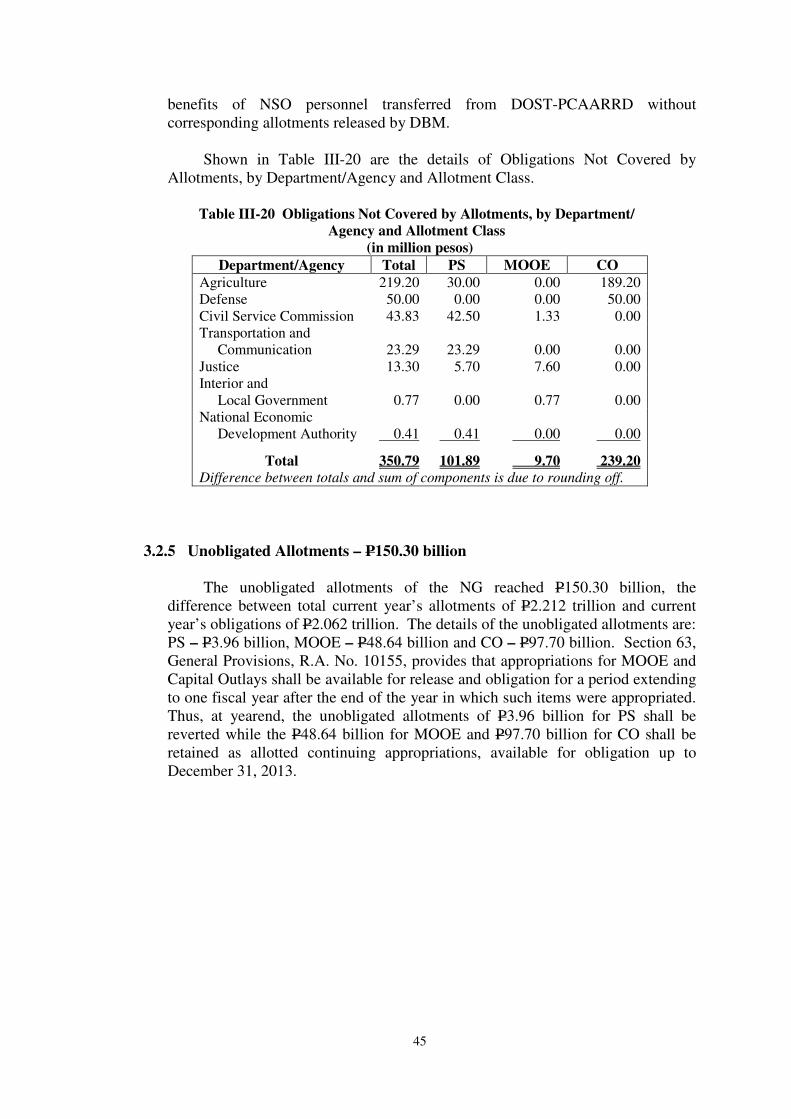
45
benefits of NSO personnel transferred from DOST-PCAARRD without
corresponding allotments released by DBM.
Shown in Table III-20 are the details of Obligations Not Covered by
Allotments, by Department/Agency and Allotment Class.
Table III-20 Obligations Not Covered by Allotments, by Department/
Agency and Allotment Class
(in million pesos)
Department/Agency Total PS MOOE CO
Agriculture 219.20 30.00 0.00 189.20
Defense 50.00 0.00 0.00 50.00
Civil Service Commission 43.83 42.50 1.33 0.00
Transportation and
Communication 23.29 23.29 0.00 0.00
Justice 13.30 5.70 7.60 0.00
Interior and
Local Government 0.77 0.00 0.77 0.00
National Economic
Development Authority 0.41 0.41 0.00 0.00
Total 350.79 101.89 9.70 239.20
Difference between totals and sum of components is due to rounding off.
3.2.5 Unobligated Allotments – P150.30 billion
The unobligated allotments of the NG reached P150.30 billion, the
difference between total current year’s allotments of P2.212 trillion and current
year’s obligations of P2.062 trillion. The details of the unobligated allotments are:
PS – P3.96 billion, MOOE – P48.64 billion and CO – P97.70 billion. Section 63,
General Provisions, R.A. No. 10155, provides that appropriations for MOOE and
Capital Outlays shall be available for release and obligation for a period extending
to one fiscal year after the end of the year in which such items were appropriated.
Thus, at yearend, the unobligated allotments of P3.96 billion for PS shall be
reverted while the P48.64 billion for MOOE and P97.70 billion for CO shall be
retained as allotted continuing appropriations, available for obligation up to
December 31, 2013.

IV. FINANCIAL STATEMENTS
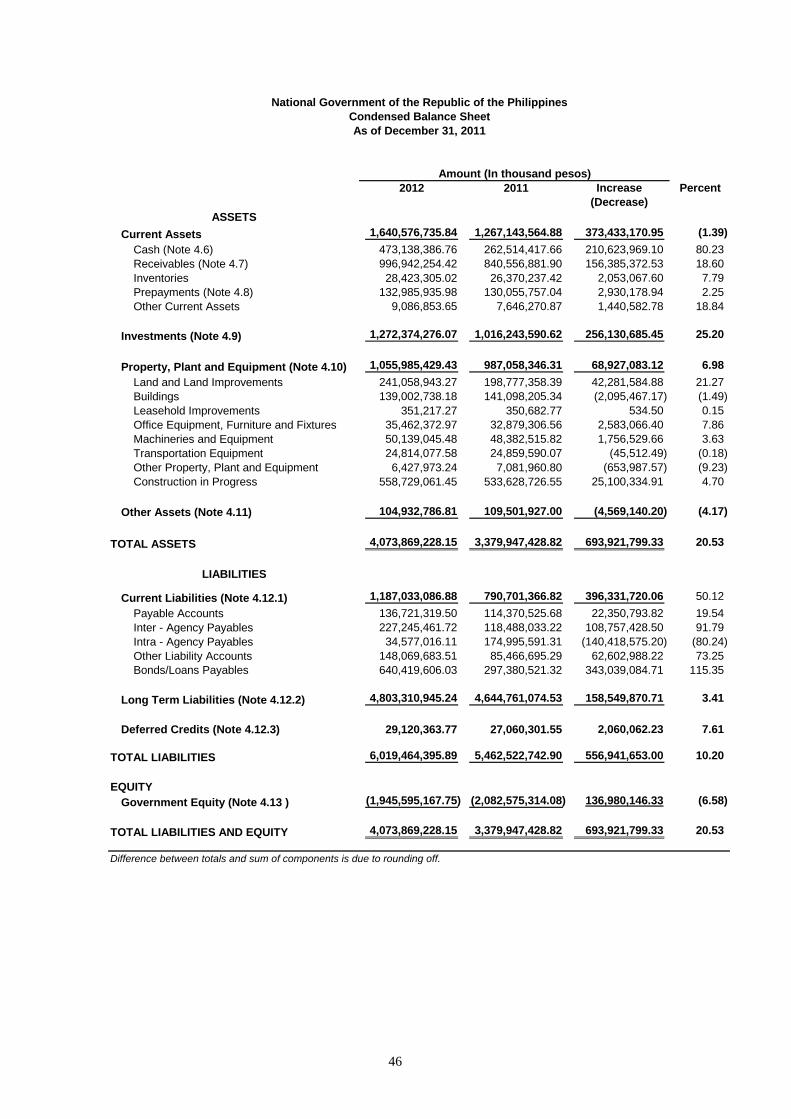
2012 2011 Increase Percent
(Decrease)
Current Assets 1,640,576,735.84 1,267,143,564.88 373,433,170.95 (1.39)
Cash (Note 4.6) 473,138,386.76 262,514,417.66 210,623,969.10 80.23
Receivables (Note 4.7) 996,942,254.42 840,556,881.90 156,385,372.53 18.60
Inventories 28,423,305.02 26,370,237.42 2,053,067.60 7.79
Prepayments (Note 4.8) 132,985,935.98 130,055,757.04 2,930,178.94 2.25
Other Current Assets 9,086,853.65 7,646,270.87 1,440,582.78 18.84
Investments (Note 4.9) 1,272,374,276.07 1,016,243,590.62 256,130,685.45 25.20
Property, Plant and Equipment (Note 4.10) 1,055,985,429.43 987,058,346.31 68,927,083.12 6.98
Land and Land Improvements 241,058,943.27 198,777,358.39 42,281,584.88 21.27
Buildings 139,002,738.18 141,098,205.34 (2,095,467.17) (1.49)
Leasehold Improvements 351,217.27 350,682.77 534.50 0.15
Office Equipment, Furniture and Fixtures 35,462,372.97 32,879,306.56 2,583,066.40 7.86
Machineries and Equipment 50,139,045.48 48,382,515.82 1,756,529.66 3.63
Transportation Equipment 24,814,077.58 24,859,590.07 (45,512.49) (0.18)
Other Property, Plant and Equipment 6,427,973.24 7,081,960.80 (653,987.57) (9.23)
Construction in Progress 558,729,061.45 533,628,726.55 25,100,334.91 4.70
Other Assets (Note 4.11) 104,932,786.81 109,501,927.00 (4,569,140.20) (4.17)
TOTAL ASSETS 4,073,869,228.15 3,379,947,428.82 693,921,799.33 20.53
Current Liabilities (Note 4.12.1) 1,187,033,086.88 790,701,366.82 396,331,720.06 50.12
Payable Accounts 136,721,319.50 114,370,525.68 22,350,793.82 19.54
Inter - Agency Payables 227,245,461.72 118,488,033.22 108,757,428.50 91.79
Intra - Agency Payables 34,577,016.11 174,995,591.31 (140,418,575.20) (80.24)
Other Liability Accounts 148,069,683.51 85,466,695.29 62,602,988.22 73.25
Bonds/Loans Payables 640,419,606.03 297,380,521.32 343,039,084.71 115.35
Long Term Liabilities (Note 4.12.2) 4,803,310,945.24 4,644,761,074.53 158,549,870.71 3.41
Deferred Credits (Note 4.12.3) 29,120,363.77 27,060,301.55 2,060,062.23 7.61
TOTAL LIABILITIES 6,019,464,395.89 5,462,522,742.90 556,941,653.00 10.20
EQUITY
Government Equity (Note 4.13 ) (1,945,595,167.75) (2,082,575,314.08) 136,980,146.33 (6.58)
TOTAL LIABILITIES AND EQUITY 4,073,869,228.15 3,379,947,428.82 693,921,799.33 20.53
Difference between totals and sum of components is due to rounding off.
LIABILITIES
ASSETS
National Government of the Republic of the Philippines
Condensed Balance Sheet
As of December 31, 2011
Amount (In thousand pesos)
46
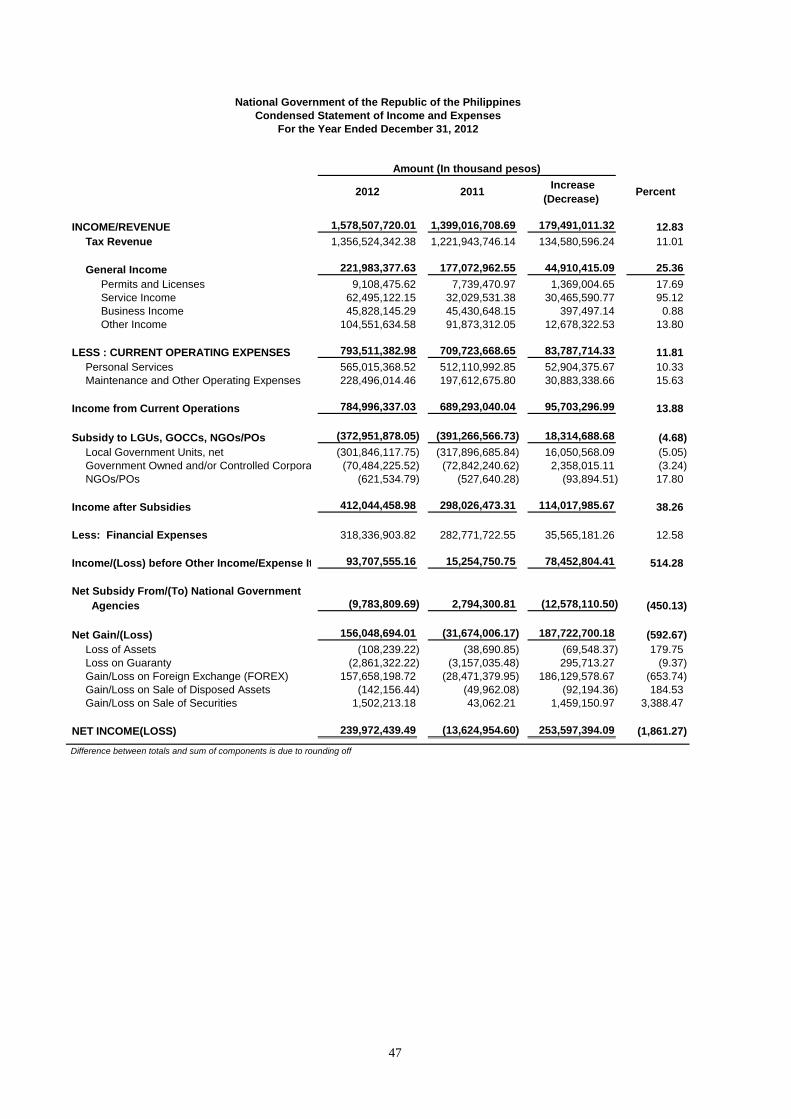
INCOME/REVENUE 1,578,507,720.01 1,399,016,708.69 179,491,011.32 12.83
Tax Revenue 1,356,524,342.38 1,221,943,746.14 134,580,596.24 11.01
General Income 221,983,377.63 177,072,962.55 44,910,415.09 25.36
Permits and Licenses 9,108,475.62 7,739,470.97 1,369,004.65 17.69
Service Income 62,495,122.15 32,029,531.38 30,465,590.77 95.12
Business Income 45,828,145.29 45,430,648.15 397,497.14 0.88
Other Income 104,551,634.58 91,873,312.05 12,678,322.53 13.80
LESS : CURRENT OPERATING EXPENSES 793,511,382.98 709,723,668.65 83,787,714.33 11.81
Personal Services 565,015,368.52 512,110,992.85 52,904,375.67 10.33
Maintenance and Other Operating Expenses 228,496,014.46 197,612,675.80 30,883,338.66 15.63
Income from Current Operations 784,996,337.03 689,293,040.04 95,703,296.99 13.88
Subsidy to LGUs, GOCCs, NGOs/POs (372,951,878.05) (391,266,566.73) 18,314,688.68 (4.68)
Local Government Units, net (301,846,117.75) (317,896,685.84) 16,050,568.09 (5.05)
Government Owned and/or Controlled Corporation (70,484,225.52) (72,842,240.62) 2,358,015.11 (3.24)
NGOs/POs (621,534.79) (527,640.28) (93,894.51) 17.80
Income after Subsidies 412,044,458.98 298,026,473.31 114,017,985.67 38.26
Less: Financial Expenses 318,336,903.82 282,771,722.55 35,565,181.26 12.58
Income/(Loss) before Other Income/Expense Items 93,707,555.16 15,254,750.75 78,452,804.41 514.28
Net Subsidy From/(To) National Government
Agencies (9,783,809.69) 2,794,300.81 (12,578,110.50) (450.13)
Net Gain/(Loss) 156,048,694.01 (31,674,006.17) 187,722,700.18 (592.67)
Loss of Assets (108,239.22) (38,690.85) (69,548.37) 179.75
Loss on Guaranty (2,861,322.22) (3,157,035.48) 295,713.27 (9.37)
Gain/Loss on Foreign Exchange (FOREX) 157,658,198.72 (28,471,379.95) 186,129,578.67 (653.74)
Gain/Loss on Sale of Disposed Assets (142,156.44) (49,962.08) (92,194.36) 184.53
Gain/Loss on Sale of Securities 1,502,213.18 43,062.21 1,459,150.97 3,388.47
NET INCOME(LOSS) 239,972,439.49 (13,624,954.60) 253,597,394.09 (1,861.27)
Difference between totals and sum of components is due to rounding off
National Government of the Republic of the Philippines
Condensed Statement of Income and Expenses
For the Year Ended December 31, 2012
Amount (In thousand pesos)
2012 2011 Increase
(Decrease) Percent
47
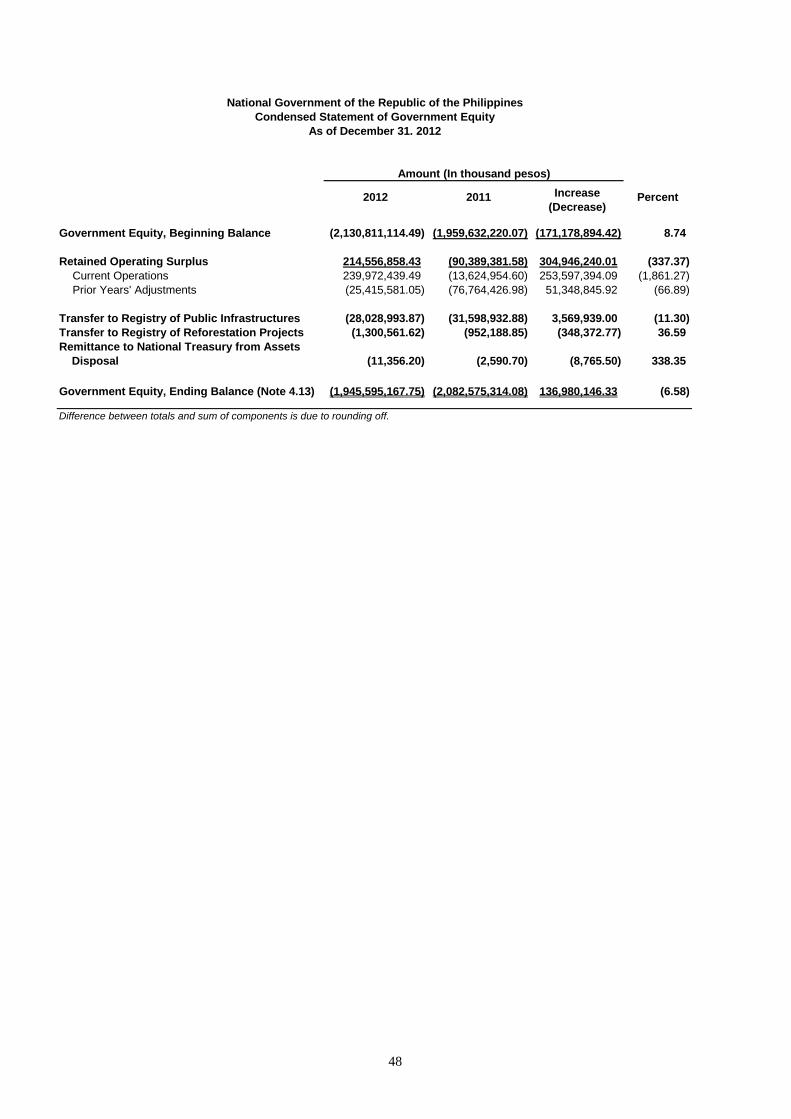
Increase
(Decrease)
Government Equity, Beginning Balance (2,130,811,114.49) (1,959,632,220.07) (171,178,894.42) 8.74
Retained Operating Surplus 214,556,858.43 (90,389,381.58) 304,946,240.01 (337.37)
Current Operations 239,972,439.49 (13,624,954.60) 253,597,394.09 (1,861.27)
Prior Years' Adjustments (25,415,581.05) (76,764,426.98) 51,348,845.92 (66.89)
Transfer to Registry of Public Infrastructures (28,028,993.87) (31,598,932.88) 3,569,939.00 (11.30)
Transfer to Registry of Reforestation Projects (1,300,561.62) (952,188.85) (348,372.77) 36.59
Remittance to National Treasury from Assets
Disposal (11,356.20) (2,590.70) (8,765.50) 338.35
Government Equity, Ending Balance (Note 4.13) (1,945,595,167.75) (2,082,575,314.08) 136,980,146.33 (6.58)
Difference between totals and sum of components is due to rounding off.
Percent
National Government of the Republic of the Philippines
Condensed Statement of Government Equity
As of December 31. 2012
Amount (In thousand pesos)
2012 2011
48
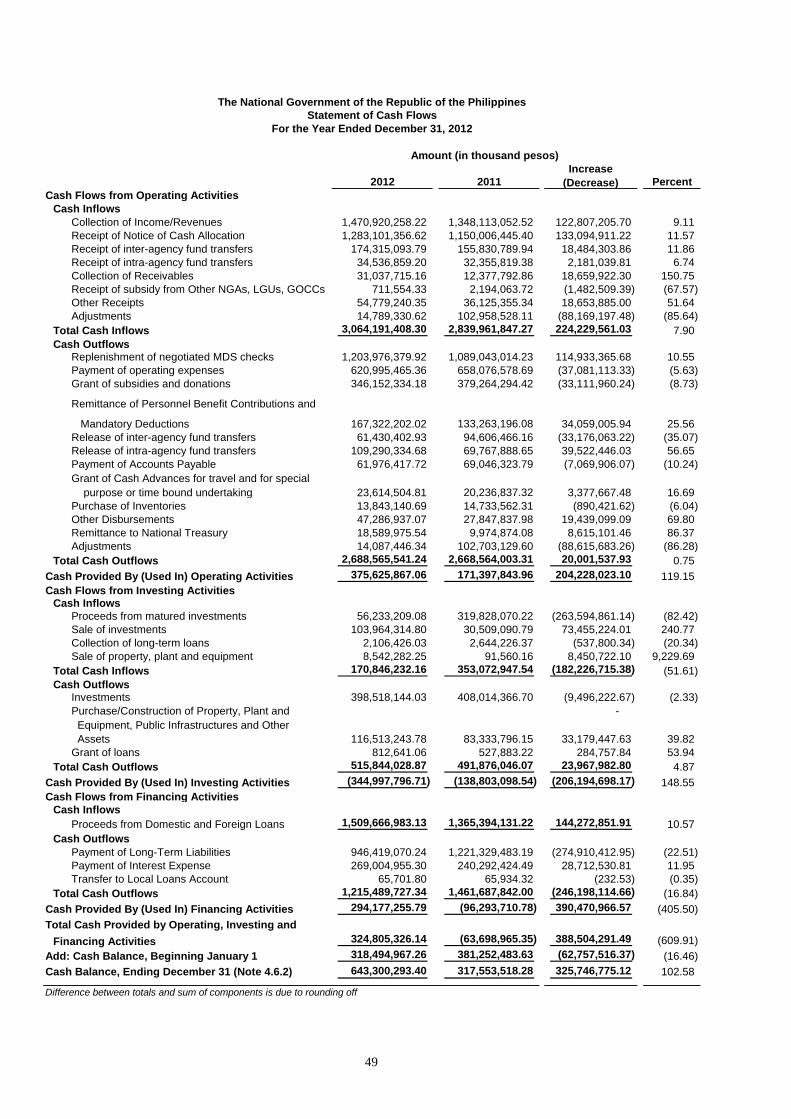
2012 2011
Increase
(Decrease) Percent
Cash Flows from Operating Activities
Cash Inflows
Collection of Income/Revenues 1,470,920,258.22 1,348,113,052.52 122,807,205.70 9.11
Receipt of Notice of Cash Allocation 1,283,101,356.62 1,150,006,445.40 133,094,911.22 11.57
Receipt of inter-agency fund transfers 174,315,093.79 155,830,789.94 18,484,303.86 11.86
Receipt of intra-agency fund transfers 34,536,859.20 32,355,819.38 2,181,039.81 6.74
Collection of Receivables 31,037,715.16 12,377,792.86 18,659,922.30 150.75
Receipt of subsidy from Other NGAs, LGUs, GOCCs 711,554.33 2,194,063.72 (1,482,509.39) (67.57)
Other Receipts 54,779,240.35 36,125,355.34 18,653,885.00 51.64
Adjustments 14,789,330.62 102,958,528.11 (88,169,197.48) (85.64)
Total Cash Inflows 3,064,191,408.30 2,839,961,847.27 224,229,561.03 7.90
Cash OutflowsReplenishment of negotiated MDS checks 1,203,976,379.92 1,089,043,014.23 114,933,365.68 10.55
Payment of operating expenses 620,995,465.36 658,076,578.69 (37,081,113.33) (5.63)
Grant of subsidies and donations 346,152,334.18 379,264,294.42 (33,111,960.24) (8.73)
Remittance of Personnel Benefit Contributions and
Mandatory Deductions 167,322,202.02 133,263,196.08 34,059,005.94 25.56
Release of inter-agency fund transfers 61,430,402.93 94,606,466.16 (33,176,063.22) (35.07)
Release of intra-agency fund transfers 109,290,334.68 69,767,888.65 39,522,446.03 56.65
Payment of Accounts Payable 61,976,417.72 69,046,323.79 (7,069,906.07) (10.24)
Grant of Cash Advances for travel and for special
purpose or time bound undertaking 23,614,504.81 20,236,837.32 3,377,667.48 16.69
Purchase of Inventories 13,843,140.69 14,733,562.31 (890,421.62) (6.04)
Other Disbursements 47,286,937.07 27,847,837.98 19,439,099.09 69.80
Remittance to National Treasury 18,589,975.54 9,974,874.08 8,615,101.46 86.37
Adjustments 14,087,446.34 102,703,129.60 (88,615,683.26) (86.28)
Total Cash Outflows 2,688,565,541.24 2,668,564,003.31 20,001,537.93 0.75
Cash Provided By (Used In) Operating Activities 375,625,867.06 171,397,843.96 204,228,023.10 119.15
Cash Flows from Investing ActivitiesCash Inflows
Proceeds from matured investments 56,233,209.08 319,828,070.22 (263,594,861.14) (82.42)
Sale of investments 103,964,314.80 30,509,090.79 73,455,224.01 240.77
Collection of long-term loans 2,106,426.03 2,644,226.37 (537,800.34) (20.34)
Sale of property, plant and equipment 8,542,282.25 91,560.16 8,450,722.10 9,229.69
Total Cash Inflows 170,846,232.16 353,072,947.54 (182,226,715.38) (51.61)
Cash OutflowsInvestments 398,518,144.03 408,014,366.70 (9,496,222.67) (2.33)
Purchase/Construction of Property, Plant and -
Equipment, Public Infrastructures and Other
Assets 116,513,243.78 83,333,796.15 33,179,447.63 39.82
Grant of loans 812,641.06 527,883.22 284,757.84 53.94
Total Cash Outflows 515,844,028.87 491,876,046.07 23,967,982.80 4.87
Cash Provided By (Used In) Investing Activities (344,997,796.71) (138,803,098.54) (206,194,698.17) 148.55
Cash Flows from Financing Activities
Cash Inflows
Proceeds from Domestic and Foreign Loans 1,509,666,983.13 1,365,394,131.22 144,272,851.91 10.57
Cash Outflows
Payment of Long-Term Liabilities 946,419,070.24 1,221,329,483.19 (274,910,412.95) (22.51)
Payment of Interest Expense 269,004,955.30 240,292,424.49 28,712,530.81 11.95
Transfer to Local Loans Account 65,701.80 65,934.32 (232.53) (0.35)
Total Cash Outflows 1,215,489,727.34 1,461,687,842.00 (246,198,114.66) (16.84)
Cash Provided By (Used In) Financing Activities 294,177,255.79 (96,293,710.78) 390,470,966.57 (405.50)
Total Cash Provided by Operating, Investing and
Financing Activities 324,805,326.14 (63,698,965.35) 388,504,291.49 (609.91)
Add: Cash Balance, Beginning January 1 318,494,967.26 381,252,483.63 (62,757,516.37) (16.46)
Cash Balance, Ending December 31 (Note 4.6.2) 643,300,293.40 317,553,518.28 325,746,775.12 102.58
Difference between totals and sum of components is due to rounding off
The National Government of the Republic of the Philippines
Statement of Cash Flows
For the Year Ended December 31, 2012
Amount (in thousand pesos)
49
50
NOTES TO FINANCIAL STATEMENTS
4.5 Summary of Significant Accounting Policies/Procedures
4.5.1 Funds and Books Maintained
The New Government Accounting System (NGAS) which took effect on
January 2002, authorized the national government agencies (NGAs) to maintain
two (2) sets of books of accounts, namely:
Regular Agency (RA) Books – used to record the receipt and utilization of
Notice of Cash Allocation and other income/receipts which the agencies are
authorized to use and to deposit with the National Treasury and/or with the
Authorized Government Depository Banks (AGDB).
National Government (NG) Books – used to record the income which the
agencies are not authorized to use and are required to be remitted to the
National Treasury.
The accounting system of the NG adopts the one fund concept in recording
the financial transactions and in the preparation of the financial statements.
However, separate fund accounting is done when specifically required by law, or
by a donor agency, or when necessitated by circumstances subject to prior
approval of the Commission on Audit.
4.5.2 Use of NGAS Chart of Accounts
The accounts used are in conformity with the NGAS Chart of Accounts
prescribed under COA Circular No. 2004-008 dated September 20, 2004, the
Updated Description of Accounts, and COA Accounting Circular No. 2006-001
dated November 6, 2006.
4.5.3 Control of Appropriations and Allotments and Monitoring of Obligations
Following the NGAS policy, separate registries are maintained by the COA
to record the appropriations and allotments, by agency/source/allotment class; and
by the NGAs to record the allotments and obligations by allotments class and by
program/project/activity.
4.5.4 Notice of Cash Allocation (NCA)
The receipt of NCA by the agency is recorded in the books as debit to
account “Cash-National Treasury, Modified Disbursement System (NT, MDS)”
and credit to account “Subsidy Income from National Government (SING)”.
The unused/lapsed/expired cash balance under the Cash-NT, MDS is
reverted by debiting the account SING and crediting Cash-NT, MDS.
51
At the end of the year, an adjustment is prepared for the restoration of cash
equivalent to the unreleased checks and recognition of the appropriate
payable/liability accounts. On the first working day of January, a reversal journal
entry is made by the agencies by debiting the appropriate liability account and
crediting the Cash-National Treasury, MDS.
4.5.5 Maintenance of Petty Cash Fund and Payroll Fund
Petty Cash Fund is maintained under the Imprest System. All replenishments
are directly charged to the expense account.
Payroll Fund pertains to cash advances for salaries and wages and other
personnel benefits in accordance with COA Accounting Circular No. 2006-001
dated November 9, 2006.
4.5.6 Foreign-Assisted Projects
Government agencies implementing Foreign-Assisted Projects may use any
of the following methods:
Working Fund/Imprest Account Availment, whereby the lending/donor
institution provides the implementing agency with seed money from the
loan/grant for the payment of eligible expenditures, subject to replenishment;
Direct Payment Scheme, where suppliers/contractors/consultants are paid
directly by the lending institution and borrowings are recorded based on the
withdrawal authorization/advice of payment or any proof of disbursements;
100% Cash Loan Financing Scheme, which requires 100% appropriation and
allotment cover and the loan proceeds will provide the cash requirement;
Grants in Cash and In Kind; and
Commodity Loan and Grant; among others.
4.5.7 Inventory Valuation
The perpetual inventory system is used to account for inventories where
regular purchases are recorded as inventory account and issuances from stock as
expenses. However, purchases out of Petty Cash Fund for immediate use are
charged outright to appropriate expense accounts.
The cost of ending inventory of office supplies and materials and other
inventory items is computed using the Moving Average Method.
Small value tangible items with estimated useful life of more than one year
are recorded under the appropriate supplies inventory account upon acquisition
and as expense upon issuance as prescribed under COA Circular No. 2005-002
dated April 14, 2005. Other tangible assets not included in the list of Annex A of
the said Circular are classified as Property, Plant and Equipment, subject to
depreciation.
52
4.5.8 Property, Plant and Equipment
Property, Plant and Equipment used in government operations are carried at
cost less accumulated depreciation. For assets under construction, the
Construction Period Theory is adopted where billings for on-going projects are
recorded under the Construction in Progress account.
The Straight-Line Method of depreciation is used in depreciating the
Property, Plant and Equipment with estimated useful lives ranging from 5 to 40
years as set in COA Circular No. 2003-007 dated December 11, 2003. A residual
value computed at ten percent of the cost of the asset is recognized and
depreciation starts on the following month after the purchase.
4.5.9 Public Infrastructures and Reforestation Projects
Public Infrastructures such as roads, highways, bridges, public parks and
plazas, canals, irrigations, as well as those for environmental purposes like
reforestation projects, etc. are assets of the government for use by the general
public and technically not owned by the implementing agencies. During
construction, these are recorded as Construction in Progress, and upon
completion, these are reclassified to Public Infrastructures and Reforestation
Projects. At the end of the year, the completed Public Infrastructures and
Reforestation Projects are transferred to the Registry of Public Infrastructures and
Registry of Reforestation Projects maintained by the agency, respectively. The
corresponding amounts are shown as deductions in the Statement of Government
Equity.
4.5.10 Recognition of Liabilities
Liabilities are recognized at the time goods and services are
accepted/rendered and suppliers/creditors bills are received.
Commitments or obligations incurred by agencies which are not yet due and
demandable (services not rendered and/or goods not yet delivered) are recorded in
the registries, hence, not recognized as liability.
4.5.11 Revenue and Expense Recognition
The Modified accrual basis of accounting is used. Income is recorded upon
delivery of goods and services except for tax revenues, duties, fees, fines and
penalties, including user charges, which are recognized upon collection. Expenses
are recognized when incurred and reported in the financial statements in the
period to which they relate.
Collections of income due for remittance to the National Treasury are
recorded in the NG books of the NGAs as liability, “Due to National Treasury”
with subsidiary ledger of the specific income account. Upon receipt of the
remittance, these are recorded as income in the NG books of the Bureau of the
Treasury. The collections of income authorized to be used by the agencies are
recorded in the RA books and are likewise remitted to the National Treasury.
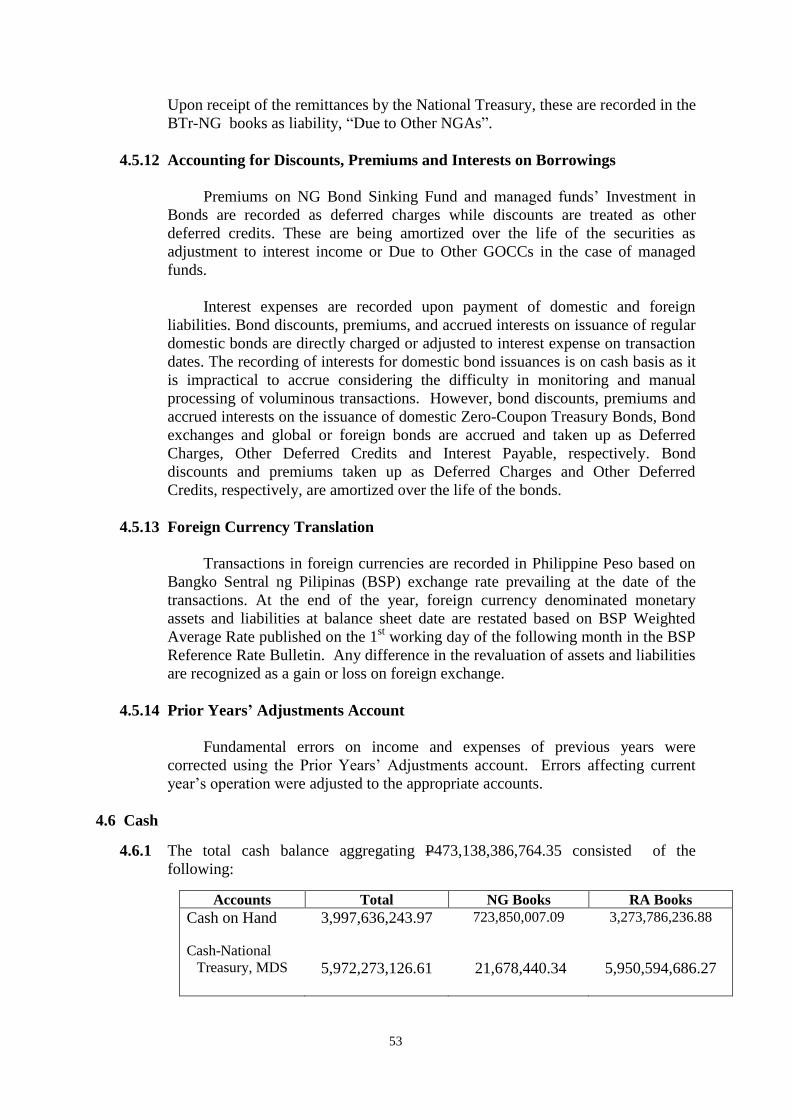
53
Upon receipt of the remittances by the National Treasury, these are recorded in the
BTr-NG books as liability, “Due to Other NGAs”.
4.5.12 Accounting for Discounts, Premiums and Interests on Borrowings
Premiums on NG Bond Sinking Fund and managed funds’ Investment in
Bonds are recorded as deferred charges while discounts are treated as other
deferred credits. These are being amortized over the life of the securities as
adjustment to interest income or Due to Other GOCCs in the case of managed
funds.
Interest expenses are recorded upon payment of domestic and foreign
liabilities. Bond discounts, premiums, and accrued interests on issuance of regular
domestic bonds are directly charged or adjusted to interest expense on transaction
dates. The recording of interests for domestic bond issuances is on cash basis as it
is impractical to accrue considering the difficulty in monitoring and manual
processing of voluminous transactions. However, bond discounts, premiums and
accrued interests on the issuance of domestic Zero-Coupon Treasury Bonds, Bond
exchanges and global or foreign bonds are accrued and taken up as Deferred
Charges, Other Deferred Credits and Interest Payable, respectively. Bond
discounts and premiums taken up as Deferred Charges and Other Deferred
Credits, respectively, are amortized over the life of the bonds.
4.5.13 Foreign Currency Translation
Transactions in foreign currencies are recorded in Philippine Peso based on
Bangko Sentral ng Pilipinas (BSP) exchange rate prevailing at the date of the
transactions. At the end of the year, foreign currency denominated monetary
assets and liabilities at balance sheet date are restated based on BSP Weighted
Average Rate published on the 1st working day of the following month in the BSP
Reference Rate Bulletin. Any difference in the revaluation of assets and liabilities
are recognized as a gain or loss on foreign exchange.
4.5.14 Prior Years’ Adjustments Account
Fundamental errors on income and expenses of previous years were
corrected using the Prior Years’ Adjustments account. Errors affecting current
year’s operation were adjusted to the appropriate accounts.
4.6 Cash
4.6.1 The total cash balance aggregating P473,138,386,764.35 consisted of the
following:
Accounts Total NG Books RA Books
Cash on Hand 3,997,636,243.97 723,850,007.09
3,273,786,236.88
Cash-National
Treasury, MDS 5,972,273,126.61 21,678,440.34 5,950,594,686.27
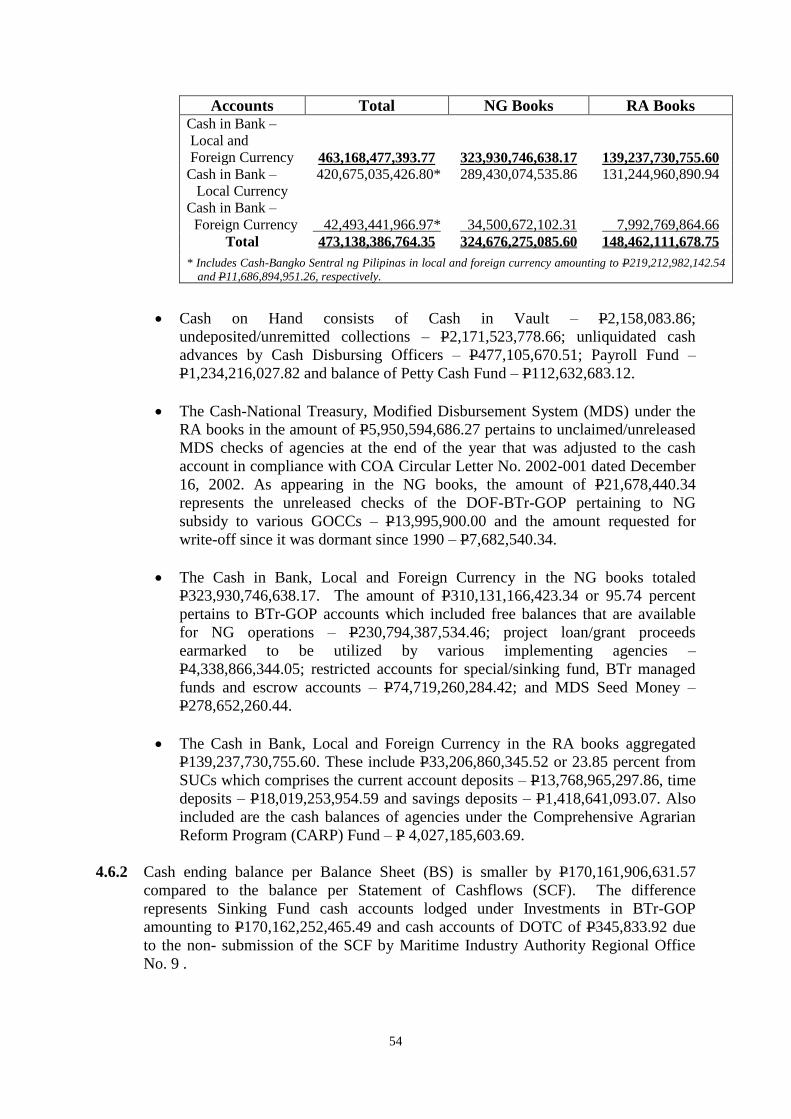
54
Accounts Total NG Books RA Books
Cash in Bank –
Local and
Foreign Currency
463,168,477,393.77
323,930,746,638.17
139,237,730,755.60
Cash in Bank –
Local Currency
420,675,035,426.80* 289,430,074,535.86 131,244,960,890.94
Cash in Bank –
Foreign Currency 42,493,441,966.97* 34,500,672,102.31 7,992,769,864.66
Total 473,138,386,764.35 324,676,275,085.60 148,462,111,678.75
* Includes Cash-Bangko Sentral ng Pilipinas in local and foreign currency amounting to P219,212,982,142.54
and P11,686,894,951.26, respectively.
Cash on Hand consists of Cash in Vault – P2,158,083.86;
undeposited/unremitted collections – P2,171,523,778.66; unliquidated cash
advances by Cash Disbursing Officers – P477,105,670.51; Payroll Fund –
P1,234,216,027.82 and balance of Petty Cash Fund – P112,632,683.12.
The Cash-National Treasury, Modified Disbursement System (MDS) under the
RA books in the amount of P5,950,594,686.27 pertains to unclaimed/unreleased
MDS checks of agencies at the end of the year that was adjusted to the cash
account in compliance with COA Circular Letter No. 2002-001 dated December
16, 2002. As appearing in the NG books, the amount of P21,678,440.34
represents the unreleased checks of the DOF-BTr-GOP pertaining to NG
subsidy to various GOCCs – P13,995,900.00 and the amount requested for
write-off since it was dormant since 1990 – P7,682,540.34.
The Cash in Bank, Local and Foreign Currency in the NG books totaled
P323,930,746,638.17. The amount of P310,131,166,423.34 or 95.74 percent
pertains to BTr-GOP accounts which included free balances that are available
for NG operations – P230,794,387,534.46; project loan/grant proceeds
earmarked to be utilized by various implementing agencies –
P4,338,866,344.05; restricted accounts for special/sinking fund, BTr managed
funds and escrow accounts – P74,719,260,284.42; and MDS Seed Money –
P278,652,260.44.
The Cash in Bank, Local and Foreign Currency in the RA books aggregated
P139,237,730,755.60. These include P33,206,860,345.52 or 23.85 percent from
SUCs which comprises the current account deposits – P13,768,965,297.86, time
deposits – P18,019,253,954.59 and savings deposits – P1,418,641,093.07. Also
included are the cash balances of agencies under the Comprehensive Agrarian
Reform Program (CARP) Fund – P 4,027,185,603.69.
4.6.2 Cash ending balance per Balance Sheet (BS) is smaller by P170,161,906,631.57
compared to the balance per Statement of Cashflows (SCF). The difference
represents Sinking Fund cash accounts lodged under Investments in BTr-GOP
amounting to P170,162,252,465.49 and cash accounts of DOTC of P345,833.92 due
to the non- submission of the SCF by Maritime Industry Authority Regional Office
No. 9 .
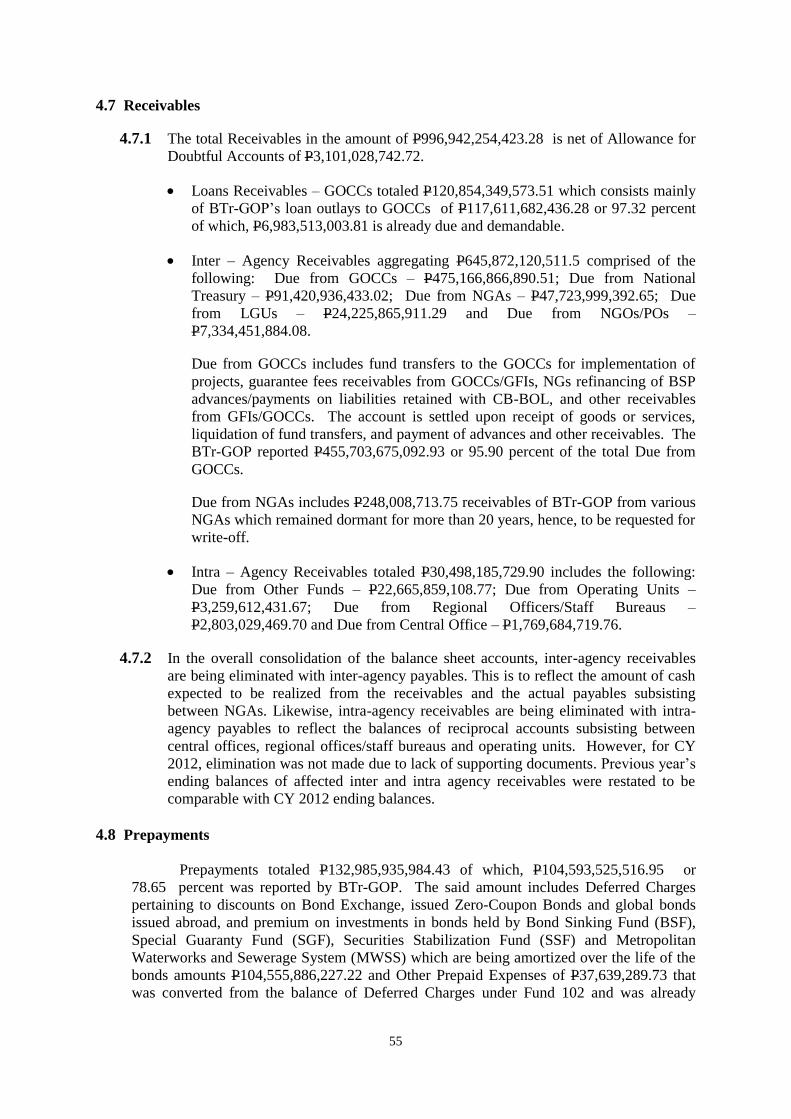
55
4.7 Receivables
4.7.1 The total Receivables in the amount of P996,942,254,423.28 is net of Allowance for
Doubtful Accounts of P3,101,028,742.72.
Loans Receivables – GOCCs totaled P120,854,349,573.51 which consists mainly
of BTr-GOP’s loan outlays to GOCCs of P117,611,682,436.28 or 97.32 percent
of which, P6,983,513,003.81 is already due and demandable.
Inter – Agency Receivables aggregating P645,872,120,511.5 comprised of the
following: Due from GOCCs – P475,166,866,890.51; Due from National
Treasury – P91,420,936,433.02; Due from NGAs – P47,723,999,392.65; Due
from LGUs – P24,225,865,911.29 and Due from NGOs/POs –
P7,334,451,884.08.
Due from GOCCs includes fund transfers to the GOCCs for implementation of
projects, guarantee fees receivables from GOCCs/GFIs, NGs refinancing of BSP
advances/payments on liabilities retained with CB-BOL, and other receivables
from GFIs/GOCCs. The account is settled upon receipt of goods or services,
liquidation of fund transfers, and payment of advances and other receivables. The
BTr-GOP reported P455,703,675,092.93 or 95.90 percent of the total Due from
GOCCs.
Due from NGAs includes P248,008,713.75 receivables of BTr-GOP from various
NGAs which remained dormant for more than 20 years, hence, to be requested for
write-off.
Intra – Agency Receivables totaled P30,498,185,729.90 includes the following:
Due from Other Funds – P22,665,859,108.77; Due from Operating Units –
P3,259,612,431.67; Due from Regional Officers/Staff Bureaus –
P2,803,029,469.70 and Due from Central Office – P1,769,684,719.76.
4.7.2 In the overall consolidation of the balance sheet accounts, inter-agency receivables
are being eliminated with inter-agency payables. This is to reflect the amount of cash
expected to be realized from the receivables and the actual payables subsisting
between NGAs. Likewise, intra-agency receivables are being eliminated with intra-
agency payables to reflect the balances of reciprocal accounts subsisting between
central offices, regional offices/staff bureaus and operating units. However, for CY
2012, elimination was not made due to lack of supporting documents. Previous year’s
ending balances of affected inter and intra agency receivables were restated to be
comparable with CY 2012 ending balances.
4.8 Prepayments
Prepayments totaled P132,985,935,984.43 of which, P104,593,525,516.95 or
78.65 percent was reported by BTr-GOP. The said amount includes Deferred Charges
pertaining to discounts on Bond Exchange, issued Zero-Coupon Bonds and global bonds
issued abroad, and premium on investments in bonds held by Bond Sinking Fund (BSF),
Special Guaranty Fund (SGF), Securities Stabilization Fund (SSF) and Metropolitan
Waterworks and Sewerage System (MWSS) which are being amortized over the life of the
bonds amounts P104,555,886,227.22 and Other Prepaid Expenses of P37,639,289.73 that
was converted from the balance of Deferred Charges under Fund 102 and was already
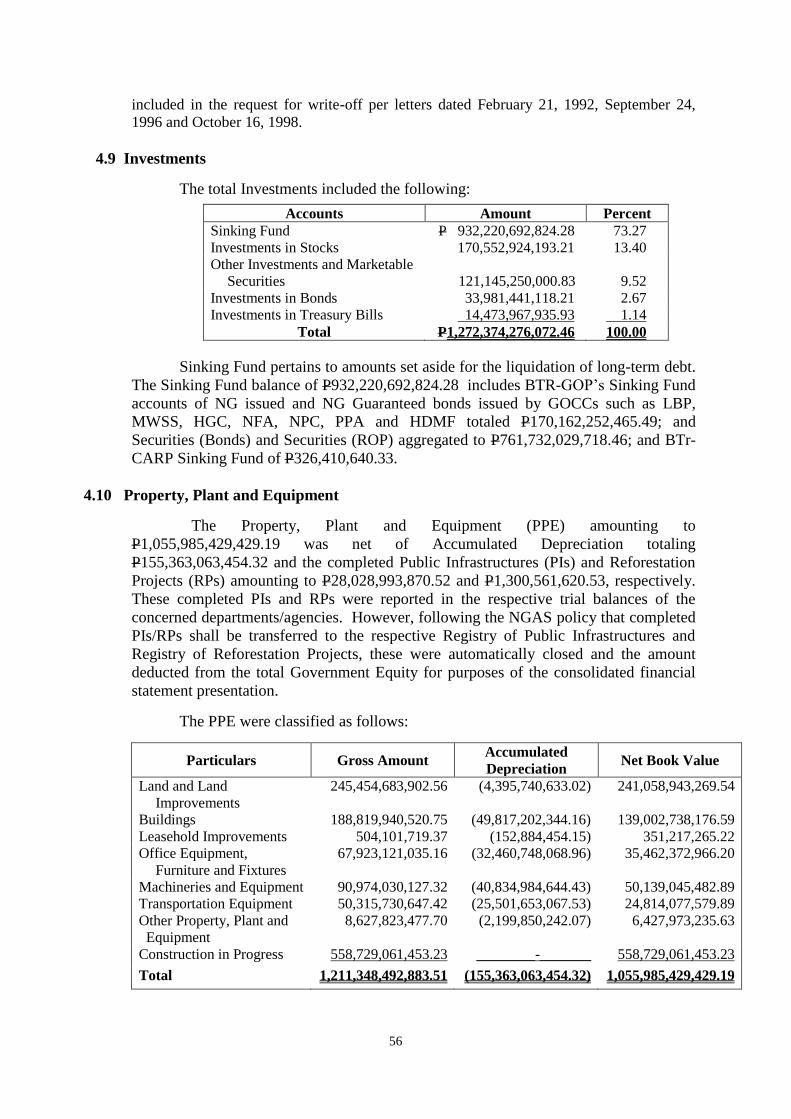
56
included in the request for write-off per letters dated February 21, 1992, September 24,
1996 and October 16, 1998.
4.9 Investments
The total Investments included the following:
Accounts Amount Percent
Sinking Fund P 932,220,692,824.28 73.27
Investments in Stocks 170,552,924,193.21 13.40
Other Investments and Marketable
Securities 121,145,250,000.83
9.52
Investments in Bonds 33,981,441,118.21 2.67
Investments in Treasury Bills 14,473,967,935.93 1.14
Total P1,272,374,276,072.46 100.00
Sinking Fund pertains to amounts set aside for the liquidation of long-term debt.
The Sinking Fund balance of P932,220,692,824.28 includes BTR-GOP’s Sinking Fund
accounts of NG issued and NG Guaranteed bonds issued by GOCCs such as LBP,
MWSS, HGC, NFA, NPC, PPA and HDMF totaled P170,162,252,465.49; and
Securities (Bonds) and Securities (ROP) aggregated to P761,732,029,718.46; and BTr-
CARP Sinking Fund of P326,410,640.33.
4.10 Property, Plant and Equipment
The Property, Plant and Equipment (PPE) amounting to
P1,055,985,429,429.19 was net of Accumulated Depreciation totaling
P155,363,063,454.32 and the completed Public Infrastructures (PIs) and Reforestation
Projects (RPs) amounting to P28,028,993,870.52 and P1,300,561,620.53, respectively.
These completed PIs and RPs were reported in the respective trial balances of the
concerned departments/agencies. However, following the NGAS policy that completed
PIs/RPs shall be transferred to the respective Registry of Public Infrastructures and
Registry of Reforestation Projects, these were automatically closed and the amount
deducted from the total Government Equity for purposes of the consolidated financial
statement presentation.
The PPE were classified as follows:
Particulars Gross Amount Accumulated
Depreciation Net Book Value
Land and Land
Improvements
245,454,683,902.56 (4,395,740,633.02) 241,058,943,269.54
Buildings 188,819,940,520.75 (49,817,202,344.16) 139,002,738,176.59
Leasehold Improvements 504,101,719.37 (152,884,454.15) 351,217,265.22
Office Equipment,
Furniture and Fixtures
67,923,121,035.16 (32,460,748,068.96) 35,462,372,966.20
Machineries and Equipment 90,974,030,127.32 (40,834,984,644.43) 50,139,045,482.89
Transportation Equipment 50,315,730,647.42 (25,501,653,067.53) 24,814,077,579.89
Other Property, Plant and
Equipment
8,627,823,477.70 (2,199,850,242.07) 6,427,973,235.63
Construction in Progress 558,729,061,453.23 ________-_______ 558,729,061,453.23
Total 1,211,348,492,883.51 (155,363,063,454.32) 1,055,985,429,429.19
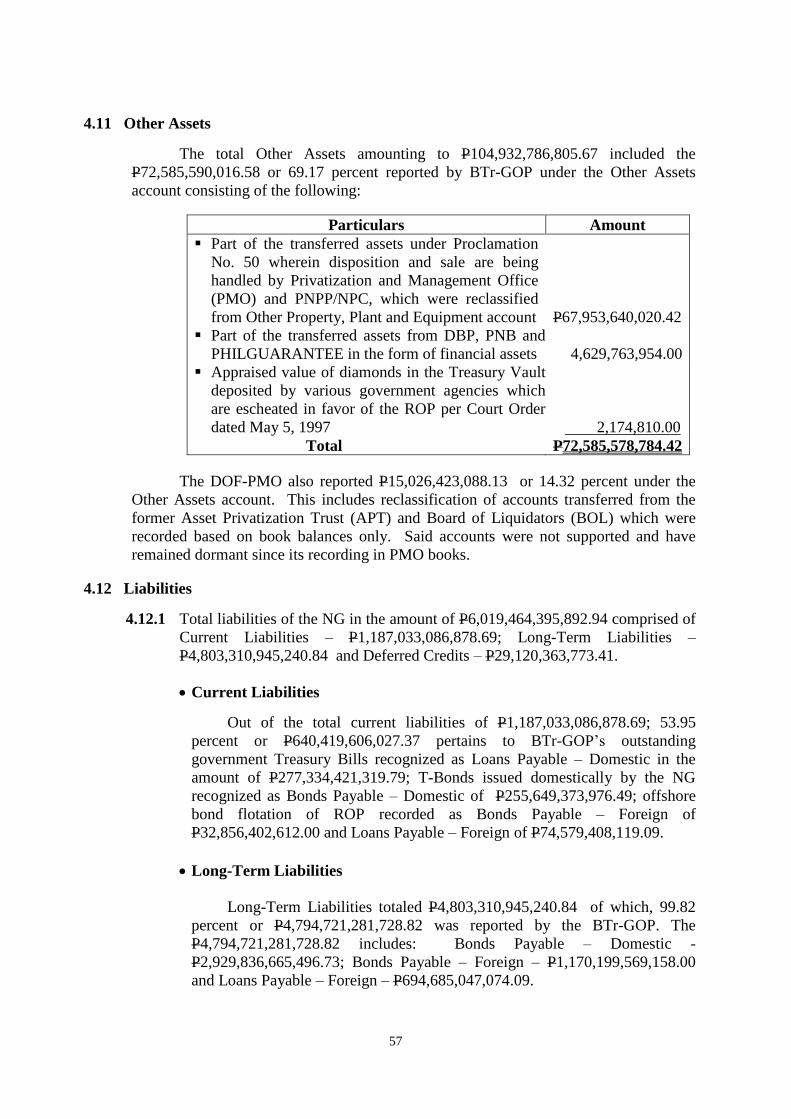
57
4.11 Other Assets
The total Other Assets amounting to P104,932,786,805.67 included the
P72,585,590,016.58 or 69.17 percent reported by BTr-GOP under the Other Assets
account consisting of the following:
Particulars Amount
Part of the transferred assets under Proclamation
No. 50 wherein disposition and sale are being
handled by Privatization and Management Office
(PMO) and PNPP/NPC, which were reclassified
from Other Property, Plant and Equipment account
P67,953,640,020.42
Part of the transferred assets from DBP, PNB and
PHILGUARANTEE in the form of financial assets
4,629,763,954.00
Appraised value of diamonds in the Treasury Vault
deposited by various government agencies which
are escheated in favor of the ROP per Court Order
dated May 5, 1997
2,174,810.00
Total P72,585,578,784.42
The DOF-PMO also reported P15,026,423,088.13 or 14.32 percent under the
Other Assets account. This includes reclassification of accounts transferred from the
former Asset Privatization Trust (APT) and Board of Liquidators (BOL) which were
recorded based on book balances only. Said accounts were not supported and have
remained dormant since its recording in PMO books.
4.12 Liabilities
4.12.1 Total liabilities of the NG in the amount of P6,019,464,395,892.94 comprised of
Current Liabilities – P1,187,033,086,878.69; Long-Term Liabilities –
P4,803,310,945,240.84 and Deferred Credits – P29,120,363,773.41.
Current Liabilities
Out of the total current liabilities of P1,187,033,086,878.69; 53.95
percent or P640,419,606,027.37 pertains to BTr-GOP’s outstanding
government Treasury Bills recognized as Loans Payable – Domestic in the
amount of P277,334,421,319.79; T-Bonds issued domestically by the NG
recognized as Bonds Payable – Domestic of P255,649,373,976.49; offshore
bond flotation of ROP recorded as Bonds Payable – Foreign of
P32,856,402,612.00 and Loans Payable – Foreign of P74,579,408,119.09.
Long-Term Liabilities
Long-Term Liabilities totaled P4,803,310,945,240.84 of which, 99.82
percent or P4,794,721,281,728.82 was reported by the BTr-GOP. The
P4,794,721,281,728.82 includes: Bonds Payable – Domestic -
P2,929,836,665,496.73; Bonds Payable – Foreign – P1,170,199,569,158.00
and Loans Payable – Foreign – P694,685,047,074.09.
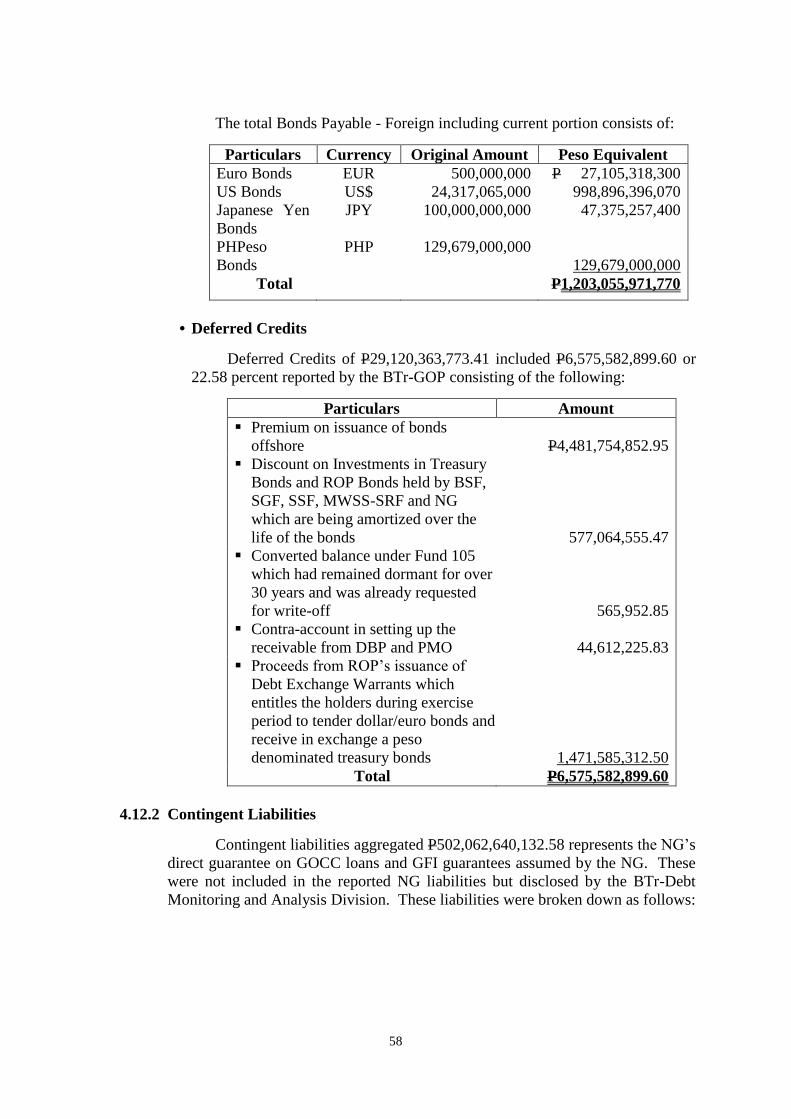
58
The total Bonds Payable - Foreign including current portion consists of:
Particulars Currency Original Amount Peso Equivalent
Euro Bonds EUR 500,000,000 P 27,105,318,300
US Bonds US$ 24,317,065,000 998,896,396,070
Japanese Yen
Bonds
JPY 100,000,000,000 47,375,257,400
PHPeso
Bonds
PHP 129,679,000,000
129,679,000,000
Total P1,203,055,971,770
• Deferred Credits
Deferred Credits of P29,120,363,773.41 included P6,575,582,899.60 or
22.58 percent reported by the BTr-GOP consisting of the following:
Particulars Amount
Premium on issuance of bonds
offshore
P4,481,754,852.95
Discount on Investments in Treasury
Bonds and ROP Bonds held by BSF,
SGF, SSF, MWSS-SRF and NG
which are being amortized over the
life of the bonds
577,064,555.47
Converted balance under Fund 105
which had remained dormant for over
30 years and was already requested
for write-off
565,952.85
Contra-account in setting up the
receivable from DBP and PMO
44,612,225.83
Proceeds from ROP’s issuance of
Debt Exchange Warrants which
entitles the holders during exercise
period to tender dollar/euro bonds and
receive in exchange a peso
denominated treasury bonds
1,471,585,312.50
Total P6,575,582,899.60
4.12.2 Contingent Liabilities
Contingent liabilities aggregated P502,062,640,132.58 represents the NG’s
direct guarantee on GOCC loans and GFI guarantees assumed by the NG. These
were not included in the reported NG liabilities but disclosed by the BTr-Debt
Monitoring and Analysis Division. These liabilities were broken down as follows:
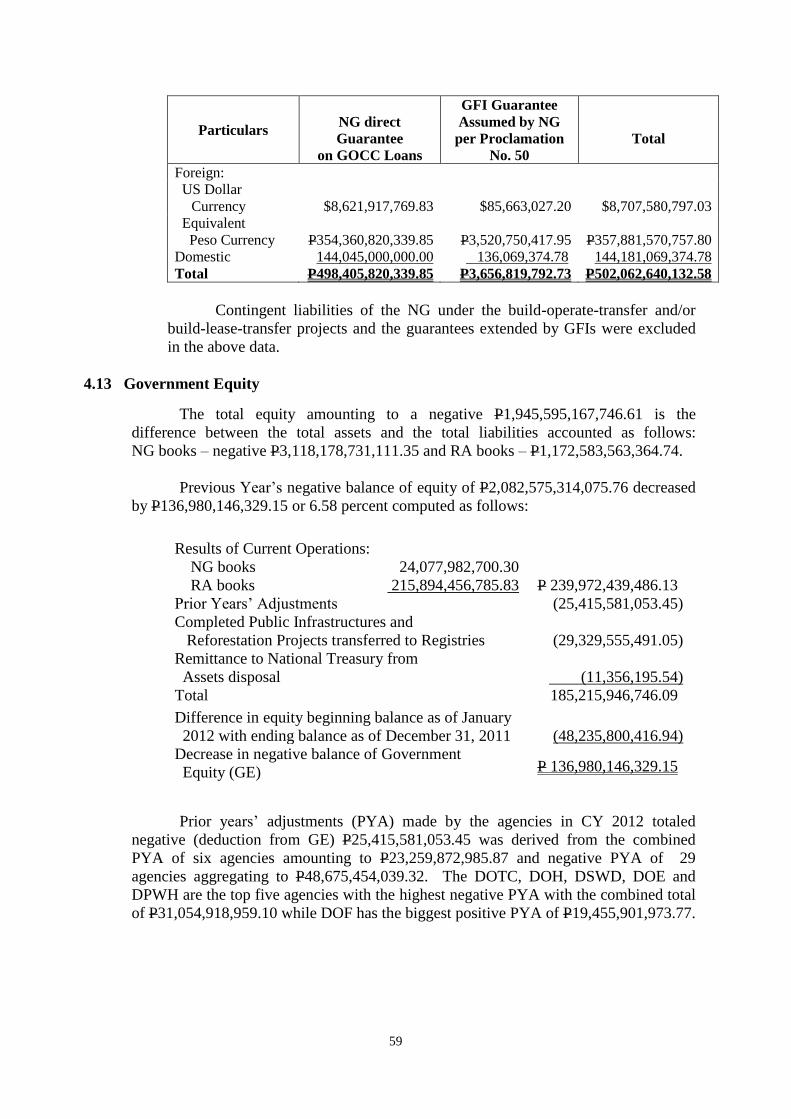
59
Particulars
NG direct
Guarantee
on GOCC Loans
GFI Guarantee
Assumed by NG
per Proclamation
No. 50
Total
Foreign:
US Dollar
Currency $8,621,917,769.83 $85,663,027.20 $8,707,580,797.03
Equivalent
Peso Currency
P354,360,820,339.85 P3,520,750,417.95 P357,881,570,757.80
Domestic 144,045,000,000.00 136,069,374.78 144,181,069,374.78
Total P498,405,820,339.85 P3,656,819,792.73 P502,062,640,132.58
Contingent liabilities of the NG under the build-operate-transfer and/or
build-lease-transfer projects and the guarantees extended by GFIs were excluded
in the above data.
4.13 Government Equity
The total equity amounting to a negative P1,945,595,167,746.61 is the
difference between the total assets and the total liabilities accounted as follows:
NG books – negative P3,118,178,731,111.35 and RA books – P1,172,583,563,364.74.
Previous Year’s negative balance of equity of P2,082,575,314,075.76 decreased
by P136,980,146,329.15 or 6.58 percent computed as follows:
Results of Current Operations:
NG books 24,077,982,700.30
RA books 215,894,456,785.83 P 239,972,439,486.13
Prior Years’ Adjustments (25,415,581,053.45)
Completed Public Infrastructures and
Reforestation Projects transferred to Registries
(29,329,555,491.05)
Remittance to National Treasury from
Assets disposal
(11,356,195.54)
Total 185,215,946,746.09
Difference in equity beginning balance as of January
2012 with ending balance as of December 31, 2011
(48,235,800,416.94)
Decrease in negative balance of Government
Equity (GE)
P 136,980,146,329.15
Prior years’ adjustments (PYA) made by the agencies in CY 2012 totaled
negative (deduction from GE) P25,415,581,053.45 was derived from the combined
PYA of six agencies amounting to P23,259,872,985.87 and negative PYA of 29
agencies aggregating to P48,675,454,039.32. The DOTC, DOH, DSWD, DOE and
DPWH are the top five agencies with the highest negative PYA with the combined total
of P31,054,918,959.10 while DOF has the biggest positive PYA of P19,455,901,973.77.
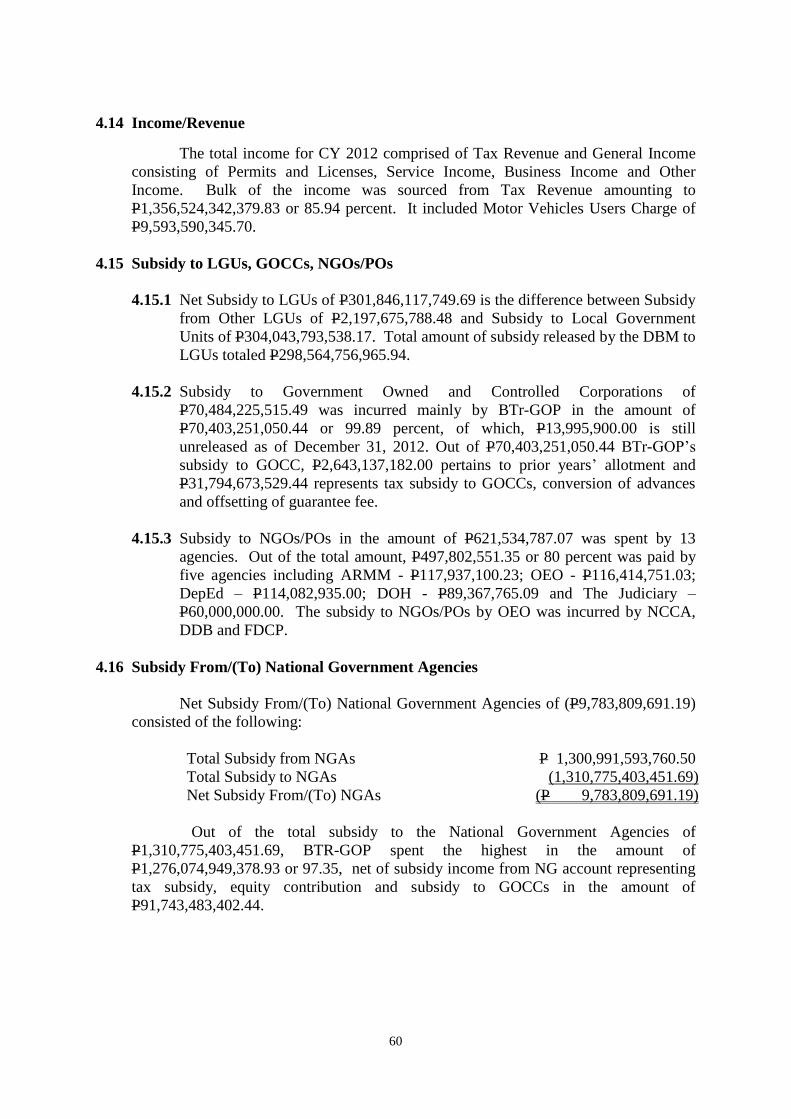
60
4.14 Income/Revenue
The total income for CY 2012 comprised of Tax Revenue and General Income
consisting of Permits and Licenses, Service Income, Business Income and Other
Income. Bulk of the income was sourced from Tax Revenue amounting to
P1,356,524,342,379.83 or 85.94 percent. It included Motor Vehicles Users Charge of
P9,593,590,345.70.
4.15 Subsidy to LGUs, GOCCs, NGOs/POs
4.15.1 Net Subsidy to LGUs of P301,846,117,749.69 is the difference between Subsidy
from Other LGUs of P2,197,675,788.48 and Subsidy to Local Government
Units of P304,043,793,538.17. Total amount of subsidy released by the DBM to
LGUs totaled P298,564,756,965.94.
4.15.2 Subsidy to Government Owned and Controlled Corporations of
P70,484,225,515.49 was incurred mainly by BTr-GOP in the amount of
P70,403,251,050.44 or 99.89 percent, of which, P13,995,900.00 is still
unreleased as of December 31, 2012. Out of P70,403,251,050.44 BTr-GOP’s
subsidy to GOCC, P2,643,137,182.00 pertains to prior years’ allotment and
P31,794,673,529.44 represents tax subsidy to GOCCs, conversion of advances
and offsetting of guarantee fee.
4.15.3 Subsidy to NGOs/POs in the amount of P621,534,787.07 was spent by 13
agencies. Out of the total amount, P497,802,551.35 or 80 percent was paid by
five agencies including ARMM - P117,937,100.23; OEO - P116,414,751.03;
DepEd – P114,082,935.00; DOH - P89,367,765.09 and The Judiciary –
P60,000,000.00. The subsidy to NGOs/POs by OEO was incurred by NCCA,
DDB and FDCP.
4.16 Subsidy From/(To) National Government Agencies
Net Subsidy From/(To) National Government Agencies of (P9,783,809,691.19)
consisted of the following:
Total Subsidy from NGAs P 1,300,991,593,760.50
Total Subsidy to NGAs (1,310,775,403,451.69)
Net Subsidy From/(To) NGAs (P 9,783,809,691.19)
Out of the total subsidy to the National Government Agencies of
P1,310,775,403,451.69, BTR-GOP spent the highest in the amount of
P1,276,074,949,378.93 or 97.35, net of subsidy income from NG account representing
tax subsidy, equity contribution and subsidy to GOCCs in the amount of
P91,743,483,402.44.

V. FINANCIAL ANALYSES
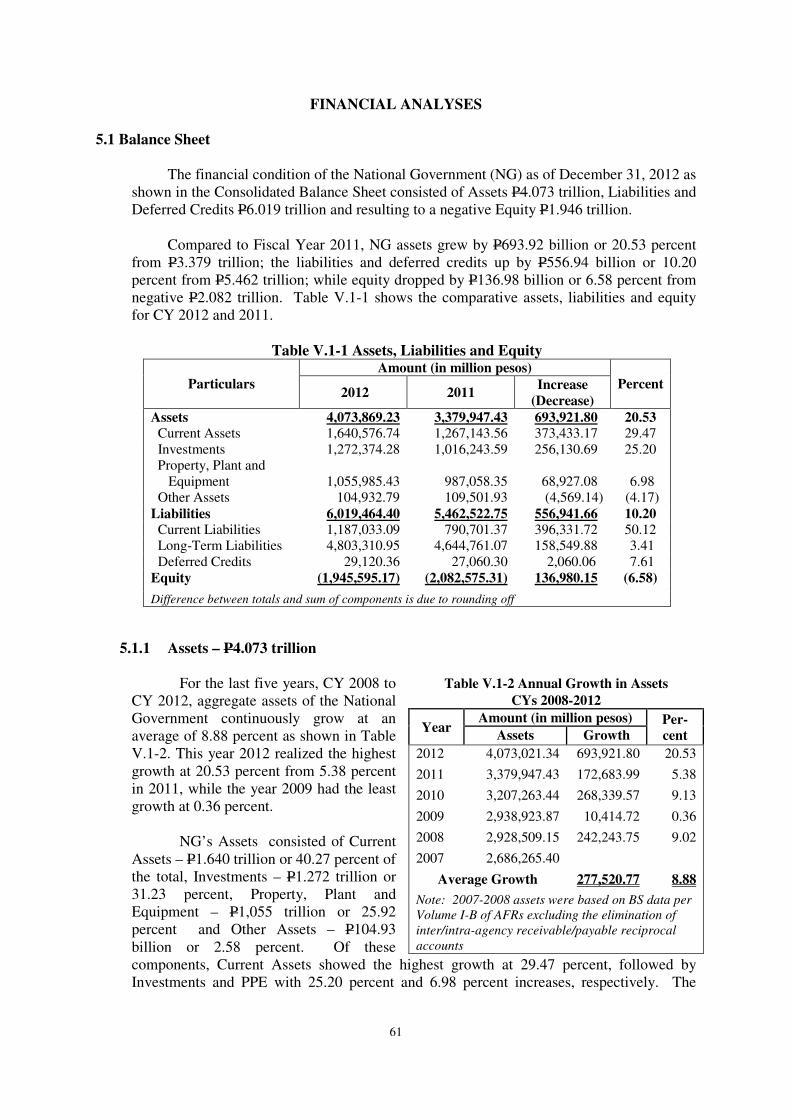
61
FINANCIAL ANALYSES
5.1 Balance Sheet
The financial condition of the National Government (NG) as of December 31, 2012 as
shown in the Consolidated Balance Sheet consisted of Assets P4.073 trillion, Liabilities and
Deferred Credits P6.019 trillion and resulting to a negative Equity P1.946 trillion.
Compared to Fiscal Year 2011, NG assets grew by P693.92 billion or 20.53 percent
from P3.379 trillion; the liabilities and deferred credits up by P556.94 billion or 10.20
percent from P5.462 trillion; while equity dropped by P136.98 billion or 6.58 percent from
negative P2.082 trillion. Table V.1-1 shows the comparative assets, liabilities and equity
for CY 2012 and 2011.
Table V.1-1 Assets, Liabilities and Equity
Particulars
Amount (in million pesos)
Percent 2012 2011
Increase
(Decrease)
Assets 4,073,869.23 3,379,947.43 693,921.80 20.53
Current Assets 1,640,576.74 1,267,143.56 373,433.17 29.47
Investments 1,272,374.28 1,016,243.59 256,130.69 25.20
Property, Plant and
Equipment
1,055,985.43
987,058.35
68,927.08
6.98
Other Assets 104,932.79 109,501.93 (4,569.14) (4.17)
Liabilities 6,019,464.40 5,462,522.75 556,941.66 10.20 Current Liabilities 1,187,033.09 790,701.37 396,331.72 50.12
Long-Term Liabilities 4,803,310.95 4,644,761.07 158,549.88 3.41
Deferred Credits 29,120.36 27,060.30 2,060.06 7.61
Equity (1,945,595.17) (2,082,575.31) 136,980.15 (6.58)
Difference between totals and sum of components is due to rounding off
5.1.1 Assets – P4.073 trillion
For the last five years, CY 2008 to
CY 2012, aggregate assets of the National
Government continuously grow at an
average of 8.88 percent as shown in Table
V.1-2. This year 2012 realized the highest
growth at 20.53 percent from 5.38 percent
in 2011, while the year 2009 had the least
growth at 0.36 percent.
NG’s Assets consisted of Current
Assets – P1.640 trillion or 40.27 percent of
the total, Investments – P1.272 trillion or
31.23 percent, Property, Plant and
Equipment – P1,055 trillion or 25.92
percent and Other Assets – P104.93
billion or 2.58 percent. Of these
components, Current Assets showed the highest growth at 29.47 percent, followed by
Investments and PPE with 25.20 percent and 6.98 percent increases, respectively. The
Table V.1-2 Annual Growth in Assets
CYs 2008-2012
Year Amount (in million pesos) Per-
cent Assets Growth
2012 4,073,021.34 693,921.80 20.53
2011 3,379,947.43 172,683.99 5.38
2010 3,207,263.44 268,339.57 9.13
2009 2,938,923.87 10,414.72 0.36
2008 2,928,509.15 242,243.75 9.02
2007 2,686,265.40
Average Growth 277,520.77 8.88
Note: 2007-2008 assets were based on BS data per
Volume I-B of AFRs excluding the elimination of
inter/intra-agency receivable/payable reciprocal
accounts
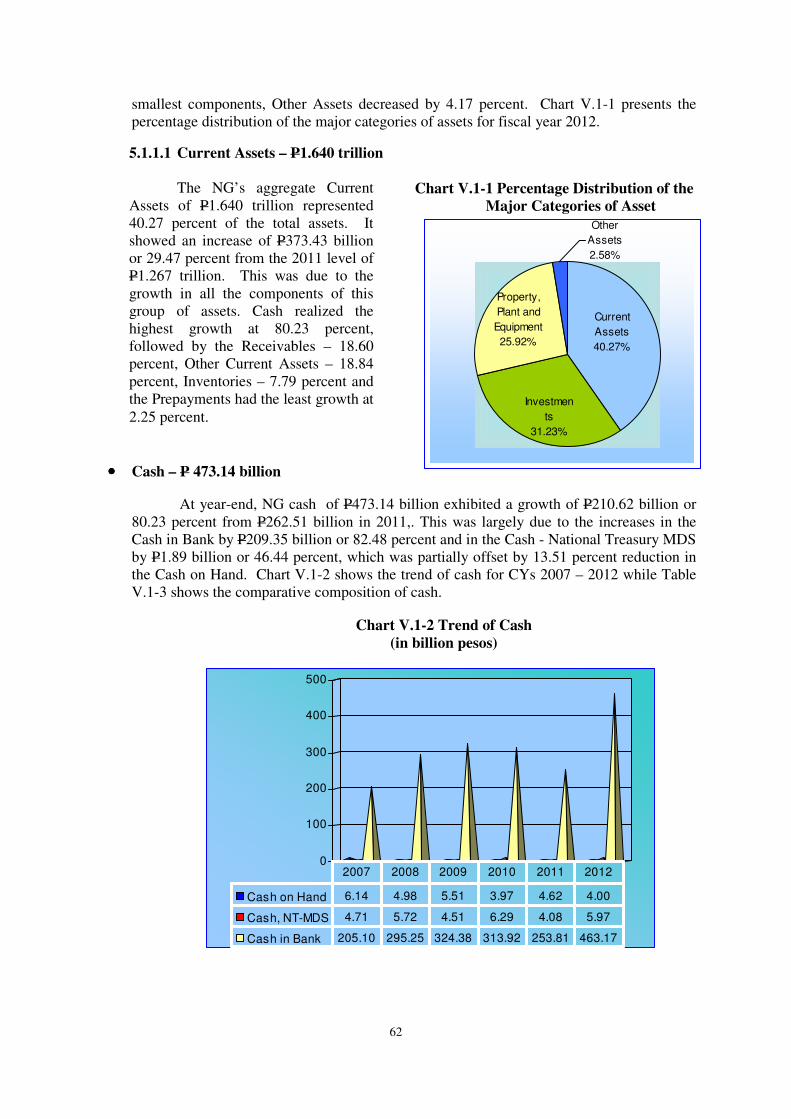
62
Other
Assets
2.58%
Property,
Plant and
Equipment
25.92%
Investmen
ts
31.23%
Current
Assets
40.27%
smallest components, Other Assets decreased by 4.17 percent. Chart V.1-1 presents the
percentage distribution of the major categories of assets for fiscal year 2012.
Chart V.1-1 Percentage Distribution of the
Major Categories of Asset
•••• Cash – P 473.14 billion
At year-end, NG cash of P473.14 billion exhibited a growth of P210.62 billion or
80.23 percent from P262.51 billion in 2011,. This was largely due to the increases in the
Cash in Bank by P209.35 billion or 82.48 percent and in the Cash - National Treasury MDS
by P1.89 billion or 46.44 percent, which was partially offset by 13.51 percent reduction in
the Cash on Hand. Chart V.1-2 shows the trend of cash for CYs 2007 – 2012 while Table
V.1-3 shows the comparative composition of cash.
Chart V.1-2 Trend of Cash
(in billion pesos)
5.1.1.1 Current Assets – P1.640 trillion
The NG’s aggregate Current
Assets of P1.640 trillion represented
40.27 percent of the total assets. It
showed an increase of P373.43 billion
or 29.47 percent from the 2011 level of
P1.267 trillion. This was due to the
growth in all the components of this
group of assets. Cash realized the
highest growth at 80.23 percent,
followed by the Receivables – 18.60
percent, Other Current Assets – 18.84
percent, Inventories – 7.79 percent and
the Prepayments had the least growth at
2.25 percent.
0
100
200
300
400
500
Cash on Hand 6.14 4.98 5.51 3.97 4.62 4.00
Cash, NT-MDS 4.71 5.72 4.51 6.29 4.08 5.97
Cash in Bank 205.10 295.25 324.38 313.92 253.81 463.17
2007 2008 2009 2010 2011 2012
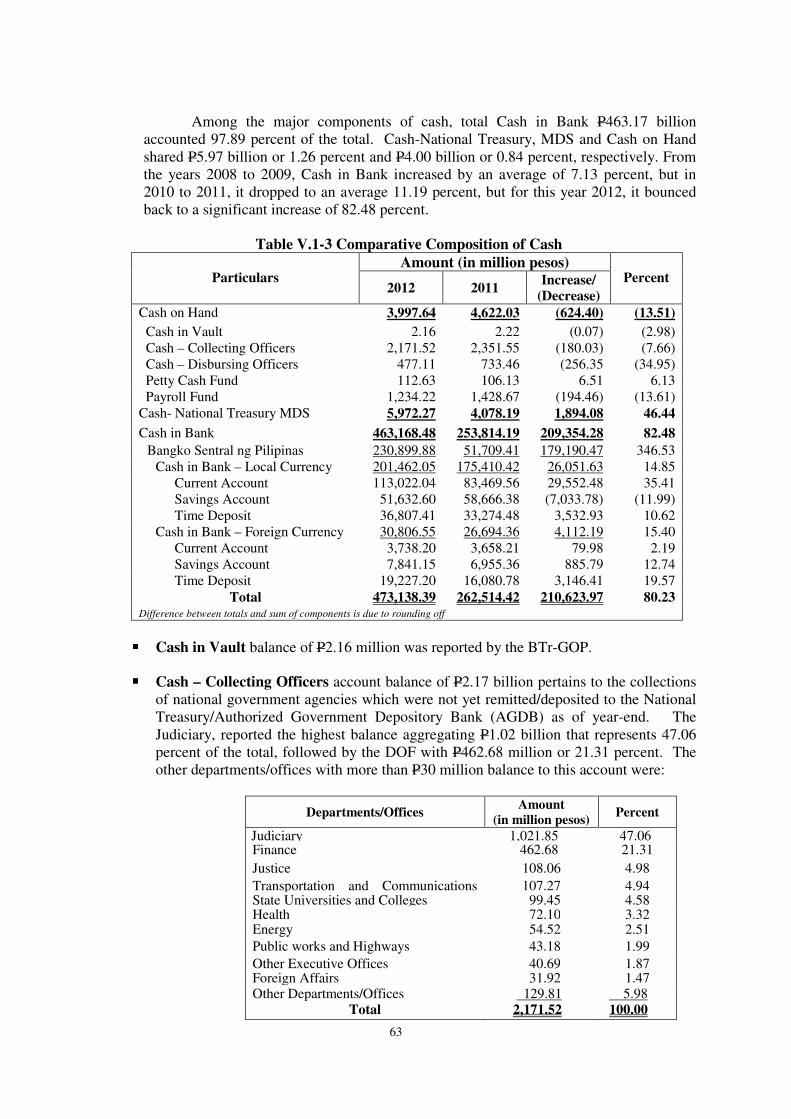
63
Among the major components of cash, total Cash in Bank P463.17 billion
accounted 97.89 percent of the total. Cash-National Treasury, MDS and Cash on Hand
shared P5.97 billion or 1.26 percent and P4.00 billion or 0.84 percent, respectively. From
the years 2008 to 2009, Cash in Bank increased by an average of 7.13 percent, but in
2010 to 2011, it dropped to an average 11.19 percent, but for this year 2012, it bounced
back to a significant increase of 82.48 percent.
Table V.1-3 Comparative Composition of Cash
Particulars Amount (in million pesos)
Percent 2012 2011
Increase/
(Decrease)
Cash on Hand 3,997.64 4,622.03 (624.40) (13.51)
Cash in Vault 2.16 2.22 (0.07) (2.98)
Cash – Collecting Officers 2,171.52 2,351.55 (180.03) (7.66)
Cash – Disbursing Officers 477.11 733.46 (256.35 (34.95)
Petty Cash Fund 112.63 106.13 6.51 6.13
Payroll Fund 1,234.22 1,428.67 (194.46) (13.61)
Cash- National Treasury MDS 5,972.27 4,078.19 1,894.08 46.44
Cash in Bank 463,168.48 253,814.19 209,354.28 82.48
Bangko Sentral ng Pilipinas 230,899.88 51,709.41 179,190.47 346.53
Cash in Bank – Local Currency 201,462.05 175,410.42 26,051.63 14.85
Current Account 113,022.04
18.96
83,469.56 29,552.48 35.41
Savings Account 51,632.60 58,666.38 (7,033.78) (11.99)
Time Deposit 36,807.41 33,274.48 3,532.93 10.62
Cash in Bank – Foreign Currency 30,806.55 26,694.36 4,112.19 15.40
Current Account 3,738.20 3,658.21 79.98 2.19
Savings Account 7,841.15 6,955.36 885.79 12.74
Time Deposit 19,227.20 16,080.78 3,146.41 19.57
Total 473,138.39 262,514.42 210,623.97 80.23 Difference between totals and sum of components is due to rounding off
���� Cash in Vault balance of P2.16 million was reported by the BTr-GOP.
���� Cash – Collecting Officers account balance of P2.17 billion pertains to the collections
of national government agencies which were not yet remitted/deposited to the National
Treasury/Authorized Government Depository Bank (AGDB) as of year-end. The
Judiciary, reported the highest balance aggregating P1.02 billion that represents 47.06
percent of the total, followed by the DOF with P462.68 million or 21.31 percent. The
other departments/offices with more than P30 million balance to this account were:
Departments/Offices Amount
(in million pesos) Percent
Judiciary 1,021.85 47.06 Finance 462.68 21.31
Justice 108.06 4.98
Transportation and Communications 107.27 4.94 State Universities and Colleges 99.45 4.58 Health 72.10 3.32 Energy 54.52 2.51
Public works and Highways 43.18 1.99
Other Executive Offices 40.69 1.87 Foreign Affairs 31.92 1.47 Other Departments/Offices 129.81 5.98
Total 2,171.52 100.00
64
���� Cash – Disbursing Officers of P477.11 million represents unliquidated cash advances
of authorized disbursing officers at year-end. A decrease of P256.35 million or 34.95
percent was noted compared to 2011 level of P733.46 million. The departments/offices
that reported more than P10 million unliquidated cash advances were as follows:
Departments/Offices Amount
(in million pesos) Percent
Social Welfare and Development 111.71 23.42
Foreign Affairs 98.05 20.55
State Universities and Colleges 57.36 12.02
Transportation and Communications 56.34 11.81
Public Works and Highways 39.66 8.31
Science and Technology 30.55 6.40
Other Executive Offices 28.62 6.04
Health 17.58 3.69
Environment and Natural Resources 10.29 2.16
Other Departments/Offices 26.73 5.60
Total 477.11 100.00
� The DSWD-OSEC reported the highest unliquidated cash advances of
P111.71 million representing 23.42 percent of the total P477.11 million
unliquidated cash advances of the NG at year end. The bulk of which,
amounting to P107.61 million pertains to cash advances to DSWD Field
Offices II and X for projects such as Cash for Work and Social Pension for
Indigent Senior Citizens.
� The DFA-OSEC reported P98.05 million or 20.55 percent of the total, that
included prior years’ working funds of the Regional Consular Offices (RCOs)
and Foreign Service Post (FSP) granted before the introduction of the New
Government Accounting System (NGAS) in 2002, cash advances granted to
Finance Officers in the RCOs and FSPs, and Regular and Special Disbursing
Officers in the Home Office.
� State Universities and Colleges combined balance P57.36 million or 12.02
percent of the total. Six SUCs that shared the aggregate amount of P41.75
million or 72.79 percent were: University of Eastern Philippines – P9.54
million, Bohol Island State University – P9.16 million, Eastern Samar State
University – P8 million, Capiz State University – P5.87 million, University of
Southeastern Philippines – P4.97 million and Western Visayas College of
Science and Technology – P4.22 million.
� The DOTC- OSEC’s P56.24 million pertained to the unliquidated cash
advances reported by the attached agencies: LTO, CARAGA and the
Philippine Coast Guard.
���� Petty Cash Fund granted to duly designated custodian to cover petty expenses P112.63
million, an increment of P6.51 million or 6.13 percent was noted compared to P106.13
million in 2011. As in the previous year, the COMELEC and the DOH – OSEC were
the two agencies that reported the highest with P19.85 million and P15.27 million or
17.63 percent and 13.56 percent, respectively.
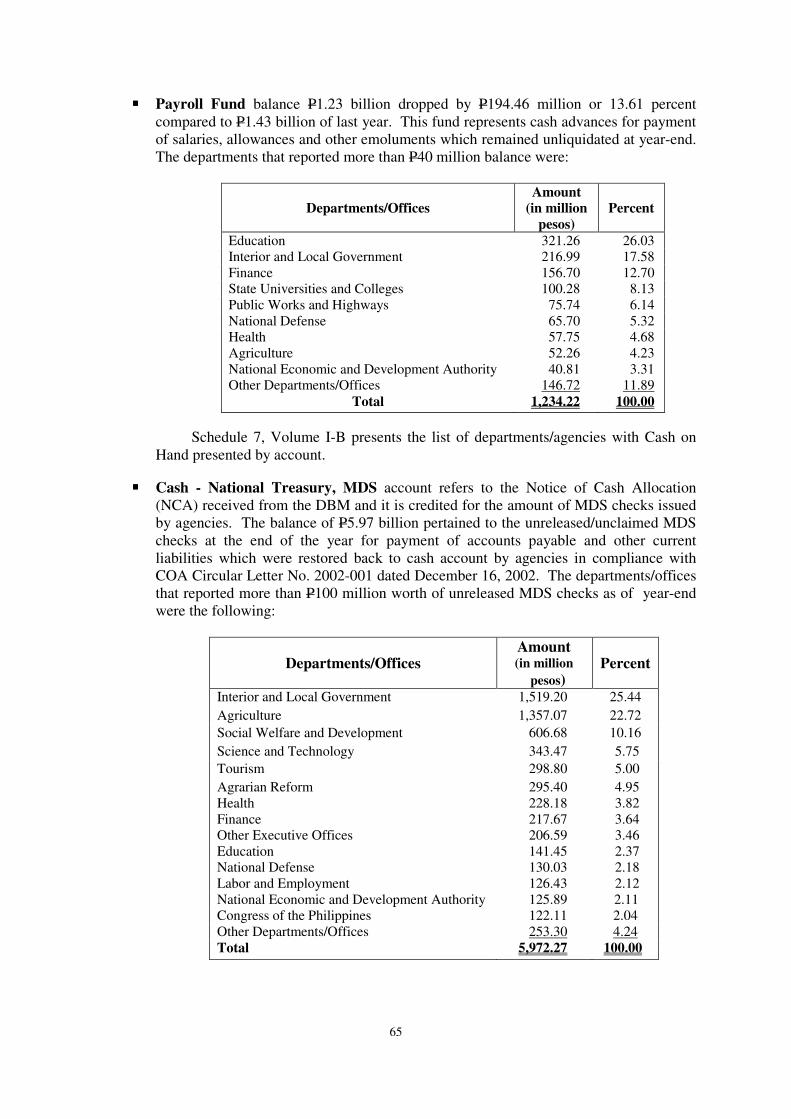
65
���� Payroll Fund balance P1.23 billion dropped by P194.46 million or 13.61 percent
compared to P1.43 billion of last year. This fund represents cash advances for payment
of salaries, allowances and other emoluments which remained unliquidated at year-end.
The departments that reported more than P40 million balance were:
Departments/Offices
Amount
(in million
pesos)
Percent
Education 321.26 26.03
Interior and Local Government 216.99 17.58
Finance 156.70 12.70
State Universities and Colleges 100.28 8.13
Public Works and Highways 75.74 6.14
National Defense 65.70 5.32
Health 57.75 4.68
Agriculture 52.26 4.23
National Economic and Development Authority 40.81 3.31
Other Departments/Offices 146.72 11.89
Total 1,234.22 100.00
Schedule 7, Volume I-B presents the list of departments/agencies with Cash on
Hand presented by account.
���� Cash - National Treasury, MDS account refers to the Notice of Cash Allocation
(NCA) received from the DBM and it is credited for the amount of MDS checks issued
by agencies. The balance of P5.97 billion pertained to the unreleased/unclaimed MDS
checks at the end of the year for payment of accounts payable and other current
liabilities which were restored back to cash account by agencies in compliance with
COA Circular Letter No. 2002-001 dated December 16, 2002. The departments/offices
that reported more than P100 million worth of unreleased MDS checks as of year-end
were the following:
Departments/Offices Amount (in million
pesos) Percent
Interior and Local Government 1,519.20 25.44
Agriculture 1,357.07 22.72
Social Welfare and Development 606.68 10.16
Science and Technology 343.47 5.75
Tourism 298.80 5.00
Agrarian Reform 295.40 4.95
Health 228.18 3.82
Finance 217.67 3.64
Other Executive Offices 206.59 3.46
Education 141.45 2.37
National Defense 130.03 2.18
Labor and Employment 126.43 2.12
National Economic and Development Authority 125.89 2.11
Congress of the Philippines 122.11 2.04
Other Departments/Offices 253.30 4.24
Total 5,972.27 100.00
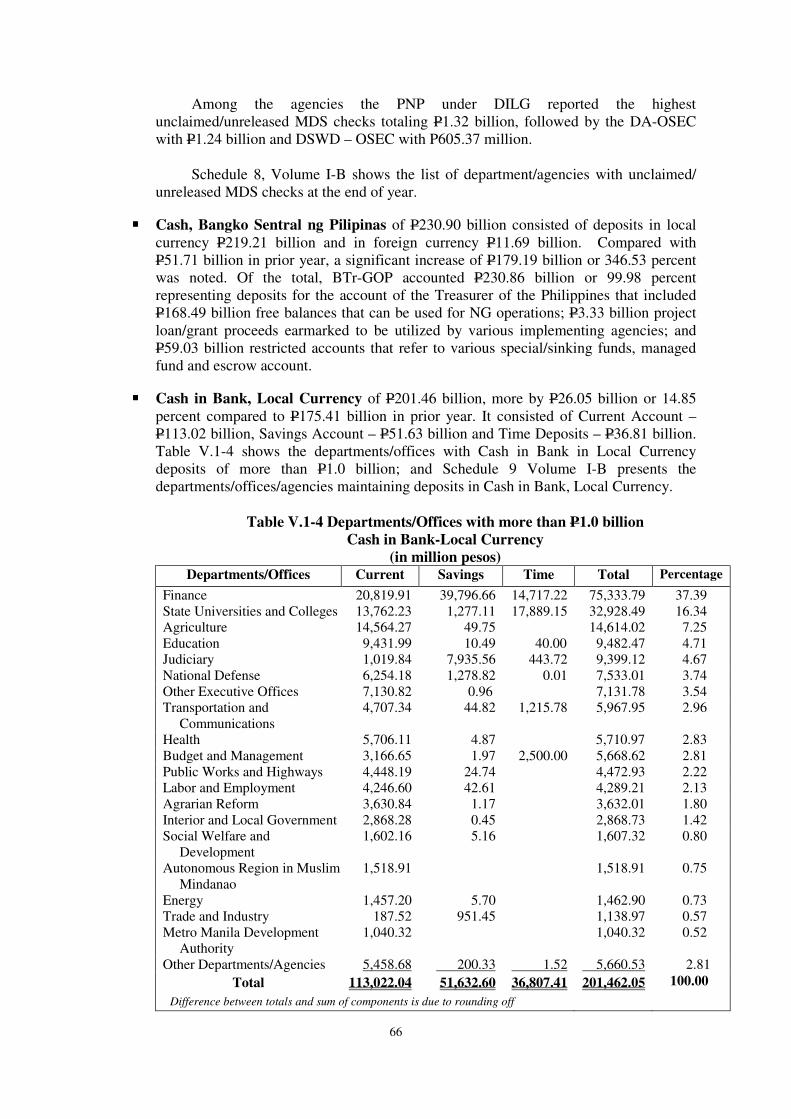
66
Among the agencies the PNP under DILG reported the highest
unclaimed/unreleased MDS checks totaling P1.32 billion, followed by the DA-OSEC
with P1.24 billion and DSWD – OSEC with P605.37 million.
Schedule 8, Volume I-B shows the list of department/agencies with unclaimed/
unreleased MDS checks at the end of year.
���� Cash, Bangko Sentral ng Pilipinas of P230.90 billion consisted of deposits in local
currency P219.21 billion and in foreign currency P11.69 billion. Compared with
P51.71 billion in prior year, a significant increase of P179.19 billion or 346.53 percent
was noted. Of the total, BTr-GOP accounted P230.86 billion or 99.98 percent
representing deposits for the account of the Treasurer of the Philippines that included
P168.49 billion free balances that can be used for NG operations; P3.33 billion project
loan/grant proceeds earmarked to be utilized by various implementing agencies; and
P59.03 billion restricted accounts that refer to various special/sinking funds, managed
fund and escrow account.
���� Cash in Bank, Local Currency of P201.46 billion, more by P26.05 billion or 14.85
percent compared to P175.41 billion in prior year. It consisted of Current Account –
P113.02 billion, Savings Account – P51.63 billion and Time Deposits – P36.81 billion.
Table V.1-4 shows the departments/offices with Cash in Bank in Local Currency
deposits of more than P1.0 billion; and Schedule 9 Volume I-B presents the
departments/offices/agencies maintaining deposits in Cash in Bank, Local Currency.
Table V.1-4 Departments/Offices with more than P1.0 billion
Cash in Bank-Local Currency
(in million pesos) Departments/Offices Current Savings Time Total Percentage
Finance 20,819.91 39,796.66 14,717.22 75,333.79 37.39
State Universities and Colleges 13,762.23 1,277.11 17,889.15 32,928.49 16.34
Agriculture 14,564.27 49.75 14,614.02 7.25
Education 9,431.99 10.49 40.00 9,482.47 4.71
Judiciary 1,019.84 7,935.56 443.72 9,399.12 4.67
National Defense 6,254.18 1,278.82 0.01 7,533.01 3.74
Other Executive Offices 7,130.82 0.96 7,131.78 3.54
Transportation and
Communications
4,707.34 44.82 1,215.78 5,967.95 2.96
Health 5,706.11 4.87 5,710.97 2.83
Budget and Management 3,166.65 1.97 2,500.00 5,668.62 2.81
Public Works and Highways 4,448.19 24.74 4,472.93 2.22
Labor and Employment 4,246.60 42.61 4,289.21 2.13
Agrarian Reform 3,630.84 1.17 3,632.01 1.80
Interior and Local Government 2,868.28 0.45 2,868.73 1.42
Social Welfare and
Development
1,602.16 5.16 1,607.32 0.80
Autonomous Region in Muslim
Mindanao
1,518.91 1,518.91 0.75
Energy 1,457.20 5.70 1,462.90 0.73
Trade and Industry 187.52 951.45 1,138.97 0.57
Metro Manila Development
Authority
1,040.32 1,040.32 0.52
Other Departments/Agencies 5,458.68 200.33 1.52 5,660.53 2.81
Total 113,022.04 51,632.60 36,807.41 201,462.05 100.00
Difference between totals and sum of components is due to rounding off
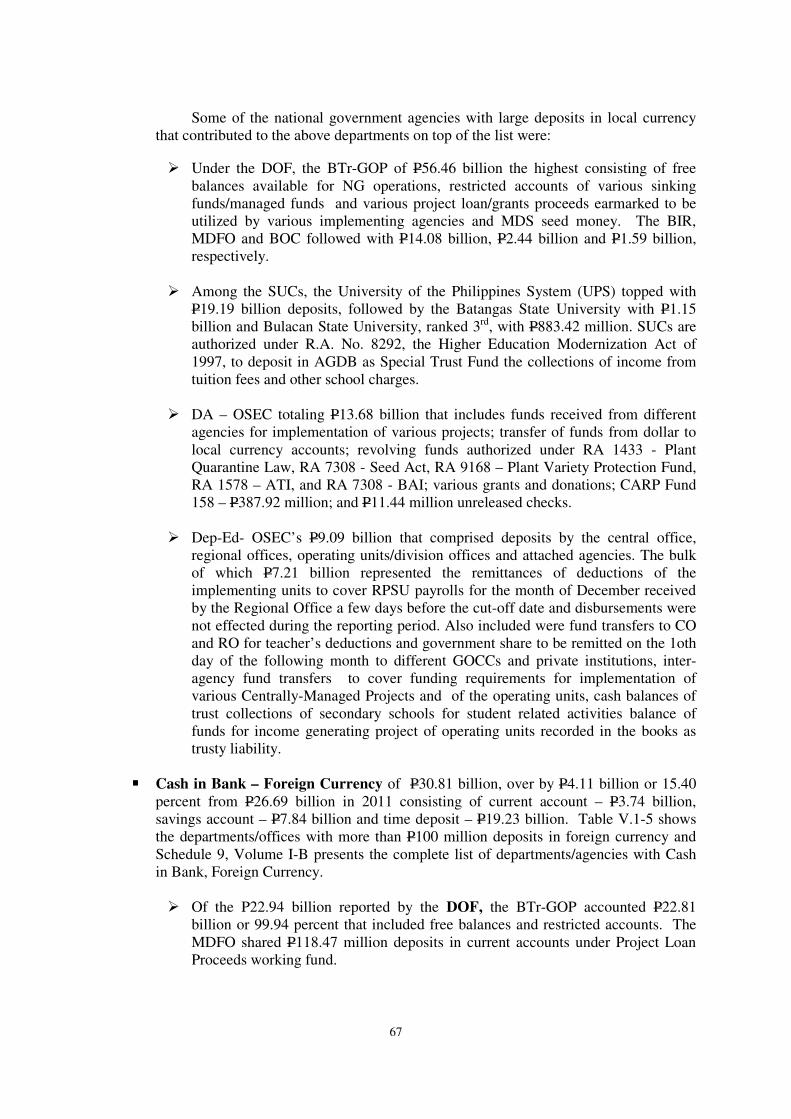
67
Some of the national government agencies with large deposits in local currency
that contributed to the above departments on top of the list were:
� Under the DOF, the BTr-GOP of P56.46 billion the highest consisting of free
balances available for NG operations, restricted accounts of various sinking
funds/managed funds and various project loan/grants proceeds earmarked to be
utilized by various implementing agencies and MDS seed money. The BIR,
MDFO and BOC followed with P14.08 billion, P2.44 billion and P1.59 billion,
respectively.
� Among the SUCs, the University of the Philippines System (UPS) topped with
P19.19 billion deposits, followed by the Batangas State University with P1.15
billion and Bulacan State University, ranked 3rd, with P883.42 million. SUCs are
authorized under R.A. No. 8292, the Higher Education Modernization Act of
1997, to deposit in AGDB as Special Trust Fund the collections of income from
tuition fees and other school charges.
� DA – OSEC totaling P13.68 billion that includes funds received from different
agencies for implementation of various projects; transfer of funds from dollar to
local currency accounts; revolving funds authorized under RA 1433 - Plant
Quarantine Law, RA 7308 - Seed Act, RA 9168 – Plant Variety Protection Fund,
RA 1578 – ATI, and RA 7308 - BAI; various grants and donations; CARP Fund
158 – P387.92 million; and P11.44 million unreleased checks.
� Dep-Ed- OSEC’s P9.09 billion that comprised deposits by the central office,
regional offices, operating units/division offices and attached agencies. The bulk
of which P7.21 billion represented the remittances of deductions of the
implementing units to cover RPSU payrolls for the month of December received
by the Regional Office a few days before the cut-off date and disbursements were
not effected during the reporting period. Also included were fund transfers to CO
and RO for teacher’s deductions and government share to be remitted on the 1oth
day of the following month to different GOCCs and private institutions, inter-
agency fund transfers to cover funding requirements for implementation of
various Centrally-Managed Projects and of the operating units, cash balances of
trust collections of secondary schools for student related activities balance of
funds for income generating project of operating units recorded in the books as
trusty liability.
���� Cash in Bank – Foreign Currency of P30.81 billion, over by P4.11 billion or 15.40
percent from P26.69 billion in 2011 consisting of current account – P3.74 billion,
savings account – P7.84 billion and time deposit – P19.23 billion. Table V.1-5 shows
the departments/offices with more than P100 million deposits in foreign currency and
Schedule 9, Volume I-B presents the complete list of departments/agencies with Cash
in Bank, Foreign Currency.
� Of the P22.94 billion reported by the DOF, the BTr-GOP accounted P22.81
billion or 99.94 percent that included free balances and restricted accounts. The
MDFO shared P118.47 million deposits in current accounts under Project Loan
Proceeds working fund.
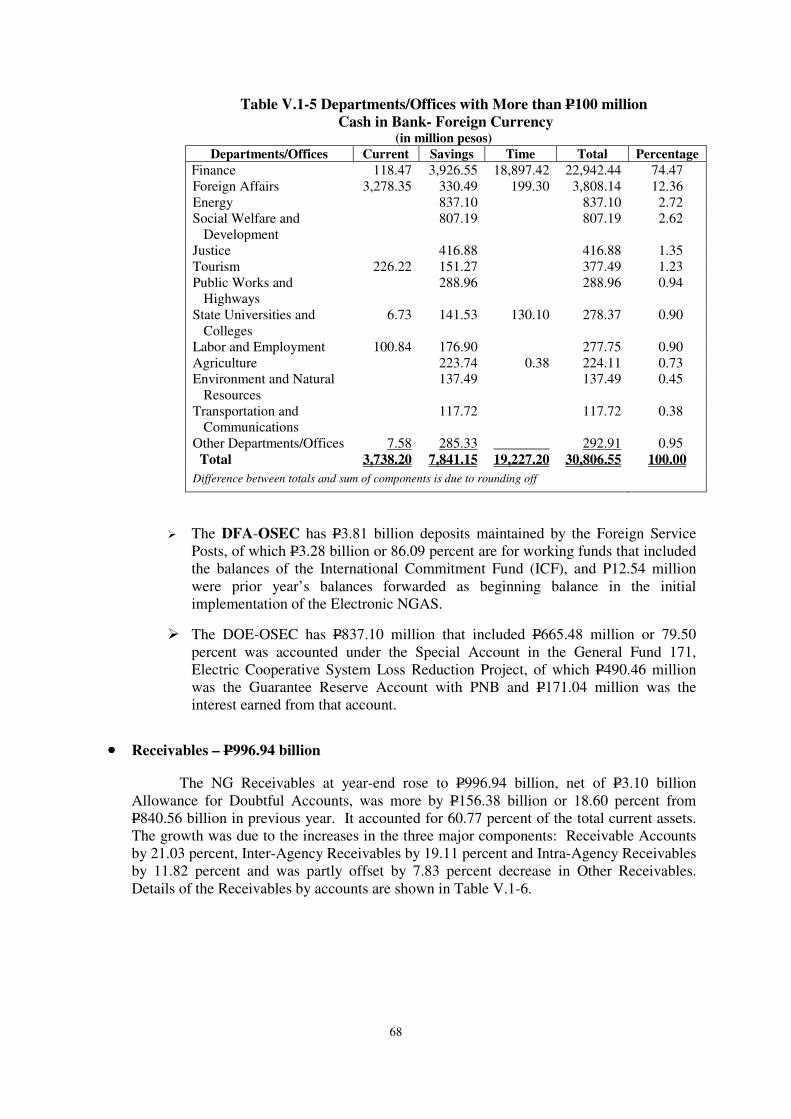
68
Table V.1-5 Departments/Offices with More than P100 million
Cash in Bank- Foreign Currency (in million pesos)
Departments/Offices Current Savings Time Total Percentage
Finance 118.47 3,926.55 18,897.42 22,942.44 74.47
Foreign Affairs 3,278.35 330.49 199.30 3,808.14 12.36
Energy 837.10 837.10 2.72
Social Welfare and
Development
807.19 807.19 2.62
Justice 416.88 416.88 1.35
Tourism 226.22 151.27 377.49 1.23
Public Works and
Highways
288.96 288.96 0.94
State Universities and
Colleges
6.73 141.53 130.10 278.37 0.90
Labor and Employment 100.84 176.90 277.75 0.90
Agriculture 223.74 0.38 224.11 0.73
Environment and Natural
Resources
137.49 137.49 0.45
Transportation and
Communications
117.72 117.72 0.38
Other Departments/Offices 7.58 285.33 ________ 292.91 0.95
Total 3,738.20 7,841.15 19,227.20 30,806.55 100.00
Difference between totals and sum of components is due to rounding off
� The DFA-OSEC has P3.81 billion deposits maintained by the Foreign Service
Posts, of which P3.28 billion or 86.09 percent are for working funds that included
the balances of the International Commitment Fund (ICF), and P12.54 million
were prior year’s balances forwarded as beginning balance in the initial
implementation of the Electronic NGAS.
� The DOE-OSEC has P837.10 million that included P665.48 million or 79.50
percent was accounted under the Special Account in the General Fund 171,
Electric Cooperative System Loss Reduction Project, of which P490.46 million
was the Guarantee Reserve Account with PNB and P171.04 million was the
interest earned from that account.
•••• Receivables – P996.94 billion
The NG Receivables at year-end rose to P996.94 billion, net of P3.10 billion
Allowance for Doubtful Accounts, was more by P156.38 billion or 18.60 percent from
P840.56 billion in previous year. It accounted for 60.77 percent of the total current assets.
The growth was due to the increases in the three major components: Receivable Accounts
by 21.03 percent, Inter-Agency Receivables by 19.11 percent and Intra-Agency Receivables
by 11.82 percent and was partly offset by 7.83 percent decrease in Other Receivables.
Details of the Receivables by accounts are shown in Table V.1-6.
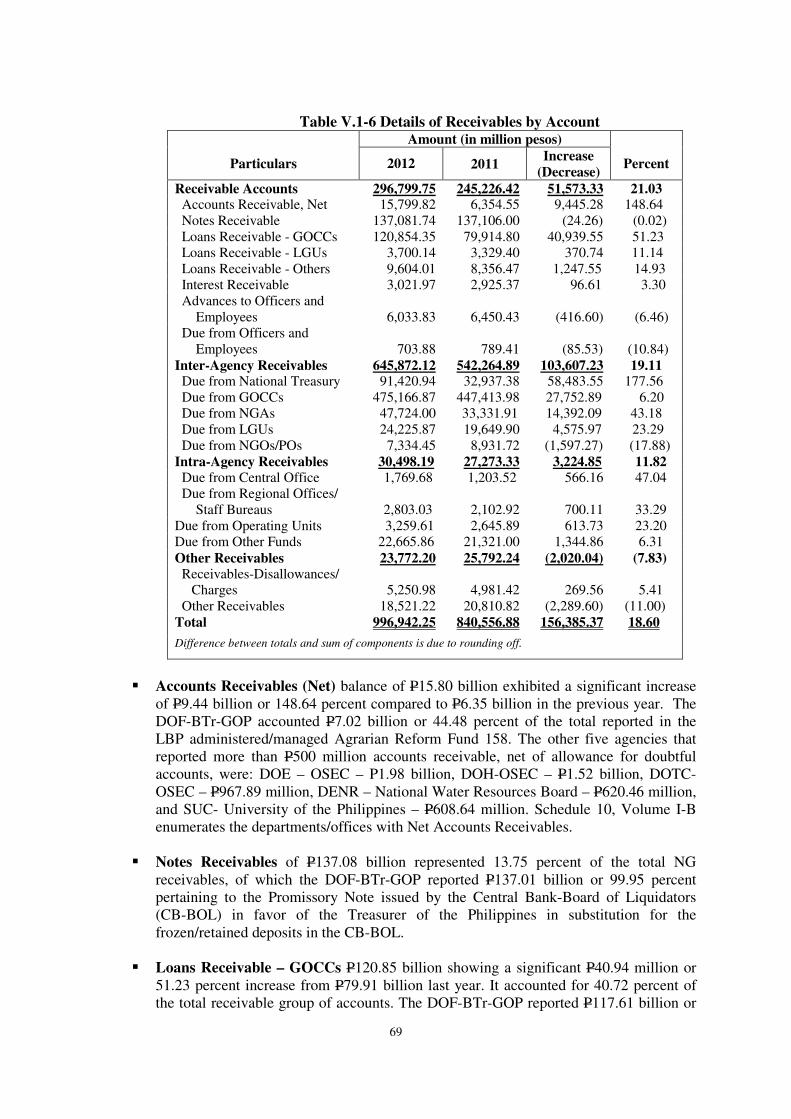
69
Table V.1-6 Details of Receivables by Account
Particulars
Amount (in million pesos)
Percent 2012 2011 Increase
(Decrease)
Receivable Accounts 296,799.75 245,226.42 51,573.33 21.03 Accounts Receivable, Net 15,799.82 6,354.55 9,445.28 148.64
Notes Receivable 137,081.74 137,106.00 (24.26) (0.02)
Loans Receivable - GOCCs 120,854.35 79,914.80 40,939.55 51.23
Loans Receivable - LGUs 3,700.14 3,329.40 370.74 11.14
Loans Receivable - Others 9,604.01 8,356.47 1,247.55 14.93
Interest Receivable 3,021.97 2,925.37 96.61 3.30
Advances to Officers and
Employees
6,033.83
6,450.43
(416.60)
(6.46)
Due from Officers and
Employees
703.88
789.41
(85.53)
(10.84)
Inter-Agency Receivables 645,872.12 542,264.89 103,607.23 19.11 Due from National Treasury 91,420.94 32,937.38 58,483.55 177.56
Due from GOCCs 475,166.87 447,413.98 27,752.89 6.20
Due from NGAs 47,724.00 33,331.91 14,392.09 43.18
Due from LGUs 24,225.87 19,649.90 4,575.97 23.29
Due from NGOs/POs 7,334.45 8,931.72 (1,597.27) (17.88)
Intra-Agency Receivables 30,498.19 27,273.33 3,224.85 11.82
Due from Central Office 1,769.68 1,203.52 566.16 47.04
Due from Regional Offices/
Staff Bureaus
2,803.03
2,102.92
700.11
33.29
Due from Operating Units 3,259.61 2,645.89 613.73 23.20
Due from Other Funds 22,665.86 21,321.00 1,344.86 6.31
Other Receivables 23,772.20 25,792.24 (2,020.04) (7.83)
Receivables-Disallowances/
Charges
5,250.98
4,981.42
269.56
5.41
Other Receivables 18,521.22 20,810.82 (2,289.60) (11.00)
Total 996,942.25 840,556.88 156,385.37 18.60
Difference between totals and sum of components is due to rounding off.
� Accounts Receivables (Net) balance of P15.80 billion exhibited a significant increase
of P9.44 billion or 148.64 percent compared to P6.35 billion in the previous year. The
DOF-BTr-GOP accounted P7.02 billion or 44.48 percent of the total reported in the
LBP administered/managed Agrarian Reform Fund 158. The other five agencies that
reported more than P500 million accounts receivable, net of allowance for doubtful
accounts, were: DOE – OSEC – P1.98 billion, DOH-OSEC – P1.52 billion, DOTC-
OSEC – P967.89 million, DENR – National Water Resources Board – P620.46 million,
and SUC- University of the Philippines – P608.64 million. Schedule 10, Volume I-B
enumerates the departments/offices with Net Accounts Receivables.
� Notes Receivables of P137.08 billion represented 13.75 percent of the total NG
receivables, of which the DOF-BTr-GOP reported P137.01 billion or 99.95 percent
pertaining to the Promissory Note issued by the Central Bank-Board of Liquidators
(CB-BOL) in favor of the Treasurer of the Philippines in substitution for the
frozen/retained deposits in the CB-BOL.
� Loans Receivable – GOCCs P120.85 billion showing a significant P40.94 million or
51.23 percent increase from P79.91 billion last year. It accounted for 40.72 percent of
the total receivable group of accounts. The DOF-BTr-GOP reported P117.61 billion or
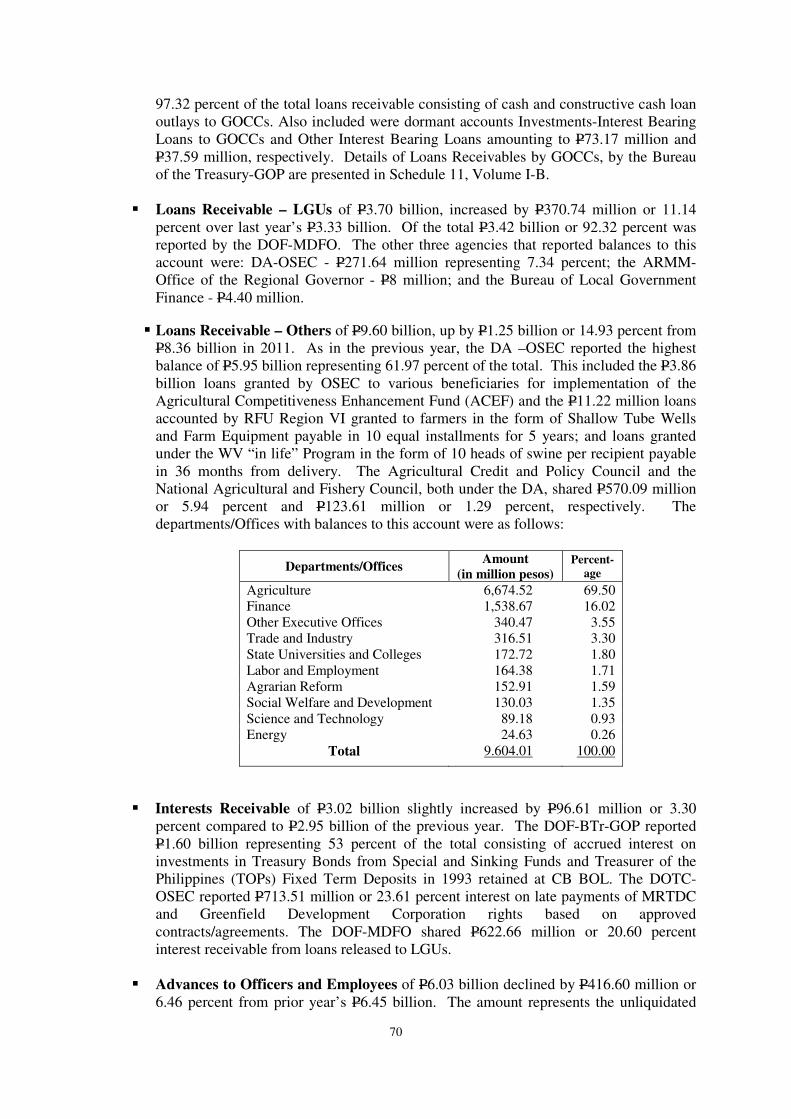
70
97.32 percent of the total loans receivable consisting of cash and constructive cash loan
outlays to GOCCs. Also included were dormant accounts Investments-Interest Bearing
Loans to GOCCs and Other Interest Bearing Loans amounting to P73.17 million and
P37.59 million, respectively. Details of Loans Receivables by GOCCs, by the Bureau
of the Treasury-GOP are presented in Schedule 11, Volume I-B.
� Loans Receivable – LGUs of P3.70 billion, increased by P370.74 million or 11.14
percent over last year’s P3.33 billion. Of the total P3.42 billion or 92.32 percent was
reported by the DOF-MDFO. The other three agencies that reported balances to this
account were: DA-OSEC - P271.64 million representing 7.34 percent; the ARMM-
Office of the Regional Governor - P8 million; and the Bureau of Local Government
Finance - P4.40 million.
� Loans Receivable – Others of P9.60 billion, up by P1.25 billion or 14.93 percent from
P8.36 billion in 2011. As in the previous year, the DA –OSEC reported the highest
balance of P5.95 billion representing 61.97 percent of the total. This included the P3.86
billion loans granted by OSEC to various beneficiaries for implementation of the
Agricultural Competitiveness Enhancement Fund (ACEF) and the P11.22 million loans
accounted by RFU Region VI granted to farmers in the form of Shallow Tube Wells
and Farm Equipment payable in 10 equal installments for 5 years; and loans granted
under the WV “in life” Program in the form of 10 heads of swine per recipient payable
in 36 months from delivery. The Agricultural Credit and Policy Council and the
National Agricultural and Fishery Council, both under the DA, shared P570.09 million
or 5.94 percent and P123.61 million or 1.29 percent, respectively. The
departments/Offices with balances to this account were as follows:
Departments/Offices Amount
(in million pesos)
Percent-
age
Agriculture 6,674.52 69.50
Finance 1,538.67 16.02
Other Executive Offices 340.47 3.55
Trade and Industry 316.51 3.30
State Universities and Colleges 172.72 1.80
Labor and Employment 164.38 1.71
Agrarian Reform 152.91 1.59
Social Welfare and Development 130.03 1.35
Science and Technology 89.18 0.93
Energy 24.63 0.26
Total 9.604.01 100.00
� Interests Receivable of P3.02 billion slightly increased by P96.61 million or 3.30
percent compared to P2.95 billion of the previous year. The DOF-BTr-GOP reported
P1.60 billion representing 53 percent of the total consisting of accrued interest on
investments in Treasury Bonds from Special and Sinking Funds and Treasurer of the
Philippines (TOPs) Fixed Term Deposits in 1993 retained at CB BOL. The DOTC-
OSEC reported P713.51 million or 23.61 percent interest on late payments of MRTDC
and Greenfield Development Corporation rights based on approved
contracts/agreements. The DOF-MDFO shared P622.66 million or 20.60 percent
interest receivable from loans released to LGUs.
� Advances to Officers and Employees of P6.03 billion declined by P416.60 million or
6.46 percent from prior year’s P6.45 billion. The amount represents the unliquidated
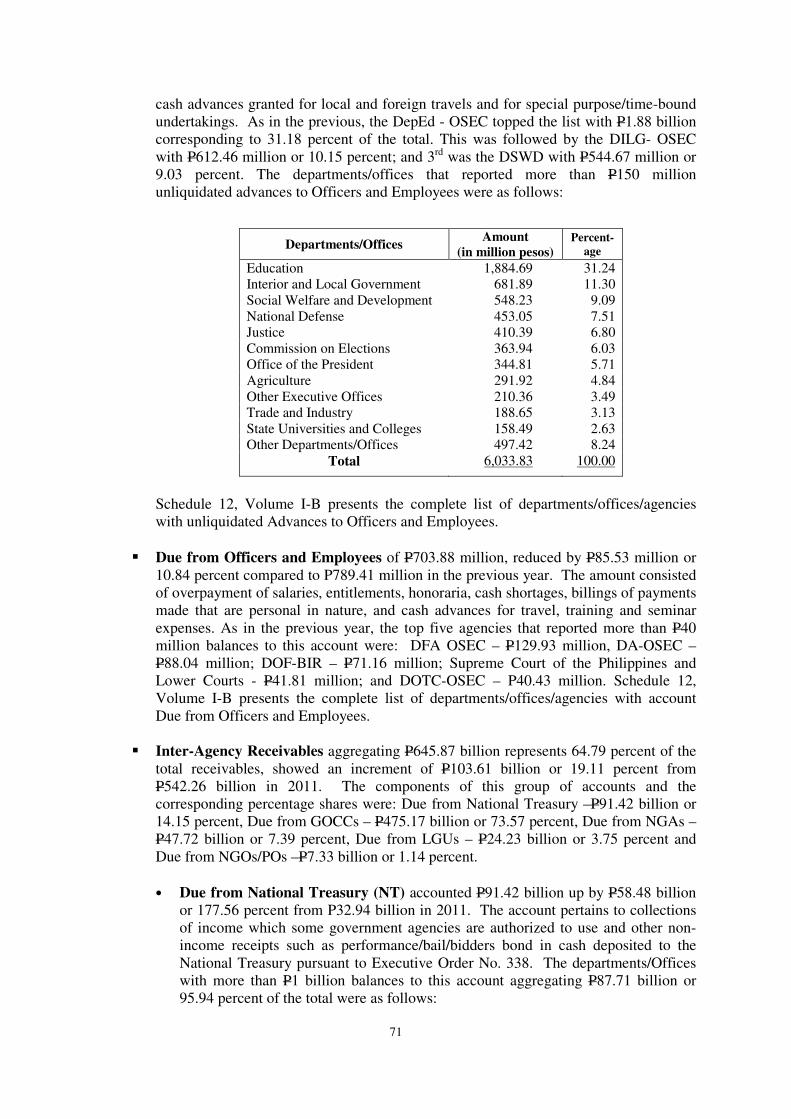
71
cash advances granted for local and foreign travels and for special purpose/time-bound
undertakings. As in the previous, the DepEd - OSEC topped the list with P1.88 billion
corresponding to 31.18 percent of the total. This was followed by the DILG- OSEC
with P612.46 million or 10.15 percent; and 3rd was the DSWD with P544.67 million or
9.03 percent. The departments/offices that reported more than P150 million
unliquidated advances to Officers and Employees were as follows:
Departments/Offices Amount
(in million pesos)
Percent-
age
Education 1,884.69 31.24
Interior and Local Government 681.89 11.30
Social Welfare and Development 548.23 9.09
National Defense 453.05 7.51
Justice 410.39 6.80
Commission on Elections 363.94 6.03
Office of the President 344.81 5.71
Agriculture 291.92 4.84
Other Executive Offices 210.36 3.49
Trade and Industry 188.65 3.13
State Universities and Colleges 158.49 2.63
Other Departments/Offices 497.42 8.24
Total 6,033.83 100.00
Schedule 12, Volume I-B presents the complete list of departments/offices/agencies
with unliquidated Advances to Officers and Employees.
� Due from Officers and Employees of P703.88 million, reduced by P85.53 million or
10.84 percent compared to P789.41 million in the previous year. The amount consisted
of overpayment of salaries, entitlements, honoraria, cash shortages, billings of payments
made that are personal in nature, and cash advances for travel, training and seminar
expenses. As in the previous year, the top five agencies that reported more than P40
million balances to this account were: DFA OSEC – P129.93 million, DA-OSEC –
P88.04 million; DOF-BIR – P71.16 million; Supreme Court of the Philippines and
Lower Courts - P41.81 million; and DOTC-OSEC – P40.43 million. Schedule 12,
Volume I-B presents the complete list of departments/offices/agencies with account
Due from Officers and Employees.
� Inter-Agency Receivables aggregating P645.87 billion represents 64.79 percent of the
total receivables, showed an increment of P103.61 billion or 19.11 percent from
P542.26 billion in 2011. The components of this group of accounts and the
corresponding percentage shares were: Due from National Treasury –P91.42 billion or
14.15 percent, Due from GOCCs – P475.17 billion or 73.57 percent, Due from NGAs –
P47.72 billion or 7.39 percent, Due from LGUs – P24.23 billion or 3.75 percent and
Due from NGOs/POs –P7.33 billion or 1.14 percent.
• Due from National Treasury (NT) accounted P91.42 billion up by P58.48 billion
or 177.56 percent from P32.94 billion in 2011. The account pertains to collections
of income which some government agencies are authorized to use and other non-
income receipts such as performance/bail/bidders bond in cash deposited to the
National Treasury pursuant to Executive Order No. 338. The departments/Offices
with more than P1 billion balances to this account aggregating P87.71 billion or
95.94 percent of the total were as follows:
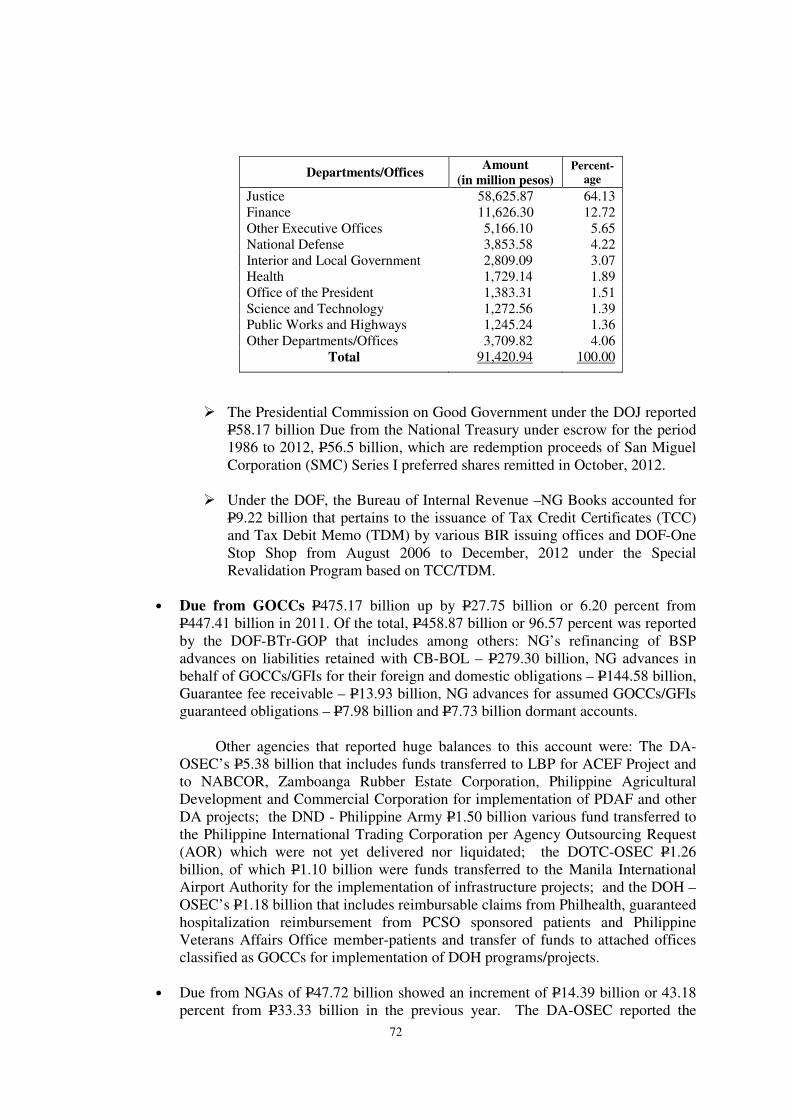
72
Departments/Offices Amount
(in million pesos) Percent-
age
Justice 58,625.87 64.13
Finance 11,626.30 12.72
Other Executive Offices 5,166.10 5.65
National Defense 3,853.58 4.22
Interior and Local Government 2,809.09 3.07
Health 1,729.14 1.89
Office of the President 1,383.31 1.51
Science and Technology 1,272.56 1.39
Public Works and Highways 1,245.24 1.36
Other Departments/Offices 3,709.82 4.06
Total 91,420.94 100.00
� The Presidential Commission on Good Government under the DOJ reported
P58.17 billion Due from the National Treasury under escrow for the period
1986 to 2012, P56.5 billion, which are redemption proceeds of San Miguel
Corporation (SMC) Series I preferred shares remitted in October, 2012.
� Under the DOF, the Bureau of Internal Revenue –NG Books accounted for
P9.22 billion that pertains to the issuance of Tax Credit Certificates (TCC)
and Tax Debit Memo (TDM) by various BIR issuing offices and DOF-One
Stop Shop from August 2006 to December, 2012 under the Special
Revalidation Program based on TCC/TDM.
• Due from GOCCs P475.17 billion up by P27.75 billion or 6.20 percent from
P447.41 billion in 2011. Of the total, P458.87 billion or 96.57 percent was reported
by the DOF-BTr-GOP that includes among others: NG’s refinancing of BSP
advances on liabilities retained with CB-BOL – P279.30 billion, NG advances in
behalf of GOCCs/GFIs for their foreign and domestic obligations – P144.58 billion,
Guarantee fee receivable – P13.93 billion, NG advances for assumed GOCCs/GFIs
guaranteed obligations – P7.98 billion and P7.73 billion dormant accounts.
Other agencies that reported huge balances to this account were: The DA-
OSEC’s P5.38 billion that includes funds transferred to LBP for ACEF Project and
to NABCOR, Zamboanga Rubber Estate Corporation, Philippine Agricultural
Development and Commercial Corporation for implementation of PDAF and other
DA projects; the DND - Philippine Army P1.50 billion various fund transferred to
the Philippine International Trading Corporation per Agency Outsourcing Request
(AOR) which were not yet delivered nor liquidated; the DOTC-OSEC P1.26
billion, of which P1.10 billion were funds transferred to the Manila International
Airport Authority for the implementation of infrastructure projects; and the DOH –
OSEC’s P1.18 billion that includes reimbursable claims from Philhealth, guaranteed
hospitalization reimbursement from PCSO sponsored patients and Philippine
Veterans Affairs Office member-patients and transfer of funds to attached offices
classified as GOCCs for implementation of DOH programs/projects.
• Due from NGAs of P47.72 billion showed an increment of P14.39 billion or 43.18
percent from P33.33 billion in the previous year. The DA-OSEC reported the
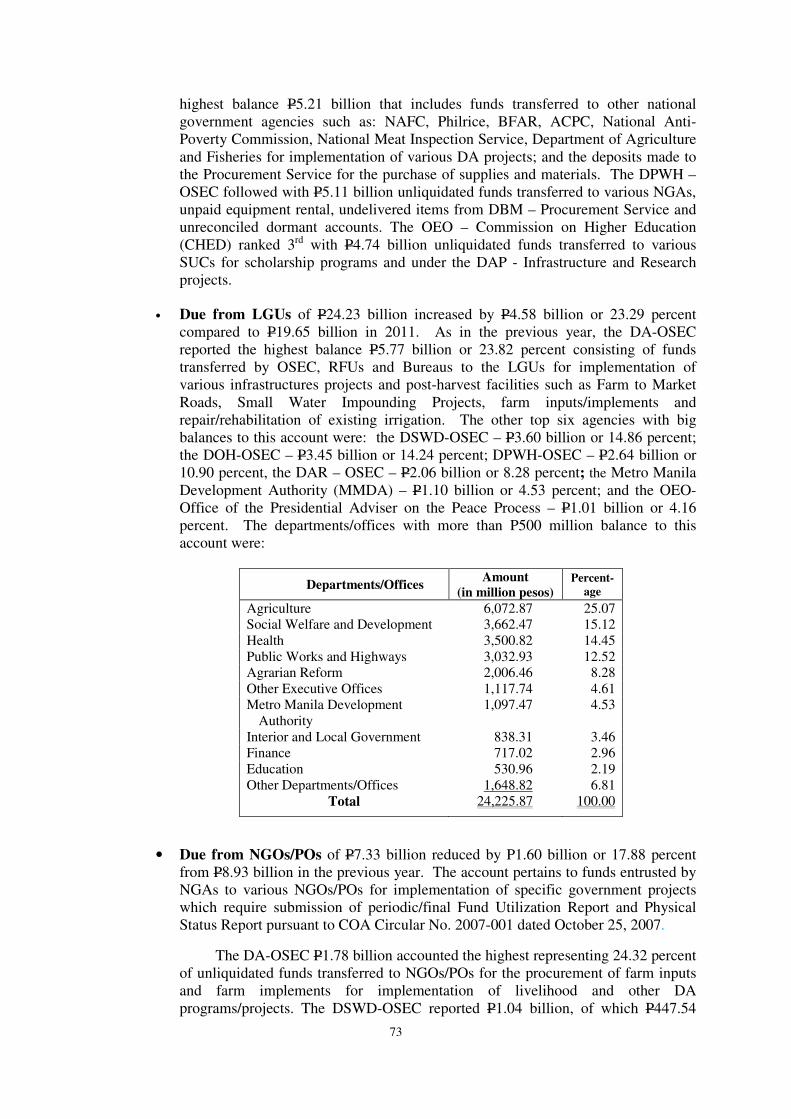
73
highest balance P5.21 billion that includes funds transferred to other national
government agencies such as: NAFC, Philrice, BFAR, ACPC, National Anti-
Poverty Commission, National Meat Inspection Service, Department of Agriculture
and Fisheries for implementation of various DA projects; and the deposits made to
the Procurement Service for the purchase of supplies and materials. The DPWH –
OSEC followed with P5.11 billion unliquidated funds transferred to various NGAs,
unpaid equipment rental, undelivered items from DBM – Procurement Service and
unreconciled dormant accounts. The OEO – Commission on Higher Education
(CHED) ranked 3rd with P4.74 billion unliquidated funds transferred to various
SUCs for scholarship programs and under the DAP - Infrastructure and Research
projects.
• Due from LGUs of P24.23 billion increased by P4.58 billion or 23.29 percent
compared to P19.65 billion in 2011. As in the previous year, the DA-OSEC
reported the highest balance P5.77 billion or 23.82 percent consisting of funds
transferred by OSEC, RFUs and Bureaus to the LGUs for implementation of
various infrastructures projects and post-harvest facilities such as Farm to Market
Roads, Small Water Impounding Projects, farm inputs/implements and
repair/rehabilitation of existing irrigation. The other top six agencies with big
balances to this account were: the DSWD-OSEC – P3.60 billion or 14.86 percent;
the DOH-OSEC – P3.45 billion or 14.24 percent; DPWH-OSEC – P2.64 billion or
10.90 percent, the DAR – OSEC – P2.06 billion or 8.28 percent; the Metro Manila
Development Authority (MMDA) – P1.10 billion or 4.53 percent; and the OEO-
Office of the Presidential Adviser on the Peace Process – P1.01 billion or 4.16
percent. The departments/offices with more than P500 million balance to this
account were:
Departments/Offices Amount
(in million pesos) Percent-
age
Agriculture 6,072.87 25.07
Social Welfare and Development 3,662.47 15.12
Health 3,500.82 14.45
Public Works and Highways 3,032.93 12.52
Agrarian Reform 2,006.46 8.28
Other Executive Offices 1,117.74 4.61
Metro Manila Development
Authority
1,097.47 4.53
Interior and Local Government 838.31 3.46
Finance 717.02 2.96
Education 530.96 2.19
Other Departments/Offices 1,648.82 6.81
Total 24,225.87 100.00
• Due from NGOs/POs of P7.33 billion reduced by P1.60 billion or 17.88 percent
from P8.93 billion in the previous year. The account pertains to funds entrusted by
NGAs to various NGOs/POs for implementation of specific government projects
which require submission of periodic/final Fund Utilization Report and Physical
Status Report pursuant to COA Circular No. 2007-001 dated October 25, 2007.
The DA-OSEC P1.78 billion accounted the highest representing 24.32 percent
of unliquidated funds transferred to NGOs/POs for the procurement of farm inputs
and farm implements for implementation of livelihood and other DA
programs/projects. The DSWD-OSEC reported P1.04 billion, of which P447.54
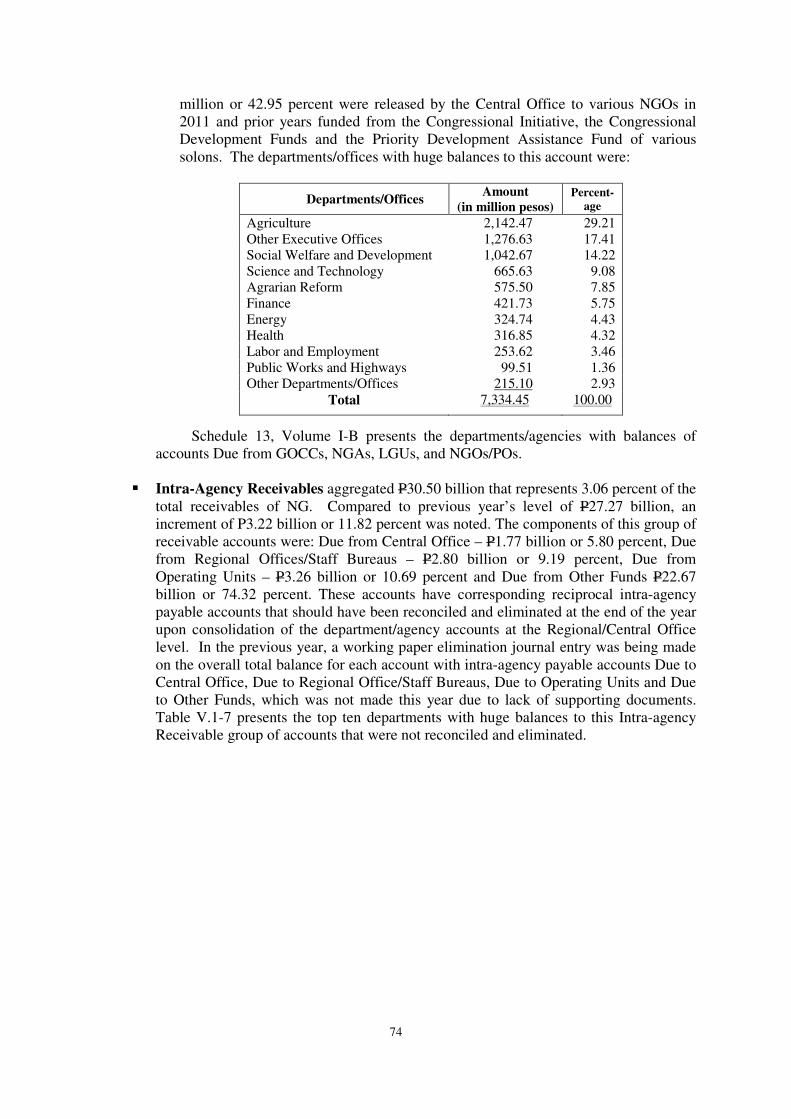
74
million or 42.95 percent were released by the Central Office to various NGOs in
2011 and prior years funded from the Congressional Initiative, the Congressional
Development Funds and the Priority Development Assistance Fund of various
solons. The departments/offices with huge balances to this account were:
Departments/Offices Amount
(in million pesos) Percent-
age
Agriculture 2,142.47 29.21
Other Executive Offices 1,276.63 17.41
Social Welfare and Development 1,042.67 14.22
Science and Technology 665.63 9.08
Agrarian Reform 575.50 7.85
Finance 421.73 5.75
Energy 324.74 4.43
Health 316.85 4.32
Labor and Employment 253.62 3.46
Public Works and Highways 99.51 1.36
Other Departments/Offices 215.10 2.93
Total 7,334.45 100.00
Schedule 13, Volume I-B presents the departments/agencies with balances of
accounts Due from GOCCs, NGAs, LGUs, and NGOs/POs.
� Intra-Agency Receivables aggregated P30.50 billion that represents 3.06 percent of the
total receivables of NG. Compared to previous year’s level of P27.27 billion, an
increment of P3.22 billion or 11.82 percent was noted. The components of this group of
receivable accounts were: Due from Central Office – P1.77 billion or 5.80 percent, Due
from Regional Offices/Staff Bureaus – P2.80 billion or 9.19 percent, Due from
Operating Units – P3.26 billion or 10.69 percent and Due from Other Funds P22.67
billion or 74.32 percent. These accounts have corresponding reciprocal intra-agency
payable accounts that should have been reconciled and eliminated at the end of the year
upon consolidation of the department/agency accounts at the Regional/Central Office
level. In the previous year, a working paper elimination journal entry was being made
on the overall total balance for each account with intra-agency payable accounts Due to
Central Office, Due to Regional Office/Staff Bureaus, Due to Operating Units and Due
to Other Funds, which was not made this year due to lack of supporting documents.
Table V.1-7 presents the top ten departments with huge balances to this Intra-agency
Receivable group of accounts that were not reconciled and eliminated.
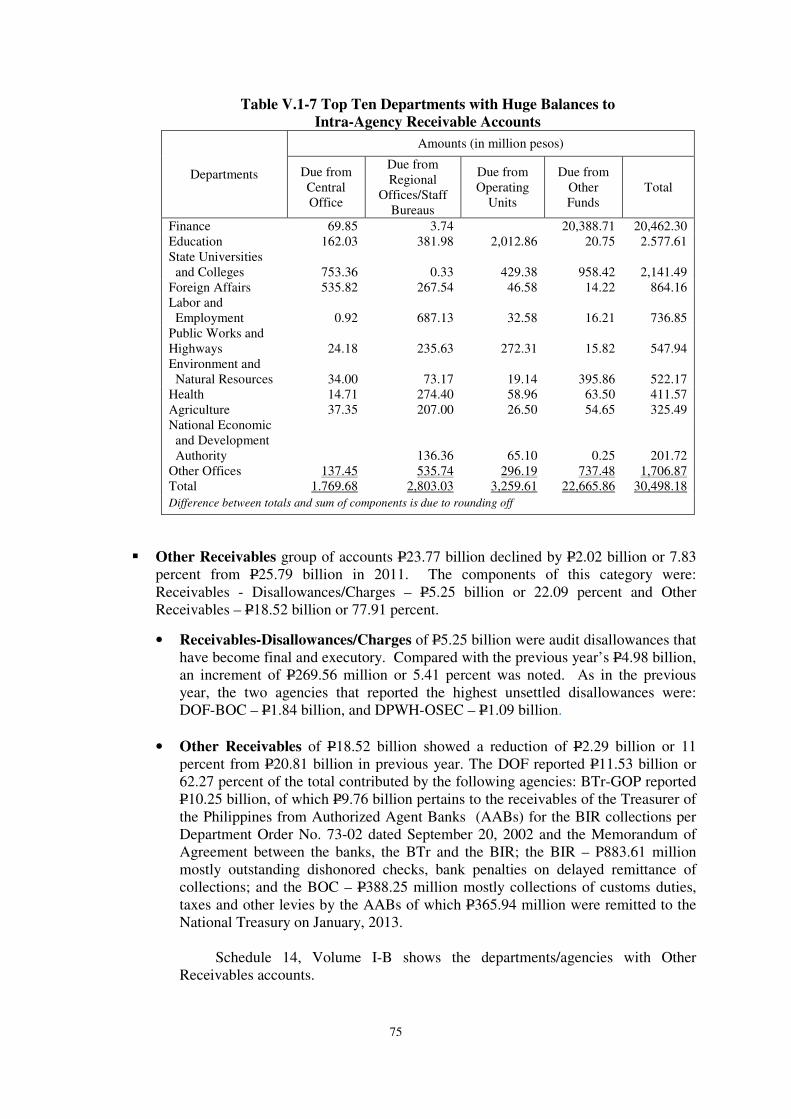
75
Table V.1-7 Top Ten Departments with Huge Balances to
Intra-Agency Receivable Accounts
Departments
Amounts (in million pesos)
Due from
Central
Office
Due from
Regional
Offices/Staff
Bureaus
Due from
Operating
Units
Due from
Other
Funds
Total
Finance 69.85 3.74 20,388.71 20,462.30
Education 162.03 381.98 2,012.86 20.75 2.577.61
State Universities
and Colleges
753.36
0.33
429.38
958.42
2,141.49
Foreign Affairs 535.82 267.54 46.58 14.22 864.16
Labor and
Employment
0.92
687.13
32.58
16.21
736.85
Public Works and
Highways
24.18
235.63
272.31
15.82
547.94
Environment and
Natural Resources
34.00
73.17
19.14
395.86
522.17
Health 14.71 274.40 58.96 63.50 411.57
Agriculture 37.35 207.00 26.50 54.65 325.49
National Economic
and Development
Authority
136.36
65.10
0.25
201.72
Other Offices 137.45 535.74 296.19 737.48 1,706.87
Total 1.769.68 2,803.03 3,259.61 22,665.86 30,498.18
Difference between totals and sum of components is due to rounding off
� Other Receivables group of accounts P23.77 billion declined by P2.02 billion or 7.83
percent from P25.79 billion in 2011. The components of this category were:
Receivables - Disallowances/Charges – P5.25 billion or 22.09 percent and Other
Receivables – P18.52 billion or 77.91 percent.
• Receivables-Disallowances/Charges of P5.25 billion were audit disallowances that
have become final and executory. Compared with the previous year’s P4.98 billion,
an increment of P269.56 million or 5.41 percent was noted. As in the previous
year, the two agencies that reported the highest unsettled disallowances were:
DOF-BOC – P1.84 billion, and DPWH-OSEC – P1.09 billion.
• Other Receivables of P18.52 billion showed a reduction of P2.29 billion or 11
percent from P20.81 billion in previous year. The DOF reported P11.53 billion or
62.27 percent of the total contributed by the following agencies: BTr-GOP reported
P10.25 billion, of which P9.76 billion pertains to the receivables of the Treasurer of
the Philippines from Authorized Agent Banks (AABs) for the BIR collections per
Department Order No. 73-02 dated September 20, 2002 and the Memorandum of
Agreement between the banks, the BTr and the BIR; the BIR – P883.61 million
mostly outstanding dishonored checks, bank penalties on delayed remittance of
collections; and the BOC – P388.25 million mostly collections of customs duties,
taxes and other levies by the AABs of which P365.94 million were remitted to the
National Treasury on January, 2013.
Schedule 14, Volume I-B shows the departments/agencies with Other
Receivables accounts.
76
•••• Inventories – P28.42 billion
Inventories of NGAs aggregated P28.42 billion, posting an increment of P2.05
billion or 7.79 percent compared to P26.37 billion in the previous year. This group of
assets consisted of the following sub-groups: Supplies – P25.96 billion or 91.35 percent;
Materials – P1.72 billion or 6.04 percent; and Agricultural, Fishery and Forestry Products –
P742.44 million or 2.61 percent.
The DND reported the highest balance of inventories amounting to P8.40 billion
that includes among others Military and Police Supplies Inventory –P4.04 billion, Spare
Parts Inventory – P1.21 billion, Other Supplies Inventory – P1.18 billion, Gasoline, Oil and
Lubricants Inventory – P821.34 million and Office Supplies Inventory – P472.30 million.
The other departments that reported more than P1.00 billion inventory at year-end were:
DOH – P6.99 billion, DepEd – P2.89 billion, DA– P1.44 billion, SUCs and DILG – P1.20
billion each. Schedule 15, Volume I-B presents the Inventory accounts by
department/office/agency.
•••• Prepayments – P132.99 billion
Prepayments of P132.99 billion showed an increment of P2.93 billion or 2.25
percent over last year’s P130.06 billion. The components of this group of assets were:
Deferred Charges – P104.74 billion; Advances to Contractors – P15.69 billion; Deposit on
Letters of Credits – P8.35 billion; Other Prepaid Expenses – P3.38 billion; Prepaid Rent –
P695.79 million; Prepaid Insurance – P126.58 million; and Prepaid Interest – P2.44 million.
Schedule 16, Volume I-B presents the Prepaid Expenses by accounts by department/office.
� Deferred Charges of P104.74 billion dropped by P322.70 million from P105.06 billion
in 2011. Of the total, the DOF BTR-GOP accounted P104.56 or 99.83 percent mostly
from discounts on Bond Exchange, the issuance of Zero-Coupon Bonds and Global
bonds abroad, and premiums on investments in bonds held by Bond Sinking Fund,
Special Guaranty Fund, Security Stabilization Fund and Manila Waterworks Sewerage
System which being are amortized over the life of the bonds.
� Advances to Contractors rose to P15.69 billion, showing a growth of P4.53 billion or
40.54 percent compared to P11.17 billion of the previous year. These were advance
payments for the implementation of the foreign-assisted and locally-funded
infrastructures and other projects. The DPWH reported the highest P7.03 billion or
44.81 percent of the total advances followed by the following departments: the DOH –
P3.24 billion, the DA – P1.49 billion and the DND – P1.10 billion.
� Deposit on Letters of Credit of P8.35 billion reduced by P737.03 million or 8.11
percent from P9.09 billion in 2011. The DND accounted P6.37 billion or 76.25 percent
of the total. The account represented marginal deposits or prepayments deposited to
authorized depository banks for the supplies and delivery of ammunitions, vehicular
and communication requirements of the AFP contracted from foreign suppliers and cost
of freight forwarding and other items for modernization projects. Other departments
that reported more than P100 million balances were: the COMELEC – P753.73 million,
the DA – P664.71 million, and the DOTC – P178.99 million.
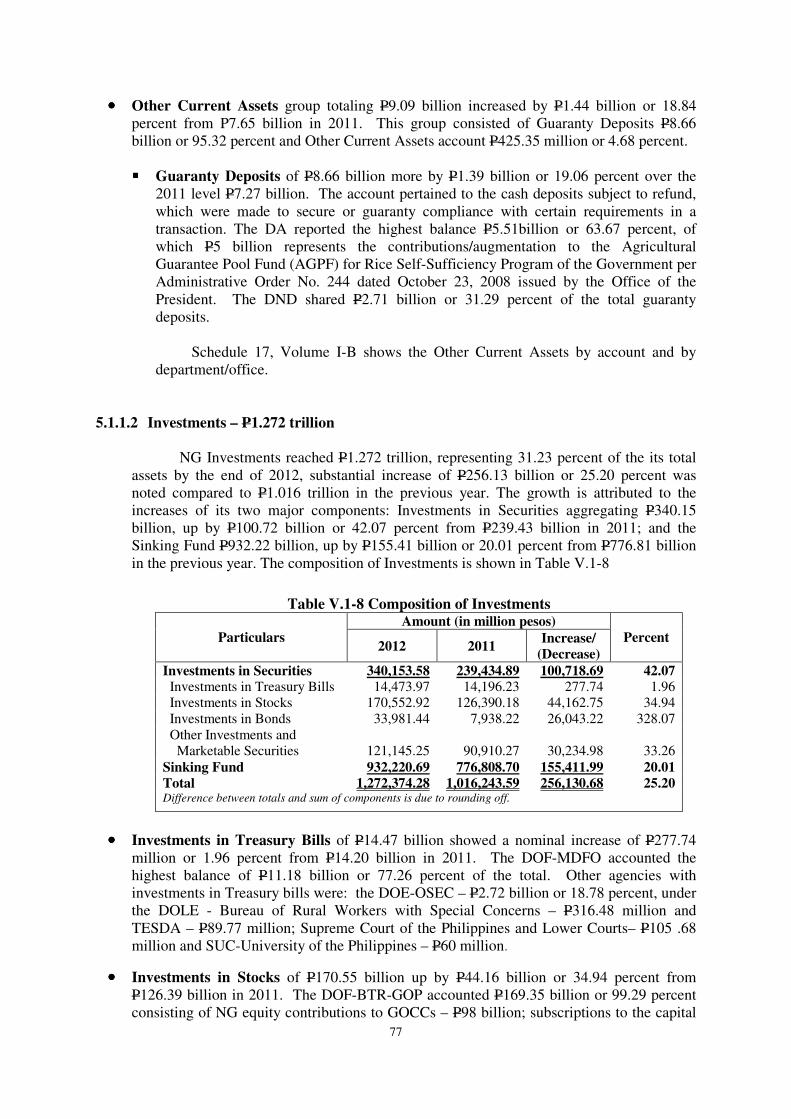
77
•••• Other Current Assets group totaling P9.09 billion increased by P1.44 billion or 18.84
percent from P7.65 billion in 2011. This group consisted of Guaranty Deposits P8.66
billion or 95.32 percent and Other Current Assets account P425.35 million or 4.68 percent.
���� Guaranty Deposits of P8.66 billion more by P1.39 billion or 19.06 percent over the
2011 level P7.27 billion. The account pertained to the cash deposits subject to refund,
which were made to secure or guaranty compliance with certain requirements in a
transaction. The DA reported the highest balance P5.51billion or 63.67 percent, of
which P5 billion represents the contributions/augmentation to the Agricultural
Guarantee Pool Fund (AGPF) for Rice Self-Sufficiency Program of the Government per
Administrative Order No. 244 dated October 23, 2008 issued by the Office of the
President. The DND shared P2.71 billion or 31.29 percent of the total guaranty
deposits.
Schedule 17, Volume I-B shows the Other Current Assets by account and by
department/office.
5.1.1.2 Investments – P1.272 trillion
NG Investments reached P1.272 trillion, representing 31.23 percent of the its total
assets by the end of 2012, substantial increase of P256.13 billion or 25.20 percent was
noted compared to P1.016 trillion in the previous year. The growth is attributed to the
increases of its two major components: Investments in Securities aggregating P340.15
billion, up by P100.72 billion or 42.07 percent from P239.43 billion in 2011; and the
Sinking Fund P932.22 billion, up by P155.41 billion or 20.01 percent from P776.81 billion
in the previous year. The composition of Investments is shown in Table V.1-8
Table V.1-8 Composition of Investments
Particulars
Amount (in million pesos)
Percent 2012 2011
Increase/
(Decrease)
Investments in Securities 340,153.58 239,434.89 100,718.69 42.07 Investments in Treasury Bills 14,473.97 14,196.23 277.74 1.96
Investments in Stocks 170,552.92 126,390.18 44,162.75 34.94
Investments in Bonds 33,981.44 7,938.22 26,043.22 328.07
Other Investments and
Marketable Securities
121,145.25
90,910.27
30,234.98
33.26
Sinking Fund 932,220.69 776,808.70 155,411.99 20.01
Total 1,272,374.28 1,016,243.59 256,130.68 25.20 Difference between totals and sum of components is due to rounding off.
•••• Investments in Treasury Bills of P14.47 billion showed a nominal increase of P277.74
million or 1.96 percent from P14.20 billion in 2011. The DOF-MDFO accounted the
highest balance of P11.18 billion or 77.26 percent of the total. Other agencies with
investments in Treasury bills were: the DOE-OSEC – P2.72 billion or 18.78 percent, under
the DOLE - Bureau of Rural Workers with Special Concerns – P316.48 million and
TESDA – P89.77 million; Supreme Court of the Philippines and Lower Courts– P105 .68
million and SUC-University of the Philippines – P60 million.
•••• Investments in Stocks of P170.55 billion up by P44.16 billion or 34.94 percent from
P126.39 billion in 2011. The DOF-BTR-GOP accounted P169.35 billion or 99.29 percent
consisting of NG equity contributions to GOCCs – P98 billion; subscriptions to the capital
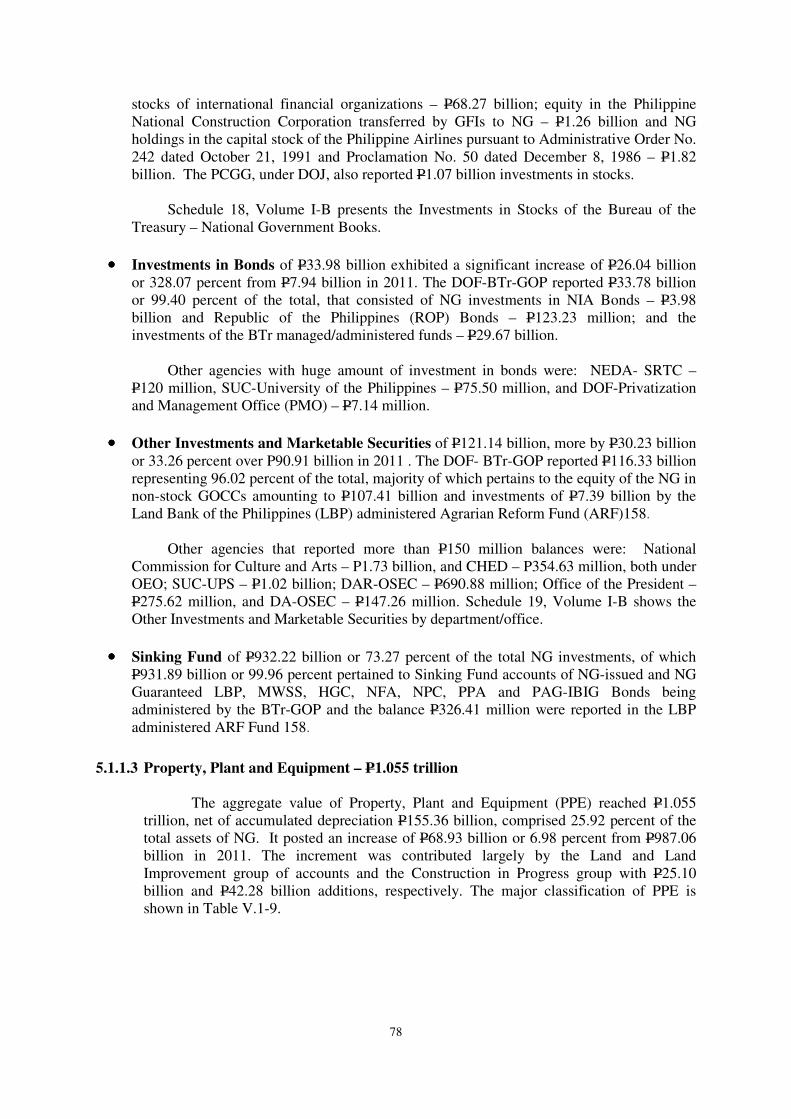
78
stocks of international financial organizations – P68.27 billion; equity in the Philippine
National Construction Corporation transferred by GFIs to NG – P1.26 billion and NG
holdings in the capital stock of the Philippine Airlines pursuant to Administrative Order No.
242 dated October 21, 1991 and Proclamation No. 50 dated December 8, 1986 – P1.82
billion. The PCGG, under DOJ, also reported P1.07 billion investments in stocks.
Schedule 18, Volume I-B presents the Investments in Stocks of the Bureau of the
Treasury – National Government Books.
•••• Investments in Bonds of P33.98 billion exhibited a significant increase of P26.04 billion
or 328.07 percent from P7.94 billion in 2011. The DOF-BTr-GOP reported P33.78 billion
or 99.40 percent of the total, that consisted of NG investments in NIA Bonds – P3.98
billion and Republic of the Philippines (ROP) Bonds – P123.23 million; and the
investments of the BTr managed/administered funds – P29.67 billion.
Other agencies with huge amount of investment in bonds were: NEDA- SRTC –
P120 million, SUC-University of the Philippines – P75.50 million, and DOF-Privatization
and Management Office (PMO) – P7.14 million.
•••• Other Investments and Marketable Securities of P121.14 billion, more by P30.23 billion
or 33.26 percent over P90.91 billion in 2011 . The DOF- BTr-GOP reported P116.33 billion
representing 96.02 percent of the total, majority of which pertains to the equity of the NG in
non-stock GOCCs amounting to P107.41 billion and investments of P7.39 billion by the
Land Bank of the Philippines (LBP) administered Agrarian Reform Fund (ARF)158.
Other agencies that reported more than P150 million balances were: National
Commission for Culture and Arts – P1.73 billion, and CHED – P354.63 million, both under
OEO; SUC-UPS – P1.02 billion; DAR-OSEC – P690.88 million; Office of the President –
P275.62 million, and DA-OSEC – P147.26 million. Schedule 19, Volume I-B shows the
Other Investments and Marketable Securities by department/office.
•••• Sinking Fund of P932.22 billion or 73.27 percent of the total NG investments, of which
P931.89 billion or 99.96 percent pertained to Sinking Fund accounts of NG-issued and NG
Guaranteed LBP, MWSS, HGC, NFA, NPC, PPA and PAG-IBIG Bonds being
administered by the BTr-GOP and the balance P326.41 million were reported in the LBP
administered ARF Fund 158.
5.1.1.3 Property, Plant and Equipment – P1.055 trillion
The aggregate value of Property, Plant and Equipment (PPE) reached P1.055
trillion, net of accumulated depreciation P155.36 billion, comprised 25.92 percent of the
total assets of NG. It posted an increase of P68.93 billion or 6.98 percent from P987.06
billion in 2011. The increment was contributed largely by the Land and Land
Improvement group of accounts and the Construction in Progress group with P25.10
billion and P42.28 billion additions, respectively. The major classification of PPE is
shown in Table V.1-9.
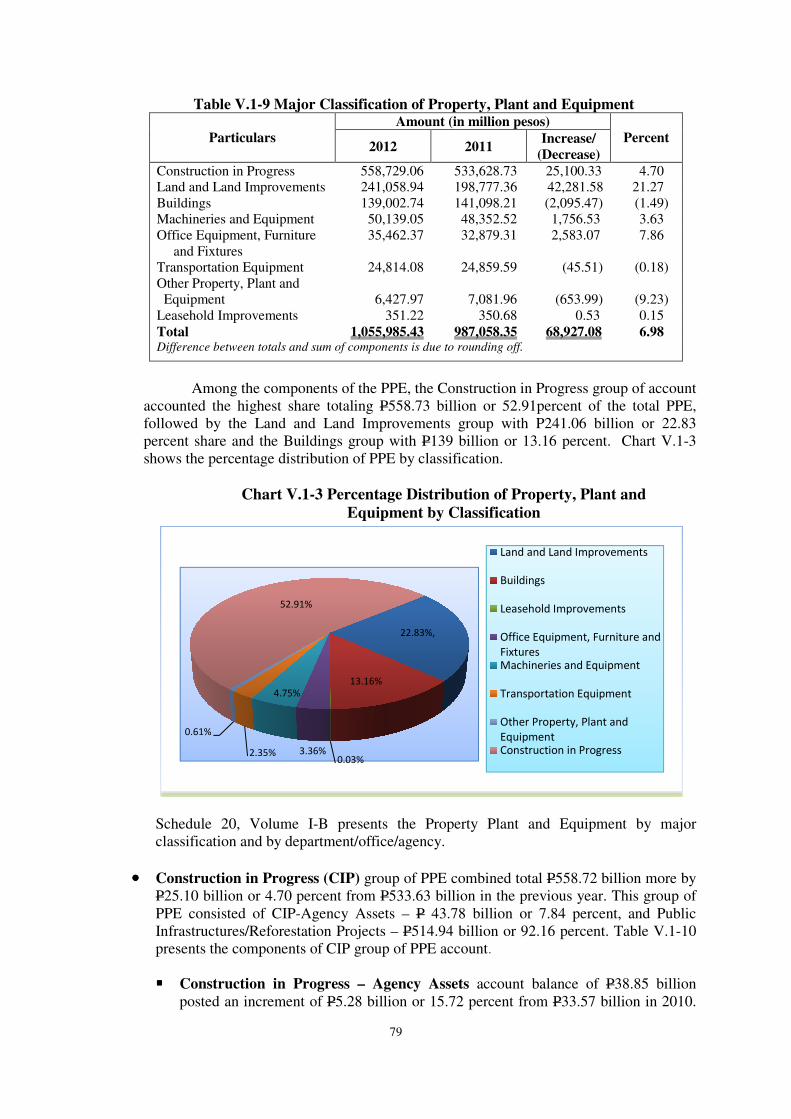
79
Table V.1-9 Major Classification of Property, Plant and Equipment
Particulars
Amount (in million pesos)
Percent 2012 2011
Increase/
(Decrease)
Construction in Progress 558,729.06 533,628.73 25,100.33 4.70
Land and Land Improvements 241,058.94 198,777.36 42,281.58 21.27
Buildings 139,002.74 141,098.21 (2,095.47) (1.49)
Machineries and Equipment 50,139.05 48,352.52 1,756.53 3.63
Office Equipment, Furniture
and Fixtures
35,462.37 32,879.31 2,583.07 7.86
Transportation Equipment 24,814.08 24,859.59 (45.51) (0.18)
Other Property, Plant and
Equipment
6,427.97
7,081.96
(653.99)
(9.23)
Leasehold Improvements 351.22 350.68 0.53 0.15
Total 1,055,985.43 987,058.35 68,927.08 6.98 Difference between totals and sum of components is due to rounding off.
Among the components of the PPE, the Construction in Progress group of account
accounted the highest share totaling P558.73 billion or 52.91percent of the total PPE,
followed by the Land and Land Improvements group with P241.06 billion or 22.83
percent share and the Buildings group with P139 billion or 13.16 percent. Chart V.1-3
shows the percentage distribution of PPE by classification.
Chart V.1-3 Percentage Distribution of Property, Plant and
Equipment by Classification
22.83%,
13.16%
0.03%3.36%
4.75%
2.35%
0.61%
52.91%
Land and Land Improvements
Buildings
Leasehold Improvements
Office Equipment, Furniture and
Fixtures
Machineries and Equipment
Transportation Equipment
Other Property, Plant and
Equipment
Construction in Progress
Schedule 20, Volume I-B presents the Property Plant and Equipment by major
classification and by department/office/agency.
•••• Construction in Progress (CIP) group of PPE combined total P558.72 billion more by
P25.10 billion or 4.70 percent from P533.63 billion in the previous year. This group of
PPE consisted of CIP-Agency Assets – P 43.78 billion or 7.84 percent, and Public
Infrastructures/Reforestation Projects – P514.94 billion or 92.16 percent. Table V.1-10
presents the components of CIP group of PPE account.
���� Construction in Progress – Agency Assets account balance of P38.85 billion
posted an increment of P5.28 billion or 15.72 percent from P33.57 billion in 2010.
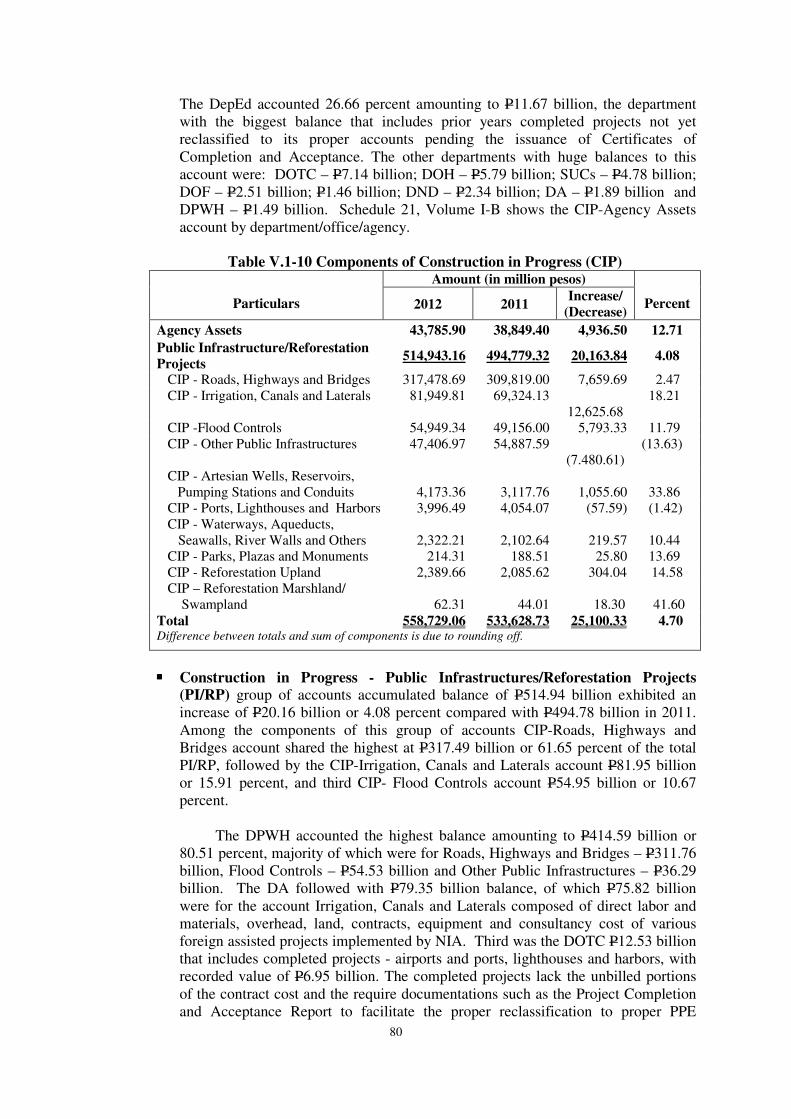
80
The DepEd accounted 26.66 percent amounting to P11.67 billion, the department
with the biggest balance that includes prior years completed projects not yet
reclassified to its proper accounts pending the issuance of Certificates of
Completion and Acceptance. The other departments with huge balances to this
account were: DOTC – P7.14 billion; DOH – P5.79 billion; SUCs – P4.78 billion;
DOF – P2.51 billion; P1.46 billion; DND – P2.34 billion; DA – P1.89 billion and
DPWH – P1.49 billion. Schedule 21, Volume I-B shows the CIP-Agency Assets
account by department/office/agency.
Table V.1-10 Components of Construction in Progress (CIP)
Particulars
Amount (in million pesos)
Percent 2012 2011 Increase/
(Decrease)
Agency Assets 43,785.90 38,849.40 4,936.50 12.71
Public Infrastructure/Reforestation
Projects 514,943.16 494,779.32 20,163.84 4.08
CIP - Roads, Highways and Bridges 317,478.69 309,819.00 7,659.69 2.47
CIP - Irrigation, Canals and Laterals 81,949.81 69,324.13
12,625.68
18.21
CIP -Flood Controls 54,949.34 49,156.00 5,793.33 11.79
CIP - Other Public Infrastructures 47,406.97 54,887.59
(7.480.61)
(13.63)
CIP - Artesian Wells, Reservoirs,
Pumping Stations and Conduits
4,173.36
3,117.76
1,055.60
33.86
CIP - Ports, Lighthouses and Harbors 3,996.49 4,054.07 (57.59) (1.42)
CIP - Waterways, Aqueducts,
Seawalls, River Walls and Others
2,322.21
2,102.64
219.57
10.44
CIP - Parks, Plazas and Monuments 214.31 188.51 25.80 13.69
CIP - Reforestation Upland 2,389.66 2,085.62 304.04 14.58
CIP – Reforestation Marshland/
Swampland
62.31
44.01
18.30
41.60
Total 558,729.06 533,628.73 25,100.33 4.70 Difference between totals and sum of components is due to rounding off.
���� Construction in Progress - Public Infrastructures/Reforestation Projects (PI/RP) group of accounts accumulated balance of P514.94 billion exhibited an
increase of P20.16 billion or 4.08 percent compared with P494.78 billion in 2011.
Among the components of this group of accounts CIP-Roads, Highways and
Bridges account shared the highest at P317.49 billion or 61.65 percent of the total
PI/RP, followed by the CIP-Irrigation, Canals and Laterals account P81.95 billion
or 15.91 percent, and third CIP- Flood Controls account P54.95 billion or 10.67
percent.
The DPWH accounted the highest balance amounting to P414.59 billion or
80.51 percent, majority of which were for Roads, Highways and Bridges – P311.76
billion, Flood Controls – P54.53 billion and Other Public Infrastructures – P36.29
billion. The DA followed with P79.35 billion balance, of which P75.82 billion
were for the account Irrigation, Canals and Laterals composed of direct labor and
materials, overhead, land, contracts, equipment and consultancy cost of various
foreign assisted projects implemented by NIA. Third was the DOTC P12.53 billion
that includes completed projects - airports and ports, lighthouses and harbors, with
recorded value of P6.95 billion. The completed projects lack the unbilled portions
of the contract cost and the require documentations such as the Project Completion
and Acceptance Report to facilitate the proper reclassification to proper PPE
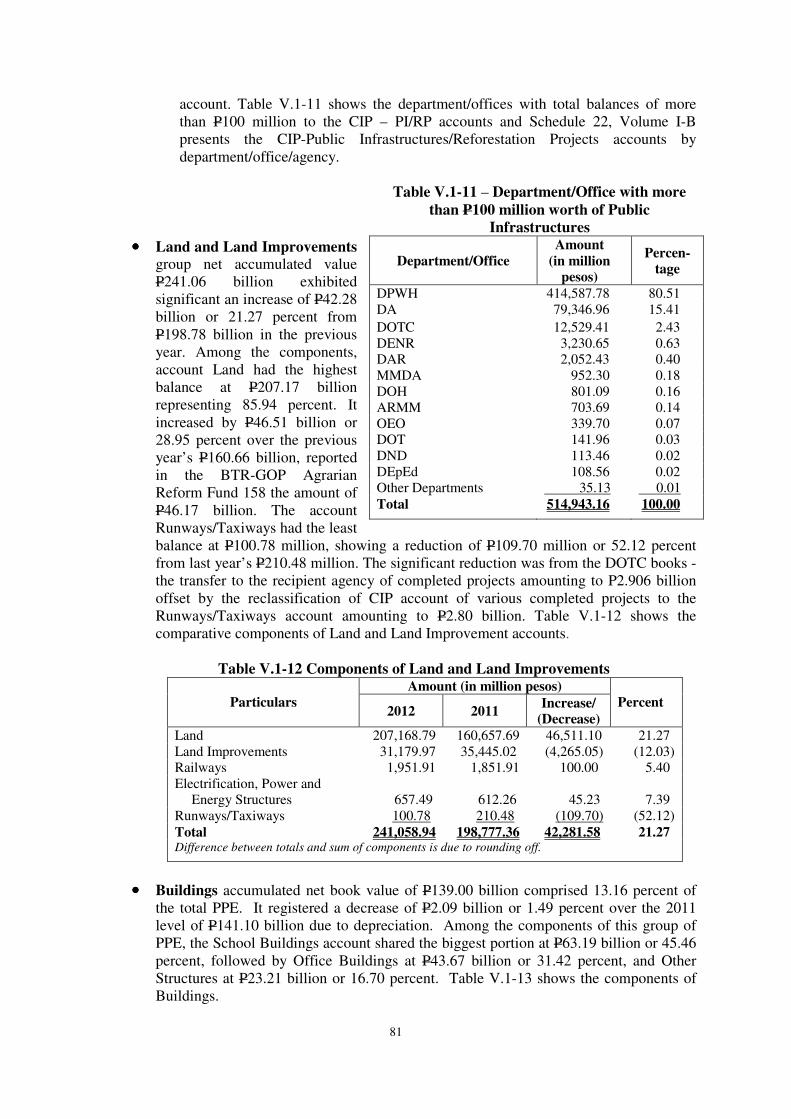
81
account. Table V.1-11 shows the department/offices with total balances of more
than P100 million to the CIP – PI/RP accounts and Schedule 22, Volume I-B
presents the CIP-Public Infrastructures/Reforestation Projects accounts by
department/office/agency.
Table V.1-11 – Department/Office with more
than P100 million worth of Public
Infrastructures
•••• Land and Land Improvements group net accumulated value
P241.06 billion exhibited
significant an increase of P42.28
billion or 21.27 percent from
P198.78 billion in the previous
year. Among the components,
account Land had the highest
balance at P207.17 billion
representing 85.94 percent. It
increased by P46.51 billion or
28.95 percent over the previous
year’s P160.66 billion, reported
in the BTR-GOP Agrarian
Reform Fund 158 the amount of
P46.17 billion. The account
Runways/Taxiways had the least
balance at P100.78 million, showing a reduction of P109.70 million or 52.12 percent
from last year’s P210.48 million. The significant reduction was from the DOTC books -
the transfer to the recipient agency of completed projects amounting to P2.906 billion
offset by the reclassification of CIP account of various completed projects to the
Runways/Taxiways account amounting to P2.80 billion. Table V.1-12 shows the
comparative components of Land and Land Improvement accounts.
Table V.1-12 Components of Land and Land Improvements
Particulars
Amount (in million pesos)
Percent 2012 2011
Increase/
(Decrease)
Land 207,168.79 160,657.69 46,511.10 21.27
Land Improvements 31,179.97 35,445.02 (4,265.05) (12.03)
Railways 1,951.91 1,851.91 100.00 5.40
Electrification, Power and
Energy Structures
657.49
612.26
45.23
7.39
Runways/Taxiways 100.78 210.48 (109.70) (52.12)
Total 241,058.94 198,777.36 42,281.58 21.27 Difference between totals and sum of components is due to rounding off.
•••• Buildings accumulated net book value of P139.00 billion comprised 13.16 percent of
the total PPE. It registered a decrease of P2.09 billion or 1.49 percent over the 2011
level of P141.10 billion due to depreciation. Among the components of this group of
PPE, the School Buildings account shared the biggest portion at P63.19 billion or 45.46
percent, followed by Office Buildings at P43.67 billion or 31.42 percent, and Other
Structures at P23.21 billion or 16.70 percent. Table V.1-13 shows the components of
Buildings.
Department/Office
Amount
(in million
pesos)
Percen-
tage
DPWH 414,587.78 80.51
DA 79,346.96 15.41
DOTC 12,529.41 2.43
DENR 3,230.65 0.63
DAR 2,052.43 0.40
MMDA 952.30 0.18
DOH 801.09 0.16
ARMM 703.69 0.14
OEO 339.70 0.07
DOT 141.96 0.03
DND 113.46 0.02
DEpEd 108.56 0.02
Other Departments 35.13 0.01
Total 514,943.16 100.00
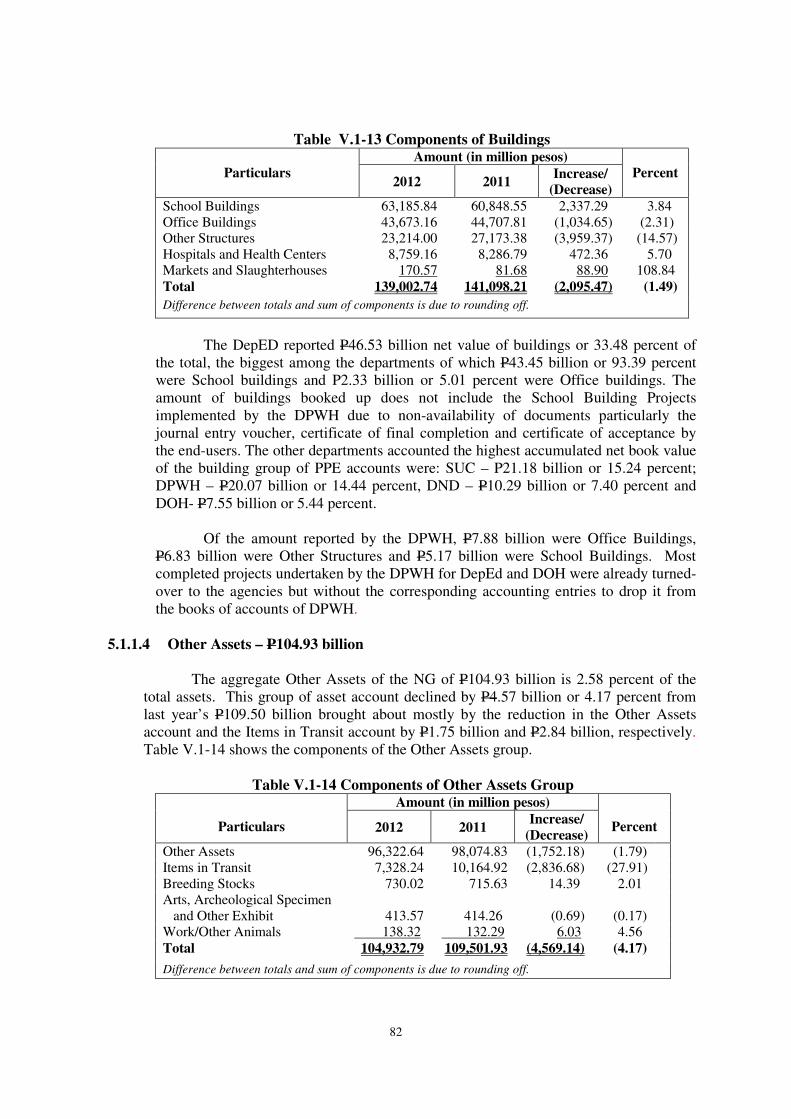
82
Table V.1-13 Components of Buildings
Particulars
Amount (in million pesos)
Percent 2012 2011
Increase/
(Decrease)
School Buildings 63,185.84 60,848.55 2,337.29 3.84
Office Buildings 43,673.16 44,707.81 (1,034.65) (2.31)
Other Structures 23,214.00 27,173.38 (3,959.37) (14.57)
Hospitals and Health Centers 8,759.16 8,286.79 472.36 5.70
Markets and Slaughterhouses 170.57 81.68 88.90 108.84
Total 139,002.74 141,098.21 (2,095.47) (1.49)
Difference between totals and sum of components is due to rounding off.
The DepED reported P46.53 billion net value of buildings or 33.48 percent of
the total, the biggest among the departments of which P43.45 billion or 93.39 percent
were School buildings and P2.33 billion or 5.01 percent were Office buildings. The
amount of buildings booked up does not include the School Building Projects
implemented by the DPWH due to non-availability of documents particularly the
journal entry voucher, certificate of final completion and certificate of acceptance by
the end-users. The other departments accounted the highest accumulated net book value
of the building group of PPE accounts were: SUC – P21.18 billion or 15.24 percent;
DPWH – P20.07 billion or 14.44 percent, DND – P10.29 billion or 7.40 percent and
DOH- P7.55 billion or 5.44 percent.
Of the amount reported by the DPWH, P7.88 billion were Office Buildings,
P6.83 billion were Other Structures and P5.17 billion were School Buildings. Most
completed projects undertaken by the DPWH for DepEd and DOH were already turned-
over to the agencies but without the corresponding accounting entries to drop it from
the books of accounts of DPWH.
5.1.1.4 Other Assets – P104.93 billion
The aggregate Other Assets of the NG of P104.93 billion is 2.58 percent of the
total assets. This group of asset account declined by P4.57 billion or 4.17 percent from
last year’s P109.50 billion brought about mostly by the reduction in the Other Assets
account and the Items in Transit account by P1.75 billion and P2.84 billion, respectively.
Table V.1-14 shows the components of the Other Assets group.
Table V.1-14 Components of Other Assets Group
Particulars
Amount (in million pesos)
Percent 2012 2011 Increase/
(Decrease)
Other Assets 96,322.64 98,074.83 (1,752.18) (1.79)
Items in Transit 7,328.24 10,164.92 (2,836.68) (27.91)
Breeding Stocks 730.02 715.63 14.39 2.01
Arts, Archeological Specimen
and Other Exhibit
413.57
414.26
(0.69)
(0.17)
Work/Other Animals 138.32 132.29 6.03 4.56
Total 104,932.79 109,501.93 (4,569.14) (4.17)
Difference between totals and sum of components is due to rounding off.
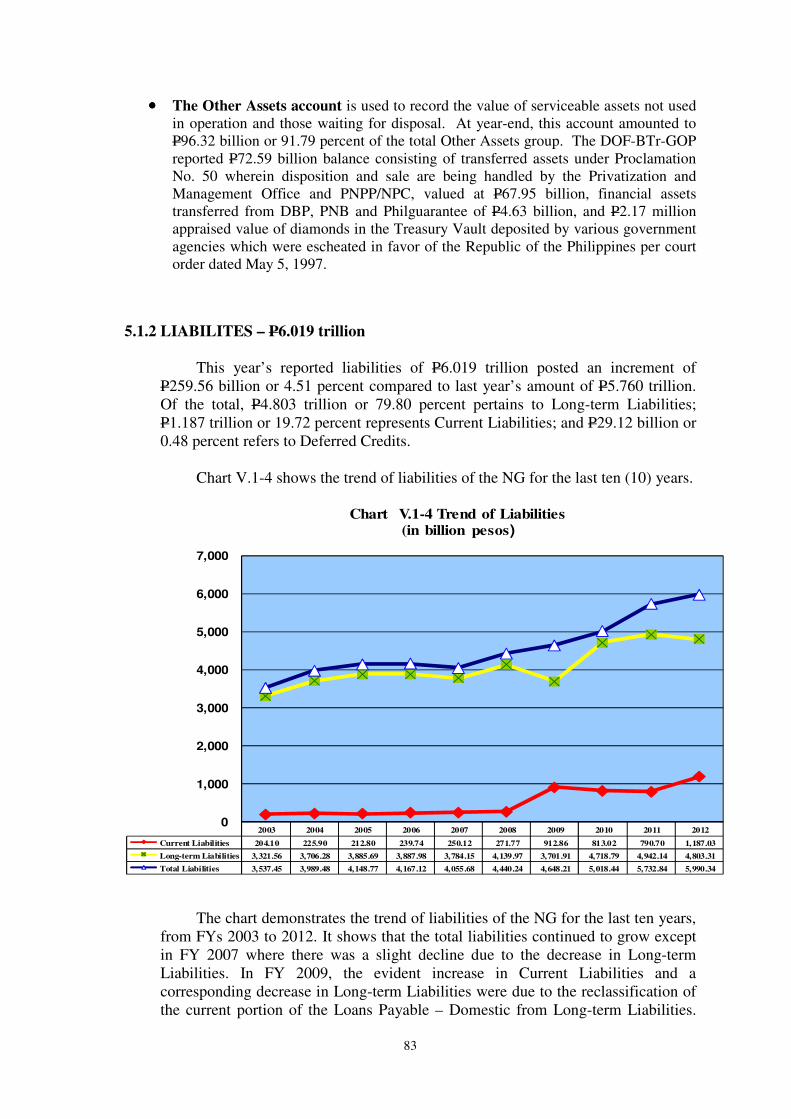
83
•••• The Other Assets account is used to record the value of serviceable assets not used
in operation and those waiting for disposal. At year-end, this account amounted to
P96.32 billion or 91.79 percent of the total Other Assets group. The DOF-BTr-GOP
reported P72.59 billion balance consisting of transferred assets under Proclamation
No. 50 wherein disposition and sale are being handled by the Privatization and
Management Office and PNPP/NPC, valued at P67.95 billion, financial assets
transferred from DBP, PNB and Philguarantee of P4.63 billion, and P2.17 million
appraised value of diamonds in the Treasury Vault deposited by various government
agencies which were escheated in favor of the Republic of the Philippines per court
order dated May 5, 1997.
5.1.2 LIABILITES – P6.019 trillion
This year’s reported liabilities of P6.019 trillion posted an increment of
P259.56 billion or 4.51 percent compared to last year’s amount of P5.760 trillion.
Of the total, P4.803 trillion or 79.80 percent pertains to Long-term Liabilities;
P1.187 trillion or 19.72 percent represents Current Liabilities; and P29.12 billion or
0.48 percent refers to Deferred Credits.
Chart V.1-4 shows the trend of liabilities of the NG for the last ten (10) years.
The chart demonstrates the trend of liabilities of the NG for the last ten years,
from FYs 2003 to 2012. It shows that the total liabilities continued to grow except
in FY 2007 where there was a slight decline due to the decrease in Long-term
Liabilities. In FY 2009, the evident increase in Current Liabilities and a
corresponding decrease in Long-term Liabilities were due to the reclassification of
the current portion of the Loans Payable – Domestic from Long-term Liabilities.
2003 2004 2005 2006 2007 2008 2009 2010 2011 2012
Current Liabilities 204.10 225.90 212.80 239.74 250.12 271.77 912.86 813.02 790.70 1,187.03
Long-term Liabilities 3,321.56 3,706.28 3,885.69 3,887.98 3,784.15 4,139.97 3,701.91 4,718.79 4,942.14 4,803.31
Total Liabilities 3,537.45 3,989.48 4,148.77 4,167.12 4,055.68 4,440.24 4,648.21 5,018.44 5,732.84 5,990.34
0
1,000
2,000
3,000
4,000
5,000
6,000
7,000
Chart V.1-4 Trend of Liabilities(in billion pesos)
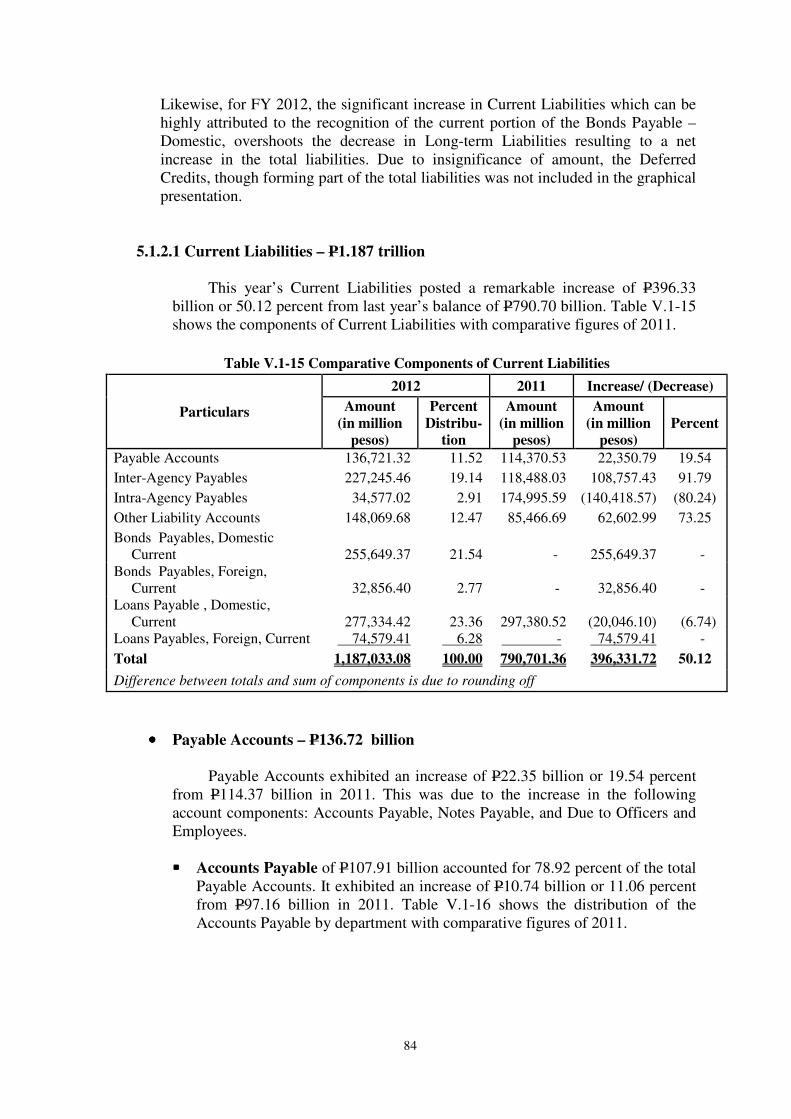
84
Likewise, for FY 2012, the significant increase in Current Liabilities which can be
highly attributed to the recognition of the current portion of the Bonds Payable –
Domestic, overshoots the decrease in Long-term Liabilities resulting to a net
increase in the total liabilities. Due to insignificance of amount, the Deferred
Credits, though forming part of the total liabilities was not included in the graphical
presentation.
5.1.2.1 Current Liabilities – P1.187 trillion
This year’s Current Liabilities posted a remarkable increase of P396.33
billion or 50.12 percent from last year’s balance of P790.70 billion. Table V.1-15
shows the components of Current Liabilities with comparative figures of 2011.
Table V.1-15 Comparative Components of Current Liabilities
Particulars
2012 2011 Increase/ (Decrease)
Amount
(in million
pesos)
Percent
Distribu-
tion
Amount
(in million
pesos)
Amount
(in million
pesos)
Percent
Payable Accounts 136,721.32 11.52 114,370.53 22,350.79 19.54
Inter-Agency Payables 227,245.46 19.14 118,488.03 108,757.43 91.79
Intra-Agency Payables 34,577.02 2.91 174,995.59 (140,418.57) (80.24)
Other Liability Accounts 148,069.68 12.47 85,466.69 62,602.99 73.25
Bonds Payables, Domestic
Current
255,649.37
21.54
-
255,649.37
-
Bonds Payables, Foreign,
Current
32,856.40
2.77
-
32,856.40
-
Loans Payable , Domestic,
Current
277,334.42
23.36
297,380.52
(20,046.10)
(6.74)
Loans Payables, Foreign, Current 74,579.41 6.28 - 74,579.41 -
Total 1,187,033.08 100.00 790,701.36 396,331.72 50.12
Difference between totals and sum of components is due to rounding off
•••• Payable Accounts – P136.72 billion
Payable Accounts exhibited an increase of P22.35 billion or 19.54 percent
from P114.37 billion in 2011. This was due to the increase in the following
account components: Accounts Payable, Notes Payable, and Due to Officers and
Employees.
���� Accounts Payable of P107.91 billion accounted for 78.92 percent of the total
Payable Accounts. It exhibited an increase of P10.74 billion or 11.06 percent
from P97.16 billion in 2011. Table V.1-16 shows the distribution of the
Accounts Payable by department with comparative figures of 2011.
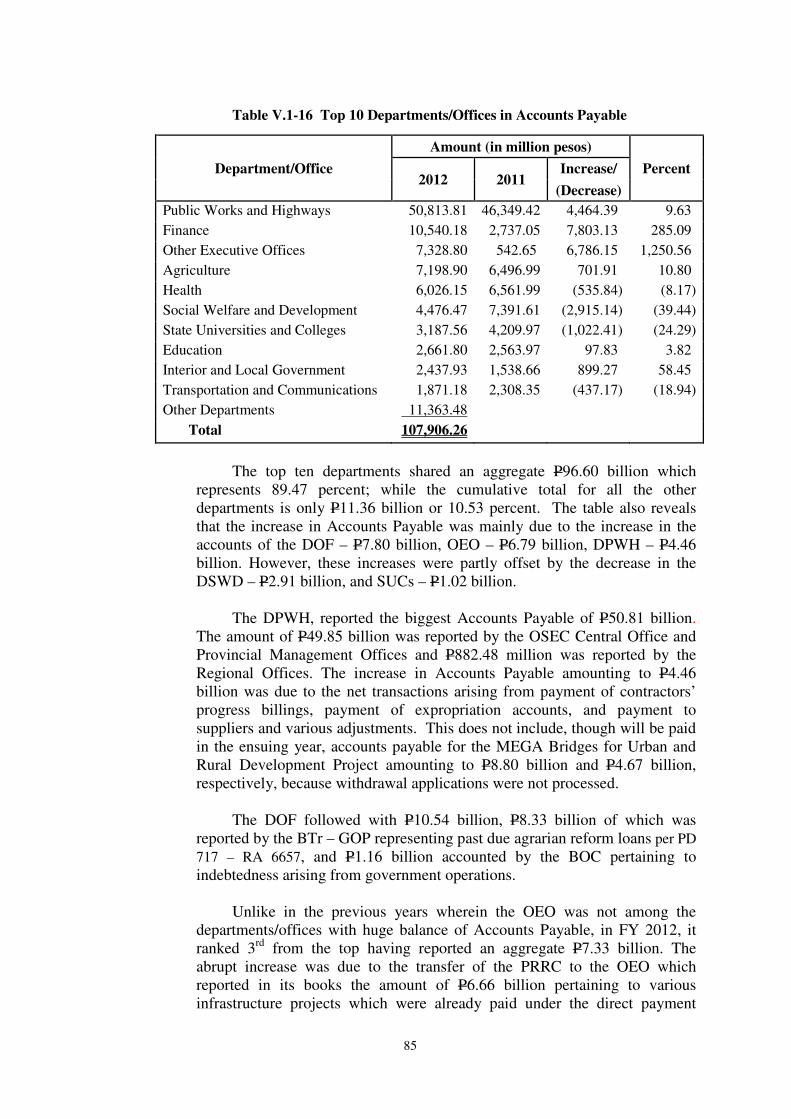
85
Table V.1-16 Top 10 Departments/Offices in Accounts Payable
Department/Office
Amount (in million pesos)
2012 2011 Increase/ Percent
(Decrease)
Public Works and Highways 50,813.81 46,349.42 4,464.39 9.63
Finance 10,540.18 2,737.05 7,803.13 285.09
Other Executive Offices 7,328.80 542.65 6,786.15 1,250.56
Agriculture 7,198.90 6,496.99 701.91 10.80
Health 6,026.15 6,561.99 (535.84) (8.17)
Social Welfare and Development 4,476.47 7,391.61 (2,915.14) (39.44)
State Universities and Colleges 3,187.56 4,209.97 (1,022.41) (24.29)
Education 2,661.80 2,563.97 97.83 3.82
Interior and Local Government 2,437.93 1,538.66 899.27 58.45
Transportation and Communications 1,871.18 2,308.35 (437.17) (18.94)
Other Departments 11,363.48
Total 107,906.26
The top ten departments shared an aggregate P96.60 billion which
represents 89.47 percent; while the cumulative total for all the other
departments is only P11.36 billion or 10.53 percent. The table also reveals
that the increase in Accounts Payable was mainly due to the increase in the
accounts of the DOF – P7.80 billion, OEO – P6.79 billion, DPWH – P4.46
billion. However, these increases were partly offset by the decrease in the
DSWD – P2.91 billion, and SUCs – P1.02 billion.
The DPWH, reported the biggest Accounts Payable of P50.81 billion.
The amount of P49.85 billion was reported by the OSEC Central Office and
Provincial Management Offices and P882.48 million was reported by the
Regional Offices. The increase in Accounts Payable amounting to P4.46
billion was due to the net transactions arising from payment of contractors’
progress billings, payment of expropriation accounts, and payment to
suppliers and various adjustments. This does not include, though will be paid
in the ensuing year, accounts payable for the MEGA Bridges for Urban and
Rural Development Project amounting to P8.80 billion and P4.67 billion,
respectively, because withdrawal applications were not processed.
The DOF followed with P10.54 billion, P8.33 billion of which was
reported by the BTr – GOP representing past due agrarian reform loans per PD
717 – RA 6657, and P1.16 billion accounted by the BOC pertaining to
indebtedness arising from government operations.
Unlike in the previous years wherein the OEO was not among the
departments/offices with huge balance of Accounts Payable, in FY 2012, it
ranked 3rd
from the top having reported an aggregate P7.33 billion. The
abrupt increase was due to the transfer of the PRRC to the OEO which
reported in its books the amount of P6.66 billion pertaining to various
infrastructure projects which were already paid under the direct payment
86
scheme charged against the ADB loan and Belgian Super Subsidy Facility
loan but cannot be dropped from the books because of the absence of the
Notice of NCAA from the DBM.
The DA had an accumulated balance of P7.20 billion in Accounts
Payable, P6.59 billion of which represents unreleased checks for due and
demandable obligations to creditors. The OSEC reported P1.24 which
represents the accounts paid by the bank under the direct payment scheme but
remained outstanding in the books due to the non-issuance of the NCAA by
the DBM. The bulk of the balances per project pertain to the following: NIA
– P3.78 billion, RFU XIII– P267.33 million, MRDP – P143.89 million, and
BSWM – P122.99 million.
The DOH has an outstanding Accounts Payable in the amount of P6.03
billion. Of this amount, the OSEC reported P5.96 billion which pertain to
purchases of inventories and PPE on account and unpaid contracts for
services.
The DSWD’s P4.48 billion in Accounts Payable includes P3.87 billion
representing various claims of creditors and unpaid cash grants of the
beneficiaries of Pantawid Pamilyang Pilipino Program, and unreleased checks
of P605.37 million subject for reversion in the ensuing year.
The SUCs recorded a total of P3.19 billion in Accounts Payable. Of this
amount, P2.63 billion or 82.44 percent was accounted by the University of the
Philippines and the remaining P557.25 million or 17.56 percent was
distributed among 99 other SUCs; thus, 12 SUCs do not have accounts
payable or unpaid obligations as of the end of the year.
The DepEd has an accumulated balance of Accounts Payable amounting
to P2.62 billion. Of this amount, a total of P2.38 billion was reported by the
Regional Offices, and P235.92 million was recorded in the books of the
OSEC, its bureaus and attached agencies.
The DILG reported outstanding Payable Accounts totaling to P2.44
billion. The sum of P2.21 billion was accounted in the books of the PNP
where the bulk of P1.97 billion was reported as obligations/payable of NHQ.
The DOTC ranked number 10 among the departments with the highest
Accounts Payable. It reported a balance of P1.87 billion as of yearend. Per
report of the OSEC, the amount of P916.59 refers to obligations to external
creditors for goods delivered and services rendered.
���� Notes Payable with a balance of P16.73 billion represents 12.24 percent of
the total Payable Accounts. It showed a substantial increase of P9.59 billion
or 134.12 percent from the 2011 figure of P7.15 billion. The BTr – GOP
declared that P16.71 billion or 99.88 percent refers primarily to promissory
notes issued to BSP, Multilateral Investment Guaranty Agency (MIGA),
Asian Development Bank (ADB), International Monetary Fund (IMF), and
87
International Bank for Reconstruction and Development (IBRD) for payment
of subscription to the capital stock.
���� Due to Officers and Employees of P11.71 billion shared 8.57 percent of the
total Payable Accounts which increased by P2.18 billion or 22.90 percent
from P9.53 billion in 2011. It represents unpaid salaries, fringe benefits and
other emoluments, and other unpaid obligations due to officers and
employees of NGAs.
The bulk of this payable account was accounted in the books of the
following departments: DILG – P4.16 billion, DepEd – P2.45 billion, and
DND – P2.28 billion.
Under the DILG, the PNP reported P4.02 billion payable to PNP
personnel as of the end of the year, P3.89 billion or 96.77 percent of which
was reported for the NHQ.
���� Interest Payable totaling P367.31 million was reported by the BTR-GOP
representing accrued interest on over-the-counter sale of domestic bonds.
This amount registered a decrease of P160.37 million or 30.39 percent from
last year’s P527.68 million.
•••• Inter-Agency Payables – P227.25 billion
Inter-Agency Payables pertain to liabilities that subsist between NGAs,
LGUs and GOCCs as of the end of the year. This group of liability accounts
showed an increase of P108.76 billion or 91.79 percent from last year’s P118.49
billion. This was mainly due to the increase in four accounts: Due to Other
NGAs – P72.78 billion, Due to Other GOCCs – P22.65 billion, Due to National
Treasury – P11.29 billion, Due to LGUs – P1.13 billion.
���� Due to the National Treasury in the total amount of P33.57 billion is 14.77
percent of the total inter-agency payables. Main contributors to this account
are the DOF – P15.66 billion and the DOE – P14.59 billion. Specifically the
BIR reported a total of P14.52 billion which refer to balances of collections in
the prior years which are still being reconciled with the BTr. In the books of
the DOE, P14.58 billion pertains to revenues/receivables representing
government share/royalties from service/operating contracts and other
fees/charges/penalties collected. The amount was adjusted by P13.82 billion
in April, 2013.
���� Due to BIR of P3.43 billion constitutes 1.51 percent of the total inter-agency
payables. This account refers to unremitted withholding taxes from salaries of
officers and employees and from claims of suppliers, contractors, and other
creditors.
���� Due to GSIS, PHILHEALTH, and PAG-IBIG had balances of P5.19
billion, P967.11 million, and P370.24 million, respectively. These accounts
which totaled P6.53 billion represent 2.87 percent of the total inter-agency
88
payables. They represent mandatory contributions for GSIS life and
retirement insurance premiums, PHILHEALTH and PAG-IBIG premiums,
including government shares, and deductions for payment of various loans
which were unremitted as of the end of the year.
���� Due to Other NGAs in the total amount of P126.02 billion shared 55.45
percent of inter-agency payables. A remarkable increase of P72.78 billion or
136.72 percent from last year’s P53.23 billion was noted for this account.
The DOF-BTR accounted a large portion of the account amounting to P91.17
billion or 72.35 percent.
���� Due to Other GOCCs with an outstanding balance of P50.35 billion
represents 22.16 percent of the total inter-agency payables. It registered a
significant increase of P22.65 billion or 81.78 percent from P27.70 billion in
2011. The bulk of this account amounting to P45.74 billion representing
90.84 percent was reported by the DOF-BTR as follows:
The DFA also accounted in its books P2.91 billion representing 5.78
percent which includes the amounts due the Bangko Sentral ng Pilipinas
(Fiscal Agency Service) for currency remittances to various Foreign Service
Posts.
The total of P1.70 billion or 3.38 percent was shared by the other
departments/offices.
Particulars
Amount
(in million
pesos)
1. NG Subsidy and Equity to GOCCs under the Disbursement
Acceleration Program
15,547.55
2. NG Relending to PSALM for the payment of NG advances for its
IPPs Projects
12,501.54
3. NG Payable to the BSP representing IMF revaluation of the
Special Drawing Rights in Philippine Peso
9,416.98
4. Managed funds and escrow account held by the NG for Bond
Sinking Fund, DRF and other GOCCs
6,791.90
5. Collateral deposit of GOCCs under the 1992 Philippine Financing
Plan
868.17
6. Withheld tax from PDIC on its investments in government
securities pending release of SARO for tax subsidy
384.89
7. Balance of proceeds from the drawing of the US$120.0 million
Performance Bond/Irrevocable Standby Letter of Credit put up by
the Maynilad Water Services, Inc. to secure its Concession Fee
liabilities with MWSS
133.30
8. Philippine Coconut Authority collections 53.65
9. NG liability to the Social Security System relative to the accrued
interest due to delayed payment of dividends to PNB shares
43.06
Total 45,741.05
Difference between totals and sum of components is due to rounding off

89
���� Due to LGUs of P7.35 billion constitutes 3.23 percent of the total inter-
agency payables. Of the total amount, the DOE reported P4.79 billion
equivalent to 64.99 percent which represents funds available to implement
projects under the Energy Regulatory 1-94.
The DBM also reported a huge balance of P1.22 billion which
represents the unreleased authorized share of LGUs in IRA, national wealth,
value added tax for the years 2000 to 2006. These shares were not authorized
by the DBM to be reverted per memorandum dated December 5, 2011;
however, in view of the Audit Observation Memorandum issued by the COA
Auditor on dormant accounts instructions were requested from the
Undersecretary for resolution.
The schedule of Inter-agency Payables by department/office/agency and
by account is shown in Schedule 24, Volume I-B.
•••• Intra-Agency Payables – P34.58 billion
Intra-agency payables are reciprocal accounts that subsist between the
Central Office, Regional Offices/Staff Bureaus and Operating Units, and other
funds within the agency. This group of accounts with an accumulated balance of
P34.58 billion showed a decline of P140.42 billion or 80.24 percent from last
year’s level of P175.00 billion. The decline was due to the decreases in Due to
Other Funds by P135.31 billion or 81.52 percent, Due to Operating Units by
P4.67 billion or 73.90 percent, and Due to Regional Offices by P691.07 million
or 46.28 percent.
Despite the great decline, the Due to Other Funds account has still an
outstanding balance of P30.68 billion as of yearend. The bulk was accounted in
the DOF, particularly, MDFO – P20.39 billion and BOC – P6.50 billion. The
account of the BOC includes mark-up from sale of accountable forms and interest
income from bank accounts which are due for remittance to the BTR and for
recording in the other books or funds. Furthermore, the Due to Operating Units
account has P1.65 billion balance as of the end of the year.
•••• Other Liability Accounts – P148.07 billion
The Other Liability Accounts of the NG comprised: Guaranty Deposits
Payable – P10.42 billion or 7.04 percent, Performance/Bidders/Bail Bonds
Payable – P10.58 billion or 7.14 percent, Tax Refunds Payable – P12.14 billion
or 8.20 percent, and Other Payables – P114.93 billion or 77.62 percent.
■ Guaranty Deposits Payable with a total balance of P10.42 billion decreased
by P4.62 billion or 79.61 percent from last year’s balance of P5.80 billion.
The DPWH has the biggest of this account in the amount of P4.32 billion,
P3.59 billion of which are obligations of the Regional Offices. The DOF also
reported P3.19 billion, P3.12 billion of which was reported by the BTr-GOP,
particularly referring to ARF.
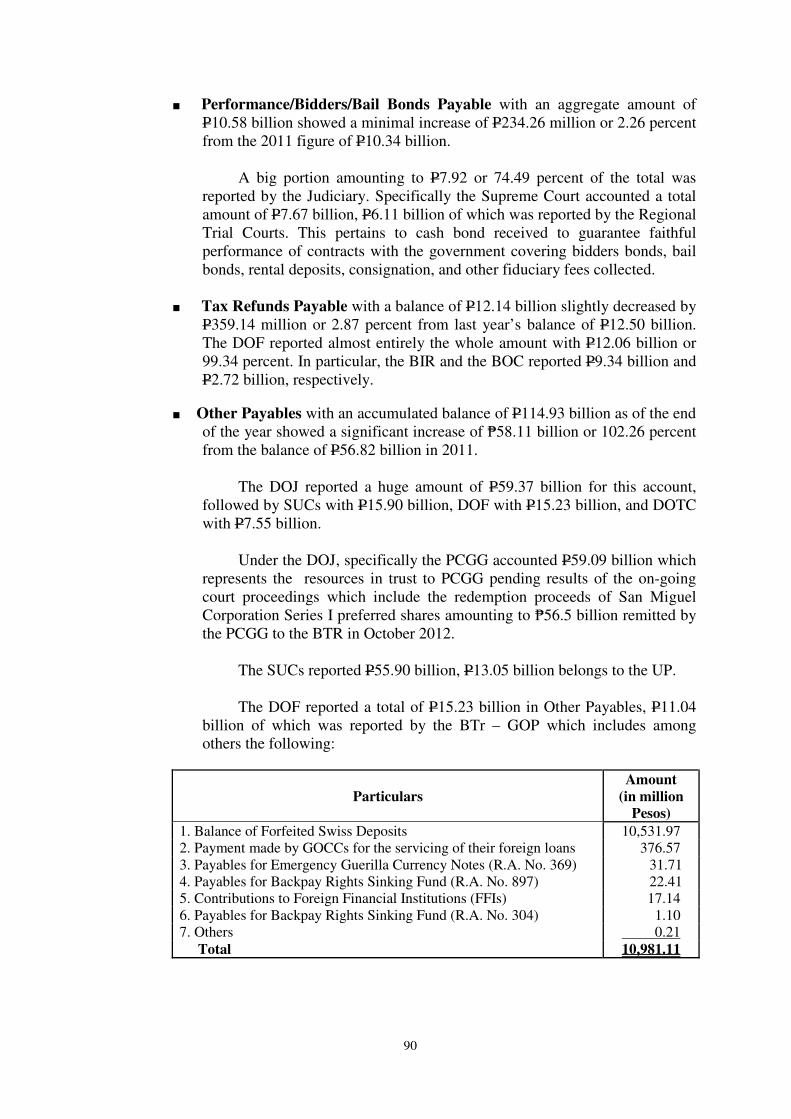
90
■ Performance/Bidders/Bail Bonds Payable with an aggregate amount of
P10.58 billion showed a minimal increase of P234.26 million or 2.26 percent
from the 2011 figure of P10.34 billion.
A big portion amounting to P7.92 or 74.49 percent of the total was
reported by the Judiciary. Specifically the Supreme Court accounted a total
amount of P7.67 billion, P6.11 billion of which was reported by the Regional
Trial Courts. This pertains to cash bond received to guarantee faithful
performance of contracts with the government covering bidders bonds, bail
bonds, rental deposits, consignation, and other fiduciary fees collected.
■ Tax Refunds Payable with a balance of P12.14 billion slightly decreased by
P359.14 million or 2.87 percent from last year’s balance of P12.50 billion.
The DOF reported almost entirely the whole amount with P12.06 billion or
99.34 percent. In particular, the BIR and the BOC reported P9.34 billion and
P2.72 billion, respectively.
■ Other Payables with an accumulated balance of P114.93 billion as of the end
of the year showed a significant increase of ₱58.11 billion or 102.26 percent
from the balance of P56.82 billion in 2011.
The DOJ reported a huge amount of P59.37 billion for this account,
followed by SUCs with P15.90 billion, DOF with P15.23 billion, and DOTC
with P7.55 billion.
Under the DOJ, specifically the PCGG accounted P59.09 billion which
represents the resources in trust to PCGG pending results of the on-going
court proceedings which include the redemption proceeds of San Miguel
Corporation Series I preferred shares amounting to ₱56.5 billion remitted by
the PCGG to the BTR in October 2012.
The SUCs reported P55.90 billion, P13.05 billion belongs to the UP.
The DOF reported a total of P15.23 billion in Other Payables, P11.04
billion of which was reported by the BTr – GOP which includes among
others the following:
Particulars
Amount
(in million
Pesos)
1. Balance of Forfeited Swiss Deposits 10,531.97
2. Payment made by GOCCs for the servicing of their foreign loans 376.57
3. Payables for Emergency Guerilla Currency Notes (R.A. No. 369) 31.71
4. Payables for Backpay Rights Sinking Fund (R.A. No. 897) 22.41
5. Contributions to Foreign Financial Institutions (FFIs) 17.14
6. Payables for Backpay Rights Sinking Fund (R.A. No. 304) 1.10
7. Others 0.21
Total 10,981.11
91
The DOTC accounted P7.55 billion classified as Other Payables. The
bulk of P4.53 billion was reported by the LTO and P3.00 billion was
reported by the DOTC – OSEC.
The Other Payables accounted in the books of the LTO pertains to
collected computerization fees held in escrow on behalf of the LTO – IT
project proponent, STRADCOM Corporation. And the Other Payables of the
OSEC, includes as follows: P2.83 billion which applies to collections from
the operation of the EDSA MRT 3 to be used for the payment of
rental/equity and maintenance fee and other payments enumerated in the
agreement to build, operate and transfer; P57.96 million representing the
peso equivalent of the dollar trust fund received from MRTC for EDSA LRT
III project; and P57.49 million relating to bidding collections to be used to
pay honoraria of BAC members.
The DPWH also reported an amount of P1.10 billion as Other Payables
which includes claims of employees for reserved leaves and terminal pay,
and allowable deductions in the compensation of employees payable to
private companies, claims of public and private establishments for the refund
of cash bonds posted in securing excavation permits and deposits for sub-soil
exploration.
•••• Bonds Payable – Domestic, Current – P255.65 billion
Bonds Payable – Domestic, Current with an outstanding balance of P255.65
billion as of the end of the year represents 21.54 percent of the total Current
Liabilities of the NG. This refers to the Treasury Bonds issued domestically by
the NG, maturity of which is within one year. In FY 2011, no current portion for
this account was recorded in the books of the BTr-GOP.
•••• Bonds Payable – Foreign, Current – P32.86 billion
Bonds Payable – Foreign, Current with a balance of P32.86 billion shares
2.77 percent of the total Current Liabilities of the NG. This amount pertains to
offshore bond floatation of the ROP which is due on February 2013. In FY 2011,
no current portion for this account was recognized by the BTr – GOP.
•••• Loans Payable – Domestic, Current – P277.33 billion
Loans Payable – Domestic, Current recorded at P277.33 billion signifies
23.36 percent of total Current Liabilities. This revealed a decrease by P20.05
billion or 6.74 percent from last year’s figure of P297.38 billion. Details of this
account show that these are treasury bills issued domestically by the NG,
maturity of which is within one year.
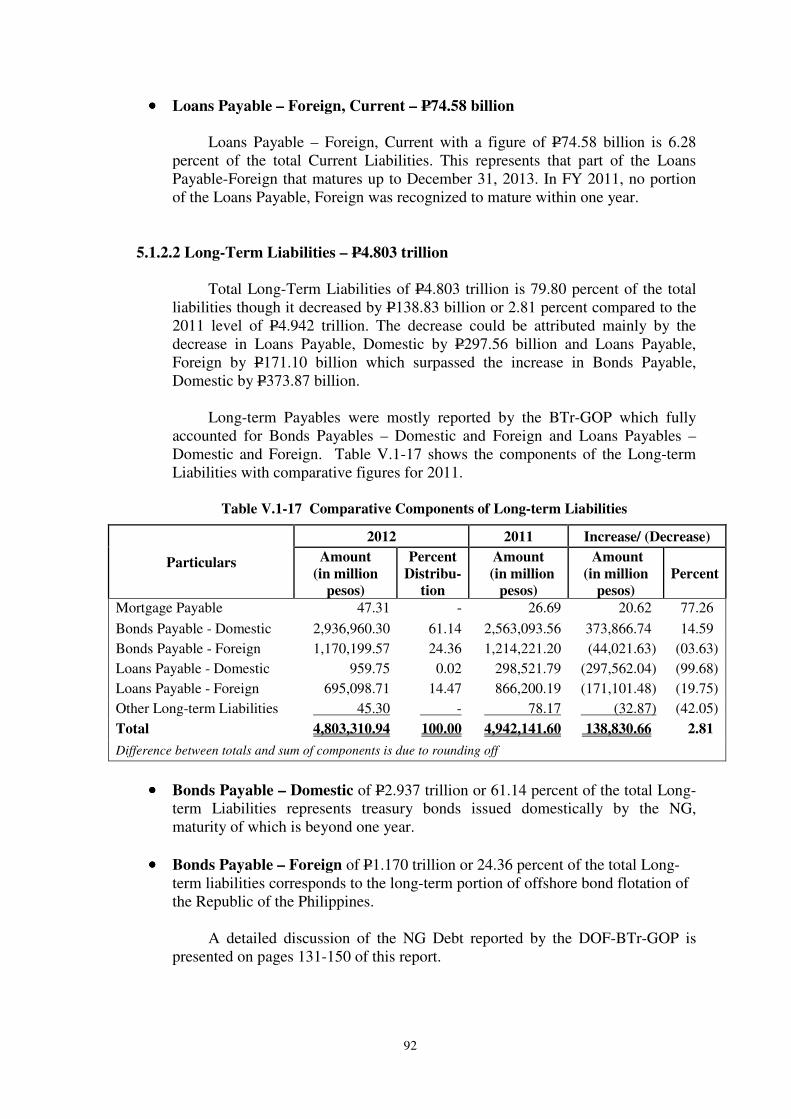
92
•••• Loans Payable – Foreign, Current – P74.58 billion
Loans Payable – Foreign, Current with a figure of P74.58 billion is 6.28
percent of the total Current Liabilities. This represents that part of the Loans
Payable-Foreign that matures up to December 31, 2013. In FY 2011, no portion
of the Loans Payable, Foreign was recognized to mature within one year.
5.1.2.2 Long-Term Liabilities – P4.803 trillion
Total Long-Term Liabilities of P4.803 trillion is 79.80 percent of the total
liabilities though it decreased by P138.83 billion or 2.81 percent compared to the
2011 level of P4.942 trillion. The decrease could be attributed mainly by the
decrease in Loans Payable, Domestic by P297.56 billion and Loans Payable,
Foreign by P171.10 billion which surpassed the increase in Bonds Payable,
Domestic by P373.87 billion.
Long-term Payables were mostly reported by the BTr-GOP which fully
accounted for Bonds Payables – Domestic and Foreign and Loans Payables –
Domestic and Foreign. Table V.1-17 shows the components of the Long-term
Liabilities with comparative figures for 2011.
Table V.1-17 Comparative Components of Long-term Liabilities
Particulars
2012 2011 Increase/ (Decrease)
Amount
(in million
pesos)
Percent
Distribu-
tion
Amount
(in million
pesos)
Amount
(in million
pesos)
Percent
Mortgage Payable 47.31 - 26.69 20.62 77.26
Bonds Payable - Domestic 2,936,960.30 61.14 2,563,093.56 373,866.74 14.59
Bonds Payable - Foreign 1,170,199.57 24.36 1,214,221.20 (44,021.63) (03.63)
Loans Payable - Domestic 959.75 0.02 298,521.79 (297,562.04) (99.68)
Loans Payable - Foreign 695,098.71 14.47 866,200.19 (171,101.48) (19.75)
Other Long-term Liabilities 45.30 - 78.17 (32.87) (42.05)
Total 4,803,310.94 100.00 4,942,141.60 138,830.66 2.81
Difference between totals and sum of components is due to rounding off
•••• Bonds Payable – Domestic of P2.937 trillion or 61.14 percent of the total Long-
term Liabilities represents treasury bonds issued domestically by the NG,
maturity of which is beyond one year.
•••• Bonds Payable – Foreign of P1.170 trillion or 24.36 percent of the total Long-
term liabilities corresponds to the long-term portion of offshore bond flotation of
the Republic of the Philippines.
A detailed discussion of the NG Debt reported by the DOF-BTr-GOP is
presented on pages 131-150 of this report.
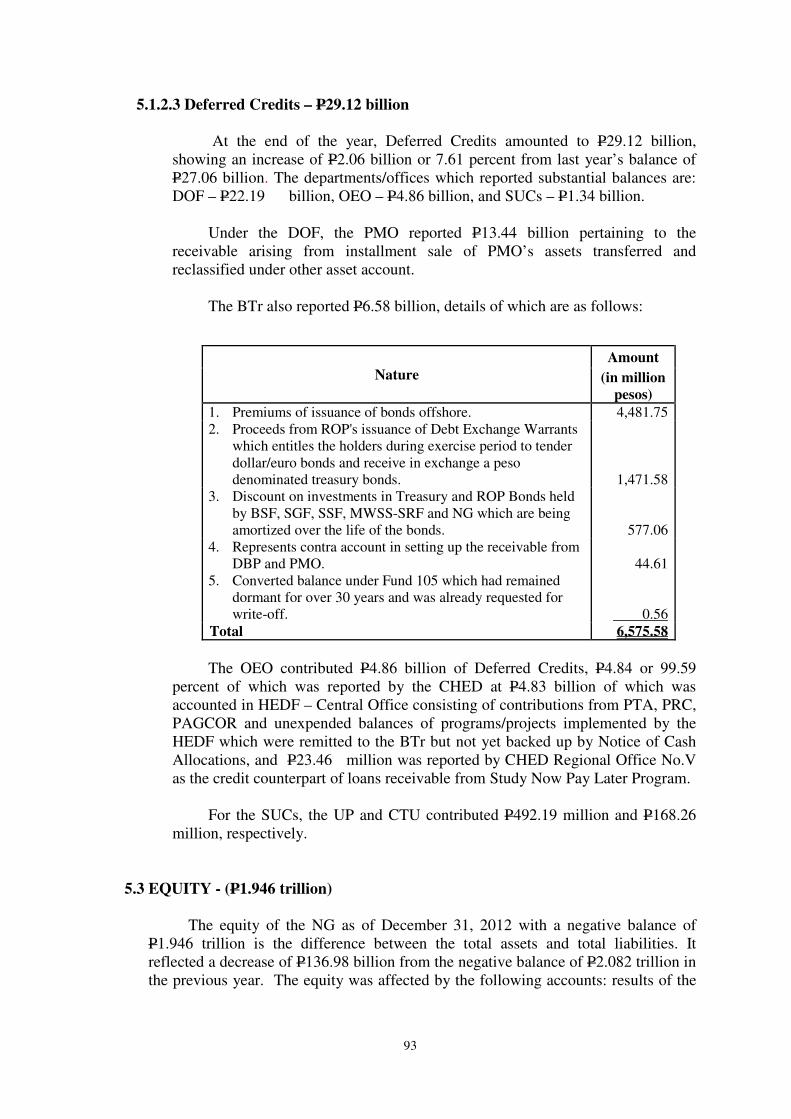
93
5.1.2.3 Deferred Credits – P29.12 billion
At the end of the year, Deferred Credits amounted to P29.12 billion,
showing an increase of P2.06 billion or 7.61 percent from last year’s balance of
P27.06 billion. The departments/offices which reported substantial balances are:
DOF – P22.19 billion, OEO – P4.86 billion, and SUCs – P1.34 billion.
Under the DOF, the PMO reported P13.44 billion pertaining to the
receivable arising from installment sale of PMO’s assets transferred and
reclassified under other asset account.
The BTr also reported P6.58 billion, details of which are as follows:
Nature
Amount
(in million
pesos)
1. Premiums of issuance of bonds offshore. 4,481.75
2. Proceeds from ROP's issuance of Debt Exchange Warrants
which entitles the holders during exercise period to tender
dollar/euro bonds and receive in exchange a peso
denominated treasury bonds.
1,471.58
3. Discount on investments in Treasury and ROP Bonds held
by BSF, SGF, SSF, MWSS-SRF and NG which are being
amortized over the life of the bonds.
577.06
4. Represents contra account in setting up the receivable from
DBP and PMO.
44.61
5. Converted balance under Fund 105 which had remained
dormant for over 30 years and was already requested for
write-off.
0.56
Total 6,575.58
The OEO contributed P4.86 billion of Deferred Credits, P4.84 or 99.59
percent of which was reported by the CHED at P4.83 billion of which was
accounted in HEDF – Central Office consisting of contributions from PTA, PRC,
PAGCOR and unexpended balances of programs/projects implemented by the
HEDF which were remitted to the BTr but not yet backed up by Notice of Cash
Allocations, and P23.46 million was reported by CHED Regional Office No.V
as the credit counterpart of loans receivable from Study Now Pay Later Program.
For the SUCs, the UP and CTU contributed P492.19 million and P168.26
million, respectively.
5.3 EQUITY - (P1.946 trillion)
The equity of the NG as of December 31, 2012 with a negative balance of
P1.946 trillion is the difference between the total assets and total liabilities. It
reflected a decrease of P136.98 billion from the negative balance of P2.082 trillion in
the previous year. The equity was affected by the following accounts: results of the
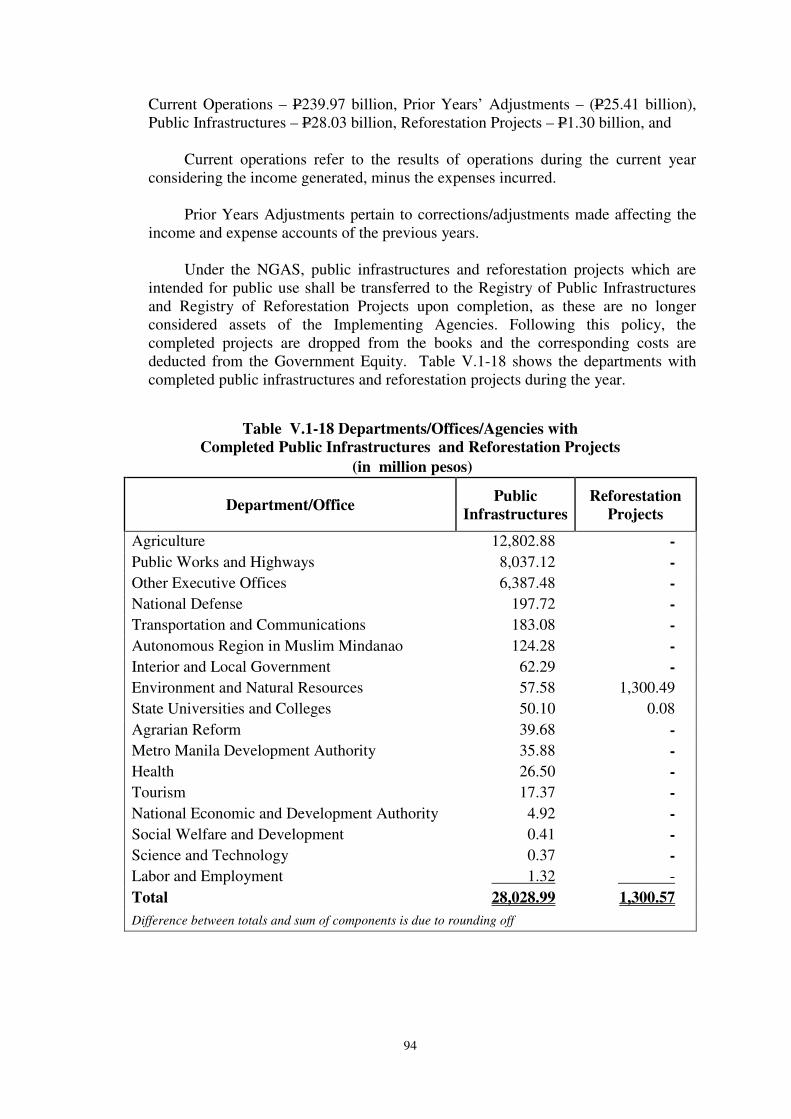
94
Current Operations – P239.97 billion, Prior Years’ Adjustments – (P25.41 billion),
Public Infrastructures – P28.03 billion, Reforestation Projects – P1.30 billion, and
Current operations refer to the results of operations during the current year
considering the income generated, minus the expenses incurred.
Prior Years Adjustments pertain to corrections/adjustments made affecting the
income and expense accounts of the previous years.
Under the NGAS, public infrastructures and reforestation projects which are
intended for public use shall be transferred to the Registry of Public Infrastructures
and Registry of Reforestation Projects upon completion, as these are no longer
considered assets of the Implementing Agencies. Following this policy, the
completed projects are dropped from the books and the corresponding costs are
deducted from the Government Equity. Table V.1-18 shows the departments with
completed public infrastructures and reforestation projects during the year.
Table V.1-18 Departments/Offices/Agencies with
Completed Public Infrastructures and Reforestation Projects
(in million pesos)
Department/Office Public
Infrastructures
Reforestation
Projects
Agriculture 12,802.88 -
Public Works and Highways 8,037.12 -
Other Executive Offices 6,387.48 -
National Defense 197.72 -
Transportation and Communications 183.08 -
Autonomous Region in Muslim Mindanao 124.28 -
Interior and Local Government 62.29 -
Environment and Natural Resources 57.58 1,300.49
State Universities and Colleges 50.10 0.08
Agrarian Reform 39.68 -
Metro Manila Development Authority 35.88 -
Health 26.50 -
Tourism 17.37 -
National Economic and Development Authority 4.92 -
Social Welfare and Development 0.41 -
Science and Technology 0.37 -
Labor and Employment 1.32 -
Total 28,028.99 1,300.57
Difference between totals and sum of components is due to rounding off
95
This year’s completed Public Infrastructures of P28.03 billion decreased by
P3.57 billion or 11.30 percent; while, Reforestation Projects of P1.30 billion
increased by P348.38 million or 36.59 percent from the CY 2011 of P31.60 billion
and P952.19 million, respectively.
The DENR, being the agency responsible for the conservation, management,
development, and proper use of the country’s environment and natural resources
reported P1.30 billion or 99.99 percent for reforestation projects; while, the SUCs,
accounted for P0.08 million or 0.01 percent.
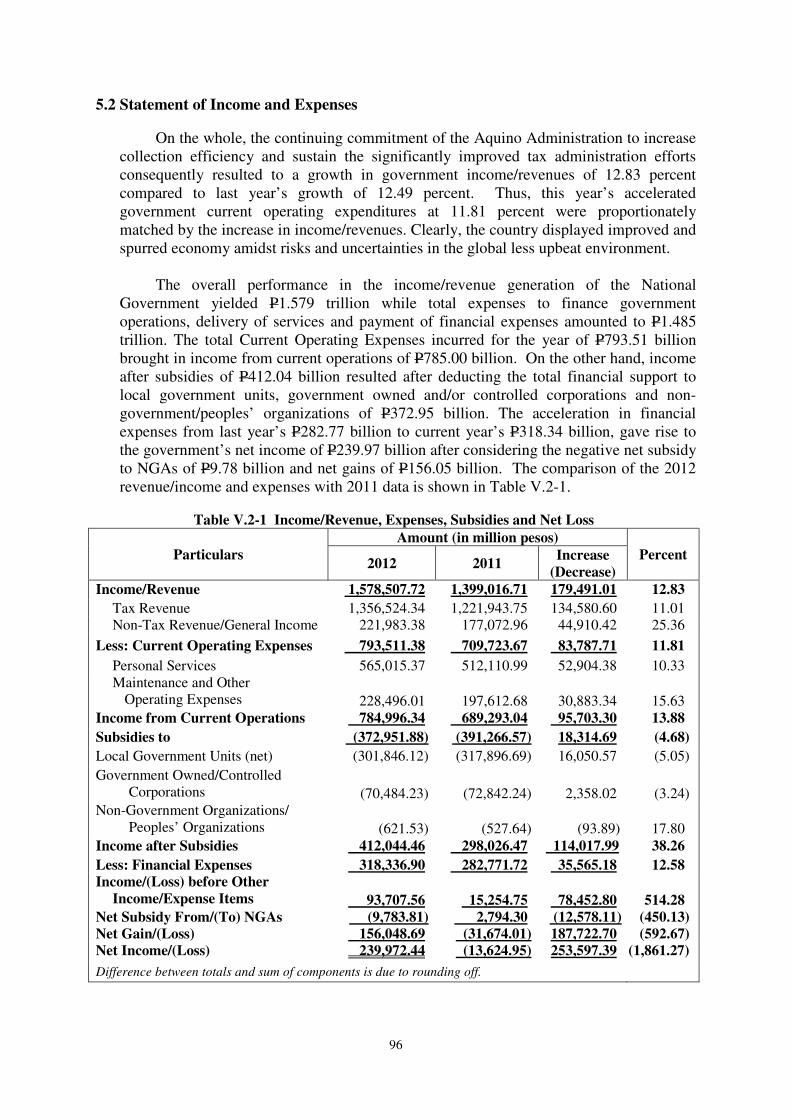
96
5.2 Statement of Income and Expenses
On the whole, the continuing commitment of the Aquino Administration to increase
collection efficiency and sustain the significantly improved tax administration efforts
consequently resulted to a growth in government income/revenues of 12.83 percent
compared to last year’s growth of 12.49 percent. Thus, this year’s accelerated
government current operating expenditures at 11.81 percent were proportionately
matched by the increase in income/revenues. Clearly, the country displayed improved and
spurred economy amidst risks and uncertainties in the global less upbeat environment.
The overall performance in the income/revenue generation of the National
Government yielded P1.579 trillion while total expenses to finance government
operations, delivery of services and payment of financial expenses amounted to P1.485
trillion. The total Current Operating Expenses incurred for the year of P793.51 billion
brought in income from current operations of P785.00 billion. On the other hand, income
after subsidies of P412.04 billion resulted after deducting the total financial support to
local government units, government owned and/or controlled corporations and non-
government/peoples’ organizations of P372.95 billion. The acceleration in financial
expenses from last year’s P282.77 billion to current year’s P318.34 billion, gave rise to
the government’s net income of P239.97 billion after considering the negative net subsidy
to NGAs of P9.78 billion and net gains of P156.05 billion. The comparison of the 2012
revenue/income and expenses with 2011 data is shown in Table V.2-1.
Table V.2-1 Income/Revenue, Expenses, Subsidies and Net Loss
Particulars Amount (in million pesos)
Percent 2012 2011
Increase
(Decrease) Income/Revenue 1,578,507.72 1,399,016.71 179,491.01 12.83
Tax Revenue 1,356,524.34 1,221,943.75 134,580.60 11.01 Non-Tax Revenue/General Income 221,983.38 177,072.96 44,910.42 25.36
Less: Current Operating Expenses 793,511.38 709,723.67 83,787.71 11.81
Personal Services 565,015.37 512,110.99 52,904.38 10.33 Maintenance and Other
Operating Expenses
228,496.01
197,612.68 30,883.34 15.63 Income from Current Operations 784,996.34 689,293.04 95,703.30 13.88
Subsidies to (372,951.88) (391,266.57) 18,314.69 (4.68)
Local Government Units (net) (301,846.12) (317,896.69) 16,050.57 (5.05)
Government Owned/Controlled Corporations
(70,484.23)
(72,842.24)
2,358.02
(3.24)
Non-Government Organizations/ Peoples’ Organizations
(621.53)
(527.64)
(93.89)
17.80
Income after Subsidies 412,044.46 298,026.47 114,017.99 38.26
Less: Financial Expenses 318,336.90 282,771.72 35,565.18 12.58 Income/(Loss) before Other
Income/Expense Items
93,707.56
15,254.75 78,452.80
514.28
Net Subsidy From/(To) NGAs (9,783.81) 2,794.30 (12,578.11) (450.13) Net Gain/(Loss) 156,048.69 (31,674.01) 187,722.70 (592.67) Net Income/(Loss) 239,972.44 (13,624.95) 253,597.39 (1,861.27)
Difference between totals and sum of components is due to rounding off.
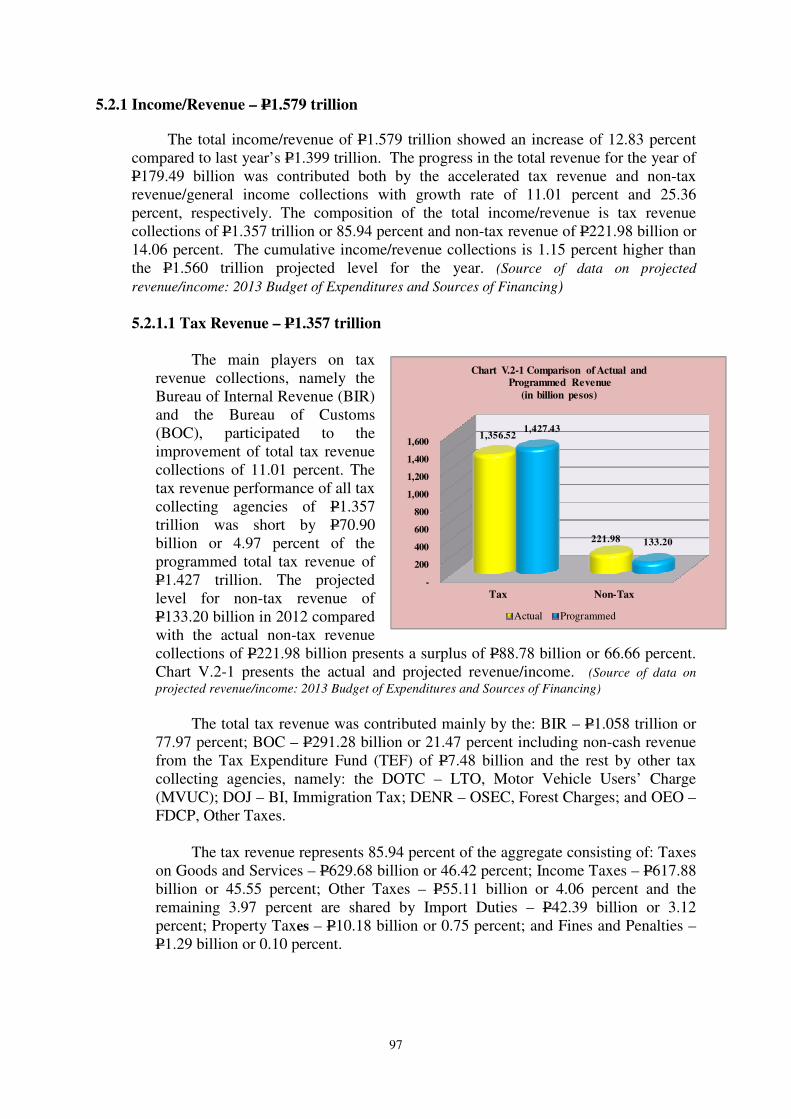
97
5.2.1 Income/Revenue – P1.579 trillion
The total income/revenue of P1.579 trillion showed an increase of 12.83 percent
compared to last year’s P1.399 trillion. The progress in the total revenue for the year of
P179.49 billion was contributed both by the accelerated tax revenue and non-tax
revenue/general income collections with growth rate of 11.01 percent and 25.36
percent, respectively. The composition of the total income/revenue is tax revenue
collections of P1.357 trillion or 85.94 percent and non-tax revenue of P221.98 billion or
14.06 percent. The cumulative income/revenue collections is 1.15 percent higher than
the P1.560 trillion projected level for the year. (Source of data on projected
revenue/income: 2013 Budget of Expenditures and Sources of Financing)
5.2.1.1 Tax Revenue – P1.357 trillion
The main players on tax
revenue collections, namely the
Bureau of Internal Revenue (BIR)
and the Bureau of Customs
(BOC), participated to the
improvement of total tax revenue
collections of 11.01 percent. The
tax revenue performance of all tax
collecting agencies of P1.357
trillion was short by P70.90
billion or 4.97 percent of the
programmed total tax revenue of
P1.427 trillion. The projected
level for non-tax revenue of
P133.20 billion in 2012 compared
with the actual non-tax revenue
collections of P221.98 billion presents a surplus of P88.78 billion or 66.66 percent.
Chart V.2-1 presents the actual and projected revenue/income. (Source of data on
projected revenue/income: 2013 Budget of Expenditures and Sources of Financing)
The total tax revenue was contributed mainly by the: BIR – P1.058 trillion or
77.97 percent; BOC – P291.28 billion or 21.47 percent including non-cash revenue
from the Tax Expenditure Fund (TEF) of P7.48 billion and the rest by other tax
collecting agencies, namely: the DOTC – LTO, Motor Vehicle Users’ Charge
(MVUC); DOJ – BI, Immigration Tax; DENR – OSEC, Forest Charges; and OEO –
FDCP, Other Taxes.
The tax revenue represents 85.94 percent of the aggregate consisting of: Taxes
on Goods and Services – P629.68 billion or 46.42 percent; Income Taxes – P617.88
billion or 45.55 percent; Other Taxes – P55.11 billion or 4.06 percent and the
remaining 3.97 percent are shared by Import Duties – P42.39 billion or 3.12
percent; Property Taxes – P10.18 billion or 0.75 percent; and Fines and Penalties –
P1.29 billion or 0.10 percent.
-
200
400
600
800
1,000
1,200
1,400
1,600
Tax Non-Tax
1,356.52
221.98
1,427.43
133.20
Chart V.2-1 Comparison of Actual and
Programmed Revenue
(in billion pesos)
Actual Programmed
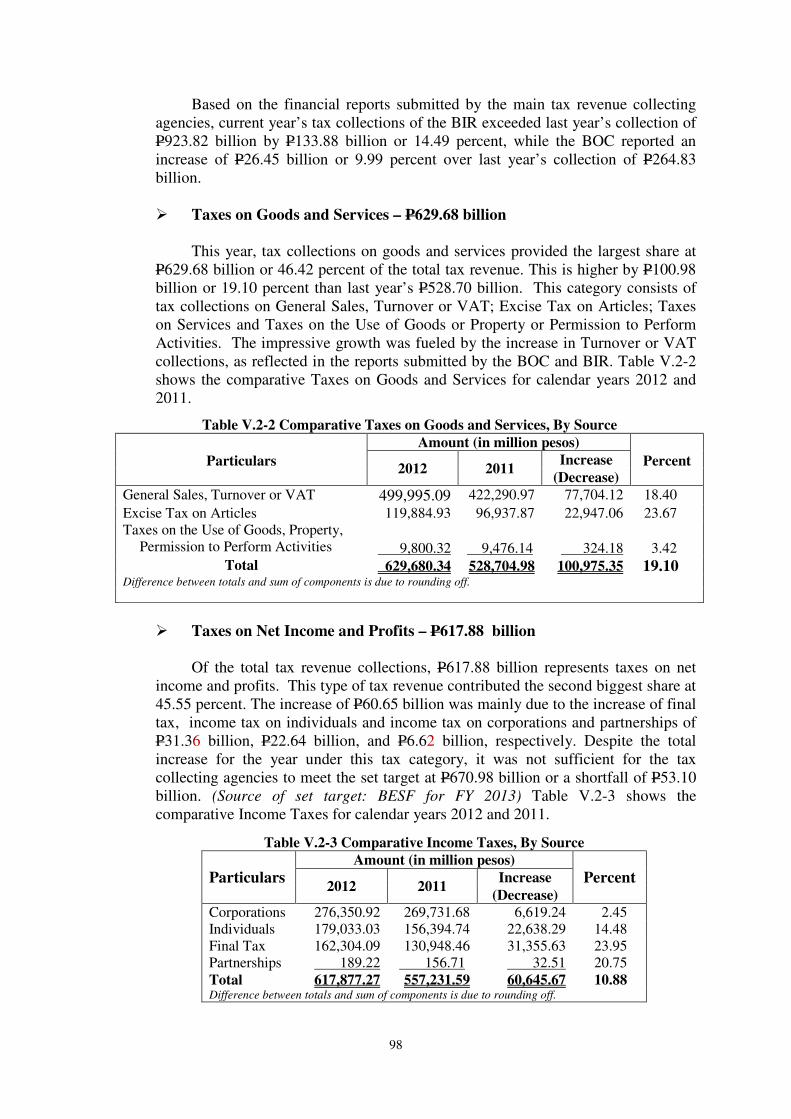
98
Based on the financial reports submitted by the main tax revenue collecting
agencies, current year’s tax collections of the BIR exceeded last year’s collection of
P923.82 billion by P133.88 billion or 14.49 percent, while the BOC reported an
increase of P26.45 billion or 9.99 percent over last year’s collection of P264.83
billion.
� Taxes on Goods and Services – P629.68 billion
This year, tax collections on goods and services provided the largest share at
P629.68 billion or 46.42 percent of the total tax revenue. This is higher by P100.98
billion or 19.10 percent than last year’s P528.70 billion. This category consists of
tax collections on General Sales, Turnover or VAT; Excise Tax on Articles; Taxes
on Services and Taxes on the Use of Goods or Property or Permission to Perform
Activities. The impressive growth was fueled by the increase in Turnover or VAT
collections, as reflected in the reports submitted by the BOC and BIR. Table V.2-2
shows the comparative Taxes on Goods and Services for calendar years 2012 and
2011.
Table V.2-2 Comparative Taxes on Goods and Services, By Source
Particulars
Amount (in million pesos) Percent
2012 2011 Increase
(Decrease) General Sales, Turnover or VAT 499,995.09 422,290.97 77,704.12 18.40
Excise Tax on Articles 119,884.93 96,937.87 22,947.06 23.67 Taxes on the Use of Goods, Property,
Permission to Perform Activities
9,800.32
9,476.14
324.18 3.42 Total 629,680.34 528,704.98 100,975.35 19.10
Difference between totals and sum of components is due to rounding off.
� Taxes on Net Income and Profits – P617.88 billion
Of the total tax revenue collections, P617.88 billion represents taxes on net
income and profits. This type of tax revenue contributed the second biggest share at
45.55 percent. The increase of P60.65 billion was mainly due to the increase of final
tax, income tax on individuals and income tax on corporations and partnerships of
P31.36 billion, P22.64 billion, and P6.62 billion, respectively. Despite the total
increase for the year under this tax category, it was not sufficient for the tax
collecting agencies to meet the set target at P670.98 billion or a shortfall of P53.10
billion. (Source of set target: BESF for FY 2013) Table V.2-3 shows the
comparative Income Taxes for calendar years 2012 and 2011.
Table V.2-3 Comparative Income Taxes, By Source
Particulars Amount (in million pesos)
Percent 2012 2011
Increase (Decrease)
Corporations 276,350.92 269,731.68 6,619.24 2.45 Individuals 179,033.03 156,394.74 22,638.29 14.48 Final Tax 162,304.09 130,948.46 31,355.63 23.95 Partnerships 189.22 156.71 32.51 20.75 Total 617,877.27 557,231.59 60,645.67 10.88 Difference between totals and sum of components is due to rounding off.
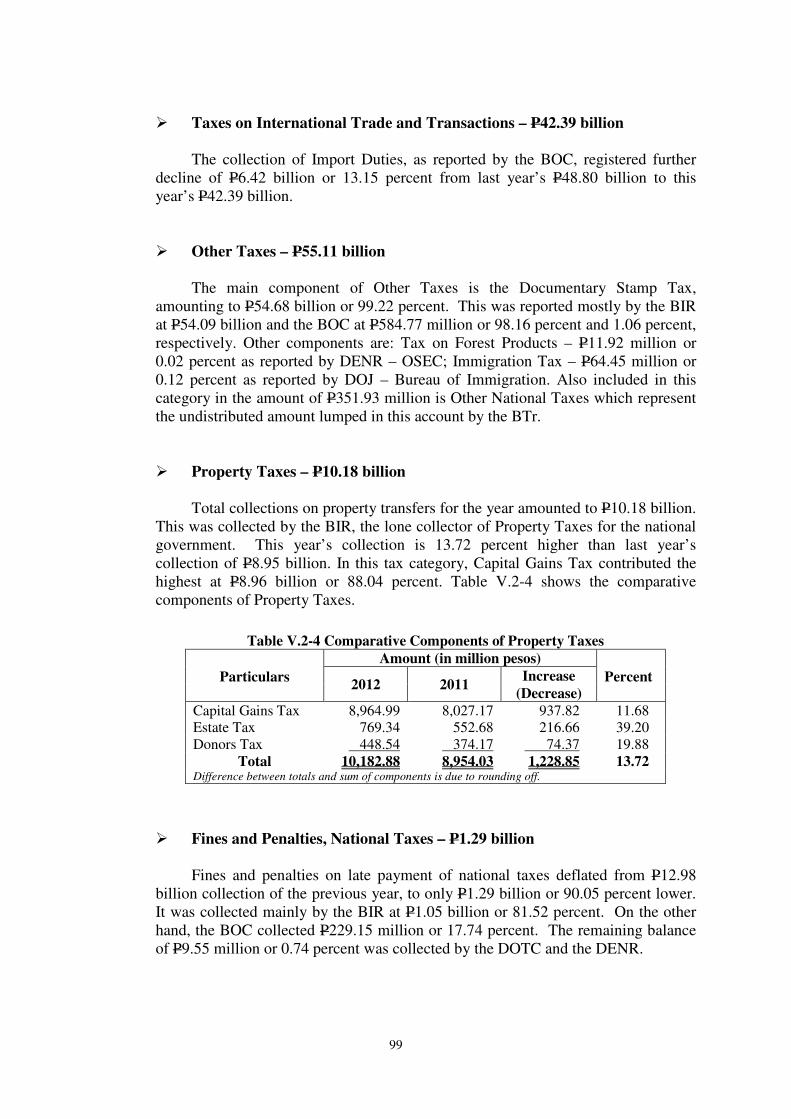
99
� Taxes on International Trade and Transactions – P42.39 billion
The collection of Import Duties, as reported by the BOC, registered further
decline of P6.42 billion or 13.15 percent from last year’s P48.80 billion to this
year’s P42.39 billion.
� Other Taxes – P55.11 billion
The main component of Other Taxes is the Documentary Stamp Tax,
amounting to P54.68 billion or 99.22 percent. This was reported mostly by the BIR
at P54.09 billion and the BOC at P584.77 million or 98.16 percent and 1.06 percent,
respectively. Other components are: Tax on Forest Products – P11.92 million or
0.02 percent as reported by DENR – OSEC; Immigration Tax – P64.45 million or
0.12 percent as reported by DOJ – Bureau of Immigration. Also included in this
category in the amount of P351.93 million is Other National Taxes which represent
the undistributed amount lumped in this account by the BTr.
� Property Taxes – P10.18 billion
Total collections on property transfers for the year amounted to P10.18 billion.
This was collected by the BIR, the lone collector of Property Taxes for the national
government. This year’s collection is 13.72 percent higher than last year’s
collection of P8.95 billion. In this tax category, Capital Gains Tax contributed the
highest at P8.96 billion or 88.04 percent. Table V.2-4 shows the comparative
components of Property Taxes.
� Fines and Penalties, National Taxes – P1.29 billion
Fines and penalties on late payment of national taxes deflated from P12.98
billion collection of the previous year, to only P1.29 billion or 90.05 percent lower.
It was collected mainly by the BIR at P1.05 billion or 81.52 percent. On the other
hand, the BOC collected P229.15 million or 17.74 percent. The remaining balance
of P9.55 million or 0.74 percent was collected by the DOTC and the DENR.
Table V.2-4 Comparative Components of Property Taxes
Particulars
Amount (in million pesos) Percent
2012 2011 Increase
(Decrease) Capital Gains Tax 8,964.99 8,027.17 937.82 11.68 Estate Tax 769.34 552.68 216.66 39.20 Donors Tax 448.54 374.17 74.37 19.88
Total 10,182.88 8,954.03 1,228.85 13.72 Difference between totals and sum of components is due to rounding off.
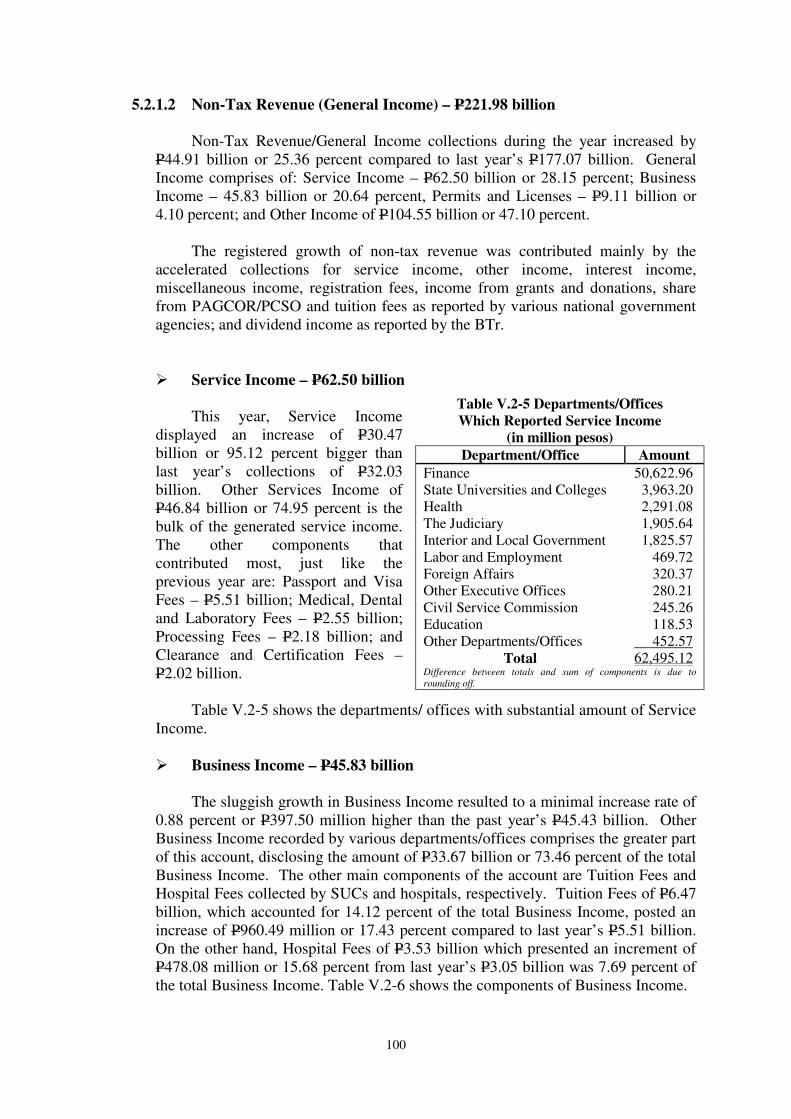
100
5.2.1.2 Non-Tax Revenue (General Income) – P221.98 billion
Non-Tax Revenue/General Income collections during the year increased by
P44.91 billion or 25.36 percent compared to last year’s P177.07 billion. General
Income comprises of: Service Income – P62.50 billion or 28.15 percent; Business
Income – 45.83 billion or 20.64 percent, Permits and Licenses – P9.11 billion or
4.10 percent; and Other Income of P104.55 billion or 47.10 percent.
The registered growth of non-tax revenue was contributed mainly by the
accelerated collections for service income, other income, interest income,
miscellaneous income, registration fees, income from grants and donations, share
from PAGCOR/PCSO and tuition fees as reported by various national government
agencies; and dividend income as reported by the BTr.
� Service Income – P62.50 billion
This year, Service Income
displayed an increase of P30.47
billion or 95.12 percent bigger than
last year’s collections of P32.03
billion. Other Services Income of
P46.84 billion or 74.95 percent is the
bulk of the generated service income.
The other components that
contributed most, just like the
previous year are: Passport and Visa
Fees – P5.51 billion; Medical, Dental
and Laboratory Fees – P2.55 billion;
Processing Fees – P2.18 billion; and
Clearance and Certification Fees –
P2.02 billion.
Table V.2-5 shows the departments/ offices with substantial amount of Service
Income.
� Business Income – P45.83 billion
The sluggish growth in Business Income resulted to a minimal increase rate of
0.88 percent or P397.50 million higher than the past year’s P45.43 billion. Other
Business Income recorded by various departments/offices comprises the greater part
of this account, disclosing the amount of P33.67 billion or 73.46 percent of the total
Business Income. The other main components of the account are Tuition Fees and
Hospital Fees collected by SUCs and hospitals, respectively. Tuition Fees of P6.47
billion, which accounted for 14.12 percent of the total Business Income, posted an
increase of P960.49 million or 17.43 percent compared to last year’s P5.51 billion.
On the other hand, Hospital Fees of P3.53 billion which presented an increment of
P478.08 million or 15.68 percent from last year’s P3.05 billion was 7.69 percent of
the total Business Income. Table V.2-6 shows the components of Business Income.
Table V.2-5 Departments/Offices Which Reported Service Income
(in million pesos) Department/Office Amount
Finance 50,622.96 State Universities and Colleges 3,963.20 Health 2,291.08 The Judiciary 1,905.64 Interior and Local Government 1,825.57 Labor and Employment 469.72 Foreign Affairs 320.37 Other Executive Offices 280.21 Civil Service Commission 245.26 Education 118.53 Other Departments/Offices 452.57
Total 62,495.12 Difference between totals and sum of components is due to
rounding off.
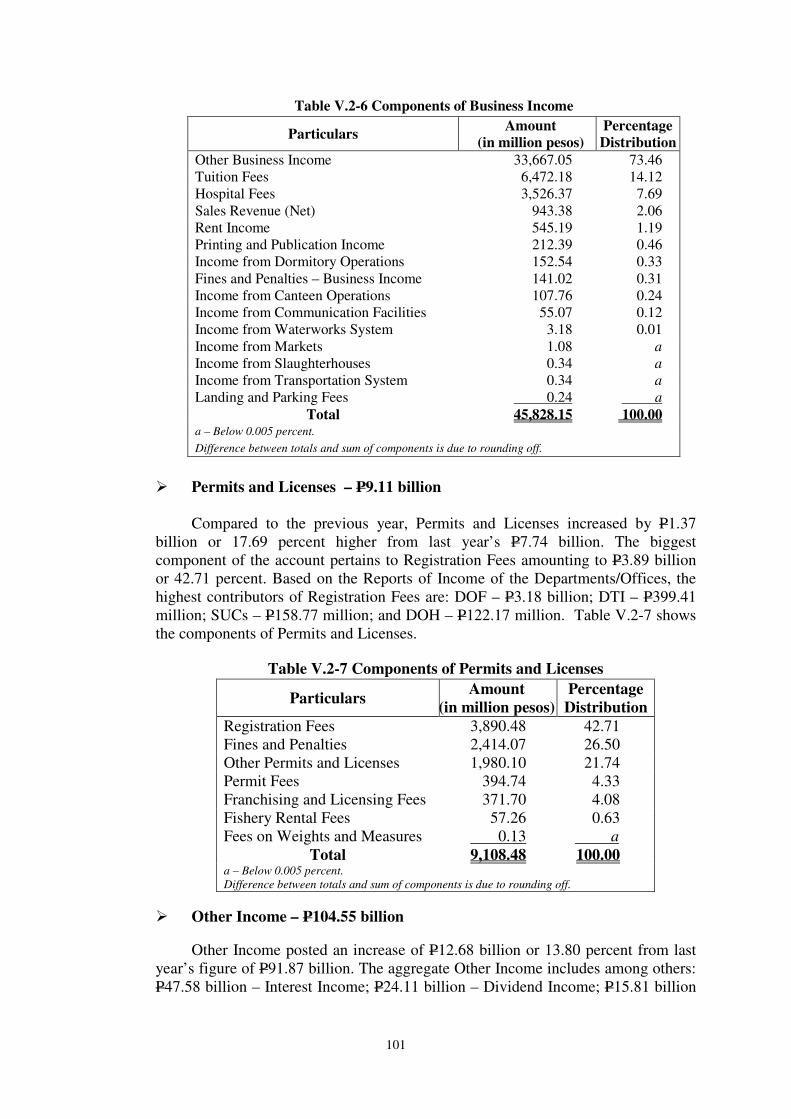
101
� Permits and Licenses – P9.11 billion
Compared to the previous year, Permits and Licenses increased by P1.37
billion or 17.69 percent higher from last year’s P7.74 billion. The biggest
component of the account pertains to Registration Fees amounting to P3.89 billion
or 42.71 percent. Based on the Reports of Income of the Departments/Offices, the
highest contributors of Registration Fees are: DOF – P3.18 billion; DTI – P399.41
million; SUCs – P158.77 million; and DOH – P122.17 million. Table V.2-7 shows
the components of Permits and Licenses.
� Other Income – P104.55 billion
Other Income posted an increase of P12.68 billion or 13.80 percent from last
year’s figure of P91.87 billion. The aggregate Other Income includes among others:
P47.58 billion – Interest Income; P24.11 billion – Dividend Income; P15.81 billion
Table V.2-6 Components of Business Income
Particulars Amount
(in million pesos)
Percentage
Distribution
Other Business Income 33,667.05 73.46
Tuition Fees 6,472.18 14.12
Hospital Fees 3,526.37 7.69
Sales Revenue (Net) 943.38 2.06
Rent Income 545.19 1.19
Printing and Publication Income 212.39 0.46
Income from Dormitory Operations 152.54 0.33
Fines and Penalties – Business Income 141.02 0.31
Income from Canteen Operations 107.76 0.24
Income from Communication Facilities 55.07 0.12
Income from Waterworks System 3.18 0.01
Income from Markets 1.08 a
Income from Slaughterhouses 0.34 a
Income from Transportation System 0.34 a
Landing and Parking Fees 0.24 a
Total 45,828.15 100.00 a – Below 0.005 percent.
Difference between totals and sum of components is due to rounding off.
Table V.2-7 Components of Permits and Licenses
Particulars Amount
(in million pesos)
Percentage
Distribution
Registration Fees 3,890.48 42.71
Fines and Penalties 2,414.07 26.50
Other Permits and Licenses 1,980.10 21.74
Permit Fees 394.74 4.33
Franchising and Licensing Fees 371.70 4.08
Fishery Rental Fees 57.26 0.63
Fees on Weights and Measures 0.13 a
Total 9,108.48 100.00 a – Below 0.005 percent.
Difference between totals and sum of components is due to rounding off.
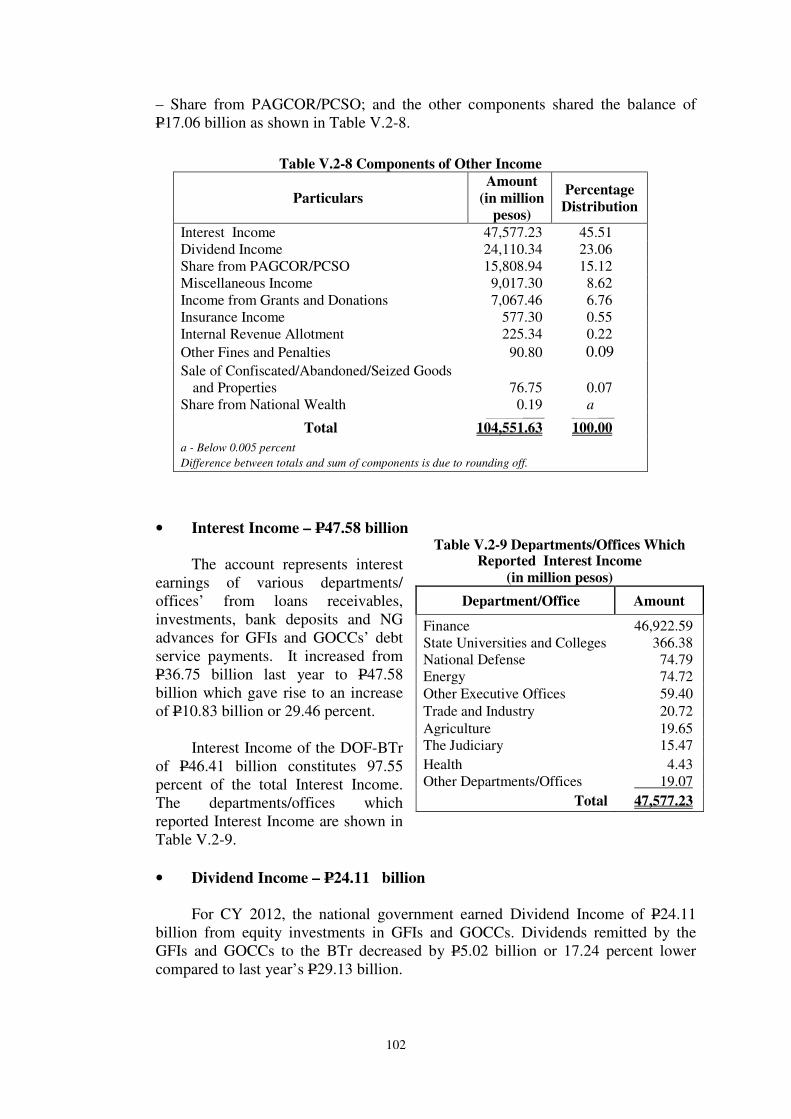
102
– Share from PAGCOR/PCSO; and the other components shared the balance of
P17.06 billion as shown in Table V.2-8.
• Interest Income – P47.58 billion
The account represents interest
earnings of various departments/
offices’ from loans receivables,
investments, bank deposits and NG
advances for GFIs and GOCCs’ debt
service payments. It increased from
P36.75 billion last year to P47.58
billion which gave rise to an increase
of P10.83 billion or 29.46 percent.
Interest Income of the DOF-BTr
of P46.41 billion constitutes 97.55
percent of the total Interest Income.
The departments/offices which
reported Interest Income are shown in
Table V.2-9.
• Dividend Income – P24.11 billion
For CY 2012, the national government earned Dividend Income of P24.11
billion from equity investments in GFIs and GOCCs. Dividends remitted by the
GFIs and GOCCs to the BTr decreased by P5.02 billion or 17.24 percent lower
compared to last year’s P29.13 billion.
Table V.2-8 Components of Other Income
Particulars Amount
(in million
pesos)
Percentage
Distribution
Interest Income 47,577.23 45.51 Dividend Income 24,110.34 23.06 Share from PAGCOR/PCSO 15,808.94 15.12 Miscellaneous Income 9,017.30 8.62 Income from Grants and Donations 7,067.46 6.76 Insurance Income 577.30 0.55 Internal Revenue Allotment 225.34 0.22
Other Fines and Penalties 90.80 0.09
Sale of Confiscated/Abandoned/Seized Goods
and Properties
76.75 0.07 Share from National Wealth 0.19 a ________ _ ______
Total 104,551.63 100.00
a - Below 0.005 percent Difference between totals and sum of components is due to rounding off.
Table V.2-9 Departments/Offices Which Reported Interest Income
(in million pesos)
Department/Office Amount
Finance 46,922.59 State Universities and Colleges 366.38 National Defense 74.79 Energy 74.72 Other Executive Offices 59.40 Trade and Industry 20.72 Agriculture 19.65 The Judiciary 15.47
Health 4.43 Other Departments/Offices 19.07
Total 47,577.23
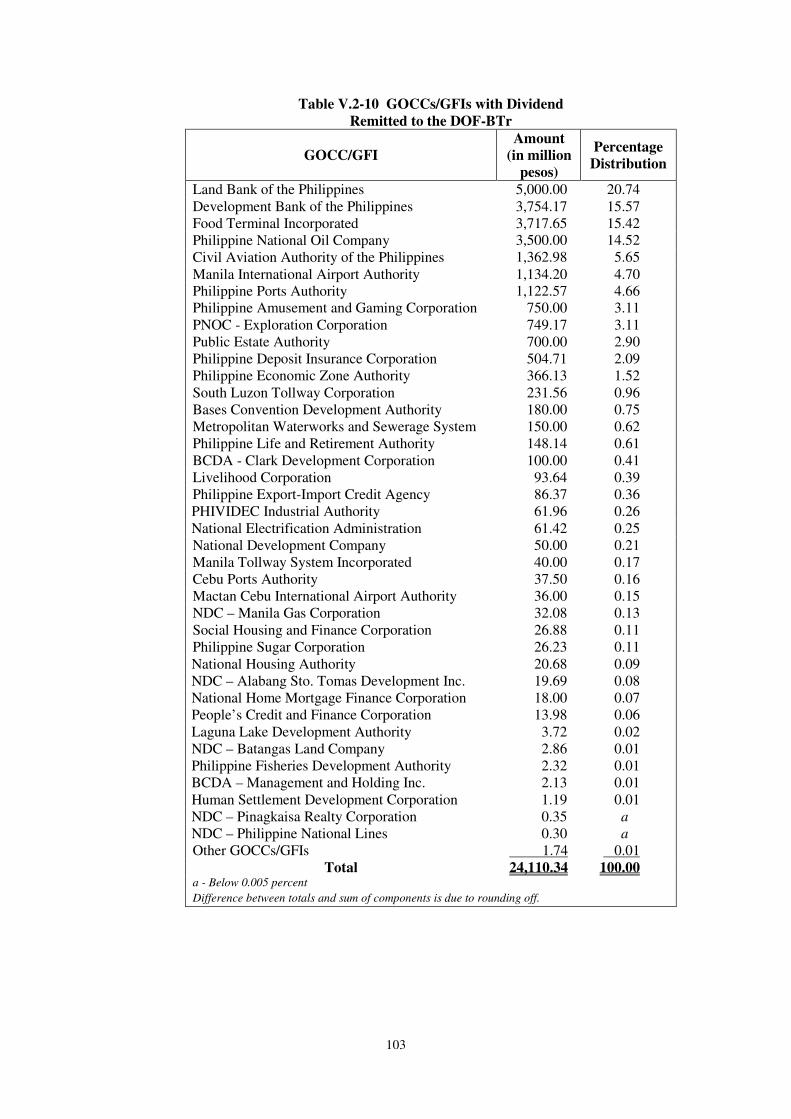
103
Table V.2-10 GOCCs/GFIs with Dividend
Remitted to the DOF-BTr
GOCC/GFI
Amount
(in million
pesos)
Percentage
Distribution
Land Bank of the Philippines 5,000.00 20.74
Development Bank of the Philippines 3,754.17 15.57
Food Terminal Incorporated 3,717.65 15.42
Philippine National Oil Company 3,500.00 14.52
Civil Aviation Authority of the Philippines 1,362.98 5.65
Manila International Airport Authority 1,134.20 4.70
Philippine Ports Authority 1,122.57 4.66
Philippine Amusement and Gaming Corporation 750.00 3.11
PNOC - Exploration Corporation 749.17 3.11
Public Estate Authority 700.00 2.90
Philippine Deposit Insurance Corporation 504.71 2.09
Philippine Economic Zone Authority 366.13 1.52
South Luzon Tollway Corporation 231.56 0.96
Bases Convention Development Authority 180.00 0.75
Metropolitan Waterworks and Sewerage System 150.00 0.62
Philippine Life and Retirement Authority 148.14 0.61
BCDA - Clark Development Corporation 100.00 0.41
Livelihood Corporation 93.64 0.39
Philippine Export-Import Credit Agency 86.37 0.36
PHIVIDEC Industrial Authority 61.96 0.26
National Electrification Administration 61.42 0.25
National Development Company 50.00 0.21
Manila Tollway System Incorporated 40.00 0.17
Cebu Ports Authority 37.50 0.16
Mactan Cebu International Airport Authority 36.00 0.15
NDC – Manila Gas Corporation 32.08 0.13
Social Housing and Finance Corporation 26.88 0.11
Philippine Sugar Corporation 26.23 0.11
National Housing Authority 20.68 0.09
NDC – Alabang Sto. Tomas Development Inc. 19.69 0.08
National Home Mortgage Finance Corporation 18.00 0.07
People’s Credit and Finance Corporation 13.98 0.06
Laguna Lake Development Authority 3.72 0.02
NDC – Batangas Land Company 2.86 0.01
Philippine Fisheries Development Authority 2.32 0.01
BCDA – Management and Holding Inc. 2.13 0.01
Human Settlement Development Corporation 1.19 0.01
NDC – Pinagkaisa Realty Corporation 0.35 a
NDC – Philippine National Lines 0.30 a
Other GOCCs/GFIs 1.74 0.01
Total 24,110.34 100.00 a - Below 0.005 percent
Difference between totals and sum of components is due to rounding off.
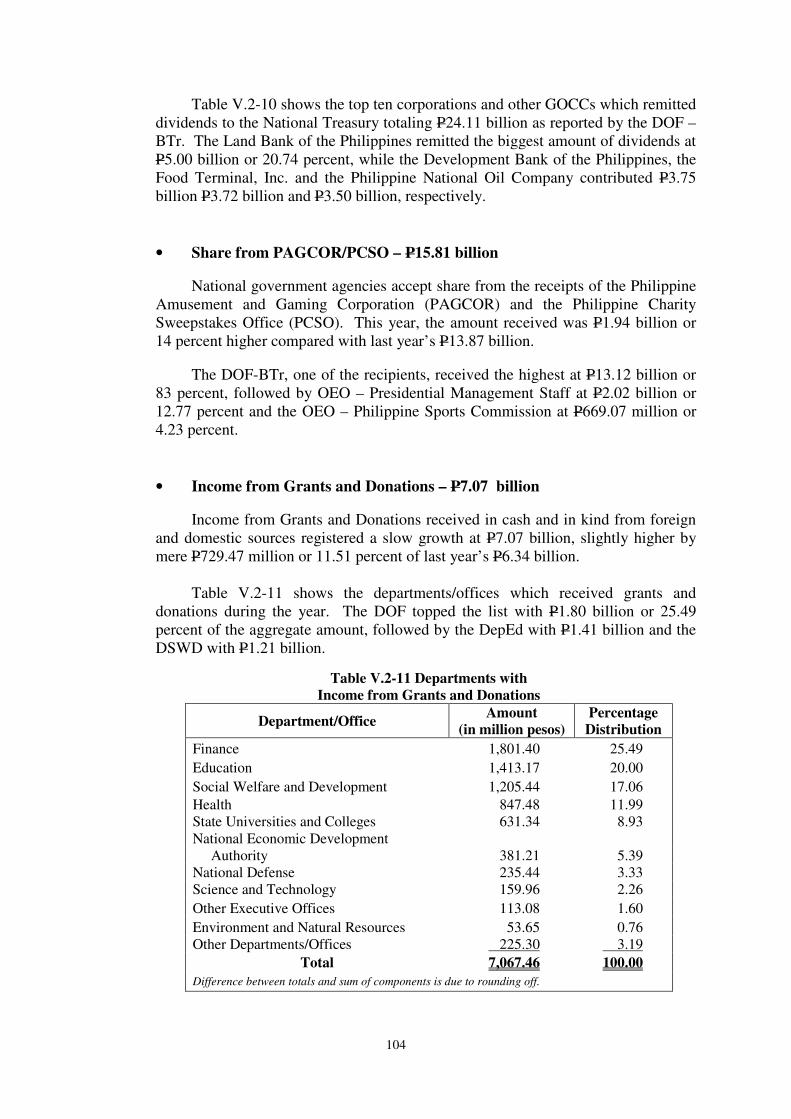
104
Table V.2-10 shows the top ten corporations and other GOCCs which remitted
dividends to the National Treasury totaling P24.11 billion as reported by the DOF –
BTr. The Land Bank of the Philippines remitted the biggest amount of dividends at
P5.00 billion or 20.74 percent, while the Development Bank of the Philippines, the
Food Terminal, Inc. and the Philippine National Oil Company contributed P3.75
billion P3.72 billion and P3.50 billion, respectively.
• Share from PAGCOR/PCSO – P15.81 billion
National government agencies accept share from the receipts of the Philippine
Amusement and Gaming Corporation (PAGCOR) and the Philippine Charity
Sweepstakes Office (PCSO). This year, the amount received was P1.94 billion or
14 percent higher compared with last year’s P13.87 billion.
The DOF-BTr, one of the recipients, received the highest at P13.12 billion or
83 percent, followed by OEO – Presidential Management Staff at P2.02 billion or
12.77 percent and the OEO – Philippine Sports Commission at P669.07 million or
4.23 percent.
• Income from Grants and Donations – P7.07 billion
Income from Grants and Donations received in cash and in kind from foreign
and domestic sources registered a slow growth at P7.07 billion, slightly higher by
mere P729.47 million or 11.51 percent of last year’s P6.34 billion.
Table V.2-11 shows the departments/offices which received grants and
donations during the year. The DOF topped the list with P1.80 billion or 25.49
percent of the aggregate amount, followed by the DepEd with P1.41 billion and the
DSWD with P1.21 billion.
Table V.2-11 Departments with
Income from Grants and Donations
Department/Office Amount
(in million pesos)
Percentage
Distribution
Finance 1,801.40 25.49
Education 1,413.17 20.00
Social Welfare and Development 1,205.44 17.06
Health 847.48 11.99
State Universities and Colleges 631.34 8.93
National Economic Development
Authority 381.21 5.39
National Defense 235.44 3.33
Science and Technology 159.96 2.26
Other Executive Offices 113.08 1.60
Environment and Natural Resources 53.65 0.76
Other Departments/Offices 225.30 3.19
Total 7,067.46 100.00
Difference between totals and sum of components is due to rounding off.
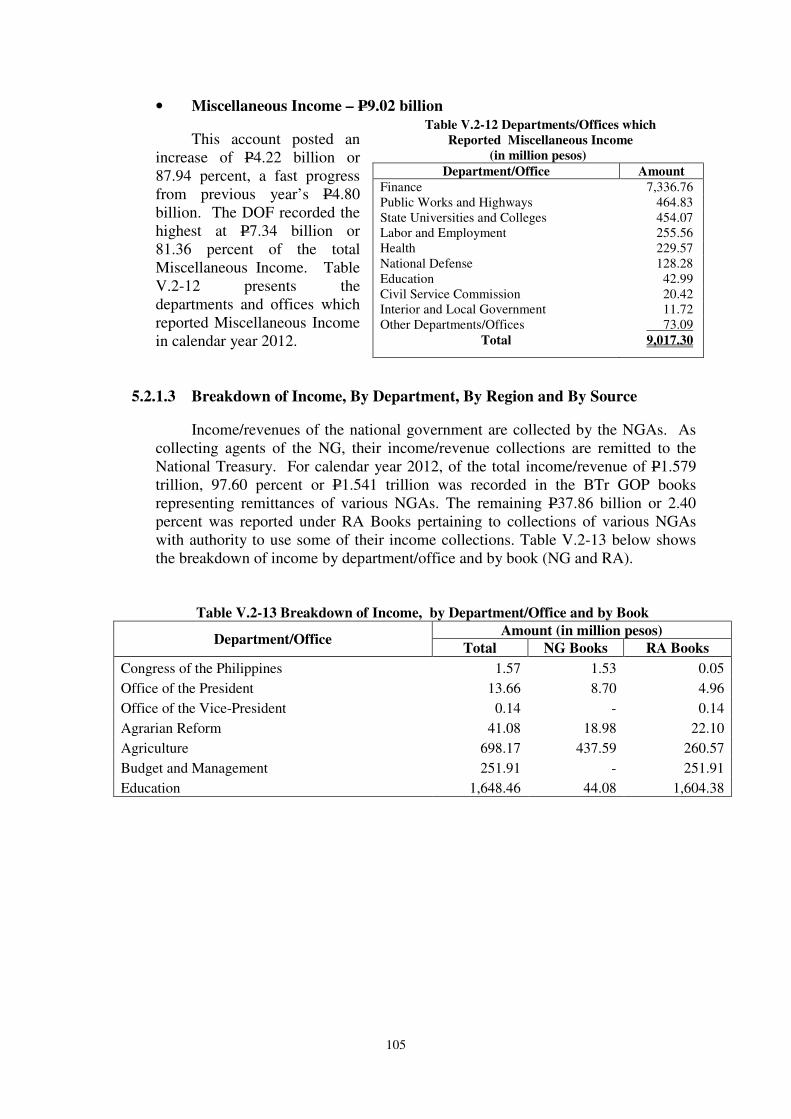
105
• Miscellaneous Income – P9.02 billion
This account posted an
increase of P4.22 billion or
87.94 percent, a fast progress
from previous year’s P4.80
billion. The DOF recorded the
highest at P7.34 billion or
81.36 percent of the total
Miscellaneous Income. Table
V.2-12 presents the
departments and offices which
reported Miscellaneous Income
in calendar year 2012.
5.2.1.3 Breakdown of Income, By Department, By Region and By Source
Income/revenues of the national government are collected by the NGAs. As
collecting agents of the NG, their income/revenue collections are remitted to the
National Treasury. For calendar year 2012, of the total income/revenue of P1.579
trillion, 97.60 percent or P1.541 trillion was recorded in the BTr GOP books
representing remittances of various NGAs. The remaining P37.86 billion or 2.40
percent was reported under RA Books pertaining to collections of various NGAs
with authority to use some of their income collections. Table V.2-13 below shows
the breakdown of income by department/office and by book (NG and RA).
Table V.2-13 Breakdown of Income, by Department/Office and by Book
Department/Office Amount (in million pesos)
Total NG Books RA Books
Congress of the Philippines 1.57 1.53 0.05
Office of the President 13.66 8.70 4.96
Office of the Vice-President 0.14 - 0.14
Agrarian Reform 41.08 18.98 22.10
Agriculture 698.17 437.59 260.57
Budget and Management 251.91 - 251.91
Education 1,648.46 44.08 1,604.38
Table V.2-12 Departments/Offices which
Reported Miscellaneous Income
(in million pesos)
Department/Office Amount
Finance 7,336.76
Public Works and Highways 464.83
State Universities and Colleges 454.07
Labor and Employment 255.56
Health 229.57
National Defense 128.28
Education 42.99
Civil Service Commission 20.42
Interior and Local Government 11.72
Other Departments/Offices 73.09
Total 9,017.30
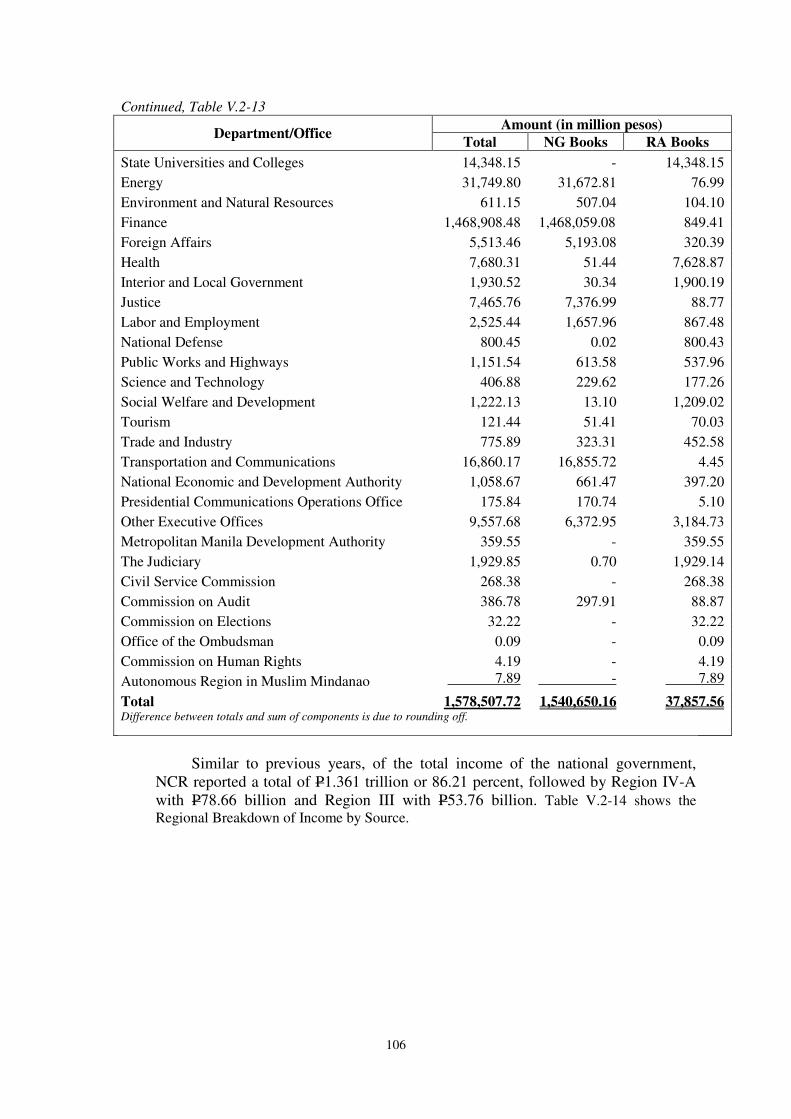
106
Continued, Table V.2-13
Department/Office Amount (in million pesos)
Total NG Books RA Books
State Universities and Colleges 14,348.15 - 14,348.15
Energy 31,749.80 31,672.81 76.99
Environment and Natural Resources 611.15 507.04 104.10
Finance 1,468,908.48 1,468,059.08 849.41
Foreign Affairs 5,513.46 5,193.08 320.39
Health 7,680.31 51.44 7,628.87
Interior and Local Government 1,930.52 30.34 1,900.19
Justice 7,465.76 7,376.99 88.77
Labor and Employment 2,525.44 1,657.96 867.48
National Defense 800.45 0.02 800.43
Public Works and Highways 1,151.54 613.58 537.96
Science and Technology 406.88 229.62 177.26
Social Welfare and Development 1,222.13 13.10 1,209.02
Tourism 121.44 51.41 70.03
Trade and Industry 775.89 323.31 452.58
Transportation and Communications 16,860.17 16,855.72 4.45
National Economic and Development Authority 1,058.67 661.47 397.20
Presidential Communications Operations Office 175.84 170.74 5.10
Other Executive Offices 9,557.68 6,372.95 3,184.73
Metropolitan Manila Development Authority 359.55 - 359.55
The Judiciary 1,929.85 0.70 1,929.14
Civil Service Commission 268.38 - 268.38
Commission on Audit 386.78 297.91 88.87
Commission on Elections 32.22 - 32.22
Office of the Ombudsman 0.09 - 0.09
Commission on Human Rights 4.19 - 4.19
Autonomous Region in Muslim Mindanao 7.89 - 7.89
Total 1,578,507.72 1,540,650.16 37,857.56 Difference between totals and sum of components is due to rounding off.
Similar to previous years, of the total income of the national government,
NCR reported a total of P1.361 trillion or 86.21 percent, followed by Region IV-A
with P78.66 billion and Region III with P53.76 billion. Table V.2-14 shows the
Regional Breakdown of Income by Source.
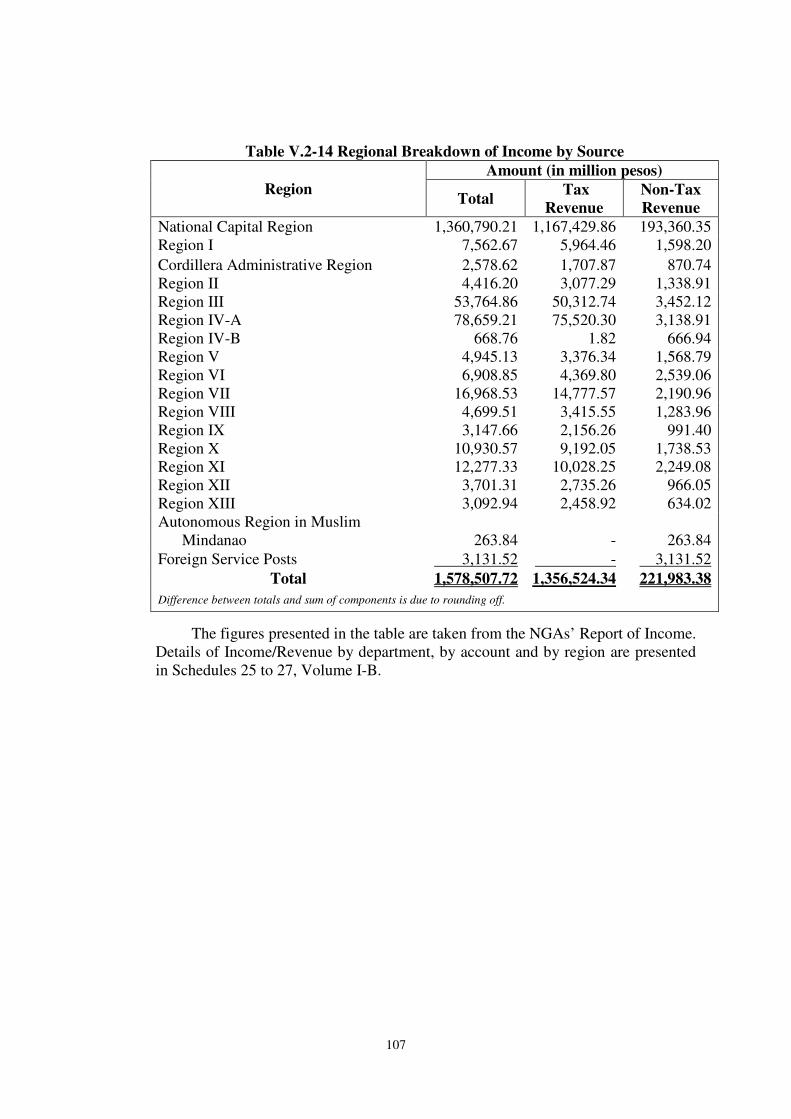
107
The figures presented in the table are taken from the NGAs’ Report of Income.
Details of Income/Revenue by department, by account and by region are presented
in Schedules 25 to 27, Volume I-B.
Table V.2-14 Regional Breakdown of Income by Source
Region
Amount (in million pesos)
Total Tax
Revenue
Non-Tax
Revenue
National Capital Region 1,360,790.21 1,167,429.86 193,360.35
Region I 7,562.67 5,964.46 1,598.20
Cordillera Administrative Region 2,578.62 1,707.87 870.74
Region II 4,416.20 3,077.29 1,338.91
Region III 53,764.86 50,312.74 3,452.12
Region IV-A 78,659.21 75,520.30 3,138.91
Region IV-B 668.76 1.82 666.94
Region V 4,945.13 3,376.34 1,568.79
Region VI 6,908.85 4,369.80 2,539.06
Region VII 16,968.53 14,777.57 2,190.96
Region VIII 4,699.51 3,415.55 1,283.96
Region IX 3,147.66 2,156.26 991.40
Region X 10,930.57 9,192.05 1,738.53
Region XI 12,277.33 10,028.25 2,249.08
Region XII 3,701.31 2,735.26 966.05
Region XIII 3,092.94 2,458.92 634.02
Autonomous Region in Muslim
Mindanao 263.84 - 263.84
Foreign Service Posts 3,131.52 - 3,131.52
Total 1,578,507.72 1,356,524.34 221,983.38
Difference between totals and sum of components is due to rounding off.
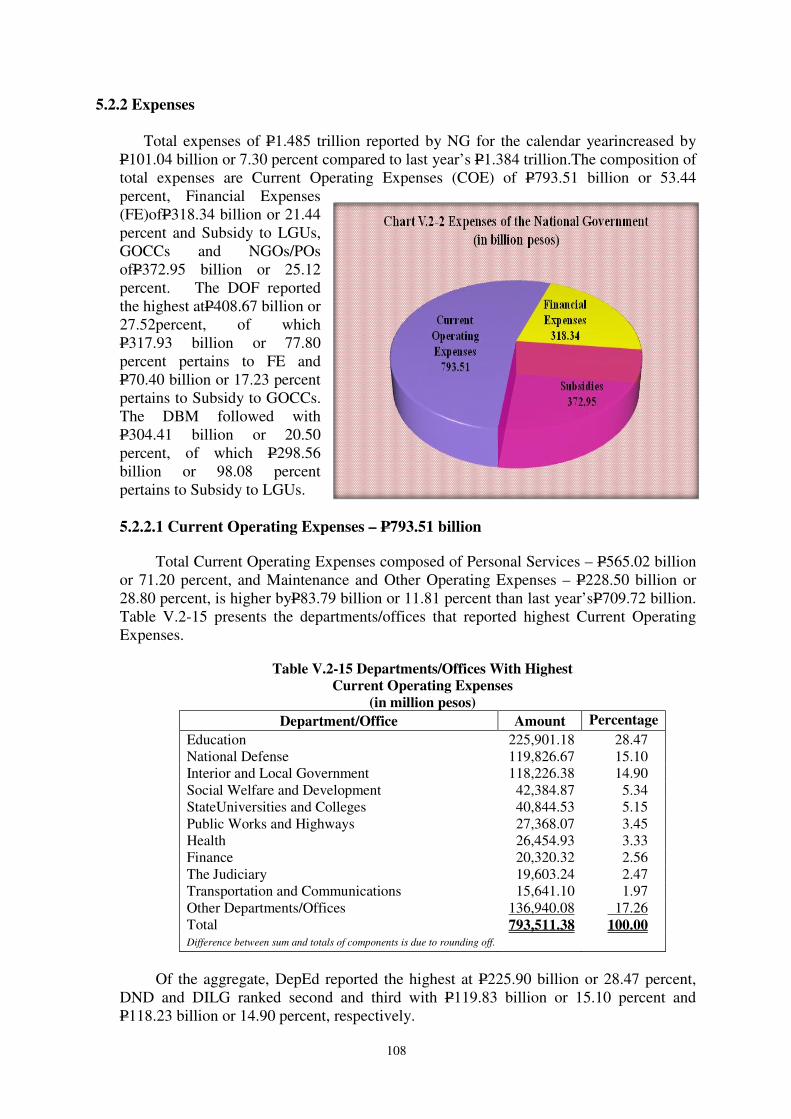
108
5.2.2 Expenses
Total expenses of P1.485 trillion reported by NG for the calendar yearincreased by
P101.04 billion or 7.30 percent compared to last year’s P1.384 trillion.The composition of
total expenses are Current Operating Expenses (COE) of P793.51 billion or 53.44
percent, Financial Expenses
(FE)ofP318.34 billion or 21.44
percent and Subsidy to LGUs,
GOCCs and NGOs/POs
ofP372.95 billion or 25.12
percent. The DOF reported
the highest atP408.67 billion or
27.52percent, of which
P317.93 billion or 77.80
percent pertains to FE and
P70.40 billion or 17.23 percent
pertains to Subsidy to GOCCs.
The DBM followed with
P304.41 billion or 20.50
percent, of which P298.56
billion or 98.08 percent
pertains to Subsidy to LGUs.
5.2.2.1 Current Operating Expenses – P793.51 billion
Total Current Operating Expenses composed of Personal Services – P565.02 billion
or 71.20 percent, and Maintenance and Other Operating Expenses – P228.50 billion or
28.80 percent, is higher byP83.79 billion or 11.81 percent than last year’sP709.72 billion.
Table V.2-15 presents the departments/offices that reported highest Current Operating
Expenses.
Of the aggregate, DepEd reported the highest at P225.90 billion or 28.47 percent,
DND and DILG ranked second and third with P119.83 billion or 15.10 percent and
P118.23 billion or 14.90 percent, respectively.
Table V.2-15 Departments/Offices With Highest Current Operating Expenses
(in million pesos)
Department/Office Amount Percentage
Education 225,901.18 28.47 National Defense 119,826.67 15.10 Interior and Local Government 118,226.38 14.90 Social Welfare and Development 42,384.87 5.34 StateUniversities and Colleges 40,844.53 5.15 Public Works and Highways 27,368.07 3.45 Health 26,454.93 3.33 Finance 20,320.32 2.56 The Judiciary 19,603.24 2.47 Transportation and Communications 15,641.10 1.97 Other Departments/Offices 136,940.08 17.26 Total 793,511.38 100.00 Difference between sum and totals of components is due to rounding off.
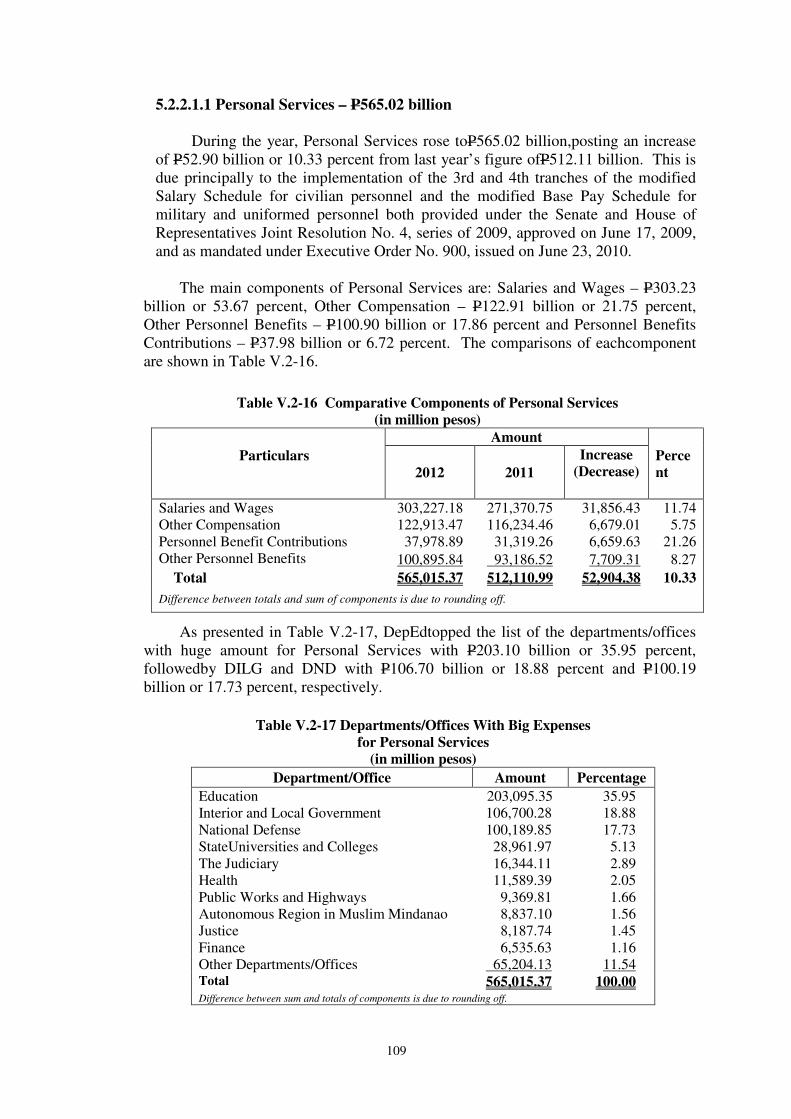
109
5.2.2.1.1 Personal Services – P565.02 billion
During the year, Personal Services rose toP565.02 billion,posting an increase
of P52.90 billion or 10.33 percent from last year’s figure ofP512.11 billion. This is
due principally to the implementation of the 3rd and 4th tranches of the modified
Salary Schedule for civilian personnel and the modified Base Pay Schedule for
military and uniformed personnel both provided under the Senate and House of
Representatives Joint Resolution No. 4, series of 2009, approved on June 17, 2009,
and as mandated under Executive Order No. 900, issued on June 23, 2010.
The main components of Personal Services are: Salaries and Wages – P303.23
billion or 53.67 percent, Other Compensation – P122.91 billion or 21.75 percent,
Other Personnel Benefits – P100.90 billion or 17.86 percent and Personnel Benefits
Contributions – P37.98 billion or 6.72 percent. The comparisons of eachcomponent
are shown in Table V.2-16.
As presented in Table V.2-17, DepEdtopped the list of the departments/offices
with huge amount for Personal Services with P203.10 billion or 35.95 percent,
followedby DILG and DND with P106.70 billion or 18.88 percent and P100.19
billion or 17.73 percent, respectively.
Table V.2-16 Comparative Components of Personal Services (in million pesos)
Particulars
Amount Perce
nt
2012 2011
Increase
(Decrease)
Salaries and Wages 303,227.18 271,370.75 31,856.43 11.74 Other Compensation 122,913.47 116,234.46 6,679.01 5.75 Personnel Benefit Contributions 37,978.89 31,319.26 6,659.63 21.26 Other Personnel Benefits 100,895.84 93,186.52 7,709.31 8.27
Total 565,015.37 512,110.99 52,904.38 10.33
Difference between totals and sum of components is due to rounding off.
Table V.2-17 Departments/Offices With Big Expenses for Personal Services
(in million pesos)
Department/Office Amount Percentage
Education 203,095.35 35.95 Interior and Local Government 106,700.28 18.88 National Defense 100,189.85 17.73 StateUniversities and Colleges 28,961.97 5.13 The Judiciary 16,344.11 2.89 Health 11,589.39 2.05 Public Works and Highways 9,369.81 1.66 Autonomous Region in Muslim Mindanao 8,837.10 1.56 Justice 8,187.74 1.45 Finance 6,535.63 1.16 Other Departments/Offices 65,204.13 11.54 Total 565,015.37 100.00 Difference between sum and totals of components is due to rounding off.
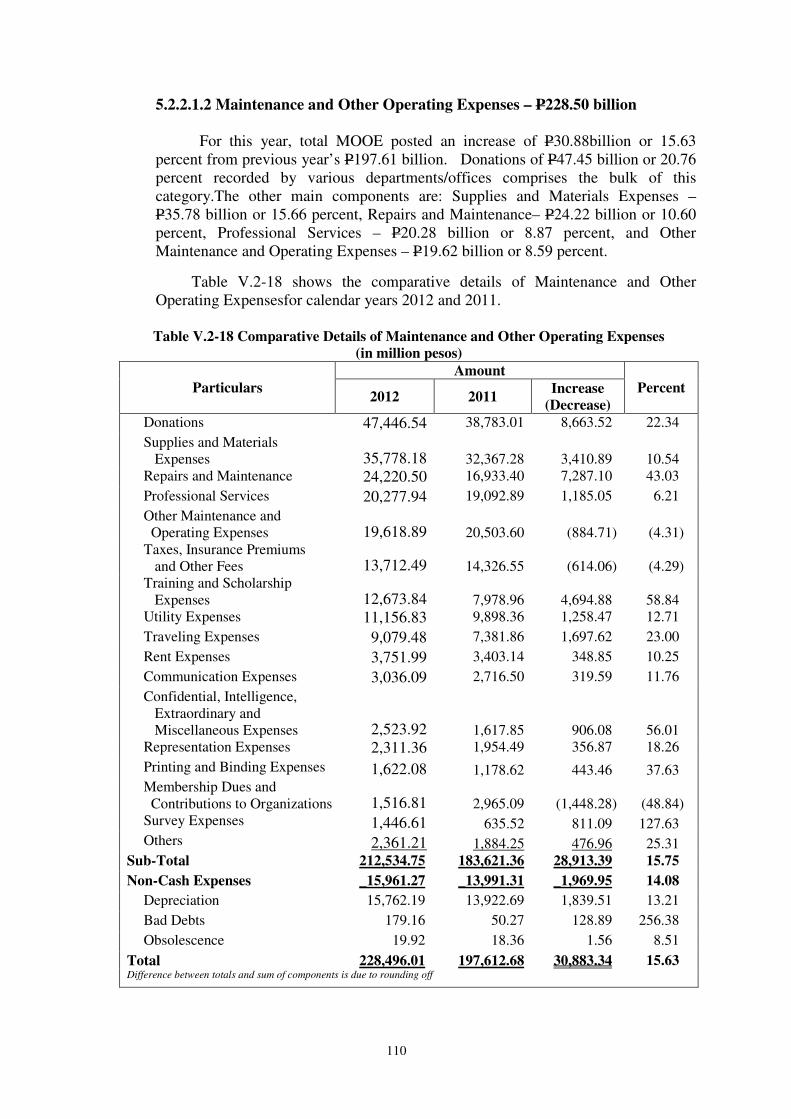
110
5.2.2.1.2 Maintenance and Other Operating Expenses – P228.50 billion
For this year, total MOOE posted an increase of P30.88billion or 15.63
percent from previous year’s P197.61 billion. Donations of P47.45 billion or 20.76
percent recorded by various departments/offices comprises the bulk of this
category.The other main components are: Supplies and Materials Expenses –
P35.78 billion or 15.66 percent, Repairs and Maintenance– P24.22 billion or 10.60
percent, Professional Services – P20.28 billion or 8.87 percent, and Other
Maintenance and Operating Expenses – P19.62 billion or 8.59 percent.
Table V.2-18 shows the comparative details of Maintenance and Other
Operating Expensesfor calendar years 2012 and 2011.
Table V.2-18 Comparative Details of Maintenance and Other Operating Expenses
(in million pesos)
Particulars Amount
Percent 2012 2011
Increase
(Decrease) Donations 47,446.54 38,783.01 8,663.52 22.34
Supplies and Materials Expenses 35,778.18 32,367.28 3,410.89 10.54 Repairs and Maintenance 24,220.50 16,933.40 7,287.10 43.03
Professional Services 20,277.94 19,092.89 1,185.05 6.21
Other Maintenance and Operating Expenses 19,618.89 20,503.60 (884.71) (4.31) Taxes, Insurance Premiums and Other Fees 13,712.49 14,326.55 (614.06) (4.29) Training and Scholarship Expenses 12,673.84 7,978.96 4,694.88 58.84 Utility Expenses 11,156.83 9,898.36 1,258.47 12.71
Traveling Expenses 9,079.48 7,381.86 1,697.62 23.00
Rent Expenses 3,751.99 3,403.14 348.85 10.25
Communication Expenses 3,036.09 2,716.50 319.59 11.76
Confidential, Intelligence, Extraordinary and Miscellaneous Expenses 2,523.92 1,617.85 906.08 56.01 Representation Expenses 2,311.36 1,954.49 356.87 18.26
Printing and Binding Expenses 1,622.08 1,178.62 443.46 37.63 Membership Dues and Contributions to Organizations 1,516.81 2,965.09 (1,448.28) (48.84) Survey Expenses 1,446.61 635.52 811.09 127.63 Others 2,361.21 1,884.25 476.96 25.31
Sub-Total 212,534.75 183,621.36 28,913.39 15.75
Non-Cash Expenses _15,961.27 _13,991.31 _1,969.95 14.08
Depreciation 15,762.19 13,922.69 1,839.51 13.21
Bad Debts 179.16 50.27 128.89 256.38
Obsolescence 19.92 18.36 1.56 8.51
Total 228,496.01 197,612.68 30,883.34 15.63 Difference between totals and sum of components is due to rounding off
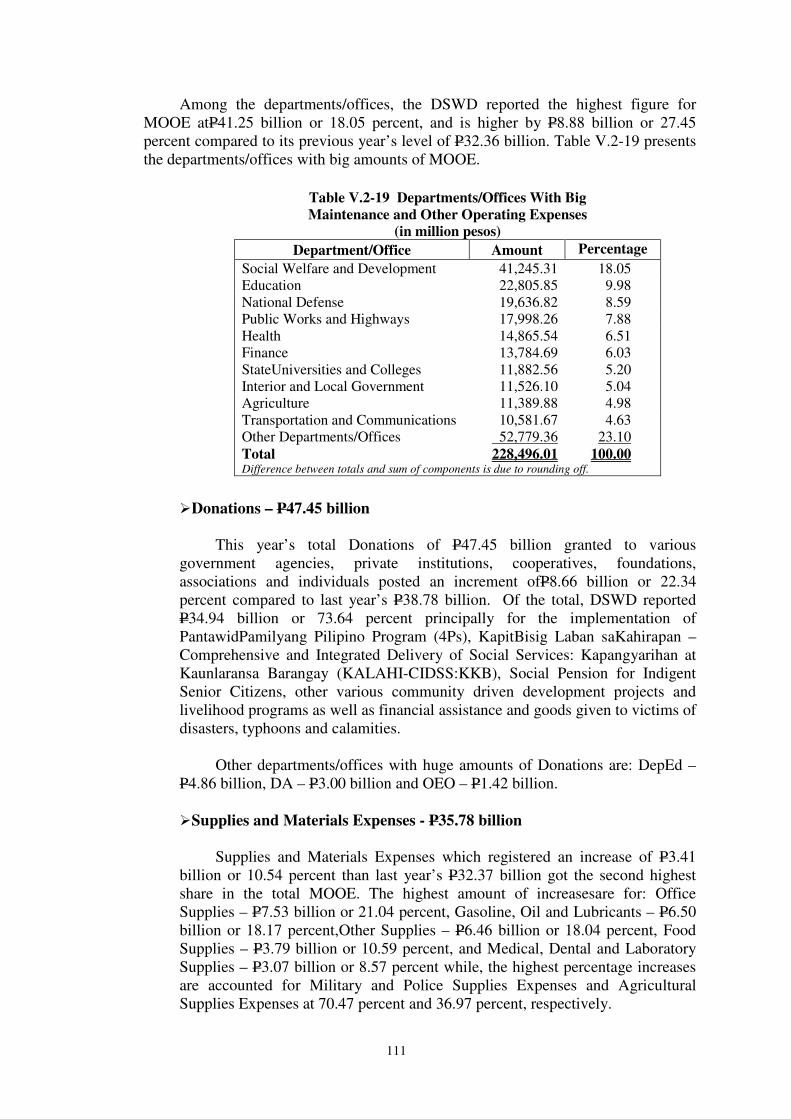
111
Among the departments/offices, the DSWD reported the highest figure for
MOOE atP41.25 billion or 18.05 percent, and is higher by P8.88 billion or 27.45
percent compared to its previous year’s level of P32.36 billion. Table V.2-19 presents
the departments/offices with big amounts of MOOE.
� Donations – P47.45 billion
This year’s total Donations of P47.45 billion granted to various
government agencies, private institutions, cooperatives, foundations,
associations and individuals posted an increment ofP8.66 billion or 22.34
percent compared to last year’s P38.78 billion. Of the total, DSWD reported
P34.94 billion or 73.64 percent principally for the implementation of
PantawidPamilyang Pilipino Program (4Ps), KapitBisig Laban saKahirapan –
Comprehensive and Integrated Delivery of Social Services: Kapangyarihan at
Kaunlaransa Barangay (KALAHI-CIDSS:KKB), Social Pension for Indigent
Senior Citizens, other various community driven development projects and
livelihood programs as well as financial assistance and goods given to victims of
disasters, typhoons and calamities.
Other departments/offices with huge amounts of Donations are: DepEd –
P4.86 billion, DA – P3.00 billion and OEO – P1.42 billion.
� Supplies and Materials Expenses - P35.78 billion
Supplies and Materials Expenses which registered an increase of P3.41
billion or 10.54 percent than last year’s P32.37 billion got the second highest
share in the total MOOE. The highest amount of increasesare for: Office
Supplies – P7.53 billion or 21.04 percent, Gasoline, Oil and Lubricants – P6.50
billion or 18.17 percent,Other Supplies – P6.46 billion or 18.04 percent, Food
Supplies – P3.79 billion or 10.59 percent, and Medical, Dental and Laboratory
Supplies – P3.07 billion or 8.57 percent while, the highest percentage increases
are accounted for Military and Police Supplies Expenses and Agricultural
Supplies Expenses at 70.47 percent and 36.97 percent, respectively.
Table V.2-19 Departments/Offices With Big Maintenance and Other Operating Expenses
(in million pesos)
Department/Office Amount Percentage
Social Welfare and Development 41,245.31 18.05 Education 22,805.85 9.98 National Defense 19,636.82 8.59 Public Works and Highways 17,998.26 7.88 Health 14,865.54 6.51 Finance 13,784.69 6.03 StateUniversities and Colleges 11,882.56 5.20 Interior and Local Government 11,526.10 5.04 Agriculture 11,389.88 4.98 Transportation and Communications 10,581.67 4.63 Other Departments/Offices 52,779.36 23.10 Total 228,496.01 100.00 Difference between totals and sum of components is due to rounding off.
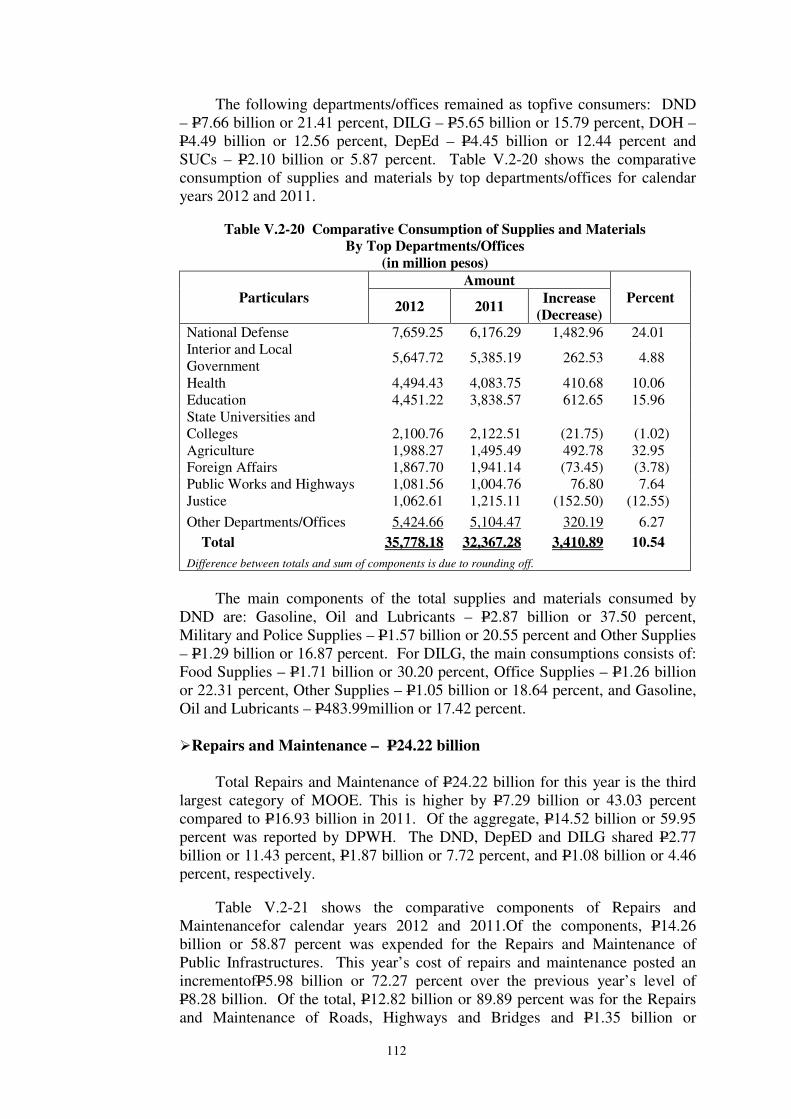
112
The following departments/offices remained as topfive consumers: DND
– P7.66 billion or 21.41 percent, DILG – P5.65 billion or 15.79 percent, DOH –
P4.49 billion or 12.56 percent, DepEd – P4.45 billion or 12.44 percent and
SUCs – P2.10 billion or 5.87 percent. Table V.2-20 shows the comparative
consumption of supplies and materials by top departments/offices for calendar
years 2012 and 2011.
Table V.2-20 Comparative Consumption of Supplies and Materials By Top Departments/Offices
(in million pesos)
Particulars Amount
Percent 2012 2011
Increase
(Decrease) National Defense 7,659.25 6,176.29 1,482.96 24.01 Interior and Local Government
5,647.72 5,385.19 262.53 4.88
Health 4,494.43 4,083.75 410.68 10.06 Education 4,451.22 3,838.57 612.65 15.96 State Universities and Colleges 2,100.76 2,122.51 (21.75) (1.02) Agriculture 1,988.27 1,495.49 492.78 32.95 Foreign Affairs 1,867.70 1,941.14 (73.45) (3.78) Public Works and Highways 1,081.56 1,004.76 76.80 7.64 Justice 1,062.61 1,215.11 (152.50) (12.55)
Other Departments/Offices 5,424.66 5,104.47 320.19 6.27
Total 35,778.18 32,367.28 3,410.89 10.54
Difference between totals and sum of components is due to rounding off.
The main components of the total supplies and materials consumed by
DND are: Gasoline, Oil and Lubricants – P2.87 billion or 37.50 percent,
Military and Police Supplies – P1.57 billion or 20.55 percent and Other Supplies
– P1.29 billion or 16.87 percent. For DILG, the main consumptions consists of:
Food Supplies – P1.71 billion or 30.20 percent, Office Supplies – P1.26 billion
or 22.31 percent, Other Supplies – P1.05 billion or 18.64 percent, and Gasoline,
Oil and Lubricants – P483.99million or 17.42 percent.
� Repairs and Maintenance – P24.22 billion
Total Repairs and Maintenance of P24.22 billion for this year is the third
largest category of MOOE. This is higher by P7.29 billion or 43.03 percent
compared to P16.93 billion in 2011. Of the aggregate, P14.52 billion or 59.95
percent was reported by DPWH. The DND, DepED and DILG shared P2.77
billion or 11.43 percent, P1.87 billion or 7.72 percent, and P1.08 billion or 4.46
percent, respectively.
Table V.2-21 shows the comparative components of Repairs and
Maintenancefor calendar years 2012 and 2011.Of the components, P14.26
billion or 58.87 percent was expended for the Repairs and Maintenance of
Public Infrastructures. This year’s cost of repairs and maintenance posted an
incrementofP5.98 billion or 72.27 percent over the previous year’s level of
P8.28 billion. Of the total, P12.82 billion or 89.89 percent was for the Repairs
and Maintenance of Roads, Highways and Bridges and P1.35 billion or
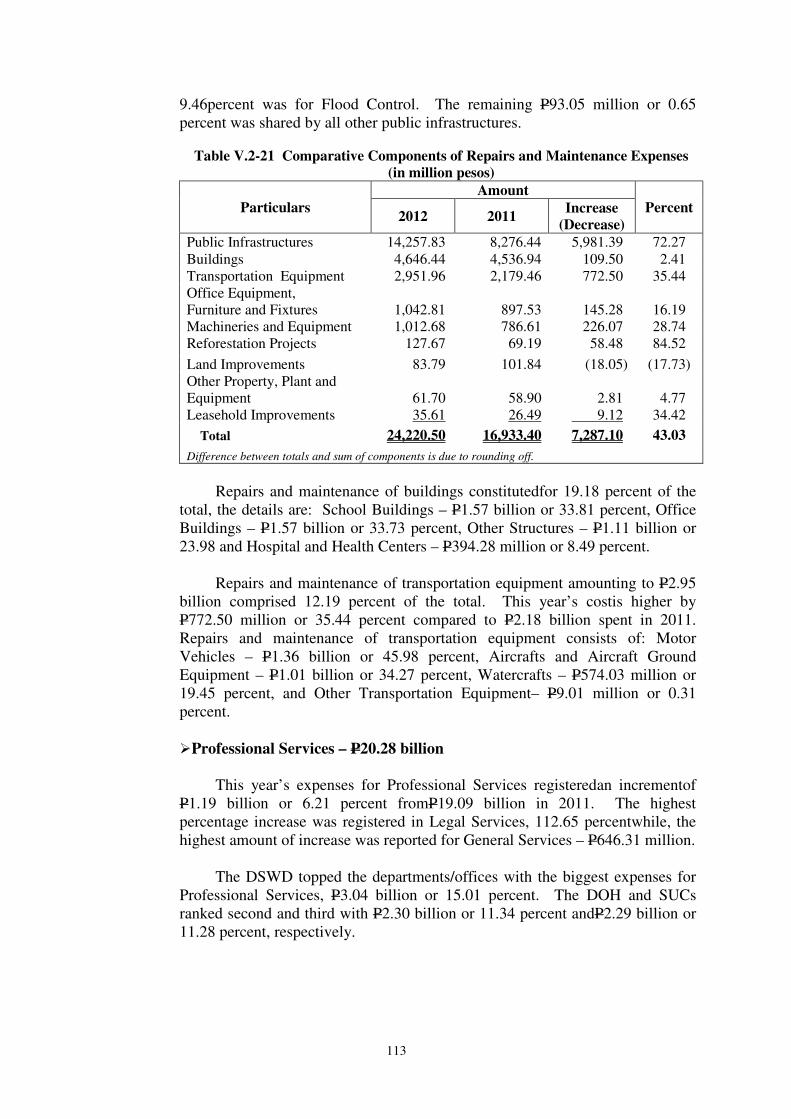
113
9.46percent was for Flood Control. The remaining P93.05 million or 0.65
percent was shared by all other public infrastructures.
Table V.2-21 Comparative Components of Repairs and Maintenance Expenses (in million pesos)
Particulars Amount
Percent 2012 2011
Increase
(Decrease) Public Infrastructures 14,257.83 8,276.44 5,981.39 72.27 Buildings 4,646.44 4,536.94 109.50 2.41 Transportation Equipment 2,951.96 2,179.46 772.50 35.44 Office Equipment, Furniture and Fixtures 1,042.81 897.53 145.28 16.19 Machineries and Equipment 1,012.68 786.61 226.07 28.74 Reforestation Projects 127.67 69.19 58.48 84.52
Land Improvements 83.79 101.84 (18.05) (17.73) Other Property, Plant and Equipment 61.70 58.90 2.81 4.77 Leasehold Improvements 35.61 26.49 9.12 34.42
Total 24,220.50 16,933.40 7,287.10 43.03
Difference between totals and sum of components is due to rounding off.
Repairs and maintenance of buildings constitutedfor 19.18 percent of the
total, the details are: School Buildings – P1.57 billion or 33.81 percent, Office
Buildings – P1.57 billion or 33.73 percent, Other Structures – P1.11 billion or
23.98 and Hospital and Health Centers – P394.28 million or 8.49 percent.
Repairs and maintenance of transportation equipment amounting to P2.95
billion comprised 12.19 percent of the total. This year’s costis higher by
P772.50 million or 35.44 percent compared to P2.18 billion spent in 2011.
Repairs and maintenance of transportation equipment consists of: Motor
Vehicles – P1.36 billion or 45.98 percent, Aircrafts and Aircraft Ground
Equipment – P1.01 billion or 34.27 percent, Watercrafts – P574.03 million or
19.45 percent, and Other Transportation Equipment– P9.01 million or 0.31
percent.
� Professional Services – P20.28 billion
This year’s expenses for Professional Services registeredan incrementof
P1.19 billion or 6.21 percent fromP19.09 billion in 2011. The highest
percentage increase was registered in Legal Services, 112.65 percentwhile, the
highest amount of increase was reported for General Services – P646.31 million.
The DSWD topped the departments/offices with the biggest expenses for
Professional Services, P3.04 billion or 15.01 percent. The DOH and SUCs
ranked second and third with P2.30 billion or 11.34 percent andP2.29 billion or
11.28 percent, respectively.
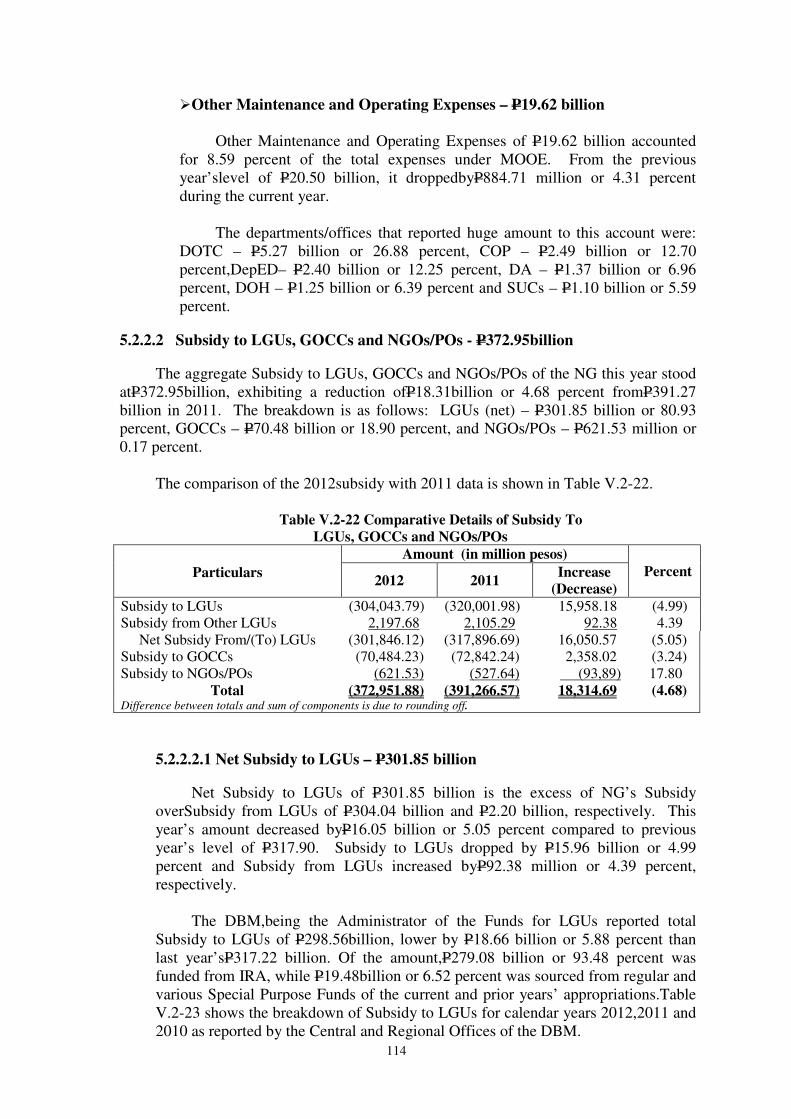
114
� Other Maintenance and Operating Expenses – P19.62 billion
Other Maintenance and Operating Expenses of P19.62 billion accounted
for 8.59 percent of the total expenses under MOOE. From the previous
year’slevel of P20.50 billion, it droppedbyP884.71 million or 4.31 percent
during the current year.
The departments/offices that reported huge amount to this account were:
DOTC – P5.27 billion or 26.88 percent, COP – P2.49 billion or 12.70
percent,DepED– P2.40 billion or 12.25 percent, DA – P1.37 billion or 6.96
percent, DOH – P1.25 billion or 6.39 percent and SUCs – P1.10 billion or 5.59
percent.
5.2.2.2 Subsidy to LGUs, GOCCs and NGOs/POs - P372.95billion
The aggregate Subsidy to LGUs, GOCCs and NGOs/POs of the NG this year stood
atP372.95billion, exhibiting a reduction ofP18.31billion or 4.68 percent fromP391.27
billion in 2011. The breakdown is as follows: LGUs (net) – P301.85 billion or 80.93
percent, GOCCs – P70.48 billion or 18.90 percent, and NGOs/POs – P621.53 million or
0.17 percent.
The comparison of the 2012subsidy with 2011 data is shown in Table V.2-22.
Table V.2-22 Comparative Details of Subsidy To
LGUs, GOCCs and NGOs/POs
Particulars
Amount (in million pesos) Percent
2012 2011 Increase
(Decrease) Subsidy to LGUs (304,043.79) (320,001.98) 15,958.18 (4.99) Subsidy from Other LGUs 2,197.68 2,105.29 92.38 4.39 Net Subsidy From/(To) LGUs (301,846.12) (317,896.69) 16,050.57 (5.05) Subsidy to GOCCs (70,484.23) (72,842.24) 2,358.02 (3.24) Subsidy to NGOs/POs (621.53) (527.64) (93,89) 17.80
Total (372,951.88) (391,266.57) 18,314.69 (4.68) Difference between totals and sum of components is due to rounding off.
5.2.2.2.1 Net Subsidy to LGUs – P301.85 billion
Net Subsidy to LGUs of P301.85 billion is the excess of NG’s Subsidy
overSubsidy from LGUs of P304.04 billion and P2.20 billion, respectively. This
year’s amount decreased byP16.05 billion or 5.05 percent compared to previous
year’s level of P317.90. Subsidy to LGUs dropped by P15.96 billion or 4.99
percent and Subsidy from LGUs increased byP92.38 million or 4.39 percent,
respectively.
The DBM,being the Administrator of the Funds for LGUs reported total
Subsidy to LGUs of P298.56billion, lower by P18.66 billion or 5.88 percent than
last year’sP317.22 billion. Of the amount,P279.08 billion or 93.48 percent was
funded from IRA, while P19.48billion or 6.52 percent was sourced from regular and
various Special Purpose Funds of the current and prior years’ appropriations.Table
V.2-23 shows the breakdown of Subsidy to LGUs for calendar years 2012,2011 and
2010 as reported by the Central and Regional Offices of the DBM.
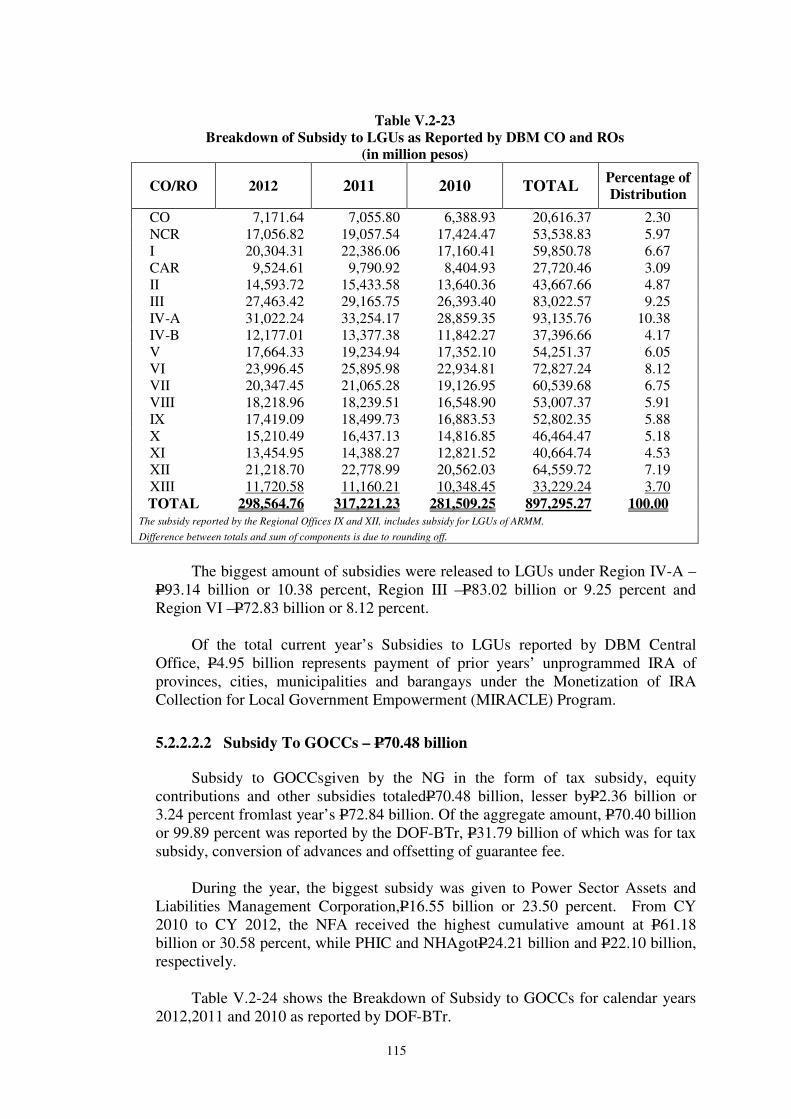
115
Table V.2-23 Breakdown of Subsidy to LGUs as Reported by DBM CO and ROs
(in million pesos)
CO/RO 2012 2011 2010 TOTAL Percentage of
Distribution
CO 7,171.64 7,055.80 6,388.93 20,616.37 2.30 NCR 17,056.82 19,057.54 17,424.47 53,538.83 5.97 I 20,304.31 22,386.06 17,160.41 59,850.78 6.67 CAR 9,524.61 9,790.92 8,404.93 27,720.46 3.09 II 14,593.72 15,433.58 13,640.36 43,667.66 4.87 III 27,463.42 29,165.75 26,393.40 83,022.57 9.25 IV-A 31,022.24 33,254.17 28,859.35 93,135.76 10.38 IV-B 12,177.01 13,377.38 11,842.27 37,396.66 4.17 V 17,664.33 19,234.94 17,352.10 54,251.37 6.05 VI 23,996.45 25,895.98 22,934.81 72,827.24 8.12 VII 20,347.45 21,065.28 19,126.95 60,539.68 6.75 VIII 18,218.96 18,239.51 16,548.90 53,007.37 5.91 IX 17,419.09 18,499.73 16,883.53 52,802.35 5.88 X 15,210.49 16,437.13 14,816.85 46,464.47 5.18 XI 13,454.95 14,388.27 12,821.52 40,664.74 4.53 XII 21,218.70 22,778.99 20,562.03 64,559.72 7.19 XIII 11,720.58 11,160.21 10,348.45 33,229.24 3.70 TOTAL 298,564.76 317,221.23 281,509.25 897,295.27 100.00
The subsidy reported by the Regional Offices IX and XII, includes subsidy for LGUs of ARMM.
Difference between totals and sum of components is due to rounding off.
The biggest amount of subsidies were released to LGUs under Region IV-A –
P93.14 billion or 10.38 percent, Region III –P83.02 billion or 9.25 percent and
Region VI –P72.83 billion or 8.12 percent.
Of the total current year’s Subsidies to LGUs reported by DBM Central
Office, P4.95 billion represents payment of prior years’ unprogrammed IRA of
provinces, cities, municipalities and barangays under the Monetization of IRA
Collection for Local Government Empowerment (MIRACLE) Program.
5.2.2.2.2 Subsidy To GOCCs – P70.48 billion
Subsidy to GOCCsgiven by the NG in the form of tax subsidy, equity
contributions and other subsidies totaledP70.48 billion, lesser byP2.36 billion or
3.24 percent fromlast year’s P72.84 billion. Of the aggregate amount, P70.40 billion
or 99.89 percent was reported by the DOF-BTr, P31.79 billion of which was for tax
subsidy, conversion of advances and offsetting of guarantee fee.
During the year, the biggest subsidy was given to Power Sector Assets and
Liabilities Management Corporation,P16.55 billion or 23.50 percent. From CY
2010 to CY 2012, the NFA received the highest cumulative amount at P61.18
billion or 30.58 percent, while PHIC and NHAgotP24.21 billion and P22.10 billion,
respectively.
Table V.2-24 shows the Breakdown of Subsidy to GOCCs for calendar years
2012,2011 and 2010 as reported by DOF-BTr.
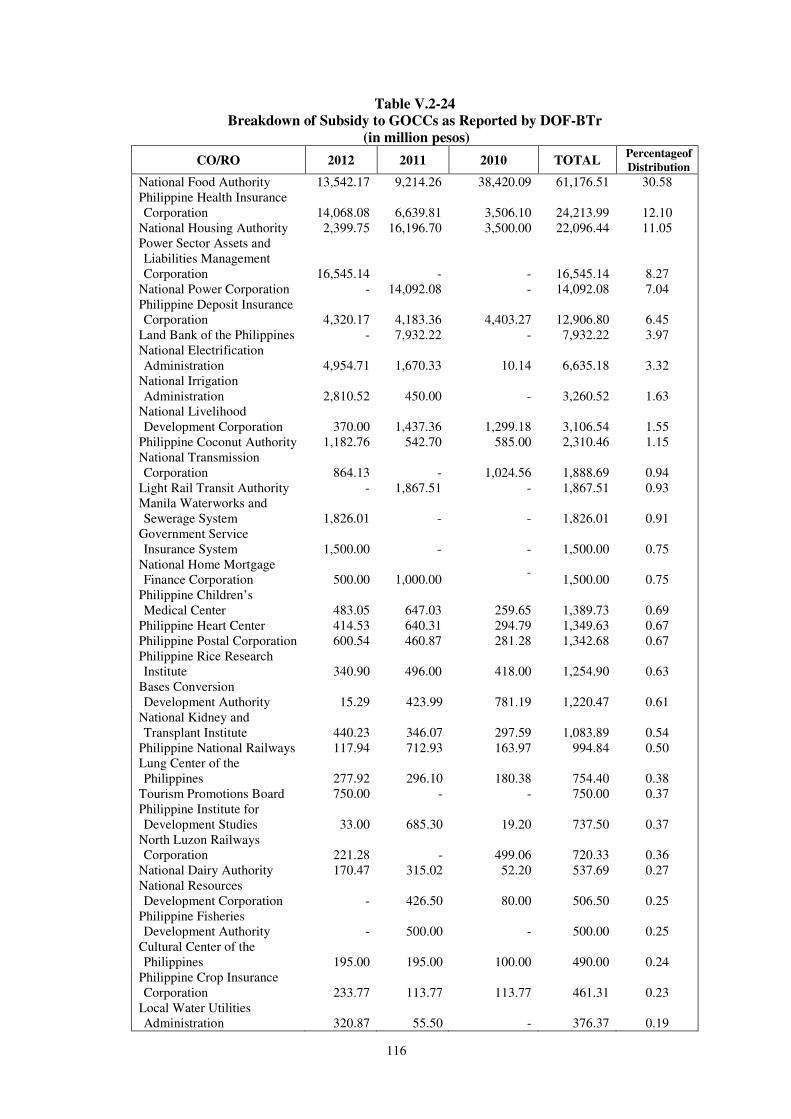
116
Table V.2-24 Breakdown of Subsidy to GOCCs as Reported by DOF-BTr
(in million pesos)
CO/RO 2012 2011 2010 TOTAL Percentageof
Distribution
National Food Authority 13,542.17 9,214.26 38,420.09 61,176.51 30.58
Philippine Health Insurance
Corporation
14,068.08 6,639.81 3,506.10 24,213.99 12.10
National Housing Authority 2,399.75 16,196.70 3,500.00 22,096.44 11.05
Power Sector Assets and
Liabilities Management
Corporation
16,545.14
-
-
16,545.14
8.27
National Power Corporation - 14,092.08 - 14,092.08 7.04
Philippine Deposit Insurance
Corporation
4,320.17
4,183.36
4,403.27 12,906.80 6.45
Land Bank of the Philippines - 7,932.22 - 7,932.22 3.97
National Electrification
Administration
4,954.71
1,670.33
10.14 6,635.18 3.32
National Irrigation
Administration
2,810.52
450.00
- 3,260.52 1.63
National Livelihood
Development Corporation
370.00
1,437.36
1,299.18 3,106.54 1.55
Philippine Coconut Authority 1,182.76 542.70 585.00 2,310.46 1.15
National Transmission
Corporation
864.13
-
1,024.56 1,888.69 0.94
Light Rail Transit Authority - 1,867.51 - 1,867.51 0.93
Manila Waterworks and
Sewerage System
1,826.01
-
- 1,826.01 0.91
Government Service
Insurance System
1,500.00
-
- 1,500.00 0.75
National Home Mortgage
Finance Corporation
500.00
1,000.00 -
1,500.00 0.75
Philippine Children’s
Medical Center
483.05
647.03
259.65 1,389.73
0.69
Philippine Heart Center 414.53 640.31 294.79 1,349.63 0.67
Philippine Postal Corporation 600.54 460.87 281.28 1,342.68 0.67
Philippine Rice Research
Institute
340.90
496.00
418.00 1,254.90 0.63
Bases Conversion
Development Authority
15.29
423.99
781.19 1,220.47 0.61
National Kidney and
Transplant Institute
440.23
346.07
297.59 1,083.89 0.54
Philippine National Railways 117.94 712.93 163.97 994.84 0.50
Lung Center of the
Philippines
277.92
296.10
180.38 754.40 0.38
Tourism Promotions Board 750.00 - - 750.00 0.37
Philippine Institute for
Development Studies
33.00
685.30
19.20 737.50 0.37
North Luzon Railways
Corporation
221.28
-
499.06 720.33 0.36
National Dairy Authority 170.47 315.02 52.20 537.69 0.27
National Resources
Development Corporation
-
426.50
80.00 506.50 0.25
Philippine Fisheries
Development Authority
-
500.00
- 500.00 0.25
Cultural Center of the
Philippines
195.00
195.00
100.00 490.00 0.24
Philippine Crop Insurance
Corporation
233.77
113.77
113.77 461.31 0.23
Local Water Utilities
Administration
320.87
55.50 - 376.37 0.19
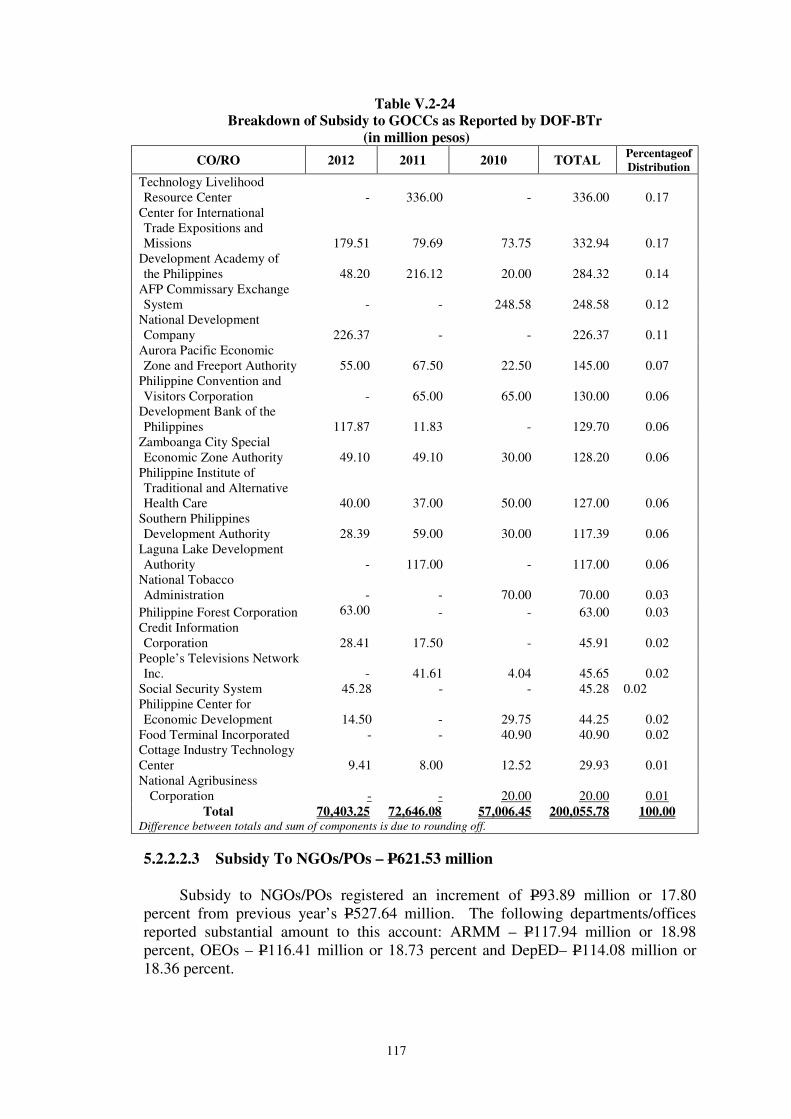
117
Table V.2-24 Breakdown of Subsidy to GOCCs as Reported by DOF-BTr
(in million pesos)
CO/RO 2012 2011 2010 TOTAL Percentageof
Distribution
Technology Livelihood
Resource Center
-
336.00 - 336.00 0.17
Center for International
Trade Expositions and
Missions
179.51
79.69
73.75 332.94 0.17
Development Academy of
the Philippines
48.20
216.12
20.00 284.32 0.14
AFP Commissary Exchange
System
-
-
248.58 248.58 0.12
National Development
Company
226.37
- - 226.37 0.11
Aurora Pacific Economic
Zone and Freeport Authority
55.00
67.50
22.50 145.00 0.07
Philippine Convention and
Visitors Corporation
-
65.00
65.00 130.00 0.06
Development Bank of the
Philippines
117.87
11.83 - 129.70 0.06
Zamboanga City Special
Economic Zone Authority
49.10 49.10 30.00 128.20 0.06
Philippine Institute of
Traditional and Alternative
Health Care
40.00 37.00 50.00 127.00 0.06
Southern Philippines
Development Authority
28.39
59.00
30.00
117.39
0.06
Laguna Lake Development
Authority
-
117.00
-
117.00
0.06
National Tobacco
Administration
-
-
70.00 70.00 0.03
Philippine Forest Corporation 63.00 - - 63.00 0.03
Credit Information
Corporation
28.41 17.50 - 45.91 0.02
People’s Televisions Network
Inc.
-
41.61
4.04 45.65 0.02
Social Security System 45.28 - - 45.28 0.02
Philippine Center for
Economic Development
14.50
-
29.75 44.25 0.02
Food Terminal Incorporated - - 40.90 40.90 0.02
Cottage Industry Technology
Center
9.41 8.00 12.52 29.93 0.01
National Agribusiness
Corporation
.-
.-
.20.00 .20.00 0.01
Total 70,403.25 72,646.08 57,006.45 200,055.78 100.00 Difference between totals and sum of components is due to rounding off.
5.2.2.2.3 Subsidy To NGOs/POs – P621.53 million
Subsidy to NGOs/POs registered an increment of P93.89 million or 17.80
percent from previous year’s P527.64 million. The following departments/offices
reported substantial amount to this account: ARMM – P117.94 million or 18.98
percent, OEOs – P116.41 million or 18.73 percent and DepED– P114.08 million or
18.36 percent.

118
5.2.2.3 Financial Expenses – P318.34 billion
Total Financial Expenses of P318.34 billion for the calendar year grew by P35.57
billion or 12.58 percent compared to P282.77 billion of the previous year. Of the
aggregate, the DOF accounted for P317.93 billion or 99.87 percent, of which
P317.75billion or 99.94 percent was reported by the BTr-GOP in the payment of foreign
and domestic loans and bonds and notes payable.
As exhibited in Table V.2-25, Interest Expenses rose by P38.09 billion or 13.94
percent while Documentary Stamp Expenses and Other Financial Charges dropped by
P2.18 billion or 28.33 percent and P401.35 million or 32.13 percent, respectively.
Table V.2-25 Comparative Components of Financial Expenses
Particulars Amount (in million pesos)
Percent 2012 2011
Increase
(Decrease) Interest Expenses 311,298.74 273,205.27 38,093.48 13.94 Documentary Stamp Expenses 5,520.97 7,703.84 (2,182.87) (28.33) Other Financial Charges 847.95 1,249.30 (401.35) (32.13) Bank Charges 344.97 280.72 64.25 22.89 Commitment Fees 324.28 332.60 (8.32) (2.50)
Total 318,336.90 282,771.72 35,565.18 12.58 Difference between totals and sum of components is due to rounding off.
5.2.2.4 Regional Breakdown of Expenses
Since almost all of the Central Offices are situated in Metro Manila, the NCR
continued to account for the highest amount of expenses totaling P764.53 billion or 55.25
percent. Regions IV, III and VI followed with P93.15 billion or 6.73 percent, P63.63
billion or 4.60 percent and P55.40 billion or 4.00 percent, respectively. On the other
hand, the Foreign Service Posts of DFA reported total expenses of P4.84 billion as
presented in Table V.2-26
The breakdown of expenses by department/office and by region is shown in
Schedule 28, Volume I-B, while the details of expenses, by account and by region are
presented in Schedule 29, Volume I-B.
Table V.2-26 Regional Breakdown of Expenses and Subsidies
(in million pesos)
Region PS MOOE FE Subsidies TOTAL Percentage Distribution
NCR 296,710.19 131,822.22 318,240.15 93,652.95 840,425.51 56.60 I 18,056.22 5,959.05 0.35 20,428.48 44,444.10 2.99 CAR 8,945.21 3,922.27 1.49 9,828.24 22,697.21 1.53 II 13,838.90 5,241.35 2.03 14,748.74 33,831.02 2.28 III 28,181.23 10,388.59 5.91 27,803.43 66,379.17 4.47 IV-A 26,743.95 12,205.24 7.45 31,185.81 70,142.44 4.72 IV-B 9,968.42 3,632.56 0.36 12,326.41 25,927.75 1.75 V 20,711.33 6,346.78 1.94 17,991.27 45,051.32 3.03 VI 25,468.14 7,320.73 28.17 24,357.32 57,174.36 3.85 VII 19,335.32 6,700.95 0.60 20,607.01 46,643.88 3.14 VIII 17,787.58 5,521.65 3.24 18,463.75 41,776.22 2.81 IX 13,440.68 4,866.53 1.11 17,530.38 35,838.70 2.41
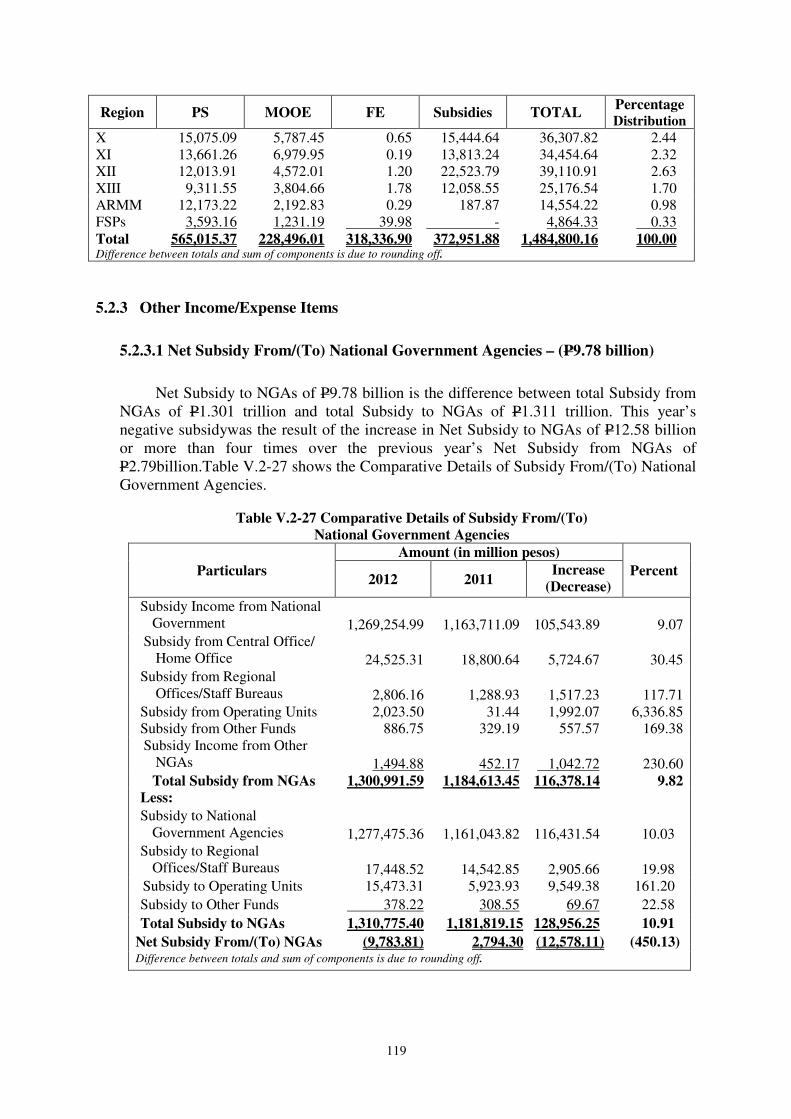
119
Region PS MOOE FE Subsidies TOTAL Percentage Distribution
X 15,075.09 5,787.45 0.65 15,444.64 36,307.82 2.44 XI 13,661.26 6,979.95 0.19 13,813.24 34,454.64 2.32 XII 12,013.91 4,572.01 1.20 22,523.79 39,110.91 2.63 XIII 9,311.55 3,804.66 1.78 12,058.55 25,176.54 1.70 ARMM 12,173.22 2,192.83 0.29 187.87 14,554.22 0.98 FSPs 3,593.16 1,231.19 39.98 . - 4,864.33 0.33 Total 565,015.37 228,496.01 318,336.90 372,951.88 1,484,800.16 100.00 Difference between totals and sum of components is due to rounding off.
5.2.3 Other Income/Expense Items
5.2.3.1 Net Subsidy From/(To) National Government Agencies – (P9.78 billion)
Net Subsidy to NGAs of P9.78 billion is the difference between total Subsidy from
NGAs of P1.301 trillion and total Subsidy to NGAs of P1.311 trillion. This year’s
negative subsidywas the result of the increase in Net Subsidy to NGAs of P12.58 billion
or more than four times over the previous year’s Net Subsidy from NGAs of
P2.79billion.Table V.2-27 shows the Comparative Details of Subsidy From/(To) National
Government Agencies.
Table V.2-27 Comparative Details of Subsidy From/(To) National Government Agencies
Particulars
Amount (in million pesos) Percent
2012 2011 Increase
(Decrease)
Subsidy Income from National
Government
1,269,254.99
1,163,711.09
105,543.89
9.07 Subsidy from Central Office/
Home Office
24,525.31
18,800.64
5,724.67
30.45 Subsidy from Regional
Offices/Staff Bureaus
2,806.16
1,288.93
1,517.23
117.71 Subsidy from Operating Units 2,023.50 31.44 1,992.07 6,336.85 Subsidy from Other Funds 886.75 329.19 557.57 169.38 Subsidy Income from Other
NGAs
1,494.88
452.17
1,042.72
230.60 Total Subsidy from NGAs 1,300,991.59 1,184,613.45 116,378.14 9.82
Less: Subsidy to National
Government Agencies
1,277,475.36
1,161,043.82
116,431.54
10.03 Subsidy to Regional
Offices/Staff Bureaus
17,448.52
14,542.85
2,905.66
19.98 Subsidy to Operating Units 15,473.31 5,923.93 9,549.38 161.20
Subsidy to Other Funds 378.22 308.55 69.67 22.58
Total Subsidy to NGAs 1,310,775.40 1,181,819.15 128,956.25 10.91
Net Subsidy From/(To) NGAs (9,783.81) 2,794.30 (12,578.11) (450.13) Difference between totals and sum of components is due to rounding off.
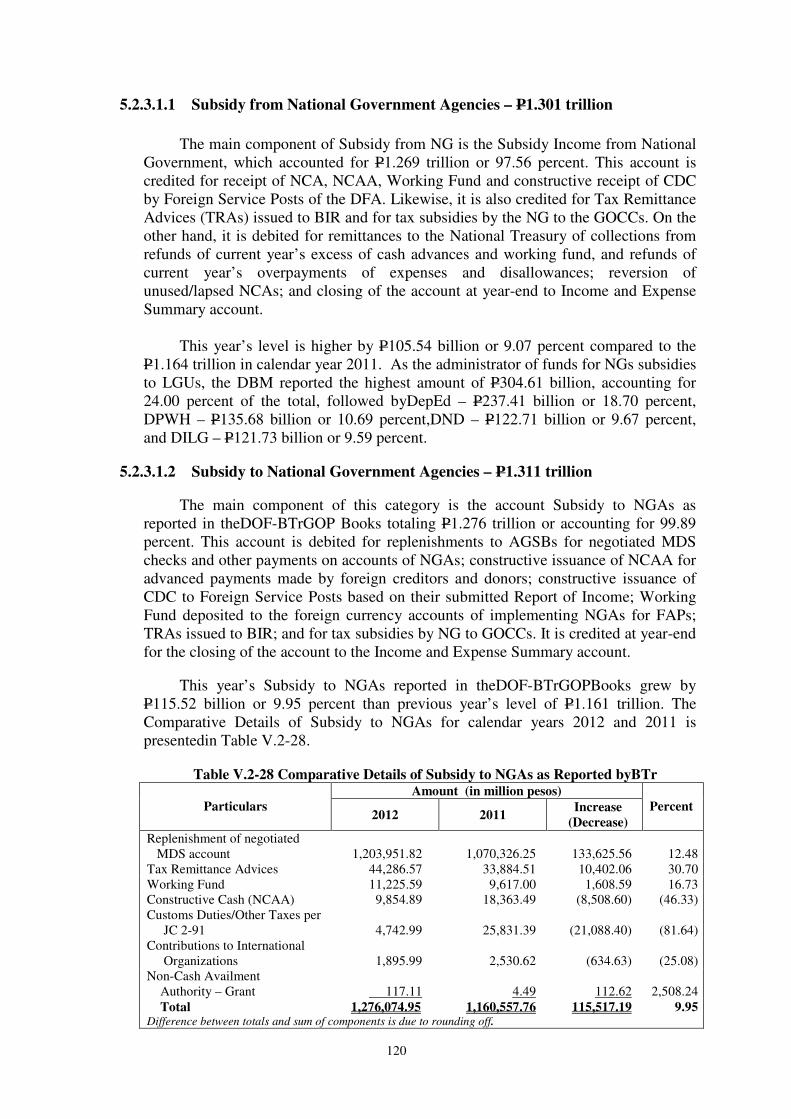
120
5.2.3.1.1 Subsidy from National Government Agencies – P1.301 trillion
The main component of Subsidy from NG is the Subsidy Income from National
Government, which accounted for P1.269 trillion or 97.56 percent. This account is
credited for receipt of NCA, NCAA, Working Fund and constructive receipt of CDC
by Foreign Service Posts of the DFA. Likewise, it is also credited for Tax Remittance
Advices (TRAs) issued to BIR and for tax subsidies by the NG to the GOCCs. On the
other hand, it is debited for remittances to the National Treasury of collections from
refunds of current year’s excess of cash advances and working fund, and refunds of
current year’s overpayments of expenses and disallowances; reversion of
unused/lapsed NCAs; and closing of the account at year-end to Income and Expense
Summary account.
This year’s level is higher by P105.54 billion or 9.07 percent compared to the
P1.164 trillion in calendar year 2011. As the administrator of funds for NGs subsidies
to LGUs, the DBM reported the highest amount of P304.61 billion, accounting for
24.00 percent of the total, followed byDepEd – P237.41 billion or 18.70 percent,
DPWH – P135.68 billion or 10.69 percent,DND – P122.71 billion or 9.67 percent,
and DILG – P121.73 billion or 9.59 percent.
5.2.3.1.2 Subsidy to National Government Agencies – P1.311 trillion
The main component of this category is the account Subsidy to NGAs as
reported in theDOF-BTrGOP Books totaling P1.276 trillion or accounting for 99.89
percent. This account is debited for replenishments to AGSBs for negotiated MDS
checks and other payments on accounts of NGAs; constructive issuance of NCAA for
advanced payments made by foreign creditors and donors; constructive issuance of
CDC to Foreign Service Posts based on their submitted Report of Income; Working
Fund deposited to the foreign currency accounts of implementing NGAs for FAPs;
TRAs issued to BIR; and for tax subsidies by NG to GOCCs. It is credited at year-end
for the closing of the account to the Income and Expense Summary account.
This year’s Subsidy to NGAs reported in theDOF-BTrGOPBooks grew by
P115.52 billion or 9.95 percent than previous year’s level of P1.161 trillion. The
Comparative Details of Subsidy to NGAs for calendar years 2012 and 2011 is
presentedin Table V.2-28.
Table V.2-28 Comparative Details of Subsidy to NGAs as Reported byBTr
Particulars
Amount (in million pesos)
Percent
2012 2011
Increase
(Decrease)
Replenishment of negotiated
MDS account
1,203,951.82
1,070,326.25
133,625.56
12.48
Tax Remittance Advices 44,286.57 33,884.51 10,402.06 30.70
Working Fund 11,225.59 9,617.00 1,608.59 16.73
Constructive Cash (NCAA) 9,854.89 18,363.49 (8,508.60) (46.33)
Customs Duties/Other Taxes per
JC 2-91
4,742.99
25,831.39
(21,088.40)
(81.64)
Contributions to International
Organizations
1,895.99
2,530.62
(634.63)
(25.08)
Non-Cash Availment
Authority – Grant
117.11
.4.49
.112.62
2,508.24
Total 1,276,074.95 1,160,557.76 115,517.19 9.95 Difference between totals and sum of components is due to rounding off.
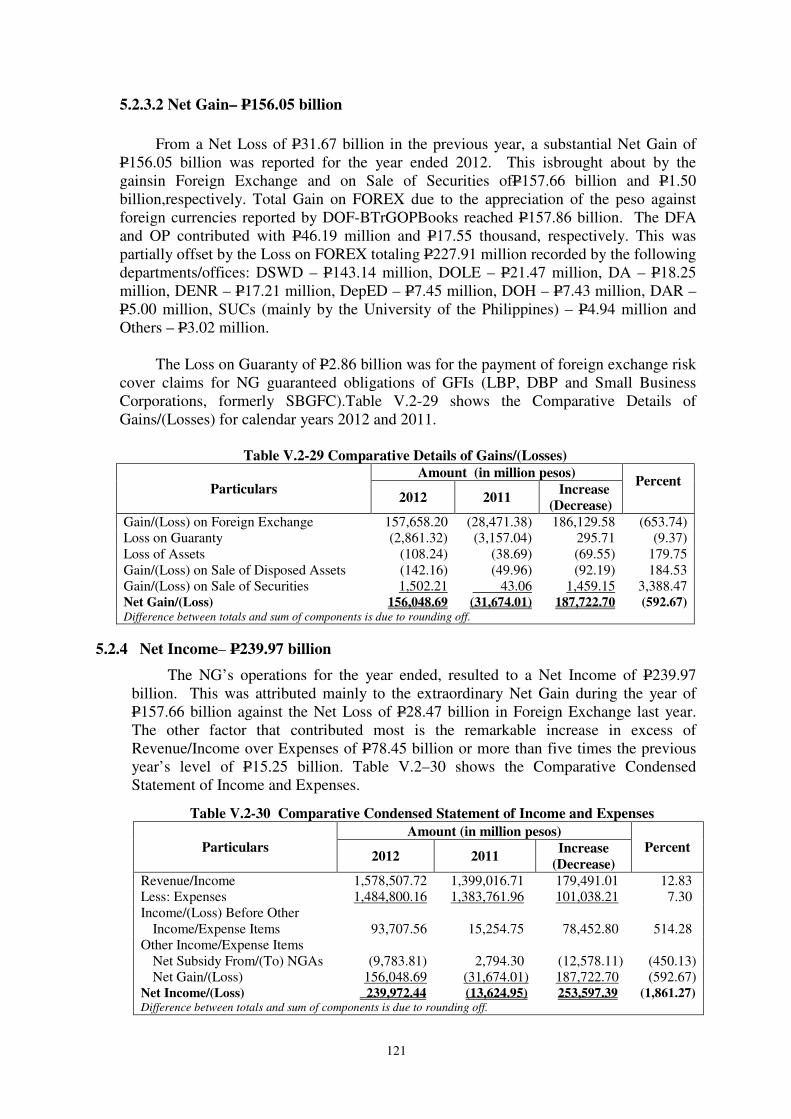
121
5.2.3.2 Net Gain– P156.05 billion
From a Net Loss of P31.67 billion in the previous year, a substantial Net Gain of
P156.05 billion was reported for the year ended 2012. This isbrought about by the
gainsin Foreign Exchange and on Sale of Securities ofP157.66 billion and P1.50
billion,respectively. Total Gain on FOREX due to the appreciation of the peso against
foreign currencies reported by DOF-BTrGOPBooks reached P157.86 billion. The DFA
and OP contributed with P46.19 million and P17.55 thousand, respectively. This was
partially offset by the Loss on FOREX totaling P227.91 million recorded by the following
departments/offices: DSWD – P143.14 million, DOLE – P21.47 million, DA – P18.25
million, DENR – P17.21 million, DepED – P7.45 million, DOH – P7.43 million, DAR –
P5.00 million, SUCs (mainly by the University of the Philippines) – P4.94 million and
Others – P3.02 million.
The Loss on Guaranty of P2.86 billion was for the payment of foreign exchange risk
cover claims for NG guaranteed obligations of GFIs (LBP, DBP and Small Business
Corporations, formerly SBGFC).Table V.2-29 shows the Comparative Details of
Gains/(Losses) for calendar years 2012 and 2011.
Table V.2-29 Comparative Details of Gains/(Losses)
Particulars
Amount (in million pesos) Percent
2012 2011 Increase
(Decrease)
Gain/(Loss) on Foreign Exchange 157,658.20 (28,471.38) 186,129.58 (653.74)
Loss on Guaranty (2,861.32) (3,157.04) 295.71 (9.37)
Loss of Assets (108.24) (38.69) (69.55) 179.75
Gain/(Loss) on Sale of Disposed Assets (142.16) (49.96) (92.19) 184.53
Gain/(Loss) on Sale of Securities 1,502.21 43.06 1,459.15 3,388.47 Net Gain/(Loss) 156,048.69 (31,674.01) 187,722.70 (592.67) Difference between totals and sum of components is due to rounding off.
5.2.4 Net Income– P239.97 billion
The NG’s operations for the year ended, resulted to a Net Income of P239.97
billion. This was attributed mainly to the extraordinary Net Gain during the year of
P157.66 billion against the Net Loss of P28.47 billion in Foreign Exchange last year.
The other factor that contributed most is the remarkable increase in excess of
Revenue/Income over Expenses of P78.45 billion or more than five times the previous
year’s level of P15.25 billion. Table V.2–30 shows the Comparative Condensed
Statement of Income and Expenses.
Table V.2-30 Comparative Condensed Statement of Income and Expenses
Particulars
Amount (in million pesos)
Percent 2012 2011
Increase
(Decrease)
Revenue/Income 1,578,507.72 1,399,016.71 179,491.01 12.83
Less: Expenses 1,484,800.16 1,383,761.96 101,038.21 7.30
Income/(Loss) Before Other
Income/Expense Items 93,707.56 15,254.75 78,452.80 514.28
Other Income/Expense Items
Net Subsidy From/(To) NGAs (9,783.81) 2,794.30 (12,578.11) (450.13)
Net Gain/(Loss) 156,048.69 (31,674.01) 187,722.70 (592.67) Net Income/(Loss) 239,972.44 (13,624.95) 253,597.39 (1,861.27) Difference between totals and sum of components is due to rounding off.
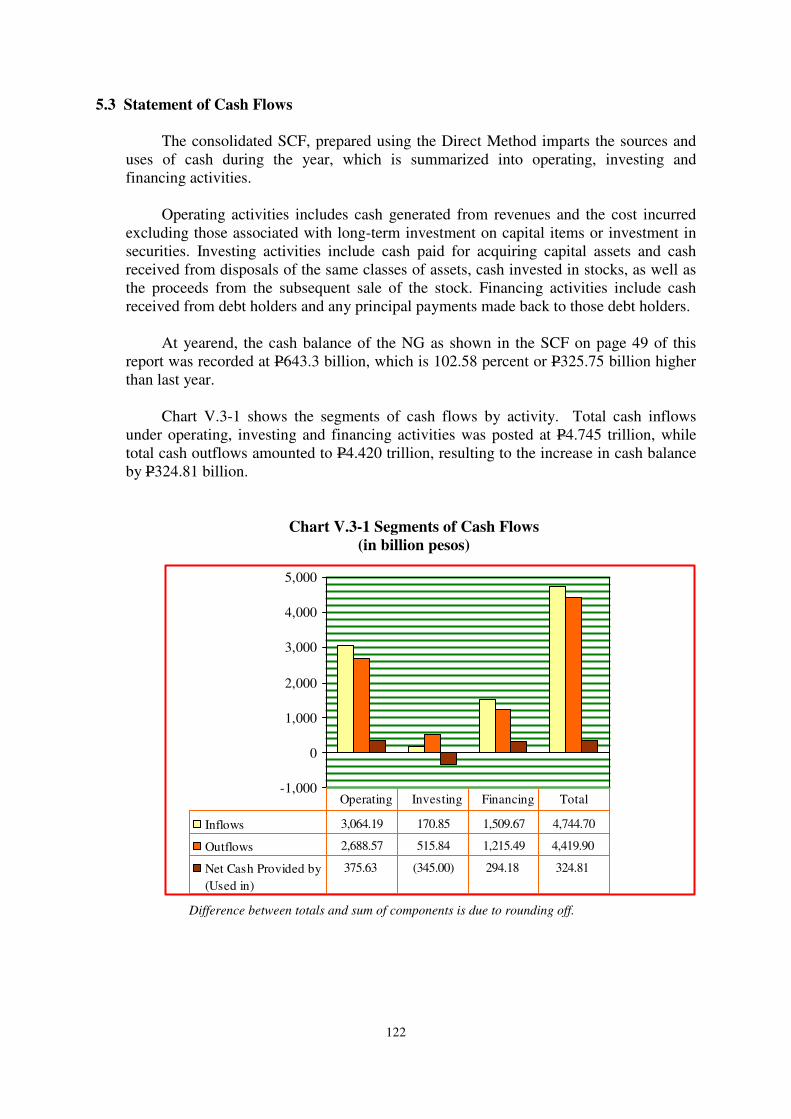
122
5.3 Statement of Cash Flows
The consolidated SCF, prepared using the Direct Method imparts the sources and
uses of cash during the year, which is summarized into operating, investing and
financing activities.
Operating activities includes cash generated from revenues and the cost incurred
excluding those associated with long-term investment on capital items or investment in
securities. Investing activities include cash paid for acquiring capital assets and cash
received from disposals of the same classes of assets, cash invested in stocks, as well as
the proceeds from the subsequent sale of the stock. Financing activities include cash
received from debt holders and any principal payments made back to those debt holders.
At yearend, the cash balance of the NG as shown in the SCF on page 49 of this
report was recorded at P643.3 billion, which is 102.58 percent or P325.75 billion higher
than last year.
Chart V.3-1 shows the segments of cash flows by activity. Total cash inflows
under operating, investing and financing activities was posted at P4.745 trillion, while
total cash outflows amounted to P4.420 trillion, resulting to the increase in cash balance
by P324.81 billion.
Chart V.3-1 Segments of Cash Flows
(in billion pesos)
Difference between totals and sum of components is due to rounding off.
-1,000
0
1,000
2,000
3,000
4,000
5,000
Inflows 3,064.19 170.85 1,509.67 4,744.70
Outflows 2,688.57 515.84 1,215.49 4,419.90
Net Cash Provided by
(Used in)
375.63 (345.00) 294.18 324.81
Operating Investing Financing Total
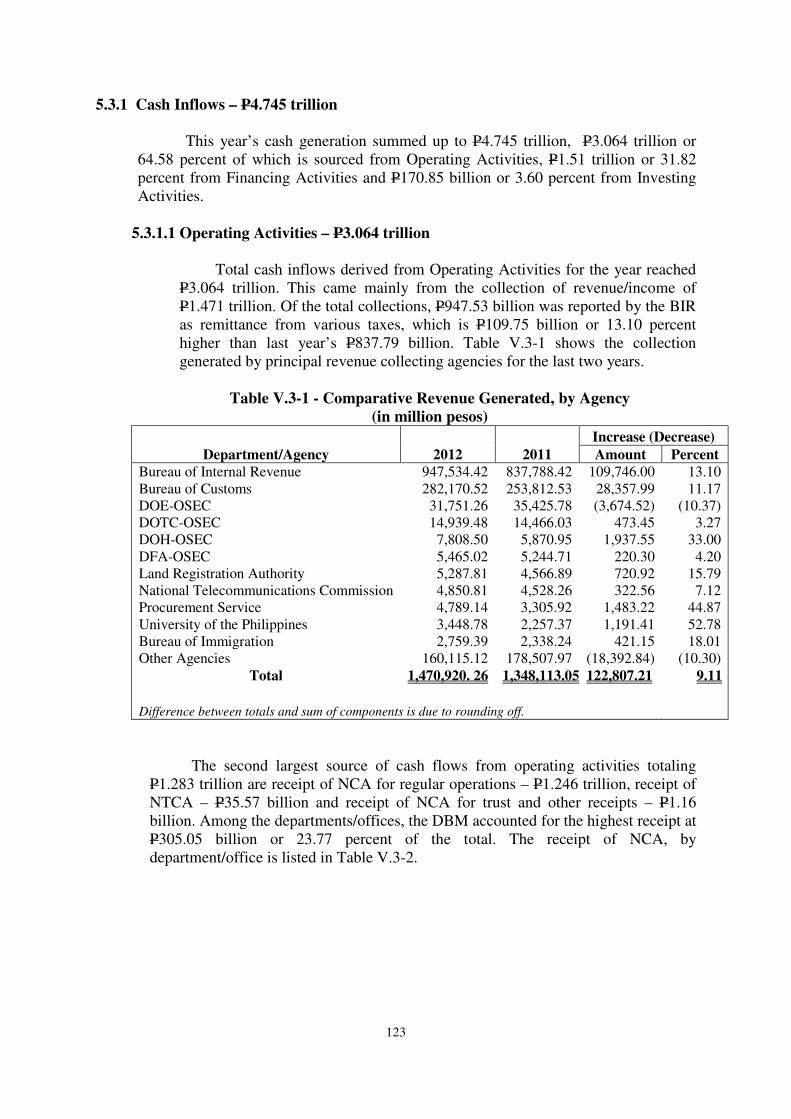
123
5.3.1 Cash Inflows – P4.745 trillion
This year’s cash generation summed up to P4.745 trillion, P3.064 trillion or
64.58 percent of which is sourced from Operating Activities, P1.51 trillion or 31.82
percent from Financing Activities and P170.85 billion or 3.60 percent from Investing
Activities.
5.3.1.1 Operating Activities – P3.064 trillion
Total cash inflows derived from Operating Activities for the year reached
P3.064 trillion. This came mainly from the collection of revenue/income of
P1.471 trillion. Of the total collections, P947.53 billion was reported by the BIR
as remittance from various taxes, which is P109.75 billion or 13.10 percent
higher than last year’s P837.79 billion. Table V.3-1 shows the collection
generated by principal revenue collecting agencies for the last two years.
Table V.3-1 - Comparative Revenue Generated, by Agency
(in million pesos)
Department/Agency 2012 2011
Increase (Decrease)
Amount Percent
Bureau of Internal Revenue 947,534.42 837,788.42 109,746.00 13.10
Bureau of Customs 282,170.52 253,812.53 28,357.99 11.17
DOE-OSEC 31,751.26 35,425.78 (3,674.52) (10.37)
DOTC-OSEC 14,939.48 14,466.03 473.45 3.27
DOH-OSEC 7,808.50 5,870.95 1,937.55 33.00
DFA-OSEC 5,465.02 5,244.71 220.30 4.20
Land Registration Authority 5,287.81 4,566.89 720.92 15.79
National Telecommunications Commission 4,850.81 4,528.26 322.56 7.12
Procurement Service 4,789.14 3,305.92 1,483.22 44.87
University of the Philippines 3,448.78 2,257.37 1,191.41 52.78
Bureau of Immigration 2,759.39 2,338.24 421.15 18.01
Other Agencies 160,115.12 178,507.97 (18,392.84) (10.30)
Total 1,470,920. 26 1,348,113.05 122,807.21 9.11
Difference between totals and sum of components is due to rounding off.
The second largest source of cash flows from operating activities totaling
P1.283 trillion are receipt of NCA for regular operations – P1.246 trillion, receipt of
NTCA – P35.57 billion and receipt of NCA for trust and other receipts – P1.16
billion. Among the departments/offices, the DBM accounted for the highest receipt at
P305.05 billion or 23.77 percent of the total. The receipt of NCA, by
department/office is listed in Table V.3-2.
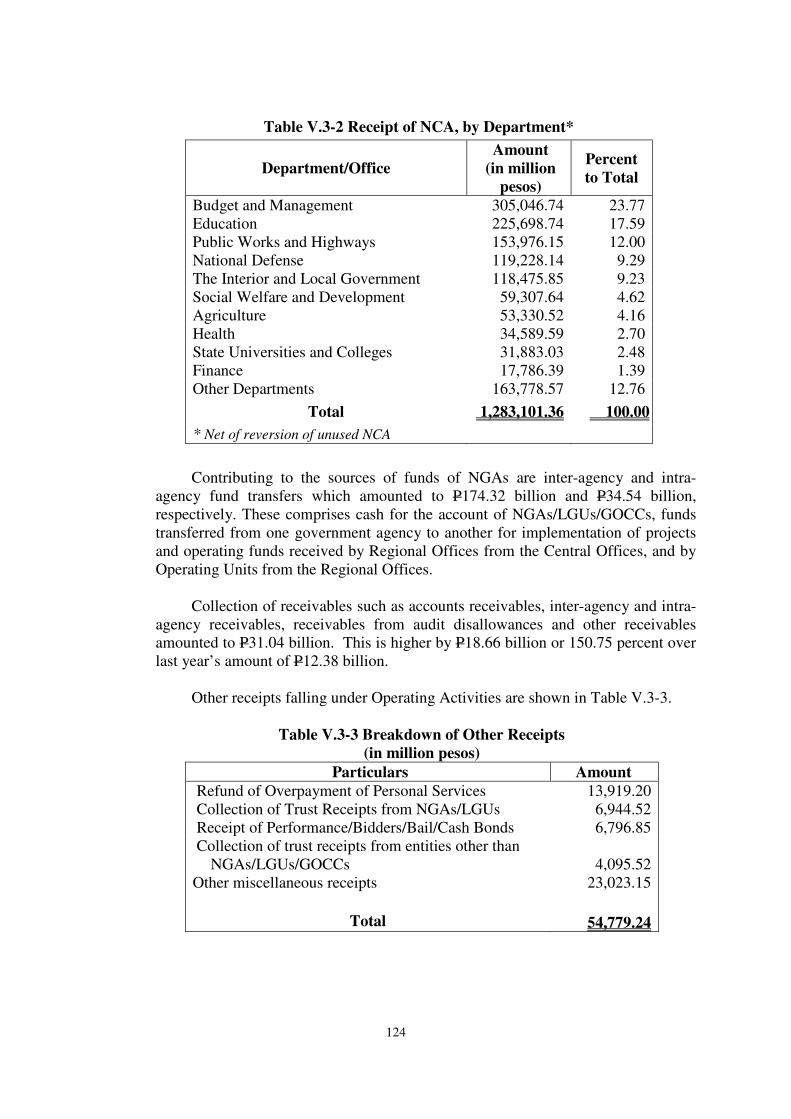
124
Table V.3-2 Receipt of NCA, by Department*
Department/Office
Amount
(in million
pesos)
Percent
to Total
Budget and Management 305,046.74 23.77
Education 225,698.74 17.59
Public Works and Highways 153,976.15 12.00
National Defense 119,228.14 9.29
The Interior and Local Government 118,475.85 9.23
Social Welfare and Development 59,307.64 4.62
Agriculture 53,330.52 4.16
Health 34,589.59 2.70
State Universities and Colleges 31,883.03 2.48
Finance 17,786.39 1.39
Other Departments 163,778.57 12.76
Total 1,283,101.36 100.00
* Net of reversion of unused NCA
Contributing to the sources of funds of NGAs are inter-agency and intra-
agency fund transfers which amounted to P174.32 billion and P34.54 billion,
respectively. These comprises cash for the account of NGAs/LGUs/GOCCs, funds
transferred from one government agency to another for implementation of projects
and operating funds received by Regional Offices from the Central Offices, and by
Operating Units from the Regional Offices.
Collection of receivables such as accounts receivables, inter-agency and intra-
agency receivables, receivables from audit disallowances and other receivables
amounted to P31.04 billion. This is higher by P18.66 billion or 150.75 percent over
last year’s amount of P12.38 billion.
Other receipts falling under Operating Activities are shown in Table V.3-3.
Table V.3-3 Breakdown of Other Receipts
(in million pesos)
Particulars Amount
Refund of Overpayment of Personal Services 13,919.20
Collection of Trust Receipts from NGAs/LGUs 6,944.52
Receipt of Performance/Bidders/Bail/Cash Bonds 6,796.85
Collection of trust receipts from entities other than
NGAs/LGUs/GOCCs 4,095.52
Other miscellaneous receipts 23,023.15
Total 54,779.24
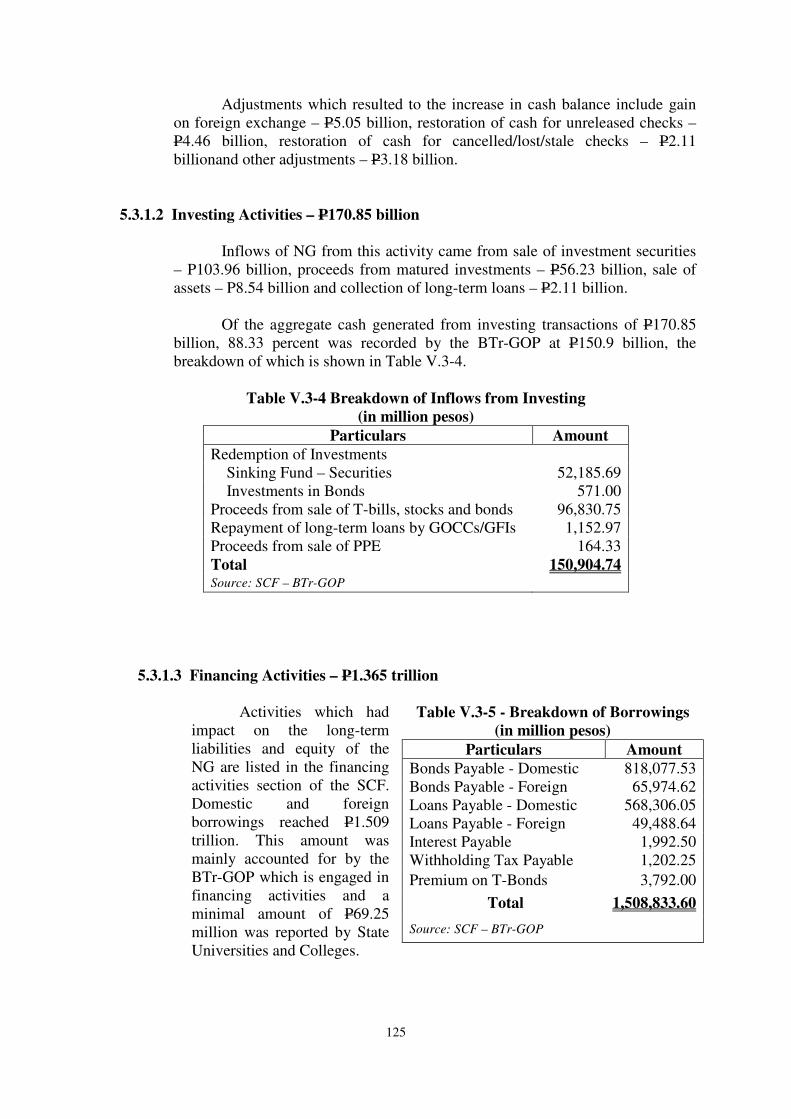
125
Adjustments which resulted to the increase in cash balance include gain
on foreign exchange – P5.05 billion, restoration of cash for unreleased checks –
P4.46 billion, restoration of cash for cancelled/lost/stale checks – P2.11
billionand other adjustments – P3.18 billion.
5.3.1.2 Investing Activities – P170.85 billion
Inflows of NG from this activity came from sale of investment securities
– P103.96 billion, proceeds from matured investments – P56.23 billion, sale of
assets – P8.54 billion and collection of long-term loans – P2.11 billion.
Of the aggregate cash generated from investing transactions of P170.85
billion, 88.33 percent was recorded by the BTr-GOP at P150.9 billion, the
breakdown of which is shown in Table V.3-4.
Table V.3-4 Breakdown of Inflows from Investing
(in million pesos)
Particulars Amount
Redemption of Investments
Sinking Fund – Securities 52,185.69
Investments in Bonds 571.00
Proceeds from sale of T-bills, stocks and bonds 96,830.75
Repayment of long-term loans by GOCCs/GFIs 1,152.97
Proceeds from sale of PPE 164.33
Total 150,904.74 Source: SCF – BTr-GOP
5.3.1.3 Financing Activities – P1.365 trillion
Activities which had
impact on the long-term
liabilities and equity of the
NG are listed in the financing
activities section of the SCF.
Domestic and foreign
borrowings reached P1.509
trillion. This amount was
mainly accounted for by the
BTr-GOP which is engaged in
financing activities and a
minimal amount of P69.25
million was reported by State
Universities and Colleges.
Table V.3-5 - Breakdown of Borrowings
(in million pesos)
Particulars Amount
Bonds Payable - Domestic 818,077.53
Bonds Payable - Foreign 65,974.62
Loans Payable - Domestic 568,306.05
Loans Payable - Foreign 49,488.64
Interest Payable 1,992.50
Withholding Tax Payable 1,202.25
Premium on T-Bonds 3,792.00
Total 1,508,833.60
Source: SCF – BTr-GOP
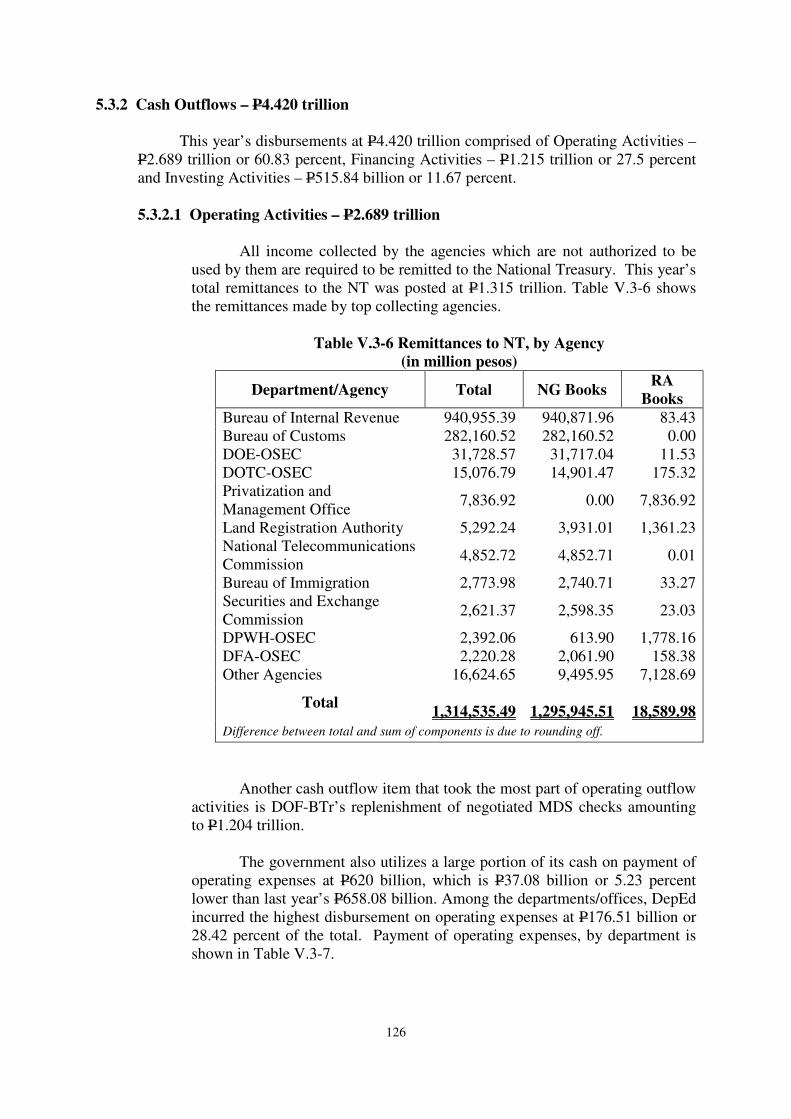
126
5.3.2 Cash Outflows – P4.420 trillion
This year’s disbursements at P4.420 trillion comprised of Operating Activities –
P2.689 trillion or 60.83 percent, Financing Activities – P1.215 trillion or 27.5 percent
and Investing Activities – P515.84 billion or 11.67 percent.
5.3.2.1 Operating Activities – P2.689 trillion
All income collected by the agencies which are not authorized to be
used by them are required to be remitted to the National Treasury. This year’s
total remittances to the NT was posted at P1.315 trillion. Table V.3-6 shows
the remittances made by top collecting agencies.
Table V.3-6 Remittances to NT, by Agency
(in million pesos)
Department/Agency Total NG Books RA
Books
Bureau of Internal Revenue 940,955.39 940,871.96 83.43
Bureau of Customs 282,160.52 282,160.52 0.00
DOE-OSEC 31,728.57 31,717.04 11.53
DOTC-OSEC 15,076.79 14,901.47 175.32
Privatization and
Management Office 7,836.92 0.00 7,836.92
Land Registration Authority 5,292.24 3,931.01 1,361.23
National Telecommunications
Commission 4,852.72 4,852.71 0.01
Bureau of Immigration 2,773.98 2,740.71 33.27
Securities and Exchange
Commission 2,621.37 2,598.35 23.03
DPWH-OSEC 2,392.06 613.90 1,778.16
DFA-OSEC 2,220.28 2,061.90 158.38
Other Agencies 16,624.65 9,495.95 7,128.69
Total 1,314,535.49 1,295,945.51
18,589.98
Difference between total and sum of components is due to rounding off.
Another cash outflow item that took the most part of operating outflow
activities is DOF-BTr’s replenishment of negotiated MDS checks amounting
to P1.204 trillion.
The government also utilizes a large portion of its cash on payment of
operating expenses at P620 billion, which is P37.08 billion or 5.23 percent
lower than last year’s P658.08 billion. Among the departments/offices, DepEd
incurred the highest disbursement on operating expenses at P176.51 billion or
28.42 percent of the total. Payment of operating expenses, by department is
shown in Table V.3-7.
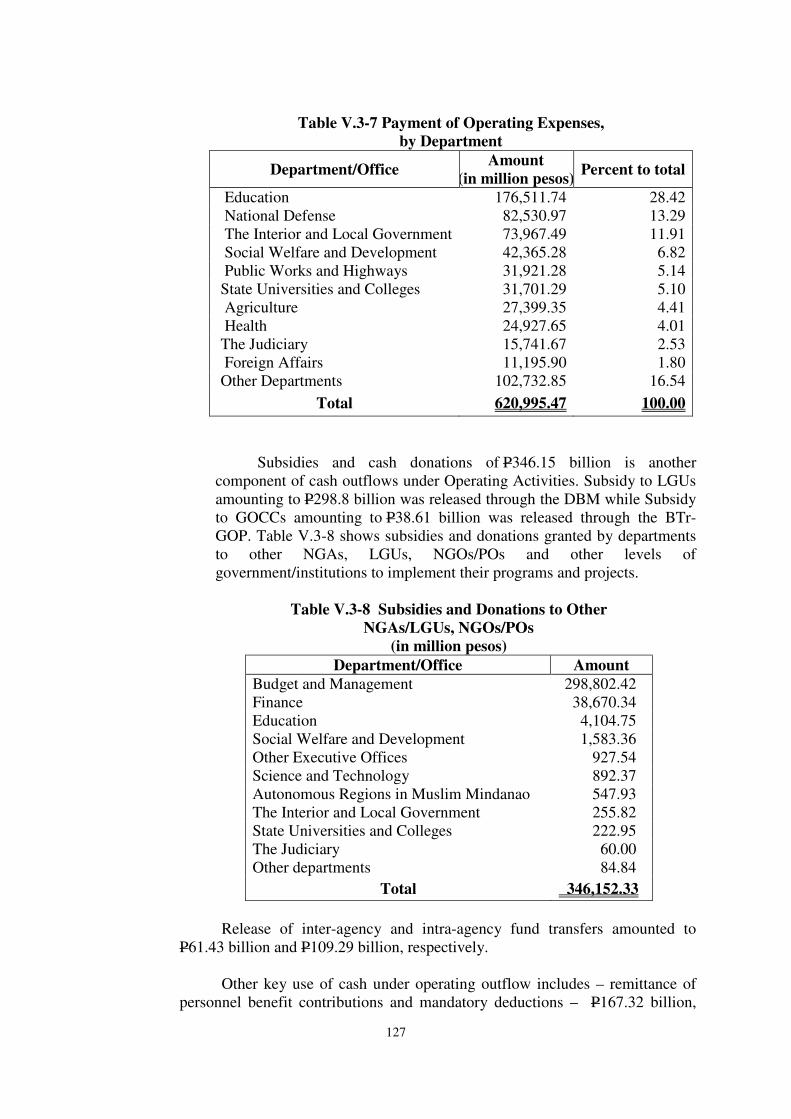
127
Table V.3-7 Payment of Operating Expenses,
by Department
Department/Office Amount
(in million pesos)Percent to total
Education 176,511.74 28.42
National Defense 82,530.97 13.29
The Interior and Local Government 73,967.49 11.91
Social Welfare and Development 42,365.28 6.82
Public Works and Highways 31,921.28 5.14
State Universities and Colleges 31,701.29 5.10
Agriculture 27,399.35 4.41
Health 24,927.65 4.01
The Judiciary 15,741.67 2.53
Foreign Affairs 11,195.90 1.80
Other Departments 102,732.85 16.54
Total 620,995.47 100.00
Subsidies and cash donations of P346.15 billion is another
component of cash outflows under Operating Activities. Subsidy to LGUs
amounting to P298.8 billion was released through the DBM while Subsidy
to GOCCs amounting to P38.61 billion was released through the BTr-
GOP. Table V.3-8 shows subsidies and donations granted by departments
to other NGAs, LGUs, NGOs/POs and other levels of
government/institutions to implement their programs and projects.
Table V.3-8 Subsidies and Donations to Other
NGAs/LGUs, NGOs/POs
(in million pesos)
Department/Office Amount
Budget and Management 298,802.42
Finance 38,670.34
Education 4,104.75
Social Welfare and Development 1,583.36
Other Executive Offices 927.54
Science and Technology 892.37
Autonomous Regions in Muslim Mindanao 547.93
The Interior and Local Government 255.82
State Universities and Colleges 222.95
The Judiciary 60.00
Other departments 84.84
Total 346,152.33
Release of inter-agency and intra-agency fund transfers amounted to
P61.43 billion and P109.29 billion, respectively.
Other key use of cash under operating outflow includes – remittance of
personnel benefit contributions and mandatory deductions – P167.32 billion,
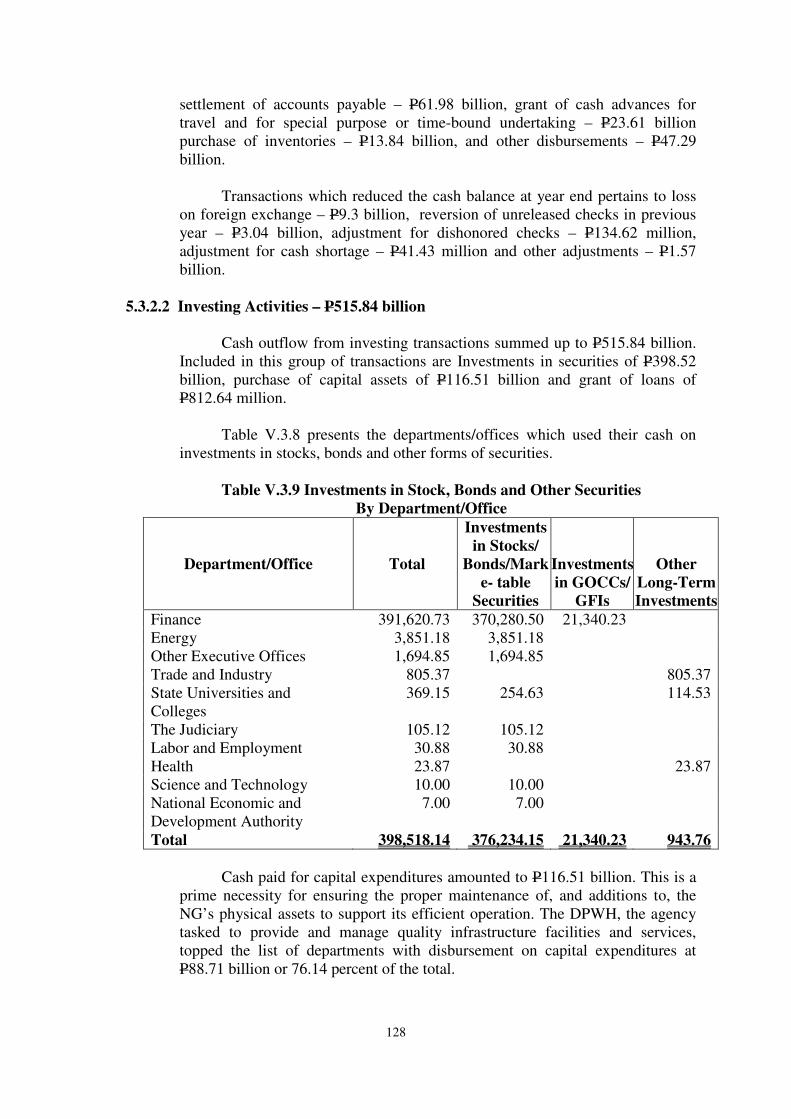
128
settlement of accounts payable – P61.98 billion, grant of cash advances for
travel and for special purpose or time-bound undertaking – P23.61 billion
purchase of inventories – P13.84 billion, and other disbursements – P47.29
billion.
Transactions which reduced the cash balance at year end pertains to loss
on foreign exchange – P9.3 billion, reversion of unreleased checks in previous
year – P3.04 billion, adjustment for dishonored checks – P134.62 million,
adjustment for cash shortage – P41.43 million and other adjustments – P1.57
billion.
5.3.2.2 Investing Activities – P515.84 billion
Cash outflow from investing transactions summed up to P515.84 billion.
Included in this group of transactions are Investments in securities of P398.52
billion, purchase of capital assets of P116.51 billion and grant of loans of
P812.64 million.
Table V.3.8 presents the departments/offices which used their cash on
investments in stocks, bonds and other forms of securities.
Table V.3.9 Investments in Stock, Bonds and Other Securities
By Department/Office
Department/Office Total
Investments
in Stocks/
Bonds/Mark
e- table
Securities
Investments
in GOCCs/
GFIs
Other
Long-Term
Investments
Finance 391,620.73 370,280.50 21,340.23
Energy 3,851.18 3,851.18
Other Executive Offices 1,694.85 1,694.85
Trade and Industry 805.37 805.37
State Universities and
Colleges
369.15 254.63 114.53
The Judiciary 105.12 105.12
Labor and Employment 30.88 30.88
Health 23.87 23.87
Science and Technology 10.00 10.00
National Economic and
Development Authority
7.00 7.00
Total 398,518.14 376,234.15 21,340.23 943.76
Cash paid for capital expenditures amounted to P116.51 billion. This is a
prime necessity for ensuring the proper maintenance of, and additions to, the
NG’s physical assets to support its efficient operation. The DPWH, the agency
tasked to provide and manage quality infrastructure facilities and services,
topped the list of departments with disbursement on capital expenditures at
P88.71 billion or 76.14 percent of the total.
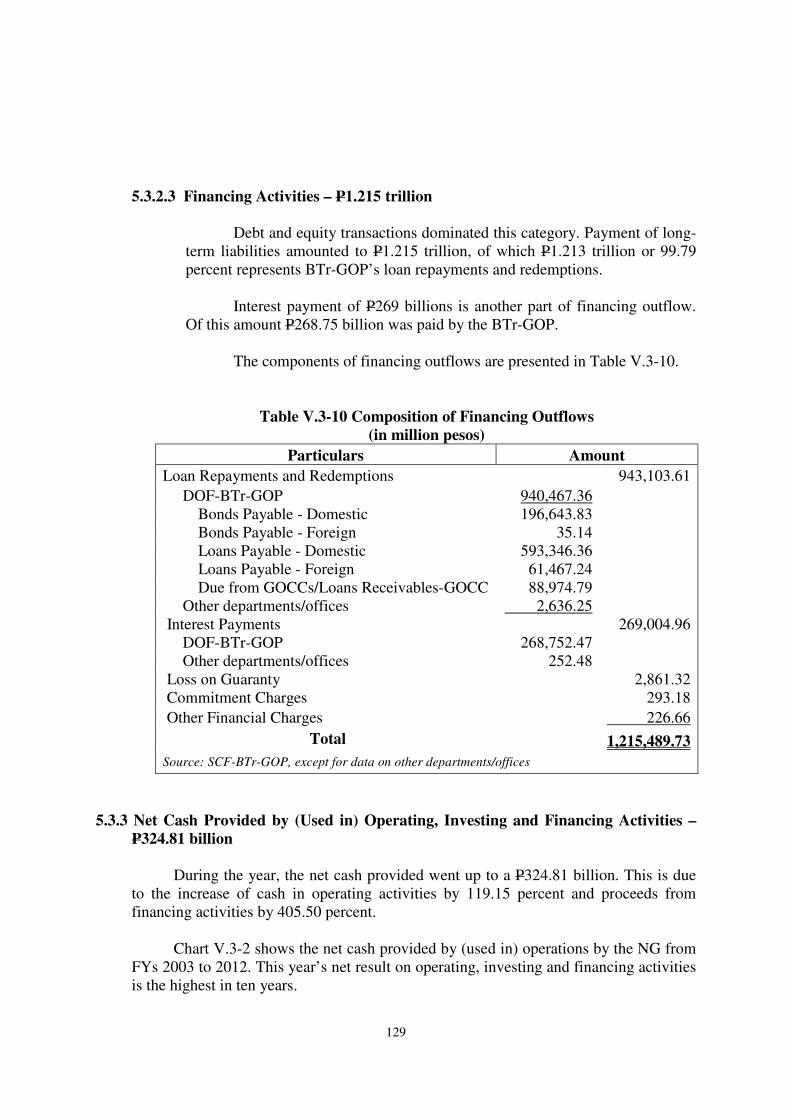
129
5.3.2.3 Financing Activities – P1.215 trillion
Debt and equity transactions dominated this category. Payment of long-
term liabilities amounted to P1.215 trillion, of which P1.213 trillion or 99.79
percent represents BTr-GOP’s loan repayments and redemptions.
Interest payment of P269 billions is another part of financing outflow.
Of this amount P268.75 billion was paid by the BTr-GOP.
The components of financing outflows are presented in Table V.3-10.
Table V.3-10 Composition of Financing Outflows
(in million pesos)
Particulars Amount
Loan Repayments and Redemptions 943,103.61
DOF-BTr-GOP 940,467.36
Bonds Payable - Domestic 196,643.83
Bonds Payable - Foreign 35.14
Loans Payable - Domestic 593,346.36
Loans Payable - Foreign 61,467.24
Due from GOCCs/Loans Receivables-GOCC 88,974.79
Other departments/offices 2,636.25
Interest Payments 269,004.96
DOF-BTr-GOP 268,752.47
Other departments/offices 252.48
Loss on Guaranty 2,861.32
Commitment Charges 293.18
Other Financial Charges 226.66
Total 1,215,489.73
Source: SCF-BTr-GOP, except for data on other departments/offices
5.3.3 Net Cash Provided by (Used in) Operating, Investing and Financing Activities –
P324.81 billion
During the year, the net cash provided went up to a P324.81 billion. This is due
to the increase of cash in operating activities by 119.15 percent and proceeds from
financing activities by 405.50 percent.
Chart V.3-2 shows the net cash provided by (used in) operations by the NG from
FYs 2003 to 2012. This year’s net result on operating, investing and financing activities
is the highest in ten years.
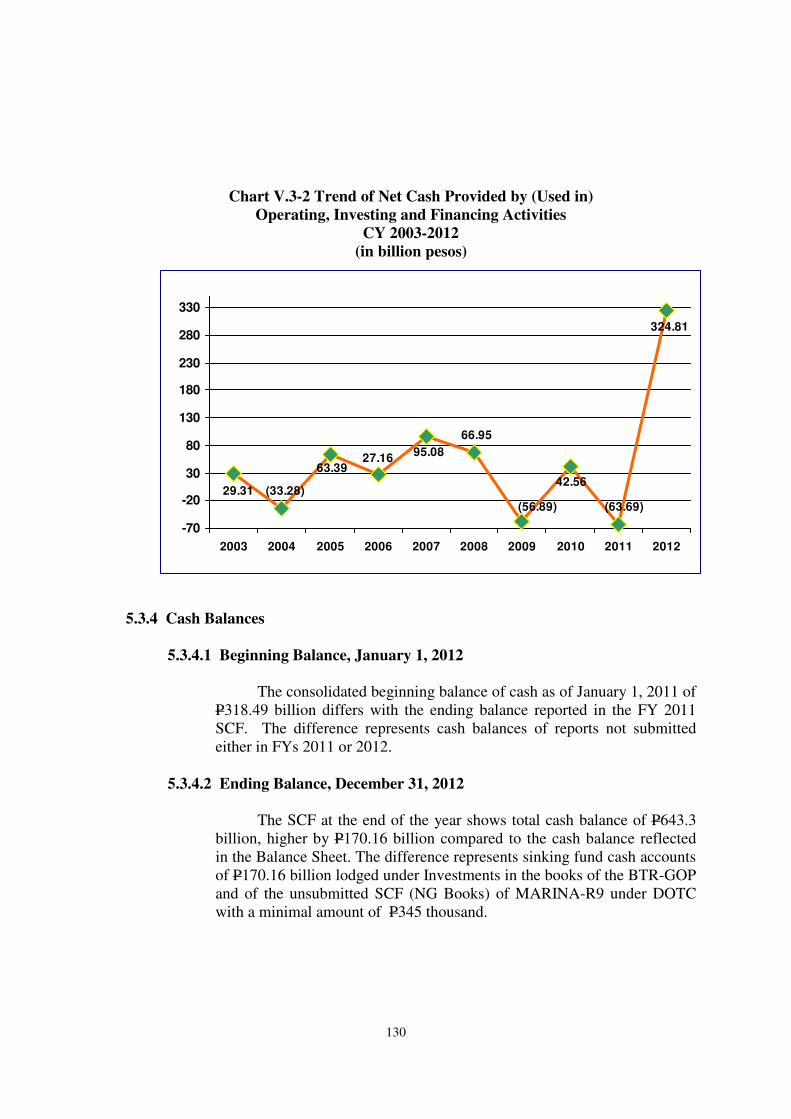
130
Chart V.3-2 Trend of Net Cash Provided by (Used in)
Operating, Investing and Financing Activities
CY 2003-2012
(in billion pesos)
5.3.4 Cash Balances
5.3.4.1 Beginning Balance, January 1, 2012
The consolidated beginning balance of cash as of January 1, 2011 of
P318.49 billion differs with the ending balance reported in the FY 2011
SCF. The difference represents cash balances of reports not submitted
either in FYs 2011 or 2012.
5.3.4.2 Ending Balance, December 31, 2012
The SCF at the end of the year shows total cash balance of P643.3
billion, higher by P170.16 billion compared to the cash balance reflected
in the Balance Sheet. The difference represents sinking fund cash accounts
of P170.16 billion lodged under Investments in the books of the BTR-GOP
and of the unsubmitted SCF (NG Books) of MARINA-R9 under DOTC
with a minimal amount of P345 thousand.
324.81
63.3927.16
(33.28)42.56
66.95
95.08
29.31
(63.69)(56.89)
-70
-20
30
80
130
180
230
280
330
2003 2004 2005 2006 2007 2008 2009 2010 2011 2012
VI. NATIONAL
GOVERNMENT DEBT
131
NATIONAL GOVERNMENT DEBT
6.1 Introduction
The National Budget for CY 2012 banked on improved collection efficiency
through better tax administration and widened tax base, coupled with the strategic
management of our debt. To attain these, the National Government (NG)
strengthened and provided funding support to the existing tax administration
measures and policy reforms implemented by the two major collecting agencies,
the Bureau of Internal Revenue (BIR) and the Bureau of Customs (BOC). The
medium-term debt strategy adopted by the NG was focused on reducing the NG’s
foreign currency denominated debt, meeting the government’s financing
requirement at minimal cost consistent with an acceptable level of risk and further
supporting the development of the domestic capital and debt market.
The debt strategy was pursued through reducing foreign exchange risk
exposure by increasing domestic borrowing and reducing foreign currency
denominated debt within the portfolio; mitigating the refinancing or roll-over risk
by lengthening the maturity of NG debt through bond exchange; and supporting
the development of domestic capital and securities market, among others. The debt
profile was improved by extending the maturities of current debt and
redenominated the external debt through the issuance of peso- denominated bonds
in the international market. To reduce the country’s vulnerability to external
shocks, the NG redefined the foreign-to-domestic borrowing mix to 36:64.
Although national revenue has increased over the last three years, it is still
insufficient to back up the capital programs and projects of the government. Thus,
the government has resorted to borrowings to finance its developmental programs.
This section of the AFR gives us a view on the total NG direct loans, GOCCs
loans that were assumed by the NG and those loans contracted by the NG but were
relent to GOCCs.
6.2 Definition of Terms
Public Debt – includes the total indebtedness of the National Government,
local government and government corporations or financial institutions
from industries, corporations or financial institutions, whether private or
government, foreign or domestic, which are fully supported and guaranteed
by NG. (2013 BESF Glossary of Terms)
Foreign Debt – Indebtedness covered by loan agreements entered into by
and between the NG and foreign lending institutions availed of by
NGAs/GOCCs and bonds issued by the NG in foreign countries such as
Global Bonds, Euro Bonds and Japanese Bonds.
132
Domestic Debt – bonds, notes, certificates of indebtedness, bills and other
direct obligations issued by the government on the domestic market.
(DMFAS Glossary of Terms)
Government Securities – evidences of indebtedness of the Republic of the
Philippines or its instrumentalities, government-owned and/or controlled
corporations, or the Central Bank and must be freely negotiable and
regularly serviced. (2013 BESF Glossary of Terms)
Treasury Bills – Short-term debt instruments issued by the NG. (2013
BESF Glossary of Terms)
Fixed Rate Treasury Bonds – direct and unconditional obligations of the
NG, interest bearing and carry a term of more than one year and can be
traded in the secondary market before maturity.
Treasury Bonds/Notes – certificates of indebtedness issued by the National
Government, the maturity of which extends beyond one year. (2013 BESF
Glossary of Terms)
Retail Treasury Bonds – direct and unconditional obligations of the NG
which primarily caters to the retail market or the end-users. They are
interest bearing and carry a term of more than one year and can be traded in
the secondary market before maturity.
Multi-Currency Retail Treasury Bonds – denominated in two or more
currencies and issued in scripless or, at the option of the Republic, in
certificated form, each of which, if issued in certificated form, shall be duly
executed and delivered by the Republic. (BTr website)
Special Purpose Treasury Bonds – exclusively issued to finance the
Comprehensive Agrarian Reform Program (CARP)-related expenditures as
alternative compliance with the agrarian reform credit requirement under
Sec. 4 (a) of P. D. No. 717, and as eligible reserve for trust duties. (BSP
Circular No. 301s 2001)
Zero Coupon Bonds (also called a discount bond or deep discount bond) –
a bond bought at a price lower than its face value, with the face value
repaid at the time of maturity. It does not make periodic interest payments,
or have so-called "coupons", hence the term zero-coupon bond. When the
bond reaches maturity, its investor receives its par (or face) value.
133
Onshore Foreign Currency Treasury Bonds – bonds denominated in
Foreign Currency and issued in scripless form. (BTr website)
Benchmark Bonds – bonds that are more liquid and are, therefore, intended
to trade more efficiently in the secondary market. (BTr website)
Loan Availments/Proceeds – amount drawn, in cash or in kind, against
existing or new loan commitments. (2013 BESF Glossary of Terms)
Loan Repayments – payment made by the debtor to the creditor to cover
principal reimbursement due in accordance with the amortization schedule.
Domestic Issuances – securities in the form of bonds, bills and notes issued
by the government on the domestic market.
Domestic Redemptions – maturing securities on domestic market redeemed
by the government.
Foreign Assisted Projects – government projects which are wholly or partly
financed by foreign loans and/or foreign grants. (2013 BESF Glossary of
Terms)
6.3 Authority and Limits to Borrowings
Under Section 20, Article 7 of the 1987 Philippine Constitution, the President
may contract or guarantee foreign loans on behalf of the Philippines with the prior
concurrence of the Monetary Board, and subject to such limitations as may be
provided by law.
The foreign borrowings are also governed by laws and regulations,
specifically R.A. No. 4860 dated August 8, 1966, as amended by P.D. No. 139
dated June 27, 1984. The amendment increased foreign debt limit to an amount not
exceeding US$10 billion or its equivalent in other foreign currencies at the
exchange rate prevailing at the time the loans, credits or indebtedness are incurred
at terms of payment of not less than ten (10) years except those contracted in the
interest of national security and rehabilitation resulting from natural calamities. The
recent law on foreign borrowings is R.A. No. 8182, approved by Congress on June
11, 1996, excluding the Official Development Assistance (ODA) loans from the
foreign debt limit of US$10 billion in order to facilitate the absorption and optimize
the utilization of ODA resources.
Domestic borrowings are contracted in accordance with R.A. No. 245 dated
June 12, 1948, as amended by P.D. No. 142 on March 2, 1973, which authorizes
the Secretary of Finance with the approval of the President, after consultation with
the Monetary Board to borrow in order to meet public expenditures authorized by
law. Republic Act No. 1000 approved on June 12, 1954 authorizes the President of
the Philippines to issue bonds to finance public works and projects for economic
development authorized by law.
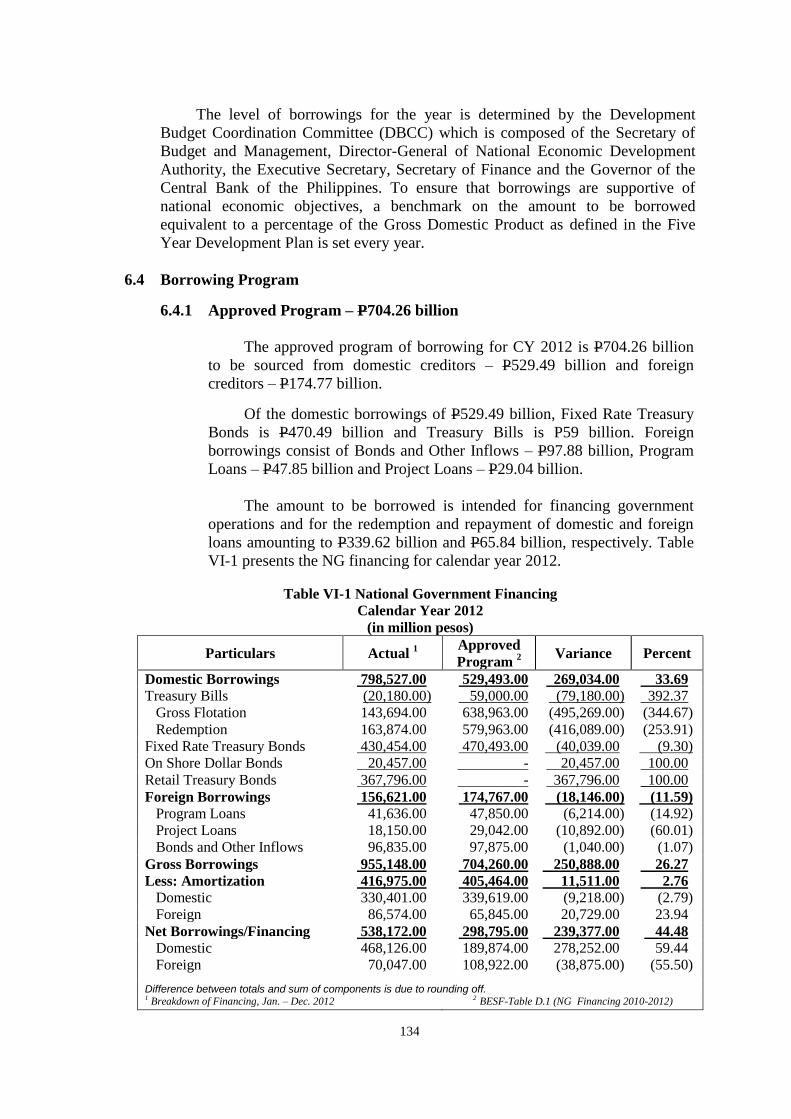
134
The level of borrowings for the year is determined by the Development
Budget Coordination Committee (DBCC) which is composed of the Secretary of
Budget and Management, Director-General of National Economic Development
Authority, the Executive Secretary, Secretary of Finance and the Governor of the
Central Bank of the Philippines. To ensure that borrowings are supportive of
national economic objectives, a benchmark on the amount to be borrowed
equivalent to a percentage of the Gross Domestic Product as defined in the Five
Year Development Plan is set every year.
6.4 Borrowing Program
6.4.1 Approved Program – P704.26 billion
The approved program of borrowing for CY 2012 is P704.26 billion
to be sourced from domestic creditors – P529.49 billion and foreign
creditors – P174.77 billion.
Of the domestic borrowings of P529.49 billion, Fixed Rate Treasury
Bonds is P470.49 billion and Treasury Bills is P59 billion. Foreign
borrowings consist of Bonds and Other Inflows – P97.88 billion, Program
Loans – P47.85 billion and Project Loans – P29.04 billion.
The amount to be borrowed is intended for financing government
operations and for the redemption and repayment of domestic and foreign
loans amounting to P339.62 billion and P65.84 billion, respectively. Table
VI-1 presents the NG financing for calendar year 2012.
Table VI-1 National Government Financing
Calendar Year 2012
(in million pesos)
Particulars Actual 1
Approved
Program 2
Variance Percent
Domestic Borrowings 798,527.00 529,493.00 269,034.00 33.69
Treasury Bills (20,180.00) 59,000.00 (79,180.00) 392.37
Gross Flotation 143,694.00 638,963.00 (495,269.00) (344.67)
Redemption 163,874.00 579,963.00 (416,089.00) (253.91)
Fixed Rate Treasury Bonds 430,454.00 470,493.00 (40,039.00 (9.30)
On Shore Dollar Bonds 20,457.00 - 20,457.00 100.00
Retail Treasury Bonds 367,796.00 - 367,796.00 100.00
Foreign Borrowings 156,621.00 174,767.00 (18,146.00) (11.59)
Program Loans
Project Loans
41,636.00 47,850.00 (6,214.00) (14.92)
18,150.00 29,042.00 (10,892.00) (60.01)
Bonds and Other Inflows 96,835.00 97,875.00 (1,040.00) (1.07)
Gross Borrowings 955,148.00 704,260.00 250,888.00 26.27
Less: Amortization 416,975.00 405,464.00 11,511.00 2.76
Domestic 330,401.00 339,619.00 (9,218.00) (2.79)
Foreign 86,574.00 65,845.00 20,729.00 23.94
Net Borrowings/Financing 538,172.00 298,795.00 239,377.00 44.48
Domestic 468,126.00 189,874.00 278,252.00 59.44
Foreign 70,047.00 108,922.00 (38,875.00) (55.50)
Difference between totals and sum of components is due to rounding off. 1 Breakdown of Financing, Jan. – Dec. 2012 2 BESF-Table D.1 (NG Financing 2010-2012)
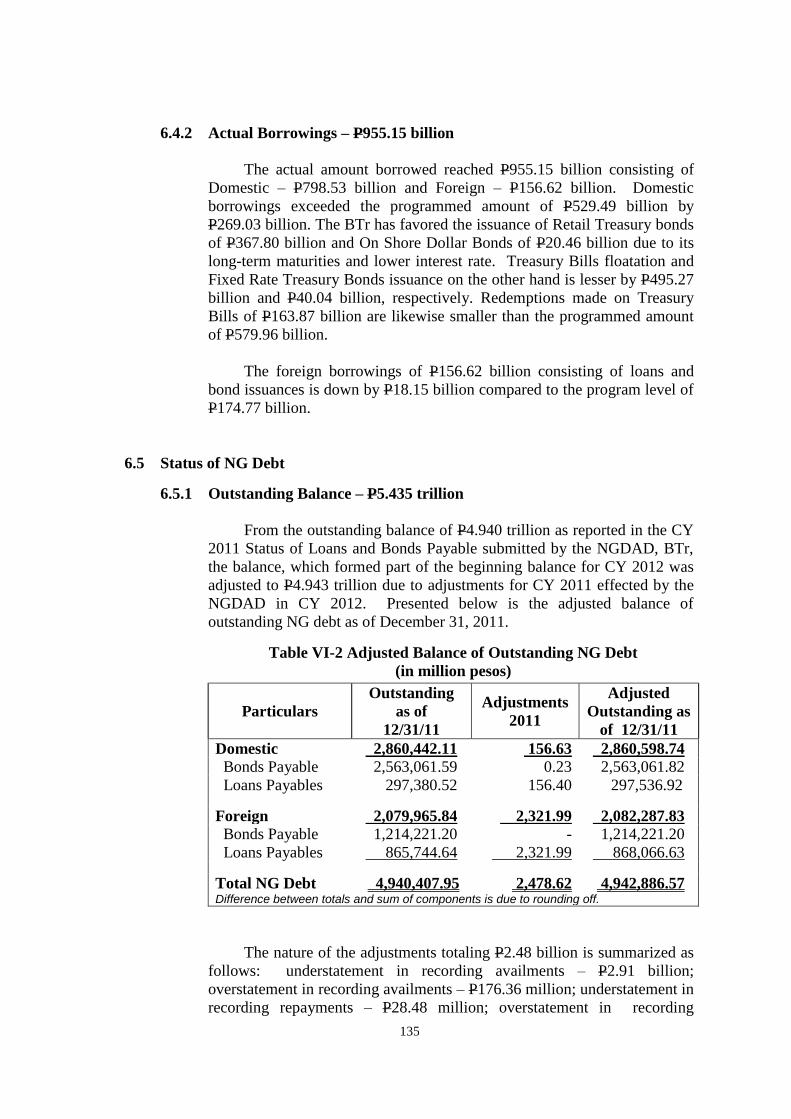
135
6.4.2 Actual Borrowings – P955.15 billion
The actual amount borrowed reached P955.15 billion consisting of
Domestic – P798.53 billion and Foreign – P156.62 billion. Domestic
borrowings exceeded the programmed amount of P529.49 billion by
P269.03 billion. The BTr has favored the issuance of Retail Treasury bonds
of P367.80 billion and On Shore Dollar Bonds of P20.46 billion due to its
long-term maturities and lower interest rate. Treasury Bills floatation and
Fixed Rate Treasury Bonds issuance on the other hand is lesser by P495.27
billion and P40.04 billion, respectively. Redemptions made on Treasury
Bills of P163.87 billion are likewise smaller than the programmed amount
of P579.96 billion.
The foreign borrowings of P156.62 billion consisting of loans and
bond issuances is down by P18.15 billion compared to the program level of
P174.77 billion.
6.5 Status of NG Debt
6.5.1 Outstanding Balance – P5.435 trillion
From the outstanding balance of P4.940 trillion as reported in the CY
2011 Status of Loans and Bonds Payable submitted by the NGDAD, BTr,
the balance, which formed part of the beginning balance for CY 2012 was
adjusted to P4.943 trillion due to adjustments for CY 2011 effected by the
NGDAD in CY 2012. Presented below is the adjusted balance of
outstanding NG debt as of December 31, 2011.
Table VI-2 Adjusted Balance of Outstanding NG Debt
(in million pesos)
Particulars
Outstanding
as of
12/31/11
Adjustments
2011
Adjusted
Outstanding as
of 12/31/11
Domestic 2,860,442.11 156.63 2,860,598.74
Bonds Payable 2,563,061.59 0.23 2,563,061.82
Loans Payables 297,380.52 156.40 297,536.92
Foreign 2,079,965.84 2,321.99 2,082,287.83
Bonds Payable 1,214,221.20 - 1,214,221.20
Loans Payables 865,744.64 2,321.99 868,066.63
Total NG Debt 4,940,407.95 2,478.62 4,942,886.57 Difference between totals and sum of components is due to rounding off.
The nature of the adjustments totaling P2.48 billion is summarized as
follows: understatement in recording availments – P2.91 billion;
overstatement in recording availments – P176.36 million; understatement in
recording repayments – P28.48 million; overstatement in recording
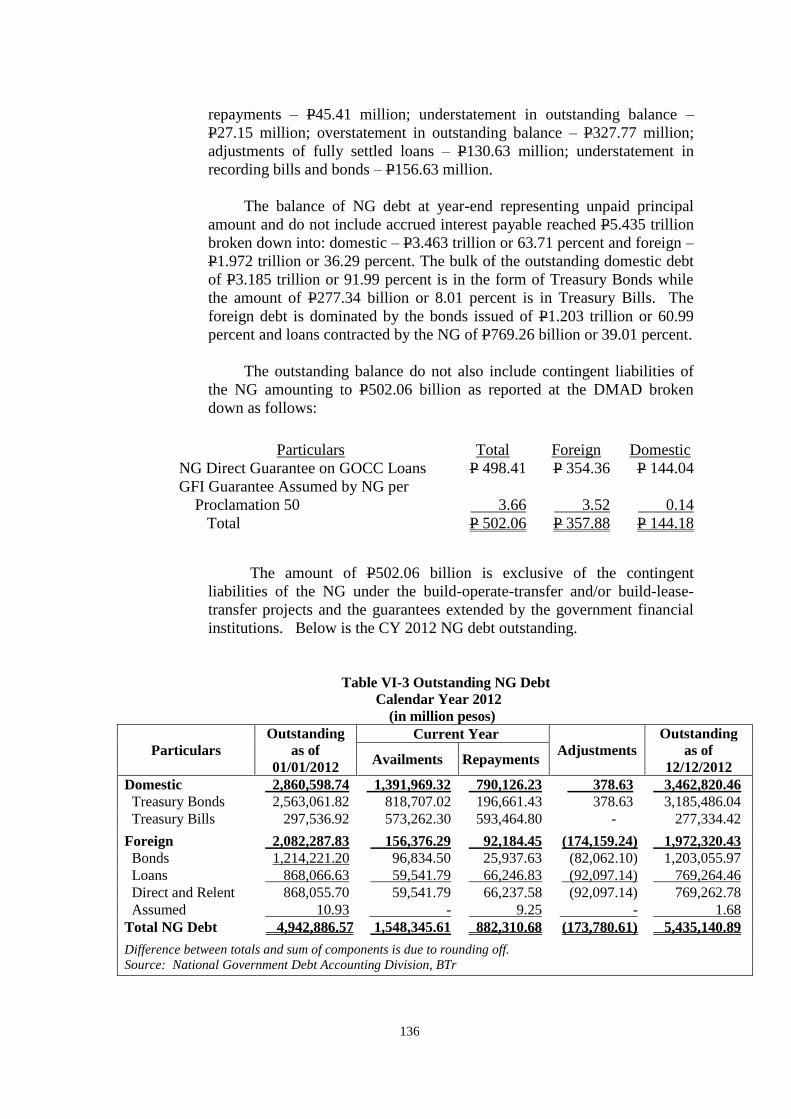
136
repayments – P45.41 million; understatement in outstanding balance –
P27.15 million; overstatement in outstanding balance – P327.77 million;
adjustments of fully settled loans – P130.63 million; understatement in
recording bills and bonds – P156.63 million.
The balance of NG debt at year-end representing unpaid principal
amount and do not include accrued interest payable reached P5.435 trillion
broken down into: domestic – P3.463 trillion or 63.71 percent and foreign –
P1.972 trillion or 36.29 percent. The bulk of the outstanding domestic debt
of P3.185 trillion or 91.99 percent is in the form of Treasury Bonds while
the amount of P277.34 billion or 8.01 percent is in Treasury Bills. The
foreign debt is dominated by the bonds issued of P1.203 trillion or 60.99
percent and loans contracted by the NG of P769.26 billion or 39.01 percent.
The outstanding balance do not also include contingent liabilities of
the NG amounting to P502.06 billion as reported at the DMAD broken
down as follows:
The amount of P502.06 billion is exclusive of the contingent
liabilities of the NG under the build-operate-transfer and/or build-lease-
transfer projects and the guarantees extended by the government financial
institutions. Below is the CY 2012 NG debt outstanding.
Table VI-3 Outstanding NG Debt
Calendar Year 2012
(in million pesos)
Particulars
Outstanding
as of
01/01/2012
Current Year
Adjustments
Outstanding
as of
12/12/2012 Availments Repayments
Domestic 2,860,598.74 1,391,969.32 790,126.23 378.63 3,462,820.46
Treasury Bonds 2,563,061.82 818,707.02 196,661.43 378.63 3,185,486.04
Treasury Bills 297,536.92 573,262.30 593,464.80 - 277,334.42 -
Foreign 2,082,287.83 156,376.29 92,184.45 (174,159.24) 1,972,320.43
Bonds 1,214,221.20 96,834.50 25,937.63 (82,062.10) 1,203,055.97
Loans 868,066.63 59,541.79 66,246.83 (92,097.14) 769,264.46
Direct and Relent 868,055.70 59,541.79 66,237.58 (92,097.14) 769,262.78
Assumed 10.93 - 9.25 - 1.68
Total NG Debt 4,942,886.57 1,548,345.61 882,310.68 (173,780.61) 5,435,140.89
Difference between totals and sum of components is due to rounding off.
Source: National Government Debt Accounting Division, BTr
Particulars Total Foreign Domestic
NG Direct Guarantee on GOCC Loans P 498.41 P 354.36 P 144.04
GFI Guarantee Assumed by NG per
Proclamation 50 3.66 3.52 0.14
Total P 502.06 P 357.88 P 144.18

137
The adjustments made during the year of P173.78 billion correspond
to foreign currency revaluation for bonds and loans of P175.49 billion and
reimbursement of redemption on Agrarian Reform bonds of P1.71 billion.
Shown in Chart VI-1 is the NG Debt by Source.
Of the P3.185 trillion outstanding bonds issued, the Fixed Rate
Treasury Bonds constitute the bulk of P1.431 trillion or 44.92 percent. The
Benchmark Bonds of P910.57 billion and Retail Treasury Bonds of
P745.92 billion constitute 28.58 percent and 23.42 percent, respectively.
The Fixed Rate Onshore Dollar Bonds of P20.46 billion is the new type of
bonds issued during the year. Treasury Bills outstanding of P275.02 billion
represent 99.17 percent of loans payable. Included in the Loans Payable
account is amount pertaining to CB-BOL of P174.57 billion, Development
Bank of the Philippines (DBP) Assumed loans of P2.29 billion, Treasury
Bills-Certificated of P11.65 million and Treasury Notes of P5.89 million.
The DBP Assumed loans exist by virtue of Proclamation No. 50 issued in
1986.
The outstanding foreign debt of P1.972 trillion is in the nature of
bonds issued and loans contracted. The bonds consist of Global Bonds –
P1.129 trillion; Japanese Yen Bonds – P47.38 billion and Euro Bonds –
P27.11 billion. The loans contracted by the NG from foreign creditors
reached P769.26 billion.
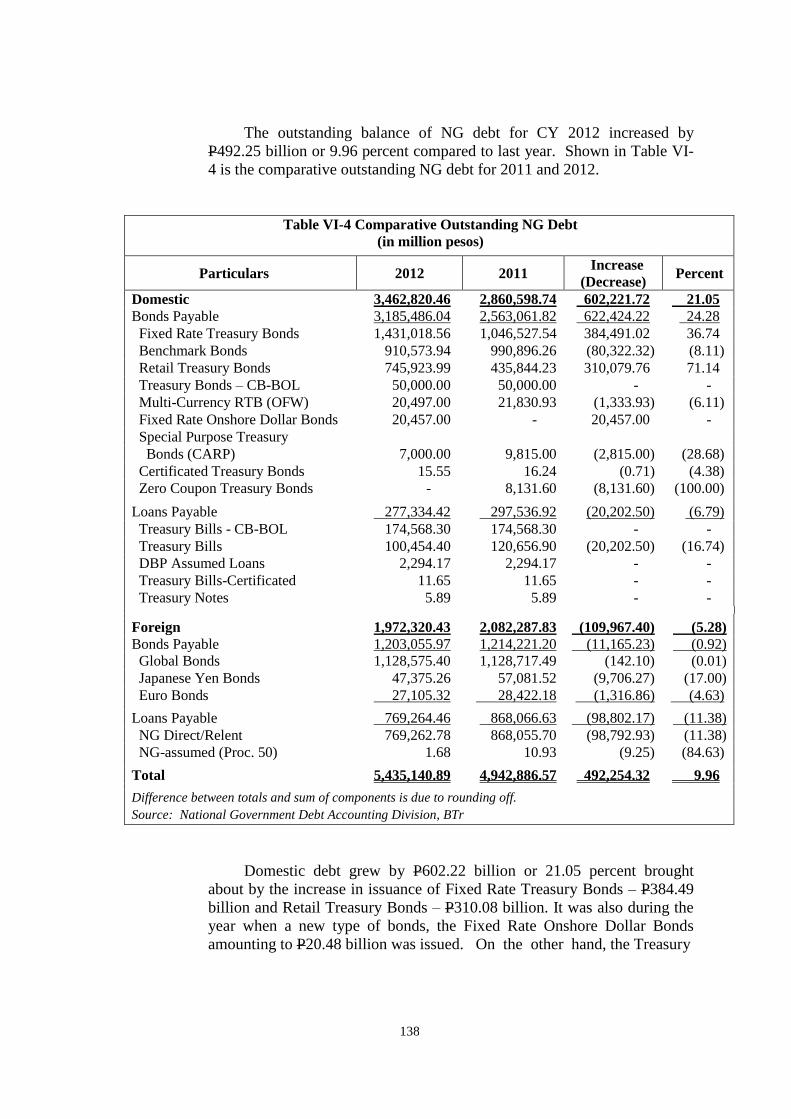
138
The outstanding balance of NG debt for CY 2012 increased by
P492.25 billion or 9.96 percent compared to last year. Shown in Table VI-
4 is the comparative outstanding NG debt for 2011 and 2012.
Table VI-4 Comparative Outstanding NG Debt
(in million pesos)
Particulars 2012 2011 Increase
(Decrease) Percent
Domestic 3,462,820.46 2,860,598.74 602,221.72 21.05
Bonds Payable 3,185,486.04 2,563,061.82 622,424.22 24.28
Fixed Rate Treasury Bonds 1,431,018.56 1,046,527.54 384,491.02 36.74
Benchmark Bonds 910,573.94 990,896.26 (80,322.32) (8.11)
Retail Treasury Bonds 745,923.99 435,844.23 310,079.76 71.14
Treasury Bonds – CB-BOL 50,000.00 50,000.00 - -
Multi-Currency RTB (OFW) 20,497.00 21,830.93 (1,333.93) (6.11)
Fixed Rate Onshore Dollar Bonds 20,457.00 - 20,457.00 -
Special Purpose Treasury
Bonds (CARP) 7,000.00 9,815.00 (2,815.00) (28.68)
Certificated Treasury Bonds 15.55 16.24 (0.71) (4.38)
Zero Coupon Treasury Bonds - 8,131.60 (8,131.60) (100.00)
Loans Payable 277,334.42 297,536.92 (20,202.50) (6.79)
Treasury Bills - CB-BOL 174,568.30 174,568.30 - -
Treasury Bills 100,454.40 120,656.90 (20,202.50) (16.74)
DBP Assumed Loans 2,294.17 2,294.17 - -
Treasury Bills-Certificated 11.65 11.65 - -
Treasury Notes 5.89 5.89 - -
Foreign 1,972,320.43 2,082,287.83 (109,967.40) (5.28)
Bonds Payable 1,203,055.97 1,214,221.20 (11,165.23) (0.92)
Global Bonds 1,128,575.40 1,128,717.49 (142.10) (0.01)
Japanese Yen Bonds 47,375.26 57,081.52 (9,706.27) (17.00)
Euro Bonds 27,105.32 28,422.18 (1,316.86) (4.63)
Loans Payable 769,264.46 868,066.63 (98,802.17) (11.38)
NG Direct/Relent 769,262.78 868,055.70 (98,792.93) (11.38)
NG-assumed (Proc. 50) 1.68 10.93 (9.25) (84.63)
Total 5,435,140.89 4,942,886.57 492,254.32 9.96
Difference between totals and sum of components is due to rounding off.
Source: National Government Debt Accounting Division, BTr
Domestic debt grew by P602.22 billion or 21.05 percent brought
about by the increase in issuance of Fixed Rate Treasury Bonds – P384.49
billion and Retail Treasury Bonds – P310.08 billion. It was also during the
year when a new type of bonds, the Fixed Rate Onshore Dollar Bonds
amounting to P20.48 billion was issued. On the other hand, the Treasury
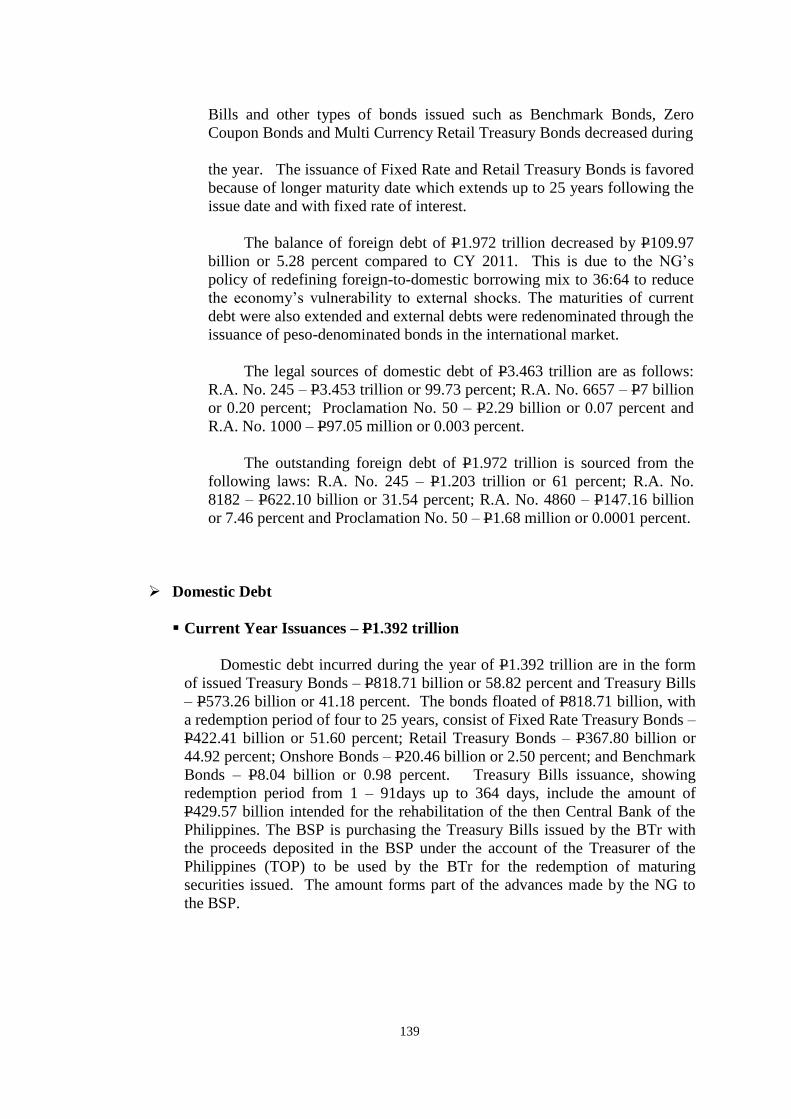
139
Bills and other types of bonds issued such as Benchmark Bonds, Zero
Coupon Bonds and Multi Currency Retail Treasury Bonds decreased during
the year. The issuance of Fixed Rate and Retail Treasury Bonds is favored
because of longer maturity date which extends up to 25 years following the
issue date and with fixed rate of interest.
The balance of foreign debt of P1.972 trillion decreased by P109.97
billion or 5.28 percent compared to CY 2011. This is due to the NG’s
policy of redefining foreign-to-domestic borrowing mix to 36:64 to reduce
the economy’s vulnerability to external shocks. The maturities of current
debt were also extended and external debts were redenominated through the
issuance of peso-denominated bonds in the international market.
The legal sources of domestic debt of P3.463 trillion are as follows:
R.A. No. 245 – P3.453 trillion or 99.73 percent; R.A. No. 6657 – P7 billion
or 0.20 percent; Proclamation No. 50 – P2.29 billion or 0.07 percent and
R.A. No. 1000 – P97.05 million or 0.003 percent.
The outstanding foreign debt of P1.972 trillion is sourced from the
following laws: R.A. No. 245 – P1.203 trillion or 61 percent; R.A. No.
8182 – P622.10 billion or 31.54 percent; R.A. No. 4860 – P147.16 billion
or 7.46 percent and Proclamation No. 50 – P1.68 million or 0.0001 percent.
Domestic Debt
Current Year Issuances – P1.392 trillion
Domestic debt incurred during the year of P1.392 trillion are in the form
of issued Treasury Bonds – P818.71 billion or 58.82 percent and Treasury Bills
– P573.26 billion or 41.18 percent. The bonds floated of P818.71 billion, with
a redemption period of four to 25 years, consist of Fixed Rate Treasury Bonds –
P422.41 billion or 51.60 percent; Retail Treasury Bonds – P367.80 billion or
44.92 percent; Onshore Bonds – P20.46 billion or 2.50 percent; and Benchmark
Bonds – P8.04 billion or 0.98 percent. Treasury Bills issuance, showing
redemption period from 1 – 91days up to 364 days, include the amount of
P429.57 billion intended for the rehabilitation of the then Central Bank of the
Philippines. The BSP is purchasing the Treasury Bills issued by the BTr with
the proceeds deposited in the BSP under the account of the Treasurer of the
Philippines (TOP) to be used by the BTr for the redemption of maturing
securities issued. The amount forms part of the advances made by the NG to
the BSP.
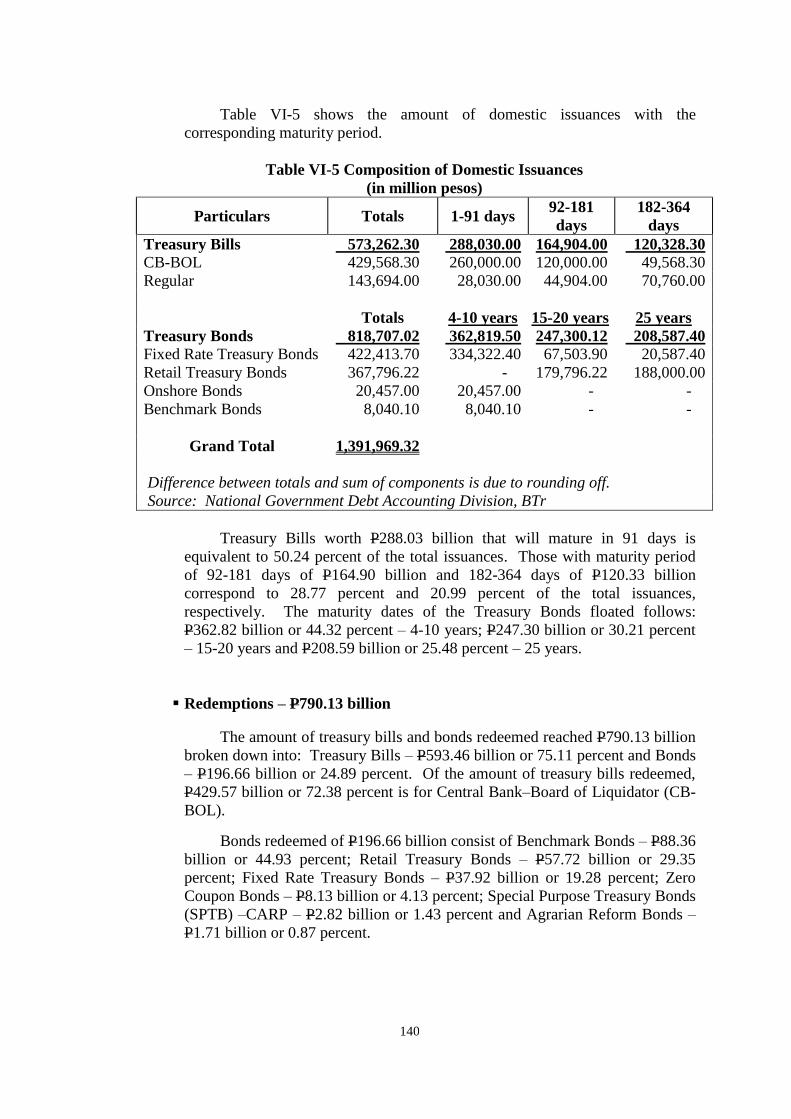
140
Table VI-5 shows the amount of domestic issuances with the
corresponding maturity period.
Table VI-5 Composition of Domestic Issuances
(in million pesos)
Particulars Totals 1-91 days 92-181
days
182-364
days
Treasury Bills 573,262.30 288,030.00 164,904.00 120,328.30
CB-BOL 429,568.30 260,000.00 120,000.00 49,568.30
Regular 143,694.00 28,030.00 44,904.00 70,760.00
Totals 4-10 years 15-20 years 25 years
Treasury Bonds 818,707.02 362,819.50 247,300.12 208,587.40
Fixed Rate Treasury Bonds 422,413.70 334,322.40 67,503.90 20,587.40
Retail Treasury Bonds 367,796.22 - 179,796.22 188,000.00
Onshore Bonds 20,457.00 20,457.00 - -
Benchmark Bonds 8,040.10 8,040.10 - -
Grand Total 1,391,969.32
Difference between totals and sum of components is due to rounding off.
Source: National Government Debt Accounting Division, BTr
Treasury Bills worth P288.03 billion that will mature in 91 days is
equivalent to 50.24 percent of the total issuances. Those with maturity period
of 92-181 days of P164.90 billion and 182-364 days of P120.33 billion
correspond to 28.77 percent and 20.99 percent of the total issuances,
respectively. The maturity dates of the Treasury Bonds floated follows:
P362.82 billion or 44.32 percent – 4-10 years; P247.30 billion or 30.21 percent
– 15-20 years and P208.59 billion or 25.48 percent – 25 years.
Redemptions – P790.13 billion
The amount of treasury bills and bonds redeemed reached P790.13 billion
broken down into: Treasury Bills – P593.46 billion or 75.11 percent and Bonds
– P196.66 billion or 24.89 percent. Of the amount of treasury bills redeemed,
P429.57 billion or 72.38 percent is for Central Bank–Board of Liquidator (CB-
BOL).
Bonds redeemed of P196.66 billion consist of Benchmark Bonds – P88.36
billion or 44.93 percent; Retail Treasury Bonds – P57.72 billion or 29.35
percent; Fixed Rate Treasury Bonds – P37.92 billion or 19.28 percent; Zero
Coupon Bonds – P8.13 billion or 4.13 percent; Special Purpose Treasury Bonds
(SPTB) –CARP – P2.82 billion or 1.43 percent and Agrarian Reform Bonds –
P1.71 billion or 0.87 percent.
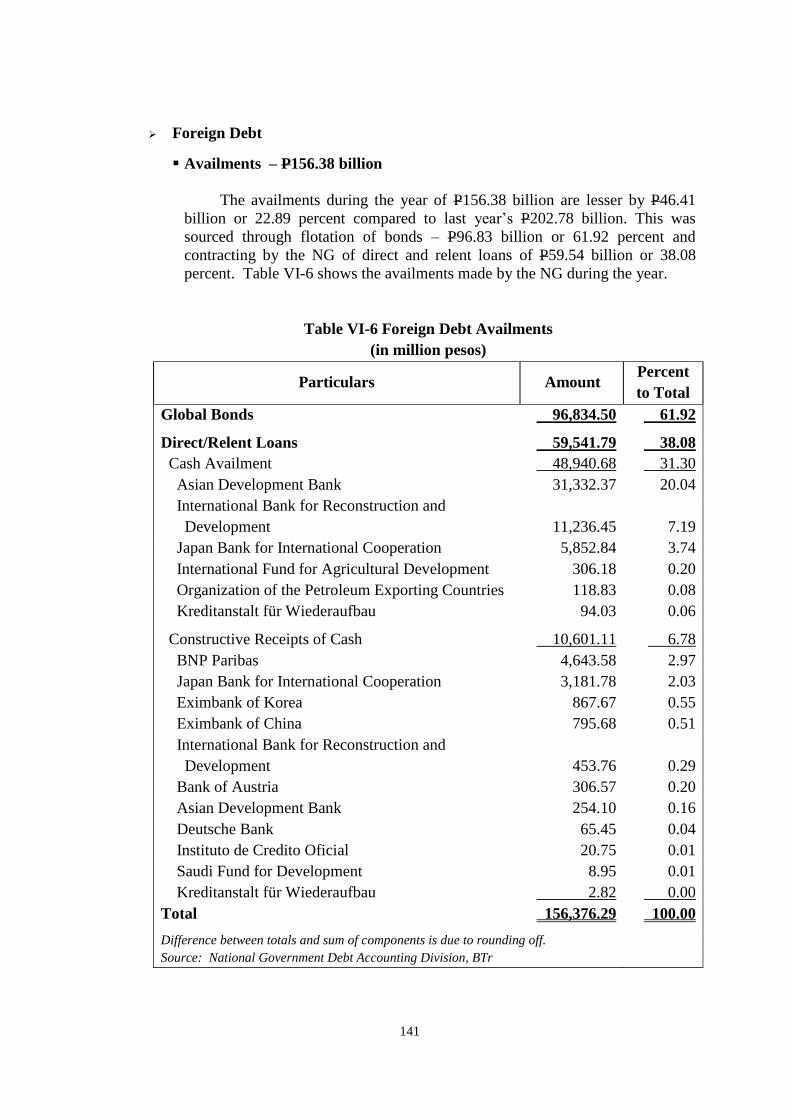
141
Foreign Debt
Availments – P156.38 billion
The availments during the year of P156.38 billion are lesser by P46.41
billion or 22.89 percent compared to last year’s P202.78 billion. This was
sourced through flotation of bonds – P96.83 billion or 61.92 percent and
contracting by the NG of direct and relent loans of P59.54 billion or 38.08
percent. Table VI-6 shows the availments made by the NG during the year.
Table VI-6 Foreign Debt Availments
(in million pesos)
Particulars Amount Percent
to Total
Global Bonds 96,834.50 61.92
Direct/Relent Loans 59,541.79 38.08
Cash Availment 48,940.68 31.30
Asian Development Bank 31,332.37 20.04
International Bank for Reconstruction and
Development
11,236.45
7.19
Japan Bank for International Cooperation 5,852.84 3.74
International Fund for Agricultural Development 306.18 0.20
Organization of the Petroleum Exporting Countries 118.83 0.08
Kreditanstalt für Wiederaufbau 94.03 0.06
Constructive Receipts of Cash 10,601.11 6.78
BNP Paribas 4,643.58 2.97
Japan Bank for International Cooperation 3,181.78 2.03
Eximbank of Korea 867.67 0.55
Eximbank of China 795.68 0.51
International Bank for Reconstruction and
Development
453.76
0.29
Bank of Austria 306.57 0.20
Asian Development Bank 254.10 0.16
Deutsche Bank 65.45 0.04
Instituto de Credito Oficial 20.75 0.01
Saudi Fund for Development 8.95 0.01
Kreditanstalt für Wiederaufbau 2.82 0.00
Total 156,376.29 100.00
Difference between totals and sum of components is due to rounding off.
Source: National Government Debt Accounting Division, BTr
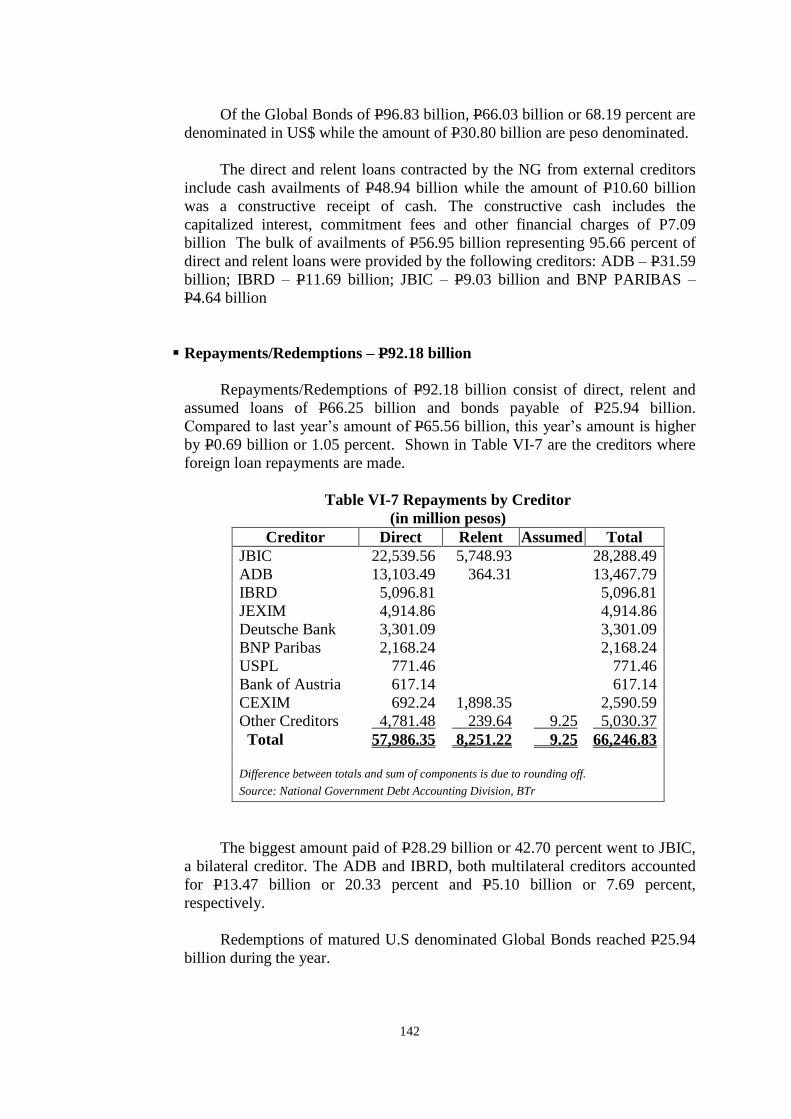
142
Of the Global Bonds of P96.83 billion, P66.03 billion or 68.19 percent are
denominated in US$ while the amount of P30.80 billion are peso denominated.
The direct and relent loans contracted by the NG from external creditors
include cash availments of P48.94 billion while the amount of P10.60 billion
was a constructive receipt of cash. The constructive cash includes the
capitalized interest, commitment fees and other financial charges of P7.09
billion The bulk of availments of P56.95 billion representing 95.66 percent of
direct and relent loans were provided by the following creditors: ADB – P31.59
billion; IBRD – P11.69 billion; JBIC – P9.03 billion and BNP PARIBAS –
P4.64 billion
Repayments/Redemptions – P92.18 billion
Repayments/Redemptions of P92.18 billion consist of direct, relent and
assumed loans of P66.25 billion and bonds payable of P25.94 billion.
Compared to last year’s amount of P65.56 billion, this year’s amount is higher
by P0.69 billion or 1.05 percent. Shown in Table VI-7 are the creditors where
foreign loan repayments are made.
Table VI-7 Repayments by Creditor
(in million pesos)
Creditor Direct Relent Assumed Total
JBIC 22,539.56 5,748.93 28,288.49
ADB 13,103.49 364.31 13,467.79
IBRD 5,096.81 5,096.81
JEXIM 4,914.86 4,914.86
Deutsche Bank 3,301.09 3,301.09
BNP Paribas 2,168.24 2,168.24
USPL 771.46 771.46
Bank of Austria 617.14 617.14
CEXIM 692.24 1,898.35 2,590.59
Other Creditors 4,781.48 239.64 9.25 5,030.37
Total 57,986.35 8,251.22 9.25 66,246.83
Difference between totals and sum of components is due to rounding off.
Source: National Government Debt Accounting Division, BTr
The biggest amount paid of P28.29 billion or 42.70 percent went to JBIC,
a bilateral creditor. The ADB and IBRD, both multilateral creditors accounted
for P13.47 billion or 20.33 percent and P5.10 billion or 7.69 percent,
respectively.
Redemptions of matured U.S denominated Global Bonds reached P25.94
billion during the year.
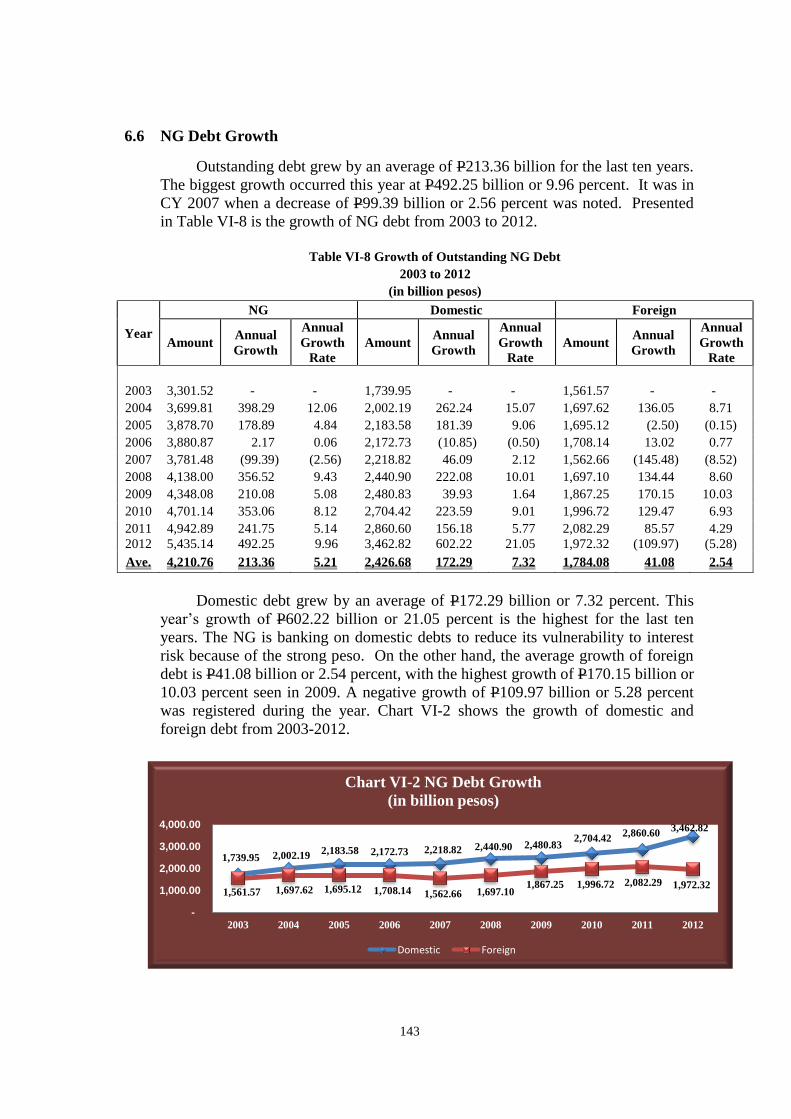
143
6.6 NG Debt Growth
Outstanding debt grew by an average of P213.36 billion for the last ten years.
The biggest growth occurred this year at P492.25 billion or 9.96 percent. It was in
CY 2007 when a decrease of P99.39 billion or 2.56 percent was noted. Presented
in Table VI-8 is the growth of NG debt from 2003 to 2012.
Table VI-8 Growth of Outstanding NG Debt
2003 to 2012
(in billion pesos)
Year
NG Domestic Foreign
Amount Annual
Growth
Annual
Growth
Rate
Amount Annual
Growth
Annual
Growth
Rate
Amount Annual
Growth
Annual
Growth
Rate
2003 3,301.52 - - 1,739.95 - - 1,561.57 - -
2004 3,699.81 398.29 12.06 2,002.19 262.24 15.07 1,697.62 136.05 8.71
2005 3,878.70 178.89 4.84 2,183.58 181.39 9.06 1,695.12 (2.50) (0.15)
2006 3,880.87 2.17 0.06 2,172.73 (10.85) (0.50) 1,708.14 13.02 0.77
2007 3,781.48 (99.39) (2.56) 2,218.82 46.09 2.12 1,562.66 (145.48) (8.52)
2008 4,138.00 356.52 9.43 2,440.90 222.08 10.01 1,697.10 134.44 8.60
2009 4,348.08 210.08 5.08 2,480.83 39.93 1.64 1,867.25 170.15 10.03
2010 4,701.14 353.06 8.12 2,704.42 223.59 9.01 1,996.72 129.47 6.93
2011
2012
4,942.89
5,435.14
241.75
492.25
5.14
9.96
2,860.60
3,462.82
156.18
602.22
5.77
21.05
2,082.29
1,972.32
85.57
(109.97)
4.29
(5.28)
Ave. 4,210.76 213.36 5.21 2,426.68 172.29 7.32 1,784.08 41.08 2.54
Domestic debt grew by an average of P172.29 billion or 7.32 percent. This
year’s growth of P602.22 billion or 21.05 percent is the highest for the last ten
years. The NG is banking on domestic debts to reduce its vulnerability to interest
risk because of the strong peso. On the other hand, the average growth of foreign
debt is P41.08 billion or 2.54 percent, with the highest growth of P170.15 billion or
10.03 percent seen in 2009. A negative growth of P109.97 billion or 5.28 percent
was registered during the year. Chart VI-2 shows the growth of domestic and
foreign debt from 2003-2012.
1,739.95 2,002.19 2,183.58 2,172.73 2,218.82 2,440.90 2,480.83
2,704.42 2,860.60
3,462.82
1,561.57 1,697.62 1,695.12 1,708.14 1,562.66 1,697.10 1,867.25 1,996.72 2,082.29 1,972.32
-
1,000.00
2,000.00
3,000.00
4,000.00
2003 2004 2005 2006 2007 2008 2009 2010 2011 2012
Chart VI-2 NG Debt Growth
(in billion pesos)
Domestic Foreign
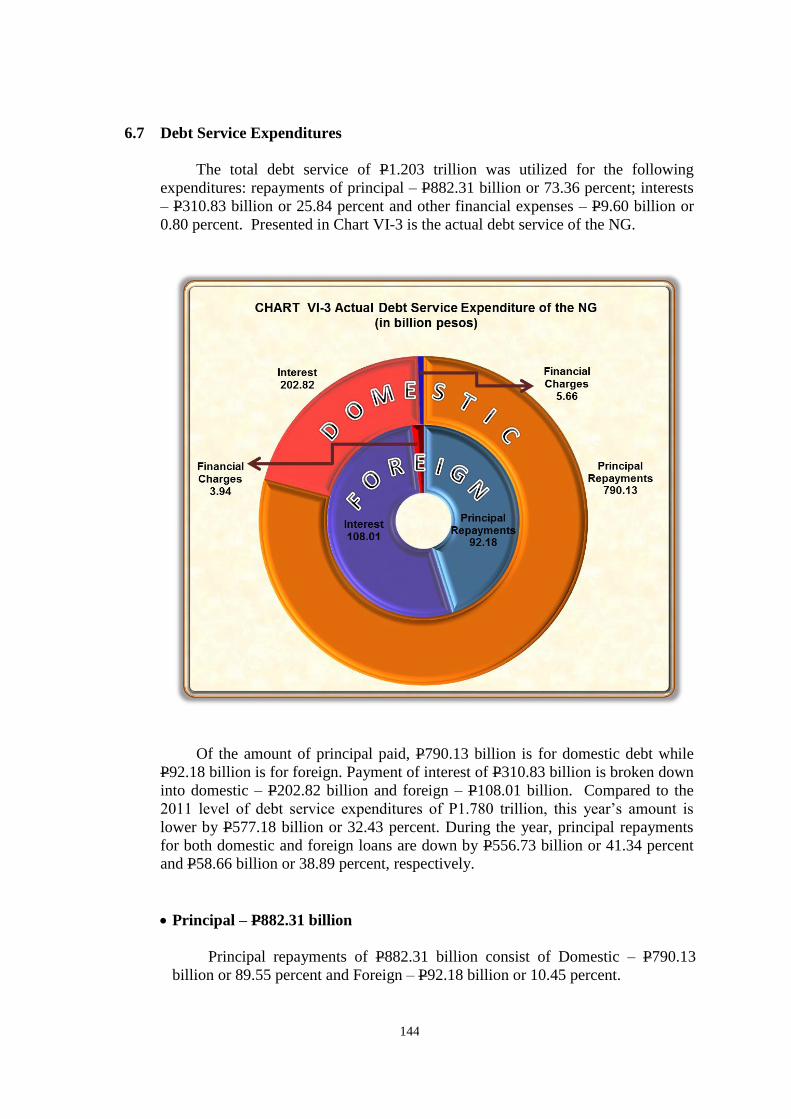
144
6.7 Debt Service Expenditures
The total debt service of P1.203 trillion was utilized for the following
expenditures: repayments of principal – P882.31 billion or 73.36 percent; interests
– P310.83 billion or 25.84 percent and other financial expenses – P9.60 billion or
0.80 percent. Presented in Chart VI-3 is the actual debt service of the NG.
Of the amount of principal paid, P790.13 billion is for domestic debt while
P92.18 billion is for foreign. Payment of interest of P310.83 billion is broken down
into domestic – P202.82 billion and foreign – P108.01 billion. Compared to the
2011 level of debt service expenditures of P1.780 trillion, this year’s amount is
lower by P577.18 billion or 32.43 percent. During the year, principal repayments
for both domestic and foreign loans are down by P556.73 billion or 41.34 percent
and P58.66 billion or 38.89 percent, respectively.
Principal – P882.31 billion
Principal repayments of P882.31 billion consist of Domestic – P790.13
billion or 89.55 percent and Foreign – P92.18 billion or 10.45 percent.
145
Of the amount paid for domestic obligations, P593.46 billion or 75.11
percent is for the redemption of Treasury bills. The payment for foreign
obligations of P66.25 billion or 71.86 percent pertains to direct/relent and
assumed loans of the NG while redemption of foreign bonds issued of P25.94
billion represents 28.14 percent of foreign loan repayments.
Interest – P 310.83 billion
Compared to the 2011 amount of P272.89 billion, interest payment went up
by P37.94 billion or 13.90 percent. Table VI-9 shows the comparative amount of
interest paid by the NG for domestic and foreign loans.
Table VI-9 Comparative Interest Payments of the NG
Particulars Amount (in million pesos) Increase
(Decrease) Percent
2012 2011
Domestic 202,821.27 169,951.03 32,870.24 19.34
Bonds 197,231.53 164,313.62 32,917.91 20.03 T-Bills, Notes and
Loans
5,589.74 5,637.41 (47.67) (0.85)
Foreign 108,009.48 102,943.71 5,065.77 4.92
Global Bond 91,402.98 86,351.91 5,051.07 5.85 Direct/Relent 16,606.41 16,591.34 15.07 0.09 Assumed 0.09 0.46 (0.37) (80.43) Total 310,830.75 272,894.74 37,936.01 13.90
Difference between totals and sum of components is due to rounding off.
Source: National Government Debt Accounting Division, BTr
Interest paid for domestic debt of P202.82 billion went up by P32.87 billion
or 19.34 percent. The biggest increase of P32.92 billion or 20.03 percent is for
bonds issuance which is offset by the slight decrease on interest payment for
treasury bills and notes of P47.67 million.
Interest paid for foreign loans of P108.01 billion showed an increase of
P5.07 billion or 4.92 percent compared to the previous year’s amount of P102.94
billion. The bulk of the increase of P5.05 billion or 5.85 percent pertains to the
amount paid for Global bonds of P91.40 billion. Payments made for direct/relent
loans amounting to P16.61 billion also showed an increase of P15.07 million or
0.09 percent.
146
Other Financial Expenses – P9.60 billion
The breakdown of Other Financial Expenses of P9.60 billion follows:
domestic – P5.66 billion or 58.91 percent and foreign – P3.94 billion or 41.09
percent. Table VI-10 shows the comparative other financial expenses paid by the
NG.
Table VI-10 Comparative Other Financial Expenses of the NG
Particulars
Amount (in million pesos)
Percent 2012 2011
(Increase
(Decrease)
Domestic 5,657.42 7,291.40 (1,633.98) (22.41)
Documentary Stamp Tax 5,189.33 7,091.29 (1,901.96) (26.82)
Other Financial Charges 468.09 200.11 267.98 133.92
Foreign 3,945.34 5,199.08 (1,253.74) (24.11)
Loss on Guaranty 2,861.32 3,156.76 (295.43) (9.36)
Other Financial Charges 377.32 1,047.26 (669.94) (63.97)
Documentary Stamp Tax 330.17 611.17 (281.00) (45.98)
Commitment Fees 323.18 330.89 (7.72) (2.33)
Bank Charges 53.35 52.99 0.35 0.67
Total 9,602.75 12,490.47 (2,887.72) (23.12)
Difference between totals and sum of components is due to rounding off.
Source: National Government Debt Accounting Division, BTr
The financial expenses of P5.66 billion incurred for domestic debt
transactions decreased by P1.63 billion or 22.41 percent. Documentary stamp tax
of P5.19 billion also decreased by P1.90 billion or 26.82 percent while other
financial charges of P468.09 million incurred in relation to retail treasury bonds
issuances increased by P267.98 million or 133.92 percent.
Financial expenses paid for foreign debt of P3.94 billion decreased by
P1.25 billion or 24.11 percent compared to last year’s amount of P5.20 billion.
The loss on guaranty of P2.86 billion, which decreased by P295.43 million
pertains to foreign exchange risk cover on foreign currency fluctuations for loans
of GOCCs guaranteed by the NG. Of the amount, P2.03 billion is for the account
of the DBP; P789.12 million for LBP and P39.86 million for SBGFC. The five
departments which accounted for the bulk of commitment fees paid are: DAR –
P97.62 million, DOTC – P81.96 million, DPWH – P57.51 million, DENR –
P39.80 million and DSWD – P21.49 million. Among the creditors which charged
commitment fees, BNP PARIBAS showed the huge amount of P204.34 million.
Presented under pages 431 and 432, Volume I-B of this report, are the schedules
of Commitment Fees paid by the departments and the creditors which charged the
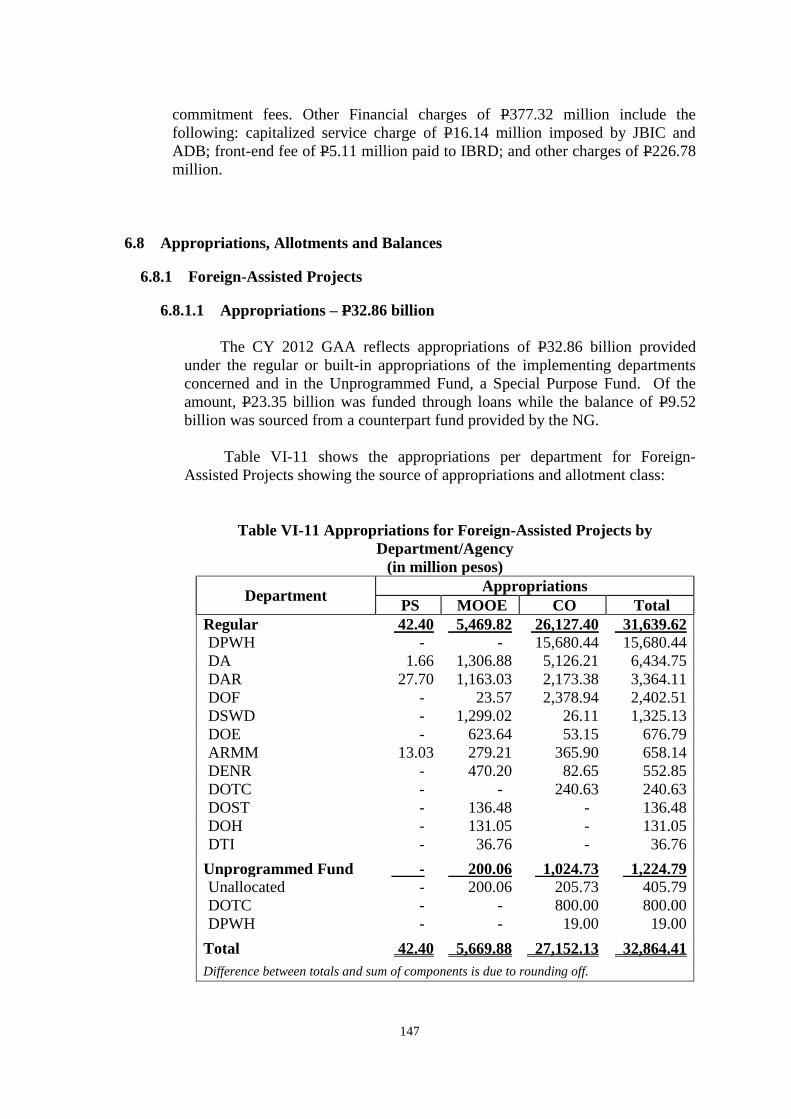
147
commitment fees. Other Financial charges of P377.32 million include the
following: capitalized service charge of P16.14 million imposed by JBIC and
ADB; front-end fee of P5.11 million paid to IBRD; and other charges of P226.78
million.
6.8 Appropriations, Allotments and Balances
6.8.1 Foreign-Assisted Projects
6.8.1.1 Appropriations – P32.86 billion
The CY 2012 GAA reflects appropriations of P32.86 billion provided
under the regular or built-in appropriations of the implementing departments
concerned and in the Unprogrammed Fund, a Special Purpose Fund. Of the
amount, P23.35 billion was funded through loans while the balance of P9.52
billion was sourced from a counterpart fund provided by the NG.
Table VI-11 shows the appropriations per department for Foreign-
Assisted Projects showing the source of appropriations and allotment class:
Table VI-11 Appropriations for Foreign-Assisted Projects by
Department/Agency
(in million pesos)
Department Appropriations
PS MOOE CO Total
Regular 42.40 5,469.82 26,127.40 31,639.62
DPWH - - 15,680.44 15,680.44
DA 1.66 1,306.88 5,126.21 6,434.75
DAR 27.70 1,163.03 2,173.38 3,364.11
DOF - 23.57 2,378.94 2,402.51
DSWD - 1,299.02 26.11 1,325.13
DOE - 623.64 53.15 676.79
ARMM 13.03 279.21 365.90 658.14
DENR - 470.20 82.65 552.85
DOTC - - 240.63 240.63
DOST - 136.48 - 136.48
DOH - 131.05 - 131.05
DTI - 36.76 - 36.76
Unprogrammed Fund - 200.06 1,024.73 1,224.79
Unallocated - 200.06 205.73 405.79
DOTC - - 800.00 800.00
DPWH - - 19.00 19.00
Total 42.40 5,669.88 27,152.13 32,864.41
Difference between totals and sum of components is due to rounding off.
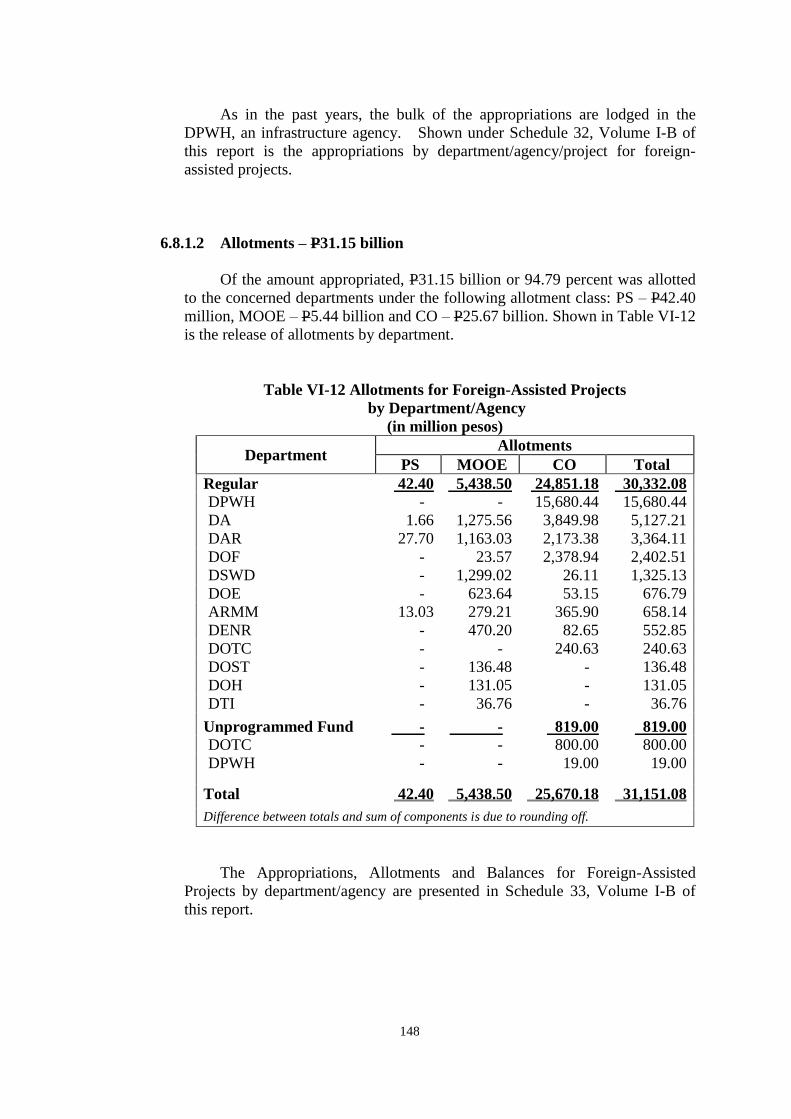
148
As in the past years, the bulk of the appropriations are lodged in the
DPWH, an infrastructure agency. Shown under Schedule 32, Volume I-B of
this report is the appropriations by department/agency/project for foreign-
assisted projects.
6.8.1.2 Allotments – P31.15 billion
Of the amount appropriated, P31.15 billion or 94.79 percent was allotted
to the concerned departments under the following allotment class: PS – P42.40
million, MOOE – P5.44 billion and CO – P25.67 billion. Shown in Table VI-12
is the release of allotments by department.
Table VI-12 Allotments for Foreign-Assisted Projects
by Department/Agency
(in million pesos)
Department Allotments
PS MOOE CO Total
Regular 42.40 5,438.50 24,851.18 30,332.08
DPWH - - 15,680.44 15,680.44
DA 1.66 1,275.56 3,849.98 5,127.21
DAR 27.70 1,163.03 2,173.38 3,364.11
DOF - 23.57 2,378.94 2,402.51
DSWD - 1,299.02 26.11 1,325.13
DOE - 623.64 53.15 676.79
ARMM 13.03 279.21 365.90 658.14
DENR - 470.20 82.65 552.85
DOTC - - 240.63 240.63
DOST - 136.48 - 136.48
DOH - 131.05 - 131.05
DTI - 36.76 - 36.76
Unprogrammed Fund - - 819.00 819.00
DOTC - - 800.00 800.00
DPWH - - 19.00 19.00
Total 42.40 5,438.50 25,670.18 31,151.08
Difference between totals and sum of components is due to rounding off.
The Appropriations, Allotments and Balances for Foreign-Assisted
Projects by department/agency are presented in Schedule 33, Volume I-B of
this report.
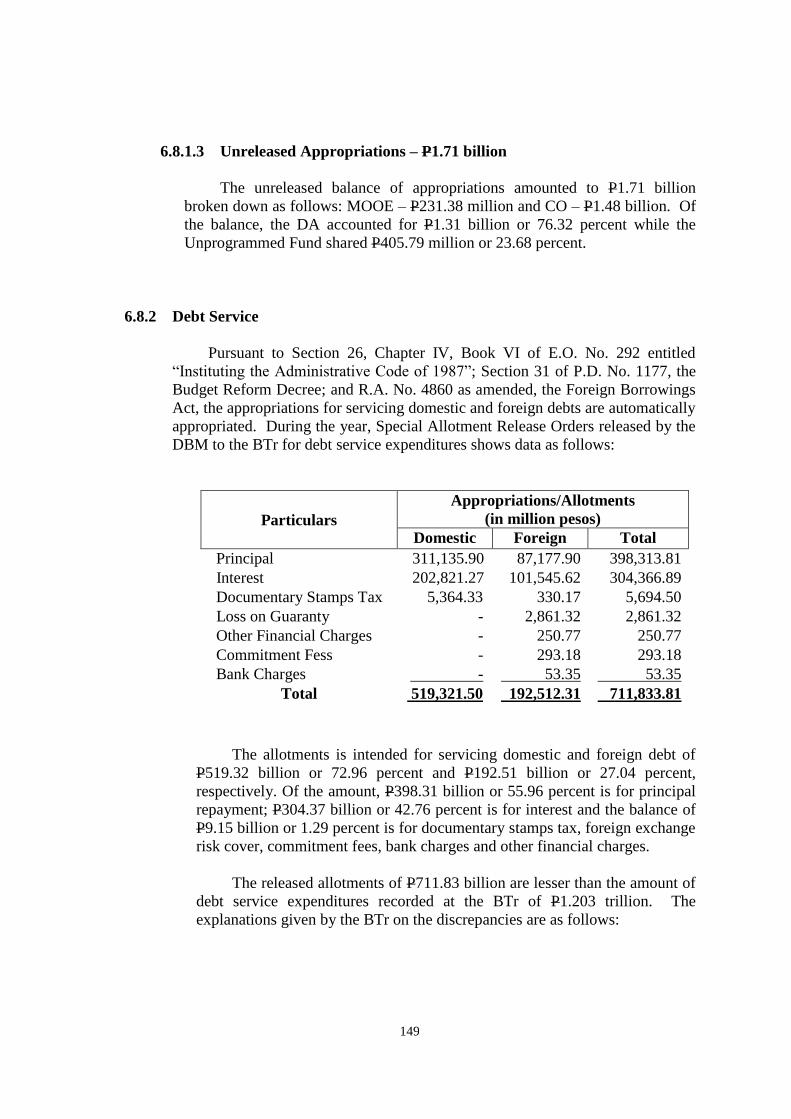
149
6.8.1.3 Unreleased Appropriations – P1.71 billion
The unreleased balance of appropriations amounted to P1.71 billion
broken down as follows: MOOE – P231.38 million and CO – P1.48 billion. Of
the balance, the DA accounted for P1.31 billion or 76.32 percent while the
Unprogrammed Fund shared P405.79 million or 23.68 percent.
6.8.2 Debt Service
Pursuant to Section 26, Chapter IV, Book VI of E.O. No. 292 entitled
“Instituting the Administrative Code of 1987”; Section 31 of P.D. No. 1177, the
Budget Reform Decree; and R.A. No. 4860 as amended, the Foreign Borrowings
Act, the appropriations for servicing domestic and foreign debts are automatically
appropriated. During the year, Special Allotment Release Orders released by the
DBM to the BTr for debt service expenditures shows data as follows:
Particulars
Appropriations/Allotments
(in million pesos)
Domestic Foreign Total
Principal 311,135.90 87,177.90 398,313.81
Interest 202,821.27 101,545.62 304,366.89
Documentary Stamps Tax 5,364.33 330.17 5,694.50
Loss on Guaranty - 2,861.32 2,861.32
Other Financial Charges - 250.77 250.77
Commitment Fess - 293.18 293.18
Bank Charges - 53.35 53.35
Total 519,321.50 192,512.31 711,833.81
The allotments is intended for servicing domestic and foreign debt of
P519.32 billion or 72.96 percent and P192.51 billion or 27.04 percent,
respectively. Of the amount, P398.31 billion or 55.96 percent is for principal
repayment; P304.37 billion or 42.76 percent is for interest and the balance of
P9.15 billion or 1.29 percent is for documentary stamps tax, foreign exchange
risk cover, commitment fees, bank charges and other financial charges.
The released allotments of P711.83 billion are lesser than the amount of
debt service expenditures recorded at the BTr of P1.203 trillion. The
explanations given by the BTr on the discrepancies are as follows:
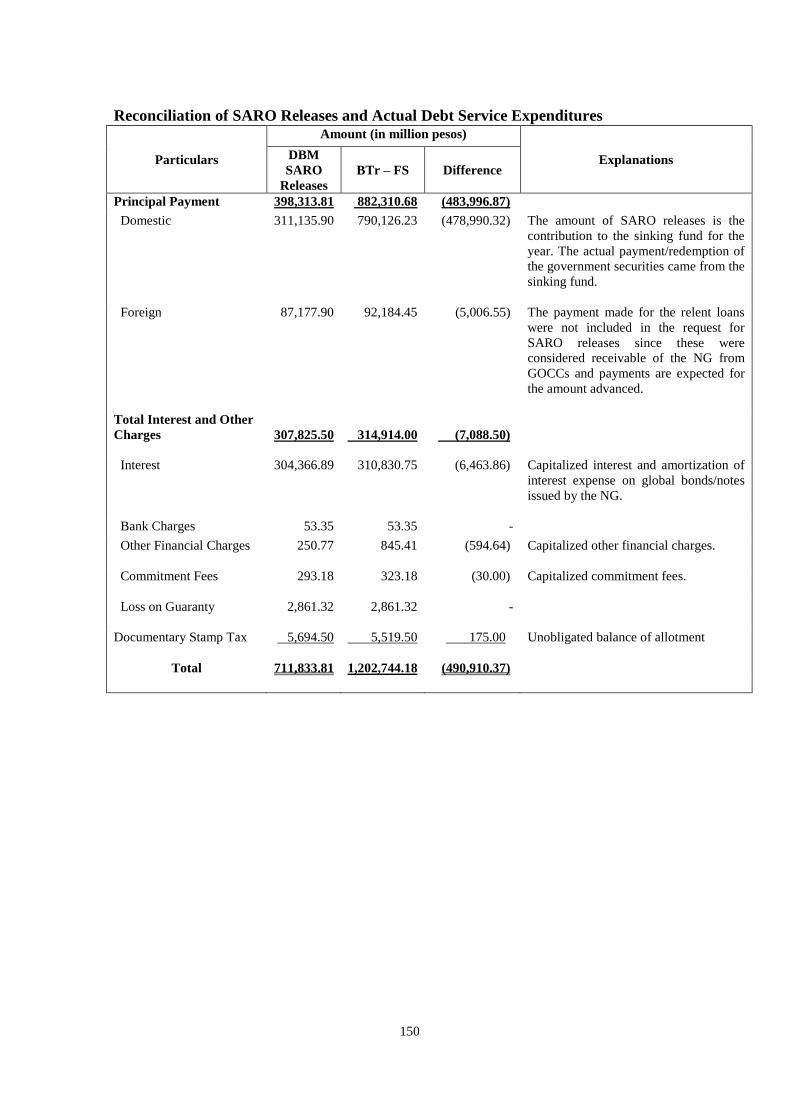
150
Reconciliation of SARO Releases and Actual Debt Service Expenditures
Particulars
Amount (in million pesos)
Explanations DBM
SARO
Releases
BTr – FS Difference
Principal Payment 398,313.81 882,310.68 (483,996.87)
Domestic 311,135.90 790,126.23 (478,990.32) The amount of SARO releases is the
contribution to the sinking fund for the
year. The actual payment/redemption of
the government securities came from the
sinking fund.
Foreign 87,177.90 92,184.45 (5,006.55) The payment made for the relent loans
were not included in the request for
SARO releases since these were
considered receivable of the NG from
GOCCs and payments are expected for
the amount advanced.
Total Interest and Other
Charges
307,825.50 314,914.00 (7,088.50)
Interest 304,366.89 310,830.75 (6,463.86) Capitalized interest and amortization of
interest expense on global bonds/notes
issued by the NG.
Bank Charges 53.35 53.35 -
Other Financial Charges 250.77 845.41 (594.64) Capitalized other financial charges.
Commitment Fees 293.18 323.18 (30.00) Capitalized commitment fees.
Loss on Guaranty
2,861.32 2,861.32 -
Documentary Stamp Tax 5,694.50 5,519.50 175.00 Unobligated balance of allotment
Total 711,833.81 1,202,744.18 (490,910.37)
VII. SPECIAL ACCOUNTS IN
THE GENERAL FUND
151
SPECIAL ACCOUNT IN THE GENERAL FUND
7.1 Introduction
The General Appropriations Act (GAA) includes general and specific provisions
on Special Account in the General Fund (SAGF) intended for various specific purposes
which are sourced from grants and donations, collections of specific fees, charges,
premiums, among others. Excluded from these are donations for specific purposes with
a term not exceeding one (1) year and which shall be treated as trust receipts pursuant to
Section 12 of Republic Act No.10155, the 2012 GAA.
7.1.1 Legal Basis/Purpose
Presidential Decree No. 1234 dated November 8, 1977 provides that the
establishment of Special and Fiduciary Funds has been authorized from time to
time in order to facilitate the funding of priority activities of Government
including those undertaken by GOCCs. This decree contains the following
provisions quoted as follows:
“Section 1. All income and collections for Special or Fiduciary Funds
authorized by law shall be remitted to the Treasury and treated as SAGF xxx
corporations.
Section 2. The amounts collected and accruing to Special or Fiduciary Funds
shall be considered as being automatically appropriated for the purposes
authorized by law creating the said Funds, except as may be otherwise
provided in the General Appropriations decree.
Section 3. The amounts collected under Special or Fiduciary Funds shall be
released to the implementing agencies subject to the approval of the President
and to Special Budget under Section 40 of P.D. No. 1177: PROVIDED, That
funds needed for regular operations or other duly authorized purposes may be
automatically released under such conditions as may be approved by the
President.
Section 4. The funds once released shall be administered by the government
agency or corporations concerned and shall be utilized only for the purposes
authorized in the law creating the said Special or Fiduciary Funds. “
7.1.2 Existing Accounting Procedures
The New Government Accounting System (NGAS) adopts the one fund
concept and provides that separate accounting shall be done only when
specifically required by law or by a donor agency or when otherwise necessitated
by circumstances subject to prior approval of the Commission.
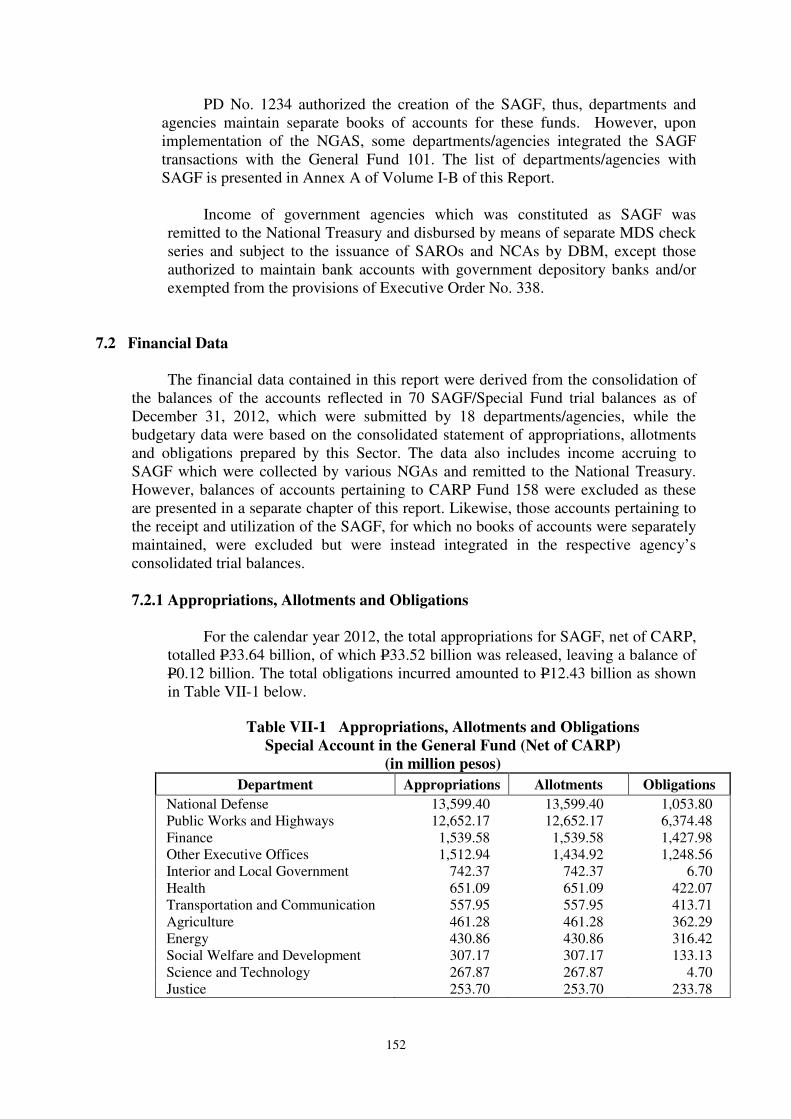
152
PD No. 1234 authorized the creation of the SAGF, thus, departments and
agencies maintain separate books of accounts for these funds. However, upon
implementation of the NGAS, some departments/agencies integrated the SAGF
transactions with the General Fund 101. The list of departments/agencies with
SAGF is presented in Annex A of Volume I-B of this Report.
Income of government agencies which was constituted as SAGF was
remitted to the National Treasury and disbursed by means of separate MDS check
series and subject to the issuance of SAROs and NCAs by DBM, except those
authorized to maintain bank accounts with government depository banks and/or
exempted from the provisions of Executive Order No. 338.
7.2 Financial Data
The financial data contained in this report were derived from the consolidation of
the balances of the accounts reflected in 70 SAGF/Special Fund trial balances as of
December 31, 2012, which were submitted by 18 departments/agencies, while the
budgetary data were based on the consolidated statement of appropriations, allotments
and obligations prepared by this Sector. The data also includes income accruing to
SAGF which were collected by various NGAs and remitted to the National Treasury.
However, balances of accounts pertaining to CARP Fund 158 were excluded as these
are presented in a separate chapter of this report. Likewise, those accounts pertaining to
the receipt and utilization of the SAGF, for which no books of accounts were separately
maintained, were excluded but were instead integrated in the respective agency’s
consolidated trial balances.
7.2.1 Appropriations, Allotments and Obligations
For the calendar year 2012, the total appropriations for SAGF, net of CARP,
totalled P33.64 billion, of which P33.52 billion was released, leaving a balance of
P0.12 billion. The total obligations incurred amounted to P12.43 billion as shown
in Table VII-1 below.
Table VII-1 Appropriations, Allotments and Obligations
Special Account in the General Fund (Net of CARP)
(in million pesos)
Department Appropriations Allotments Obligations
National Defense 13,599.40 13,599.40 1,053.80
Public Works and Highways 12,652.17 12,652.17 6,374.48
Finance 1,539.58 1,539.58 1,427.98
Other Executive Offices 1,512.94 1,434.92 1,248.56
Interior and Local Government 742.37 742.37 6.70
Health 651.09 651.09 422.07
Transportation and Communication 557.95 557.95 413.71
Agriculture 461.28 461.28 362.29
Energy 430.86 430.86 316.42
Social Welfare and Development 307.17 307.17 133.13
Science and Technology 267.87 267.87 4.70
Justice 253.70 253.70 233.78
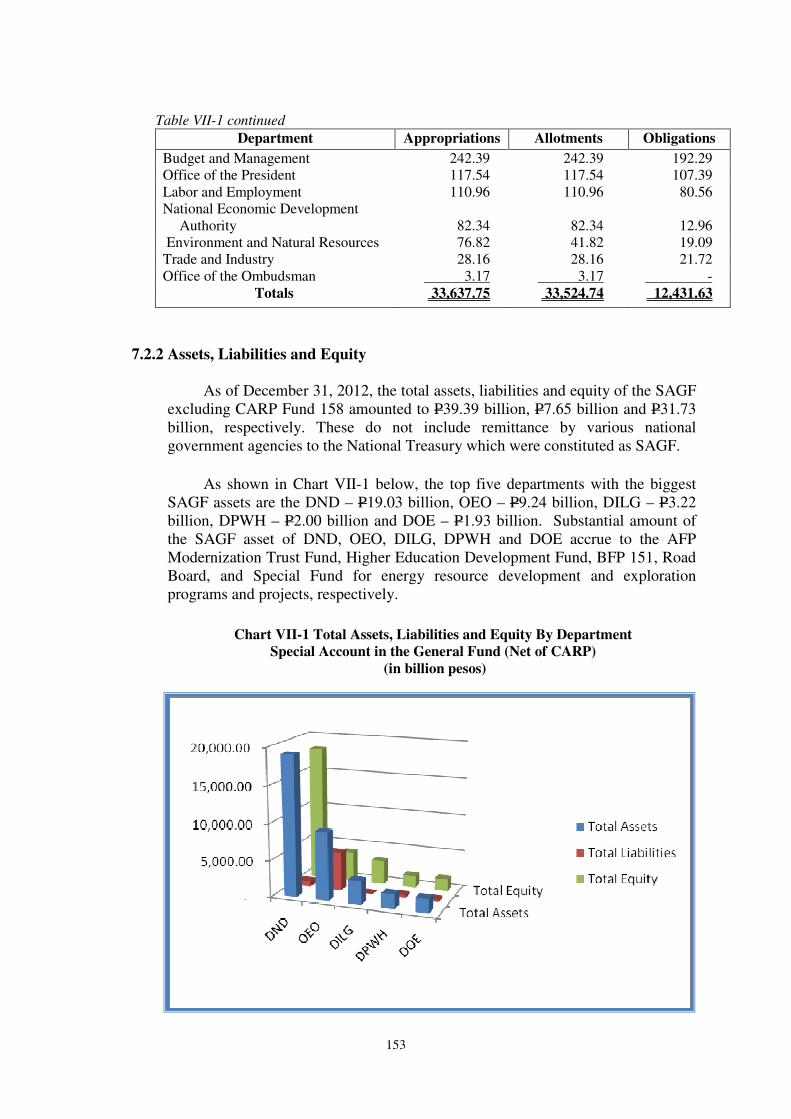
153
Chart VII-1 Total Assets, Liabilities and Equity By Department
Special Account in the General Fund (Net of CARP)
(in billion pesos)
Table VII-1 continued
Department Appropriations Allotments Obligations
Budget and Management 242.39 242.39 192.29
Office of the President 117.54 117.54 107.39
Labor and Employment 110.96 110.96 80.56
National Economic Development
Authority 82.34 82.34 12.96
Environment and Natural Resources 76.82 41.82 19.09
Trade and Industry 28.16 28.16 21.72
Office of the Ombudsman 3.17 3.17 -
Totals 33,637.75 33,524.74 12,431.63
7.2.2 Assets, Liabilities and Equity
As of December 31, 2012, the total assets, liabilities and equity of the SAGF
excluding CARP Fund 158 amounted to P39.39 billion, P7.65 billion and P31.73
billion, respectively. These do not include remittance by various national
government agencies to the National Treasury which were constituted as SAGF.
As shown in Chart VII-1 below, the top five departments with the biggest
SAGF assets are the DND – P19.03 billion, OEO – P9.24 billion, DILG – P3.22
billion, DPWH – P2.00 billion and DOE – P1.93 billion. Substantial amount of
the SAGF asset of DND, OEO, DILG, DPWH and DOE accrue to the AFP
Modernization Trust Fund, Higher Education Development Fund, BFP 151, Road
Board, and Special Fund for energy resource development and exploration
programs and projects, respectively.
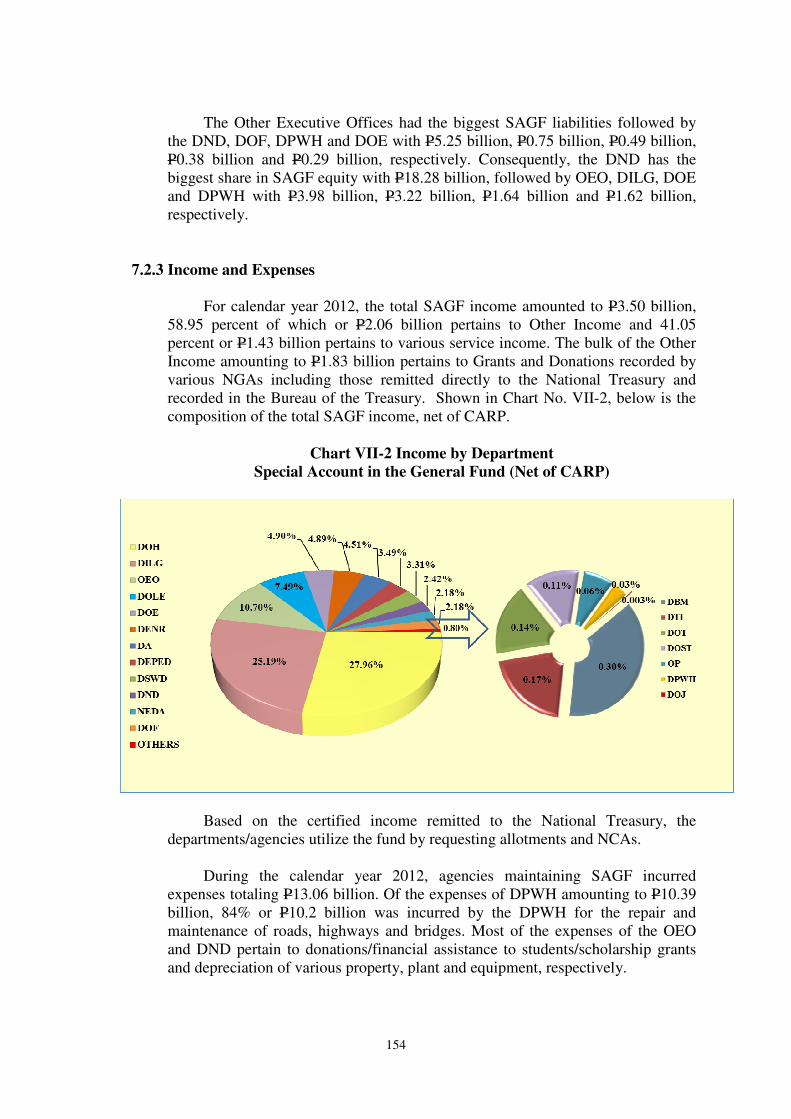
154
The Other Executive Offices had the biggest SAGF liabilities followed by
the DND, DOF, DPWH and DOE with P5.25 billion, P0.75 billion, P0.49 billion,
P0.38 billion and P0.29 billion, respectively. Consequently, the DND has the
biggest share in SAGF equity with P18.28 billion, followed by OEO, DILG, DOE
and DPWH with P3.98 billion, P3.22 billion, P1.64 billion and P1.62 billion,
respectively.
7.2.3 Income and Expenses
For calendar year 2012, the total SAGF income amounted to P3.50 billion,
58.95 percent of which or P2.06 billion pertains to Other Income and 41.05
percent or P1.43 billion pertains to various service income. The bulk of the Other
Income amounting to P1.83 billion pertains to Grants and Donations recorded by
various NGAs including those remitted directly to the National Treasury and
recorded in the Bureau of the Treasury. Shown in Chart No. VII-2, below is the
composition of the total SAGF income, net of CARP.
Chart VII-2 Income by Department
Special Account in the General Fund (Net of CARP)
Based on the certified income remitted to the National Treasury, the
departments/agencies utilize the fund by requesting allotments and NCAs.
During the calendar year 2012, agencies maintaining SAGF incurred
expenses totaling P13.06 billion. Of the expenses of DPWH amounting to P10.39
billion, 84% or P10.2 billion was incurred by the DPWH for the repair and
maintenance of roads, highways and bridges. Most of the expenses of the OEO
and DND pertain to donations/financial assistance to students/scholarship grants
and depreciation of various property, plant and equipment, respectively.
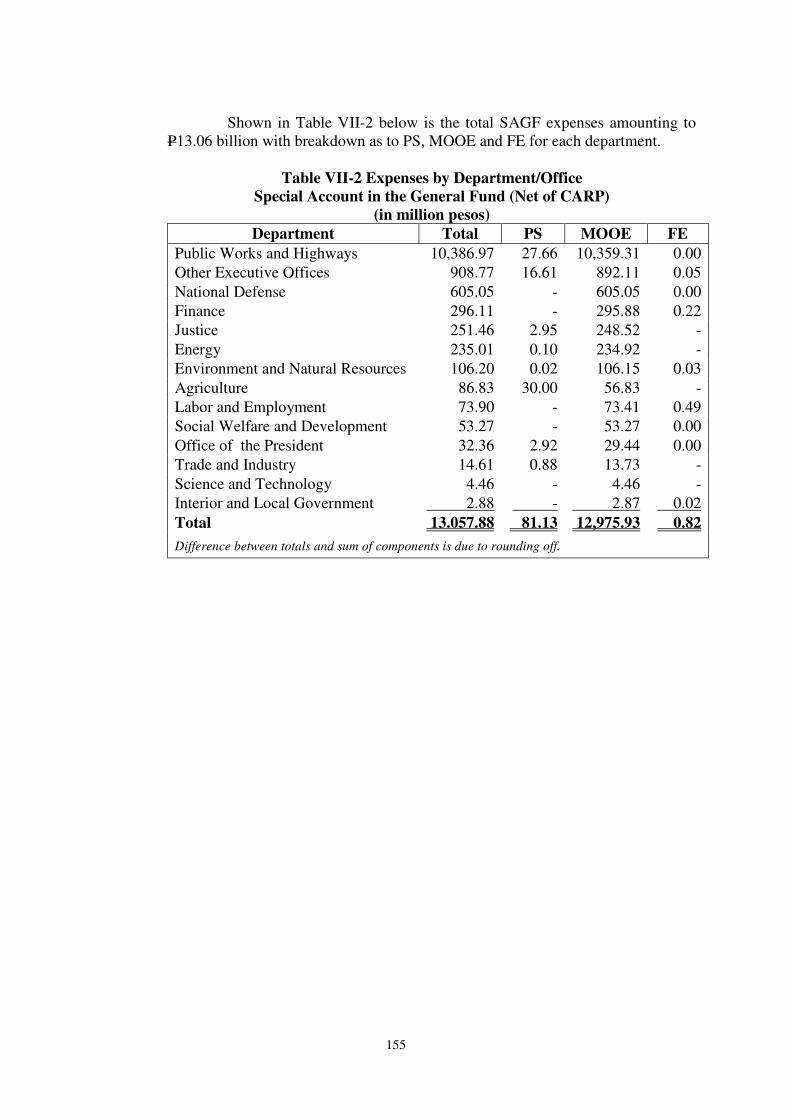
155
Shown in Table VII-2 below is the total SAGF expenses amounting to
P13.06 billion with breakdown as to PS, MOOE and FE for each department.
Table VII-2 Expenses by Department/Office
Special Account in the General Fund (Net of CARP)
(in million pesos)
Department Total PS MOOE FE
Public Works and Highways 10,386.97 27.66 10,359.31 0.00
Other Executive Offices 908.77 16.61 892.11 0.05
National Defense 605.05 - 605.05 0.00
Finance 296.11 - 295.88 0.22
Justice 251.46 2.95 248.52 -
Energy 235.01 0.10 234.92 -
Environment and Natural Resources 106.20 0.02 106.15 0.03
Agriculture 86.83 30.00 56.83 -
Labor and Employment 73.90 - 73.41 0.49
Social Welfare and Development 53.27 - 53.27 0.00
Office of the President 32.36 2.92 29.44 0.00
Trade and Industry 14.61 0.88 13.73 -
Science and Technology 4.46 - 4.46 -
Interior and Local Government 2.88 - 2.87 0.02
Total 13.057.88 81.13 12,975.93 0.82
Difference between totals and sum of components is due to rounding off.
VIII. COMPREHENSIVE
AGRARIAN REFORM
PROGRAM
156
COMPREHENSIVE AGRARIAN REFORM PROGRAM
8.1 Introduction
The Comprehensive Agrarian Reform Program (CARP) created under Republic
Act No. 6657 dated June 10, 1988 was established to protect the rights of farmers,
farmworkers, and landowners, as well as cooperatives, and other independent farmers.
From its initial ten-year life, from 1988 to 1998, it was extended up to June 30, 2014
through the enactment of Republic Act Nos. 8532 and 9700 to be able to pursue some
of the specific objectives/thrusts of the agrarian reform program namely: (a) to
complete land acquisition and distributions within the indicative timeframe of the
CARP on its second decade of implementation; and (b) to fast track delivery of agrarian
reform justice relative to judicial, quasi-judicial, non-judicial and mediation of cases.
To ensure the timely and effective delivery of services to the beneficiaries and to
manage and direct the CARP at the national level, the Presidential Agrarian Reform
Council (PARC) was created under Section 18 of Executive Order No. 229 and Section
41 of R.A. No. 6657. The Council is chaired by the President and supported by the
Secretaries/Heads of implementing agencies. Also established pursuant to Section 43 of
R.A. No 6657 was the PARC Secretariat, which is tasked to organize and harmonize
inter-agency linkages and evaluate CARP projects. At the grassroots level, the
Provincial Reform Coordinating Committee coordinates the delivery of agrarian reform
activities to the people. The Agrarian Reform Fund (ARF), which serves as the funding
source of the program and committees is utilized under the supervision of the PARC
Executive Committee.
8.2 Major Components of CARP and its Implementing Agencies
The implementation of CARP is concentrated on three major components namely:
(1) Land Tenure Improvement (LTI). This component seeks to secure the tenurial status
of the farmers and farm workers in the lands they till. It is operationalized either
through land acquisition and distribution (LAD) or leasehold operations; (2) Program
Beneficiaries Development (PBD) is the support services delivery component of the
agrarian reform program. It aims to capacitate the Agrarian Reform Beneficiaries
(ARBs) and provide them access to the necessary support services to make their lands
more productive, enable them to venture in income generating livelihood projects and
actively participate in community governance; and (3) Agrarian Justice Delivery (AJD)
– aims to provide agrarian legal assistance and the adjudication of cases to ensure
appropriate and timely resolution of agrarian reform issues.
The Department of Agrarian Reform (DAR) is in-charged with the main
responsibility in the implementation of the CARP. It is supported by other government
agencies/office which act as implementing agencies of the CARP. Their roles and
responsibilities are as follows: (a) Department of Environment and Natural Resources
(DENR) – in-charge of land surveys and distribution of free patents and stewardship
contracts to beneficiaries of public and alienable and disposable lands suitable to
agriculture and agro-forestry areas; (b) Department of Agriculture (DA) – responsible
for agricultural extension services; (c) Land Bank of the Philippines (LBP) – land
evaluation, collection of land amortization from farmer-beneficiaries and provision of
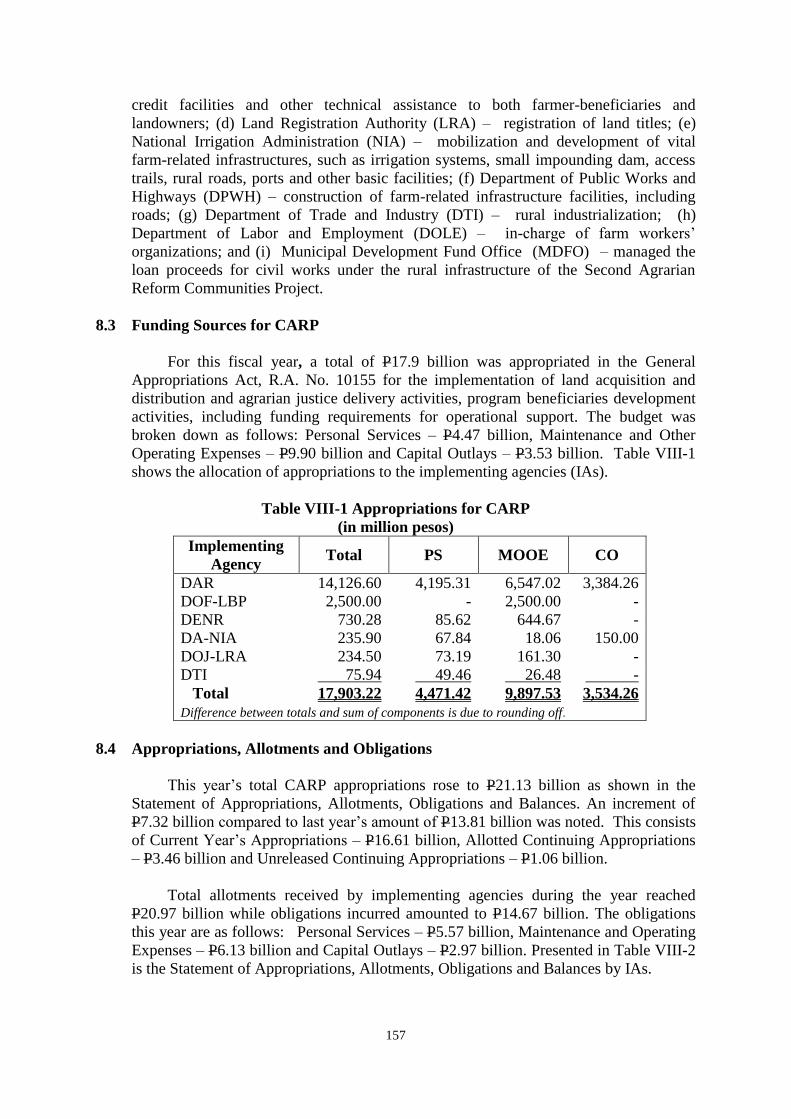
157
credit facilities and other technical assistance to both farmer-beneficiaries and
landowners; (d) Land Registration Authority (LRA) – registration of land titles; (e)
National Irrigation Administration (NIA) – mobilization and development of vital
farm-related infrastructures, such as irrigation systems, small impounding dam, access
trails, rural roads, ports and other basic facilities; (f) Department of Public Works and
Highways (DPWH) – construction of farm-related infrastructure facilities, including
roads; (g) Department of Trade and Industry (DTI) – rural industrialization; (h)
Department of Labor and Employment (DOLE) – in-charge of farm workers’
organizations; and (i) Municipal Development Fund Office (MDFO) – managed the
loan proceeds for civil works under the rural infrastructure of the Second Agrarian
Reform Communities Project.
8.3 Funding Sources for CARP
For this fiscal year, a total of P17.9 billion was appropriated in the General
Appropriations Act, R.A. No. 10155 for the implementation of land acquisition and
distribution and agrarian justice delivery activities, program beneficiaries development
activities, including funding requirements for operational support. The budget was
broken down as follows: Personal Services – P4.47 billion, Maintenance and Other
Operating Expenses – P9.90 billion and Capital Outlays – P3.53 billion. Table VIII-1
shows the allocation of appropriations to the implementing agencies (IAs).
Table VIII-1 Appropriations for CARP
(in million pesos)
Implementing
Agency Total PS MOOE CO
DAR 14,126.60 4,195.31 6,547.02 3,384.26
DOF-LBP 2,500.00 - 2,500.00 -
DENR 730.28 85.62 644.67 -
DA-NIA 235.90 67.84 18.06 150.00
DOJ-LRA 234.50 73.19 161.30 -
DTI 75.94 49.46 26.48 -
Total 17,903.22 4,471.42 9,897.53 3,534.26
Difference between totals and sum of components is due to rounding off.
8.4 Appropriations, Allotments and Obligations
This year’s total CARP appropriations rose to P21.13 billion as shown in the
Statement of Appropriations, Allotments, Obligations and Balances. An increment of
P7.32 billion compared to last year’s amount of P13.81 billion was noted. This consists
of Current Year’s Appropriations – P16.61 billion, Allotted Continuing Appropriations
– P3.46 billion and Unreleased Continuing Appropriations – P1.06 billion.
Total allotments received by implementing agencies during the year reached
P20.97 billion while obligations incurred amounted to P14.67 billion. The obligations
this year are as follows: Personal Services – P5.57 billion, Maintenance and Operating
Expenses – P6.13 billion and Capital Outlays – P2.97 billion. Presented in Table VIII-2
is the Statement of Appropriations, Allotments, Obligations and Balances by IAs.
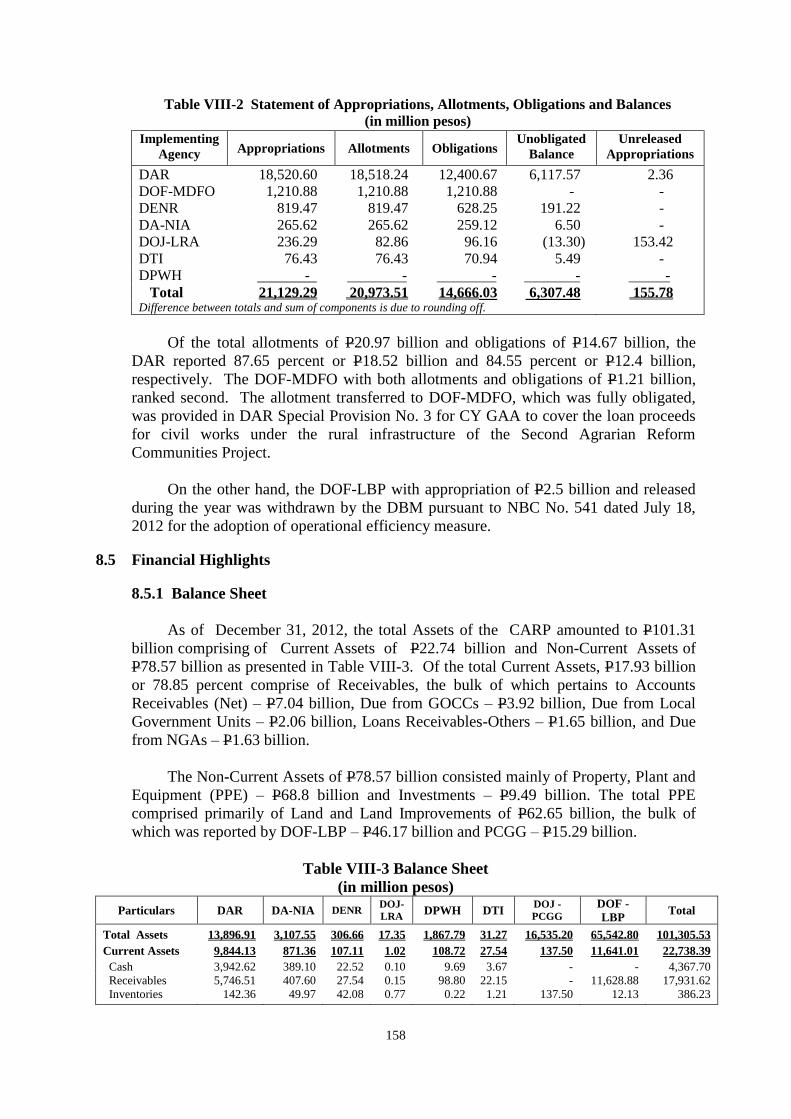
158
Table VIII-2 Statement of Appropriations, Allotments, Obligations and Balances
(in million pesos)
Implementing
Agency Appropriations Allotments Obligations Unobligated
Balance
Unreleased
Appropriations
DAR 18,520.60 18,518.24 12,400.67 6,117.57 2.36
DOF-MDFO 1,210.88 1,210.88 1,210.88 - -
DENR 819.47 819.47 628.25 191.22 -
DA-NIA 265.62 265.62 259.12 6.50 -
DOJ-LRA 236.29 82.86 96.16 (13.30) 153.42
DTI 76.43 76.43 70.94 5.49 -
DPWH - - - - -
Total 21,129.29 20,973.51 14,666.03 6,307.48 155.78 Difference between totals and sum of components is due to rounding off.
Of the total allotments of P20.97 billion and obligations of P14.67 billion, the
DAR reported 87.65 percent or P18.52 billion and 84.55 percent or P12.4 billion,
respectively. The DOF-MDFO with both allotments and obligations of P1.21 billion,
ranked second. The allotment transferred to DOF-MDFO, which was fully obligated,
was provided in DAR Special Provision No. 3 for CY GAA to cover the loan proceeds
for civil works under the rural infrastructure of the Second Agrarian Reform
Communities Project.
On the other hand, the DOF-LBP with appropriation of P2.5 billion and released
during the year was withdrawn by the DBM pursuant to NBC No. 541 dated July 18,
2012 for the adoption of operational efficiency measure.
8.5 Financial Highlights
8.5.1 Balance Sheet
As of December 31, 2012, the total Assets of the CARP amounted to P101.31
billion comprising of Current Assets of P22.74 billion and Non-Current Assets of
P78.57 billion as presented in Table VIII-3. Of the total Current Assets, P17.93 billion
or 78.85 percent comprise of Receivables, the bulk of which pertains to Accounts
Receivables (Net) – P7.04 billion, Due from GOCCs – P3.92 billion, Due from Local
Government Units – P2.06 billion, Loans Receivables-Others – P1.65 billion, and Due
from NGAs – P1.63 billion.
The Non-Current Assets of P78.57 billion consisted mainly of Property, Plant and
Equipment (PPE) – P68.8 billion and Investments – P9.49 billion. The total PPE
comprised primarily of Land and Land Improvements of P62.65 billion, the bulk of
which was reported by DOF-LBP – P46.17 billion and PCGG – P15.29 billion.
Table VIII-3 Balance Sheet
(in million pesos)
Particulars DAR DA-NIA DENR DOJ-
LRA DPWH DTI
DOJ -
PCGG
DOF -
LBP Total
Total Assets 13,896.91 3,107.55 306.66 17.35 1,867.79 31.27 16,535.20 65,542.80 101,305.53
Current Assets 9,844.13 871.36 107.11 1.02 108.72 27.54 137.50 11,641.01 22,738.39
Cash 3,942.62 389.10 22.52 0.10 9.69 3.67 - - 4,367.70
Receivables 5,746.51 407.60 27.54 0.15 98.80 22.15 - 11,628.88 17,931.62
Inventories 142.36 49.97 42.08 0.77 0.22 1.21 137.50 12.13 386.23
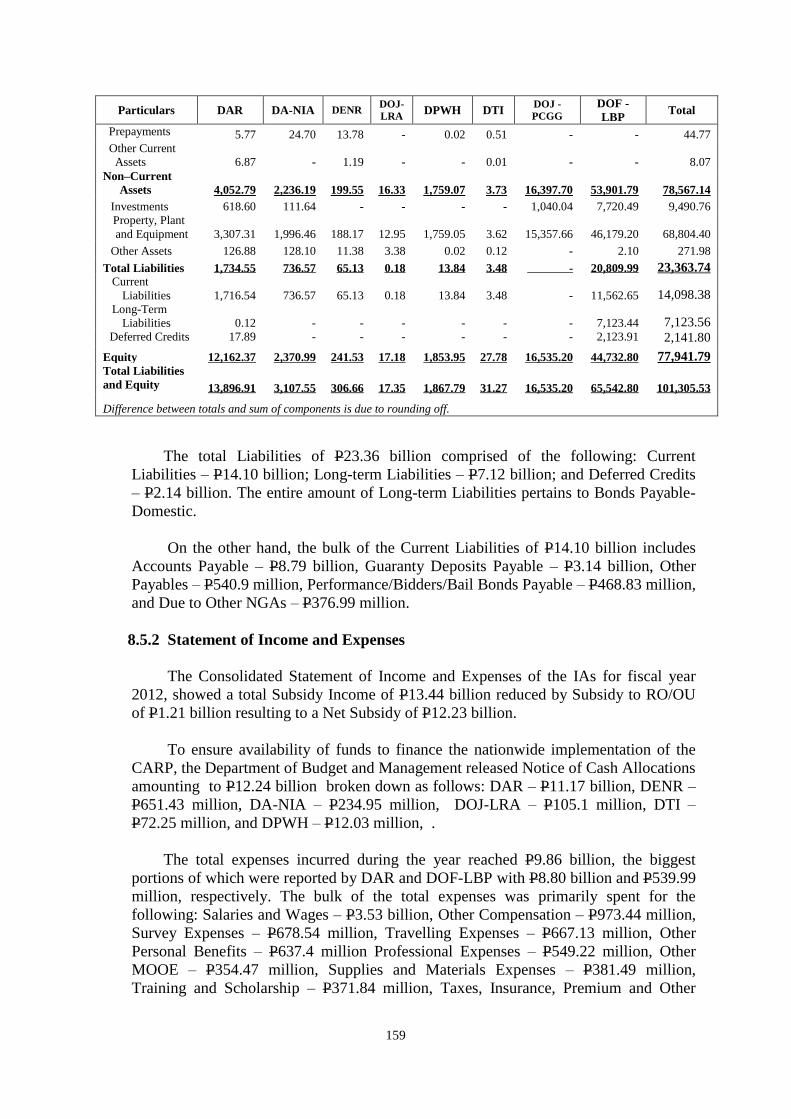
159
Particulars DAR DA-NIA DENR DOJ-
LRA DPWH DTI
DOJ -
PCGG
DOF -
LBP Total
Prepayments 5.77 24.70 13.78 - 0.02 0.51 - - 44.77
Other Current
Assets 6.87 - 1.19 - - 0.01 - - 8.07
Non–Current
Assets
4,052.79
2,236.19
199.55
16.33
1,759.07
3.73
16,397.70
53,901.79
78,567.14
Investments 618.60 111.64 - - - - 1,040.04 7,720.49 9,490.76
Property, Plant
and Equipment 3,307.31 1,996.46 188.17 12.95 1,759.05 3.62 15,357.66 46,179.20 68,804.40
Other Assets 126.88 128.10 11.38 3.38 0.02 0.12 - 2.10 271.98
Total Liabilities 1,734.55 736.57 65.13 0.18 13.84 3.48 - 20,809.99 23,363.74 Current
Liabilities
1,716.54
736.57
65.13
0.18 13.84 3.48 - 11,562.65 14,098.38 Long-Term
Liabilities 0.12 - - - - - - 7,123.44 7,123.56 Deferred Credits 17.89 - - - - - - 2,123.91 2,141.80
Equity 12,162.37 2,370.99 241.53 17.18 1,853.95 27.78 16,535.20 44,732.80 77,941.79 Total Liabilities
and Equity 13,896.91 3,107.55 306.66 17.35 1,867.79 31.27 16,535.20 65,542.80 101,305.53
Difference between totals and sum of components is due to rounding off.
The total Liabilities of P23.36 billion comprised of the following: Current
Liabilities – P14.10 billion; Long-term Liabilities – P7.12 billion; and Deferred Credits
– P2.14 billion. The entire amount of Long-term Liabilities pertains to Bonds Payable-
Domestic.
On the other hand, the bulk of the Current Liabilities of P14.10 billion includes
Accounts Payable – P8.79 billion, Guaranty Deposits Payable – P3.14 billion, Other
Payables – P540.9 million, Performance/Bidders/Bail Bonds Payable – P468.83 million,
and Due to Other NGAs – P376.99 million.
8.5.2 Statement of Income and Expenses
The Consolidated Statement of Income and Expenses of the IAs for fiscal year
2012, showed a total Subsidy Income of P13.44 billion reduced by Subsidy to RO/OU
of P1.21 billion resulting to a Net Subsidy of P12.23 billion.
To ensure availability of funds to finance the nationwide implementation of the
CARP, the Department of Budget and Management released Notice of Cash Allocations
amounting to P12.24 billion broken down as follows: DAR – P11.17 billion, DENR –
P651.43 million, DA-NIA – P234.95 million, DOJ-LRA – P105.1 million, DTI –
P72.25 million, and DPWH – P12.03 million, .
The total expenses incurred during the year reached P9.86 billion, the biggest
portions of which were reported by DAR and DOF-LBP with P8.80 billion and P539.99
million, respectively. The bulk of the total expenses was primarily spent for the
following: Salaries and Wages – P3.53 billion, Other Compensation – P973.44 million,
Survey Expenses – P678.54 million, Travelling Expenses – P667.13 million, Other
Personal Benefits – P637.4 million Professional Expenses – P549.22 million, Other
MOOE – P354.47 million, Supplies and Materials Expenses – P381.49 million,
Training and Scholarship – P371.84 million, Taxes, Insurance, Premium and Other
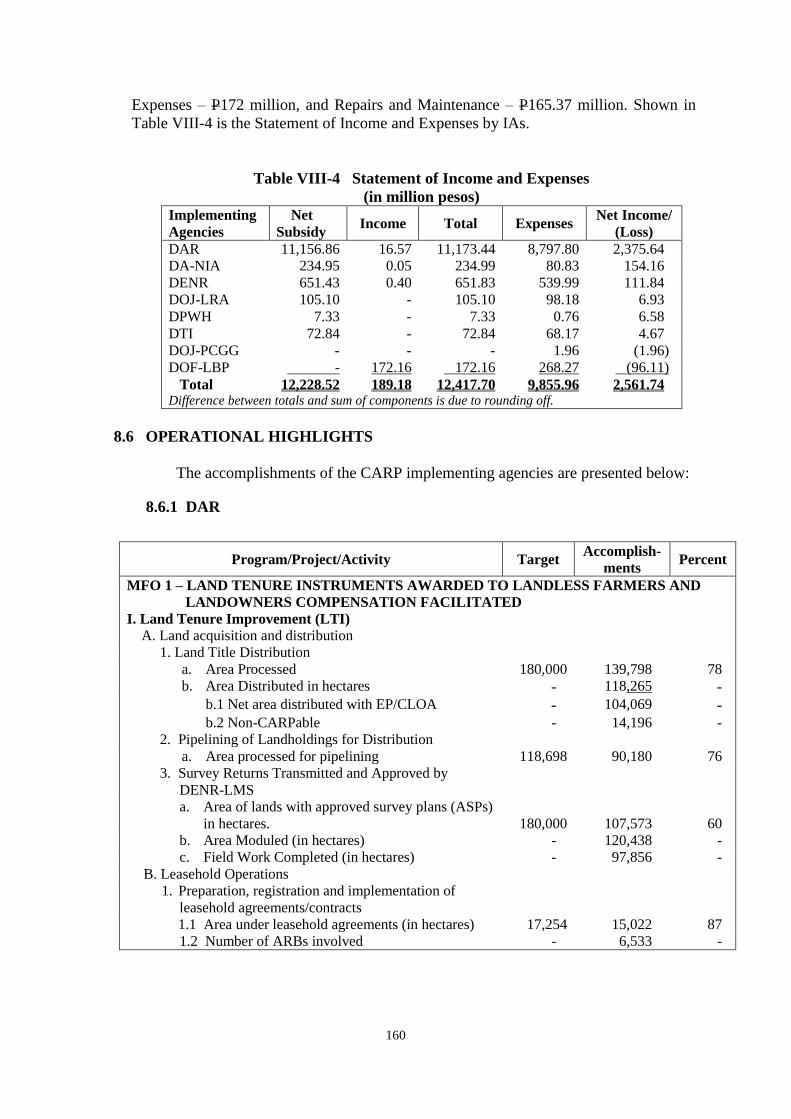
160
Expenses – P172 million, and Repairs and Maintenance – P165.37 million. Shown in
Table VIII-4 is the Statement of Income and Expenses by IAs.
Table VIII-4 Statement of Income and Expenses
(in million pesos)
Implementing
Agencies
Net
Subsidy Income Total Expenses
Net Income/
(Loss)
DAR 11,156.86 16.57 11,173.44 8,797.80 2,375.64
DA-NIA 234.95 0.05 234.99 80.83 154.16
DENR 651.43 0.40 651.83 539.99 111.84
DOJ-LRA 105.10 - 105.10 98.18 6.93
DPWH 7.33 - 7.33 0.76 6.58
DTI 72.84 - 72.84 68.17 4.67
DOJ-PCGG - - - 1.96 (1.96)
DOF-LBP - 172.16 172.16 268.27 (96.11)
Total 12,228.52 189.18 12,417.70 9,855.96 2,561.74 Difference between totals and sum of components is due to rounding off.
8.6 OPERATIONAL HIGHLIGHTS
The accomplishments of the CARP implementing agencies are presented below:
8.6.1 DAR
Program/Project/Activity Target Accomplish-
ments Percent
MFO 1 – LAND TENURE INSTRUMENTS AWARDED TO LANDLESS FARMERS AND
LANDOWNERS COMPENSATION FACILITATED
I. Land Tenure Improvement (LTI)
A. Land acquisition and distribution
1. Land Title Distribution
a. Area Processed 180,000 139,798 78
b. Area Distributed in hectares - 118,265 - b.1 Net area distributed with EP/CLOA - 104,069 - b.2 Non-CARPable - 14,196 -
2. Pipelining of Landholdings for Distribution
a. Area processed for pipelining 118,698 90,180 76
3. Survey Returns Transmitted and Approved by
DENR-LMS
a. Area of lands with approved survey plans (ASPs)
in hectares.
180,000
107,573
60
b. Area Moduled (in hectares) - 120,438 -
c. Field Work Completed (in hectares) - 97,856 -
B. Leasehold Operations
1. Preparation, registration and implementation of
leasehold agreements/contracts
1.1 Area under leasehold agreements (in hectares) 17,254 15,022 87
1.2 Number of ARBs involved - 6,533 -
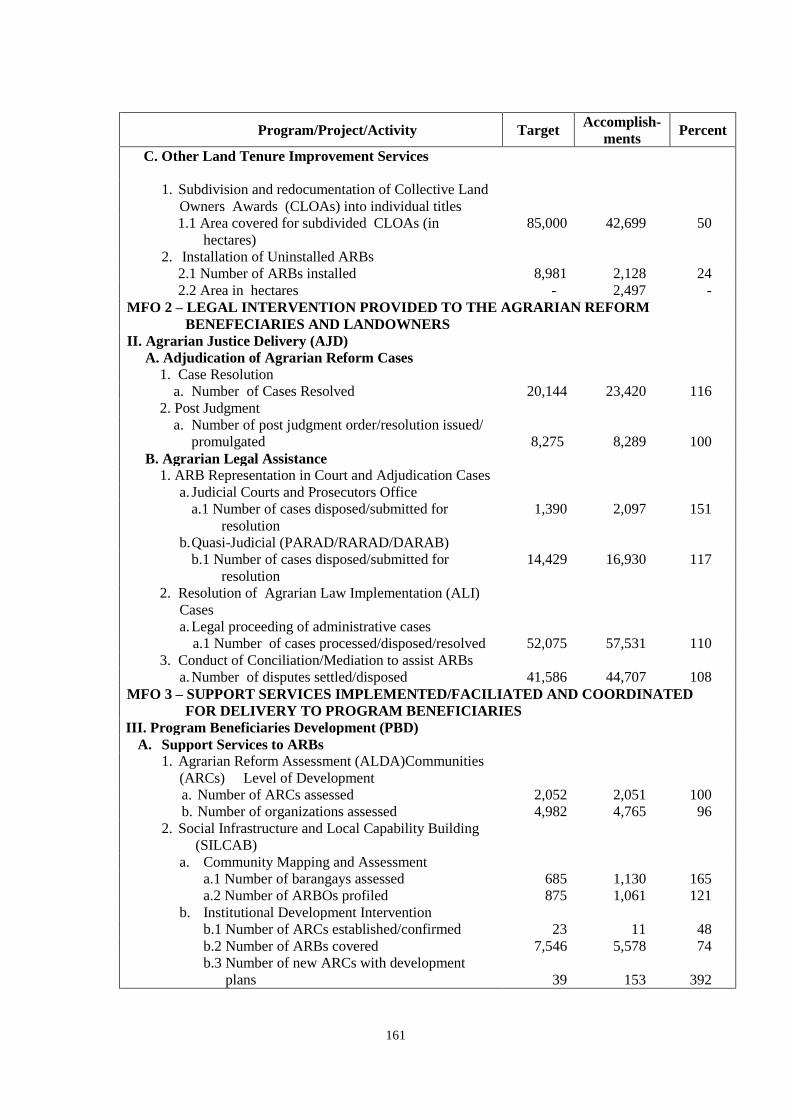
161
Program/Project/Activity Target Accomplish-
ments Percent
C. Other Land Tenure Improvement Services
1. Subdivision and redocumentation of Collective Land
Owners Awards (CLOAs) into individual titles
1.1 Area covered for subdivided CLOAs (in
hectares)
85,000 42,699 50
2. Installation of Uninstalled ARBs
2.1 Number of ARBs installed 8,981 2,128 24
2.2 Area in hectares - 2,497 -
MFO 2 – LEGAL INTERVENTION PROVIDED TO THE AGRARIAN REFORM
BENEFECIARIES AND LANDOWNERS
II. Agrarian Justice Delivery (AJD)
A. Adjudication of Agrarian Reform Cases
1. Case Resolution
a. Number of Cases Resolved 20,144 23,420 116
2. Post Judgment
a. Number of post judgment order/resolution issued/
promulgated 8,275
8,289 100
B. Agrarian Legal Assistance
1. ARB Representation in Court and Adjudication Cases
a. Judicial Courts and Prosecutors Office
a.1 Number of cases disposed/submitted for
resolution
1,390 2,097 151
b. Quasi-Judicial (PARAD/RARAD/DARAB)
b.1 Number of cases disposed/submitted for
resolution
14,429 16,930 117
2. Resolution of Agrarian Law Implementation (ALI)
Cases
a. Legal proceeding of administrative cases
a.1 Number of cases processed/disposed/resolved 52,075 57,531 110
3. Conduct of Conciliation/Mediation to assist ARBs
a. Number of disputes settled/disposed 41,586 44,707 108
MFO 3 – SUPPORT SERVICES IMPLEMENTED/FACILIATED AND COORDINATED
FOR DELIVERY TO PROGRAM BENEFICIARIES
III. Program Beneficiaries Development (PBD)
A. Support Services to ARBs
1. Agrarian Reform Assessment (ALDA)Communities
(ARCs) Level of Development
a. Number of ARCs assessed 2,052 2,051 100
b. Number of organizations assessed 4,982 4,765 96
2. Social Infrastructure and Local Capability Building
(SILCAB)
a. Community Mapping and Assessment
a.1 Number of barangays assessed 685 1,130 165
a.2 Number of ARBOs profiled 875 1,061 121
b. Institutional Development Intervention
b.1 Number of ARCs established/confirmed 23 11 48
b.2 Number of ARBs covered 7,546 5,578 74
b.3 Number of new ARCs with development
plans
39
153
392
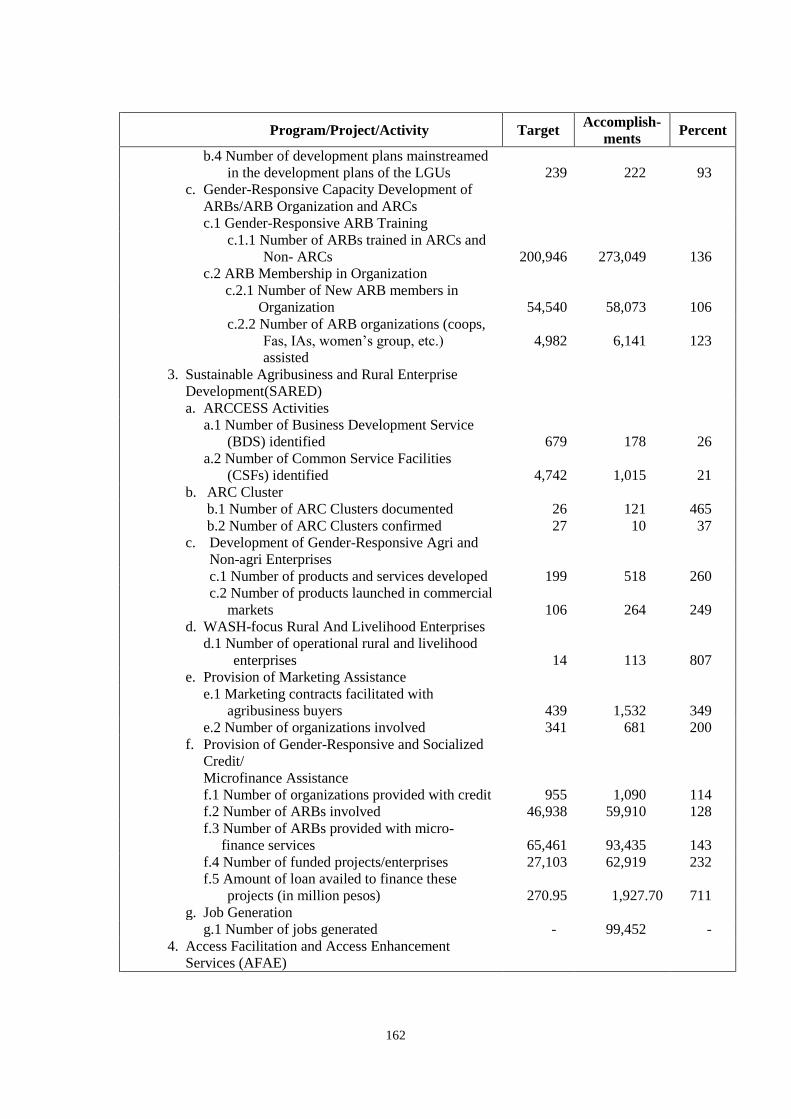
162
Program/Project/Activity Target Accomplish-
ments Percent
b.4 Number of development plans mainstreamed
in the development plans of the LGUs
239
222
93
c. Gender-Responsive Capacity Development of
ARBs/ARB Organization and ARCs
c.1 Gender-Responsive ARB Training
c.1.1 Number of ARBs trained in ARCs and
Non- ARCs
200,946
273,049
136
c.2 ARB Membership in Organization
c.2.1 Number of New ARB members in
Organization
54,540
58
58,073
106
c.2.2 Number of ARB organizations (coops,
Fas, IAs, women’s group, etc.)
assisted
4,982
6,141
123
3. Sustainable Agribusiness and Rural Enterprise
Development(SARED)
a. ARCCESS Activities
a.1 Number of Business Development Service
(BDS) identified
679
178
26
a.2 Number of Common Service Facilities
(CSFs) identified
4,742
1,015
21
b. ARC Cluster
b.1 Number of ARC Clusters documented 26 121 465
b.2 Number of ARC Clusters confirmed 27 10 37
c. Development of Gender-Responsive Agri and
Non-agri Enterprises
c.1 Number of products and services developed 199 518 260
c.2 Number of products launched in commercial
markets
106
264
249
d. WASH-focus Rural And Livelihood Enterprises
d.1 Number of operational rural and livelihood
enterprises
14
113
807
e. Provision of Marketing Assistance
e.1 Marketing contracts facilitated with
agribusiness buyers
439
1,532
349
e.2 Number of organizations involved 341 681 200
f. Provision of Gender-Responsive and Socialized
Credit/
Microfinance Assistance
f.1 Number of organizations provided with credit 955 1,090 114
f.2 Number of ARBs involved 46,938 59,910 128
f.3 Number of ARBs provided with micro-
finance services
65,461
93,435
143
f.4 Number of funded projects/enterprises 27,103 62,919 232
f.5 Amount of loan availed to finance these
projects (in million pesos)
270.95
1,927.70
711
g. Job Generation
g.1 Number of jobs generated - 99,452 -
4. Access Facilitation and Access Enhancement
Services (AFAE)
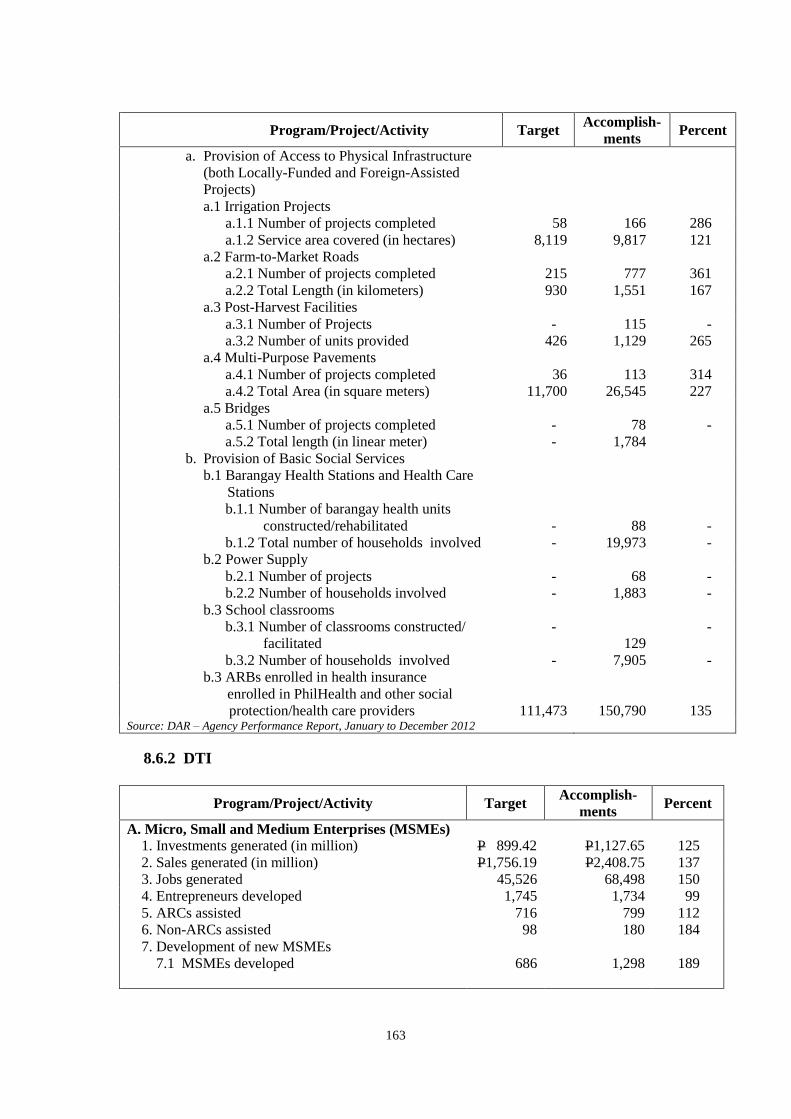
163
Program/Project/Activity Target Accomplish-
ments Percent
a. Provision of Access to Physical Infrastructure
(both Locally-Funded and Foreign-Assisted
Projects)
a.1 Irrigation Projects
a.1.1 Number of projects completed 58 166 286
a.1.2 Service area covered (in hectares) 8,119 9,817 121
a.2 Farm-to-Market Roads
a.2.1 Number of projects completed 215 777 361
a.2.2 Total Length (in kilometers) 930 1,551 167
a.3 Post-Harvest Facilities
a.3.1 Number of Projects - 115 -
a.3.2 Number of units provided 426 1,129 265
a.4 Multi-Purpose Pavements
a.4.1 Number of projects completed 36 113 314
a.4.2 Total Area (in square meters) 11,700 26,545 227
a.5 Bridges
a.5.1 Number of projects completed - 78 -
a.5.2 Total length (in linear meter) - 1,784
b. Provision of Basic Social Services
b.1 Barangay Health Stations and Health Care
Stations
b.1.1 Number of barangay health units
constructed/rehabilitated
-
88
-
b.1.2 Total number of households involved - 19,973 -
b.2 Power Supply
b.2.1 Number of projects - 68 -
b.2.2 Number of households involved - 1,883 -
b.3 School classrooms
b.3.1 Number of classrooms constructed/
facilitated
-
129
-
b.3.2 Number of households involved - 7,905 -
b.3 ARBs enrolled in health insurance
enrolled in PhilHealth and other social
protection/health care providers
111,473
150,790
135 Source: DAR – Agency Performance Report, January to December 2012
8.6.2 DTI
Program/Project/Activity Target Accomplish-
ments Percent
A. Micro, Small and Medium Enterprises (MSMEs)
1. Investments generated (in million) P 899.42 P1,127.65 125
2. Sales generated (in million) P1,756.19 P2,408.75 137
3. Jobs generated 45,526 68,498 150
4. Entrepreneurs developed 1,745 1,734 99
5. ARCs assisted 716 799 112
6. Non-ARCs assisted 98 180 184
7. Development of new MSMEs
7.1 MSMEs developed
686
1,298
189
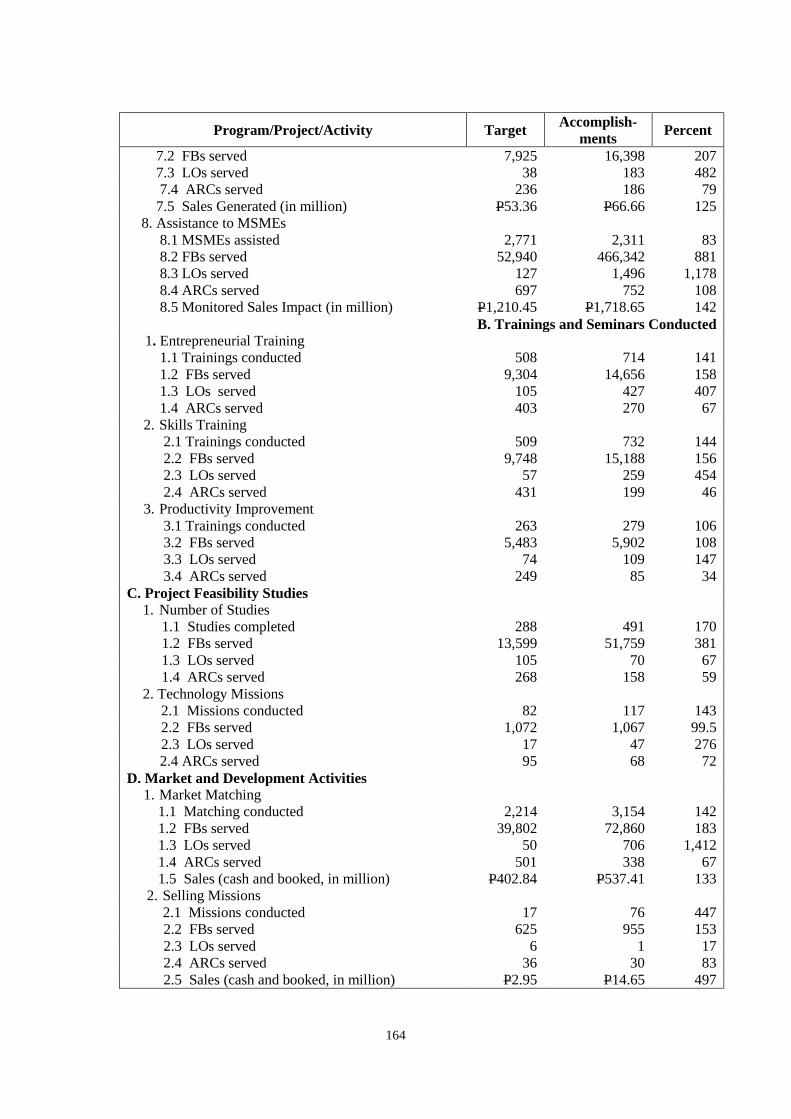
164
Program/Project/Activity Target Accomplish-
ments Percent
7.2 FBs served 7,925 16,398 207
7.3 LOs served 38 183 482
7.4 ARCs served 236 186 79
7.5 Sales Generated (in million) P53.36 P66.66 125
8. Assistance to MSMEs
8.1 MSMEs assisted
8.2 FBs served
8.3 LOs served
8.4 ARCs served
8.5 Monitored Sales Impact (in million)
2,771
52,940
127
697
P1,210.45
2,311
466,342
1,496
752
P1,718.65
83
881
1,178
108
142
B. Trainings and Seminars Conducted
1. Entrepreneurial Training
1.1 Trainings conducted
1.2 FBs served
1.3 LOs served
1.4 ARCs served
508
9,304
105
403
714
14,656
427
270
141
158
407
67
2. Skills Training
2.1 Trainings conducted
2.2 FBs served
2.3 LOs served
2.4 ARCs served
509
9,748
57
431
732
15,188
259
199
144
156
454
46
3. Productivity Improvement
3.1 Trainings conducted
3.2 FBs served
3.3 LOs served
3.4 ARCs served
263
5,483
74
249
279
5,902
109
85
106
108
147
34
C. Project Feasibility Studies
1. Number of Studies
1.1 Studies completed 288 491 170
1.2 FBs served 13,599 51,759 381
1.3 LOs served 105 70 67
1.4 ARCs served 268 158 59
2. Technology Missions
2.1 Missions conducted 82 117 143
2.2 FBs served 1,072 1,067 99.5
2.3 LOs served 17 47 276
2.4 ARCs served 95 68 72
D. Market and Development Activities
1. Market Matching
1.1 Matching conducted
1.2 FBs served
1.3 LOs served
1.4 ARCs served
1.5 Sales (cash and booked, in million)
2,214
39,802
50
501
P402.84
3,154
72,860
706
338
P537.41
142
183
1,412
67
133
2. Selling Missions
2.1 Missions conducted 17 76 447
2.2 FBs served 625 955 153
2.3 LOs served 6 1 17
2.4 ARCs served 36 30 83
2.5 Sales (cash and booked, in million) P2.95 P14.65 497
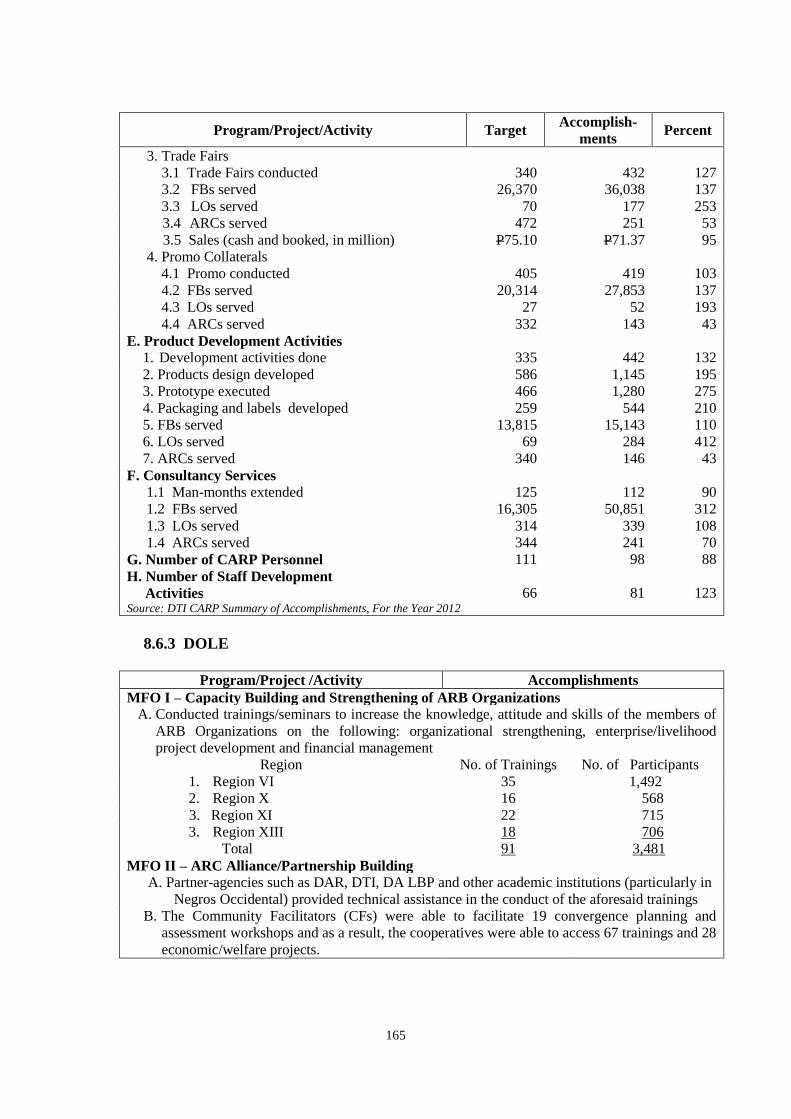
165
Program/Project/Activity Target Accomplish-
ments Percent
3. Trade Fairs
3.1 Trade Fairs conducted 340 432 127 3.2 FBs served 26,370 36,038 137 3.3 LOs served 70 177 253 3.4 ARCs served 472 251 53
3.5 Sales (cash and booked, in million) P75.10 P71.37 95 4. Promo Collaterals
4.1 Promo conducted 405 419 103 4.2 FBs served 20,314 27,853 137 4.3 LOs served 27 52 193 4.4 ARCs served 332 143 43
E. Product Development Activities
1. Development activities done 335 442 132
2. Products design developed
3. Prototype executed
4. Packaging and labels developed
5. FBs served
6. LOs served
7. ARCs served
586
466
259
13,815
69
340
1,145
1,280
544
15,143
284
146
195
275
210
110
412
43
F. Consultancy Services
1.1 Man-months extended
1.2 FBs served
1.3 LOs served
1.4 ARCs served
125
16,305
314
344
112
50,851
339
241
90
312
108
70
G. Number of CARP Personnel 111 98 88
H. Number of Staff Development
Activities
66
81
123 Source: DTI CARP Summary of Accomplishments, For the Year 2012
8.6.3 DOLE
Program/Project /Activity Accomplishments
MFO I – Capacity Building and Strengthening of ARB Organizations
A. Conducted trainings/seminars to increase the knowledge, attitude and skills of the members of
ARB Organizations on the following: organizational strengthening, enterprise/livelihood
project development and financial management
Region No. of Trainings No. of Participants
1. Region VI 35 1,492
2. Region X 16 568
3. Region XI 22 715
3. Region XIII 18 706
Total 91 3,481
MFO II – ARC Alliance/Partnership Building A. Partner-agencies such as DAR, DTI, DA LBP and other academic institutions (particularly in
Negros Occidental) provided technical assistance in the conduct of the aforesaid trainings
B. The Community Facilitators (CFs) were able to facilitate 19 convergence planning and
assessment workshops and as a result, the cooperatives were able to access 67 trainings and 28
economic/welfare projects.
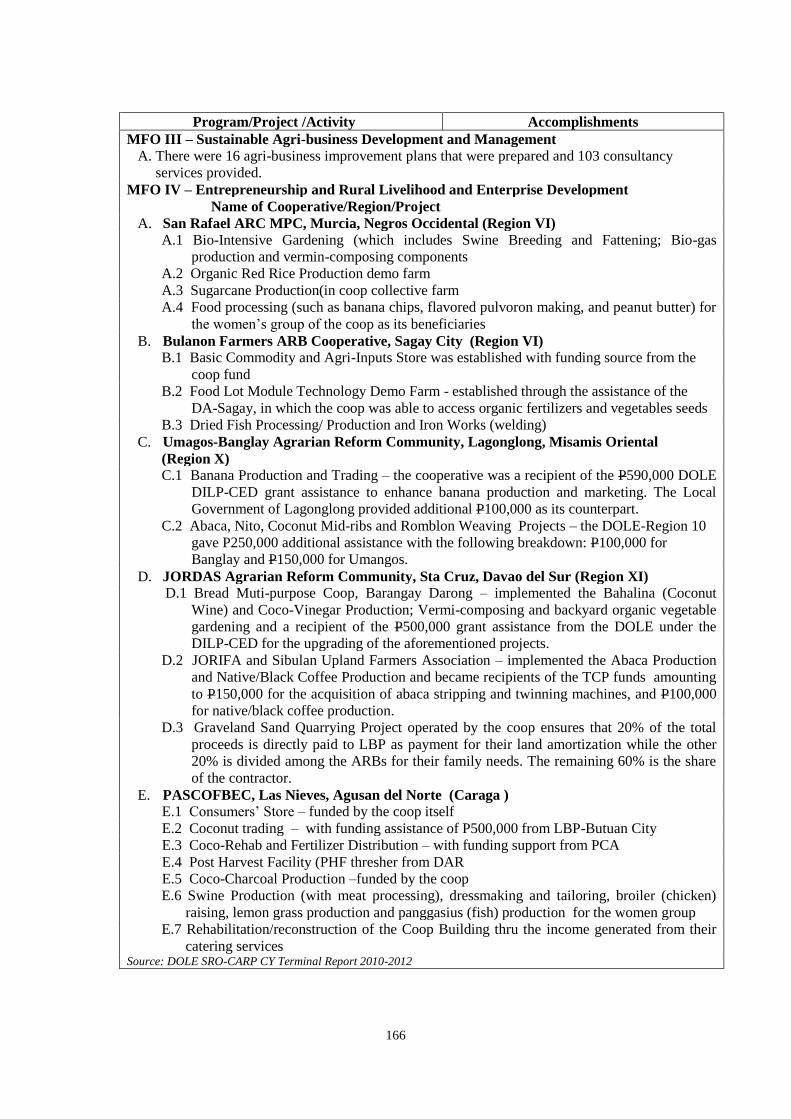
166
Program/Project /Activity Accomplishments
MFO III – Sustainable Agri-business Development and Management
A. There were 16 agri-business improvement plans that were prepared and 103 consultancy
services provided.
MFO IV – Entrepreneurship and Rural Livelihood and Enterprise Development
Name of Cooperative/Region/Project
A. San Rafael ARC MPC, Murcia, Negros Occidental (Region VI)
A.1 Bio-Intensive Gardening (which includes Swine Breeding and Fattening; Bio-gas
production and vermin-composing components
A.2 Organic Red Rice Production demo farm
A.3 Sugarcane Production(in coop collective farm
A.4 Food processing (such as banana chips, flavored pulvoron making, and peanut butter) for
the women’s group of the coop as its beneficiaries
B. Bulanon Farmers ARB Cooperative, Sagay City (Region VI)
B.1 Basic Commodity and Agri-Inputs Store was established with funding source from the
coop fund
B.2 Food Lot Module Technology Demo Farm - established through the assistance of the
DA-Sagay, in which the coop was able to access organic fertilizers and vegetables seeds
B.3 Dried Fish Processing/ Production and Iron Works (welding)
C. Umagos-Banglay Agrarian Reform Community, Lagonglong, Misamis Oriental
(Region X)
C.1 Banana Production and Trading – the cooperative was a recipient of the P590,000 DOLE
DILP-CED grant assistance to enhance banana production and marketing. The Local
Government of Lagonglong provided additional P100,000 as its counterpart.
C.2 Abaca, Nito, Coconut Mid-ribs and Romblon Weaving Projects – the DOLE-Region 10
gave P250,000 additional assistance with the following breakdown: P100,000 for
Banglay and P150,000 for Umangos.
D. JORDAS Agrarian Reform Community, Sta Cruz, Davao del Sur (Region XI)
D.1 Bread Muti-purpose Coop, Barangay Darong – implemented the Bahalina (Coconut
Wine) and Coco-Vinegar Production; Vermi-composing and backyard organic vegetable
gardening and a recipient of the P500,000 grant assistance from the DOLE under the
DILP-CED for the upgrading of the aforementioned projects.
D.2 JORIFA and Sibulan Upland Farmers Association – implemented the Abaca Production
and Native/Black Coffee Production and became recipients of the TCP funds amounting
to P150,000 for the acquisition of abaca stripping and twinning machines, and P100,000
for native/black coffee production.
D.3 Graveland Sand Quarrying Project operated by the coop ensures that 20% of the total
proceeds is directly paid to LBP as payment for their land amortization while the other
20% is divided among the ARBs for their family needs. The remaining 60% is the share
of the contractor.
E. PASCOFBEC, Las Nieves, Agusan del Norte (Caraga )
E.1 Consumers’ Store – funded by the coop itself
E.2 Coconut trading – with funding assistance of P500,000 from LBP-Butuan City
E.3 Coco-Rehab and Fertilizer Distribution – with funding support from PCA
E.4 Post Harvest Facility (PHF thresher from DAR
E.5 Coco-Charcoal Production –funded by the coop
E.6 Swine Production (with meat processing), dressmaking and tailoring, broiler (chicken)
raising, lemon grass production and panggasius (fish) production for the women group
E.7 Rehabilitation/reconstruction of the Coop Building thru the income generated from their
catering services Source: DOLE SRO-CARP CY Terminal Report 2010-2012
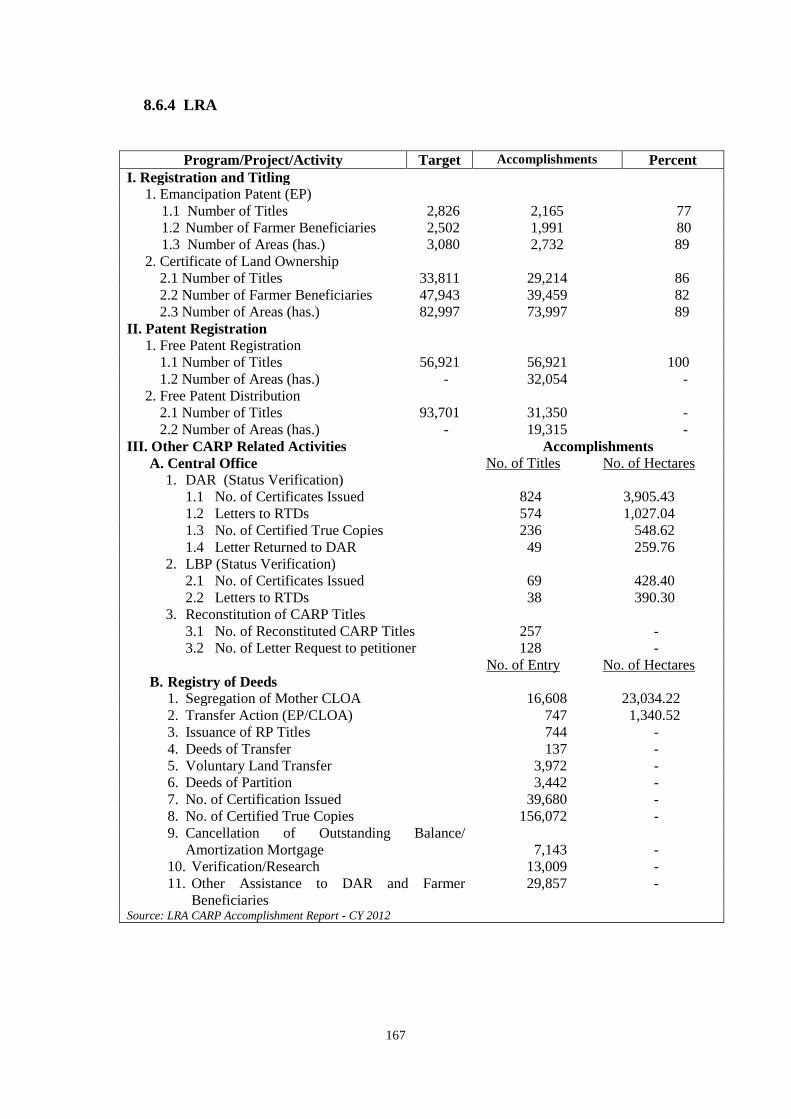
167
8.6.4 LRA
Program/Project/Activity Target Accomplishments Percent
I. Registration and Titling
1. Emancipation Patent (EP)
1.1 Number of Titles 2,826 2,165 77
1.2 Number of Farmer Beneficiaries 2,502 1,991 80
1.3 Number of Areas (has.) 3,080 2,732 89
2. Certificate of Land Ownership
2.1 Number of Titles 33,811 29,214 86
2.2 Number of Farmer Beneficiaries 47,943 39,459 82
2.3 Number of Areas (has.) 82,997 73,997 89
II. Patent Registration
1. Free Patent Registration
1.1 Number of Titles 56,921 56,921 100
1.2 Number of Areas (has.) - 32,054 -
2. Free Patent Distribution
2.1 Number of Titles 93,701 31,350 -
2.2 Number of Areas (has.) - 19,315 -
III. Other CARP Related Activities Accomplishments
A. Central Office No. of Titles No. of Hectares
1. DAR (Status Verification)
1.1 No. of Certificates Issued 824 3,905.43
1.2 Letters to RTDs 574 1,027.04
1.3 No. of Certified True Copies 236 548.62
1.4 Letter Returned to DAR 49 259.76
2. LBP (Status Verification)
2.1 No. of Certificates Issued 69 428.40
2.2 Letters to RTDs 38 390.30
3. Reconstitution of CARP Titles
3.1 No. of Reconstituted CARP Titles 257 -
3.2 No. of Letter Request to petitioner 128 -
No. of Entry No. of Hectares
B. Registry of Deeds
1. Segregation of Mother CLOA 16,608 23,034.22
2. Transfer Action (EP/CLOA) 747 1,340.52
3. Issuance of RP Titles 744 -
4. Deeds of Transfer 137 -
5. Voluntary Land Transfer 3,972 -
6. Deeds of Partition 3,442 -
7. No. of Certification Issued 39,680 -
8. No. of Certified True Copies 156,072 -
9. Cancellation of Outstanding Balance/
Amortization Mortgage
7,143
-
10. Verification/Research 13,009 -
11. Other Assistance to DAR and Farmer
Beneficiaries
29,857 -
Source: LRA CARP Accomplishment Report - CY 2012
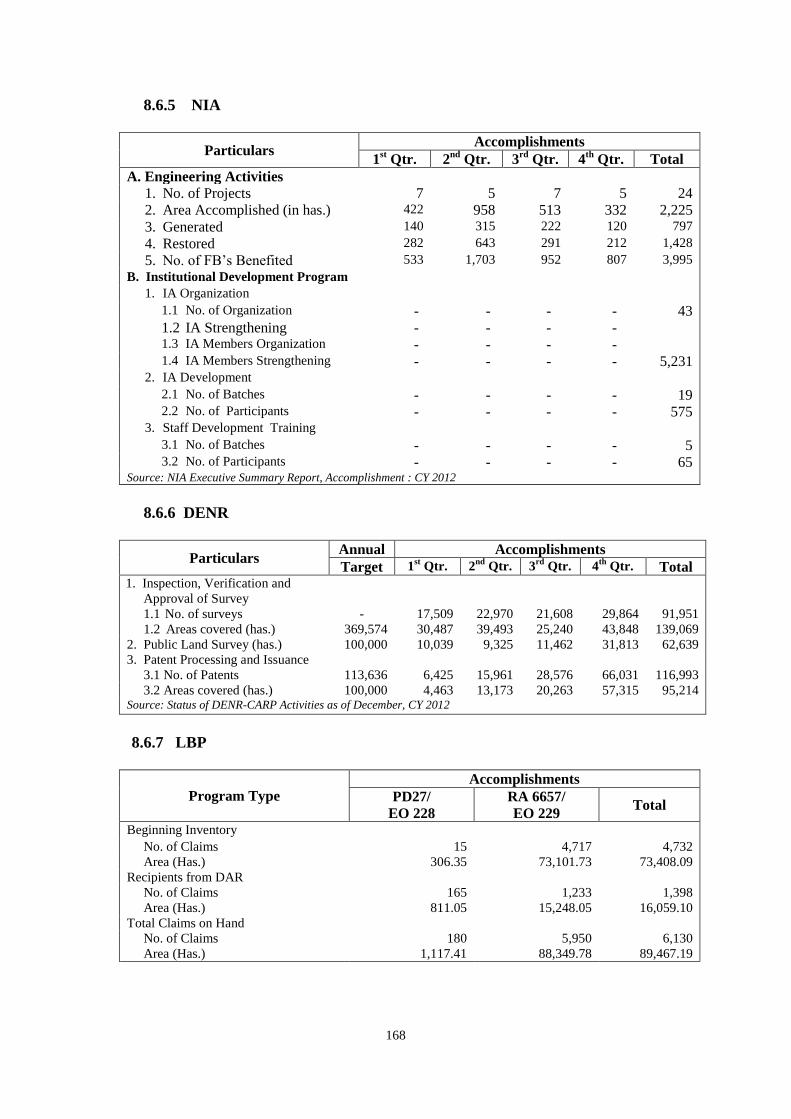
168
8.6.5 NIA
Particulars Accomplishments
1st Qtr. 2
nd Qtr. 3
rd Qtr. 4
th Qtr. Total
A. Engineering Activities
1. No. of Projects 7 5 7 5 24
2. Area Accomplished (in has.) 422 958 513 332 2,225
3. Generated 140 315 222 120 797
4. Restored 282 643 291 212 1,428
5. No. of FB’s Benefited 533 1,703 952 807 3,995
B. Institutional Development Program 1. IA Organization
1.1 No. of Organization - - - - 43
1.2 IA Strengthening - - - - 1.3 IA Members Organization - - - - 1.4 IA Members Strengthening - - - - 5,231
2. IA Development 2.1 No. of Batches - - - - 19 2.2 No. of Participants - - - - 575
3. Staff Development Training 3.1 No. of Batches - - - - 5 3.2 No. of Participants - - - - 65
Source: NIA Executive Summary Report, Accomplishment : CY 2012
8.6.6 DENR
Particulars Annual Accomplishments
Target 1st Qtr. 2
nd Qtr. 3
rd Qtr. 4
th Qtr. Total
1. Inspection, Verification and
Approval of Survey
1.1 No. of surveys
1.2 Areas covered (has.)
-
369,574
17,509
30,487
22,970
39,493
21,608
25,240
29,864
43,848
91,951
139,069
2. Public Land Survey (has.) 100,000 10,039 9,325 11,462 31,813 62,639
3. Patent Processing and Issuance
3.1 No. of Patents 113,636 6,425 15,961 28,576 66,031 116,993
3.2 Areas covered (has.) 100,000 4,463 13,173 20,263 57,315 95,214 Source: Status of DENR-CARP Activities as of December, CY 2012
8.6.7 LBP
Program Type
Accomplishments
PD27/
EO 228
RA 6657/
EO 229 Total
Beginning Inventory No. of Claims 15 4,717 4,732
Area (Has.) 306.35 73,101.73 73,408.09
Recipients from DAR
No. of Claims 165 1,233 1,398
Area (Has.) 811.05 15,248.05 16,059.10
Total Claims on Hand
No. of Claims 180 5,950 6,130
Area (Has.) 1,117.41 88,349.78 89,467.19
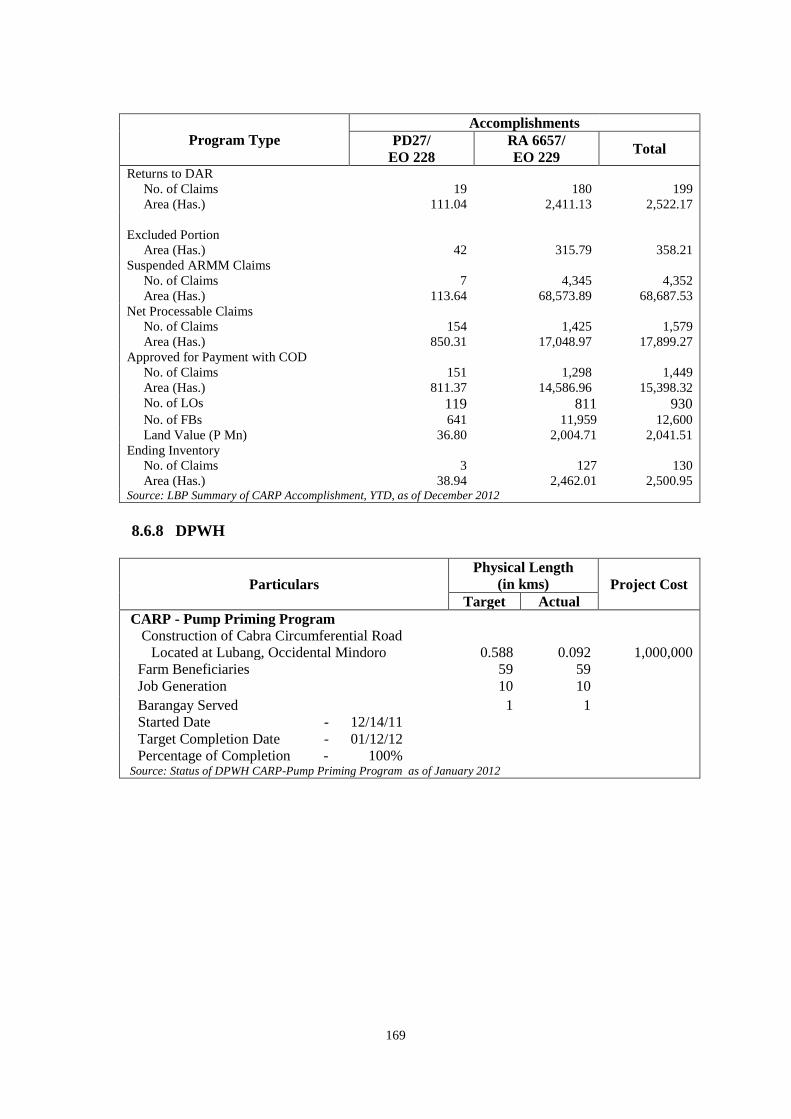
169
Program Type
Accomplishments
PD27/
EO 228
RA 6657/
EO 229 Total
Returns to DAR
No. of Claims
Area (Has.)
19
111.04
180
2,411.13
199
2,522.17
Excluded Portion
Area (Has.)
42
315.79
358.21
Suspended ARMM Claims
No. of Claims
Area (Has.)
7
113.64
4,345
68,573.89
4,352
68,687.53
Net Processable Claims
No. of Claims
Area (Has.)
154
850.31
1,425
17,048.97
1,579
17,899.27
Approved for Payment with COD
No. of Claims 151 1,298 1,449
Area (Has.) 811.37 14,586.96 15,398.32
No. of LOs 119 811 930 No. of FBs 641 11,959 12,600 Land Value (P Mn) 36.80 2,004.71 2,041.51 Ending Inventory
No. of Claims
Area (Has.)
3
38.94
127
2,462.01
130
2,500.95 Source: LBP Summary of CARP Accomplishment, YTD, as of December 2012
8.6.8 DPWH
Particulars
Physical Length
(in kms)
Project Cost
Target Actual
CARP - Pump Priming Program
Construction of Cabra Circumferential Road
Located at Lubang, Occidental Mindoro 0.588 0.092 1,000,000
Farm Beneficiaries 59 59
Job Generation 10 10
Barangay Served 1 1
Started Date - 12/14/11
Target Completion Date - 01/12/12
Percentage of Completion - 100% Source: Status of DPWH CARP-Pump Priming Program as of January 2012
IX. SIGNIFICANT AND
COMMON AUDIT
OBSERVATIONS AND
RECOMMENDATIONS
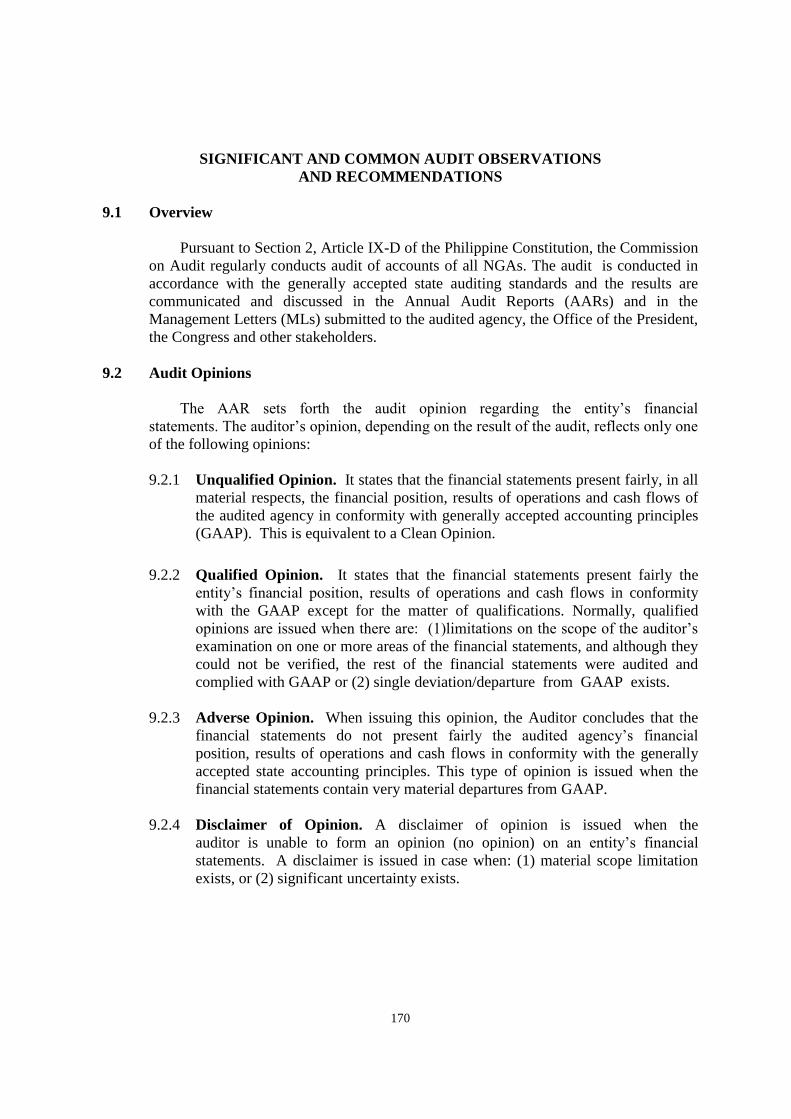
170
SIGNIFICANT AND COMMON AUDIT OBSERVATIONS
AND RECOMMENDATIONS
9.1 Overview
Pursuant to Section 2, Article IX-D of the Philippine Constitution, the Commission
on Audit regularly conducts audit of accounts of all NGAs. The audit is conducted in
accordance with the generally accepted state auditing standards and the results are
communicated and discussed in the Annual Audit Reports (AARs) and in the
Management Letters (MLs) submitted to the audited agency, the Office of the President,
the Congress and other stakeholders.
9.2 Audit Opinions
The AAR sets forth the audit opinion regarding the entity’s financial
statements. The auditor’s opinion, depending on the result of the audit, reflects only one
of the following opinions:
9.2.1 Unqualified Opinion. It states that the financial statements present fairly, in all
material respects, the financial position, results of operations and cash flows of
the audited agency in conformity with generally accepted accounting principles
(GAAP). This is equivalent to a Clean Opinion.
9.2.2 Qualified Opinion. It states that the financial statements present fairly the
entity’s financial position, results of operations and cash flows in conformity
with the GAAP except for the matter of qualifications. Normally, qualified
opinions are issued when there are: (1)limitations on the scope of the auditor’s
examination on one or more areas of the financial statements, and although they
could not be verified, the rest of the financial statements were audited and
complied with GAAP or (2) single deviation/departure from GAAP exists.
9.2.3 Adverse Opinion. When issuing this opinion, the Auditor concludes that the
financial statements do not present fairly the audited agency’s financial
position, results of operations and cash flows in conformity with the generally
accepted state accounting principles. This type of opinion is issued when the
financial statements contain very material departures from GAAP.
9.2.4 Disclaimer of Opinion. A disclaimer of opinion is issued when the
auditor is unable to form an opinion (no opinion) on an entity’s financial
statements. A disclaimer is issued in case when: (1) material scope limitation
exists, or (2) significant uncertainty exists.
171
9.3 Results of Audit
The audit opinions shown in the transmitted CY 2012 CAARs and AARS of 191
NGAs, including the Stand-Alone Agencies at the Regions, as of 31 August 2013, are
broken down as follows: 32 unqualified/clean or 17 percent, 152 qualified or 80
percent, 6 adverse or 3 percent, and one disclaimer. The audit opinions excluded audited
agencies with AARs not yet transmitted as of given date and/or only management
letters were issued. Presented in the graph below is the Summary of Audit Opinions for
CY 2012.
Thirty-two agencies were given unqualified or clean audit opinion on the financial
statements, namely:
1. Office of the Vice-President (OVP)
2. Presidential Broadcast Staff (PBS)
3. Presidential Legislative Liaison Office (PLLO)
4. Technical Cooperation Council of the Philippines (TCCP)
5. Presidential Management Staff (PMS)
6. Film Development Council of the Philippines (FDCP)
7. National Intelligence Coordinating Agency (NICA)
8. Central Board of Assessment Appeals (CBAA)
9. Anti-Money Laundering Council (AMLC)
10. Government Procurement Policy Board – Technical Support Office
(GPPB-TSO)
Summary of Audit Opinions
Calendar Year 2012
172
11. Legislative-Executive Development Advisory Council (LEDAC)
12. Philippine National Volunteer Service Coordinating Agency (PNVSCA)
13. Public-Private Partnership Center of the Philippines (PPPCP)
14. Court of Tax Appeals (CTA)
15. Sandiganbayan (SB)
16. Local Government Academy (LGA)
17. Office of Transportation Cooperatives (OTC)
18. Philippine Trade Training Center (PTTC)
19. Ifugao State University (IfSU)
20. Mountain Province State Polytechnic College (MPSPC)
21. Regional Development Council (RDC)
22. Marcos Mariano State University (MMSU)
23. Cavite State University (CvSU)
24. Dr. Emilio B. Espinosa, Sr. Memorial State College of Agriculture and
Technology (DEBESMSCAT)
25. West Visayas State University (WVSU)
26. Capiz State University (CAPSU)
27. Cebu Technological University (CTU)
28. Cebu Normal University (CNU)
29. Bukidnon Forests, Incorporated (BFI)
30. Camiguin Polytechnic State College (CPSC)
31. Mindanao University of Science and Technology (MUST)
32. Mindanao State University –Gen San City
Adverse audit opinions were issued to six (6) NGAs such as Land Registration
Authority (LRA), Philippine State College of Aeronautics (PhilSCA), Philippine
Atmospheric, Geophysical and Astronomical Services Administration (PAGASA), Toll
Regulatory Board (TRB), National Agricultural and Fishery Council (NAFC) and
National Meat Inspection Service (NMIS).
The common reason for the adverse opinions is material effects of the
misstatement of accounts, particularly the following audit observations, among others:
1. Unreconciled or inaccurate cash balances due to material differences between
the book and bank balances, aggravated by non-preparation or delayed
submission of the Bank Reconciliation Statements (BRSs);
2. Cash advances, in material amounts, remain unliquidated for over two years
and the General and Subsidiary Ledgers were not reconciled due to
mispostings or errors in recording;
3. Unreliable Inventory accounts balances due to failure of Accounting and
Property Section to conduct regular/periodic reconciliation of records,
misclassification or erroneous recording of accounts and/or delayed
submission of supporting documents;
173
4. Accuracy of the Property, Plant and Equipment accounts balances cannot be
ascertained due to failure of management to undertake physical inventory of
the assets, there was no periodic reconciliation of records of the Accounting
and Property Section, property cards were not maintained by the Property
Officer and unserviceable properties were not reclassified to Other Assets.
The Telecommunication Office (TELOF) was issued with a disclaimer of opinion
due to failure of management to maintain subsidiary ledgers for forwarded balances of
major controlling accounts in CY 2011 and no alternative audit procedures can be
undertaken to determine the accuracy and validity of the account balances since the
agency’s records were inadequate hence, the scope of audit work was not sufficient to
enable the auditors to render an opinion on the agency’s financial statements. Details of
the Summary of Audit Opinions is shown in Annex B.
174
9.4 Significant Audit Observations and Recommendations
Presented below are the significant audit observations and recommendations on the
audit of national government agencies submitted by auditors of the National Government
Sector and Regional Offices of this Commission.
AUDIT OBSERVATIONS
9.4.1 Office of the Vice-President (OVP)
Unsettled disallowances amounting to P100
million of the defunct Office of the Prime
Minister (OPM) in 1986 and below, under
the administration of the late Vice-
President Laurel during the period 1987-
1992 remain outstanding. These were
requested for write-off but denied per COA
Decision No. 2011-100 dated 13 December
2011. The amount has been dormant for
over ten years.
9.4.2 Games and Amusement Board
(GAB)
The absence of a more authoritative
specific guidelines/policies for the
accounting and monitoring of unclaimed
dividends resulted in non-collection, non-
recording and non-remittance to the
National Treasury of more than P33.95
million and undetermined balance of
previous years unclaimed dividends from
the Manila Jockey Club, Inc. (MJCI).
Likewise, the non-inclusion in the Monthly
Report on the Distribution of Wager Funds
of the actual claimed and unclaimed
dividends in every racing events, pursuant
to Section 11, RA No. 309 allowed MJCI to
claim it as corporate earnings.
RECOMMENDATIONS
Appeal for reconsideration on the denied
request for write-off by supporting and
citing in detail the actions taken and the
reasons why they cannot enforce settlement
thereof.
Prioritize the request for a Declaratory
Relief from the Department of Justice
(DOJ), for an authoritative opinion on the
nature of the unclaimed dividends, if public
or private funds, to compel or not MJCI to
remit said dividend to the National
Treasury; coordinate with proper agencies
on the promulgation of monitoring
guidelines and policies for the unclaimed
dividends for their eventual collection and
recording in the books of accounts and
remittance to the National Treasury, if
opined as public funds by DOJ.
Require the Chief of Sports and Games
Regulation Office (SGRO) to perform its
audit functions and specify in their Monthly
Report on Distribution of Wager Funds the
actual claimed and unclaimed dividends
175
AUDIT OBSERVATIONS
9.4.3 Housing and Urban Development
Coordinating Council (HUDCC)
The assurance that funds transferred to
various implementing agencies (IAs) for the
land survey cost totaling P20.94 million
were properly utilized cannot be
conclusively established nor the objectives/
purpose as agreed upon in the MOA were
achieved due to continuous disregard/
inaction by the IAs to submit the required
reports for the settlement of their accounts
pursuant to COA Circular No. 94-013 and
the MOA.
9.4.4 National Commission for Culture
and the Arts (NCCA)
The accumulation of the contribution to the
National Endowment Fund for Culture and
RECOMMENDATIONS
paid on each racing events; enforce the
Racing Clubs to immediately remit the
remaining balance of the unclaimed
dividends and henceforth, all unclaimed
dividends of future racing events be
remitted to the National Treasury.
Require the submission to the COA of all
disbursement vouchers (DVs)/withdrawals
for review and evaluation; and require the
MJCI to submit evidence of payment of
taxes to the BIR for the previous
years’unclaimed dividends which it claimed
as corporate savings.
Require all Accountants of the IAs to
evaluate all outstanding accounts and
submit justifications for the delayed/non-
submission of survey reports; strictly
enforce the periodic submission of Fund
Utilization Reports with special attention to
defaulting IAs.
Establish a Monitoring Team and design a
tool to be used in the conduct of
monitoring, inspection and evaluation of all
the projects; identify the problems
encountered and make final evaluation and
assessment of the status of the project to
determine the appropriate action; and
formulate alternative measures to effect the
immediate submission of the liquidation
reports of the partner LGUs in order to
ascertain that the funds released were
properly utilized in accordance with the
provisions stated in the MOA.
Seek the exemption on the provisions of EO
No. 338 from the Permanent Committee,
176
AUDIT OBSERVATIONS
the Arts or Fund amounting to P1.727
billion as of 31 December 2012 was placed
in an investment Management account
contrary to Executive Order No. 338,
s.1996, thus, resulting in the huge amount
of idle fund instead of helping the
government in maximizing the use of its
resources.
9.4.5 Philippine Racing Commission
(PRC)
Unclaimed dividends of winning bettors in
the hands of the racing clubs totaling
P33.95 million and undetermined balance
of previous years’ from the MJCI were not
collected, recorded nor remitted to the
Bureau of the Treasury (BTr) due to the
absence of Declaratory Relief from the
Department of Justice (DOJ) that will
resolve the issue on its nature. As a result,
the government was deprived of potential
income to finance its priority projects.
Likewise, the withdrawals from PRCI and
its disbursements totaling P17.36 million
were not recorded in the books precluding
its review and evaluation.
9.4.6 Philippine Sports Commission
(PSC)
Financial Assistance (FA) granted to
various National Sports Associations
(NSAs) and funds entrusted to three
Southeast Asian Games Organizing
Committees totaling P124.15 million as of
31 December 2012 (or approximately 45
per cent of last year’s Due from NGOs/POs
account balance) remain unliquidated
contrary to COA Circular No. 2007-001
dated 25 October 2007 and PSC Board
Resolution No. 316-2010 dated 28
September 2010.
RECOMMENDATIONS
otherwise, deposit the said amount to the
Bureau of the Treasury pursuant to EO No.
338 following the guidelines set forth in
COA-DBM-DOF Joint Circular No. 1-97
dated 02 January 1997.
Prioritize the request for a Declaratory
Relief from DOJ to resolve the issue on the
nature of unclaimed dividends; require the
racing clubs to remit the remaining balance
of the unclaimed dividends and henceforth,
all unclaimed dividends of future racing
events to BTr; require the submission of
all disbursement vouchers/withdrawals to
the Office of the Auditor for review and
evaluation; and require MJCI to submit
evidence of payment of taxes to the Bureau
of Internal Revenue (BIR) for the previous
years’s unclaimed dividends which it
claimed as corporate earnings.
(a) Demand the NSAs to submit the
required Final Fund Utilization Report as
provided in COA Circular No. 2007-001
dated 25 October 2007; (b) Maintain and
strictly implement its policy that NSAs
with unliquidated FAs should not be
granted/released additional financial
assistance; (c) require the 49 NSAs and the
three organizing committees to render full
accounting or submit liquidation documents
of the amount received from PSC and if
necessary, institute appropriate legal action
to enforce liquidation.
177
AUDIT OBSERVATIONS
9.4.7 Anti - Money Laundering Council
(AMLC)
The implementation of the E-Government
Project entitled “Transaction Monitoring
and Analysis System (TMAS) with a fund
balance of P40.92 million as of 31
December 2012 was delayed by at least
four years from its original completion date
in 2008 thus, the purpose and target users
of the project are not fully served.
9.4.8 Sandiganbayan
The Sandiganbayan still adopts the
traditional manual payroll system of paying
employee’s salaries and other personnel
benefits in cash instead of the automated
payroll-thru-bank system thus, exposing
payroll money to risk of losses either thru
theft or robbery.
9.4.9 Presidential Commission on Good
Government (PCGG)
Proceeds from the sale of three surrendered
properties amounting to P230.07 million
intended for Comprehensive Agrarian
Reform Program (CARP) were not remitted
by the Independent Realty Corporation
(IRC) to PCGG thus, were not also
remitted to the BTr, contrary to Section 69
of PD No. 1445, EO No. 338 and Special
Provision in the GAA. Furthermore, income
collected from sequestered properties
totalling P1.62 million were also not
remitted promptly to the escrow account in
the BTr.
9.4.10 Philippine State College of
Aeronautics (PhilsCA)
9.4.10.1 Failure of management to work
on the titling of land with a zonal value
RECOMMENDATIONS
Endeavor to complete the project as soon as
possible to facilitate the accomplishment of
its intended goal.
(a) Adopt the payroll-thru-bank system; and
(b) Coordinate with a government servicing
bank near the Sandiganbayan office and
initiate arrangements for the installation of
automated teller machine (ATM) facilities
within the Sandiganbayan.
(1) Vigorously pursue the collection of all
proceeds from the sale of real properties
and thereafter immediately remit to the BTr
for the CARP fund or to the trust/escrow
account of PCGG with the BTr pending
resolution of any court case or
encumbrances pursuant to regulations;
(2) Immediately remit the collection from
the Galeria de Magallanes to the BTr
pursuant to Section 69 of PD No. 1445 and
effect the immediate closure of the
Banahaw Broadcasting Corporation (BBC)
account which is no longer operational and
remit the balance to the escrow account
with the BTr.
1) Make urgent representation with the
BCDA to facilitate the transfer of the land
178
AUDIT OBSERVATIONS
of P255 million and document the final
acceptance of building/structures covered
by the land swapping arrangement among
PhilsCA, BCDA and Megaworld rendered
the Property, Plant and Equipment account
balance at year-end unreliable since said
transactions were not reflected in the
financial statements.
9.4.10.2 Two Tampico trainer planes
costing P16.13 million have remained
grounded or unutilized since 2008 because
of the failure of management to secure from
the Civil Aviation Authority of the
Philippines (CAAP) the Certificate of
Airworthiness Directive (CAD) and
Aviation Training Organization Certificate
(ATOC), as requirements to operate a
Flying School, resulting in the non-
achievement of the College's mandate to
provide advance level of instructions in the
field of aeronautics.
9.4.11 Department of Health (DOH)
9.4.11.1 Low disbursements rate due to
inadequate planning; delayed procurement
process; not actively engaging the various
parties into an agreement to fast track the
implementation of projects; and
reorganization and change of project
officers, among others, resulted in the
reversion of cash allocation of P3.379
billion; incurrence of commitment fees
amounting to P3.802 million; and non-
accomplishment of targeted activities and
delayed delivery of health services.
RECOMMENDATIONS
title of the relocation site in the name of
PhilsCA and determine the zonal or
appraised value of the property; (2) Seek
the services of an independent property
appraiser to ascertain the structural
soundness of the buildings/structures and to
identify defects, if any, to fast track
issuance of Certificate of Acceptance by
management and Certificate of Occupancy;
and (3) Request from Megaworld for the
pertinent data/documents to determine the
actual cost/proper valuation of all their
deliverables to the PhilsCA for recording in
the books.
1) Secure Aviation Training Organization
Certificate from CAAP; 2) Comply with
the requirements of the CAAP by
upgrading the airworthiness condition of
the two Tampico trainer planes; 3)
Consider the two trainer planes for sale if
upgrading the same is not practicable and
too costly for the government and make
representation with the Office of the
President and the DBM for the inclusion of
budget for the procurement of new trainer
planes.
Direct the concerned Heads/
Directors/Chiefs of the CO, Bureaus,
CHDs and Hospitals to: (a) improve the
planning and procurement processes in
order to implement and complete the
projects on time and within the
implementation schedule of projects; (b)
actively engage the various parties into an
agreement to determine the most effective
and efficient strategies on how to fast track
the disbursements and implementation of
projects; and (c) closely monitor the
status/progress of the projects to ascertain
179
AUDIT OBSERVATIONS
9.4.11.2 Drugs and medicines as well as
medical supplies acquired in current and
prior years amounting to P17.505 million
have either expired or remained unutilized
due to receipt of drugs with near-expiry
dates and purchases of medicines and
medical supplies exceeding the normal
three-month requirements despite the
absence of specific recipients; and lack of
proper planning, monitoring and control on
utilization/distribution.
9.4.11.3 Deficiencies in planning,
engineering designs, and program of
works, inefficiencies in carrying out
detailed engineering surveys and designs,
inability to compel contractors to comply
with contract terms and conditions, lack of
monitoring/timelines for project
completion, delays in the preparation and
approval of design revisions and other
project documentations were among the
reasons for not meeting the timeframe for
completion of hospital projects amounting
to P387.20 million which resulted in the
deprivation of prompt use of the projects
and availment of healthcare services by the
intended users.
RECOMMENDATIONS
that the strategies adopted are responsive
to the needs of the projects.
Direct the concerned Heads/ Chiefs of
Bureau and Hospitals to: (a) fast track the
distribution of drugs and medicines to
intended beneficiaries; (b) observe the
normal three-month requirements in their
purchases of drugs and medicines and
medical supplies in accordance with
Section 428 of the GAAM, Volume I; and
(c) coordinate and plan the timing of
procurement taking into consideration the
need and expiration of the drugs and
medicines.
Instruct the Directors/Chiefs of Hospitals
to: (a) closely coordinate with the Head of
the Infrastructure Unit in the review and
evaluation of the Program of Works prior
to bidding to ensure that the desired design
and estimates including changes in
specifications were properly considered to
minimize variations and change orders and
time extensions that may result in the
incurrence of additional cost, negative
slippages and delayed completion of the
project; (b) compel the contractors to
comply with contract terms and conditions,
complete the projects and impose
corresponding liquidated damages, if
warranted; (c) provide adequate funds
and/or request for release of funds from
DBM for the completion of projects; and
(d) ensure that the activities contained in
the Program of Work are implemented
with minimal changes - any necessary and
unavoidable changes in the activities be
satisfactorily explained, undertaken on
time and that the new activities are aligned
and contributory to the desired/expected
outcomes of the project.
180
AUDIT OBSERVATIONS
9.4.11.4 Hospital buildings, facilities and
equipment amounting to P443.957 million
were idle and/or unutilized, as intended,
due to gaps in planning or assessments of
needs, lack of coordination among offices
concerned, insufficient funding for
operation and/or preventive maintenance,
lack of trained operators/users, unavailable
spare parts, among others; thereby
depriving the patients of efficient, quality
health care services, and the hospital, of
income that may be derived from the use
and operation of these facilities and
equipment.
9.4.11.5 The slow implementation of
project activities for the P41.20 million
allotted for the Provision for Potable Water
Supply resulted in only 30.47 percent or
P12.552 million fund utilization and
ultimately the non-attainment of the
objectives of the program and deprived
intended beneficiaries the prompt availment
of the benefits of the program.
RECOMMENDATIONS
(a) Ensure that projects planned and
budgeted out of the agency’s appropriation
shall be used only for the purpose it was
appropriated; (b) Refrain from procuring
equipment or implementing projects which
are not urgently necessary and be guided
by a pre-determined need; and (c) Direct
the Chief of Hospitals to undertake
corrective measures to maximize the use of
equipment and other facilities by (i)
adopting preventive maintenance program
for equipment; (ii) providing sufficient
funding for operation and/or preventive
maintenance; and (iii) ensuring availability
of spare parts and adequately trained
persons to operate the equipment.
Direct the CDH-Caraga Director to: (a)
determine the causes for the slow/delayed
implementation of the projects and the
kind of assistance needed by the LGU-
partners of the Program - to facilitate the
completion, improve disbursements and
performance rates; (b) coordinate with
DOH CO and follow up the project
proposals that were submitted for approval
and instruct the personnel involved to
prepare implementation timelines or
phasing of project activities which shall
serve as a guide in monitoring status of
project administration and program
management; and (c) enhance monitoring
activities in order to effect prompt delivery
of the program activities and ensure
prompt attainment of the program
objectives.
181
AUDIT OBSERVATIONS
9.4.12 Department of Social Welfare and
Development (DSWD)
9.4.12.1 Double entries in the 4Ps database/
payroll in CY 2012 totaling P17.436
million, resulted in excess transfer of
payroll funds and, consequently,
overpayment of grants of P8.718 million,
undisbursed grants not refunded on time,
incurrence of additional service fees of
P0.184 million in the distribution of grants
and cast doubts on the reliability/integrity
of the data stored in the database.
9.4.12.2 Payments of P29.030 million in
Conditional Cash Transfers (CCT) grants
to 4Ps beneficiaries for July and August
2012 were made on the basis of the
DSWD-approved Force Majeure
Declaration in lieu of the required
conditionalities of the program, resulting in
the payment of grants not in accordance
with the 4Ps Manual.
RECOMMENDATIONS
Require: a) Pantawid Pamilya National
Project Management Office (NPMO) to
evaluate and test corrective procedures
adopted in the selection process and
detection of similar incidence of double
entry of household (HH)/beneficiaries to
prevent overpayment of grants;
b) City/Municipal Links to conduct
periodic validation on 4Ps HH to facilitate
the reporting of changes on the status or
condition of any member of the
beneficiary HH while under the program
and to monitor the cash grant;
c) Provincial and Municipal Links to
coordinate closely with local government
officials for the determination,
identification and prompt reporting of 4Ps
duplicate HH beneficiaries in order to
generate an accurate input on the database;
and, d) NPMO to offset the overpaid
grants as a reduction from subsequent
grants to beneficiaries.
Ensure that succeeding payments of grants
are widely disseminated by posting the list
of beneficiary per LGU in the official
website of DSWD for transparency,
pursuant to the Special Provisions of the
2012 GAA.
Require: (i) the City/ Municipal Links to
go over the Compliance Verification
Forms (CVF) of beneficiaries in DSWD-
IOM approved calamity areas and those
without CVF for the same period and
submit to the Regional Technology
Information Officer (RTIO)/Regional
Focal Person to effect adjustments/offset
grants from succeeding payouts; and, (ii)
the NPMO to dutifully adhere to the Loan
Agreement with WB/ADB and the
182
AUDIT OBSERVATIONS
9.4.12.3 Grants and service fees of P50.151
million were paid to 7,782 HH beneficiaries
which could not be found in the List of
Validated and Registered HH Beneficiaries
of the National Household Targeting Office
(NHTO) contrary to Special Provisions
No. 5 of CY 2012 GAA, thus, may be
considered irregular and further resulting in
additional cost to the government in the
distribution of CCT.
9.4.12.4 Funds transferred to LGUs/
advances to SDOs for the immediate
implementation of the Social Pension
Program for Indigent Senior Citizens,
without the databank of verified/approved
beneficiaries, resulted in payments of
stipends amounting P1.901 million to
unqualified social pensioners and P7.705
million to replacement social pensioners
without complete documents. Moreover,
allowing subsequent releases despite non-
liquidation of previous fund transfers
resulted in the accumulation of unliquidated
funds of P170.237 million in five DSWD
FOs, contrary to Section 2 of PD 1445 and
DSWD AO Nos. 03 and 04.
RECOMMENDATIONS
Borrower on Project Implementation,
specifically on the approval of subsequent
changes to the Project Administration
Manual by both parties.
Pantawid Pamilya NPMO Project Manager
to: (i) require the RTIO to explain the
reasons for the deletion of the 4Ps
beneficiaries and their reactivation; and the
inclusion of beneficiaries with doubtful data
pursuant to the comment of NHTO-CO;
(ii) immediately delist unregistered/
unvalidated payroll-beneficiaries from the
Payroll System, if found to be with
unauthorized HH ID, and cause their
replacement of qualified beneficiaries to the
Program; and, (iii) source the 4Ps database
directly from the NHTO data to avoid
unauthorized grants to unregistered/
unvalidated HH beneficiaries of the
program.
Concerned FOs Management to:
(a) conduct the necessary verification,
identification and monitoring of
beneficiaries in close coordination with the
Municipal/City Links and LGUs so that the
release of cash grants to eligible senior
citizens can be efficiently undertaken; (b)
ensure that funds transferred to each LGU
are based on the updated and approved list
of verified beneficiaries for the quarter;
and, (c) adhere strictly to the provisions
embodied in COA Circular No. 97-002 and
impose appropriate administrative/legal
sanctions and/or cause the filing of
malversation/criminal charges to those
officers and employees who failed to
liquidate immediately their cash advances.

183
AUDIT OBSERVATIONS
9.4.12.5 Funds amounting to P110.896
million were released without the covering
project proposals and master list of
beneficiaries, thus the readiness and
capabilities of LGUs/POs were not
considered, which resulted in the delayed
implementation of the Supplemental
Feeding Program (SFP), consequently
delaying the attainment of the goal to
improve and sustain the nutrition of
targeted children in the day care centers.
Further, the FOS’ failure to monitor the
utilization and liquidation of SFP funds in
accordance with the MOA and COA
Circular No. 2012-001 resulted in
unliquidated fund transfers to LGUs of
P889.993 million.
9.4.12.6 Self - Employment Assistance –
Kaunlaran (SEA-K) Loans amounting
P177.671 million remained unpaid for one
to 17 years for failure to ascertain the
viability of project proposals as well as
poor monitoring and delayed project
evaluation resulting in the increased
number of inactive SKAs thus, collections
are remote and low. This affected the
sustainability of the program for financing
livelihood endeavors’ to enhance the
socio-economic skills of the poor families
to establish and self-manage a sustainable
community-based micro-credit organization
for entrepreneurial development.
RECOMMENDATIONS
Require the FOs concerned to ensure that:
(i) all funds transferred are duly supported
with required project proposals and master
list of beneficiaries as basis for supervision
and monitoring of program
implementation; (ii) previous fund
transfers to LGUs/POs are fully liquidated
and accounted for before subsequent
releases are allowed to prevent
accumulation of unliquidated accounts;
and (iii) require the SFP Focal person to
coordinate closely with LGUs and social
worker counterparts to clarify and resolve
issues, problems and concerns as well as to
follow up submission of monthly physical
accomplishment and financial reports on
the utilization of funds.
Exert extra effort to collect from active
SKAs and revisit the DSWD AO to
include appropriate sanctions against
erring beneficiaries. Specifically, ensure
that:
a. For loans released within two years
(2010-2012): (i) FOs’ SLP Units regularly
send demand letters to delinquent SKAs to
settle their monthly return of the
capital/financial assistance per agreement
to avoid accumulation of receivables; and,
(ii) FOs’ focal person conduct regular
monitoring and assessment of all SKAs so
that problems could be attended to and
addressed at the earliest time to prevent, if
not totally eliminate, instances of non-
payment or to intensify collection of
amounts due the government; and,
b. For loans released beyond two years
(2010 and below): (i)FOs’ focal person
review the composition of active SKAs for
possible identification of inactive and
disbanded SKAs with outstanding loan
availments which may have joined a
184
AUDIT OBSERVATIONS
9.4.12.7 Deficiencies were noted in the
utilization of the KALAHI-AF investment
Sub – Projects (SPs) grants, such as: (a) low
SPs community grants utilization of 53.23
percent or unimplemented/unutilized
community grants amounting to P 845.582
million; (b) Technical Assistance Funds to
various SPs overpaid by P1.530 million;
and (c) previously approved SPs of P14.529
million financed, but not included in the
2012 WFP and/or appropriation of the
agency, contrary to NBC No. 535.
9.4.12.8 Validation of 131 KALAHI-
CIDSS (KC) SPs amounting to P162.471
million revealed: (a) seven SPs worth
P 16.395 million were incomplete/not fully
functional due to failure of the BSPMC
and concerned officials to adequately
monitor implementation; (b) absence of
RECOMMENDATIONS
newly-organized or active SKA for possible
recovery of unpaid loans, otherwise,
consider the disqualification of members
with delinquent accounts; and, (ii) after
careful review of each account balance and
exhaustion of efforts to collect accounts
which have been outstanding for over five
years, request from COA authority to
write-off these accounts in accordance with
COA Circular No. 97-001.
i) Require the Barangay Sub – Project
Management Committee to fast track
submission of requirements as provided in
the Community Based Procurement
Manual (CBPM) to ensure timely release
of community grants; (ii) accelerate/
maximize the utilization of loan proceeds
for the implementation of SPs to avoid
incurrence of commitment fees for the
undisbursed amount of the loan; (iii) adopt
efficient and timely procurement
procedures in accordance with the CBPM;
and (iv) perform resurvey of or update the
project design/ specifications/scope of
work before the procurement/bidding in
order to avoid additional works and/or
several variation orders during project
implementation; and v) make
representation with the local officials
concerned for the immediate allocation/
appropriation of the counterpart fund and
the timely and opportune release thereof to
ensure timely completion of projects.
Direct the RPMO and the Area
Coordinating Team (ACT) to require the
BSPMC to: (i) issue variation orders for
changes made in the projects and its
reassessment regarding environmental
safeguard of the area; (ii) complete the
requirements of the project to achieve

185
AUDIT OBSERVATIONS
proper turnover of completed SPs of
P19.991 million as required in the CBIM;
and (c) non-maintenance of separate books
and deposit accounts for KC-AF and
KC-PAMANA of P11.438 million.
9.4.12.9 The non-availability of data on the
operational status of completed PODER
projects in FO XIII amounting to
P27.649 million; failure to adequately
prepare the community for the project
operations and maintenance consistent with
DSWD AO No. 13, s. 2009; and non-
compliance with the KALAHI Operations
Manual on the monitoring aspect after their
turnover have raised doubt on the existence
and sustainability of these projects.
9.4.13 Metro Manila Development
Authority (MMDA)
9.4.13.1 Inefficient implementation due to
inadequate planning of 49 Flood Control
Projects (FCPs) - P322M
9.4.13.2 Incurrence of P20.9 million
could have been avoided had there been
consistent use of the DPWH prescribed
rates in the computation of Overhead,
Contingencies and Miscellaneous (OCM)
RECOMMENDATIONS
proper turn-over of the SPs and provide
copies to COA thru RPMO;
and, (iii) maintain separate records for the
KC-AF and KC-PAMANA to properly
monitor the balances as well as the
utilization of each fund and turn-over
excess funds to the source agency duly
supported with BSPMC resolution
pursuant to KALAHI-CIDSS manual.
(i) Revisit the provisions of existing
mutual partnership agreement with the
LGU to ensure that operation and
maintenance (O & M) upon turnover of
projects are clearly assigned to the LGU;
and (ii) direct the RPMO to strengthen the
O&M functions of the DSWD, especially
on areas with non-functional projects.
Revisit the strategies and practices in the
implementation of FCPs given that time is
of the essence vis-a-vis the weather patterns
of the Philippines, specifically: a)
Formulate the Annual Procurement Plan
supported by Project Procurement
Management Plan in strict compliance with
Section 7 of the Implementing Rules and
Regulations of RA 9184; b) Undertake the
procurement activities as early as February
of the year to ensure completion of FCP
before the onset of the rainy season which
normally starts in the months of June and
onward.
Require the Engineers at the FCSMO, to
whom the preparation of the ABC are
assigned, to strictly comply with the
provisions of existing DPWH Department
Order No. 29 dated 16 May 2011
186
AUDIT OBSERVATIONS
and Profit components of the Approved
Budget for the Contract (ABC).
9.4.13.3 Low physical delivery rate of
15 per cent or only two of 13 footbridge
projects were completed as planned.
9.4.13.4 Deficiencies in processes and
procedures of solid wastes operations
impact on the validity and reasonableness
of P1.2 billion disbursements:
1) Inadequate documentation/information
to support payment of tipping fees;
2) A total of 90 dump trucks accredited
by LGUs and used in waste disposal
operations were registered as
government-owned, of which 81 were
sampled to have been utilized in actual
collection of garbage by private
contractors without corresponding
reduction in payment of tipping fees
and thus, entailed additional fuel and
maintenance expenses to the
disadvantage of the Government.
Moreover, 20 of the accredited dump
trucks were found to be unregistered
with the LTO.
RECOMMENDATIONS
particularly on the percentages for OCM
and Profit and any amendments thereto.
Ensure strict implementation of footbridge
projects as planned/targeted over those
requests received from private individuals
and various LGUs; and take immediate
action to address the issues/problems which
caused delays in the construction of the
uncompleted/on-hold footbridges.
a) Conduct thorough review of existing
contracts with LGUs and consider possible
amendments to include sufficient
information/documents necessary for
technical review and the provision for the
reduction of tipping fees in consideration of
the expenses incurred by LGUs using
government trucks in the collection of
garbage; b) Coordinate with concerned
LGUs for the proper documentation of
disbursements for tipping fees to establish
its correctness and validity as deemed
appropriate by specific standards of internal
control. Also, require uniform daily trip
tickets for all contractors certified by the
LGUs and MMDA with all relevant
information such as the specific routes, time
and distance travelled from collection to
disposal area, volume of wastes and the
names of drivers and collectors; c) Include
in the MOA with the LGUs a provision
requiring, among others, registration of
dump trucks used in waste disposal
operations. The list of accredited dump
trucks including the nature, class/category
and capacity should be made integral part of
the MOA; d) Conduct regular verification
of records with the LTO, at least once a
year, to determine compliance with LTO
registration regulations; and e) Require the
LGUs concerned to submit proper
documents for the sampled trips showing
the specific locations travelled by the
187
AUDIT OBSERVATIONS
3) Variance of P141 million in the use of
conversion factor in the Solid Waste
Management Facility Agreement.
9.4.14 Toll Regulatory Board (TRB)
The appropriateness and necessity of
recording the TRB’s liability pertaining to
the acquisition of the right-of-way (ROW)
for the Manila-Cavite Toll Expressway
Project amounting to P4.66 billion in its
books of accounts could not be determined
due to lack of coordination and non-
reconciliation of records between TRB and
Philippine Reclamation Authority (PRA),
Moreover, no guidelines on the proper
recording and offsetting of accounts have
been issued.
9.4.15 Department of Energy (DOE)
9.4.15.1 Full payment to Dumalag
Corporation in the amount of P22.047
million for the “Procurement of Goods
and Installation for the Household
Electrification Program (HEP) Project”
was made despite reported deficiencies
and defective components of the Solar
Home Systems (SHS) delivered/installed in
Tablas Island, Province of Romblon
Province of Romblon (Municipalities of
RECOMMENDATIONS
haulers, the distance in terms of kilometers
and the time duration from area of
collection to the dumping sites.
Re-evaluate in coordination with the QC
government and apply correspondingly on
its basis the computation of payment for
waste disposal service to the facility
operator, and proper amendment to the
agreement should be made as a result.
Coordinate with PRA and request for
documents/records regarding the FCDU
loan amounting to US$68.56 million;
inquire from DOF the amount recognized
for debt servicing and the status of the loan
repayments made on the FCDU loan to
facilitate reconciliation of records between
the agency and PRA; and follow-up with
the focal person or Committee formed by
representatives from the DOF, DBM and
COA with regards to the propriety and
necessity of recording the liabilities and the
procured ROW properties, including the
offsetting of accounts of the concerned
agencies, considering the information that
will be obtained.
Submit the signed/approved Budgetary
Requirements of the HEP Project as
required by the COA - TAS for
contract review and project evaluation;
submit documentary evidence(s) that
technical trainings of Sitio Power
Associations and 2,750 household
beneficiaries on the basics of Solar
Photovoltaic along with basic
trouble shooting and maintenance were
188
AUDIT OBSERVATIONS
Calatrava, San Agustin, and Odiongan,
Province of Romblon).
9.4.15.2 The transfer of funds aggregating
P118.268 million from the Cash National
Treasury-MDS Account maintained at the
Land Bank of the Philippines (LBP), to the
Cash in Bank – LCSA maintained at the
Bank of the Philippine Islands (BPI), for
credit to BPI-FAO DOE-PTAP Pantawid
Pasada Account for the loading/reloading of
a total of 96,902 PTA cards, cannot be fully
evaluated/validated due to non-submission
of requested reports relative to the
Program’s implementation.
9.4.15.3 The distribution of the 3.6 million
Compact Fluorescent Lamps (CFLs), an
activity under the National Residential
Lighting Program (Component 1.2) of the
Philippine Energy Efficiency Project
(PEEP) with a total cost of P310.896
million, could not be fully accounted due to
non-submission of status, detailed
distribution, and inventory reports.
Further, the disposal of 1.4 million
Incandescent Bulbs (IBs) which is part of
the P17.51 million contract dated
September 2009 with GRM International,
Inc. remained unimplemented as at year
end.
9.4.15.4 After three years of
implementation and just six months to
closing date, the PEEP's physical delivery
rate based on overall accomplishments and
financial utilization rate based on
cumulative disbursements from project
RECOMMENDATIONS
actually conducted and that same were
validated by the DOE Project technical
personnel; and validate reported
replacement of defective components and
rectifications by the DOE Project’s
Technical personnel to assure compliance
by the Contractor of the Project
deliverables as per Contract.
Submit the requested reports relative to the
implementation of PTAP for audit
evaluation/validation.
Fully account the distribution of the 3.6
million CFLs and submit to COA the
corresponding reports for audit evaluation.
Explain/justify the overall physical delivery
and financial utilization rates of below 50%
considering that the Project’s closing date is
only six (6) months away; submit
justifications for the delays incurred in
the procurement activities of the PEEP; and
189
AUDIT OBSERVATIONS
inception to 31 December 2012 were
computed at 49.25 percent and 39.86
percent, respectively, indicating that project
implementation is behind schedule.
Moreover, ten planned activities worth
P440.810 million representing 21.07
percent of the total PEEP cost of
P2.092 billion, programmed to be
implemented during the year, were not
accomplished due to slow/delayed
procurement process.
9.4.16 Pasig River Rehabilitation
Commission (PRRC)
Of the ten planned Materials Recovery
Facilities (MRFs) to be constructed, only
four were fully completed, one operational
and three non-operational totalling P1.91
million.
Forty-seven equipment amounting to P5.54
million purchased for the MRF projects
remained unutilized/idle and found to be
physically deteriorated due to non-
completion/operation of the MRFs.
9.4.17 National Mapping and Resource
Information Authority (NAMRIA)
The expected completion date of the
implementation of the Philippine Reference
System of 1992 (PRS 92) Project by the
DENR Regional Offices, MGB and LMB
costing P204.37 million was delayed by
two years due to slow recovery of reference
monuments to be used in the
transformation.
9.4.18 Fertilizer and Pesticide Authority
(FPA)
Laboratory pesticide equipment and
accessories totaling P11.28 million were
RECOMMENDATIONS
accelerate the procurement process to
ensure the timely implementation of
targeted activities in the work plans.
(a) Rehabilitate the three non-operational
MRFs and pursue construction of the
remaining six; and
(b) Coordinate with proper officials of
DENR and other locations where MRF
equipment are stored for a more secured
and protected storage area.
NAMRIA to assist the regional offices in
the conduct of another round of recovery of
the monuments; strengthen collaboration
with concerned DENR officials to promptly
address and settle issues and closely
monitor accomplishments of DENR ROs,
MGB & LMB.
Request for budget from the DBM for the
completion of the pesticide facility and for
190
AUDIT OBSERVATIONS
not fully utilized and were left idle due to
the non-completion of the laboratory
pesticide facility as of year-end.
9.4.19 Construction Industry Authority
of the Philippines (CIAP)
The Philippine Contractors Accreditation
Board (PCAB) has not yet established a
monitoring mechanism to keep track of
licensed and unlicensed Contractors/
Construction Companies which are engaged
in construction business contrary to RA No.
4566 thus, there were at least 14
contractors who are in construction services
even without licenses.
9.4.20 Livestock Development Council
(LDC)
In CY 2012 alone, the LDC transferred
funds to Non-Governmental Organizations/
People's Organization (NGOs/POs)
totalling P5.28 million for projects and
activities the purposes of which were not
aligned and within the scope of the mandate
of the Council as stated in Section 3 of PD
No. 914 dated 29 March 1976.
RECOMMENDATIONS
additional plantilla for technical personnel
to man the Laboratory Services Division to
make the pesticide laboratory fully
operational so that the unutilized/idle
equipment can also be used and serve their
purpose.
a) Set-up monitoring mechanisms to keep
track/determine which among the
Contractors/Construction Companies which
are engaged in construction business are not
registered; or if registered, failed to renew
their licenses on the subsequent year before
engaging in a specific undertaking/project;
(b) Post at CIAP PCAB website the list of
the names and addresses of registered
contractors, with issued, suspended or
revoked licenses; and
(c) Institute disciplinary action allowed
under Section 3.3 of RA No. 4566 against
non-compliant contractors/ construction
companies corresponding to the violation/s
committed.
Before entering into an undertaking, give
due considerations to the parameters of the
mandate of the LDC to ensure that only
legitimate projects and activities are
undertaken/funded by the agency.
191
AUDIT OBSERVATIONS
9.4.21 National Agricultural and Fishery
Council (NAFC)
9.4.21.1 The NAFC, using the Priority
Development Assistance Fund (PDAF)
received from DA-OSEC, the recipient of
funds from the Department of Budget and
Management (DBM) and the key
implementing agency of PDAF projects,
transferred the amount of P116.752
million to various Non-Government
Organizations (NGOs)/ Peoples
Organizations (POs) for the implementation
of various livelihood projects and integrated
livelihood development programs. Per
MOA executed by and between the NAFC -
DA-OSEC and NAFC – NGOs/POs, the
NAFC became the key/primary
implementing agency instead of DA-OSEC.
The implementation of these kinds of
projects is not however, within the ambit of
its mandate as provided for under Executive
Order No. 116 dated January 30, 1987 and
the Implementing Rules and Regulations
(IRR) of RA No. 8435, the Agriculture and
Fisheries Modernization Act (AFMA) of
1997.
9.4.21.2 The Guaranty Fund deposit
amounting to P431.262 million for the
implementation of the Special Vehicle Loan
Fund (SVLF) Program with the Philippine
National Bank (PNB) was in excess of its
purpose, to secure the outstanding loans of
P0.705 million as of December 31, 2012.
9.4.22 National Meat Inspection Service
(NMIS)
The National Livestock Program (NLP)
funds totaling P28.76 million intended
for the construction/rehabilitation of
RECOMMENDATIONS
Request the DA to discontinue transferring
funds to NAFC for the implementation of
various livelihood projects and integrated
livelihood development programs funded
by PDAF since these activities are not
aligned or within the mandate of the
Council; and henceforth, before entering
into any undertaking, give due
consideration to the parameters of the
mandate of the NAFC
Determine the required amount of Guaranty
Fund which should be proportionate to the
amount of outstanding or anticipated loans;
any excess be remitted to the BTr pursuant
to Section 4 of RA No. 10155
Ensure that (i) the implementation of the
NLP program is in accordance with the
approved budget and WFP to guarantee
192
AUDIT OBSERVATIONS
slaughterhouses were utilized for the
procurement of meat delivery vehicles and
mobile laboratory bus without the approval
of the DBM for re-alignment of funds
hence, reducing the funds available for the
slaughterhouse projects. Moreover, the
checks for the payment of the said
procurement were prepared in the absence
of complete documentation which was not
in accord with Section 4 of PD No. 1445.
9.4.23 Board of Investments (BOI)
As of year-end or 366 days from its
contracted project duration, the required
deliverables from the application system
and web portal enhancement from Info-
Alchemy Corporation, with contract price
of P11.998 million, were not yet
fully/completely delivered which deprived
the BOI the benefit from the system for the
improvement of its operations. The BOI
had not instituted any measures for the
collection of liquidated damages from the
service provider and/or initiated to rescind
the contract as provided for under Section
VI of the Service Contract.
RECOMMENDATIONS
that the objectives thereof are attained; and
(ii) any modifications thereto are approved
by the proper authorities; signatories of
transactions and the accounting officials
and staff ensure that the pertinent laws and
regulations in the disbursement of
government funds are strictly complied
with; the Cashier cancel the two unreleased
checks and report the cancellation thereof;
upon receipt of the report of the
cancellation of the check from the Cashier,
the Accountant make the necessary entries
to adjust the balance/total of the accounts
affected.
Submit amendment of the Service Contract,
if any; require Info-Alchemy Corporation to
deliver the remaining deliverables of the
contract; and require the service provider
to pay the liquidated damages
corresponding to the period of delay in the
delivery of the required deliverables.
193
AUDIT OBSERVATIONS
9.4.24 Don Mariano Marcos Memorial
State University (DMMMSU)
(RO 1)
Unexpended subsidy for CY 2012 of
NLUC, MLUC and SLUC from the Central
Administration totalling P30.06 million
was treated as a Liability account at year-
end and remitted to the Central
Administration at the second month of the
ensuing year. Said amount was eventually
re-issued to the campus through sub-
allotment and the receipt of which was
credited to “Subsidy from Central
Administration” resulting in misleading
financial information and erroneous
presentation of the accounts in the
financial statements.
9.4.25 Philippine Carabao Center (PCC)
(RO 3)
Management failed to request for relief of
accountability for 301 dead breeding
stocks/animals as of December 31, 2012
amounting to P42.54 million casting doubt
on the accuracy of the reported balance of
Breeding Stock account.
9.4.26 Ramon Magsaysay Technological
University (RMTU)
Funds from PS MDS, Trust MDS and
Auxiliary accounts amounting to P6.69
million, P3.06 million and P0.12 million,
respectively were transferred to other Trust
accounts to avoid reversion of the unused or
unutilized Notice of Cash Allocation
(NCA) and to cover up the anticipated bank
overdraft in violation of Section 3.9,
National Budget Circular No. 535 dated 29
December 2011, Section 4 (3), PD No.
RECOMMENDATIONS
Close the unutilized portion of the subsidy
to the Government Equity Account and
should not be treated as a liability since
there is no actual liability, for fair
presentation of the financial statements.
Ensure requests for relief of accountability
are filed properly and promptly by
accountable officers concerned.
Discontinue the practice of transferring
funds from PS MDS to other Trust account;
likewise, cease transferring the Trust MDS
account such as PDAF for scholarship
program, to other Trust account in
adherence to Sec. 3.9.1.3, Par. 3,NBC No.
535; use the trust fund to pay obligations
for the purpose for which said fund was
created; stop immediately the practice of
borrowing funds to cover up anticipated
194
AUDIT OBSERVATIONS
1445 and Sections 13, 69 and 184, and
NGAS, Volume 3 for National
Government Agencies resulting in juggling
of funds.
9.4.27 Phividec Industrial Authority
(PIA), Tagoloan, Misamis Oriental
(RO 10)
9.4.27.1 PIA has not exercised its right to
renegotiate concession fees despite the
significant positive variance between the
Operator’s projected and actual revenue,
hence, PIA may be deprived of incremental
concession fees resulting from the growth
of MCT operations.
9.4.27.2 PIA’s proposed repayment scheme
for its foreign loan with JBIC guaranteed by
the Government may not be the best option
as it has paid P54.948 million during the
year as default charges pursuant to Section
1.06 of Article 1 of the Subsidiary Loan
Agreement.
RECOMMENDATIONS
cash overdraft in other accounts; strictly
adhere to the fundamental principles in the
disbursement of funds as prescribed under
Sections 4(5) and 4 (6), PD No. 1445.
a) Direct the Port Revenue Division to
collate all pertinent records such as the
comparison of projected and actual cargo
volumes from 2008 to 2012 as basis for the
renegotiation of concession fees; b) Create
an Audit Committee to conduct
examination and verification of the
Operator’s books of accounts such as
record of revenue and all documents used in
the collections of port revenue; c) Exert all
efforts to renegotiate the Concession Fees
based on mutual agreement that are most
beneficial and advantageous to both
contracting parties; d) Regularly avail of
the option to exercise the rights provided
under the 2nd
paragraph, Section 9.2 of
Article 9 of the concession contract
whenever it has reached or exceeded the
limits provided therein without awaiting the
five year period to renegotiate the
concession fees; and e) Reduce into writing
all agreements made by the parties in
connection with Section 9.2, Article 9 of
the Concession Contract, approved by
PIA’s Board of Directors.
Re-evaluate the best moves either: a) to
continuously pursue the proposed scheme
of repayment, and b) to comply with the
terms and conditions of the Agreement.
The first option is favorable to the BTr as it
will continue to collect default charges
pursuant to the concluded Agreement
prejudicial to the interest of PIA.
195
AUDIT OBSERVATIONS
9.4.27.3 Cash on hand and short term
investments pertaining to MCT operations
were not all deposited with the Philippine
Veterans Bank (PVB) thus, about more or
less P112 million was deposited and/or
placed in a short term investment with the
Land Bank of the Philippines (LBP),
Cagayan de Oro and Puerto Branch. The
reporting procedure used is not within the
purview of Section 111 of PD 1445.
9.4.27.4 PIA has not yet remitted to the
Bureau of the Treasury (BTr) equivalent to
50 per cent of its reported net earnings of
P86.658M pursuant to Section 7,
Implementing Rules and Regulations of RA
No. 7656, thus contributing to the shortfall
of collections of the National Government
9.4.27.5 PIA collections from MICTSI for
variable and fixed concession fees were
understated by P 6.869 million because of
non-compliance by the latter of Article 9.1
and Annex C of Article 1 of the
Concession Contract.
RECOMMENDATIONS
In the second option, default charges could
be minimized. PIA’s savings from default
charges under second option could be
utilized to more tangible Projects including
its aggressive expansion project of MCT
operations.
a) Continue and fast track the establishment
of the cash account of MCT operations
from April 2004 to 24 April 2008 and cause
the immediate transfer to the PVB;
b) Immediately transfer the amount of
P112M more or less to the PVB based on
the data as shown above; and c) Deposit
only those collections and disburse/
withdraw fund from the PVB accounts
pertaining to the MCT operations for
Calendar Year 2013 and onwards.
Remit immediately to the Bureau of the
Treasury the fifty percent net
earnings or the amount of P43.329
million and the balance after any
adjustments within seven days after
the issuance of the COA Annual
Audit Report pursuant to Section 7, IRR
of RA No. 7656; and see to it that in the
ensuing year and every year thereafter the
fifty percent (50%) shall be remitted every
30 April following the dividend year.
Strictly enforce the provision of Article 9.1
as provided in Annex C of the Contract
regarding payment by MICTSI on fixed and
variable concession fees; enforce
collections from MICTSI with respect to
the uncollected variable fees resulting from
196
AUDIT OBSERVATIONS
9.4.27.6 PIA has not exercised its
visitorial authority vested to them under
Article 11 and failed to require the
Operator to comply with Article 10.2 of
the Concession Contract, thus, there may
be a risk that PIA is not receiving fully the
variable concession fees.
9.4.28 Mindanao University of Science
and Technology (MUST),
Lapasan Cagayan de Oro City
Contract for drainage project rescinded in
August 2008 or over four years with 45.33
percent accomplishment remained not
re-contracted leaving the installed
structures/equipment involving P2.6 million
RECOMMENDATIONS
the sales discounts deducted and other
income (rental & miscellaneous) excluded
in the computation of gross income in the
amount of P4.369 million; and enforce
collections from MICTSI for the unpaid
fixed concession fees in 2012 amounting to
P2.5 million.
a) Revisit Article 11 of the Contract and
conduct a regular inspection and
verification of the MICTSI books of
accounts related to revenue to ensure that
the reported gross revenue reflects the
Operator’s financial report; b) Strictly
require MICTSI to comply with Article
10.2 on monthly submission of operational
reports as a management tool for
calculating the variable concession fees
collectible from the Operator; and
c) Before any renegotiation shall commence
as provided under Article 9.2 of the
Contract, PIA i) must undertake complete
and thorough audit, inspection and
examination of the Operator’s books of
accounts and records of revenues except
interest income; ii) assess and bill the
Operator for variable concession fees for
understatement of the reported gross
revenue found during audit; and iii) ensure
within 24 hours that the Operator shall pay
the under remittance of variable concession
fees as billed.
Require the Accountant to book up the
Drainage System Phase 1 works with a
completion percentage of 58.97 percent
valued at P2.933 million; and assign
people to coordinate with the Department
197
AUDIT OBSERVATIONS
exposed to weather conditions, as flooding
of the university’s campus continued
unabated during heavy rainfall causing
damage to several government properties,
declaring suspension of classes and
incurring higher cost for the completion of
flood mitigation control project.
9.4.29 Northern Mindanao State College
of Science and Technology
(NMSCST), Tangub City
Properties owned by the College amounting
to P18.572 million were not
covered/insured contrary to Section 3.1 of
the National Budget Circular No. 342 and
COA Circular No. 81-160 dated 21 April
1981, thereby depriving the college of the
opportunity to recover indemnity in case of
loss or damage.
RECOMMENDATIONS
of Public Works and Highways for the
completion of the Campus Drainage
System.
Adhere strictly to the provision of Section
3.1 of the National Budget Circular No. 342
and COA Circular No. 81-160 dated 21
April 1981 by securing insurance coverage
for all properties of the college to assure
recovery of the cost of assets in case of loss
or damage.
198
9.5 Consolidated Common Audit Observations and Recommendations from the
Annual Audit Reports for National Government Agencies (NGAs) for
Calendar Year 2012
9.5.1 Cash
The audit of the cash accounts in the books of National Government
Agencies (NGAs) disclosed non - compliance with existing laws, rules
and regulations as well as deviations from required accounting
procedures as follows:
9.5.1.1 Unreconciled differences between the book and bank balances figures
were reported from 18 audited agencies amounting to P521.59 million
affecting the reliability of the cash account balance, primarily due to
the non-preparation or delayed submission of the bank reconciliation
statements (BRS) and/or deficiencies in the maintenance of cash
records of said agencies.
9.5.1.2 Cash collected by collecting/accountable officers totalling P11.26
million in 10 NGAs was not remitted/deposited intact within the
prescribed time with authorized government depository banks hence,
exposing the assets to risk of misuse and loss.
9.5.1.3 Unused and/or dormant cash balances of 11 NGAs amounting to
P345.60 million were not remitted to the Bureau of the Treasury (BTr)
resulting in huge balances of idle and unutilized funds in Authorized
Government Depository Banks (AGDBs) which should have been used
by the National Government.
9.5.1.4 Cash advances issued to Cash-Disbursing Officers for payroll fund
or petty cash fund of six audited agencies totalling P58.50 million
remain unliquidated at year-end due to non-compliance with the
provisions of Sections 5.1.2, 5.7 and 5.8 of COA Circular No. 97-002
and Section 89, P.D. No.1445, opening possible risks of misuse or
malversation. (A1)
9.5.1.5 Cash shortages were incurred in three audited agencies amounting to
P1.70 million due to lapses/weaknesses in internal control on
collections like depositing intact of all collections daily with an AGDB
as provided in Section 21, Volume 1, Manual on the New Government
Accounting System (MNGAS).
9.5.1.6 Under assessment/collection of supervision and regulation fees or
monthly rentals in three NGAs totaling P15.38 million due to non-
imposition of said fees or incorrect assessment resulted in collection
inefficiency and lesser government revenues.
199
9.5.1.7 Unrecorded bank accounts or dormant funds were reported in five
NGAs totaling P36.96 million contrary to GAFMIS Circular Letter No.
2002-001 dated 16 December 2002 and Section 4 (B) MNGAS.
9.5.1.8 Erroneous or delayed recording of cash transactions in 13 NGAs
totalling P208.81 million resulted in unreliable Cash account balances
at year-end affecting the fair presentation of the amounts in the
financial statements.
9.5.1.9 Cash deposited in banks by four NGAs totalling P115.19 million was
without authority contrary to Executive Order No. 338, series 1996.
9.5.1.10 Unreleased/stale checks of eight NGAs amounting to P77.63 million
were not restored to cash balances thus, understating said balances at
year-end.
9.5.1.11 Unused funds of three NGAs amounting P1.74 million was not
remitted back to the donor/source agency after project completion
which was not in accord with Section 4.9, COA Circular No. 94-013
dated 13 December 1994 and MOA provisions.
9.5.1.12 Cash deposits/cash transfers totalling P4.57 million of three NGAs
were made thru private banks in violation of the Special Provisions of
Republic Act No. 10155, General Appropriations Act of CY 2012.
One NGA in Zamboanga City has obtained an authority from the BSP
to deposit its collections with a private bank.
9.5.1.13 Non-preparation of the BRS or delayed submission of BRS and
recording of the reconciling items rendered the cash account balances
of 12 NGAs of doubtful validity.
9.5.1.14 Collecting Officers/Accountable Officers of 10 NGAs were not
covered by fidelity bond contrary to the provisions of Treasury
Circular No. 02-2009 dated 06 August 2009.
Recommendations
9.5.1.15 Prepare the monthly reconciliation statements of all bank accounts
every end of the month in accordance with Section 74 of P.D. No.
1445, take up reconciling items and adjust the books to correct the
errors, if any, to reflect the correct balance of the cash account in the
financial statements.
9.5.1.16 Verify and analyze cash transactions and come up with a
reconciled general ledger and subsidiary ledger balances to ascertain
the correctness of the balance of Cash in Bank – Local Currency,
Current Account as appearing in the books.
200
9.5.1.17 Closely monitor and supervise the prompt remittance of collections
in consonance with Section 69, P.D. No. 1445 to safeguard
government funds from misappropriation, loss or misuse. Ensure
collections are deposited intact with authorized government depository
bank as prescribed in the Manual on the New Government Accounting
System (MNGAS).
9.5.1.18 Remit to the BTr all existing balances of trust receipts in compliance to
Executive Order No. 338 dated 17 May 1996, COA-DBM-DOF Joint
Circular No. 9-81 dated 19 October 1981 and COA-DBM-DOF Joint
Circular No. 1-97 dated 02 January 1997. Collections should be
remitted/deposited intact daily and regularly as required under Section
21, Volume II of the MNGAS for National Government Agencies
(NGAs).
9.5.1.19 Return to the source agency the unused funds for the completed
projects, pursuant to COA Circular No. 94-013 dated 13 December
1994.
9.5.1.20 Cash advances for payroll fund and petty cash fund should be
liquidated within the prescribed period in compliance with Sections
5.1.2, 5.7 and 5.8 of COA Circular No. 97-002 and Section 89, PD
No. 1445.
9.5.1.21 Record bank accounts maintained for special purpose in compliance
with the provisions of GAFMIS Circular Letter No. 2002-001 dated
16 December 2002 and Section 74 of PD 1445.
9.5.2 Receivables
9 5.2.1 Cash advances to Officers and Employees of 50 audited agencies for
travel, special time bound undertakings and other activities totaling
P1.98 billion were not liquidated within the specified period and
remained outstanding for years due to the non-implementation of the
prescribed controls on the grant and liquidation of cash advances.
9.5.2.2 Funds transferred by 31 NGAs to other NGAs, Local Government
Units (LGUs), Government - Owned and Controlled Corporations
(GOCCs) and Non-Governmental Organizations (NGOs)/ People’s
Organizations (POs) for the implementation of projects with an
aggregate amount of P13.76 billion, remain unliquidated for several
years due to the following factors:
a. Failure of the source agencies to monitor transferred funds and to
enforce submission of liquidation reports after completion of the
project;
201
b. Failure of the implementing/recipient agencies to regularly submit
liquidation reports and refund unused balances to the source
agencies after completion of the projects; and
c. Lack of` periodic reconciliation of accounting records between the
source agencies and implementing agencies.
9.5.2.3 Dormant/unsupported receivables were reported in 39 NGAs amounting
to P670.90 million primarily due to insufficient or lack of supporting
documents, failure of management to retrieve the records for analysis,
absence of established/updated individual subsidiary ledgers contrary
to Section 111, PD No. 1445, reciprocal accounts were not reconciled,
necessary schedules required under Section 75, MNGAS were not
prepared, erroneous recording of transactions, and flawed aging
schedules thereby leading to a remote possibility of collection of these
receivables.
9.5.2.4 Unrecorded receivables of 13 NGAs amounting to P74.85 million
due to failure of management to recognize as receivable the uncollected
tuition and other miscellaneous fees, stall rental fees, canteen sales on
credit, among others, resulted in the understatement of the agencies’
receivable accounts balances.
9.5.2.5 Ten NGAs reported an uncollected or unsettled receivables totalling
P232.04 million attributed to failure of schools to collect repayments
on students’ interest free loan assistance, reneging scholars who failed
to complete their courses within the prescribed period stipulated in the
Memorandum of Agreement (MOA), long outstanding loan receivables
from cooperative banks and cooperatives which had either closed shop
or in deep financial distress, and failure of an agency to monitor and
control sales on credit contrary to Section 60, 61 and 64, GAAM,
Volume I.
9.5.2.6 Three NGAs had not set-up an allowance for doubtful accounts
for its receivable accounts as required under Section 66,
MNGAS.
Recommendations
9.5.2.7 To ensure collection of receivables and liquidation of cash advances,
the following measures are recommended:
a. Prepare and maintain a complete and up-to-date subsidiary records
and aging schedule that are reconciled with the General Ledger
balances.
b. Adhere strictly to pertinent regulations on the grant, utilization and
liquidation of cash advances which include, among others:

202
Full liquidation of outstanding cash advances of accountable
officers before new cash advances are granted as provided in
Section 89 of P.D. No. 1445; and
Full settlement of all cash advances at year-end so that
appropriate expense accounts will be recognized in the books,
and instruct the concerned accountable officers and employees
to deposit or return immediately to the cashier/collecting officer
any unused portion of their cash advances.
c. Strict implementation of the provision of Section 5.8 of COA
Circular No. 97-002 which requires the settlement/liquidation of
cash advances within the prescribed period.
9.5.2.8 All possible legal measures/remedies should be enforced in collecting
receivables, which include, among others: a) sending out demand
letters to debtors/officers and employees, b) withholding of salaries or
any claim due them after sufficient notice have been served and
c) other legal means.
9.5.2.9 Verify the status of long outstanding accounts and assess accounts
receivables which are no longer collectible. Consider the possible
write-off of these accounts after exerting diligent efforts to collect,
instituting appropriate action and exhausting all the remedies available.
9.5.2.10 To prevent the accumulation of long outstanding unliquidated fund
transfers, the following are recommended:
a. Transfer the fund directly to the implementing agency of a
project/program instead of having it coursed thru an intermediary
agency by indicating this provision in the LA/Memorandum of
Agreement (MOA); require the timeliness of the project
implementation in the LA/MOA;
b. Strictly implement the provisions of COA Circular Nos. 94-013,
96-003 and 2007-001 and the provisions of the MOA by requiring
the implementing agency to immediately submit the required
liquidation reports and refund any unutilized balances including
interest, if any; and
c. Refrain from granting additional fund releases to
NGAs/LGUs/GOCCs/NGOs/POs with unliquidated balances to
prevent accumulation of amounts.
9.5.2.11 Provide an allowance for doubtful accounts in compliance with Section
66, MNGAS.
203
9.5.3 Inventories
9.5.3.1 Delayed delivery of items procured and already paid by three audited
agencies costing P46.64 million from the Department of Budget and
Management (DBM)- Procurement Service (PS) defeated the good
intention to facilitate the procurement process and resulted in the
accumulation of undelivered items.
9.5.3.2 Unreconciled difference totalling P267.54 million between the
Accounting and Property records/inventory reports of 26 agencies
brought about mainly by:
a. Non-submission of Report of Supplies and Materials Issued
(RSMI), and Report on the Physical Count of Inventories (RPCI),
among others required reports or incomplete physical count
report, as bases in recording the expenses to the Accounting Unit;
b. Absence of periodic reconciliation between Accounting and
Supply records as required in Section 43, Volume I of the
MNGAs;
c. Inventories which were already issued and/or consumed but were
still reflected in the financial statements or delayed recording of
receipts and issuances of inventories;
d. Non-maintenance of supplies ledger cards (SLCs) or unupdated
stock cards; and
e. Erroneous entries in the recording of inventory transactions or
misclassification of inventory purchases.
f. In one agency, the RSMI was prepared and recorded in the books
even when supplies and materials were not totally issued resulting
in the understatement of year-end inventory balances.
9.5.3.3 Unreconciled difference between the General Ledger (GL) and
Subsidiary Ledgers (SLs) were reported for five NGAs amounting to
P6.90 billion hence, accuracy and validity of the Inventory account
balances cannot be ascertained.
9.5.3.4 Overstatement of inventory account balances of 17 NGAs totaling
P93.10 million mainly due to the non-submission of the Report of
Supplies and Material Issued (RSMI) by the supply officer to the
Accounting Unit contrary to Section 43, MNGAS, Volume I and
Section 62, MNGAS, Volume II.
204
9.5.3.5 Inventory accounts balances of 10 audited agencies amounting to
P708.01 million were doubtful due to failure of these agencies to
conduct physical inventory/count of supplies and materials resulting in
the unreconciled balances between the Accounting and Property
records.
Recommendations
9.5.3.6 Coordinate with the DBM-PS regarding the settlement of undelivered
supplies which were already paid by the agencies.
9.5.3.7 Require the Accountant and Property/Supply Officer to reconcile
the difference between the Accounting and Property records/
inventory report by: (a) identifying the causes of the discrepancies in
the GL and SLs, and (b) analyzing items recorded in the GL/SLs and
reconciling the same with the data appearing in the RPCI in
compliance with the provisions of Section 43, Volume I and Section
62, Volume II of the MNGAS for NGAs.
9.5.3.8 Require the Accountant to maintain the Supplies Ledger Card
(SLC) in accordance with Sections 12, Volume II of the MNGAS,
undertake regular reconciliation of the SLC with the GL and
prepare the necessary adjustments.
9.5.3.9 Require the Supply Officer to submit regularly the Report of
Supplies and Materials Issued (RSMI) and other required inventory
reports to the Accounting Unit to support the recording of
consumption/issuances of supplies and materials or mortality in case
of livestock. Likewise, prepare the necessary adjustment to
record expenses, unrecorded deliveries and various accounting
errors.
9.5.3.10 Direct the Supply Officer and other concerned personnel to adhere
strictly to the established rules and regulations prescribed in Section
65, Volume II of the MNGAS relative to the conduct of physical
count of inventory items and maintain an updated inventory records
in accordance with Section 41, Volume II of the MNGAS.
9.5.3.11 Record all purchases of supplies and materials following the
perpetual inventory record and maintain supplies ledger cards for
each item in accordance to Section 43 of MNGAS, Volume I.
9.5.3.12 Observe the Asset Method of Accounting for Supplies and Materials by
recording the items to the appropriate expense account only upon its
issuance pursuant to Section 43, MNGAS.
205
9.5.4 Property, Plant and Equipment
9.5.4.1 Unrecorded Property, Plant and Equipment (PPE) totalling P2.89
billion was reported by auditors for 19 NGAs due to lack of appropriate
supporting documents and/or basis of the cost, in violation of Section
63 of Presidential Decree (PD) No. 1445 requiring that government
property shall be taken up in the books of the agency concerned at
acquisition cost or at appraised value, thereby understating the affected
PPE accounts.
9.5.4.2 Unserviceable/obsolete properties of 36 audited agencies costing
P462.05 million remained in the books of 132 audited agencies
contrary to Section 4.p, MNGAS Volume I, Section 143, MNGAS,
Volume III and Section 79 of PD No. 1445 requiring the disposal of
unserviceable properties.
9.5.4.3 Idle/unutilized properties and equipment were reported from nine
NGAs totalling P678.50 million such as abandoned/uncompleted
building projects costing P41.29 million, two school buildings worth
P24.12 million completed in 2002 and 1996, Furnitures, Fixtures and
Equipment items totalling P49.99 million acquired in 2010 and
scientific equipment amounting to P51.12 million, among others, which
defeat the purpose for which these properties were acquired, and cause
a waste of government funds given the possibility of incurring losses
due to deterioration/destruction or misuse of the properties.
9.5.4.4 Unreconciled records of Accounting and Property Units of 69 audited
agencies rendering the reported balances totalling P30.03 billion at
yearend doubtful due to failure to maintain Property, Plant and
Equipment (PPE) ledger and property cards, failure to conduct physical
count, failure to transfer completed projects from Construction-in-
Progress to PPE and the failure of the Accounting Section to maintain
Property, Plant and Equipment Ledger Cards in violation of Section
490 of the GAAM Volume I, among others. These deviations mainly
contributed to the unreconciled PPE account balances between the
accounting and property records.
9.5.4.5 Ten audited agencies failed to insure their property, plant and
equipment amounting to P1.24 billion with the General Insurance
Fund and/or Property Replacement Fund of the Government Service
Insurance System (GSIS) contrary to Section 489, GAAM, Volume I,
COA Circular No. 92-390, Administrative Order No. 141 dated 12
August 1994 and Section 5 of R.A. No. 656, otherwise known as the
Property Insurance Law, thereby, exposing the agencies’ assets to
unnecessary losses in case of fire, calamities and other fortuitous
events.
9.5.4.6 Fifty two (52) agencies failed to conduct a physical inventory of their
property, plant and equipment contrary to COA Circular No. 80-124,
Section 490, GAAM and Section 58, PD No. 1445 hence, the validity,
206
existence and correctness of the reported balances at the end of CY
2012 totalling P16.49 million cannot be determined.
9.5.4.7 Twenty-four NGAs failed to recognize the depreciation of the PPEs at
the end of each month contrary to Sections 67-68, Volume I, MNGAS
thereby, affecting accuracy of the PPE and expense accounts balances.
Recommendations
9.5.4.8 Require the Property Officer to submit to the Accounting Unit the
necessary supporting documents for the recording of the PPE in the
books of accounts and the Accountant to: (a) record the costs of all
assets/PPE items in books, and (b) obtain complete documentation of
PPE, particularly those items acquired through grants or donations.
9.5.4.9 Require the Accountant to reclassify the unserviceable properties to
Other Assets account, based on the list submitted by the Property
Officer, prior to the disposal of said properties, in accordance with
Section 143, MNGAS, Volume III, prepare the accounting entries to
drop the disposed properties from the books of accounts by the
Accounting Unit upon the disposal of unserviceable properties in
accordance with Section 79 of PD No. 1445, Section 4.p MNGAS,
Volume I, COA Circular No. 2004-008 dated 20 September 2004, and
Section 143, MNGAS, Volume I. Direct the Property Officer to: (a)
prepare the Inventory and Inspection Report of Unserviceable
Properties (IIRUP), (b) prepare the necessary documents for the
disposal of properties through public bidding or other modes of
disposal to prevent their further deterioration; and/or for the preparation
of the accounting entries to drop the disposed properties from the books
of accounts by the Accounting Unit.
9.5.4.10 Agencies should plan/study carefully the acquisition/construction
of PPE, make consultation with the stakeholders, settle gray areas of
the project like ownership of the prospective land area, among others,
before pursuing the implementation of said project to prevent
unnecessary expenditures in the future and waste of government funds
in such cases as the idle and unutilized buildings constructed in prior
years and procured furnitures, fixtures, and equipment. Further,
require the Management to undertake various remedial actions to
ensure optimum utilization of the idle/unutilized PPE and ensure
proper maintenance of these assets to avoid wastage of government
resources.
9.5.4.11 Require the Accountant to prepare and maintain Property, Plant and
Equipment Ledger Card (PPELC) and reconcile it with the property
records/inventory reports on a regular basis as well as ensure that the
PPELC is always reconciled with the GL to comply with Sec. 43,
paragraphs 3 and 4 of MNGAS, Volume 1 and Section 490 (a and b) of
GAAM, Volume 1.
207
9.5.4.12 Require the agencies to insure all its insurable physical assets
with the General Insurance Fund and/or Property Replacement Fund of
the Government Service Insurance System (GSIS) in accordance with
Section 5 of R. A. No. 656 and Administrative Order No. 141 dated
August 12, 1994 to protect its interests in case of fortuitous events.
9.5.4.13 Conduct a complete physical inventory of all assets at least once a
year pursuant to Section 58, PD No. 1445, Section 490, GAAM,
Volume I, and COA Circular No. 80-124 and prepare the Report of the
Physical Count of PPE (RPCPPE). Any discrepancies between
physical count and inventories per books must be analyzed,
investigated and a corresponding course of action be taken up
immediately.
9.5.4.14 The Accountant should ensure that depreciation expenses for all
PPE accounts are recorded at the end of each month. Further, a review
of the PPELC should be done to correct errors posted in the estimated
useful life of the asset to coincide with the prescribed estimated useful
life under COA Circular No. 2003-007. Record the recommended
audit adjustments to correct accumulated depreciation.
9.5.5 Liabilities
9.5.5.1 The recorded liabilities totalling P204.94 million of 14 audited
agencies were without valid claims and/or not supported by record or
documents to establish their validity and existence.
9.5.5.2 Nine NGAs were reported to have an unbooked or erroneously
recorded payables totaling P4.80 billion which contributed to the
understatement/overstatement of the Liabilities account balances.
Recommendations
To establish the validity and accuracy of current year’s balances and to present
a more reliable figure of payables in the succeeding years’ financial
statements, the following procedures are recommended:
9.5.5.3 Review all outstanding payables and revert those which are
undocumented/not supported with valid claims and those aged two
years or more.
9.5.5.4 Strictly enforce the submission of supporting documents prior to the
recording of transactions to minimize payables with no claimants.
9.5.5.5 Prepare journal entries to correct the unrecorded payables and adjust
errors in recording the fund transferred to reflect the correct balances.
9.5.5.6 Maintain and update SLs for each payable account to support their
existence and validate accuracy of records. Amounts that have no
breakdown, not supported with complete documentation and not
208
reconciled with SLs cast further doubt on the reliability of the account
balances.
9.5.6 Revenues
9.5.7.1 Six audited agencies’ reports disclosed their failure to accrue
income amounting to P22.69 million.
Recommendation
9.5.7.2 Instruct the Accountants to: (1) effect the recording of unrecorded
collections, (2) prepare reclassification entries on accounts
erroneously credited instead of the income account, and (3) adopt/
use the accrual method of accounting for income already earned.
9.5.7 Expenses
9.5.7.1 Unnecessary expenses were reported in 48 NGAs totalling P125.73
million while two agencies have excessive contracts amounting to
P1.92 million. Unauthorized/illegal/irregular expenses were noted in
22 agencies totalling P98.28 million.
. Recommendations
To preclude incurrence of unauthorized/illegal/excessive expenditures
and the misuse of government funds including erroneous recording thereof, we
recommend the following:
9.5.7.2 Require the agency heads to explain in writing and submit legal basis
that would justify the granting of Collective Negotiation Agreement
(CNA), incentives, representation allowance and transportation
allowance (RATA), additional bonuses and other allowances, otherwise
the amount should be refunded. Henceforth, management should
strictly adhere to the provisions of Administrative Order No. 135 dated
December 27, 2005, DBM Budget Circular No. 2006-001dated
February 1, 2006, Presidential Decree No. 1597, Section 4 of
Presidential Decree No. 1445 and other issuances relevant to said
transactions.
9.5.7.3 Ensure that funds are used in accordance with the purpose for which
these are intended. To avert misuse of funds, install policies and
controls on the proper use of funds; prepare a program of expenditures
or a Work and Financial Plan and require submission of audited
Statement of Utilization or report on the completion of the project or
trip with accompanying details of transaction.
9.5.7.4 Direct the Accountant to adhere strictly to the provisions of Section 4
(6) of Presidential Decree No. 1445, the Omnibus Rules Implementing
Book V of E.O. No. 292 and other Civil Service Laws, Executive
Order No. 298 dated March 23, 2004, Department of Budget and
Management Circular No. 2006-001 dated February 1, 2006,

209
Department of Budget and Management Circular No. 2010-3, and other
directives, requiring completeness of supporting documents to claims
before payments.
9.5.8 Compliance
Submission of reports/documents
9.5.8.1 Delayed in the submission of copies of year-end/monthly financial
reports, disbursements vouchers (DVs) and supporting documents
(SDs) and other required reports of 48 NGAs beyond the reglementary
period as required under COA Circular No. 89-299-A, Section 6, COA
Circular No. 95-006 dated 18 May 1995, Sections 3.1.1 and 3.2.1,
COA Circular No. 2009-001 dated 12 February 2009, Section 7.2.1 (a),
COA Circular No. 2009-006 dated 15 September 2009, Section 71,
MNGAS, Volume I, Sections 4, 41, 100, 107, and 122, PD No. 1445,
causing delay in the inspection of projects and purchases, as well as
analysis and review/evaluation of the accounts/contracts and
subsequently, delay in informing management of the deficiencies noted
therein.
Recommendations
9.5.8.2 Strictly comply with the submission of reports by the concerned
personnel within the prescribed period to facilitate the recording of
transactions in the agency books of accounts and provide timely and
accurate information for management’s decision/action as well as for
eventual post-audit of the agency’s financial transactions by the
Commission on Audit as required under Sections 100 and 122 of
Presidential Decree No. 1445 and Section 7.2.1(a) of COA Circular
No. 2009-006 dated September 15, 2009. Enjoin the accountable
officers to submit on time accountable reports for recording in the
books of accounts;
9.5.8.3 Require the concerned personnel to submit the contracts/purchase
orders and the supporting documents to COA within the prescribed
period in accordance with COA Circular No. 87-278 and COA
Memorandum No. 2005-027, restated with amendments under COA
Circular No. 2009-001 dated February 12, 2009; and
9.5.8.4 Require the Accounting Unit to evaluate the transactions as to
completeness of supporting documents and such are properly
accomplished particularly the signatures of authorized officials and
employees on each and every document attached to the claim.
Procurement
9.5.8.5 Procurement of various goods and services totaling P539.15 million
reported by 31 audited agencies was made without complying with the
210
applicable provisions of RA 9184, otherwise known as the
"Government Procurement Reform Act". These deficiencies include
the following, among others:
a. Procurements, in material amounts were made without public
competitive bidding contrary to Sections 48.2, 52.1 and 53.9,
Implementing Rules and Regulations (IRR) of RA No. 9184;
b. Failure to prepare the Annual Procurement Plan (APP) which is
not in accordance with Section 7, Revised IRR, RA No. 9184;
c. Procurement activities were not posted in the PHILGEPS
contrary to Sections 54.2 and 54.3, RA No. 9184;
d. Splitting of purchase orders in violation of Administrative Order
No. 17 and Section 54.1, RA No. 9184;
e. Use of reimbursement as a mode of procurement;
f. Non-observance of the guidelines on shopping, as a mode of
procurement;
g. Non-imposition of the required ten (10) percent retention money;
and
h. Indication of brand names in the request of quotation.
Recommendation
9.5.8.6 Comply with the Annual Procurement Plan (APP) and observe
Competitive Bidding and/or Alternative Modes of Procurement in
accordance with the provisions of Republic Act No. 9184 and its
implementing rules and regulations (IRR).
Other Relevant Audit Observations and Recommendations
9.5.8.7 Twenty-nine NGAs failed to settle their audit disallowances totalling
P110.44 million while seven audited agencies have unsettled
suspensions amounting to P108.46 million as of year-end.
9.5.8.8 Various non-compliance with existing accounting and auditing
rules and regulations were reported in 21 audited agencies such as:
(a) non- usage of the updated books of accounts as required by
Sections 2, 11 and 12, MNGAS, Volume II; (b) failure to implement
the required simplified accounting forms and registers in
reporting/monitoring financial transactions as provided in COA
Circular Nos. 2003-006 and 2004-003 dated 02 December 2003 and
24 June 2004; lack of supporting documents; individual accounts do
not reconcile with the financial statements, use of customized
211
computer generated official receipts without securing an authority
with COA, among others.
9.5.8.9 Delay in program/project implementation in five NGAs totalling
P386.47 million thus, the delivery of a more improved and quality
services/benefits to the constituents/stakeholders were adversely
affected.
9.5.8.10 Failure to remit the taxes withheld were noted in 18 audited agencies
amounting to P44.58 million contrary to Executive Order No. 651,
Sections 114 and 272, RA No. 8424 (National Internal Revenue
Code). On the other hand, 16 NGAs have fully complied with the
remittance of their taxes withheld totalling to P198.30 million.
9.5.8.11 Two agencies granted incentives to its officials and employees totalling
to P30.66 million without any legal basis.
9.5.8.12 Seventeen agencies showed lapses/weakness in their internal control
systems such as controls not in place for recording of transactions,
designation of personnel, disbursement system; and in handling of
collections like failure to issue official receipts.
9.5.8.13 Absence of Internal Audit Service unit in three NGAs contrary to RA
No. 3456, as amended by RA No. 4177 and DBM Circular Letter No.
2008-5 dated 14 April 2008.
9.5.8.14 No fund allocation for senior citizens and person with disabilities
were made by 27 NGAs contrary to Section 29, RA No. 10155,
General Appropriations Act of CY 2012 thus, depriving the
stakeholders of their rights and privileges under the law.
9.5.8.15 Forty-four agencies failed to implement the Gender and Development
(GAD) provisions as required in Section 28, RA No. 10155 and Joint
DBM-NEDA-NCRFW Circular 2004-1 thus, hindering the
implementation of activities designed to address gender issues and
promote women empowerment and gender equality.
Recommendations
9.5.8.16 Enforce the settlement of the audit suspensions and disallowances
within the prescribed period in accordance with Sections 9.4 and 10.4
of the 2009 Rules and Regulations on the Settlement of Accounts.
9.5.8.17 Strictly observe the provisionsof RA No. 10155 and the subsequent
General Appropriations Act, RA No. 4177, RA No. 8424 and the
various COA Circulars on accounting and auditing rules and
regulations.