Embed Size (px)
Citation preview

Annual Environmental Compliance Report
2014-15
MPA Fish Farms Pty Ltd.
September 2015
Marine Produce Australia Ltd
PO Box 1008
West Perth WA 6872
Tel: 08 9381 4483 Fax: 08 9381 5817
Prepared by: MPA Fish Farms Pty Ltd

MPA Fish Farms Pty Ltd. – Annual Environmental Compliance Report 2015
1 | P a g e
Table of Contents
1. Introduction ........................................................................................................................................................ 1
2. Current Status ..................................................................................................................................................... 2
3. Compliance ......................................................................................................................................................... 3
4. Environmental Monitoring .................................................................................................................................. 3
5. Annual Audit Table ............................................................................................................................................. 4
6. Annual Environmental Report ........................................................................................................................... 13
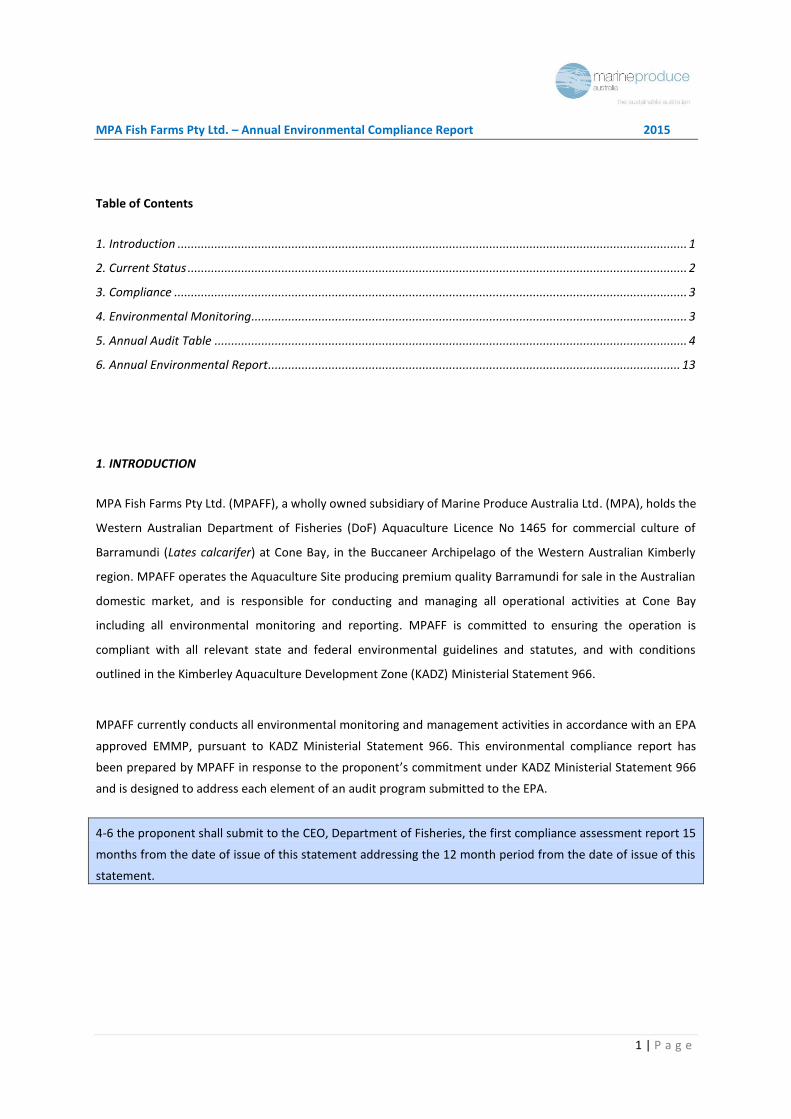
1. INTRODUCTION
MPA Fish Farms Pty Ltd. (MPAFF), a wholly owned subsidiary of Marine Produce Australia Ltd. (MPA), holds the
Western Australian Department of Fisheries (DoF) Aquaculture Licence No 1465 for commercial culture of
Barramundi (Lates calcarifer) at Cone Bay, in the Buccaneer Archipelago of the Western Australian Kimberly
region. MPAFF operates the Aquaculture Site producing premium quality Barramundi for sale in the Australian
domestic market, and is responsible for conducting and managing all operational activities at Cone Bay
including all environmental monitoring and reporting. MPAFF is committed to ensuring the operation is
compliant with all relevant state and federal environmental guidelines and statutes, and with conditions
outlined in the Kimberley Aquaculture Development Zone (KADZ) Ministerial Statement 966.
MPAFF currently conducts all environmental monitoring and management activities in accordance with an EPA
approved EMMP, pursuant to KADZ Ministerial Statement 966. This environmental compliance report has
been prepared by MPAFF in response to the proponent’s commitment under KADZ Ministerial Statement 966
and is designed to address each element of an audit program submitted to the EPA.
4-6 the proponent shall submit to the CEO, Department of Fisheries, the first compliance assessment report 15
months from the date of issue of this statement addressing the 12 month period from the date of issue of this
statement.

MPA Fish Farms Pty Ltd. – Annual Environmental Compliance Report 2015
2 | P a g e
2. CURRENT STATUS
Proposal Implementation Status
The proponent has substantially commenced implementation of the proposal. Production for the assessment
period calendar year was determined to be 825 tonnes. A summary of proposal characteristics as detailed in
KADZ Ministerial Statement 966 are listed in Table 1, including a report on the status of each listed
characteristic.
The company has deployed as of the end of the reporting period, 23 Grow-out cages and 8 nursery tanks on
the Cone Bay Aquaculture Site.
Table 1: Phase II Cone Bay Marine Finfish Farming Proposal Characteristics and Status:
Element Description Status
Proposed Aquaculture Lease Area
MPA holds a 699 hectare DoF aquaculture lease (AL0020). It is fully contained within the KADZ zone. It was determined that as MPA’s aquaculture lease area predates the assessment and the declaration of the KADZ, and sections of the KADZ boundary were placed on the MPA lease boundary, the 50 m separation distance will not be applied to MPA’s existing lease.
The 50 m separation distance between the KADZ boundary and MPA’s lease boundary will not be applied to MPA’s existing lease.
Proposed Aquaculture Licence
MPA has a current aquaculture licence (DoF 1465) and, under EPA Ministerial Statement 885, is licenced to produce 2,000 tonnes finfish per annum. MPA is requesting an increase in that tonnage capacity to a total of 6,990 tonnes of finfish per annum. There are currently no other fish farms in the zone area.
- Requested increase has been approved and MPA licence allows for 6,990 tonnes of finfish per annum.
- There are currently no other fish farms in the zone area
Floating Sea Cage Specifications
All sea cages will be fitted with predator nets or equivalent. Cages will be set with base at least 2 metres above sea floor at lowest astronomical tide. Anchorage and mooring systems will be set in such a way to not physically damage any reef or coral habitat that is found in the area.
- All sea cages are fitted with predator nets
- Anchorage and mooring systems are set in such a way to not physically damage any reef or coral habitat that is found in the area
Aquaculture Operations
Operation will be: Floating sea cages. Finfish species that naturally occur within the Pilbara and Kimberley Region – currently Barramundi. Finfish feeding, husbandry and harvesting
- 23 floating sea cages are in operation
- Current species is Barramundi
Feed inputs All pellet feed used will be either manufactured in Australia to the KADZ Management Policy standard or AQIS approved. Current feed brand used is Skretting (pellet feed manufactured in Tasmania)
Current feed brand is Skretting, manufactured in Tasmania
Seed Stock Only seed stock with a health certificate issued by DoF, or received from a facility certified by the SSBB DoF will be used.
All batches of fish are certified disease free by the Department of Fisheries pathology unit prior to being shipped to Cone Bay.

MPA Fish Farms Pty Ltd. – Annual Environmental Compliance Report 2015
3 | P a g e
3. COMPLIANCE
The proponent informed the Chief Executive Officer (CEO) of the Office of the Environmental Protection
Authority (OEPA) in writing on 21 December 2012 as per condition 6-3 of Ministerial Statement 885, that the
company had exceeded the EQG for sediment phosphorous levels in the Mepa.
6-3 In the event that monitoring required by Cone Bay Barramundi Aquaculture EMMP …indicates that the
levels of ecological protection, EQG or EQS are not being met: the proponent shall report such findings to the
CEO…
The proponent addressed this exceedance by moving to the EQS for Total Phosphorous, and reporting the
findings to the OEPA Compliance Branch. The resultant findings were of no detectable impact on infauna, no
reduction in oxygen saturation, and no development of bacterial mats under cages, thus the proponent has
requested that the phosphorus EQG trigger level be reconsidered as it is the proponent’s view that the trigger
value is not indicative of a likely impact on the Cone Bay environment. The OEPA compliance branch has taken
the request under advisement.
A copy of the updated annual audit table is included in Section 5. The proponent has complied with all
conditions outlined in the audit program.
4. ENVIRONMENTAL MONITORING
The Proponent, at Cone Bay, originally operated under a Department of Fisheries (DoF) approved EMMP
relating to Aquaculture Licence number 1465. Monitoring results relating to the EMMP were reported to the
DoF on a three monthly basis, with a major environmental report provided annually before 1 March. The 2010
and 2011 compliance reports, including the approved audit tables and environmental reports, were submitted
to DEC/OEPA, and the 2012 – 2014 results were submitted to OEPA. The current environmental monitoring
plan is as described in the EPA approved “Kimberley Aquaculture Development Zone – Environmental
Monitoring & Management Plan”.
MPA Fish Farms Pty Ltd. – Annual Environmental Compliance Report 2015
4 | P a g e
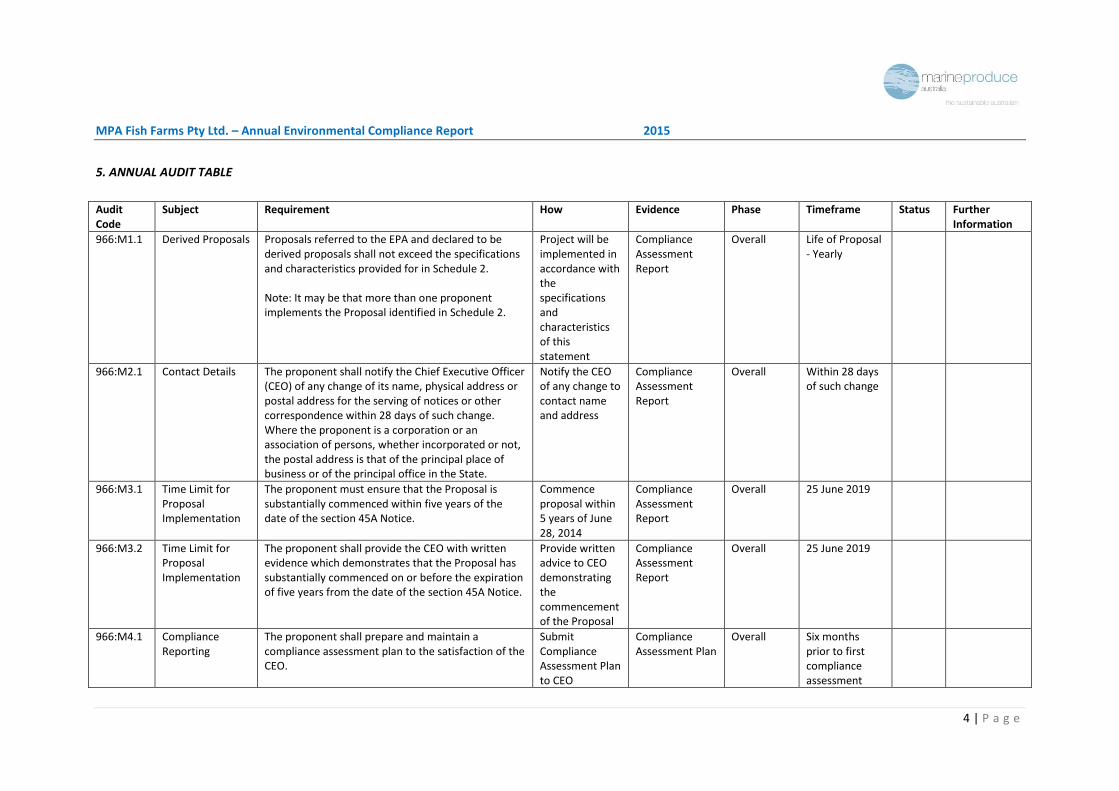
5. ANNUAL AUDIT TABLE
Audit Code
Subject Requirement How Evidence Phase Timeframe Status Further Information
966:M1.1
Derived Proposals Proposals referred to the EPA and declared to be derived proposals shall not exceed the specifications and characteristics provided for in Schedule 2. Note: It may be that more than one proponent implements the Proposal identified in Schedule 2.
Project will be implemented in accordance with the specifications and characteristics of this statement
Compliance Assessment Report
Overall Life of Proposal - Yearly
966:M2.1
Contact Details The proponent shall notify the Chief Executive Officer (CEO) of any change of its name, physical address or postal address for the serving of notices or other correspondence within 28 days of such change. Where the proponent is a corporation or an association of persons, whether incorporated or not, the postal address is that of the principal place of business or of the principal office in the State.
Notify the CEO of any change to contact name and address
Compliance Assessment Report
Overall Within 28 days of such change
966:M3.1
Time Limit for Proposal Implementation
The proponent must ensure that the Proposal is substantially commenced within five years of the date of the section 45A Notice.
Commence proposal within 5 years of June 28, 2014
Compliance Assessment Report
Overall 25 June 2019
966:M3.2
Time Limit for Proposal Implementation
The proponent shall provide the CEO with written evidence which demonstrates that the Proposal has substantially commenced on or before the expiration of five years from the date of the section 45A Notice.
Provide written advice to CEO demonstrating the commencement of the Proposal
Compliance Assessment Report
Overall 25 June 2019
966:M4.1
Compliance Reporting
The proponent shall prepare and maintain a compliance assessment plan to the satisfaction of the CEO.
Submit Compliance Assessment Plan to CEO
Compliance Assessment Plan
Overall Six months prior to first compliance assessment

MPA Fish Farms Pty Ltd. – Annual Environmental Compliance Report 2015
5 | P a g e
Audit Code
Subject Requirement How Evidence Phase Timeframe Status Further Information
966:M4.2
Compliance Reporting
The proponent shall submit to the CEO the compliance assessment plan required by Condition 4-1 at least six months prior to the first compliance assessment report required by Condition 4-6, or prior to implementation, whichever is sooner. The compliance assessment plan shall indicate:
(1) the frequency of compliance reporting; (2) the approach and timing of compliance
assessments; (3) the retention of compliance assessments; (4) the method of reporting of potential non-
compliances and corrective actions taken; (5) the table of contents of compliance
assessment reports; and (6) public availability of compliance
assessment reports.
Submit Compliance Assessment Plan to CEO
Compliance Assessment Plan
Overall Six months prior to first compliance assessment
966:M4.3
Compliance Reporting
The proponent shall assess compliance with conditions in accordance with the compliance assessment plan required by Condition 4-1.
Assess compliance in accordance with the Compliance Assessment Plan
Compliance Assessment Report
Overall Annually
966:M4.4
Compliance Reporting
The proponent shall retain reports of all compliance assessments described in the compliance assessment plan required by Condition 4-1 and shall make those reports available when requested by the CEO.
Retain digital copies of Compliance Assessment Reports
CARs available on MPA website or by direct enquiry to MPA
Overall Annually and continued
966:M4.5
Compliance Reporting
The proponent shall advise the CEO of any potential non-compliance within seven days of that non-compliance being known.
Notify CEO (and compliance branch of OEPA) by email of any potential non-compliance
Notification and yearly CAR
Overall Within 7 days of potential non-compliance being identified
MPA Fish Farms Pty Ltd. – Annual Environmental Compliance Report 2015
6 | P a g e
Audit Code
Subject Requirement How Evidence Phase Timeframe Status Further Information
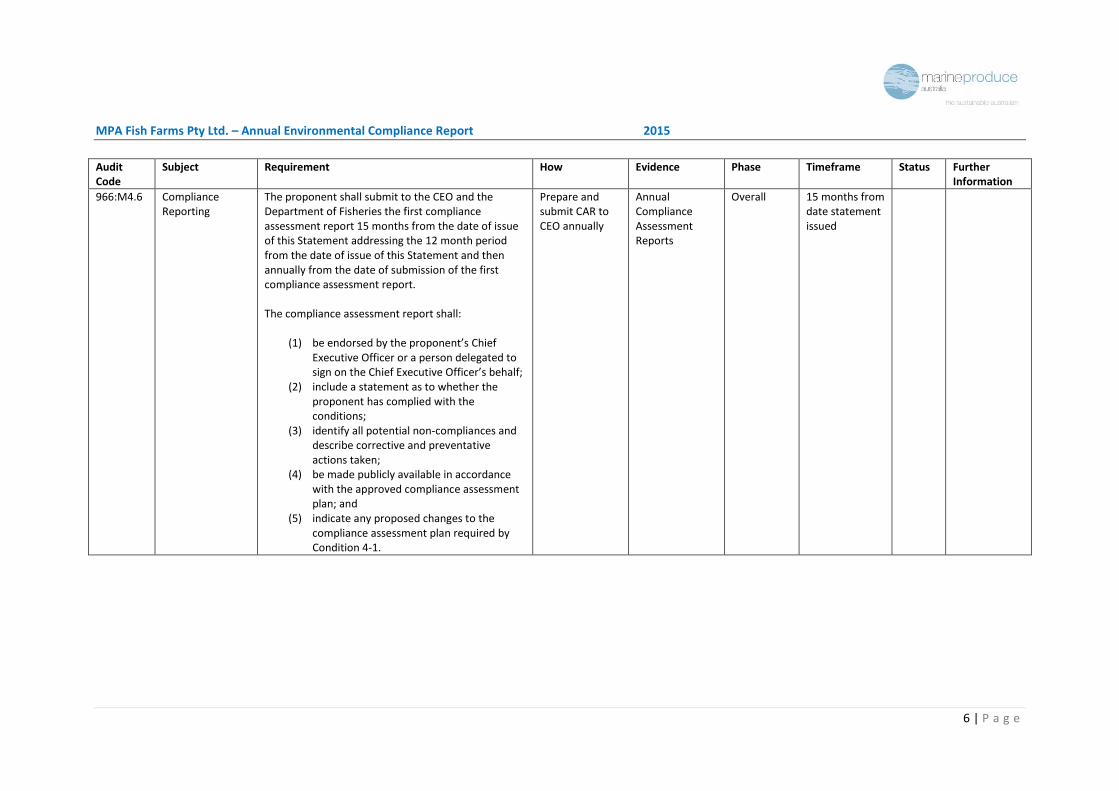
966:M4.6
Compliance Reporting
The proponent shall submit to the CEO and the Department of Fisheries the first compliance assessment report 15 months from the date of issue of this Statement addressing the 12 month period from the date of issue of this Statement and then annually from the date of submission of the first compliance assessment report. The compliance assessment report shall:
(1) be endorsed by the proponent’s Chief Executive Officer or a person delegated to sign on the Chief Executive Officer’s behalf;
(2) include a statement as to whether the proponent has complied with the conditions;
(3) identify all potential non-compliances and describe corrective and preventative actions taken;
(4) be made publicly available in accordance with the approved compliance assessment plan; and
(5) indicate any proposed changes to the compliance assessment plan required by Condition 4-1.
Prepare and submit CAR to CEO annually
Annual Compliance Assessment Reports
Overall 15 months from date statement issued

MPA Fish Farms Pty Ltd. – Annual Environmental Compliance Report 2015
7 | P a g e
Audit Code
Subject Requirement How Evidence Phase Timeframe Status Further Information
966:M5.1
Public Availability of Data
Subject to Condition 5-2, within a reasonable time period approved by the CEO of the issue of this Statement and for the remainder of the life of the Proposal, the proponent shall make publicly available, in a manner approved by the CEO, all validated environmental data (including sampling design, sampling methodologies, empirical data and derived information products (e.g. maps)) relevant to the assessment of this Proposal and implementation of this Statement.
Make data publically available
Annual CARs posted on MPA website, and available by directly contacting MPA
Overall Within a reasonable time period approved by the CEO
966:M5.2
Public Availability of Data
If any data referred to in Condition 5-1 contains particulars of:
(1) a secret formula or process; or (2) confidential commercially sensitive
information; the proponent may submit a request for approval from the CEO to not make these data publically available. In making such a request the proponent shall provide the CEO with an explanation and reasons why the data should not be made publically available.
Submit request to CEO
Submitted request to CEO with explanation
Overall As required
966:M6.1
Benthic Communities and Marine Environmental Quality
The proponent shall ensure that implementation of the Proposal causes no irreversible loss of benthic communities and achieves the levels of ecological protection for each of the ecological protection areas as specified in Table 1 of Schedule 3 and referred to in the Kimberley Aquaculture Development Zone Environmental Monitoring and Management Plan (Version 1, January 2014), or its revisions as approved by the CEO.
Assess health of environment by assessing compliance in accordance with KADZ EMMP
Compliance Assessment Report
Overall Annually

MPA Fish Farms Pty Ltd. – Annual Environmental Compliance Report 2015
8 | P a g e
Audit Code
Subject Requirement How Evidence Phase Timeframe Status Further Information
966:M6.2
Benthic Communities and Marine Environmental Quality
The proponent shall implement the Kimberley Aquaculture Development Zone Environmental Monitoring and Management Plan (Version 1, January 2014), or its revisions as approved by the CEO, and continue implementation until otherwise agreed by the CEO.
Implement EMMP
Compliance Assessment Report
Overall Annually
966:M6.3
Benthic Communities and Marine Environmental Quality
In the event that monitoring required by the Kimberley Aquaculture Development Zone Environmental Monitoring and Management Plan (Version 1, January 2014), or its revisions as approved by the CEO, indicates the levels of ecological protection as specified in Table 1 of Schedule 3, environmental quality guidelines or environmental quality standards as specified in the Kimberley Aquaculture Development Zone Environmental Monitoring and Management Plan (Version 1, January 2014), or its revisions as approved by the CEO, are not being met, the proponent shall: (1) report such findings to the CEO within two working
days of the exceedance(s) being identified; (2) investigate to determine the likely cause(s) of the
exceedance(s) of the criteria defined in the Kimberley Aquaculture Development Zone Environmental Monitoring and Management Plan (Version 1, January 2014), or its revisions as approved by the CEO;
(3) if the exceedance(s) is determined by the CEO to be a result of implementation of the Proposal, the proponent shall immediately implement the mitigation measures identified in the Kimberley Aquaculture Development Zone Environmental Monitoring and Management Plan (Version 1, January 2014), or its revisions as approved by the CEO; and
(4) continue implementing the mitigation measures required by Condition 6-3(3) until the criteria defined in the Kimberley Aquaculture Development Zone Environmental Monitoring and Management Plan (Version 1, January 2014), or its revisions as approved by the CEO, are no longer being exceeded, or until advised otherwise by the CEO.
Notify the CEO within two working days Investigate the likely cause of exceedance Implement mitigation measures if determined necessary Continue implementing as required
Notification to CEO
Overall Within two working days of exceedance(s) being identified

MPA Fish Farms Pty Ltd. – Annual Environmental Compliance Report 2015
9 | P a g e
Audit Code
Subject Requirement How Evidence Phase Timeframe Status Further Information
966:M6.4
Benthic Communities and Marine Environmental Quality
The proponent shall submit to the CEO and the Department of Fisheries annual compliance assessment reports in accordance with Condition 4-6 and which includes:
(1) the monitoring results required by the Kimberley Aquaculture Development Zone Environmental Monitoring and Management Plan (Version 1, January 2014), or subsequent approved revisions, under Condition 6-1;
(2) an assessment of the effectiveness of the management and contingency measures implemented to ensure compliance with the requirements of Conditions 6-1 and 6-2; and
(3) evidence that the Moderate Ecological Protection Area defined in Table 1 of Schedule 3 comprises no more than 33 per cent of the proponent’s Aquaculture Lease Area.
Submit CAR to CEO
Compliance Assessment Report
Overall Annually

MPA Fish Farms Pty Ltd. – Annual Environmental Compliance Report 2015
10 | P a g e
6. Annual Environmental Report
Cone Bay Ocean Cage Aquaculture Annual Environmental Report 2014/15
MPA Fish Farms Pty Ltd. PO Box 1008 West Perth WA 6872 Contact: Desiree Allen Phone: (08) 9381 4483

MPA Fish Farms Pty Ltd. – Annual Environmental Compliance Report 2015
11 | P a g e
Table of Contents
1. Introduction ...................................................................................................................................................... 13
2. Site Location ..................................................................................................................................................... 13
3. Hydrology.......................................................................................................................................................... 14
4. Environmental Monitoring Program ................................................................................................................. 15
4.1 Introduction…………………………………………………………………………………………………………………………….....15
4.2 Monitoring Against Trigger Values……………………………………………………………………………………………...15
4.3 References and Compliance Sample Sites……………………………………………………………………………….…..16
4.4 Results and Discussion…………………………………………………………………………………………..………17
4.4.1 Water Analysis…………………………………………………………………………………………………………….17
4.4.2 Sediment Analysis……………………………………………………………………………………………………….21
5. References ........................................................................................................................................................ 32 List of Figures Figure 4.1 Cone Bay location, Yampi Sound, Western Australia. 13
Figure 4.2 Location of boundary points of aquaculture licence number 1465, Cone Bay. 14
Figure 4.3 Reference and Compliance Sample sites 16
Figure 4.4 Total Suspended Solids Loss On Ignition – monthly median 17
Figure 4.5 Total Suspended Solids Loss On Ignition – sample site median 18
Figure 4.6 Total Suspended Solids Loss On Ignition – 2013-14 results 18
Figure 4.7 Dissolved Oxygen - monthly median 19
Figure 4.8 Dissolved Oxygen – sample site median 19
Figure 4.9 Chlorophyll-a – monthly median 20
Figure 4.10 Chlorophyll-a – sample site median 20
Figure 4.11 Dissolved Inorganic Nitrogen – monthly median 21
Figure 4.12 Dissolved Inorganic Nitrogen – sample site median 21
Figure 4.13 Total Phosphorous – monthly median 22
Figure 4.14 Total Phosphorous – site sample median 22
Figure 4.15 Total Organic Carbon – monthly median 23
Figure 4.16 Total Organic Carbon – 2013-14 results for comparison 24
Figure 4.17 Total Organic Carbon – sample site median 24
Figure 4.18 Total Organic Carbon – 2013-14 and 2014-15 comparison 24
Figure 4.19 Total Organic Carbon –DoF 25

MPA Fish Farms Pty Ltd. – Annual Environmental Compliance Report 2015
12 | P a g e
Figure 4.20 Copper Mepa Dry Season 25
Figure 4.21 Copper Mepa Wet Season 26
Figure 4.22 Copper Hepa Dry Season 26
Figure 4.23 Copper Hepa Wet Season 26
Figure 4.24 Copper MaxEpa Dry Season 27
Figure 4.25 Copper MaxEpa Wet Season 27
Figure 4.26 Zinc Mepa Dry Season 27
Figure 4.27 Zinc Mepa Wet Season 28
Figure 4.28 Zinc Hepa Dry Season 28
Figure 4.29 Zinc Hepa Wet Season 28
Figure 4.30 Zinc MaxEpa Dry Season 29
Figure 4.31 Zinc MaxEpa Wet Season 29
Figure 4.32 Cadmium Mepa Dry Season 29
Figure 4.33 Cadmium Mepa Wet Season 30
Figure 4.34 Cadmium Hepa Dry Season 30
Figure 4.35 Cadmium Hepa Wet Season 30
Figure 4.36 Cadmium MaxEpa Dry Season 31
Figure 4.37 Cadmium MaxEpa Wet Season 31
Figure Key (4.1 – 4.37):
M = sample month (1-4) within each of the 2 seasons
S = sample site (1-5) within each of the 2 seasons
Median 4 month* = the median value of each season’s sampling
EQG = environmental quality guideline for the particular parameter measured

MPA Fish Farms Pty Ltd. – Annual Environmental Compliance Report 2015
13 | P a g e
1. INTRODUCTION
MPA Fish Farms Pty Ltd. (MPAFF) is a small company incorporated in 2003 and is a wholly owned subsidiary of
Marine Produce Australia Ltd. MPAFF operate a sea cage marine farm in Cone Bay, Western Australia (under
Department of Fisheries Licence No. 1465) which is currently utilised for the production of Barramundi (Lates
calcarifer).
This report has been prepared by MPAFF to comply with licence conditions. It contains monitoring data
obtained as specified in the Ministerial Statement 966, and Kimberley Aquaculture Development Zone
Environmental Monitoring & Management Plan (KADZ – EMMP) approved in January 2014. In addition the
report provides an explanation of the monitoring results with respect to the EQG and EQS limits, and any
environmental impacts of the project.
2. SITE LOCATION
The existing aquaculture site (Licence no. 1465) is approximately 700 hectares and is located in Cone Bay,
Yampi Sound, Western Australia (see Figure 4.1). Cone Bay is located approximately 215 km NNE of Broome in
the north-west of Western Australia. The bay is approximately 20 km long and 6.5 km wide near its west-facing
opening and fringed by sandstone cliffs on the northern and southern sides. The aquaculture site is situated in
the southern section of the bay and encompasses Turtle Island where infrastructure exists for aquaculture
activities. Figure 4.2 represents Licence No. 1465 and the boundary coordinates which are stated in Datum
GDA94 (approximates WGS84) and are as follows:
Point Latitude Longitude A 16° 27.9388´S 123° 29.3366´E B 16° 29.6918´S 123° 32.8253´E C 16° 30.1729´S 123° 32.5657´E D 16° 28.4194´S 123° 29.0771´E
Figure 4.1 Cone Bay location, Yampi Sound, Western Australia.
MPA Fish Farms Pty Ltd. – Annual Environmental Compliance Report 2015
14 | P a g e
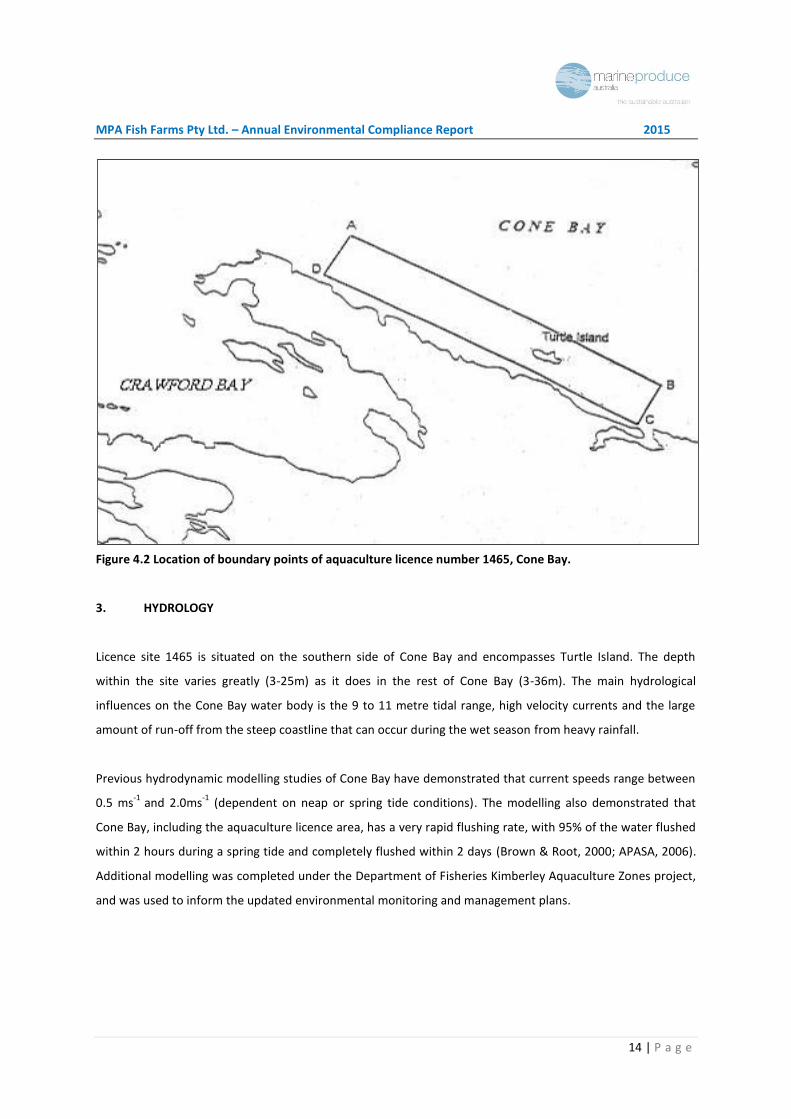
Figure 4.2 Location of boundary points of aquaculture licence number 1465, Cone Bay.
3. HYDROLOGY
Licence site 1465 is situated on the southern side of Cone Bay and encompasses Turtle Island. The depth
within the site varies greatly (3-25m) as it does in the rest of Cone Bay (3-36m). The main hydrological
influences on the Cone Bay water body is the 9 to 11 metre tidal range, high velocity currents and the large
amount of run-off from the steep coastline that can occur during the wet season from heavy rainfall.
Previous hydrodynamic modelling studies of Cone Bay have demonstrated that current speeds range between
0.5 ms-1
and 2.0ms-1
(dependent on neap or spring tide conditions). The modelling also demonstrated that
Cone Bay, including the aquaculture licence area, has a very rapid flushing rate, with 95% of the water flushed
within 2 hours during a spring tide and completely flushed within 2 days (Brown & Root, 2000; APASA, 2006).
Additional modelling was completed under the Department of Fisheries Kimberley Aquaculture Zones project,
and was used to inform the updated environmental monitoring and management plans.

MPA Fish Farms Pty Ltd. – Annual Environmental Compliance Report 2015
15 | P a g e
4. ENVIRONMENTAL MONITORING AND MANAGEMENT PLAN (EMMP)
4.1 Introduction
The Kimberley Aquaculture Development Zone Environmental Monitoring & Management Plan (KADZ - EMMP)
relates to the proposal by MPAFF to culture Barramundi (Lates calcarifer) in Cone Bay, Western Australia. The
objective of the KADZ- EMMP is to ensure the proposal is managed to achieve the relevant Environmental
Values (EV) and Environmental Quality Objectives (EQO), as outlined by the Government of Western Australia
(2003, 2004) and the EPA (2000, 2005a, 2005b). By implementing the KADZ - EMMP, the proposal will be
managed to ensure the marine environment is protected and that any adverse effects (should they arise at all)
are rapidly detected. To that end, MPAFF has committed to an extensive program of environmental
monitoring.
4.2 Monitoring Against Trigger Values
To evaluate any potential impact the farming operation may have on the marine environment, indicative
(water and benthic) variables have been measured and compared to trigger values also known as
Environmental Quality Guidelines (EQG). The indicative variables for water and benthic quality provide early
warning of possible impacts. For the KADZ - EMMP, EQG have been developed according to the approach
defined in EPA (2005a) such that exceedance of an EQG is a ‘trigger’ for further investigation against the
corresponding interim EQS. Interim EQS have been developed according to the risk based approach also
defined in EPA (2005a). If an EQS is exceeded, it is considered that there is a potential risk that the associated
EQO has not been achieved, investigation of the cause is needed and an adaptive management response is
triggered if the exceedance continues. These EQG values are not absolute, and are meant to be informed by
the local results and re-evaluated after two years’ of monitoring under the current EMMP.
The percentile based calculations specified in the KADZ - EMMP work under the premise that the median of
the compliance site measurements must lie between a specified percentile of the natural distribution of the
reference sites for a biological parameter where:
A median is the middle value of a sequence of numbers. Half the values are numerically smaller and
half are numerically larger (also known as the 50th
percentile); and
A percentile is the division of a frequency distribution of data into one hundredths. The pth
percentile
of a distribution of data is the value that is greater than or equal to the p% of all values of the
distribution. For example, the 80th
percentile is greater than or equal to 80% of all values or 80% of all
values are less than or equal to the 80th
percentile.
As per the KADZ - EMMP, monitoring against the EQG will proceed on an annual basis. Monitoring associated
with the EQS will proceed only upon exceedance of the EQG.

MPA Fish Farms Pty Ltd. – Annual Environmental Compliance Report 2015
16 | P a g e
4.3 Reference and compliance sample sites
The Cone Bay site experiences two major climatic cycles: the November-March ‘wet’ season and the April-
October ‘dry’ season. The winter dry season is characterised by extended periods of dry sunny weather, while
the summer wet season is characterised by frequent rain and periodic cyclone events. Water and sediment
quality sampling was conducted once per month for four months in each of the dry (June – September) and
the wet (December – March) seasons.
On each of the 8 (4 wet, 4 dry) sampling occasions, water and sediment samples were collected at 13
compliance sites (5 sites at the Mepa, and 4 sites in both the Hepa and MaxEpa) and 5 reference sites. Mepa
site samples were collected along a drogue transect on the incoming tide at 0-200m from a single cage. The
reference sites assigned for this current EMMP are different from those in MPA's previous EMMPs. The current
sites were chosen due to their relative centrality to the entire 2,000 hectare zone: unfortunately, as the DoF
samples have previously shown, there can be a gradient of sediment and water quality measurements from
the west to east of bay due to different depths, currents and sediment grain size. This is a problem in that the
central bay reference samples are producing results inconsistent with the results in the eastern reference
samples, and also the MPA Hepa and MaxEpa sites. This is something we would like considered carefully in
relation to our current results, and would like to discuss with the OEPA.
Figure 4.3 Reference and compliance sample sites

MPA Fish Farms Pty Ltd. – Annual Environmental Compliance Report 2015
17 | P a g e
4.4 Results and Discussion
4.4.1 Water Analysis
The objective of the water quality monitoring component is to assess whether the EQG have been met in each
of the Moderate (Mepa), High (Hepa) and Maximum (MaxEpa) Ecological Protection Areas. The water quality
EQG are designed to provide information on the potential for increased shading or smothering, increased
phytoplankton or algal growth, and increased water toxicity, that may potentially result from fish farm activity.
In accordance with MPAFF’s EMMP, the water quality monitoring program will measure the following water
quality parameters: Total Suspended Solids - Loss on Ignition (TSS LOI), Dissolved Oxygen, Chlorophyll-a and
Dissolved Inorganic Nitrogen (DIN).
Total Suspended Solids (LOI)
The level of total suspended solids in the water samples were within the EQG levels at all three compliance
monitoring sites, on all sample occasions. The variation seen in TSS (LOI) measures was spread across all
sample sites, with a random variation across sites and months. There is no evidence of increased TSS (LOI) in
the vicinity of the ocean cages. The tides and rain cause a large variation in results in the wet season. The Hepa
and MaxEpa sites are located in shallower water near creek, while the reference sites are in the open part of
the bay. Please note the July 2014 TSS (LOI) samples were lost in transit and are therefore not included in the
results.
Figure 4.4 TSS (LOI) EQG percentiles, and monthly compliance site median values

MPA Fish Farms Pty Ltd. – Annual Environmental Compliance Report 2015
18 | P a g e
Figure 4.5 TSS (LOI) EQG percentiles, and sample site median values For comparison the TSS (LOI) results from 2013-14 are below in Figure 4.6. The TSS (LOI) values in the Hepa
and MaxEpa zones for 2013-14 are similar to the 2014-15 results; however the EQG percentiles for 2014-15
are lower than the 2013-14 percentiles.
Figure 4.6 2013-2014 TSS (LOI) results for comparison
MPA Fish Farms Pty Ltd. – Annual Environmental Compliance Report 2015
19 | P a g e
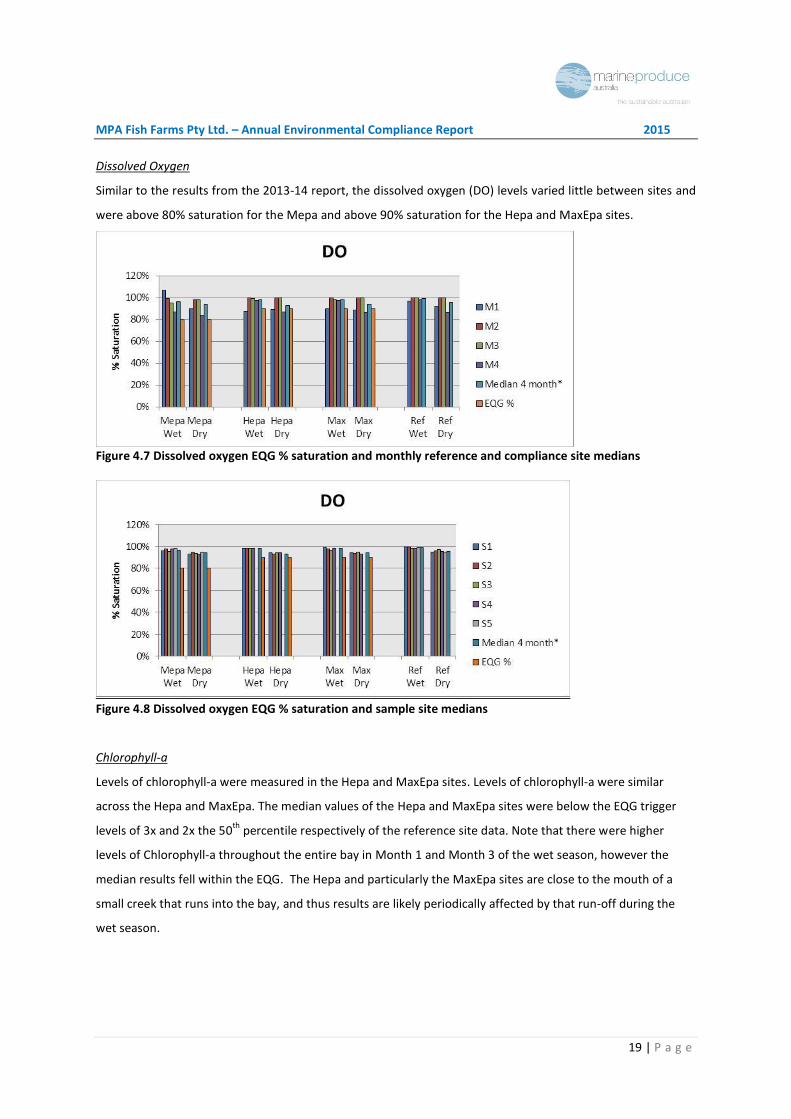
Dissolved Oxygen
Similar to the results from the 2013-14 report, the dissolved oxygen (DO) levels varied little between sites and
were above 80% saturation for the Mepa and above 90% saturation for the Hepa and MaxEpa sites.
Figure 4.7 Dissolved oxygen EQG % saturation and monthly reference and compliance site medians
Figure 4.8 Dissolved oxygen EQG % saturation and sample site medians Chlorophyll-a
Levels of chlorophyll-a were measured in the Hepa and MaxEpa sites. Levels of chlorophyll-a were similar
across the Hepa and MaxEpa. The median values of the Hepa and MaxEpa sites were below the EQG trigger
levels of 3x and 2x the 50th
percentile respectively of the reference site data. Note that there were higher
levels of Chlorophyll-a throughout the entire bay in Month 1 and Month 3 of the wet season, however the
median results fell within the EQG. The Hepa and particularly the MaxEpa sites are close to the mouth of a
small creek that runs into the bay, and thus results are likely periodically affected by that run-off during the
wet season.
MPA Fish Farms Pty Ltd. – Annual Environmental Compliance Report 2015
20 | P a g e
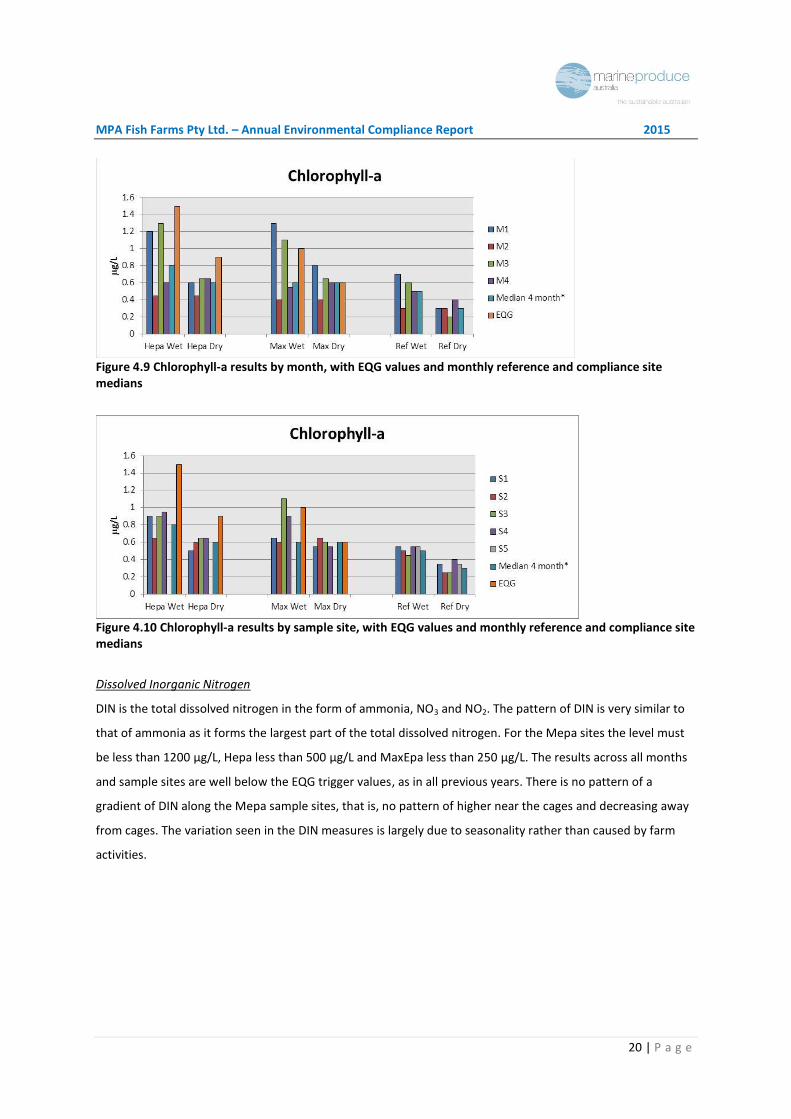
Figure 4.9 Chlorophyll-a results by month, with EQG values and monthly reference and compliance site medians
Figure 4.10 Chlorophyll-a results by sample site, with EQG values and monthly reference and compliance site medians
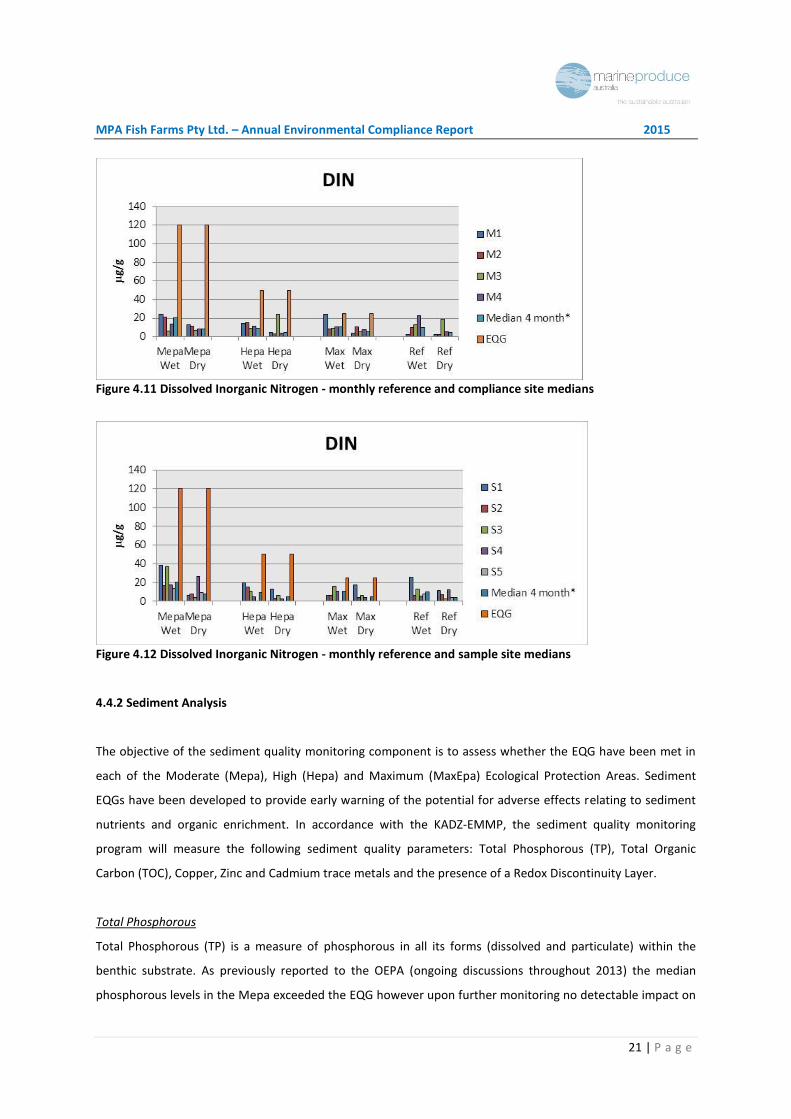
Dissolved Inorganic Nitrogen
DIN is the total dissolved nitrogen in the form of ammonia, NO3 and NO2. The pattern of DIN is very similar to
that of ammonia as it forms the largest part of the total dissolved nitrogen. For the Mepa sites the level must
be less than 1200 µg/L, Hepa less than 500 µg/L and MaxEpa less than 250 µg/L. The results across all months
and sample sites are well below the EQG trigger values, as in all previous years. There is no pattern of a
gradient of DIN along the Mepa sample sites, that is, no pattern of higher near the cages and decreasing away
from cages. The variation seen in the DIN measures is largely due to seasonality rather than caused by farm
activities.
MPA Fish Farms Pty Ltd. – Annual Environmental Compliance Report 2015
21 | P a g e
Figure 4.11 Dissolved Inorganic Nitrogen - monthly reference and compliance site medians
Figure 4.12 Dissolved Inorganic Nitrogen - monthly reference and sample site medians 4.4.2 Sediment Analysis
The objective of the sediment quality monitoring component is to assess whether the EQG have been met in
each of the Moderate (Mepa), High (Hepa) and Maximum (MaxEpa) Ecological Protection Areas. Sediment
EQGs have been developed to provide early warning of the potential for adverse effects relating to sediment
nutrients and organic enrichment. In accordance with the KADZ-EMMP, the sediment quality monitoring
program will measure the following sediment quality parameters: Total Phosphorous (TP), Total Organic
Carbon (TOC), Copper, Zinc and Cadmium trace metals and the presence of a Redox Discontinuity Layer.
Total Phosphorous
Total Phosphorous (TP) is a measure of phosphorous in all its forms (dissolved and particulate) within the
benthic substrate. As previously reported to the OEPA (ongoing discussions throughout 2013) the median
phosphorous levels in the Mepa exceeded the EQG however upon further monitoring no detectable impact on

MPA Fish Farms Pty Ltd. – Annual Environmental Compliance Report 2015
22 | P a g e
infauna or sediment condition was found. In 2014-15 the median phosphorous level in the Mepa was about
0.4mg/g lower than the EQG during the wet season, and about 0.03mg/g higher than the EQG for the dry
season, thus the latter was marginally but not significantly higher than the EQG.
As we have previously submitted, the Shaanning Pollution Index of sediment (Carroll et al, 2003) considers a
phosphorous concentration of <0.5mg/g higher than background to represent no deviation from background,
and a concentration between 0.5-2mg/g higher than background as representing a small deviation from
background.
Figure 4.13 Sediment Total Phosphorous EQG percentile and monthly compliance site medians
Figure 4.14 Sediment Total Phosphorous EQG percentile and sample site medians
The site specific medians show that there is a slight gradient of phosphorus within the Mepa sites, with levels
slightly higher nearer to the cages (ignoring the single spike in the dry season). However, the phosphorus levels
relative to background are still so low as to be considered as not varying from background. In addition, this
pattern dissipates very quickly, and clearly has no impact at the further distance of the Hepa and MaxEpa sites.

MPA Fish Farms Pty Ltd. – Annual Environmental Compliance Report 2015
23 | P a g e
There were a couple of anomalous 'spikes' in the phosphorous measures, specifically the Mepa sites in July
2014, and Reference site 2 in both December 2014 and January 2015. The Mepa spike I believe was likely a
direct result of overfeeding by new farm management (a situation that has been resolved by a further
management change), while the reference site spikes were likely a result of natural variation in the bay, and
unrelated to the fish farm.
Total Organic Carbon
Similar to last year’s results, the level of total organic carbon (TOC) in the sediment was significantly lower at
the Mepa sample sites than at the Hepa and MaxEpa sites and sit well below the Mepa EQG for the wet and
dry seasons. The average TOC levels across all sites are actually lower than levels in 2013/14. Despite this, the
TOC medians for the Hepa and MaxEpa exceed their respective EQG percentiles which are based on the
reference site results. However it is important to note that the reference site locations have changed since last
year, with only one site, R1, located in the same vicinity as the previous reference sites, and in the area is of a
similar depth, current speed, and location relative to the small creeks that feed into the bay. Three of the 5
new reference sites are located in the middle/west of the bay - an area with a different sediment grain size
and generally less influenced by inputs from the creeks. This was discussed in the DoF monitoring work
prepared for the KADZ, where it was shown that there is a naturally occurring gradient of TOC levels increasing
from west to the east end of the bay. Refer to Figure 4.19, data collected by the DoF. Given that all TOC levels
are lower in this sample year than previous years, and that there is no increase in TOC around the farm cage
areas, we submit that exceeding of EQG in the Hepa and MaxEpa are simply a consequence of natural variation
in the bay (sample sites relative to reference sites) and unrelated to the fish farming activities. We suggest that
the choice of reference sites may need to be refined further such that monitoring against appropriate
background levels (for different areas of the bay) can occur.
Figure 4.15 Sediment Total Organic Carbon EQG percentile and monthly compliance site medians

MPA Fish Farms Pty Ltd. – Annual Environmental Compliance Report 2015
24 | P a g e
Figure 4.16 2013-14 TOC EQG percentile and sample site medians for comparison
Figure 4.17 Sediment Total Organic Carbon EQG percentile and sample site medians
2013-14 Medians
2014-15 Medians
Mepa Wet 0.6 0.35
Mepa Dry 0.4 0.4
Hepa Wet 0.8 0.6
Hepa Dry 0.75 0.6
Max Wet 0.8 0.55
Max Dry 0.75 0.5
Figure 4.18 Comparison 2013-14 and 2014-15 TOC 4 Month Medians
MPA Fish Farms Pty Ltd. – Annual Environmental Compliance Report 2015
25 | P a g e
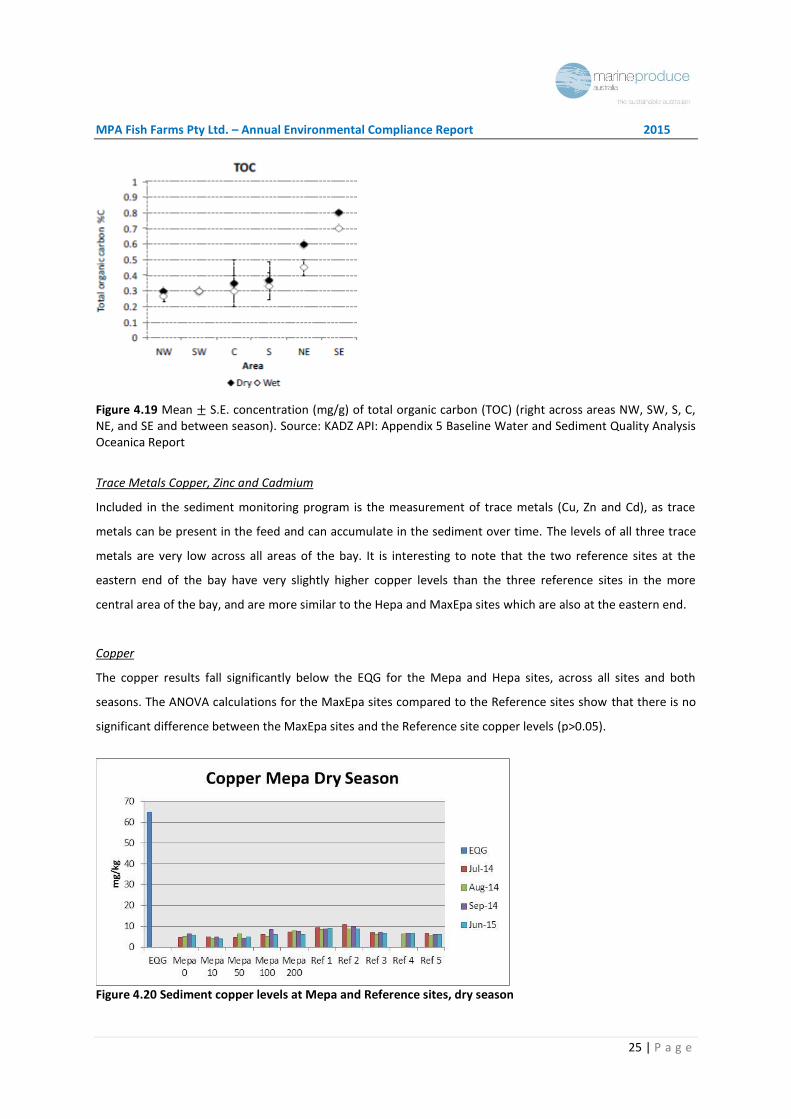
Figure 4.19 Mean ± S.E. concentration (mg/g) of total organic carbon (TOC) (right across areas NW, SW, S, C, NE, and SE and between season). Source: KADZ API: Appendix 5 Baseline Water and Sediment Quality Analysis Oceanica Report
Trace Metals Copper, Zinc and Cadmium
Included in the sediment monitoring program is the measurement of trace metals (Cu, Zn and Cd), as trace
metals can be present in the feed and can accumulate in the sediment over time. The levels of all three trace
metals are very low across all areas of the bay. It is interesting to note that the two reference sites at the
eastern end of the bay have very slightly higher copper levels than the three reference sites in the more
central area of the bay, and are more similar to the Hepa and MaxEpa sites which are also at the eastern end.
Copper
The copper results fall significantly below the EQG for the Mepa and Hepa sites, across all sites and both
seasons. The ANOVA calculations for the MaxEpa sites compared to the Reference sites show that there is no
significant difference between the MaxEpa sites and the Reference site copper levels (p>0.05).
Figure 4.20 Sediment copper levels at Mepa and Reference sites, dry season

MPA Fish Farms Pty Ltd. – Annual Environmental Compliance Report 2015
26 | P a g e
Figure 4.21 Sediment copper levels at Mepa and Reference sites, wet season
Figure 4.22 Sediment copper levels at Hepa and Reference sites, dry season
Figure 4.23 Sediment copper levels at Hepa and Reference sites, wet season

MPA Fish Farms Pty Ltd. – Annual Environmental Compliance Report 2015
27 | P a g e
Figure 4.24 MaxEpa Dry Season - Sediment copper levels in each sample month
Figure 4.25 MaxEpa Wet Season - Sediment copper levels in each sample month Zinc
The Zinc results fall significantly below their EQG for the Mepa and Hepa sites, across all sites and both
seasons. The ANOVA calculations for the MaxEpa sites compared to the Reference sites show that there is no
significant difference between the MaxEpa sites and the Reference site zinc levels (p>0.05).
Figure 4.26 Sediment zinc levels at Mepa and Reference sites, dry season

MPA Fish Farms Pty Ltd. – Annual Environmental Compliance Report 2015
28 | P a g e
Figure 4.27 Sediment zinc levels at Mepa and Reference sites, wet season
Figure 4.28 Sediment zinc levels at Hepa and Reference sites, dry season
Figure 4.29 Sediment zinc levels at Hepa and Reference sites, wet season

MPA Fish Farms Pty Ltd. – Annual Environmental Compliance Report 2015
29 | P a g e
Figure 4.30 MaxEpa Dry Season - Sediment zinc levels in each sample month
Figure 4.31 MaxEpa Wet Season - Sediment zinc levels in each sample month
Cadmium
The Cadmium results fall significantly below their EQG for the Mepa and Hepa sites, across all sites and both
seasons. The ANOVA calculations for the MaxEpa sites compared to the Reference sites show that there is no
significant difference between the MaxEpa sites and the Reference site cadmium levels (p>0.05).
Figure 4.32 Sediment cadmium levels at Mepa and Reference sites, dry season

MPA Fish Farms Pty Ltd. – Annual Environmental Compliance Report 2015
30 | P a g e
Figure 4.33 Sediment cadmium levels at Mepa and Reference sites, wet season
Figure 4.34 Sediment cadmium levels at Hepa and Reference sites, dry season
Figure 4.35 Sediment cadmium levels at Hepa and Reference sites, wet season

MPA Fish Farms Pty Ltd. – Annual Environmental Compliance Report 2015
31 | P a g e
Figure 4.36 MaxEpa Dry Season - Sediment cadmium levels in each sample month
Figure 4.37 MaxEpa Wet Season - Sediment cadmium levels in each sample month Core Characteristics and Redox Layer
The redox potential is driven by the dissolved oxygen concentration and the presence of organic matter. The
decomposition of organic matter utilises dissolved oxygen and lowers redox potential: the transition layer
between oxygen-rich and oxygen-poor layers is called the redox discontinuity layer. No redox discontinuity
layer was detected in any of the cores taken at any of the compliance and reference sites. In fact no redox
layer has ever been detected in any of the core samples taken in MPA's monitoring programs, which is not
surprising given the high level of water movement and mixing that naturally occurs in Cone Bay.
Written descriptions of the cores included core length, sediment colour and stratification, visible animal or
plant matter, presence of gas vesicles, and any sediment odour indicating hydrogen sulphide. Over the 8
months sampled, core lengths ranged from 15-55cm. In all locations and cores the colour was generally grey to
dark grey, with very occasional darker blackish streaks (mostly at Hepa sites). Shell grit was seen randomly in
both compliance and reference sites.

MPA Fish Farms Pty Ltd. – Annual Environmental Compliance Report 2015
32 | P a g e
5. References
Asia-Pacific Applied Science Associates; 2006; A Numerical Modelling Study of the Proposed Increase in Barramundi Production in Cone Bay, Western Australia; Prepared for: Maxima Pearling Company Pty Ltd.
Brown and Root Services Asia Pacific Pty Ltd; 2000; Hydrodynamic and Ecological Studies in Cone Bay; Western Australia; Prepared for: Maxima Pearling Company Pty Ltd.
Carroll, M.L, Cochrane, S., Fieler, R., Velvin, R. and White, P. 2003. Organic enrichment of sediments from salmon farming in Norway: Environmental factors, management practices and monitoring techniques. Aquaculture 226: 165-180
Environmental Protection Authority (EPA), 2000, Perth’s Coastal Water: Environmental Values and Objectives, Perth, Western Australia.
Environmental Protection Authority (EPA), 2005a, Environmental Quality Criteria Reference Document for Cockburn Sound (2003-2004) - A supporting document to the State Environmental (Cockburn Sound) Policy 2005, Report no. 20, Perth, Western Australia.
Environmental Protection Authority (EPA), 2005b, Manual of Standard Operating Procedures – For Environmental Monitoring against the Cockburn Sound Environmental Quality Criteria (2003-2004) - A supporting document to the State Environmental (Cockburn Sound) Policy 2005, Report no. 20, Perth, Western Australia.
Government of Western Australia, 2003, Hope for the future, The Western Australian State Sustainability Strategy, Department of Premier and Cabinet, Perth.
Government of Western Australia, 2004, State Water Quality Management Strategy No. 6; Implementation Framework for the Australian and New Zealand Guidelines for Fresh and Marine Water Quality and Quality Monitoring and Reporting (Guidelines No’s 4 & 7: National Water Quality Management Strategy). Prepared by Government of Western Australia, Report no. SWQ 6, Perth, Western Australia