Embed Size (px)
Citation preview

AN N UAL E F F I C I E N CY R E PO RT
November 2009

Contents Page
EXECUTIVE SUMMARY . . . . . . . . . . . . . . . . . . . . . . . . . . . . . . . . . . . . . . . . . . . . . . . . . . . . . . . . . . . . . . . . . . . . . . . . . . . . . . . . . . . . . . . . . . . . . . . . . . . . . . . 1 1
CUSTOMER SERVICE A N D WATER QUALITy . . . . . . . . . . . . . . . . . . . . . . . . . . . . . . . . . . . . . . . . . . . . . . . . . . . . . . . . . . . . . . . . . . . . . . . . . . . . . . . . . . . . 1 1 1
SYSTEM PERFORMANCE . . . . . . . . . . . . . . . . . . • . • • • • • . . . . . . . . . . . . . . . . . . . . . . . . • . . . . . . . . . . . . . . . . . . . . . . . . . . . . . . . . . • • • . . . . . . . . . . . . . . . . . . . . . . . I V
SUSTAINABLE FUTURE . . . . . . . . . . . . . . . . . . . . . . . . . . . . . . . . . . . . . . . . . . . . . . . . . . . . . . . . . . . . . . . . . . . . . . . . . . . . . . . . . . . . . . . . . . . . . . . . . . . . . . . . . . . . . . . . IV
COM MERCIAL SUCCESS . . . . . . . . . . . . . . . . . . . . . . . . . . . . . . . . . . . . . . . . . . . . . . . . . . . . . . . . . . . . . . . . . . . . . . . . . . . . . . . . . . . . . . . . . . . . . . . . . . . . . . . . . . . . . . . V
VALUE FOR MONEy . . . . . . . . . . . . . . . . . . . . . . . . . . . . . . . . . . . . . . . . . . . . . . . . . . . . . . . . . . . . . . . . . . . . . . . . . . . . . . . . . . . . . . . . . . . . . . . . . . . . . . . . . . . . . . . . . . VII
1. INTRODUCTION . . . . . . . . . . . . . . . . . . . . . . . . . . . . . . . . . . . . . . . . . . . . . . . . . . . . . . . . . . . . . . . . . . . . . . . . . . . . . . . . . . . . . . . . . . . . . . . . . . . . . . . . . 1
1.1 AIM . . . . . . . . . . . . . . . . . . . . . . . . . . . . . . . . . . . . . . . . . . . . . . . . . . . . . . . . . . . . . . . . . . . . . . . . . . . . . . . . . . . . . . . . . . . . . . . . . . . . . . . . . . . . . . . . . . . . . 1
1.2 SCOPE AND STRUCTURE . . . . . . . . . . . . . . . . . . . . . . . . . . . . . . . . . . . . . . . . . . . . . . . . . . . . . . . . . . . . . . . . . . . . . . . . . . . . . . . . . . . . . . 1
1.3 SOURCE DATA . . . . . . . . . . . . . . . . . . . . . . . . . . . . . . . . . . . . . . . . . . . . . . . . . . . . . . . . . . . . . . . . . . . . . . . . . . . . . . . . . . . . . . . . . . . . . . . . . . . . . 2
1.4 COMMERCIAL IN CONFIDENCE . . . . . . . . . . . . . . . . . . . . . . . . . . . . . . . . . . . . . . . . . . . . . . . . . . . . . . . . . . . . . . . . . . . . . . . . . . . . . 2
2 . CUSTOMER SERVICE AND WATER QUALITy . . . . . . . . . . . . . . . . . . . . . . . . . . . . . . . . . . . . . . . . . . . . . . . . . . . . . . . . . . . . . . . 3
2.1 CUSTOMER SERVICES . . . . . . . . . . . . . . . . . . . . . . . . . . . . . . . . . . . . . . . . . . . . . . . . . . . . . . . . . . . . . . . . . . . . . . . . . . . . . . . . . . . . . . . . . . 3
2.2 WATER QUALITy . . . . . . . . . . . . . . . . . . . . . . . . . . . . . . . . . . . . . . . . . . . . . . . . . . . . . . . . . . . . . . . . . . . . . . . . . . . . . . . . . . . . . . . . . . . . . . . . 10
3. SYSTEM PERFORMANCE . . . . . . . . . . . . . . . . . . . . . . . . . . . . . . . . . . . . . . . . . . . . . . . . . . . . . . . . . . . . . . . . . . . . . . . . . . . . . . . . . . . . . . . . . . 17
3.1 WATER SERViCES . . . . . . . . . . . . . . . . . . . . . . . . . . . . . . . . . . . . . . . . . . . . . . . . . . . . . . . . . . . . . . . . . . . . . . . . . . . . . . . . . . . . . . . . . . . . . . . 17
3.2 SEWER SERVICES . . . . . . . . . . . . . . . . . . . . . . . . . . . . . . . . . . . . . . . . . . . . . . . . . . . . . . . . . . . . . . . . . . . . . . . . . . . . . . . . . . . . . . . . . . . . . . . 21
4. SUSTAINABLE FUTURE . . . . . . . . . . . . . . . . . . . . . . . . . . . . . . . . . . . . . . . . . . . . . . . . . . . . . . . . . . . . . . . . . . . . . . . . . . . . . . . . . . . . . . . . . . . . . 27
4.1 WATER . . . . . . . . . . . . . . . . . . . . . . . . . . . . . . . . . . . . . . . . . . . . . . . . . . . . . . . . . . . . . . . . . . . . . . . . . . . . . . . . . . . . . . . . . . . . . . . . . . . . . . . . . . . . . . 27
4.2 SEWERAGE . . . . . . . . . . . . . . . . . . . . . . . . . . . . . . . . . . . . . . . . . . . . . . . . . . . . . . . . . . . . . . . . . . . . . . . . . . . . . . . . . . . . . . . . . . . . . . . . . . . . . . . . 31
5. COM MERCIAL SUCCESS . . . . . . . . . . . . . . . . . . . . . . . . . . . . . . . . . . . . . . . . . . . . . . . . . . . . . . . . . . . . . . . . . . . . . . . . . . . . . . . . . . . . . . . . . . . 45
5 .1 OPERATING COSTS . . . . . . . . . . . . . . . . . . . . . . . . . . . . . . . . . . . . . . . . . . . . . . . . . . . . . . . . . . . . . . . . . . . . . . . . . . . . . . . . . . . . . . . . . . . . 46
5.2 TOTAL COSTS . . . . . . . . . . . . . . . . . . . . . . . . . . . . . . . . . . . . . . . . . . . . . . . . . . . . . . . . . . . . . . . . . . . . . . . . . . . . . . . . . . . . . . . . . . . . . . . . . . . . . 64
5.3 CAPITAL EXPENDITURE . . . . . . . . . . . . . . . . . . . . . . . . . . . . . . . . . . . . . . . . . . . . . . . . . . . . . . . . . . . . . . . . . . . . . . . . . . . . . . . . . . . . . . 65
6. VALUE FOR MONEY . . . . . . . . . . . . . . . . . . . . . . . . . . . . . . . . . . . . . . . . . . . . . . . . . . . . . . . . . . . . . . . . . . . . . . . . . . . . . . . . . . . . . . . . . . . . . . . . . 81
6.1 I NTRODUCTION . . . . . . . . . . . . . . . . . . . . . . . . . . . . . . . . . . . . . . . . . . . . . . . . . . . . . . . . . . . . . . . . . . . .. . . . . . . . . . . . . . . . . . . . . . . . . . . . 81
6.2 CUSTOMER FEEDBACK . . . . . . . . . . . . . . . . . . . . . . . . . . . . . . . . . . . . . . . . . . . . . . . . . . . . . . . . . . . . . . . . . . . . . . . . . . . . . . . . . . . . . . 82
6.3 COMPARATIVE LEVELS OF SERVICE . . . . . . . . . . . . . . . . . . . . . . . . . . . . . . . . . . . . . . . . . . . . . . . . . . . . . . . . . . . . . . . . . . . . 84
6.4 COMPARATIVE LEVEL OF COSTS OF SERVICES AND CUSTOMER BILLS . . . . . . . . . . . . . . . . . . 86
6.5 CUSTOMER ASSIST PROGRAM . . . . . . . . . . . . . . . . . . . . . . . . . . . . . . . . . . . . . . . . . . . . . . . . . . . . . . . . . . . . . . . . . . . . . . . . . . . 88
EXECUTIVE S U M MARY
The Annual Efficiency Report is a key component of the Government's annua l determination of SA Water's water and wastewater prices. The Report aims to demonstrate that the
Corporation's activities a re undertaken efficiently and effectively with in the requ i rements of the legislative and operating envi ronment of the Corporation .
The pr incipa l legislative instru ment bearing on the Corporation's efficiency is the Publ ic
Corporations Act 1993 u nder which the SA Water Board is charged with the responsibi l ity to
'secure continu i ng improvements of performance' (section 14) . The Corporation's
operations a re a lso specifica l ly bound by the Waterworks Act 1932 a nd the Sewerage Act 1929 and their extensive sub-ord inate legis lation .
As a pub l i c corporation, SA Water through its Board, is d i rectly responsible to its M in ister, the M in ister for Water, for its operations and, as pa rt of the wider pub l ic sector, m ust
comply with the su ite of governance a nd accountabi l ity processes establ ished to assure the
com m un ity that pub l ic services a re p rovided appropriately and effic iently. Some of these inc lude the a n n ua l Parl ia mentary estimates and review process, the Parl iamentary
Com mittees (e.g. the Economic a nd F inance Committee, Publ ic Works Com mittee, the
Environment, Resources and Development Committee) and the independent investigative
and aud it processes of the South Austra l i an Auditor-Genera l .
I n addit ion to th i s legislative framework the Corporation i s a lso bound by a n a rray of operat iona l legis lative instruments, Federal, State and local , that d i rectly impact on the manner in which the Corporation provides its services. These inc lude the Federal
Environment P rotection and Biodiversity Conservation Act 1999, and Trade Practices Act 1974, and the South Austra l i an Environment P rotect ion Act 1991 .
I n add it ion to th is overlay of pub l i c accountab i l ity and scrutiny, in response to the reforms
a rising from the Nationa l Competition Pol icy of 1993, the u rban water industry in Austra l ia
had s ince 1995, publ ished a comprehensive annua l performance report, WSAAfacts. This
pub l ication, the most deta i led performance report of a ny industry sector in the nation,
presented i nformation a bout each participating water ut i l ity's performance i n a range of
customer service, system, water qua l ity, envi ronmental a nd financ ia l ind icators. S i nce
2004 - 05 this document has been subsumed by a l a rger performance report requ i red as
pa rt of the N at ional Water I n itiative. The Nationa l Performance Report (NPR ) now inc ludes a greater range of performance criteria and a lso encompasses the non-u rban water sector.
SA Water has actively participated in th is industry performance reporting.
Recognis ing the need to d rive the Corporation's operat ions in an hol istic and susta inable
manner, i n 2006 SA Water developed a set of strategic objectives and targets that guide the
decisions and p lann ing processes of the business: these a re incorporated into a Strategic M a p (SM) .
i i

The SM is bu i l t on five core p i l l a rs :
CD Customer Service and Water Qua l ity; CD System Performance; CD Susta i nable Future; CD People and Cu lture; a nd CD Commercial Success.
The SM is an active pa rt of the business's activities and ach ievement of the performance targets is reviewed on a monthly basis and reported to the Board. Each year a review is
conducted regard ing performance against each Strategic Key Performance Ind icator (KPI ) for the preced ing year. These reviews a re then conso l idated into a n Annua l SM KPI Review.
The review provides ana lysis concerning actua l performance, the accuracy of forecasting
during the year and what actions were taken or a re p lanned .
The Annual Efficiency Report inc ludes for the second year resu lts of th i s interna l performance reporting. This performance review is complemented by comparison
benchmarking of performance with a range of other water ut i l ities in both urban and non
urban a reas.
Due to the leve l of deta i l conta ined in the report, this Executive Summary is necessari ly confined to a high leve l summation of the performance with in the subheadings of the SM
structu re.
Customer Service and Water Quality SA Water del ivered a high level of service to both its metropol itan a nd regional customers in
2008-09, in relation to customer service ind icators. Regional service leve ls achieved in
2008-09 improved sign ificantly when compared with the levels achieved in 2007-08.
Water restrictions and a new rebates program led to unprecedented levels of customer
contact i n 2008-09. During this period, the Customer Contact Centre relocated to Victoria
Square a nd th is, combined with the increase of customer contacts, impacted on the Corporation meeting some of its interna l customer ta rgets.
Annua l customer su rvey resu lts reveal that, overa l l, customers a re very satisfied with the
levels of se rvices provided by the Corporation . SA Water is a im ing to fu rther improve its customer service targets by 2013-14.
SA Water is a lso del ivering a very high level of service to metropol itan and regiona l customers in water qua l ity as reflected in compl iance with the Austra l i an Dr inking Water G u ide l ines. This is despite the water qua l ity cha l lenges of genera l ly poor source water
qua l ity a nd the current dry c l imatic conditions.
The Corporation's performance in the metropol itan a rea relative to other water uti l ities has been strong in both microbiologica l compl iance and l im iting water qua l ity compla ints.
i i i

The regional performance i n m icrobiologica l comp l iance was strong relative to other water
ut i l it ies. Whya l l a reported a strong performance in l im iting water qua l ity compla ints, whi le
Mt Gambier reported a poor resu lt relative to previous years due to a change in source
water for a cou ple of months.
SA Water is a im ing to improve or mainta in these a l ready high levels of service. Due to
cu rrent c l imatic cond itions, SA Water wi l l i ncrease its focus on source water monitoring
which may increase costs in the short-term.
System Performance When bench marked aga inst other water ut i l ities for system performance SA Water is
ach ieving a high level of service in the provision of water services in the metropol itan a rea.
I n the regional a rea, the Corporation reported a high level of service i n Mt Gambier and
moderate leve l of service in Whya l l a .
Reporting i n several a reas is sti l l being fine-tuned, but as data qua l ity i mproves the
Corporation has strategies in p lace to improve system performance.
SA Water contin ues to monitor its performance i n sewer overflows and is seeking to fu rther
reduce overflows in the metropol itan a rea by 2013-14 whi le maintain ing its regional targets .
The Corporation reported a decrease in the number of sewer ma in breakes and chokes in
2007-08 compared with 2006-07, i n the metropol itan as wel l as regiona l a reas. The
metropo l itan leve l of performance was at the higher end of sewer ma in breaks and chokes,
when compared with other metropo l itan uti l ities. Both regions had exce l lent performance levels and were the top two performing regional uti l it ies for 2007-08.
Whi le SA Water's sewer assets a re experiencing an increasing trend in chokes due to d ry
cond itions, a batement programs as wel l as ta rgeted preventative ma intenance have been
put in p lace to manage the i mpact of these incidents on customers.
SA Water is seeking to reduce the impact of sewerage asset fa i l u res on customers by 2013-
14. To meet these objectives, the Corporation is increasing its sewer c lean ing and
p reventative maintenance p rograms i n an attempt to fu rther improve these service levels .
Sustainable Future The implementation of water restrictions has had a positive impact on reducing average
water consumption, with the 2007-08 resu lt showing a conti nued decrease in average
consumption . The Corporation is undertaking severa l i n itiatives to conti nue th is trend.
The Corporation has ma intained compl iance with its water l icences despite the sign ificant
cha l lenges presented by the cu rrent d rought conditions. Ma inta in ing compl iance imposes cost pressu res on SA Water in the form of investments in water security in itiatives.
iv

SA Water has genera l ly performed at a high leve l i n sewerage services. In particu lar, it has
conti nued as a nationa l leader i n recyc l ing water, and ma intained a strong performance in re-using b io-so l ids as wel l as sewerage treated to the tertiary leve l . Furthermore, the
Corporation has compl ied with al l Environment P rotection Agency ( EPA) l icence conditions
and has reduced the number of serious wastewater notifications to the EPA.
The Corporation wi l l continue to closely monitor the risks associated with overflows to the
environment where its performance is at the average of compared ut i l ities in the
metropol itan a rea .
Going forward SA Water is a im ing to improve wastewater service levels by increas ing the
percentage of wastewater recycled and reduc ing the n umber of Type 1 and Type 2 wastewater notifications to the EPA. Where performance is a l ready h igh, SA Water wi l l a im
to ma inta in service levels into the futu re.
For its metropol itan sector, SA Water's net greenhouse gas emissions in recent drought
years a re high compared to other ut i l it ies due to its e lectricity use caused by the need to pump water from the River M u rray. Up to 90% of Adela ide's water is supp l ied from the River M urray in drought years.
SA Water is seeking to reduce its greenhouse gas emissions going forward to comply with
the Kyoto Protocol ( 108% of 1990 leve ls by 2012) and several i n itiatives are being
implemented to enhance e lectricity efficiency as wel l as reduce the Corporation's
envi ronmental impact.
Commercial Success Water security cont inues to be the pr imary d river for sign ificant increases in operating costs
for the Corporation. Due to drought conditions SA Water has been pumping a round 90% of its annua l metropo l itan water supply from the River M u rray s ince 2006-07, as wel l as
enforcing continued water restrictions. I n the future water secur ity wi l l be provided by the
Adela ide Desa l ination P lant (ADP), a lthough this level of security wi l l come at a s ign ificant
cost, in particu lar the increased electricity costs associated with the energy intensive nature
of the desal i nation process.
The Corporation continued its high performance in regards to operating costs in com parison
to other entities with al l fou r business segments (metropolitan water supp ly, metropol itan
sewerage services, regiona l water su pply and regiona l sewerage services) reporting wel l below the weighted average for 2007-08. The Corporation's operating costs per property were low compared to the other major metropo l itan and regional water ut i l ities in Austra l i a . S ince 2003-04 costs have increased margina l ly, due mainly to the Environmental
Improvement Program that has del ivered significant improvements in environmental
com pl iance and performance.
v

The Corporation's operating cost per property for water su pply for 2007-08 decreased
marg ina l ly fol lowing a substantial i ncrease in 2006-07. The majority of the metropol itan
entit ies reported an increase in rea l operating cost per property for water supply in
2007-08, as ut i l ities worked to secure additiona l water suppl ies and manage customer demand i n the cu rrent d rought cond itions. Despite these cha l lenges, the Corporation's metropol itan operating cost per property was in the lower bounds of industry performance,
having the forth lowest operating cost per property for metropol itan water services. The
Corporation has red uced its e lectricity costs per k i lo l itre for major pumping and is undertaki ng focused work to actively improve e lectricity efficiency going forward.
Other cost pressu res relating to the c l imatic conditions have been incurred in mainta in ing
service levels and responsiveness to customers, ensuring water l icences are not exceeded
and p lann ing for future water security measures, inc lud ing the H20me Rebate Scheme and
enforcement of water restrictions.
The Corporation conti nued its high performance with respect to metropol itan sewerage
services, when compared to other entities, and had the lowest operating cost per property
i n 2007-08, a trend s ince 2002-03.
SA Water's regional operating cost per property for water services is second lowest of the
six companies compared for both 2006-07 and 2007-08. SA Water's operating costs per
property for regional water supply display a marg ina l i ncreasing trend s ince 2003-04 large ly
associated with severa l key regional water in it iatives which increased the amount of treated
water de l ivered to customers. An increase in operating costs in 2007-08 is largely due to the Country Water Qua l ity Improvement Program - Stage 3, where a fu rther 17 regional com m unities now receive treated and fi ltered water from the River M urray.
SA Water's regional operating cost per property for sewerage is in the midrange of the six
compa nies compared for both 2006-07 and 2007-08 and well below the regional weighted average. The Corporation's rea l operating costs for regional sewerage services have
increased margina l ly in 2007-08 due to i ncreased operat ing costs associated with upgrades
to severa l regional wastewater treatment plants a nd a genera l i ncrease in workload as a resu l t of expanding h i l ls a nd regional development. These u pgrades have had a positive
impact on service standards, increasing the percentage of water recycled and he lp ing SA Water ensure the Corporation conti n ues to be EPA compl iant.
Go ing forward the Corporation's rea l operating cost per property in the water business is
expected to increase. The i ncreases a re d riven by water security in it iatives, the Adela ide
Desa l i nation P lant {ADP} being the most sign ificant, as wel l as conti nu i ng the water
effic iency rebates and water restrictions. Sewerage costs a re expected to increase s l ightly from 2009-10, reflecting an increase in environmental comp l ia nce requ irements as wel l as
the need to meet demand growth .
Historical ly, the Corporation's level of capital expend iture for metropo l itan water supply has
been low, compared with other uti l ities. I n 2007-08, the Corporation i ncreased its leve l of capita l expenditu re and this trend is set to conti nue as enha nced leve ls of water security a re de l ivered, with the ADP being a sign ificant component of capita l expenditure for 2008-09 through to 2011-12.
vi
I ' , I
SA Water has del ivered a number of significant water supp ly projects i n regional South Austra l ia from 2001-02 to 2007-08. These p rojects have sign ificantly improved the level of
service to severa l a reas.
The Corporation's capita l expenditure in re lation the wastewater has remained below the
industry's weighted average for both metro pol itan and regional segments from 2002-03 to
2007-08. The capita l spend has been focused predominantly on meeting enhanced environmental standards and reduc ing the impact of the Corporation's wastewater
treatment plants on the environment. Del ivery of these projects has increased the leve ls of water recycled as wel l as reduced the environmental impacts of the Corporation's
wastewater treatment plants.
Forecast capita l expenditure is set to peak in 2009-10 pr imari ly driven by the ADP,
demonstrating the focus on improving the State's water security. I n the sewerage services
segments the emphasis wi l l remain on red ucing the Corporation's environmenta l impact
and ensuring capacity to meet demand growth .
Value for Money The Customer Satisfaction Survey conducted by the Corporation in June 2009 i nd icates
customers a re genera l ly very satisfied with the range and qua l ity of services provided by the
Corporation . Eighty-fou r per cent (84%) of responses to the su rvey consider that the price of
water represents good va lue .
The standard of service offered by the Corporation to its customers is predominately at the mid-to-high range in the metropol itan a rea and in the mid range in the regional a reas when
compared with the service levels offered to customers by the other water bodies.
Whi le SA Water's operating costs for water supply and wastewater services a re
comparative ly low in Adela ide when compared with other Austra l i an cities, average water and wastewater b i l l s a re compa ratively mid range, but above the weighted average. To
some extent this leve l of contribution may reflect the re lative qua l ity of assets which provided a genera l ly high leve l of service .
I n add ition to the qua l ity service provided to customers, the Corporation provides the
Customer Assist P rogram, a imed at identifying customers who a re having difficu lties paying their b i l l s and providing assistance as ea rly as poss ib le to he lp prevent customers fa l l ing into
a ut i l ity debt spira l .
vi i

I;�
vi i i

1 . I ntroduction 1 .1 AIM The primary purpose of this report is to review the effic iency of the operations of the South Austra l ian Water Corporation ("SA Water" or the "Corporation"). The review is
undertaken as a key input into processes for:
CII The annua l pricing submission - to assist Cabinet in its del iberations about pricing by
demonstrating that water and wastewater prices a re based on "efficient resou rce
pricing and busi ness costs for a given or improving level of service" (COAG Water
Reform Agreement 2003) and accord ingly a re compl iant with CoAG pricing pri ncip les;
CII Business p lann ing - to identify key trends, strengths, weaknesses, opportun ities and th reats . These a re factored i nto strategy setting processes as a pa rt of the
environmental scan process; a nd
CII Budgeting - to demonstrate to the Government (as owner) that the Corporation's
budgets and fi nancia l targets a re reflective of an efficient busi ness.
1.2 SCOPE AND STRUCTURE The report firstly focuses on the Corporation's performance to date. It assesses service leve ls provided by the Corporation and how much it has cost the Corporation to de l iver
these services to customers. The Corporation's past performance for both metropol itan and regional a reas is a lso bench marked aga inst comparable Austra l ian uti l ities for service leve ls
and cost of de l ivery.
The report then bu i lds a bridge from past performance to future performance to show how
the Corporation is a im ing to ma inta in or i mprove its service leve ls to customers . The report assesses whether the cost pressu res affecting the Corporation a l low these increased levels of service to be del ivered and whether the remain ing cost base is efficient.
F ina l ly, the report provides an ana lysis of the va l ue for money that customers obta i n from using the Corporation's services. This is a lso benchmarked aga inst the va l ue for money of
other uti l ities based upon publ icly ava i l ab le information .
For presentation purposes, the report is structured on fou r of the five Strategic Objectives
of the Corporation, namely:
CII Customer Service & Water Qua l ity (Chapter 2);
CII System Performance (Chapter 3) ;
CII Susta inable Future (Chapter 4); and
CII Commercial Success (Chapter 5 ) .
Chapter 6 deta i l s the Va lue for Money a na lysis.
1
1.3 SOURCE DATA The data conta ined in this report has been sourced from severa l key performance
measurement tools inc lud ing: e SA Water's interna l Strategic Map (SM); ED Nationa l Performance Report ( N PR), pub l ished by the Water Services Association of
Austra l ia (WSAA) and the National Water Commission (NWC}; and • SA Water's financ ia l accounts.
Note that financ ia l data presented is consistent with the Corporation's approved 2009-10 Budget (and forward estimates). The financia l data does not inc lude recent u pdates, such as
the 2009-10 M id Year Budget Review or the 2010-11 Pricing decision.
A l l figures presented in Chapter 5 a re in rea l 2007-08 do l lars, consistent with the 2007-08 N PR. Capita l expend iture has a lso been stated on a net of Federa l funding basis,
consistent with the regu latory approach used to set water and sewer prices.
For the purpose of this Report, comparisons for metropol itan operations a re made with
twelve s imi lar metropol itan water and wastewater ut i l ities.
For regional operations, comparisons of performance a re made with seven other regional
water and wastewater ut i l ities.
For the benchmarking ana lysis, where a ut i l ity has not reported data the ut i l ity's name is not shown in the Table .
Further deta i l s on the source data used i n this Report a re provided in Attachment 3.
1.4 COMMERCIAL IN CONFIDENCE This Report is based on a n ear l ier d raft that was prepared for Cabinet as part of the 2010-11 pricing decision.
The Corporation has made editorial changes and excl u ded, where necessa ry, information
that is commercia l i n confidence in preparing this version of Report.
2

2. Customer Service and Water Qua l ity 2.1 CUSTOMER SERVICES While SA Water continued to deliver a high level of service, it was u nable to meet all of its internal targets with regard to customer services.
Water restrictions and a new rebates program led to unprecedented levels of customer contact in 2008-09. During this period, the Customer Contact Centre relocated to Victoria Square and this, combined with the increase of customer contacts, impacted on the Corporation meeting its internal customer targets.
Annual customer survey results revea l that, overall, customers are very satisfied with the levels of service provided by the Corporation. SA Water is aiming to further improve its customer services targets by 2013;.14.
This section provides an overview of the Corporation's performance in customer service in
terms of the fo l lowing indicators featu red i n either the SM or N PR.
Section Indicator SM NPR
2 .1 .1 Compl iance with Draft Customer Charter - f Metropol itan Water & Sewer Service
2 . 1.2 Com pl iance with Draft Customer Charter - f Regiona l Water & Sewer Service
2 .1 .3 Comp l iance with Draft Customer Charter - f Customer Contact
2 . 1.4 Per cent of cal ls answered by an operator with in f 30 seconds
2 .1 .5 Comp l iance with Draft Customer Charter - New f Connections
2 .1 .6 Customer Satisfaction I ndex f
Four of these ind icators (see 2 .1 .1, 2 .1 .2, 2 .1 .3 and 2 . 1 .5), each involving interna l measures
inc l uded in the Corporation's SM, address compl iance with the Draft Customer Charter a nd
3

hence compl iance with a range of criteria (service standards) . For example, in re lat ion to
Metropol itan Water & Sewer Service there a re cu rrently 32 criteria aga inst which service is assessed inc lud ing measures in relation to restoration of unp lanned water su pply
interru ptions; restorat ion of unp lanned sewer interru ptions; and attendance and c lean u p t imes of sewer overflows. The measure in relation t o Regiona l Water & Sewer Service is
s imi lar involvi ng assessment of performance aga inst 20 criter ia . The measures in 2 . 1.3 and
2 .1 .5 s imi larly reflect compl iance aga inst m u lt ip le criteria a lthough the number of criteria
( i .e . as specified in the Draft Customer Charter) is less.
2.1.1 Compliance with Draft Customer Charter - Metropolitan Water & Sewer
Service (SM)
This f(PI measures compliance against the following service standards in the
Draft Customer Charter for the metropolitan area: restoration of unplanned
water supply interruptions; restoration of unplanned sewer interruptions; and
attendance and clean up times of sewer overflows.
Strategic Map Targets 2006-07 2007-08 2008-09 2013-14
Actual Actual Actual Target Achieve Compliance with Draft Customer Charter
Water & Sewer Services I Metro 19/20 31
/32 31
/32 95% (19
/20) (30
/32)
(30/32)
Note: Targets for each year are shown in brackets below the annual result. The number of criteria reported increased
from 20 in 2006-07 to 32 in 2007-08 and is subject to change due to the d raft nature of the Customer Charter.
Performance Of the 32 criteria reported in 2008-09, 31 (97%) met their associated ta rget thus ach ieving
the overa rch ing ta rget in respect of com pl iance with the Draft Customer Charter ta rget -
meeting the ta rgets for 30 of the 32 criter ia . The one criterion not achieved i n 2008-09, was
'Attendance at 100% of Water Supply Complaints within 2 Business Days'. Performance of
99.3% was ach ieved aga inst a ta rget of 100%, with five of the 726 events missed. Four of these five missed events occurred in the month of March 2009, and were a resu lt of
ava i lab le resources being diverted to attend to an unusua l ly h igh number of reported
bursts. Whi le the ta rget was not achieved the level of service provided was sti l l of a very
high standard .
Going Forward Performance going forward is expected to remain at a h igh level through to 2013-14.
4

2.1.2 Compliance with Draft Customer Charter - Regional Water & Sewer
Service (SM)
This f(PI measures compliance against the following service standards in the
Draft Customer Charter in regional areas: restoration of unplanned water
supply interruptions; restoration of unplanned sewer interruptions; and
attendance and clean up times of sewer overflows.
Strategic Map Targets 2006-07 2007-08 2008-09 2013-14
Actual Actual Actual Target Achieve Compliance with Draft Customer Charter
Water & Sewer Services I Regional 20/31 22
/33 31
/33 95% (29
/31) (31
/33)
(31/33)
Note: Targets for 2006-07, 2007-08 and 2008-09 are shown in brackets below the annual result.
Performance Of the 33 criteria reported i n 2008-09, 3 1 (94%) met their associated target thus achieving
the overa rching target in respect of compl iance with the Draft Customer Charter ta rget.
Reasons for missing events were either:
• confl icting priorities when other events occurred at the same time;
• knowingly missing events for occupational health and safety reasons (such as dangerous conditions at n ight); and
• schedu l ing process fa i l u res, whereby the priority event was not ca l led through to the
fie ld with in the prescribed t imeframe.
I n 2009-10, the basis of calcu lation for th is ind icator wi l l be changed to reflect the actua l n umber of events ach ieved as opposed t o the number of Draft Customer Charter criteria
met. The 2008-09 resu lts a re consistent with the futu re basis for determin ing compl iance.
Of the 3,432 Customer Charter re lated jobs logged for the year, 3,411 were completed on
ta rget. This reflects a 99% compl iance as compared to the 2009-10 compl iance ta rget of 95%.
100% 90% 80% 70% 60% 50% 40% 30% 20% 10%
2.1
- 1--
1-
.....
� :;;:
�- -
-
..... ..... r--'r ';' <;> i; <: Q. .=: .", 2:
* CC - Customer Charter
Regional Operations % Compliance with Customer Charter
: tit Ir - ITHI c- -- - --
..... ..... ..... ..... r-- ..... <0 :I % 9 2: <;> � ';' "'" " .§ .=: � � is <:>
z ""
% CC Measures Achived
-
-
eo Q
�
.-
_.
i--
eo � :;;:
. -
co <;;> .:.
.;T
- -
- -
, '"
';' i; :lE
- Unear (% CC
5
-
<0 eo eo eo eo eo eo '" Q Q ';' <;> Q � <::> 9 i: :; M & ... v � .=: " is 0 0) � <>: z c::.
Measures Achived)
- -
- -- -
- -
'" '"
<;> � ;1 �

Going Forward The Corporation is well on track to ach ieve the performance target for 2013-14. As
ind icated by Figu re 2 .1 above, actions taken by the Corporation have had a positive impact on performance, with performance expected to continue to trend u pwards.
2 . 1.3 Compliance with Draft Customer Charter - Customer Contact (SM)
This KPI measures compliance against the following customer contact
standards in the Draft Customer Charter: average time to answer a telephone
call to the Corporation's Customer Contact Centre; percentage of all routine
written enquiries responded to within 10 working days; percentage of
complaints responded to within 5 working days; percentage of all investigative
correspondence resolved within 20 working days; percentage of enquiries
resolved at first point of contact face to face or via the telephone; and
percentage of applications to discharge trade waste into the sewer system
processed within 10 working days.
Strategic Map Targets 2006-07 2007-08 2008-09 2013-14
Actual Actual Actual Target Achieve Compliance with Draft Customer Charter
Customer Contact 3/4 3
/6 2
/6 100% (4
/4) (6
/6)
(6/6)
Note: Targets for 2006-07, 2007-08 and 2008-09 are shown in brackets below the annual result. The number of criteria
reported increased from 2006-07 to 2007-08 and is subject to change due to the draft nature of the Customer Charter.
Performance A record 800,000 enqu i ries and requests were managed by the Customer Contact Centre
over 2008-09 with responses to customers, either in person, in writing or by phone. Water
restrictions and a new rebates program were the key issues that led to the unprecedented
levels of customer contact.
In 2008-09, 2 of the 6 Customer Contact criteria were met. These were :
• percentage of app l ications to discha rge trade waste into the sewer system processed
within 10 working days; a nd
• percentage of compla ints responded to within 5 working days.
Reasons for not meeting rema in ing criteria a re as fol lows :
• telephone customers wa ited on average 28 seconds for their ca l l to the Customer
Contact Centre to be answered (compared to the ta rget of 20 seconds) for fou r months o f t h e year. This resu l t was predominately due t o physical re location o f the
Customer Contact Centre to the new bu i ld ing in Victoria Square . Delays a rose primari ly due to new commun ications technology, tra in ing of new staff and
resou rcing the new front counter. By February, ca l l waiting t imes were back down to
a round 20 seconds;
6
CI the ta rget for percentage of a l l routine written enqu iries responded to with in 10
working days was missed marg ina l ly due to resources being diverted to respond to
the increased ca l l vo l umes a nd other issues associated with the relocation to Victoria Square; and
CI percentage of enqu i ries reso lved at first point of contact, face to face or via the
te lephone, decreased s l ightly due to the co-location of functions to the o ne Victoria Square fac i l ity - resu lt ing in redi rection to specific a reas of the business after first
contact.
These non-conforming criteria were a l l heavily impacted by the relocation to Victoria Square
and increased ca l l vo l umes as these customer contact ind icators a re inter-re lated. As ca l l
answer t ime increases, resources a re d iverted away from other customer contact a reas to
reduce the ca l l waiting t ime. Customer contact ind icators have now returned to pre
relocation leve ls .
Going Forward Customer Contact performance is expected to improve going forward, as reflected by the
SM target of 100% in 2013-14. The percentage of enqu iries resolved at first point of contact
was removed from the Customer Contact criteria in the 2008-09 year as it no longer
reflected the intent of the Customer Charter.
2.1.4 Per cent 0/ calls answered by an operator within 30 seconds (%) (NPR)
This KPI measures the proportion of calls that, where the customer has
selected a relevant operator option are answered by an operator within 30
seconds.
As part of the ongoing review of the N P R performance measures, th is ind icator has replaced 'Connect time to an operator (in seconds)' as reported in previous years. SA Water was
unable to report against th is new ind icator due to the manner in which SA Water stored
data (prior to moving to Victoria Square) . Due to the magnitude of information accumulated in the SA Water ca l l centre, on ly the previous 3 months worth of data is stored at any one t ime.
Going Forward SA Water's approach to stor ing data from the Corporation's ca l l centre changed with the
move to Victoria Square in November 2008. The requ i red data has been col lected for 8 out
of 12 months in 2008-09, prec lud ing reporting for 2008-09. SA Water should be ab le to report on this ind icator from 2009-10 onwards.
7

2.1.5 Compliance with Draft Customer Charter - New Connections (SM)
This KPI measures compliance against the following connection services in the
Draft Customer Charter; percentage of standard water connections installed
within 15 working days of processing the application and receiving the fees; and
percentage of properties with a standard connection to sewer within 20
working days of processing the application and receiving the fees.
Strategic Map Targets 2006-07 2007-08 2008-09 2013-14
Actual Actual Actual Target Achieve Compliance with Draft Customer Charter
New Connections 0/4 0
/2 0
/2 100% (4
/4) (2
/2)
(2/2)
Note: Targets for 2006-07, 2007-08 a nd 2008-09 are shown in brackets below the a nnual result. The number of criteria
reported decreased from 2006-07 to 2007-08 and is subject to change due to the draft nature of the Customer Charter.
Performance
During the year, the busi ness process for del ivery of new water connections was reviewed
with pa rts of the process revised . Improvements a re a l ready evident in improved
performance in the post implementation months. In the bus iness un it which com pletes new
connections, interna l performance ta rgets a re being met. Specifica l ly, the business un it
completes the new connection within 14 days of logging of the req uest. The ma in cha l lenge
to the ach ievement of the ta rget is the t ime lag between when Customer Services receive the request a nd when it is schedu led for completion.
Going Forward SA Water is a im ing for improved service levels for new connections going forward to 2013-14.
Improvement in th is a rea remains a focal point for the Corporation. It is expected that
projects underway wi l l assist in improving futu re performance .
2.1.6 Customer Satisfaction Index (SM)
This index is the mean response from the Random Household, Customer
Contact Sample and Business Customer satisfaction scores in the annual
SA Water Customer Satisfaction Survey.
Strategic Map Targets 2006-07 2007-08 2008-09 2013-14
Actual Actual Actual Target Customer Satisfaction Index 8.2 8.0 8.0 (residential customers) (8.2) (8.2) (8.3) 8.4
Note: Targets for 2006-07, 2007-08 a n d 2008-09 are shown i n brackets below t h e annual result.
8

Performance The annua l customer satisfaction su rvey measu res satisfaction with SA Water as a service
provider a nd the Corporation's attributes such as re l iab i l ity, va lue for money,
responsiveness and water qua l ity.
The 2008-09 su rvey was conducted in June 2009 and, on a 0 to 10 sca le, SA Water ach ieved
overal l satisfaction rati ngs of 8.0 (residential customers) a nd 7.8 (busi ness customers).
These excel lent resu lts demonstrate SA Water is continu ing to meet the expectations of the
overwhe lming majority of customers, despite the impacts of drought, water restrictions,
and increases in charges and changes in b i l l ing procedures (Le . i ntroduction of quarterly
b i l l ing) .
SA Water's customers rated the Corporation highly in terms of customer service, both over
the phone and on-site and the Corporation was regarded as efficient, knowledgeable, profess iona l and responsive . SA Water a lso scored wel l i n the a reas of high importance for
consumers, namely, in the rel iab le supp ly of safe d rinking water and good response times to
problems.
Whi le the overa l l satisfaction rating of 8.0 ( residentia l customers) and 7.8 (busi ness
customers) a re exce l lent, the resu lts were short of the overa l l SM ta rget of 8 .3 . Va lue for
money has been identified as a key d river of overa l l customer satisfaction . G iven the
significant price increases for water in 2009-10, it is not expected that higher satisfaction scores wi l l be ach ieved in the short term. The five year target of overa l l customer satisfaction of 8 .3 or above wi l l be difficu lt to achieve in the face of announced and future
antici pated price increases for water.
Going Forward The SM has a long term target of 8.4 by 2013-14.
SA Water is implementing a new customer satisfaction measu rement system using the Common Measurement Tool (CMT). This wi l l enable the Corporation's customer satisfaction
leve ls to be compared with a l l State government departments and agencies. Based on resu lts cu rrently being achieved by other pa rts of Government, it is expected that the
Corporation's resu lts wi l l compare favourably.
I n 2008-09, SA Water commissioned a corporate reputat ion monitor, which wi l l invo lve qua l itative customer research and p rovide an opportun ity for the Corporation to better
understand customer a nd commun ity requ i rements.
9
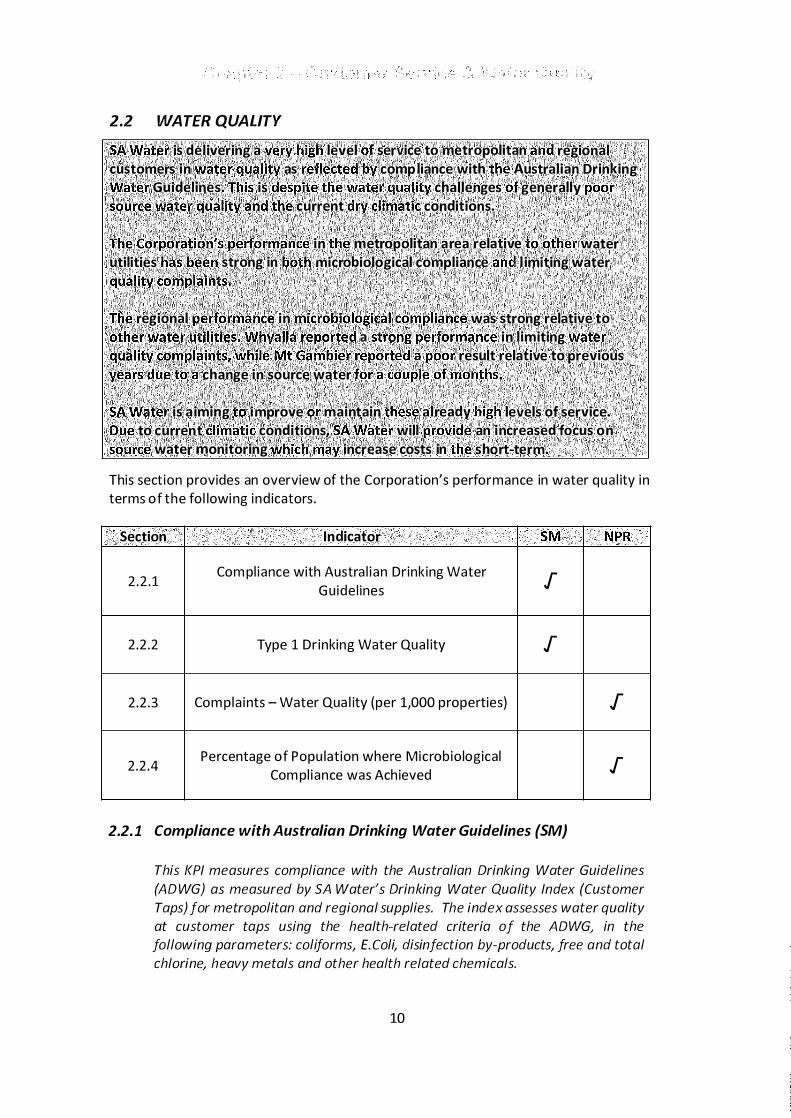
2.2 WATER QUALITY
SA Water is delivering a very h igh level of service to metropolitan and regional customers in water quality as reflected by compliance with the Australian Drinking Water GU.idelines. This is despite the water quality challenges of generally poor source water quality and the current dry cl imatic conditions.
The Corpo(ation'sperformance in the metropolitan a rea relative toother water utilities has been strong in both microbiological compliance and l imiting water qu�lity complaints;
The regional performance in microbiologicalcompliance was strong relative to other water utilities.JNhyalla reported a strong performance in limiting water quality complclints, while Mt Gambier reporteda poor result relative to previous years due toa change in ·source water for a couple of months.
SA Water is a iming to i mprove or maintain these already high levels of service. Due to current climatic conditions, SA.Water will provide an increased focus on source water monitoring which may increase costs in the short-term.
This sect ion provides an overview of the Corporation's performance in water qua l ity in terms of the fo l lowing ind icators .
Section Indicator SM
2 .2 .1 Com pl iance with Austra l i an Dr inking Water f G uide l ines
2 .2 .2 Type 1 Dr inking Water Qua l ity f
2.2 .3 Com pla ints - Water Qua l ity (per 1,000 properties)
2 .2 .4 Percentage of Popu lation where Microbiological
Com pl iance was Achieved
2.2.1 Compliance with Australian Drinking Water Guidelines (SM)
NPR
f
f
This {(PI measures compliance with the Australian Drinking Water Guidelines
(AD WG) as measured by SA Water's Drinking Water Quality Index (Customer
Taps) for metropolitan and regional supplies. The index assesses water quality
at customer taps using the health-related criteria of the ADWG, in the
following parameters: coliforms, f. Coli, disinfection by-products, free and total
chlorine, heavy metals and other health related chemicals.
10

Strategic Map Targets 2006-07 2007-08 2008-09 2013-14
Actual Actual Actual Target Achieve Australian Drinking Water 99.8% 99.7% 99.8 Guidelines Compliance (99.5%) (99.5%) (99.8) 99 .8%
Note: Targets for 2006-07, 2007-08 and 2008-09 are shown i n brackets below the a nn ual result.
Performance ADWG compl iance in 2008-09 has been consistent at about 99.8%. This is despite
deterioration in source water.
Going Forward The Corporation's high level of performance is forecast to continue to 2013-14, meeting a
target of 99.8% compl iance.
Ma inta in ing this h igh level of end-point compl iance wi l l be on ly part of the cha l lenge. In l i ne with the pr incip les of the ADWG Framework, the Corporation wi l l strive to cont inue to be proactive to improve key systems and to improve aesthetic ( i n add ition to the 'health
related' criter ia) water qua l ity for customers .
New in it iatives for 2009-10 cu rrently be ing explored a re ( 1) improved reporti ng to Operations (moving to a monthly reporting basis); and (2) ongoing investigations into the
treatment of dis infection by-products.
2.2.2 Type 1 Drinking Water Quality (SM)
This {(PI relates to the number of Type 1 drinking water quality notifications to
the Department of Health. Type 1 incidents are defined as incidents that could
cause serious risk to human health. {Note that SA Water does not necessarily
have control of type 1 incidents. As such this indicator provides information
on SA Water's operating environment rather than SA Water's performance}.
The Incident Response Index {lR!} is a ratio of the number of Department of
Health reportable incidents with a response within the required target time as
a percentage of the total number of incidents. This is a composite index of
response effort within predetermined targets against the following
parameters: incident entered into Incident Management System; report
incident to Department of Health by telephone; written report to Minister for
SA Water; initial corrective actions taken; Root Cause Analysis performed; and
preventative actions implemented.
11

Strategic Map Targets 2006-07 2007-08 2008-09 2013-14
Actual Actual Actual Target Type 1 Drinking Water Quality Reduce Type 1 Drin
king Water Qua
lity 50 80 91 90 Noti
fications to Department of Hea
lth
(60) (54) (49)
Improve Water Quality Management n
/a n
/a n
/a 81% In
dex (WQMI
) to 81%
Improve Incident Response In
dex (IR I) 57% 67% 71% 84% (50%) (60%)
(70%
)
Note: Targets for 2006-07, 2007-08 and 2008-09 are shown in brackets below the annual result.
Performance During 2007-08, the n umber of Type 1 d rinking water qua l ity incidents reported to the
Department of Health increased as a resu lt of improvements made to the way dr inking water qua l ity incidents a re defined, captured and reported.
Whi le our Type 1 "count" in 2008-09 is high; water qua l ity management of ta rgeted
ind ividua l water supp ly systems and management of risks improved . It is worth noti ng that
in August 2009, the Board approved a revised ind icator (the Water Qua l ity Management Index) which m easures water qua l ity performance through a series of ind icators associated
with the management of water qua l ity (as wel l as key qua l ity criteria ) rather than accord ing
to notifications . The new WQMI Reporting against the new index wi l l commence in 2009-10 reflects the Nationa l Dr inking Water Qua l ity G uidel ines framework.
2008-09 saw i ncreased monitoring in locations considered to be of potentia l r isk due to increases in the nu mber of notifications, as in the case of dis infection by-products. We have
an intensified focus on addressing the causes of "preventable" Type 1 notifications such as
disi nfection fa i l u res or inadequate treatment faci l ities of ground water.
The main causes for the cu rrent notifications were :
e Disinfection fa i l u res; • Disinfect ion by-products (DBPs - mostly in outer reaches of long d istrib ution systems
requir ing secondary dosing inf luenced by precursors in the source water);
& Chemica l exceedances (main ly due to natura l ly occurring chemicals in the source
water); • Protozoa detections (fo l lowing contamination of source water); and
& B lue green a lgae .
The strategies for reducing Type 1 incidents inc lude capita l improvements and i mproving
robustness of the system operation. During th is reporting period, as part of the Country
Water Qua l ity I mprovement program, Cooltong and Woolpunda commenced receiving
fi ltered water from Un ited Uti l ities Austra l ia ( UUA) and Un ited Group I nfrastructure (UG I )
p lants.
12

Un l i ke the cause of occurrence of certa in Type 1 incidents, the Corporation does have contro l over incidents measured by the IR I . The I R I resu l t has been better than target for
2007-08 and 2008-09 and has improved s ince 2006-07. These resu lts a re particu larly
positive given the recent increases in the occurrence of Type 1 events.
Going Forward Whi le the Corporation wi l l continue to monitor the n um ber of Type 1 notifications, moving
forward there wi l l be an intensified focus on pro-active water qua l ity management, to
ensure that inc idents are responded to appropriately a nd that corrective actions a re
implemented which prevent future contro l lab le incidents from occurring. The Corporation's
performance of the IR I is expected to continue to improve to 2013-14.
2.2.3 Complaints - Water Quality (per 1,000 properties) (NPR)
This f(PI measures the total number of complaints received by the water
business that relate to water quality, including water quality complaints
resulting from operational practices. With respect to water quality, this is any
complaint regarding: discolouration; taste; odour; stained washing; illness; or
cloudy water (e.g. caused by oxygenation), etc. Any contact that results in a
water quality issue is counted as a complaint. The measure does not include
complaints relating to: service interruption; adequacy of service; restrictions,
or pressure.
Figure 2.5 and Figure 2.6 show metropolitan and regional water qua lity complaints per 1,000 properties for 2005-06, 2006-07 and 2007-08.
Figure 2.5
12
1 0
8
6
4
2
o �---'--r-
Complaints - water quality (per 1 ,000 properties) - Metro
ACTEWCorp BalWon Water Brisbane Gold Coast Hunter Water Power & SAWater Sydney Water Water Corp Yarra Valley South East CilyWest Water Water Water Co rp - Water Water Ltd Water
Darwin
- 2005-06 -2006-07 = 2007-08 - M etro Average 2007-08
13
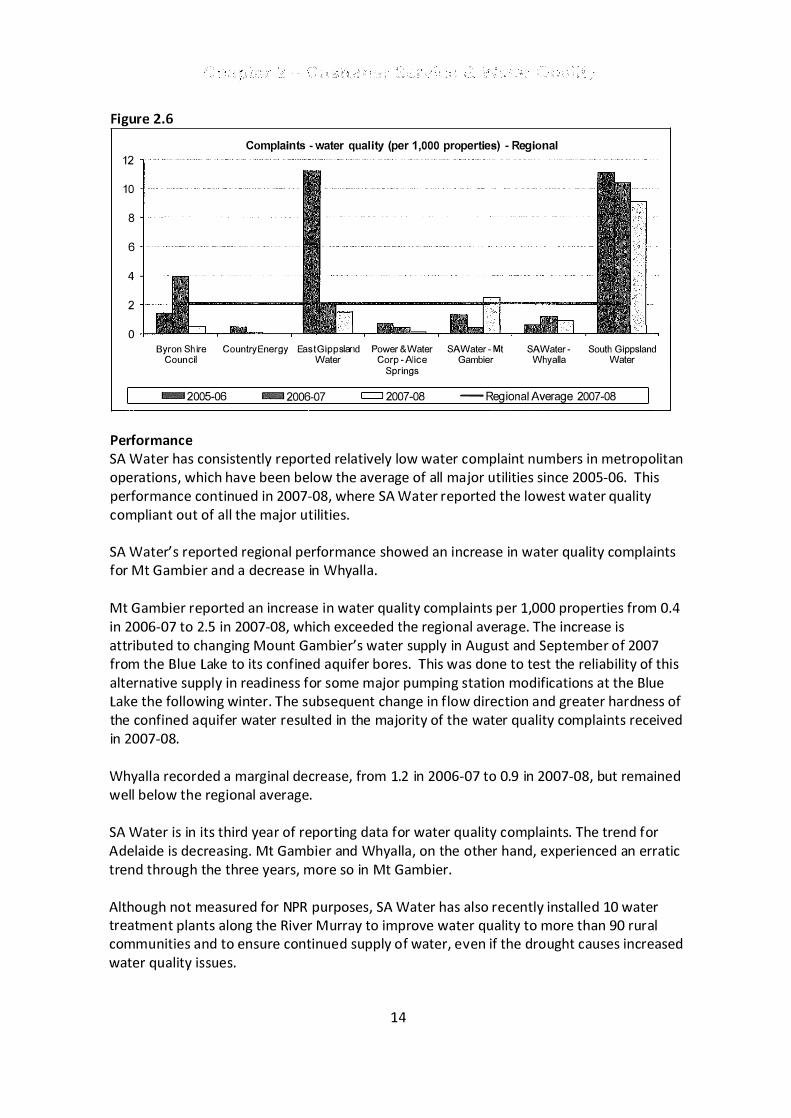
Figure 2.6
12
10
8
6
4
2
o
Complaints - water qual ity (per 1,000 properties) - Regional
Byron Sh ire Country Energy EastGippsiald Power & Water SAWater - Mt SAWater - South Gippsland Coun cil Water Corp - Alice Gambier Whyalla Water
Springs
- 2005-06 - 2006-07 c:::J 2007-08 - Reg ional Average 2007-08
Performance SA Water has consistently reported re latively low water compla int numbers in metropol itan
operations, which have been below the average of al l major ut i l ities si nce 2005-06. This
performance continued in 2007-08, where SA Water reported the lowest water qua l ity
compl iant out of a l l the major ut i l it ies.
SA Water's reported regiona l performance showed an i ncrease in water qua l ity compla ints for Mt Gambier a nd a decrease in Whya l l a .
Mt Gambier reported an increase i n water qua l ity compla ints per 1,000 properties from 0.4
in 2006-07 to 2.5 in 2007-08, which exceeded the regiona l average. The increase is
attributed to changing Mount Gambier's water supply in August and September of 2007 from the B lue Lake to its confined aqu ifer bores. This was done to test the re l iab i l ity of this
a lternative supp ly in read iness for some major pumping station mod ifications at the Blue Lake the fo l lowing winter. The subsequent change in f low d i rection a nd greater ha rdness of
the confi ned aqu ifer water resulted in the majority of the water qua l ity compla i nts received
in 2007-08.
Whya l l a recorded a margina l decrease, from 1.2 in 2006-07 to 0.9 in 2007-08, but remained
wel l below the regional average.
SA Water is in its th i rd yea r of reporting data for water qua l ity compla i nts. The trend for
Adelaide is decreasing. Mt Gambier and Whya l la, on the other hand, experienced an erratic
trend through the three years, more so in Mt Gambier.
Although not measured for NPR purposes, SA Water has a lso recently insta l led 10 water treatment p lants a long the River M urray to improve water qua l ity to more than 90 rural comm u nities a nd to ensure conti nued supply of water, even if the drought causes increased
water qua l ity issues.
14

Going Forward SA Water's intentions to focus on pro-active water qua l ity management, incl ud ing extensive
mon itoring and water qua l ity risk m itigation strategies for River M urray offta kes, wi l l
potentia l ly reduce customer compla ints around water qua l ity. These inc lude an
enha ncement of the routine monitoring program for a l l water supply off takes. Due to cu rrent c l imatic conditions, SA Water wi l l i ncrease its focus on source water monitoring
which may increase costs in the short-term but wi l l enab le SA Water to better m itigate the
impact on customers.
I n Mt Gambier, due to the pu m ping modifications in 2008-09, compla ints may remain high, but in the longer term levels of compla ints a re expected to return to pre 2007-08 levels .
2.2.4 Percentage of Population where Microbiological Compliance was Achieved
(NPR)
This {(PI measures (as a percentage of the customer base) compliance of the
microbiological quality of water supplied with the ADWG.
Percentage of population where microbioloflical compliance was achieved
State I Territorv 2005-06 2006-07 2007-08 Metro ACTEW Corporation ACT 1 00% 1 00% 1 00%
Barwon Water Vic 99.8% 1 00% 1 00%
Brisbane Water Qld 1 00% 1 00% 1 00%
Hunter Water NSW 99.6% 99.8% 1 00%
Power & Water Corp - Darwin NT 1 00% 1 00% 1 00%
SA Water SA 1 00% 1 00% 1 00%
Sydney Water NSW 1 00% 1 00% 1 00%
Water Corporation WA 1 00% 1 00% 1 00%
Yarra Valley Water Vic 1 00% 99.7% 1 00%
South East Water Ltd Vic 1 00% 1 00% 1 00%
City West Water Vic 1 00% 1 00% 1 00%
Gold Coast Water Qld 1 00% 1 00% 1 00%
Metro Average 1 00.0% 100.0% 100.0%
Byron Shire Council NSW 1 00% 1 00% 1 00%
Country EnerQY NSW 1 00% 1 00% 1 00%
East GiPpsland Vic 1 00% 95% 1 00%
Power and Water Corp. - Alice Springs NT 1 00% 1 00% 1 00%
SA Water- Mt Gambier SA 1 00% 1 00% 1 00%
SA Water- Whyalla SA 1 00% 1 00% 1 00%
South Gippsland Vic 1 00% 1 00% 1 00%
Regional Average 1 00.% 99.3% 100%
15

Performance All metropol itan and regional ut i l ities reported a 100% m icrobio logica l compl iance in 2007-
OB. Al l metropol itan and regiona l ut i l ities (except Barwon and Hunter Water in 2005-06 and
Yarra Va l ley a nd Hunter Water in 2006-07) have consistently reported 100% microbiologica l compl iance for the past three years.
Going Forward
The Corporation a ims to maintain m icrobio logical compl iance at 100%.
16
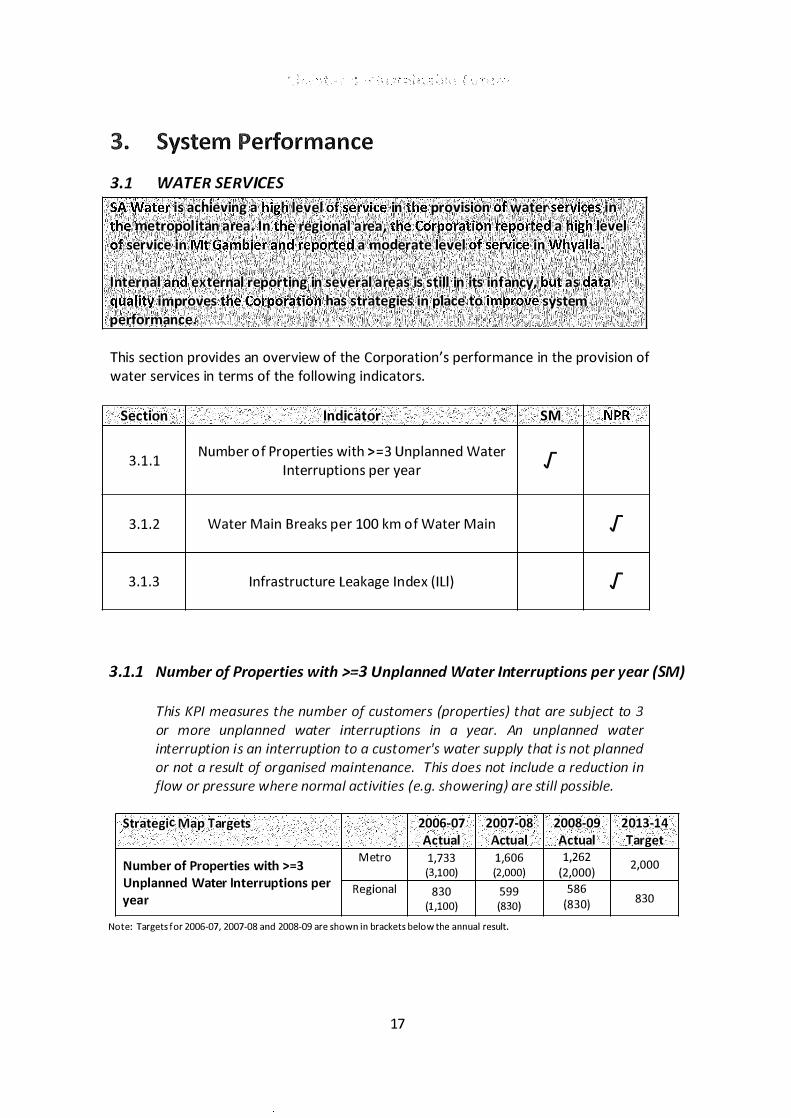
3. System Performance 3.1 WATER SERVICES
SA Water is achieving a high level of service in the provision of water services in the metropolitan a rea. I n t h e regional a rea, the Corporation reported a high level of service in Mt Gambier and reported a moderate. level of service in WhyalJa.
I nternal a nd external reporting in several a reas is still in its infancy, but as data quality improves the Corporation has strategies in place to improve system performance.
This section provides an overview of the Corporation's performance in the provision of
water services in terms of the fo l lowing ind icators.
Section Indicator SM NPR
3 .1 . 1 Number of Properties with >=3 Unp lanned Water j I nterruptions per yea r
3 .1 .2 Water Main Breaks per 100 km of Water Ma in j
3 .1 .3 I nfrastructure Leakage I ndex ( I ll ) j
3.1.1 Number of Properties with >=3 Unplanned Water Interruptions per year (SM)
This f(PI measures the number of customers (properties) that are subject to 3
or more unplanned water interruptions in a year. An unplanned water
interruption is an interruption to a customer's water supply that is not planned
or not a result of organised maintenance. This does not include a reduction in
flow or pressure where normal activities (e.g. showering) are still possible.
Strategic Map Targets 2006-07 2007-08 2008-09 2013-14
Actual Actual Actual Target
Number of Properties with >=3 Metro 1,733 1,606 1,262 2,000 (3,100) (2,000)
(2,000
)
Unplanned Water Interruptions per Regional
830 599 586 year (1,100) (830)
(830
) 830
Note: Targets for 2006-07, 2007-08 and 2008-09 are shown i n brackets below the annual result.
17

Performance The reported performance for both metropol itan and regiona l a reas was better than ta rget
for the years 2006-07, 2007-08 and 2008-09. Over the last three years the Corporation has
seen c lea r performance improvement in both metropol itan a nd regional a reas. It i s worth noting that SA Water has a lso improved data capture in relation to these performance ind icators .
Going Forward
Reporti ng on this measu re is conti nua l ly improving as data qua l ity improves and the
Corporation has strategies in p lace to improve overa l l system performance. For example,
SA Water has a strategy of preventing the fa i l u re rate of water mains from increasi ng. To
ach ieve th is, the Corporation has ana lysed h istorica l performance to p redict futu re
performance under va rious renewal strategies. To ma inta in performance at present leve ls a
program of steadi ly increasing the water ma in renewa ls program has been estab l ished. P ipes a re selected for replacement by c losely monitoring their performance. Renewal
priority is assigned on the basis of va lue for money ach ieved in reducing the number of
customer interru ptions and repa ir costs .
I n th is context, whi le the Corporation is a im ing to mainta in targets u nt i l 2013-14, targets wi l l
continue to b e reviewed as data improves .
18

3.1.2 Water Main Breaks per 100 km of Water Main (NPR)
This f(PI measures the total number of water main breaks, bursts and leaks in
all diameter mains for the reporting period. Breaks exclude those in the
property service (i. e. mains to meter connection) and weeps or seepages
associated with above ground mains that can be fixed without shutting down
the main.
Table 3.1
Water main breaks per 100 km of water main State I
Territory 2002-03 2003-04 2004-05 2005-06 2006-07
Metro Water Corporation WA 1 3 1 4 1 4 1 5 1 3
Gold Coast Water Old 1 7 1 4
South East Water Ltd Vic 1 8 24
SA Water SA 21 27
Barwon Water Vic
Sydney Water NSW 51 38 38 42 35
Hunter Water NSW 46.7 46.3 42.4 44.7 37.4
Brisbane Water Old 36.7 34.5 40 36.9 49.7
ACTEW Corporation ACT 48
Power & Water Corp - Darwin NT 55 41
Yarra Valley Water Vic 43 57
City West Water Vic 28 86
Metro Average 36.9 33.2 33.6 32.1 39.3
Reqional SA Water - Mt Gambier SA 5 2
Byron Shire Council NSW 38 9
East Gippsland Water Vic 7 9
Country Energy NSW 1 3 1 0
SA Water - Whyalla SA 20 1 3
South Gippsland Water Vic 38 93
Power & Water Corp - Alice Springs NT 56
Reqional Averaqe 20.2 27.4
Performance
2007-08
1 4
1 8
21
25
29
30
30.3
3 1 . 1
38
4 1
49
68
32.9
3
8
1 1
1 8
22
22
49
19.0
Over the three year period SA Water has reported on this ind icator, the Corporation has
been a strong performer in the metropol itan a rea. On ly Water Corporation, South East
Water and Gold Coast Water performances su rpassed SA Water's in 2007-08.
The weighted average of a l l major ut i l it ies reduced by nearly 20% from 2006-07 to 2007-08.
The Corporation's performance has been sign ificantly better than the average for the past three years.
SA Water's regional performance showed mixed resu lts compared to 2006-07. For the th i rd
yea r, Mt Gambier was the c lear leader with the lowest number of water main breaks i n 2007-08, b u t showed a s l ight increase from 2006-07. Whya l la, on the other hand, reported a
performance outcome s imi lar to SA Water's metropol itan outcome.
19

There is a strong relat ionsh i p between the i ncreased rate of water main breaks a nd the
conti nued dry seasona l condit ions experienced into 2007-08. G round movement a nd soi l types a re the two major causes of burst water mains . I n Ade la ide and in Whya l la in particu lar, so i l types a re such that seasona l changes in so i l moisture greatly affect ground movement, wh ich places pressure on pipes causing them to fa i l .
The 2008-09 figures1 for Adelaide show a s l ight reduction to 23 .7 breaks per 100km of ma in . Whya l l a reported 13 breaks in 2008-09 (a decrease from 22 breaks in 2007-08) and Mt
Gambier reported 2.0 breaks (down from 3 .0 breaks in 2007-08) .
Going forward As mentioned previously, SA Water has a strategy of preventing the fa i l u re rate of water
ma ins from increasing. To achieve th is, the Corporation has ana lysed h istorica l performance to predict future performance under va rious renewa l strategies. To maintain performance
at present leve ls a program of steadi ly increas ing the water main renewals program has
been establ ished. SA Water is reviewing the forward investment program in l ight of the ongoing d rought conditions to enab le improved performance in the future.
3.1.3 Infrastructure Leakage Index {ILl} (NPR)
The ILl measures how effectively real water losses from the system are being
managed at current operating pressure while accounting for other influential
factors like length of mains and customer meter location. The ILl is calculated
as the ratio of Current Annual Real Loss (includes leaks, bursts & overflows) to
Unavoidable Annual Real Loss.
Table 3.2
Infrastructure Leakage Index (Ill) State I 2006· 2007·
Territory 2002·03 2003·04 2004·05 2005·06 07 08 Metro Barwon Water Vic 0.6 0 .5 0 .7 0 .5 0 .4 0 .5
Gold Coast Water Old 2.5 2.7 1 .5 1 .4 0.7 0.8
ACTEW Corporation ACT 1 .3 0 .9 1 .0 0.5 0.9
South East Water Ltd Vic 1 .4 1 .3 1 .0 1 . 0 0.9 0.9
SA Water SA 1 .2 1 .2 1 .2 1 . 1 1 .0 1 .0
City West Water Vic 2.0 1 .4 1 .2 1 .3 1 .2 1 .0
Yarra Valley Water Vic 1 .3 1 .0 1 .4 1 .2 1 . 1 1 . 1
Brisbane Water Old 2.3 2.4 2.4 2.2 1 .7 1 .2
Hunter Water NSW 1 .9 1 .7 1 .7 1 .2 1 .3 1 .2
Sydney Water NSW 2.9 2 . 1 1 .8 1 . 5 1 .5 1 .5
Water Corporation WA 1 .5 1 .6 1 .7 1 .5 1 .7
Power & Water Corp · Darwin NT 5.5 4.9 5.8 1 .7 4 .0 3 .2
Metro Avera�e 2.0 1 .8 1 .8 1 .3 1 .3 1 .3
1 The NPR 2008-09 was not released at the time of compiling this report.
20

Performance The I II is used by ut i l ities a round the world to report leakage a nd takes into account factors
such as accuracy of meters, water used for fire fighting, theft, length of mains, nu mber of
connections and system pressu re . WSAA considers an I I I in the range of 1.0 to 1 .5 to be "Exce l lent" and 1.5 to 3 .5 to be "Good to Fair" .
I n 2007-08 Metropol itan Adela ide was consistent with last yea r's "Exce l lent" resu lt of 1.0,
aga i n wel l below the nationa l metropol itan average of 1 .3 .
Adela ide's reactive so i l s a re a major cause of leakage as so i l movement pu l ls pipe joints
apart and, in extreme cases, can crack the pipes. Over the six year period SA Water has
reported on th is ind icator, the Corporation's performance has been consistently better than
the average. Of the entities compared, Ba rwon Water, Gold Coast Water, ACTEW and South East Water have ach ieved a better resu lt in the past two years .
SA Water did not report any regional ind icators associated with water loss for the
2007-08 NPR, ( i .e . I I I or rea l losses) as the data is sti l l being compi led at this stage.
Going Forward SA Water a ims to ma inta in performance levels in the metropol itan a rea .
3.2 SEWER SERVICES
SA Water is closely monitoring its performance in sewer overflows and is seeking to further reduce sewer overflows in the metropolitan a rea by 2013-14 while maintaining its regional service levels.
The Corporation reported a decrease in the number of sewer main b rakes and chokes in 2007-08 compared with 2006-07, in the metropolitan as well as regional a reas. The metropolitan level of performance was at the higher end of sewer main b reaks and chokes, when compared with other metropolitan utilities. Both regions had excellent performance levels and were the top two performing regional utilities for 2007-08.
Until 2007-08 SA Water's sewer assets had been experienci ng a n increasing trend in breaks and chokes due to dry conditions. Abatement programs as well as targeted preventative maintenance have been put in place to manage the impact of these incidents on customers.
SA Water is seeking to reduce the impact of sewerage asset failures on customers by 2013-14.
21

This section provides an overview of the Corporation's performance in the provis ion of sewer services i n terms of the fol lowing ind icators.
Section I ndicator SM NPR
3 .2 .1 Sewer Main Breaks and Chokes f
3 .2 .2 Number of p roperties per year with a sewer f overflow caused by a sewer mains choke
22

3.2.1 Sewer Main Breaks and Chokes (NPR)
This measure records the number of sewer main breaks and chokes relative to
the sewerage system. A break or leak is a failure of the sewer main which
results in an interruption to the service. A choke is a confirmed partial or total
blockage that may or may not result in a spill to the external environment
from the sewer system.
Table 3.3
Sewer main breaks and chokes (per 100 km)
State I Territory 2002·03 2003·04 2004·05 2005·06 2006·07 2007·08
Metro Gold Coast Water Old 1 7.6
South East Water Ltd Vic 1 6 .6 1 8. 1 1 5. 3 1 6.4 21 .3 20.7
Water Corporation WA 2 1 .3 1 9 . 1 1 8.0 1 7.8 22.5 20.9
Brisbane Water Old 3 1 .2 22.9 28.0 26.3 32.0 27.6
City West Water Vic 35.1 31 .8 28.0 27.0 27.2 28.6
Power & Water Corp · Darwin NT 36.6 34. 1 30.2
Barwon Water Vic 44.8 43.8 38.3 41 .0 50.7 40.3
Yarra Valley Water Vic 41 .2 40.1 49.3 46.3
Hunter Water NSW 67.0 64.1 68.4 58.1 63.4 50.2
SA Water SA 49.7 46.4 53.3 52.9 65.8 58.2
Sydney Water NSW 83.0 73.0 82.0 87.0 90.0 64.0
ACTEW Corporation ACT 1 57.4 1 66.4 1 66.9
Metro Average 43.6 39.9 41 .4 51 .0 56.6 47.6
Reaional SA Water · Mt Gambier SA 1 .5 7 .5 5.3
SA Water · Whyalla SA 4.8 22.8 1 0 . 1
South Gippsland Water Vic 1 4.0 1 3. 7 1 4 .2
Byron Shire Council NSW 34.0 23.0 1 5 . 1
East Gippsland Water Vic 1 2.7 1 6. 1 1 5 .4
Power & Water Corp · Alice Springs NT 50.1 44.9 46.4
Country Energy NSW 1 83.0 1 48.0 1 25 .6
Regional Averaae 42.9 39.4 33.2
Performance In the past five years SA Water's metropol itan performance has experienced a deteriorating
trend. This trend is a lso evident for other major ut i l ities.
I n 2007-08 however, the Corporation improved its performance by 13%. This performance
improvement was a lso evident in the majority of the other ut i l ities as shown a bove. SA Water's 2007-08 reported n um ber of sewer main fa i l u res exceeded the metropol itan average. The key factor di rectly affecting this performance ind icator is Adela ide's reactive clay soi ls which a re prone to movement as c l imatic conditions change. This creates
problems for the metropol itan sewerage network, in particu lar where clay based pipes a re
23

i n use. I n addition, over 80% of sewer ma in chokes can be attri buted to tree root intrusion.
This is more preva lent in t imes of d rought when underground roots search for water
sources. Va pour rooting is the most effic ient method to prevent roots from i nvading sewer
pipes {main ly through the connections}. SA Water has an ongoing strategy that involves vapour rooting which c lea rs approximate ly 700-800km of pipes a year.
SA Water's regional centres have reported aga inst this ind icator for the last three years.
Whi le both Mt Gambier and Whya l l a experienced significant decreases in reported cases i n
2007-08 when compared t o t h e previous year, the 2007-08 performance was sti l l h igher
than reported in 2005-06. Both regiona l centres outperformed the other regional ut i l ities of s im i la r size.
As the sewerage networks for the regional a reas a re smal ler a nd genera l ly you nger than the
water networks, they do not have an asset replacement program as yet. However, through preventative ma intenance, such as c leaning programs and increased SCADA monitori ng,
i ncreases in the rate of b reaks and chokes have been constra ined.
The Corporation conti nua l ly eva l uates and identifies sewer overflow risks a nd implements
measu res such as system u pgrades as a pa rt of the Overflow Abatement Program and ta rgeted preventative sewer maintenance programs. Incidences of chokes a re given the
h ighest priority as they a re more frequent than breaks.
The Corporation has invested $15m over 5 years to establ ish an Overflow Abatement
P rogram {establ ished in l ate 2005}. The program ta rgets overflows from pump stations, the rep lacement of high risk pumping ma ins and extending SCADA networks to a l l wastewater treatment plants. The a im of th is program is to target high profi le flows from pumping
stations as they have the h ighest impact. Through th is abatement program there has been a reduction in the num ber of chokes in pumping stations, however, the impact on the overa l l
figu re reported is low.
In the 2007-08 N PR, the defin it ion of 'Sewer main breaks and chokes' changed to inc lude b reaks and chokes i n the property connection, i f owned and ma intained by the uti l ity. This
change in the defin it ion means that the comparison across ut i l ities wi l l be difficu lt to some
degree, as not a l l uti l it ies own and/or mainta i n the property connection . For example, SA Water and ACTEW own the property connection, but Sydney Water and Water
Corporation do not. H u nter Va l ley does not own the property connections but does ma intain them.
The cu rrent a nd h istorica l SA Water figu res i n the table 3 .3 above report the breaks a nd chokes in the sewer mains on ly {exc lud ing p roperty connection b reaks and chokes} . As the
defin ition changed for 2007-08 N PR, these figu res were reported in error. However it is
more compara b le across ut i l it ies. The 2007-08 figu re for metropol itan Adela ide wou l d have been 305 per 100 km of ma in according to the new defin ition . The figu res for 2008-092, for Adela ide is 287.1, Mt Gambier 64.4 and Whya l la 144.7 breaks per 100 km of ma in .
2 The NPR 2008-09 was not released at the time of compiling this report.
24

I n 2008-09 the title of the ind icator has changed to 'Sewerage breaks and chokes per 100
km of main' to better reflect the definit ion change.
Going Forward For the upcoming 2009-10 reporting period, the definit ion has been revised. It now requ i res
ut i l ities to report 'sewerage mains breaks and chokes (per 100 km main)' and 'sewerage
p roperty connections breaks and chokes (per 1000 properties)' as two separate ind icators. This is a material change from the previous 2 years and wi l l improve compa rab i l ity between
ut i l ities.
The Corporation is seeking to reduce the number of sewer ma in breaks and chokes by
continuing the Overflow Abatement P rogram and additiona l sewer c leaning and preventative ma intenance. I n the 2008-09 budget, add it ional funding was provided for the
sewer mains clean ing program. These in it iatives shou ld see the number of mains breaks
a nd chokes reduce over t ime.
3.2.2. Number of properties per year with a sewer overflow caused by a sewer
mains choke (SM)
This measure records the number of sewer ave/flow incidents on a customer's
property caused by a sewer mains choke. A sewer overflow is an untreated
wastewater spill or discharge from the wastewater system into a customer's
property.
Strategic Map Targets 2006-07 2007-08 2008-09 2013-14
Actual Actual Actual Target Number of Properties per year with a Sewer Overflow caused by a Sewer Mains Choke
M etro 67 52 99 75
I nside bui ld ing (8S) (80) (80)
Region a l 1 1 2 (6) (3) (3) 3
M etro 675 558 568 598
Outside b u i ld ing (6i7) (6S0) (650)
Regional 14 2 2 13 (52) (26) ( 26)
26
Note: Targets for 2006-07, 2007-08 and 2008-09 are shown in brackets below the annual result.
Performance The number of overflows occurring inside bu i ld ings in metropol itan a reas has been
increasing steadi ly s ince J u ly 2008 and resu lted in 2008-09 significantly (24%) a bove target. The resu lt for 2008-09 is a lmost double the number of properties affected by internal overflows in 2007-08. This is a reversa l of the positive performance of previous years, with
annua l reductions in this KPI ach ieved over the last two years.
There is norma l ly a correlation between the number of mains chokes and interna l overflows caused by mains chokes, however this has not been the case in 2008-09. I nvestigations a re cu rrently underway to determine the cause of the increase i n i nterna l overflows. The
25

pre l im inary a na lysis received from Un ited Water ind icates that the majority of sewer ma in
chokes a re caused by a combination of tree root intrusion and ra infa l l events. The a mount
of tree root debris removed through sewer main c leaning has increased by 74% between
2004-05 and 2008-09, ind icating that the dry conditions si nce 2006-07 may have led to an increase i n tree root intrusion i nto the sewer system.
In regiona l a reas, there a re relatively fewer choke incidences that resu lt in an overflow inside the customers' property, as ind icated by the resu lts for the last two years.
Going Forward For sewer overflows, where possible, SA Water is a im ing to i mprove its metropol itan
performance as wel l as ta rgets by 2013-14. The Corporation is seeking to ma inta in its regiona l ta rgets to 2013-14 a nd continue to perform on ta rget or better.
To meet these objectives, the Corporation is increasing its sewer c lean ing and preventative ma intenance programs in an attempt to fu rther improve these service levels .
26
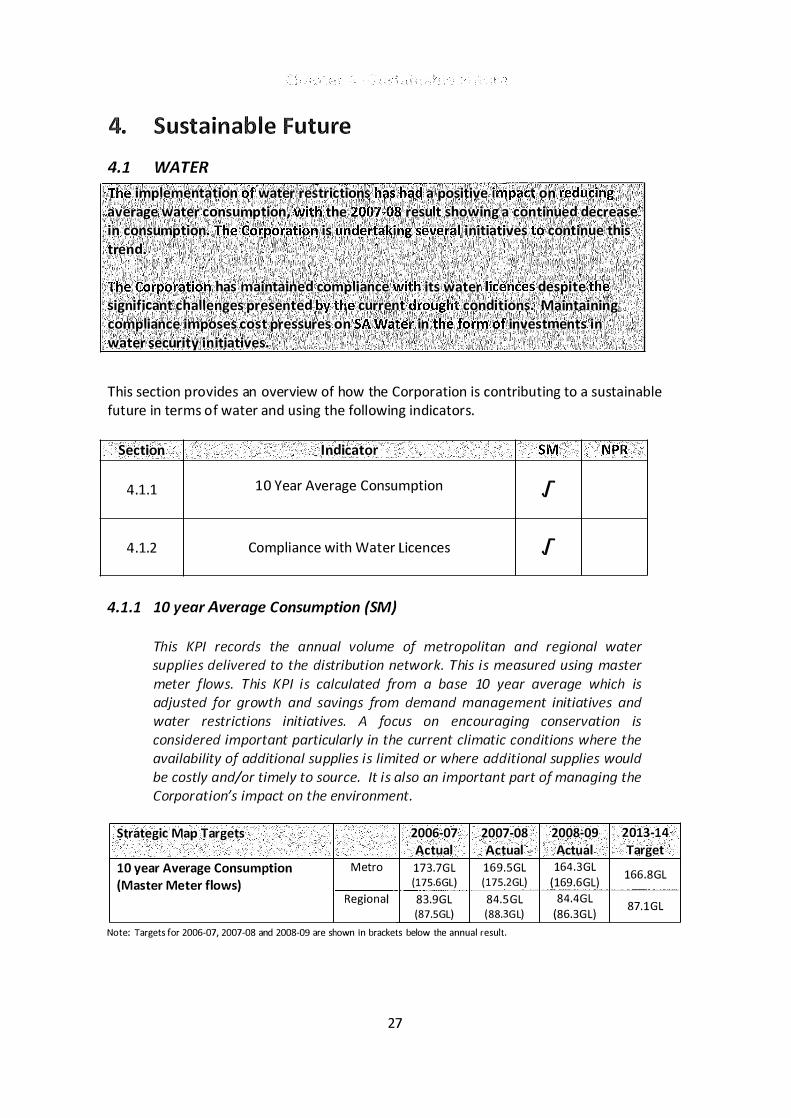
4. Susta inable Future 4.1 WATER
The implementation of water restrictions has had a positive impact on reducing average water consumption, with the 2007-08 result showing a continued decrease in consumption. The Corporation is undertaking severijl initiatives to continue this trend.
The Corporation has maintained compliance with its water l icences despite the significant challenges presented by the current drought conditions. Maintaining compliance imposes cost pressures on SA Water in the form of investments in water security initiatives.
This section p rovides an overview of how the Corporation is contribut ing to a susta inab le
future in terms of water and us ing the fol lowing ind icators.
Section I ndicator
4.1 .1 10 Year Average Consumption
4 .1.2 Compl iance with Water Licences
4.1.1 10 year Average Consumption (SMj
S M N P R
I'
I'
This KPI records the annual volume of metropolitan and regional water
supplies delivered to the distribution network. This is measured using master
meter flows. This KPI is calculated from a base 10 year average which is
adjusted for growth and savings from demand management initiatives and
water restrictions initiatives. A focus on encouraging conservation is
considered important particularly in the current climatic conditions where the
availability of additional supplies is limited or where additional supplies would
be costly and/or timely to source. It is also an important part of managing the
Corporation's impact on the environment.
Strategic Map Targets 2006-07 2007-08 2008-09 2013-14
Actual Actual Actual Target 10 year Average Consumption Metro 173.7GL 169.5GL 164.3GL 166.8GL (Master Meter flows) (175.6GL) (175.2GL)
(169.6GL
)
Regional 83.9GL 84.5GL 84.4GL 87.1GL (87.5GL) (88.3GL) (86.3GL
)
Note: Targets for 2006-07, 2007-08 and 2008-09 are shown in brackets below the annual result.
27

Performance Water consumption is ca lcu lated from a base 10 year average which is adj usted for growth,
demand management savings in itiatives a nd water restrict ions. On th is basis, the reported actua l consumption has been reducing steadi ly l a rgely due to the i m pact of water
restrictions which have been in p lace s ince 2006/07.
Ten year average water consumption in the metropol itan a rea fe l l from 173 .7G L in 2007-08
to 164.3GL in 2008-09, but in the regional a reas the leve ls increased from 83.9GL to 84.4G L
i n the same t imeframe. The 2008-09 reported resu lt for both the Metropol itan and Regional
a reas is with i n SA Water's ta rgets.
Figure 4. 1 demonstrates a rea l reduction in annua l water consu m ption with a particu larly strong response in metropol itan Adela ide. Metropo l itan Adela ide's consumption per
property has reduced from a high average of 252kL per p roperty in 2001-02 to an average of 190kL per property i n 2008-093• H istorica l ly, SA Water has reported relative ly high figu res
compared to some i nterstate cou nterparts such as Queens land and New South Wales where restrictions have been i n place for longer and were more severe. SA Water's reduction is a
resu lt of customer commitment to water conversation measures over the d rought period.
Figure 4.1
Consumption for Metro and Regional (Giga liters) 200 ---------------------------------------------------------------
3
180
160
140
120
100
80
60
40
20
o 2002-03 2003-04 2004-05 2005-06 2006-07
III Metro Consumption 0 Regional Consumption
The NPR 2008-09 was not released at the time of compiling this report.
28
2007-08 2008-09

Going Forward The Corporation is ta rgeting fu rther reductions in the 10 yea r average consumption. Where
performance has exceeded targets to date, the Corporation wi l l a im to maintain these
performance leve ls where poss ib le. However, it shou ld be noted that there is l i kely to be some bounce back in consumption when temporary water restrictions are removed .
Notwithstand ing th is, consumption is not expected to return to pre-drought levels .
SA Water and the Government is undertaking a nu mber of in itiatives to continue the
reduction in per capita consumption on a more permanent bas is . This incl udes undertaking
significant recycled water schemes, stormwater and aqu ifer recharge schemes, commercial
and industria l water aud its, and provid ing rebates for items such as ra in water tanks, AAA
shower heads, water wise garden products, new smart b i l l s a nd the introduction of
quarterly b i l l i ng.
While the 10 yea r ro l l ing average smoothes the perfo rmance, a demand prediction model (exc lud ing water conservation measures) has been developed based on popu lation, annua l
evaporation rate a nd the number of days where the temperatu re exceeds 300 C. A revised
ind icator is cu rrently u nder investigation. A Cl imate Adjusted Demand Model, cu rrently
being examined by the Murray-Darl ing Basin Commission, a ims to present c l imate adj usted
demand for the Adela ide/River Murray l icence in a transparent manner. Th is wou ld he lp to
determine the effectiveness of water savings activity independent of water restriction savings, provid ing a c learer ind ication of rea l consumption activity in the absence of water
restrictions.
4.1.2 Compliance with Water Licences (SMj
The f(PI measures SA Water's compliance (as a %) with its water licences
issued by the Department of Water, Land and Biodiversity Conservation. These
licences are issued for specified volumes of water extraction. The licences
cover allocations for metropolitan Adelaide, River Murray regional areas, the
Eyre Peninsula and the South East.
Strategic Map Targets 2006-07 2007-08 2008-09 2013-14
Actual Actual Actual Target
Compliance with Water licences
Water Extraction Within Al
location 100% 100% 100% 100% (
100%) (100%)
(100%)
Compliance wit
h Licence Con
ditions
100% 100% 100% 100% (100%)
(100%)
(100%)
Note: Targets for 2006-07, 2007-08 and 2008-09 are shown in brackets below the annua l result.
Performance Of SA Water's 62 water sources, 28 a re l icensed and for 2008-09 compl iance was achieved
for a l l l icences inc lud ing the most substantia l of these l icences, the two River M u rray l icences for supp ly to Adela ide (under normal operating conditions 650GL in any five year
period) and for supp ly to cou ntry towns (50G L per yea r) . SA Water holds an add it ional two River M urray Licences that a re not tied to water supp ly of a ny particu lar a rea . For the three
years from 2006-07 to 2008-09, SA Water achieved 100% compl iance of water extractions
29

aga inst l icensed a l locations, inc lud ing where a l locations were reduced as a resu lt of the d rought.
River Murray Metropolitan Licence - cond itions of this l icence were ach ieved by a demand reduction strategy. I n 2008-09 pumping was in accordance with the drought pumping strategy which l im ited extraction to 150 G L, whi le a l so increasing the min imum water
hold ing at the end of June if the Mt Lofty Ranges inflows were better than the requ i red
m in imum.
River Murray Country Licence - conditions of this l icence were achieved by transferring a l l of SA Water's previously pu rchased water ( unassigned Licences mentioned above) a nd
secu ring fu rther water by temporary lease a rrangements with other government agencies at
a cost of $0. 5M . Additiona l a l location secu red increased this a rea's l icence from 31 G L to 37.5GL.
Eyre Peninsula - no l icences were exceeded, however, the Polda Basin was p laced on a
Notice of Prohibition mean ing that SA Water was not a l lowed to take its fu l l a l location. SA Water received advice from DWLBC that in future years our a l locations wou ld be
red uced by up to 20%. For the more critica l supp l ies th is is being imp lemented at a
reduction of 5% per annum subject to annua l review.
South East - growth in this region exceeded long term trends a nd resu lted in a need for action to secu re add it ional supp l ies. Additiona l a l location was secured for Penola to ensure
that the l icence is not exceeded.
Shortfa l l s on other l icences and water supp l ies were a lso avoided by taking action as fo l lows:
GI Pari l la - by re-a l location from Lameroo, under a previous ly unused provision of the
Ma l lee Water Al location P lan, thus avoid ing the need to try to source water in a very
l im ited and virtua l ly inactive market; and GI U ley South - by gain ing approva l for a temporary add itiona l 5% a l location on the
basis that once the I ron Knob - Kim ba pipel ine was operat ional, SA Water's
extractions from the U ley South groundwater basin wou ld be reduced unti l they
matched the sum tota l of the orig ina l annua l base a l location.
Going Forward SA Water wi l l conti nue to ta rget 100% compl iance with its water l icences despite the
cha l lenging c l imatic conditions.
To meet this cha l lenging target and ensure an enhanced level of water security for its
customers, SA Water is i nvesting in both short term water security measures inc lud ing
addit ional pump ing a nd temporary water purchases and longer term water security measures such as c l imate-independent water sou rces and increased storage capacity. Whi lst these i n itiatives wi l l i ncrease the Corporation's operating costs, enhanced levels of water security wi l l be provided for customers and the impact on the existing sources of
supply shou ld be eased.
30

4.2 SEWERAGE
SA Water has generally performed at a high level in sewerage services. I n particular, i t h a s continued as a national leader in recycling water, maintained a strong performance in re-using bio-solids and treating sewage to tertiary level. The Corporation has complied with all EPA licence conditions and has reduced the n umber of serious wastewater notifications to the EPA.
The Corporation will continue to closely monitor the Jisks associated with overflows to the environment. The Corporation's performance for 2007'-08 in this a rea is slightly downwhen compared to 2006-07 and has some scope for improvement when compared to other utilities.
Going forward SA Water is aiming to improve wastewater service levels by increasing the percentageof wastewater recycled and reducing the number of Type 1 and Type 2 wastewater notifications to the EPA. Where performance is already high, SA Water will be seeking to maintain service levels into the future.
This section provides an overview of how the Corporation is contributing to a susta inab le
future in terms of sewerage services, us ing the fol lowing ind icators.
Section I ndicator
4.2 . 1 Percentage of Water Recycled
4.2 .2 Sewerage Treated to a Tertiary Level
4.2 .3 B io-so l ids reused
4.2.4 Sewer overflows to the environment
4.2 .5 EPA l icence compl iance
4.2 .6 N u mber of Type 1 & 2 wastewater notifications
4.2. 1 Percentage of Water Recycled (SM & NPR)
SM NPR
f f
f
f
f
f
f
This f(PI measures (as a %) the quantity of all metropolitan/regional
wastewater that is collected, treated and reused by either the water business
itself or a customer supplied by the water business.
31

Strategic Map Targets 2006-07 2007-08
Actual Actual Metro 30% 31%
Percentage of Water Recycled
(24%)
(25%)
Regional
19% 24% (18%)
(20%)
Note: Targets for 2006-07, 2007-08 and 2008-09 are shown in brackets below the annual result.
Table 4.1
Recycled water (% of effluent recycled) - Metro
SA Water
Gold Coast Water
Barwon Water
ACTEW Corporation
Brisbane Water
Hunter Water
Water Corporation
Sydney Water
Power & Water Corp · Darwin
South East Water Ltd
Yarra Valley Water
City West Water
Metro Averaqe
100
80
60
40
20
o East
Gippsland Water
State I Territory 2002·03 2003·04 2004·05 2005·06
SA 1 9.2% 21 .4% 20.0% 1 8.0%
Qld 1 2.0% 1 2.0% 1 4.0% 1 0.0%
Vic 1 2.0%
ACT 7.3% 8. 1 % 7.9% 6.7%
Qld 3.5% 3.2% 5.0% 4.8%
NSW 7.0% 8.0% 6.0% 7.0%
WA 5.0%
NSW 4.0%
NT 3.0%
Vic 2.0%
Vic 0.0%
Vic 0 .0% 0.0% 0.0%
9.8% 8.8% 8.8% 6.0%
Recycled water (% of effluent recycled) - Regional
Countty SA Water - SA Water - Power & Byron Energy Whyalla IVIt Water Shire
Gambier Corp - Council Alice
Springs
2008-09
Actual 31% (28%) 24% (23%)
2006·07 30.0%
1 5.0%
1 8.0%
6.8%
6.6%
5.0%
6.0%
4.0%
3.0%
3.0%
1 .0%
0.0%
8.2%
South Gippsland
V·Jater
_ 2007-08 - Regional Average 2007-08
Performance
2013-14
Target
34.8%
29.3%
2007·08 31 .0%
1 4.0%
1 3.0%
1 2.3%
6.3%
6.0%
6.0%
4.0%
3.0%
2 .0%
0.0%
0.0%
8.1%
During 2007-08, SA Water recycled approximately 25,562 ML (31%) of metropol itan treated
wastewater a nd 2,255 ML (24%) of regional treated wastewater.
32

The improving trend in performance over t ime for SA Water is related to sign ificant
upgrades to wastewater treatment plants ( refer to Chapter 5 .3 regarding Capital
Expenditu re for fu rther deta i l s ) . For metropol itan operations, over the last seven years SA Water has been a strong performer a nd is consistently better than the average.
In 2007-08 SA Water reported aga inst this ind icator for Mt Gambier and Whya l l a . Mt
Gambier does not recycle any of the effluent produced as a l l treated wastewater is
discharged to the sea . Whya l la recycled 35% of the eff luent in 2007-08 year, which equates
to the average when compared to other regional wastewater ut i l ities. Al l effl uent recycled
in Whya l l a is supp l ied to the golf course and counci l uses, such as park maintenance.
Ade la ide's high performance continued i nto 2008-094 with 31% for the second year .
Whya l la improved on 2007-08 figures with 44.8% recycled in 2008-09 and Mt Gambier remains at 0%.
Drought conditions, water restrictions and a c lea r pub l ic focus on water management has meant lower sewage inflows over the past 5 years. Performance over 2006-07 to 2008-09 ind icates that the percentage of recycled effl uent has remained steady (rising on ly 1%)
despite changing c l imatic conditions. Although sewerage inflows have started to pick u p most recently (2008-09), the ava i lab le effl uent h a s an impact on the percent recycled . There
is s ignificant effl uent ava i lab le at G lene lg WWTP, and with commissioning of the G lenelg-toAdela ide Parklands (GAP) project, G lenelg reuse wi l l increase to 43%. Assum ing no other
major changes to sewage volumes or reuse at other p lants, this wi l l raise the overa l l
metropol itan re-use to approximate ly 40%. Bo l iva r WWTP wi l l remain the most sign ificant provider of effl uent.
Going Forward Through the Water for Good Plan, the South Austra l i an G overnment has made a
commitment to achieve a target of 45% water recycl ing i n the long term. I n l i ne with th is
commitment, SA Water wi l l review the Corporation's i nternal recycled water ta rget a nd
seek to improve its performance in th is a rea accord ingly.
4.2.2 Sewerage Treated to a Tertiary Level (NPR)
There are typically three levels of sewage treatment, primary,
secondary and tertiary. Tertiary treatment is the most complex and
sophisticated process. It is principally designed to remove nutrients,
such as phosphorus (typically <2 mg/L) and/or nitrogen (typically <15
mg/L). A high percentage of effluent suspended solids (typically >95
per cent) are also removed. Tertiary treatment may additionally target
other contaminants of concern, (e.g. toxicants and salt) for discharges
into sensitive waterways or reuse applications where high quality
recycled water is required.
4 The NPR 2008-09 was not released at the time of compiling this report.
33

Table 4.2
Sewage treated to a tertiary level (%) - Metro
State I Territory 2002-03 2003-04 2004-05 2005-06 2006-07
ACTEW Corporation ACT 1 00% 1 00% 1 00% 1 00% 1 00%
Gold Coast Water Qld 1 00% 1 00% 1 00% 1 00% 1 00%
SA Water SA 82% 91 % 97% 1 00% 1 00%
City West Water Vic 0% 0% 0% 0% 50%
Brisbane Water Qld 76% 67% 66% 68% 68%
Yarra Valley Water Vic
Water Corporation WA 4 1 % 40% 39% 95% 94%
Hunter Water NSW 46% 48% 45% 46% 44%
Sydney Water NSW 22% 22%
South East Water Ltd Vic 21 % 23%
Barwon Water Vic 0% 0% 0% 7% 7%
Power & Water Corp - Darwin NT 2% 3%
Metro Averaqe
100
80
60
40
20
o
Performance
55.6% 55.7% 55.9%
Sewerage treated to a tertiary level (%) - Regional
Byron Shire East Gippsland SA Water - Ivl t SA Water -Council Water Gambier Whyal la
51 .0% 55.5%
South Gippsland
Water
_ 2007-08 -- Regional Average 2007-08
2007-08 1 00%
1 00%
1 00%
1 00%
98.9%
95%
94%
44%
22%
1 8%
7%
3%
65.2%
SA Water a ims to treat 100% of sewage to the tert iary leve l . This target has been ach ieved
every year s ince 2005-06 for metropol itan Adela ide a nd is well above the nationa l Metro
average on 65.2% in 2007-08. ACTEW Corporation Gold Coast Water and City West have a l l
ach ieved 100% over the same t ime period.
The trend for SA Water has shown a significant improvement over the reporting period
pr imari ly due to major upgrades of wastewater treatment plants in Adela ide over the last 5-10 years to red uce environmental impacts.
34

I n 2007-08 SA Water reported the percentage of sewage that is treated to a tert iary level i n the regional a reas of Mt Gambier, with 100%, and Whya l l a, with on ly 18.3%. The low level
sewage treated to a tertiary level in Whya l l a is attri buted to there being two p lants in the
Whya l l a system with d iffering leve ls of capacity for sewage treatment. Whya l la's Wastewater Treatment P lant (WWTP) is on ly ab le to treat to the secondary level of sewage
treatment; the second plant, Water Reclamation P lant (WRP), is more advanced and can
treat to the tertiary leve l .
Going Forward SA Water is a im ing to conti nue to achieve the 100% sewage treatment to the tert iary level
in its metropol itan a rea and Mt Gambier, and wi l l manage operating and capital
i nvestments with th is objective in m ind . I n l ine with SA Water's ta rget of increasing recycl i ng of wastewater in regional a reas, SA Water wil l a lso seek to treat a greater
percentage of its sewage in Whya l l a to tertia ry level in the future
4.2.3 Bio-solids reused (NPR)
This KPI measures (as a %) the quantum of bio-solids that are reused.
Reuse involves managing biosolids safely and sustainably to
beneficially utilise their nutrien t, energy, or other values. This may
include biosolids used for agriculture (e.g. fertiliser), soil conditioning,
mine rehabilitation, and other applications recognised as reuse. The
percentage of biosolids reused may be greater than 100 percent of
biosolids produced if the business is also reusing existing stockpiles.
Table 4.3
Biosolids reused (%)
State I Territory 2002·03 2003·04 2004·05 2005·06 2006·07
Metro SA Water SA 1 44% 1 68% 1 29% 95% 94. 1 %
Barwon Water Vic 0% 45.4% 259.6% 66.8% 21 6.7%
South East Water Ltd Vic 1 77.2% 1 2 1 .7% 33.4% 321 .5% 21 8%
ACTEW Corporation ACT 1 00% 1 00% 1 00% 1 00% 1 00%
Brisbane Water Qld 1 00% 1 00% 1 00% 1 00%
Gold Coast Water Qld 1 00% 1 00% 1 00% 1 00% 1 00%
Hunter Water NSW 83% 99% 89% 88% 1 04%
Sydney Water NSW 1 00% 1 00% 1 00% 1 00% 1 00%
City West Water Vic 60%
Water Corporation WA 97.7% 93.2% 96% 99.9% 1 00%
Yarra Valley Water Vic 0% 0% 0%
Metro Average 1 00.2% 103.0% 100.7% 1 07.1% 108.4%
Performance
2007·08
324%
1 20.2%
1 00 . 1%
1 00%
1 00%
1 00%
1 00%
1 00%
1 00%
95.9%
0%
1 12.7%
SA Water has been a high performer in biosol ids reuse for the last 6 years. In 2007-08 SA Water peaked at 324% for Adela ide .
35

Neither of the regiona l areas of Mt Gambier and Whya l l a reused bioso l ids in the 2007-08
year.
The figure for Adelaide in 2008-095 is 273%. Mt Gambier reported biosol ids reuse of 8% and Whya l la continued to remain at 0%. At Whya l l a WRP, the solids from the activated s l udge
process a re discharged to sewer a nd transported to the WWTP (primari ly lagoons) . Every
few years, when the lagoons fi l l with sol ids they a re taken offl ine and a l lowed to d ry out.
Once the lagoon is dry the dried s ludge wi l l be disposed for reuse. This process takes a few
years and therefore Whya l la on ly sporad ica l ly reports biosol ids reuse. I n Mt Gambier the
s lu dge is transported into s ludge lagoons wh ich, depending on the hold ing capacity, wou ld
fi l l u p and be d ried out sporadica l ly as wel l .
Going Forward If ferti l iser costs continue to be h igh it is expected that high demand for the bio-sol ids wi l l
continue in agricu lture . SA Water w i l l continue to provide bioso l ids for reuse in l i ne with capacity a nd demand l im itations.
4.2.4 Sewer overflows to the environment (NPR)
This f(PI reports the number of sewer overflows to the environment relative to
the length of sewer main (100km). Overflows are those caused by system
faults originating in the system under the water utility's responsibility.
Table 4.4 Sewer overflows to the environment (per 1 00 km of main)
State I Territorv 2002-03 2003-04 2004-05 2005-06 2006-07 2007-08
Metro City West Water Vic 6 5 4
Power & Water Corp - Darwin NT 9 7 7 6 6 6
South East Water Ltd Vic 4 5 7 6
Gold Coast Water Qld 20 8 21 1 1 6 1 0
Water Corporation WA 1 0 9 9 9 1 1 1 0
Brisbane Water Qld 1 9.5 20.3 1 2 .3 8.7 7.8 1 1
Barwon Water Vic 26 23 1 8 1 9 22 1 8
SA Water SA 1 4 1 4 1 5 1 3 1 9 23
Yarra Valley Water Vic 3 1 28 34 30
Hunter Water NSW 45 46 51 42 53 43
Sydney Water NSW 83 73 82 87 90 64
ACTEW Corporation ACT 1 03 97 1 07 77 82 80
Metro Average 36.7 32.9 32.5 25.9 28.6 25.4
5 The NPR 2008-09 was not released at the time of compiling this report.
36
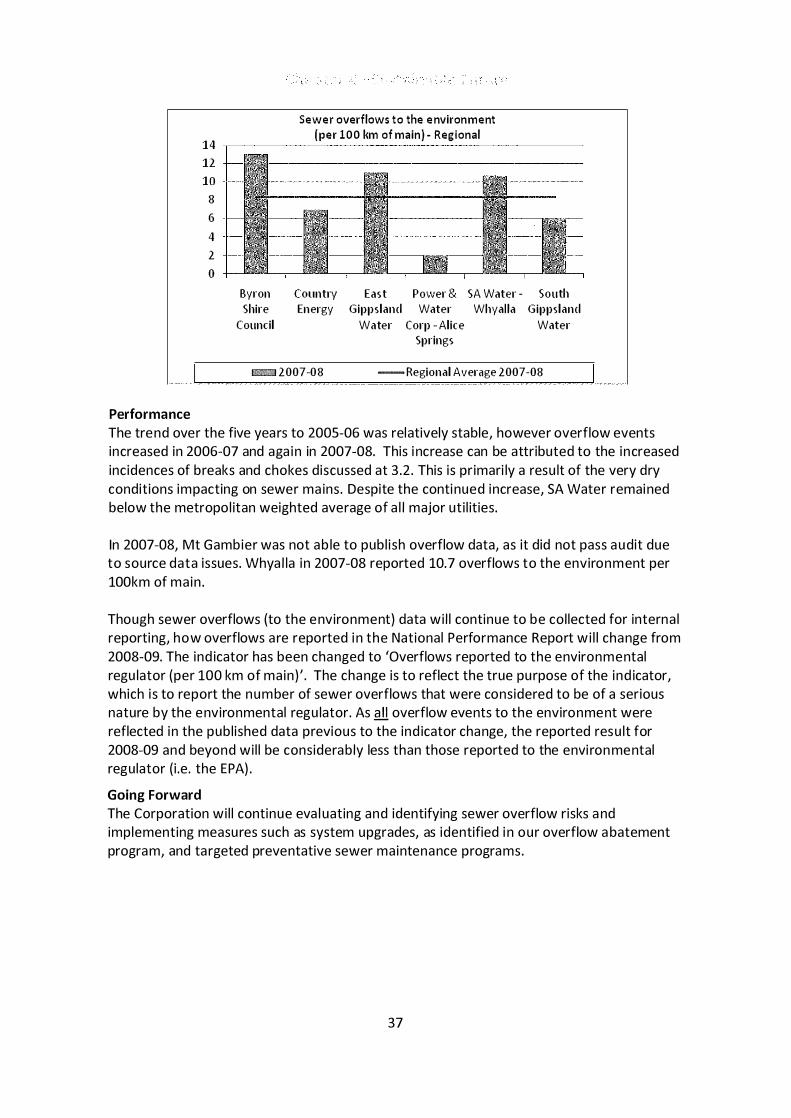
Performance
Sewer overflows to the environment
[per 1 0 0 km of main) - Regional 14 ,-------------------------------------------12 10
8 6 4 2 o
Byron Shire
Council
COllntrv Energy
_ 2007-08
Eas t Power & SA Water - South Gippsland Water Whya"a Gippsland
Water Corp - Alice Water Springs
- Regional Average 2007-08
The trend over the five years to 2005-06 was relatively stable, however overflow events increased in 2006-07 and aga in in 2007-08. This i ncrease can be attributed to the increased
incidences of breaks and chokes discussed at 3 .2 . This is pr imari ly a resu lt of the very dry
conditions impacting on sewer ma ins. Despite the conti nued increase, SA Water remained below the metropol itan weighted average of a l l major ut i l ities.
In 2007-08, Mt Gambier was not ab le to publ ish overflow data, as it did not pass a udit due to source data issues. Whya l la in 2007-08 reported 10.7 overflows to the environment per
100km of ma in .
Though sewer overflows (to the environment) data wi l l continue to be col lected for interna l reporting, how overflows a re reported i n the National Performance Report wi l l change from
2008-09. The ind icator has been changed to 'Overflows reported to the environmental
regu lator (per 100 km of main ) ' . The change is to reflect the true purpose of the ind icator, which is to report the number of sewer overflows that were considered to be of a serious nature by the environmental regu lator. As ill! overflow events to the environment were
reflected in the pub l ished data previous to the ind icator change, the reported resu lt for
2008-09 and beyond wi l l be considerab ly less than those reported to the envi ron mental regu lator ( i .e. the EPA) .
Going Forward The Corporation wi l l continue eva l uating and identifying sewer overflow risks a nd implementing measures such as system upgrades, as identified i n our overflow a batement
program, and ta rgeted preventative sewer maintenance programs.
37

4.2.5 EPA l icence compliance (SM)
SA Water's wastewater treatment plants are separately licensed by the EPA in
order to manage discharges to the environment. The Corporation also has
licenses for other processes such as abrasive blasting, transferring of treated
water, dealing with specified (listed) waste, and discharging storm water to
aquifers. This f(PI measures compliance (as a %) with these licences.
Strategic Map Targets 2006-07 2007-08 2008-09 2013-14
Actual Actual Actua l Target
EPA licence Compliance 100% 100% 97% 100% (100%) (100%) (100%)
Note: Targets for 2006-07, 2007-08 and 2008-09 are shown in brackets below the annual result.
Performance EPA l icence compl iance was not met for the first t ime in 2008-09 due to a s ing le m inor
incident associated with the discharge to Marine or I n land Water - Streaky Bay Aquifer Storage a nd Recovery Licence. Non-compl iance with l icence conditions occurred due to
fa i l u re of de-ch lorination equ ipment a nd seria l communications at the site.
Overa l l , SA Water's wastewater treatment plants, which a re l icensed by the E PA in order to
manage discharges into the environment, show reduced levels of discharge of n itrogen and phosphorous over the last ten years. See Figures 4.2 and 4.3 below.
Figure 4.2
Nit rogen in Metropolitan Wastewater Treatment Plant discharges
Tonnes per annum: 1996-97 to 2008-09 3500 ,-------------------------------------------------------
3000
2500
2000
1500
1000
500
o
The focus of u pgrade works at the metropol itan wastewater treatment plants has been to reduce the concentrations and loads of n itrogen discharged into the marine environment, as
evident in the trend in Figure 4.2, as nitrogen impacts on the health of seagrass.
38

Figure 4.3
35
30
25
20
15
10
5
o
Phosphorus in Country Wastewater Treatment Plant discharges to inland waters
Tonnes per annum : 1996-97 to 2008-09
Discharge to i n land waters from SA Water's regional wastewater treatment p lants has
focussed on phosphorous concentration and load reductions as phosphorous contri butes to
a lga l growth in fresh water systems.
Going Forward SA Water is a im ing to ma inta in 100% compl iance with EPA l icences going forward and continue to reduce nitrogen and phosphorous concentration i n the discharge i n the metropol itan and country a reas respectively.
4.2.6 Number of Type 1 & 2 wastewater notifications (SMj
This {(PI measures the number of Type 1 & 2 wastewater alert incidents
(environment wastewater incidents) reported by SA Water to the EPA under a
protocol agreed by each organisation. Type 1 incidents are those that are
causing or threatening to cause serious or material environmental harm. Type
2 incidents are those that are causing or that could cause environmental harm
but are not of a high impact or on a wide scale.
Strategic Map Targets 2006-07 2007-08 2008-09 2013-14
Actual Actual Actual Target Type 1 & 2 Waste Water Notifications 98 73 62 92
(113) (108) (102) Note: Targets for 2006-07, 2007-08 and 2008-09 are shown in brackets below the a nnual result.
Performance SA Water seeks to prevent envi ronmental incidents. However, the size and natu re of the Corporation's operations and systems at t imes leads to fa i l u res and overflows.
39

There were 62 Type 1 a nd Type 2 environmental notifications in 2008-09, down from 73 in
2007-08 and 98 i n 2006-07. Th is resu lt is wel l below the 2008-09 target of 102 . Causes of
the incidents inc luded:
• overflows due to h igh ra infa l l events overload ing sewer networks;
• sewer chokes; and
• va lve and level detection fa i l u res.
Several wastewater overflows involved discharges which entered water bodies (both in land
and marine) and may have caused loca l i sed environmental impact. Some of these overflows
were caused by external events beyond SA Water's contro l .
Most environmental incidents a re related to wastewater overflows caused by sewer
blockages from tree root intrusion, foreign bodies and fats and oils. Some overflows are
caused through power fa i l u res. P rograms a re currently in p lace to u pgrade infrastructure to
prevent sewer overflows from occurring in problematic a reas. I ncreased preventative
maintenance is a lso in p lace to min imise the risk of chokes in sewers.
I nvestment in overflow a batement, combined with lower rainfa l l, contributed to SA Water staying with in its ta rget for wastewater environmenta l notifications for 2006-07, 2007-08 and 2008-09.
Going Forward
SA Water is a im ing to lower the ta rget going forward and wi l l a im to mainta i n cu rrent high performance leve ls where poss ib le .
As mentioned above, SA Water is continua l ly eva luating and identifying sewer overflow risks
and implementing measures such as system upgrades as identified in the Corporation's
overflow abatement program and ta rgeted preventative sewer ma intenance programs.
Ana lysis of inc ident types wi l l conti nue to be undertaken to identify incidents which a re
contro l lab le and changes in work p ractice to enable fu rther reductions in inc ident numbers .
Th is wi l l assist in d i recting i nvestment of the abatement program .
40

4.3 CLIMATE
For its metropolitan sector, SA Water's net greenhouse gas emissions in recent drought years are very high.compared to other utilities due to its electricity usage being directly related to the need to pump water from the River Murray. Up to 90% of Adelaide's water is supplied from the River Murray in d rought years.
In the regional sector, the Corporation reported a relatively low net greenhouse gas emissions for Mt Gambier, while Whyalla reported a high figure due to electricity usage for pumping water from the Murray.
SA Water is seeking to reduce its greenhouse gas emissions to comply with the Kyoto Protocol (108% of 1990 levels by 2012). Several other initiatives are being implemented toenhance electricity efficiency and reduce the Corporation's environmental impact.
This section provides an overview of how the Corporation is contributing to a susta inab le futu re in terms of c l imate, us ing the fo l lowing ind icator.
Section I ndicator
4.3 . 1 Net tonnes of greenhouse gas em itted
4.3.1 Net tonnes of greenhouse gas emitted (SM & NPR)
S M NPR
f f
This f(PI measures the net tonnage of greenhouse gas emissions from the
business. Reductions in emissions can be achieved by sequestration;
renewable energy purchases and energy recovery projects (SM definition).
Strategic Map Targets 2006-07 2007-08 2008-09 2013-14
Actual Actual Actual Target Net Tonnes of Greenhouse Gas 675,061 433,816 405,000 405,000 per Emitted1 (405,000) ca
lendar year
Note: The target for 2008-09 is shown i n brackets below the annual result.
The Corporation's SM figu res above a re reported on a total Corporation basis and incl u de regional operations.
41

Table 4.5 (NPR)
Net Greenhouse Gas Emissions (tonnes C02-Equivalent per 1,000 properties)
State I Territory 2002-03 2003-04 2004-05 2005-06 2006-07
Metro City West Water Vic 24 26
Yarra Valley Water Vic 38 39 40 23
South East Water Ltd Vic 60 58 54 55
Sydney Water NSW
Brisbane Water Old
Hunter Water NSW 396 393 390 362
ACTEW Corporation ACT 279 223 220 220
Gold Coast Water Old 406 459 425 328
Barwon Water Vic 454 450
Power & Water Corp - Darwin NT
Water Corporation WA
SA Water SA 925 581 573 533
Metro Averaqe 351 292 273 250
Total net greenhouse gas emissions (net tonnes C02-equivalents)
(per 1000 properties) - Regional 5000 .-----------�----��--�--�---------------
4000 ��--------------------------�
3000 +----------------------------
2000 -j---------------------------�
1000 -I�--------------------------� '
o Byron Shire Power & SA Water - !VI t SA VVater -
Council Water Corp - Gambier Why alia Alice Springs
South Gippsland
Water
- 2007-08 - Regional Average
Performance
21
22
47
371
287
369
457
433
845
317
2007-08
1 0
38
43
240
333
333
357
380
4 1 4
509
584
994
353
SA Water has consistently been a h igh emitter of greenhouse gas. This conti nued into
2007-08 with 994 net tonnes per 1,000 properties for metropol itan operations, which is
significantly higher than a ny other major metropol itan uti l ity. This is pr imari ly due to the Corporation's e lectricity usage being d irectly related to the need to pump water from the
River Murray. Up to 90% of Adela ide's water is supp l ied from the River M urray in drought
years.
The 2007-08 NPR was the fi rst year that SA Water reported green house gas em issions for
the regional centres. Mt Gambier reported 520 net ton nes per 1,000 properties and Whya l la reported 4,688 net tonnes per 1,000 properties, the highest for s im i la r sized regional
42

ut i l ities. Whya l la's figure is re latively high due to the high energy use associated with
pumping water to Whya l la from the River Murray because there is a l a rge industrial base
withi n the boundary of Whya l la with high water demand. The em issions produced by
del ivering this water a re spread over a much lower customer base, resulting in high emission level per property.
I n 2006-07 SA Water's emissions on a tota l Corporation basis (SM) were at a h istorica l maximum of 675,000 tonnes C02-e (net) due to pumping requ i rements. During 2007-08,
SA Water's major pumping has been curta i led. SA Water's greenhouse gas mitigation activities he lped curtai l em issions from a gross va lue of over 700,000 tonnes CO2-e.
SA Water's actua l figu re of 405,000 net tonnes of greenhouse gas em issions in 2008-09, as
reported in the table above, reflects purchasing of carbon credits to negate the
corporations' high emissions.
SA Water has h istorica l ly had high energy use and greenhouse gas em issions compared with other states. As desa l i nation plants a re establ ished, other water ut i l ities are increasingly
becoming greenhouse intensive as wel l . SA Water's greenhouse management actions as
outl i ned below are designed to constra in emissions.
Going Forward SA Water is seeking a reduction in net greenhouse gas emissions to ensure compl iance with
the Kyoto P rotocol . The annua l target of 405 000 net tonnes of greenhouse gas em itted is
equ iva lent to the Kyoto commitment, being 108% of 1990 emission levels. Based on current
calcu lat ions this equates to 804 net tonnes per 1,000 properties, which is sti l l greater than the average of a l l States.
The Corporation has u ndertaken extensive consu ltation on its C l imate Change Sector
Agreement. The agreement sets out targets inc lud ing: ED achieving comp l iance with the Kyoto Protocol (period 2008-2012); ED achieving 20% renewable energy use; and ED reducing emissions by 60% compared with 1990 leve ls by 2050.
As of ea rly 2008 SA Water has made s ign ificant efforts to- identify the potentia l
environmental impacts from greenhouse gas emissions associated with the construction,
operation a nd eventua l decommiss ion ing of any new capital work projects within SA Water
at the deve lopment stage and throughout the design process. The efforts support the development of strategies to reduce energy use, whi le encompassing the integration of
greenhouse gas footprint eva l uation into SA Water's procu rement, project management,
p lann ing and design stages.
The Green ing of Government (GoGO) Framework, a pproved by Cabinet in 2006, provides an implementation framework for agencies to progress greening p lans. SA Water has
completed key strategic mi lestones for the framework and has adopted the principles of GoGO a round susta inab le workplace operations. The Corporation has a lso supported other government agencies in attem pting to meet the GoGO mi lestones.
43

Underlying growth trends, the need for add itiona l water security p rojects, higher qua l ity
wastewater requ i rements a nd wastewater recycl ing a re a l so causing SA Water's emissions
to grow. However, SA Water wi l l manage its net greenhouse gas em issions performance i n
accordance with its C l imate Change Sector Agreement with t h e Government o f South Austra l i a . This i nc ludes com m itments to use more renewable energy, expa nd energy recovery and renewable energy projects, mainta in revegetation programs and adhere to the
government commitment that the Adela ide Desa l ination Plant wi l l be carbon neutra l .
44

s. Commercia l Success Overview The service leve ls discussed in previous sections of this report a re del ivered at a cost to the Corporation's customers . Consistent with NWI requ i rements, the Corporation incorporates
efficient operating costs and capita l expenditu re within the price charged to customers .
The purpose of this chapter is to i l l ustrate that for a given level of services provided (as per
ear l ier chapters) SA Water is provid ing them at an efficient cost leve l . Efficiency is genera l ly defined as ach ieving a given outcome with min imum effort or waste.
In science based fields, such as physics, efficiency can be precisely measured however, there
is no d i rect method to measure the efficiency of a ut i l ity. The two main methods used to
est imate a uti l ities' effic iency a re : (1 ) to benchmark performance against other l i ke uti l ities;
and/or (2) measure its performance over t ime.
The pr imary pu rpose for benchmarking operating cost performance is to ascertain whether the level of service provided by the Corporation is being del ivered at a comparab le cost.
The basic hypothesis being, that if the Corporation is de l ivering s imi lar or improved leve ls of
service at lower cost, the Corporation is more efficient.
Notwithstand ing that both benchmarking and performance ana lysis have significant short
comings, the remainder of this chapter wi l l out l ine SA Water's performance against other providers (using the 2007-08 Nationa l Performance Report (NPR)), and over t ime. I t
i l l u strates that SA Water is a low cost and, therefore, efficient operator.
As many of SA Water's costs cut across the entire Corporation, this chapter provides information on a whole-of-corporation basis and, where relevant information is ava i lab le, it
is broken down i nto the Corporation's four ma in business segments.
The Corporation's Strategic Map inc ludes measures that relate to profit before tax, return on assets and capita l expend itu re. The key components of these measures, to be ana lysed
from an effic iency perspective, are closely associated with operating costs and capita l
expenditu re reported in the 2007-08 N PR. As such, no fu rther ana lysis on the Strategic Map measu res was considered necessary in this chapter.
Al l figu res quoted in this chapter, u n less stated otherwise, a re shown in rea l 2007-08 do l lars in l ine with the 2007-08 N PR.
45

5.1 OPERATING COSTS
5.1.1 Whole of Corporation operating costs
Water Security continues to be the primary driver for significant increases in operating costs for the. Corporation. From 2006-07 SA Water has been pumping around 90% of its annual metropolitan water supply from the River Murray, as wel l a s enforcing continued water restrictions. In the future water security will be provided by the Adelaide Desalination Plant, although this level of security will come at a significant cost.
The fo l lowing section focuses on the operati ng performance from a whole of Corporation
perspective. Figu re 5 . 1 . 1 below i l l ustrates the rea l operating costs from 2006-07 to
2008-09.
Figure 5.1 .1
Whole of corporation real operating cost ($ mil l ion) 400 ,----------------------------------------------------------
350 ���:==::::=:::::.:.:.:::::==
300 i=:= 250 +----------------------------------------------------------
200 +-----------------------------------------------------------
150 +----------------------------------------------------------
100 +----------------------------------------------------------
50 1----------------------------------------------------------
o +----------------------------.----------------------------� 2006-07 2007-08 2008-09
There is a s ignificant increase in operating costs over this period, cha racterised by a step
increase in costs in 2008-09.
The costs a re fu rther d isaggregated in Figure 5 . 1.2 to i l l u strate the change in operating
costs.
46

Figure 5,1.2
Whole of corporation real operating cost components ($ mil l ion)
140 �------------------------------------------------------------
120 +-----------------------------------------------------���--. . . . . . . . . . . . . . . . . .
• • • • • • • • • • • • • • • • • u • • • • • •
100 +,:-:-,-:-: . . -:-. . =-=-,-:-: . . :-=-, :;-;: . . --:: • • = .... . :.-. ....... ....... . COC . ....... . iO . .... 01 . ........ .-.-.-.-.-.�.-.-----'-'-"-'�-----------------------
. . _ . . _ . . _ . . =-. :...;;:;:: '.;,.;r;:r -
- - -- - -60 +------------------_-=�---��--==---------------------------------
f-- - - - -40 ����============::========����=-20 +--------------------------------------------------------------
o +-------------------------------,---------------------------- ----�
2006-07 2007-08 2008-09
- • • Labour -- Electricity - • - Chemicals - - - - - Materials . . . . . . . . . Contractors & Consultants - - other
Over the period, materials and chemicals costs remain relatively stable and make up a smal l
p roportion of operating costs (5% of tota l operating costs in 2008-09) . The costs that show significant variance over the period and a re materia l i n terms of total operating costs a re
out l i ned below.
Increase in other expenses
A sign ificant increase in other expenditure from 2006-07 to 2008-09 is driven pr imari ly by:
CI a $10 mi l l ion increase in expenditure in 2008-09 associated with Ex Gratia payments made to SA Water customer's for the 2007-08 financia l year, as a result of a change in
the Corporation's b i l l i ng pol icy; CI the commencement of the Corporation's H20 M E water effic iency rebates scheme in
2007-08. Expenditure on th i s program continues to i ncrease annua lly and is antici pated
to cost the Corporation in total a round $30 mi l l ion over its l ife, on its completion at the end of 2010-11; and
CI addit ional ad-hoc water purchases to ma inta in water l icence compl iance as wel l as
provide water security in d rought conditions (refer Section 4.1 .2 ) .
Increase in contractors and consultant expenditure Note that this expenditure inc ludes the Corporation's expenditu re associated with the
Un ited Water contract.
Contractor and consultant expenditure increased sign ificantly from 2006-07 to 2008-09, driven main ly by:
CI pre l imina ry works on a temporary weir; CI add it ional water level management at Lake Albert;
47

• i ncreases in United Water contract costs as a resu lt of the contracted contract
esca lat ion as wel l as increased activity related to bioso l ids management, sewer clean ing
and the commencement of the leakage detection program;
• special ist service providers and contractor's engaged on the Adela ide Desa l i nation P lant (ADP) project;
411 i ncreases in contract labou r over the period to de l ive r the H20ME water effic iency
rebates scheme;
• higher than antici pated housing development activity over the period, development
was at its h ighest level for 14 years in 2007-08; and
ED a general i ncrease in costs associated with continued high workloads as a resu lt of the
ongoing d rought conditions, part icula rly in the a reas of water qua l ity and water security p rojects.
Contractor and consultant expend itu re is expected to continue to trend upwards. The
increase is d riven by payments to the Adela ideAqua consort ium to operate and mainta i n the
ADP. Fi rst water for the ADP is expected in December 2010, construction works on the
p lant wi l l continue after first water to increase the capacity to 50 giga l itres per year by
August 2011, whi le the expanded capacity of 100 giga l itres per year wi l l be del ivered by the end of 2012.
Labour
The Corporation's labour costs increase from 2006-07 to 2008-09, but then remain relatively
stab le over the period . The increase in labour cost from 2007-08 to 2008-09 relates to wage esca lation of a pproximately $8 mi l l ion as well as an increase in the number of fu l l t ime
employees.
Additiona l fu l l t ime employees have been requ i red over the period 2006-07 to 2008-09 to
manage the h igher leve ls of capita l expenditu re, continued strong bu i ld ing activity and
d rought response. This inc ludes labour costs for water conservation officers and addit ional ca l l centre resources. Water conservation measures were introduced in 2003, with Level 2
water restrictions introduced in October 2006 and Level 3 restrictions introduced in
January 2007.
The i ncrease associated with additiona l FTEs as wel l as h igher wage esca lation has been offset in part by lower l i ab i l ities for workers compensatio n and annua l leave, as wel l as
l a rger amounts of labour capital ised.
The Workforce Replenishment Strategy wil l i ncrease labour costs across the Corporation
from 2007-08 i n order to min imise the impact of generationa l change in the core professiona l and techn ical workforce.
48
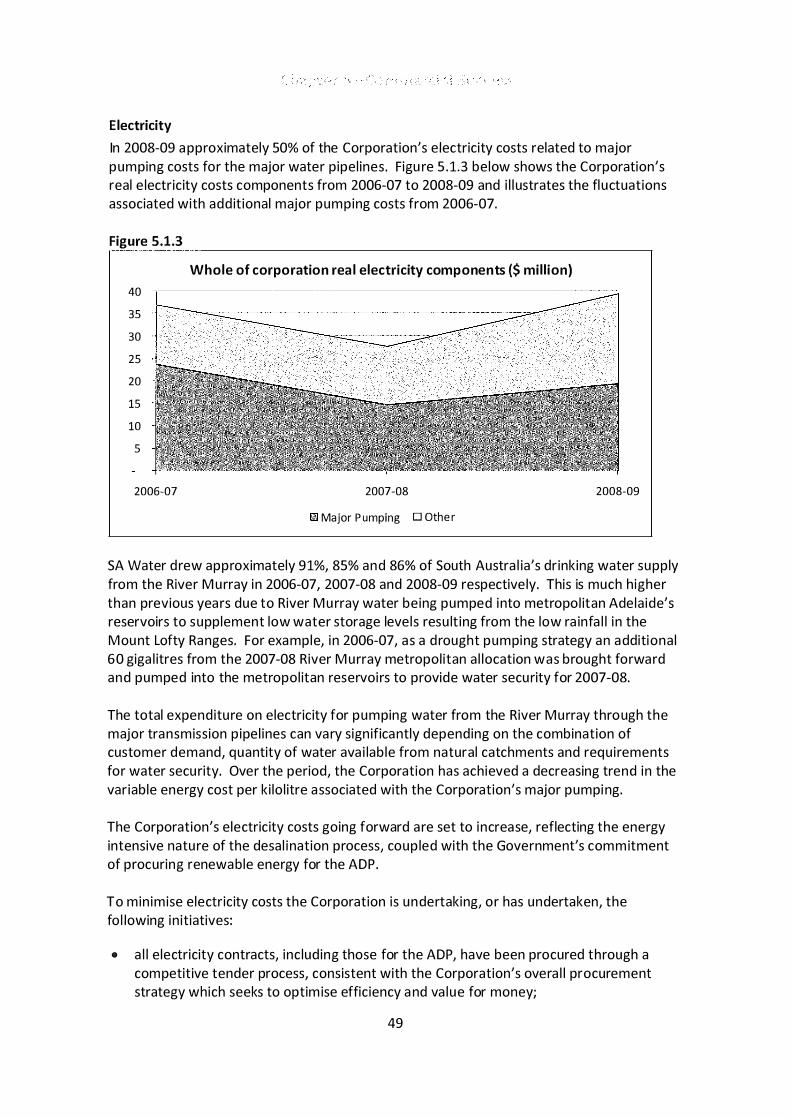
Electricity
In 2008-09 a pproximately 50% of the Corporation's e lectricity costs related to major
pumping costs for the major water pipel ines. Figu re 5 . 1.3 below shows the Corporation's real e lectricity costs components from 2006-07 to 2008-09 and i l l ustrates the fl uctuations associated with add it ional major pumping costs from 2006-07.
Figure 5.1.3
40
35
30
25
20
15
10
5
2006-07
Whole of corporation rea l electricity components ($ mil l ion)
2007-08
Il!l Major P umping 0 Othe r
2008-09
SA Water d rew approximately 91%, 85% and 86% of South Austra l ia's dr inking water supp ly
from the River M urray in 2006-07, 2007-08 and 2008-09 respective ly. This is much higher
than previous years due to River M u rray water being pumped into metropol itan Adela ide's reservoirs to supplement low water storage leve ls resu lt ing from the low ra infa l l i n the
Mou nt Lofty Ranges. For example, in 2006-07, as a d rought pumping strategy an additiona l
60 giga l itres from the 2007-08 River M urray metropol itan a l location was brought forward and pumped into the metropol itan reservoi rs to provide water security for 2007-08.
The total expenditu re on electricity for pumping water from the River Murray through the
major transmission p ipe l ines can vary sign ificantly depending on the combination of customer demand, quantity of water ava i lab le from natural catchments and requ i rements
for water security. Over the period, the Corporation has achieved a decreasing trend in the
var iable energy cost per k i lo l itre associated with the Corporation's major pumpi ng.
The Corporation's electricity costs going forward a re set to increase, reflecting the energy
intensive natu re of the desa l i nation process, coup led with the Government's commitment of procuring renewable energy for the ADP.
To min imise electricity costs the Corporation is undertaking, or has undertaken, the
fo l lowing in itiatives:
ED a l l e lectricity contracts, inc lud ing those for the ADP, have been procured through a
competitive tender process, consistent with the Corporation's overa l l procurement strategy which seeks to optim ise efficiency a nd va lue for money;
49

CD the Corporation strategica l ly manages major pumping in terms of the times a nd
volumes pumped to take advantage of off-peak energy tariffs;
CD app l ication of epoxy coating of pump impe l lers and casings and u pgrade to mechanica l sea ls on early pumping u n its to increase the efficiency of pumps6;
• the min i-hydro project recovers energy from with in Adelaide's water supply system that
is created when water is pumped, l ifted and transported from the River Murray and
M i l l brook Reservoir as i t descends to supp ly the Adela ide P la ins. The generated e lectricity is fed into the national e lectricity grid4;
CD the Corporation uses the biogas produced as a bi-product of the wastewater treatment
process to generate e lectricity. Generated electricity is used to reduce the imported
e lectricity to metropol itan wastewater treatment p lants4; and
CD i n more general terms the Corporation is com mitted to the Austra l ian Government's
Energy Effic iency Opportunities (EEO) program, which requ i res large energy using
businesses to assess their energy use to identify cost effective opportun ities for improving energy efficiency. Through th is program, SA Water is confident that energy
efficiency in itiatives wi l l continue to be a major focus for the Corporation.
5.1.2 Encouraging operating efficiency initiatives
The Corporation has in place budgetary and procurement processes and frameworks to encourage operating efficiency.
Budget Process
As a part of the Corporation's budgeting processes effic iency is encouraged through the
identification of continuous i mprovement strategies a nd savings.
During the M id Yea r Budget Review and Budget Processes, the Corporation identifies cost savings to assist in offsetting emerging cost p ressures, a nd l im it price increases.
Procurement Process SA Water's P rocurement Pol icy sets out the princip les that apply to procurement activity
throughout the Corporation. One of the key objectives of th is Pol icy is to ensure that
SA Water's procu rement activities optim ise its com mercia l focus.
Two Pol icy p ri ncip les that support th is objective a re that SA Water adopts commerc ia l
practices to o ptimise the retu rn for each do l lar spent and potentia l suppl iers a re given equa l opportun ity to do business with SA Water to the maximum extent practicable .
Under-p inn ing th is Pol icy is a requ i rement to, wherever possib le, seek competitive offers for procurements greater than $5,000. Ind icative ana lysis suggests that approximately 60% of
6 PUB & Water Services Association of Australia (2009), DRAFT Reportfor the Global Water Research Coalitian (GWRC) - Energy
Efficiency Campendium of Best Practice for Australia and Singapore.
50

operating supp l ies or services in 2007-08 were procured outside of the Corporation . Going
forward this percentage is set to increase to a round 70% by 2012-13 as the ADP becomes fu l ly operationa l .
51

5.1.3 Benchmarking Operating Cost Performance
SA Water continues its strong operating cost performance, with all four business segments in the low-to':'mid range of the compared entities. In fact, all segments performed well below the weighted average in 2007-08. The Corporation's operating costs pel"property are low compared to the other major metropolitan al1d regional water utilities in Australia.
Overall trends have seen an increase in operating costs across the Corporation as well as across the country. I n recent years water b usiness costs have increased in order to improve wate r security. Wastewater costs have increased as a result of increasing e nvironmental requirements and performance outcomes.
Real operating cost Per Property - ($ per property) Operating costs include operations, maintenance and administration costs, but
exclude interest/finance charges, capital depreciation, asset write-downs and
non-core business operating costs.
The 2006-07 NPR ( p41) reports the fo l lowing key factors affecting operating costs :
CII changes in water consumption over time;
CII network characteristics, for example the extent of pumping or treatment required
given the significant energy requirements of these functions;
CII customer density, where higher numbers of customers within smaller supply areas
tend to result in lower operating costs per property;
• the extent to which water is sourced from external bulk business or other services are
outsourced. The separation of 'bulk' and 'retail' functions is important as, where a
retail business receives supply from an external bulk water utility, the cost of this
supply will include capital-related costs for the bulk supplier. A utility which o wns and
operates its own 'bulk' supply sources would report, for this indicator, only the
operating costs relating to these functions, and not depreciation or a return on capital
invested; and
CII some utilities operate defined benefit superannuation schemes which depending on
the performance of the investment environment, may cause some fluctuation in
operating costs year on year.
As a consequence of d ifferences in operati ng environments, cost comparisons of water uti l it ies m ust be interpreted with caution .
F u rthermore, i n support of t h e existence of d ifferent operating environments in the
provision of water services, the Commonwea lth G rants Commission investigated the
i mpacts of water ava i l ab i l ity and qua l ity variations across regions on water supply costs and p roduced an i ndex of water cost d isadvantages a ris ing from access ib i l ity and water qua l ity.
52

The index, which is presented in Tab le 5 .1 .27, shows that SA Water has a 0.9 disadvantage
index in water access ib i l ity and qua l ity. On ly two other water compa nies (Actew AGL a nd
Water Corporation) have a disadvantage index and i n each case they a re relative ly sma l l .
The data strongly supports the contention that transporting water long distances (from the
River Murray to Adela ide) and the low qua l ity of that source water, impose significant cost
disadvantages for South Austra l ia's metropol itan water supply a rising from very poor
ava i lab i l ity and poor qua l ity.
Table 5.1.2 - Index of Disadvantage in Water Accessibil ity and Qua lity by Drainage Division
Availabi lity Quality Combined Impace
ActewAGL (Murray-Dar
ling) 0 1 0 .1
Brisbane Water
(N E Coast) 0 0 0
City West Water (SE Coast) 0 0 0
Power & Water* (Timor Sea) 0 0 0
SA Water (SA Gu
lf) 2 1 0.9
South East Water
(SE Coast) 0 0 0
Sydney Water
(SE Coast) 0 0 0
Water Corporation (SW Coast) 0.2 1 0 .18
Note: Calculated by the Grants Commission as O.4*Availabil ity + 0.1 *Quality.
Metropol itan Water Supply Un ited Water manages the operations and maintenance of metropo l itan Adela ide's water systems, inc lud ing the del ivery of capita l works for rehab i l itation and augmentation . This
contract commenced in 1996 a nd was procured via a competitive publ ic tender process.
As discussed above, there a re several factors that impact on operating costs which a re
i mportant for the ana lysis herein . Tab le 5 .1 .3 below identifies some of the key factors
affecti ng the Corporation's metropol itan water operating costs.
Table 5.1.3
7
Key statistics - water supply
2002-03 2003-04 2004-05 2005-06 2006-07 2007-08 2008-09
Major Pumping
Metro volume pumpe
d 154 73 65 68 193 90 150
from River Murray (GL)
Water Supplied
Metro consumption 178 166 166 151 156 139 138 (G L - master meter)
Customer Growth
Metro total connecte
d 480 486 492 499 504 510 517
properties -(OOOs)
Commonwealth Grants Commission (2004), 'Concessions and other payments - water, sanitation and protection of the
environment', 2004 Review Working Papers. See especially pp 80-81.
53

Despite having a c lear water qua l ity a nd water ava i lab i l ity disadvantage, when compared
with other interstate water companies, the Corporation has operating costs for water in the metropol itan a rea that a re comparable to the lowest cost operators .
Table 5 . 1.4 shows the rea l operating cost per property for metropol itan water supp ly from
2002-03 to 2007-08 as reported in the 2007-08 NPR.
Table 5.1.4
Real operating cost - water ($/property) - 2007-08 Dollars
State /
Territor
y 2002-03 2003-04 2004-05 2005-06 2006-07 2007-08 Hunter Water NSW 177 178 193 19S 211 186 Sout
h East Water Lt
d Vic 197 183 189 186 188 190
Yarra Val ley Water Vic 196 196 200
SA Water SA 204 186 188 190 209 205 Water Corporation WA 184 211 222 Gold Coast Water Q
ld 185 198 186 244 191 247
City West Water Vic 329 305 317 294 297 288 ACTEW Corporation ACT 310 324 247 250 291 303 Barwon Water Vic 230 240 259 263 279 303 Bris
bane Water Q
ld 240 241 259 253 286 336
Sydney Water NSW 239 216 230 218 260 336
Power & Water Corp - NT Darwin 307 323 401 387 Metro Weighted Average 232 218 227 215 236 266
The industry weighted average operating cost per property has increased sign ificantly from
2006-07. Continued d rought condit ions experienced in 2006-07 and 2007-08 a re more than l ikely the pr imary d river for th is increase across the country, as entities spend more to
secu re add it ional a nd more rel iab le water supp l ies.
Despite this cha l lenge, the Corporation conti nued its strong performance in com pa rison to other entities, having the fourth lowest operating cost per property in 2007-08, wel l below
the average of $266 per property. SA Water's operating cost per property for metropol itan
water supp ly has consistently outperformed the industry average, with the Corporation
being the lowest cost p rovider in several years .
F igure 5 .1 .4 i l l ustrates how the Corporation's performance has been be low the weighted
average over the period. The d rought conditions in 2006-07 a nd 2007-08, i n pa rti cu lar in
South Eastern Austra l ia, a re i l l ustrated below by the real upward trend in operating costs
per property of the weighted average.
54

Figure 5.1.4
Metropolitan rea l operating costs - water supply ($ per property) 450 �---------------------------------------------------------
400 ·I------------------------ ------------------------�·+--�, .�., .�, .�. -.-. -. .
350 +--.------------- ------------------------. •. �.--. ----------------, . ' . . . . . . . . . . . . . . . . . . . . . . . . . . . . . . . . . . . . . . . . . . . . . . . . . . . . . .
300 -�---------------------------------------------------------
250 +-----------------------------------------------�_� .• --. - .
- . -- . ... _ e -0 ... . __ • . ... . - . - .
150 + ........ ---------,---------,------------,-----.---,-----------, 2002-03 2003-04 2004-05 2005-06 2006-07 2007-08
. . . . . . . . . Annual Maximum -- SA Water ----- Annua
l Minimum - . - Weig
hted Average
The Corporation's operating cost per property cost spikes i n 2002-03 and 2006-07 a re d riven
primari ly by increases in electricity costs associated with add it ional major pump ing from the River Murray in both of these years { refer Table 5 .1 .3} .
The additiona l pumping from the River M urray {h igh cost water sou rce} was requ i red due to
significantly lower than average i nflows into Adela ide's main storages in these years { low cost water source}. For example, in 2006-07, as a drought pumping strategy an add it ional
60 giga l itres from the 2007-08 River M urray metropol itan a l location was brought forward
and pumped into the metropol itan reservoirs to provide water security for 2007-08.
Although d rought conditions continued into 2007-08, major pumpi ng costs were not the
major driver for increases in operating costs in 2007-08. This is i l l ustrated in F igure 5 .1 .5
below, which shows the re lat ionship between operating cost per property and the vol ume of water pumped from the River M urray.
The increase in rea l operating cost per property in 2007-08 relate to the d rought response
measures mentioned previous ly in Section 5 . 1. 1, i n particu l a r the commencement of the H20me Rebates Scheme and enforcement of water restrictions.
55

Figure 5.1.5
Metropolitan water supply o perating costs Vs volume pumped 250 ,-------------------------------------------------------------
200 �--=---�-------------------------------���=--------------------------------------------------� / ' / '
150 �------------------------------------------�4�------'�-----, ....
.... ....
100 .... ....
.... -
, ,
__ --..C�
50 +------------------------------------------------------------
o +-------------.-----------.---------.-------------rr----------,
2002-03 2003-04 2004-05 2005-06 2006-07 2007-08 -- Real ope rating cost (
$ per property) - - - Volume pumped from River Murray (GLs)
Metropolitan Sewerage Services
Un ited Water manages the operations and maintenance of metropol itan Adelaide's wastewater systems, inc lud ing the de l ivery of capita l works for rehab i l itation and
augmentation. This contract com menced i n 1996 and was p rocured via a competitive pub l ic
tender process.
Table 5. 1.5 identifies some of the key factors affecting the Corporation's metropol itan
sewerage services which a re i mportant in the context of the ana lysis here in .
Table 5.1.5
Key statistics - sewer
2002-03 2003-04 2004-05 2005-06 2006-07 2007-08
Customer Growth
Metro total connecte
d 451 458 464 470 475 480
properties - (0005) Percentage of Sewage
Treated to a Tertiary 81.6% 91 .0% 97.0% 100.0% 99.9% 100.0% Level
2008-09
487
100.0%
Table 5 . 1.6 below shows the real operating cost per property for metropol itan sewerage services from 2002-03 to 2007-08 as reported in the 2007-08 N PR.
56

Table 5. 1 .6
Real operating cost - sewerage ($/property) - 2006-07 Dollars
State /
Territory 2002-03 2003-04 2004-05 2005-06 2006-07 2007-08 SA Water SA 142 148 155 157 154 Water Corporation WA 192 192 Bris
bane Water Q
ld 222 197 189 184 180
South East Water Ltd Vic 207 205 218 219 217
City West Water Vic 236 227 250 234 232 Yarra Va
l ley Water Vic 220 229
Barwon Water Vic 205 215 230 252 261 Hunter Water NSW 184 180 190 217 228 Sydney Water NSW 261 194 199 131 190 Gold Coast Water Q
ld 199 216 247 267 225
ACTEW Corporation ACT 308 309 295 272 301 Power & Water Corp - NT Darwin 292 275 340 Metro Weighted
Average 227 198 196 179 197
The Corporation cont inued its high performance in com parison to other entities a nd at
$156 per property had the lowest operating cost per property in 2007-08, wel l below the
weighted average of $223 per property. Over the period SA Water has consistently been the lowest cost provider as i l l ustrated in Figure 5 . 1.6.
Figure 5.1.6
Metropolitan rea l operating costs - sewerage services ($ per property) 400 ,-----------------------------------------------------------
350 +------------------------------------------------------------
300 . . . . . . . . . . . . . . . . . . . . . . . .
� . . . . . . . . . . . . . . . . . . . . . . . . . . . . . .
. ' . ' . ' . . . . . . . . . . . . . . . . . . . • . .
. '
250 +-----------------------------------------------------------� . � . � . �
200 1------·----�· �-���_.._ .. __ .. =_------------------�. �-�.�-�------... . .... . .... . ... . -- . .-
100 +------------,-----------,----------,,----------.-----------, 2002-03 2003-04 2004-05 2005-06 2006-07 2007-08
. . . . . . . . . Annual Maximum -- SA Water - - - - - Annual Minimum - • - Weighted Ave rage
156 188 193 217 229 239 243 259 261 282 307
334
223
The Corporation's sl ight upward trend from 2002-03 to 2005-06 re lates to increased costs largely attributable to the Corporation's Environment Improvement Program ( E I P), which
has been introduced to meet higher environmental standards requ i red by the E PA. SA Water has, at a significant cost over the past severa l years, adj usted its operating
practices to reduce negative environmental impacts.
57

The E I P inc luded the fo l lowing metropol itan projects: Bol iva r Dissolved Air F lotation
F i ltration p lant a nd associated s l udge dewatering process; the Queensbury Diversion; the
Christies Beach E I P; and the G lenelg E IP .
As d iscussed i n Chapter 4.2, and shown in Table 5 .1 .5 above, there has been a substantial i ncrease in the proportion of wastewater treated to a tertiary level over the period.
I nterstate companies have seen some significant increases in the degree of tertiary
treatment, but none as significant as SA Water's increase. Tertiary treatment is typica l ly the most expensive treatment process to operate.
As well as improving discharges to the St Vincent's G u lf, the E I P has he lped to increase the
percentage of water recycled ( refer Chapter 4.2 .1) a nd ensured the Corporation continues
to be EPA compl iant ( refer Cha pter 4.2 .5) .
Due to higher environmental standards requ i red by the E PA, i t now appears that i n many instances recycled water options a re the most cost effective method of disposa l . If E I P
operating costs were to be removed costs wou ld remain relatively stab le over the period .
Regional Water Supply As discussed ear l ier, there a re severa l factors that impact on operating costs. Tab le 5. 1.7
below identifies some of the key factors affecting the Corporation's regional water supply costs.
Table 5.1.7
Key statistics - regional water supply
2002-03 2003-04 2004-05 2005-06 2006-07 2007-08 2008-09
Major Pumping
Regional volume 56 pumped
from River
41 41 42 50 37 37
Murray (GL)
Water Suppl ied
Regional consumption 103 80 86 84 90 80 80 (
GL - master meter)
Customer Growth
Regional total 174 177 180 183 186 190 194 connected properties
-water supply (ODDs
)
Table 5 . 1.8 below show the rea l operating cost per property for regional water services from
2005-06 to 2007-08 as reported in the 2007-08 NPR.
58

Table 5.1.8
Real operating cost - water ($/property) - 2006-07 Dollars
State / 2005-06 2006-07 2007-08
Territory
Byron Shire Council NSW 371 388 412
SA Water - Regional
SA 433(1) 441 463 Sout
h Gippsland Water Vic 390 507 508
East Gippsland Water Vic 443 477 543 Power & Water Corp -Alice Springs NT 651 719 795 Country Energy NSW 1003 894 800 Regional Weighted
Average 415 543 564 (l) The Corporation did not report this indicator in 2005-06 for benchmarking purposes. The figure included a bove is a n
internal estimate a n d is consistent with t h e Corporation's Annual Report Segment Report.
SA Water's regional operating cost per property for water is relatively low for 2006-07 and
2007-08 and wel l be low the weighted average. The Corporation's regional water segment
resu lts shou ld be interpreted with caution due to the fo l lowing factors :
CD the d iversity of systems with in the SA regional data. For example, Mount Gambier's
water is sourced readi ly from the Blue Lake, whereas Whya l la's water must be treated
and pumped 350km from the River Murray; CD whole-of-State regiona l averages which depend on the proportions of "low cost" and
"high cost" regions that a re p resent in the State; and CD South Austra l ia's disadvantage i n terms of water ava i l ab i l ity and qua l ity variations (as
deta i led in Table 5 . 1.3 ear l ier in th is chapter) .
It is difficu lt to make longer term comparisons of operating cost per property trends in
regional a reas as regional centres have only been reporting i n the NPR since 2005-06 and
there is large variabi l ity between regiona l a reas. F igure 5 .1 .7 d isp lays th is graphica l ly,
showing SA Water costs relatively stab le and a round the average of the compared
compan ies.
59

Figure 5.1.7
Regional real operating costs - water supply ($ per property) 1050 ,----------------------------------------------------------"--
. . . . . . . . . . . . . . . . . 950 - ......... -.-.- • • • • • • • • • • • • • • • • • • . . . . . . . . . . . . . . . . . . . . . . 850 -I----------------------------------------'-'�. L·----....-.-.Oi • • • • • • -. . . . . . . . . . . . . . 750 -1-----------------------------------------------------------
650 -1------------------------------------------------------------
550 -1-----------------------------------------------------------
250 +-----------------------------------------------------------
150 1-----------------------------,----------------------------, 2005-06 2006-07
. . . . . . . . . A n nual Maximum -- 5A Water - - - - - Annual Minimum
2007-08 Weighted Average
The last 5 years has seen several key regiona l water in it iatives come on l ine which increased
the amount of fi ltered water del ivered to customers as a part of the Corporation's Country
Water Qua l ity Improvement P rogram .
A n increase i n operating costs i n 2007-08 i s pa rtly attributab le t o t h e Country Water Qual ity Improvement P rogram - Stage 3 (CWQIP3) . CWQIP3 has meant a fu rther 17 regional communities now receive fi ltered and treated water from the River M urray as opposed to
their previous non-potab le supp ly. As a resu lt the provision of fi ltered water from this
program has i ncreased by a round 10.55 ML per day in regiona l SA. The treatment plants a re operated la rgely through th i rd pa rty contracts by which SA Water pays for the labour, chemical, materia ls a nd ma intenance cost of operating the 9 new p lants at Kanmantoo,
Mypolonga, Cowirra-Neeta, Swan Reach, Pa lmer, B lanchetown, Cade l l , Moorook and
G lossop.
SA Water has increased the percentage of treated water to regiona l customers a nd has supp l ied water to new customers . SA Water has a lso responded to the cha l lenge of drought
conditions and events outside of its contro l to ensure water security for customers is
mainta ined.
Regional Sewerage Services As discussed ear l ier, there a re severa l factors that impact on operating costs. Table 5. 1.9
below identifies one of the key factors affecting the Corporation's regional sewerage service
costs.
60

Table 5.1.9
Key statistics - sewer
2002-03 2003-04 2004-05 2005-06 2006-07 2007-08 2008-09 Customer Growth
Regional total 58 59 60 6 1 62 63 64 connected properties
- sewer (ODDs
)
Table 5 .1 .10 below shows the rea l operating cost per property for regional sewerage services from 2005-06 to 2007-08 as reported in the 2007-08 NPR .
Table 5.1.10
Real operating cost - water ($/property) - 2006-07 Dollars
State / 2005-06 2006-07 2007-08
Territory
Country Energy NSW 260 241 268 Power & Water Corp - Alice Springs NT 365 366 3 15 SA Water - Country SA 314(1) 289 3 17 Sout
h Gippsland Water Vic 308 313 352
East Gippsland Water Vic 548 465 504 Byron S
hire Council NSW 519 531 529
Regional Weighted
Average 408 361 378 (1) The Corporation did not report this indicator in 2005-06 for benchmarking purposes. The figure included above is an
internal estimate and i s consistent with the Corporation's Annual Report Segment Report.
SA Water's regional operating cost per property for sewerage is i n the midra nge of the
compared companies for both 2006-07 and 2007-08 a nd well below the regional average.
It is d ifficu lt to make longer term comparisons of operating cost per property trends in regional a reas as regiona l centres have on ly been reporting in NPR si nce 2005-06; ana lysis of
SA Water's regional cost trend is more useful as shown in Figure 5 .1.8 .
61

Figure S.1.8
Regional real operating costs - sewerage services ($ per property) 600 ,---------------------------------------------------------550 ���.� . . � • • �.� . . �.� . . �.� . . �. � • • � . . �.� . . -.-. . -.-. . -. . -.-. . -.-. . -. -. . -. . -.-. . -.-. . -.-. . -. . -.-. . -.-. . -.-. . -.-. . -. . -.-. . -.-. . -.-. . -. . -.-. . -.
-• •
500 +--------------------------------------------------------450 +---------------------------------------------------------400 +---------------------------------------------------------350 -F-=-=-'-'-"""-L' ---���. --�'-"_ • ... • ... • .... • ... • _ • .... • .... • ..... • - • .... • -300 �����----------�--�----�--------����� 250 -F ... :...::-::..:-=-'-"-"-'-"'--""-""'---'-----��...-... _ ... _ .. _=_:_;;;_;_;;_;;;_;_ ....... _ � __ �....JIl!!II - "" "' '' '' ''' '' '' ''' ''' -
200 +---------------------------------------------------------150 +---------------------------------------------------------100 +-----------------------------.----------------------------, 2005-06 2006-07
. . . . . . . . . Annual Maximum -- SA Water - - - - - Annual Minimum
2007-08
We ighted Average
Consistent with the majority of other compared entities, the Corporation's rea l operating
costs for regiona l sewerage services have increased from 2006-07 to 2007-0B, as shown in
Figure 5 . 1 .B .
SA Water's operationa l costs have increased over the per iod due to several u pgrades of the Corporation's regional wastewater treatments p lants (WWTP) to meet environmental
requ i rements and a general i ncrease in workload across many outer metropol itan treatment
plants such as Hahndorf, Myponga, Heathfie ld a nd others as a resu l t of expanding hi l ls and
regional deve lopment.
As with the metropo l itan sewerage business, the Corporation has u pgraded several of its
regiona l wastewater treatments plants (WWTP) to meet environmental requ i rements. These projects inc lude the construction of WWTPs in Victor Harbour, Whya l la, Port P i rie and
an upgrade at Heathfie ld WWTP.
Whi lst cost p ressures a re evident for regional wastewater, the u pgrade of severa l WWTPs
has had a posit ive impact on service standards inc lud ing increasing the percentage of sewerage treated to a tert iary level ( refer Chapter 4.2L increas ing the percentage of water
recycled ( refer Chapter 4.2 . 1) and he lping SA Water ensure the Corporation continues to be
EPA compl iant ( refer Chapter 4 .2 .5 ) .
62
5.1.3 Operating Costs - Going Forward
Going forward the Corporation's rea l operating cost per property in the water business is expected to increase. The i ncreases are driven bywater security initiatives, the ADP being the most significant, as well as continuing the water efficiency rebates and water restrictions.
Sewerage costs increase slightly from 2009-10 reflecting an increase in environmental compliance requirements as wel l a s the need to meet demand growth.
Metropolita n Water The i ncreases in this segment beyond 2009-10 a re pr imari ly attri butab le to the operation of the ADP. Removing the operating costs associated with the ADP from the forward
est imates, rea l operating cost per property decl ines sign ificantly, in particu lar beyond
2010-11 when restrictions a re assumed to be l ifted.
Costs remain high from 2008-09 to 2010-11 reflecting pr imari ly the continuation of water
restrict ions and the H20me Rebates Scheme.
Regional Water Operat ing costs remain high from 2008-09 to 2010-11 before costs red uce in 2011-12. The
high costs from 2008-09 to 2010-11 relate primari ly to drought response costs, inc lud ing the cost of addit ional water purchases and contin uation of water restrictions.
Metropolita n Sewer Operating costs a re forecast to remain relatively stable in real terms from 2009-10 for this
segment, a lthough sti l l a s l ight increase compared with 2006-07 levels .
The i ncrease over the period is driven partly by an increase in costs associated with the
operation of the upgraded Christies Beach Wastewater Treatment P lant. This project a ims
to de l iver a p lant with a focus on susta inab i l ity and the ab i l ity to cater for a growing
popu lat ion.
Regiona l Sewer Operating costs a re forecast to increase in real terms for this segment, a lthough sti l l a step increase compared with 2006-07 levels . The increase is d riven by increases in l abour costs
associated with the Corporation's Workforce Replenishment Strategy as wel l as addit ional
operating requ i rements as a resu lt of OH&S investigations a nd increases in water qua l ity
com pl iance requ i rements.
63

5.2 TOTAL COSTS
SA Water'stotal operating cost perproperty trend is consistent with the Corp. ·. oration'soperating c. ()st per .. p.
rope .. rty . . . ' . .
Real total cost per property - ($/property) Total cost for water supply/sewerage services ($/property) equal to operating
cost for water supply/sewerage services plus current cost depreciation for
water supply/sewerage assets divided by Total connected properties receiving
water supply/sewerage services)
This ind icator was deleted from the NPR and hence was not reported in the 2007-08 N PR.
The Corporation understands that th is ind icator was deleted as tota l cost inc ludes
depreciation which is based on the Written-Down Replacement Costs (WDRC), and the
ca lcu lation for this differs between ut i l it ies therefore is not a su itable comparison for
benchmarking. In the attempt to reduce ind icators, operating costs was seen as a sufficient
ind icator of the costs of the ut i l ity. Notwithstand ing its l im itations in terms of comparison,
F igure 5 .2 .1 shows the tota l costs per property for the fou r business segments.
Figure 5.2.1
Real total cost per property ($ per p ro perty) 900 .,------------------------ ------
800 +---------------------------------_--------�
- - - - - -700 +-------------�-=���=-.�-���--------------r-- - - - - - - - - - - - - -600 -r-----------------------------------------------500 t:::::�;;;;;;;;;;��::::::::::::::::::::::::::��:::::::: 400 �
. _ e _ . "" -
300 -I""'---"--'---'---"""-'�'---- .... • .... • ..... .,---�. � ____ .L_O!!!_"___!... --= .... =-.=----.----. ------------. . . . . . . . . . . . . . . . . . . . . . . . . . . . . . . . . . . . . . . . . . . . . . . . . . . . . . . . . . . . . . . . . . . . . . . . . . . . . . . . . . . . . . . . . . .
200 ,----------------------------------------------------------
100 +---------------------------------------
o +------------------.--------------------� 2006-07 2007-08 2008-09
Metro Wate r - - - Cou ntry W ate r . . . . . . . . . Metro Sewe r -- Country Sewe r
Rea l total cost per property for both water and sewer genera l ly fol lows the same trend over
the period as the real operating cost per property. This is to be expected as operating costs
a re a major component of tota l costs for the Corporation .
When this ind icator was previously reported i n t h e N P R, S A Water's rea l total cost per p roperty was consistently wel l below the average of other Austra l i an water uti l ities. Although as mentioned above, caution m ust be taken when comparing tota l cost per property as the depreciation component of this cost varies s ignificantly with the asset
va l uation methodology used by the uti l ity.
64

5.3 CAPITAL EXPENDITURE
As discussed in the Draft Nationa l Water I n it iative Pricing guide l ines, "Capita l expend itu re
constitutes the major proportion of costs recovered through water charges. Capital expenditu re inclu des expenditure : for rep lacement of existing assets; and to expand the
stock of assets to meet i ncreases in demand, meet requ i red service standards, a nd any
increases in regu latory obl igations".
I n setti ng water and sewer prices the Corporation inc ludes the cap ita l expenditure in its regu latory asset base. Depreciation on these assets as wel l as a return on investment is
recovered from customers. Furthermore, capital expend itu re has a d i rect impact on
operating costs.
5.3.1 Capital Planning Framework
The Corporation has in place formal Asset M anagement processes and policies. Consistent with operating expenditure, capital expenditure efficiencies and rationing are a part of the overall Asset Management Framework.
The Board of SA Water has endorsed a formal capital expenditure approvals policy, which is a pplied to all projects. A project m ust pass through forma l approval "gates" prior to commencement of capital works . . This process involves a rigorous b usiness case, identification of project risks and the identification of business and customer outcomes.
The Corporation contin ues to benchmark its capital planning and asset management process and policies with other Australian water utilities.
In provid ing water and wastewater services to commun ities across South Austra l ia, SA Water uti l ises a vast a rray of infrastructure assets, many of which a re expected to have
long operationa l l ives . For example, there a re more than 28,000 km of water pipes;
8,500 km of wastewater mains; 615,000 water connections a nd 485,000 wastewater con nections. In tota l, the asset base has a gross replacement va lue of more than $13.5
bi l l ion and a written down va lue of over $8 bi l l ion . See Attachment 1 for a summary table of assets.
SA Water's operating environment is cha l lenging and inc ludes factors such as broad geogra phical spread of operations, a wide variety of water sources, water security
cha l lenges, tighten ing customer service standards, increasing regu lation (water qua l ity,
environment and economic), increased com m unity expectations and a diverse a rray of
assets .
With in this environment, management of infrastructu re assets to produce effic ient and
effective outcomes throughout long operationa l l ives is a critica l activity for SA Water.
It is a lso a requ i red activity. SA Water's Charter, prepared in accordance with the Publ ic
Corporations Act 1993, states that "The Corporation m ust develop an Asset Management P lan for the short and long-term".
65
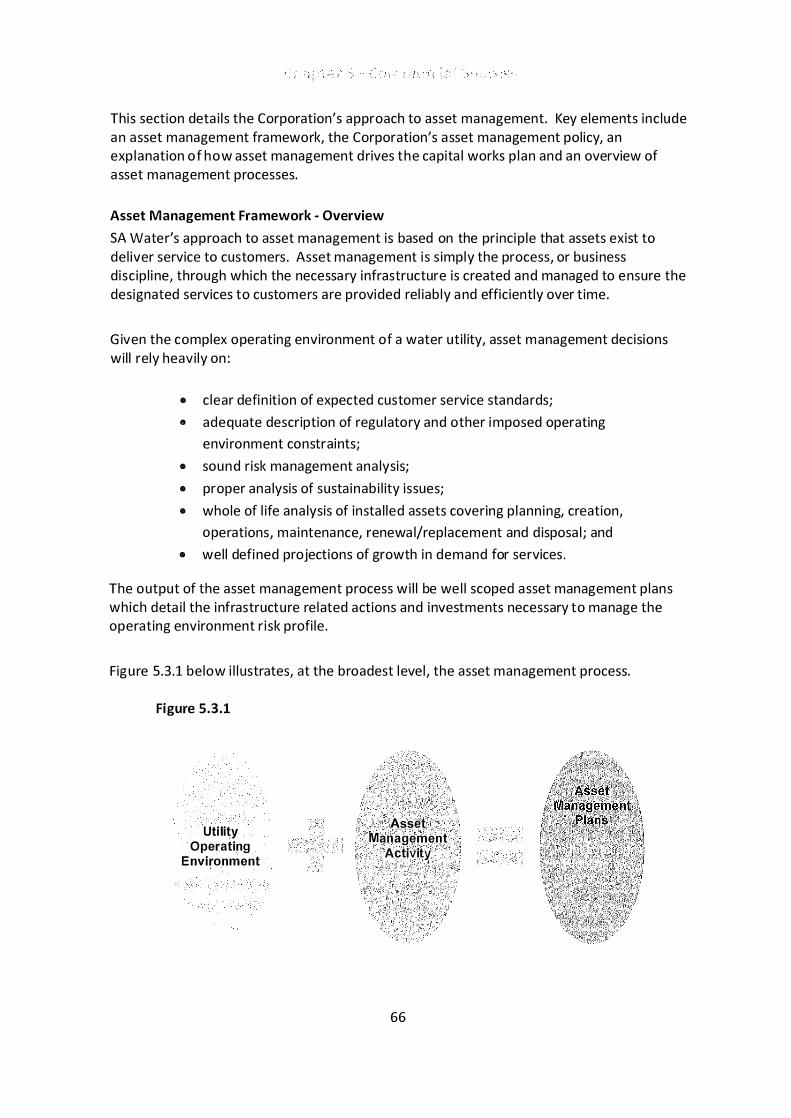
This section deta i l s the Corporation's approach to asset management. Key elements inc lude
a n asset management framework, the Corporation's asset management pol icy, an exp lanation of how asset management d rives the capita l works p l an and an overview of
asset management processes.
Asset Management Framework - Overview
SA Water's approach to asset management is based on the princip le that assets exist to
de l iver service to customers . Asset management is s imply the process, or busi ness
d isc ip l i ne, through which the necessa ry infrastructure is created and managed to ensure the
designated services to customers a re provided rel iab ly a nd efficiently over t ime.
G iven the complex operating environment of a water ut i l ity, asset management decisions
wi l l rely heavi ly on :
o c lear defin it ion of expected customer service standards;
ED adequate description of regu latory and other i mposed operating
envi ronment constraints;
o sound risk management ana lysis;
o proper ana lysis of susta inab i l ity issues;
o whole of l ife ana lysis of insta l led assets covering p lann ing, creation,
operations, ma intenance, renewa l/replacement and d isposa l ; and
o wel l defi ned projections of growth in demand for services .
The output of the asset management process wi l l be we l l scoped asset management p lans which deta i l the infrastructure re lated actions and investments necessary to manage the operating environment r isk profi le .
Figu re 5.3 .1 below i l l ustrates, at the broadest leve l , the asset management process.
Figure 5.3.1
Uti lity Operating
Environment
Asset Management
Activity
66

Asset Management translates a uti l ity's operating environment into the ma intenance and
capital i nvestment p lans to be app l ies to its infrastructure assets.
As a l l uded to above, the uti l ity operating environment can be d ivided into a nu mber of major themes. SA Water's asset management model uses the fo l lowing categorisat ion :
• strategic drivers that inc lude customer service standards, regu latory
mandates (e.g. water qua l ity, environment, OHS) and specific
corporate/owner objectives (e.g. water security);
• condition and performance of the existing insta l led infrastructu re; a nd
• impacts on the infrastructu re of demand growth.
The asset management activity appl ied to each key category varies. For the strategic d rivers, asset management activity is focussed on translating the requ i red strategic
outcomes into the specific actions needed to be app l ied to the relevant infrastructu re. For
cond ition and performance of the exist ing asset base, specific model l ing, inspections and
ma intenance regimes al l i nform future p lanned interventions. For demand growth, popu lation projections and development p lann ing priorities a re input to hydrau l ic model l ing
of the existing infrastructu re to determine the scope and timing of p lanned capacity
a ugmentations (for both treatment p lants and networks) . Undergirding a l l asset
management activity is the principle of effective risk management.
F igure 5.3.2 d iagrammatica l ly presents the Corporation's Asset Management Model .
Figure 5.3.2 - Asset Management Model
Strategic operating environment drivers
Strategic Map
Customer Standards
Regulatory requirements (e.g.
health, environment, OHS,
Economic)
Corporate strategic
Requirements (e.g. water
security objectives, sustainability
objectives, information
requirements)
Existing Assets Condition & Performance
Existing Assets Growth impacts
Agreed strategies and in itiatives
Identified future treats and opportunities
I N N OVATION
Assess Condition & performance
Long term plan outputs
67

Asset Management Framework - Asset Programs
With in each of the three major operating environment themes, asset management activity
can be fu rther categorised into Asset P rograms.
Each Asset Program has specific objectives, a clea r u nderp inn ing assessment methodology
a nd/or key d rivers and gives a forward view of p lanned management activity that covers
both operating and capita l expenditure.
The Asset programs themselves a re grouped into focus a reas as shown in F igure 5 .3 .3 .
Figure 5.3.3
Strategic Drivers
Asset Programs
Asset Condition & Performance
f
Asset Programs
68
Demand G rowth
I
Asset Programs

Strategic Drivers
Improved Customer
Service Asset Programs
Service Reliability &
Efficiency Asset Programs
Water Quality
ManagmentAsset Programs
Environmental
Improvement Asset Programs
Safety Asset
Programs
Asset Condition & Performance
Water Mains Asset Programs
Mechanica
l &
Electrica
l Equipment
Asset Programs
A fu l l l ist of Asset Programs is shown at Appendix 2.
Demand Growth
Networks Asset
Program
Extensions and
Connections Asset Program
Other Asset
Programs
As appropriate, the asset management activity undertaken within any Program wi l l app ly asset l ife cycle ana lysis covering p lann ing, asset creation, operations, maintenance,
rehab i l itation, replacement/renewa l and disposa l .
Asset Management Framework - Asset Management Plans
As introduced above, Asset Management P lans, the output of asset management activity,
give the forward projection of activity (e.g. preventive maintenance p lans) and expenditu re
(both capita l and operating) needed to manage the projected risks associated with the infrastructure base. They a re a l igned completely with Asset Programs. That is , the forward
projection of capita l and maintenance costs for each Asset Program is, in fact, the Asset
Management P lan for that Program.
For any Program, the p lanned expenditu re focus wi l l be specific. For some Programs expenditu re wi l l be a mix between operating and capital - this wi l l particu larly be the case for P rograms with in the Asset Condit ion a nd Performance theme. For others, expenditure
wi l l be purely capita l i nvestment.
69
Asset Management P lans can a lso be produced for i ndividua l complex faci l it ies, such as
water and wastewater treatment p lants and major p ipe l i nes. U nder this option, sections of
va rious Asset Programs wi l l be represented in the faci l ity p lan . For example, a fac i l ity Asset
M anagement P lan for a major wastewater treatment p lant may conta in l i nks to var ious environmenta l improvement Asset Programs, safety Asset Programs and mechanical a nd
e lectrica l equ ipment Asset Programs.
Governance - Asset Management Policy
SA Water has formal ised its asset management framework, at the highest leve l , through its
corporate Asset Management Pol icy, which is approved periodica l ly by the SA Water Board .
Asset Management Relationship to the Capital Works Plan
I ntegrated water uti l it ies a re infrastructure rich businesses. Their forward capital works
p lans a re therefore dominated by works on the infrastructure assets. S ince the resu lts of
asset management p lann ing activity, ind ividua l thematic Asset Management P lans, inc lude forward p lans of requ i red capital i nvestment, it fol lows that the summation of the capital
requ i rements across al l Asset Management Plans wi l l be c lose to a d raft capita l works p lan
for the uti l ity.
I n SA Water, for each Asset Program there is a resu ltant Asset Management P lan . The
summation of the p lanned capital works for each of the s ixty-odd Asset Programs is therefore the d raft capital works p lan for the organ isation . This representation of the p lan is in outcome terms rather than s imp ly an aggregation of more than a thousand ind ividua l p rojects.
Additiona l aggregation of Programs to each of the major asset management themes, described previously, enab les high level a rticu lation of the level of capital i nvestment requ i red to manage risk associated with strategic dr ivers, asset performance and growth .
The d raft p lan is therefore a va l id representation of the level of capital investment SA Water
shou l d make i n order to manage its risk effectively.
S i nce asset management p lann ing activity is focussed on one, five and twenty five yea r
horizons, the forward capital p lan i s automatica l ly matched to the same p lann ing periods.
Capital rationing is a rea l ity that wil l be app l ied from time to t ime fo l lowing complet ion of
the d raft p lan . Cuts made to the draft p lan wi l l resu lt in add itiona l risk for the organ isation but can sometimes be accommodated provided that the additiona l risk is clea rly understood
and accepted.
Capita l Approval Process Capital projects at SA Water a re managed via the Corporate Project Management
M ethodology (SA Water procedure CGl 71) . This methodology mandates the process steps that the project fo l lows throughout its l ife. I ncorporated within the methodology a re the
steps requ i red to comply with the SA Water Financial Approval Policy CP 023. This Board endorsed pol icy mandates the criteria for the financ ia l approva l of capita l projects inc lud ing
70

"approva l gates" which projects m ust c lear prior to progressi ng. Greater guidance on the
approva l gates is provided with in SA Water procedure CG 037 Capital Expenditure Approval
Process. These approva l gates inc lude :
Project Commenced
Develop Options
ConceptDesit1l
SA Wa ter Ca p i ta l A ppro v a l Pro c ess Ca tes
Entry onto the Capita l P lan
to Detailed Design
• Construction • Commission
Fol lowing on from the review of the busi ness need as pa rt of the asset management
process, project proposa ls a re considered as to whether they should be inc luded within the
capita l plan. The criteria for the review inc lude; project cost ( inc lud ing operat iona l impact), risk if the project does not proceed and the business benefit. Addit iona l ly these criteria a re
used to assist in the prioritisation i n the t im ing of investments.
Project Development Funds Review of the u pdated business case a nd add it ional consideration as to the level of
development funds requ i red and the a rea of expenditu re.
Option Endorsement Review of the viab le options for the project based upon ach ieving the project objectives
with consideration of risk, financ ia l i mpact, timing and the business benefits. All viable
options are considered against a base case of the project not proceeding.
Fu l l F inancia l Approva l (Busi ness Case) Review of the fu l l busi ness case inc lud ing, project del iverables, business benefits, scope,
r isk, t iming and financia l impact. Prior to seeking th is approva l the cost estimate for the
project is independently reviewed by the SA Water estimating team or for projects of
greater sca le or complexity by external consu ltants. The project cannot proceed to the
de l ivery (construction) phase unt i l this a pprova l is obta ined.
Of the 2010-11 capital program approximately 75% of the project expenditure has a l ready
received Fu l l F inancia l Approva l, via inte rna l SA Water approva l or via Cabinet endorsement.
External Benchmarking In addition to the capita l process, p rojects a re requ i red to ga in approva l in accordance with CP 034: Delegations of Financial & Procurement Authority, for the procurement of services
such as design or construction. This wi l l genera l ly be via market testing through a tender
process to ach ieve the best va lue so l ut ion.
71
Process Benchmarking
As part of ongoing development of processes and practices, d u ring 2009 SA Water benchmarked its capita l processes against other Austra l i an water uti l it ies, inc lud ing:
• Sydney Wate r
• H u nter Water
• Water Corp.
• SE Water
• Melbou rne Wate r
This benchmarking exercise has been used as pa rt of a cont inuous improvement process.
Alignment with Customer Requirements and Regulatory Obligations I ncorporated within the SA Water Capital Approva l Process at each of the approva l gates the
"outcome" (benefit) of the project is considered as part of the project review to see if the
project shou ld proceed. The project outcome is defined i n terms of quantified impact
against the corporation's strategic ta rgets. These strategic targets recorded on the
corporation's SM and a re grouped by objectives such as System Performance, Customer
Service and Water Quality.
The Corporate Project Management Methodology requ i res that upon completion projects
a re assessed against the origi na l ly stated benefits to assess the project success as part of
"benefits rea l isation" .
Delivering the within the Proposed Timeframe To manage the del ivery of the capita l program to the proposed t imeframes SA Water has
estab l ished the Corporate Project Management Methodology. This methodology is
supported by p rocesses and systems for managing and reporting of project progress,
inc lud ing corporate wide reporting of mandatory project m i lestones.
Having put systems in p lace to improve performance, for the last three financ ia l years, i .e .
2006-07 to 2008-09, SA Water has ach ieved its expend itu re ta rget for capita l del ivery.
72

5.3.2 Benchmarking Capital Expenditure
From 2002-03 to 2007-08 the Corporation has had low levels of capital expenditure for metropolitan water supply and sewerage services. From 2005-06 to 2007-08 capital expenditure per property for regional water supply has consistently and significantly increased as regional sewerage expenditure has decl ined.
Sewerage capital expenditure has been focused on Environmental Improvement Programs (EIPs), while there has been a significant focus on improving regional water quality through the Country Water Quality. I mprovement Program (CWQIP).
This section wi l l compare the Corporation's rea l capita l expenditu re with the other major urban and non-urban water ut i l ities within Austra l ia as reported in the 2007-08 N PR. Note
the data reported in the NPR has been converted to a per property basis as this provides a more relevant measure.
Real capital expenditure per property - ($ / per property)
Water supply capital expenditure reflects the actual capital expenditure on
water supply for the reporting year. This should include all capital expenditure
for: new works; renewals or replacements; other expenditure that would
otherwise be referred to as capital; and recycling water assets.
Sewerage capital expenditure is the actual capital expenditure on sewerage
for the reporting year. This should include all capital expenditure for: new
works; renewals or replacements; and other expenditure that would otherwise
be referred to as capital.
Metropolitan Water Supply
Table 5 .3 .1 compares SA Water's real capita l expenditure per property for metropol itan
water supply.
73

Table 5.3.1
Real capital expenditure - water supply ($ / property) - 2007-08 Dollars
State / 2002- 2003- 2004- 2005- 2006- 2007-Territory 03 04 05 06 07 08
Gold Coast Water Ql
d 58 100 238 218 417 535
Sydney Water NSW 66 56 57 101 133 524
ACTEW Corporation ACT 70 247 363 179 145 338 Bris
bane Water Ql
d 95 98 78 101 238 312
Barwon Water Vic 155 153 187 198 246 304 Power & Water Corp - NT 177 518 228 188 157 283 Darwin Water Corporation WA 205 173 190 559 334 196 Hunter Water NSW 114 153 218 96 284 170 City West Water Vic 55 90 117 122 84 108 SA Water SA 46 63 67 70 67 101 Yarra Val ley Water Vic 138 113 86 Sout
h East Water Lt
d Vic 65 49 40 34 48 56
Metro Weighted Average 89 95 107 160 165 282
The Corporation's metropo l itan capital expenditure for water supp ly in 2007-08 is i n the low
range of the compared entities. Sydney Water and Gold Coast Water reported sign ificantly h igher leve ls of capital expenditu re per property in 2007-08.
The Corporation's metropol itan capita l expenditure for water supply has been fa i rly stable over the period, a lthough it has d isp layed a s l ight increase over the period . Figure 5 .3 .5
below shows the Corporation below the weighted average i n terms of capital expenditure across the period 2002-03 to 2007-08. Notably, the on ly uti l ities with lower leve ls of capital
expenditu re over the period a re reta i lers a nd not vertica l ly integrated water ut i l it ies such as SA Water.
Also evident from Figu re 5.3 .4 i s the l umpiness of capital expenditu re genera l ly as well as an
overa l l i ncreas ing trend across Austra l ia s ince 2004-05. This increasing trend has been d riven by water ut i l ities seeking to improve water security and meet increases in demand.
74

Figure 5.3.4
M etropolitan real capital expend iture - water supply ($ per property)
600 ,--------------------------------------------------------------
. . . . . . . . 500 +-------;;".�. .... .-, , ' - ' . . . . . . . . . . . . .
. . . . . . . . . . . . . , , -. '
. . . . . . . . . . . . . . . . . . . . . . . . . . . . . . 400 +-____ �,L. ------------�· .�. �--�---------------------------------. . . . . . . . . .
. 300
7" 200 -r----------------------------------------------------����------
100 I- _ . - -. .... . .... . ..... . _ . 1/fIII/P
.... . .. . --
- - - - - - - - - - - - - - - - - - - - - - - - - - - - - - - - - - - - - - - - - - - -o +------------.-----------.------------.-----------.-----------�
2002-03 2003-04 2004-05 2005-06 2006-07 2007-08
. . . . . . . . . A n n ua l Maximum -- SA Water - - - - . Annual Minimum - . - Weighted Average
Going forward the Corporation's capital expenditure leve ls a re set to increase sign ificantly. Further deta i ls a re provided in Section 5 .3 .3 .
Metropolitan Sewerage
Table 5 .3 .2 compares SA Water's rea l capita l expenditu re per property for metropol itan sewerage services.
Table 5.3.2
Real capital expenditure - sewerage ($ / property) - 2007-08 Dollars
State / Territory 2002-03 2003-04 2004-05 2005-06 2006-07 2007-08
Gold Coast Water Q
ld 80 209 521 360 574 592
Water Corporation WA 188 229 138 149 240 406 Sydney Water NSW 257 257 192 198 243 263
Power & Water Corp - NT 243 222 175 180 184 214 Darwin Hunter Water NSW 235 227 244 280 213 208 Yarra Va
l ley Water Vic 157 165 159
Barwon Water Vic 261 227 195 184 195 151 Bris
bane Water Q
ld 146 251 400 241 196 150
ACTEW Corporation ACT 110 100 96 40 80 144 Sout
h East Water Lt
d Vic 129 143 140 76 109 114
City West Water Vic 79 129 120 155 78 65 SA Water SA 112 174 6 1 49 50 59 Metro Weighted Average 185 2 14 193 168 196 219
The Corporation recorded the lowest metropol itan capital expenditu re per property for sewerage services in 2007-08. Gold Coast Water once aga i n reported s ign ificantly higher levels of capital expenditure .
75

Figure 5.3.5
Metropolitan real capital expenditure-sewerage services ( $ per property) 700
600
500
400 . .
. ..
. ' . '
. . '
. . . . . . . . . . . . . . . . . . .
. '
, . " 0 i . • __ _'__ • •
_______ _ ' 0 " " " 0 , " . . .
. . . . . .
. .
. . . .
300 +------� . . . -'--.
'-------------------------------. . . . . . . . . . . . . . . . . . .
200 I-'" • iiii!IIII • - • =-. -- . - ..----....-.---=_=--.-_--.--_--.-_---. -
.... --.-_-,---.,--. --....,..---------
L_-----....... � 100
o
2002-03 2003-04 2004-05 2005-06 2006-07
. .... .
2007-08
. . . . . . . . . Annual Maximum -- SA Water - - - Annual Minimum - . - We ighted Average
The Corporation's sewerage capital expenditu re has fluctuated more sign ificantly, compared
to the water bus iness, over the period due to the completion of severa l E I Ps as wel l as the relocation of the Port Adela ide Waste Water Treatment Plant (WWTP) to Bol iva r. The
decrease from 2003-04 reflects the winding back of capital expenditu re fo l lowing the
completion of severa l of these E I Ps .
The E I Ps have inc lu ded the Bol iva r Disso lved Air F lotation Fi ltration p lant and associated s ludge dewatering process, the Queensbury Diversion, the Christies Beach E I P and the
G lenelg E IP . The increased capita l expenditu re has de l ivered improved outcomes for the environment, which can be seen by the improvement in the percentage of sewage treated
to a tert iary level ( refer Table 4.3 . 1), increasing the percentage of water recycled ( refer
Chapter 4. 1) a nd he lped to ensure the Corporation continues to be E PA compl iant ( refer
Chapter 4.3) .
Regional Water Supply
Table 5 .3 .3 below compares the Corporation's rea l capital expenditu re per property for
regional water supp ly.
Table 5.3.3
Real capital expenditure - water ($ / property) - 2007-08 Dollars
State /
Territor 2005-06 2006-07 2007-08
Y Country Energy NSW 756 SA Water SA 185(1) 433 500 Sout
h Gipps
land Water Vic 222 895 494
Power & Water Corp - NT 150 60 133 Alice Springs
Byron Shire Counci
l NSW 132
East Gippsland Water Vic
Regional Weighted 187 449 476
Average
(1) Total capital expenditure for regional SA was not reported in 2005-06 for benchmarking purposes. This figure is derived utilising internal estimates consistent with the Corporation's Annual Report and NPR definitions.
76

Figure 5 .3 .6 below shows the Corporation's capita l expend iture per property has been
consistently average when compared to other entities.
Figure 5.3.6
Regional real capital e){penditure - water supply ($ per property)
t " ' --•• • • • • • • • • • • • • • • • • • •
1,000
900
800
700
600
500
400
300
t"
• • • • • • • • • • • • � ....... � __ • • • • r • • • • • • • • • • • • •
" ,
" "
" "
" ,
. ' " ",
. ' "
" - ---
. . . . .
�
, , -------
. . , �
2005-06
. . . . . . . . . Annual Maximum -- SA Water
-- , - '
2006-07 2007-08
- - - - . Annual Minimum - . - Weighted Average
The increasing trend in regiona l water from 2005-06 to 2007-08 is due to severa l significant
projects inc lud ing: III Stage 3 of the Country Water Qua l ity Improvement P rogram (CWQIP) . U nderpinned by
the Corporation's vision of provid ing water for growth, development and qua l ity of l ife to a l l South Austra l ian, this project i mproved water qua l ity to several regiona l
communities by del ivering fi ltered water through a series of water treatment plants and
pipel i nes; III the construction of a pipel ine between Lock and Kim ba on the Eyre Peninsu la, with the
aim to red uce pressure on groundwater sou rcing on the Eyre Peninsu la; and • the com pletion of a 12km pipel ine from Mi lang to con nect to existing network in
Clayton, replacing existing aqu ifer and lake extraction .
Regional Sewerage Services
Table 5 .3 .4 below compares the Corporation's rea l capital expend iture per property for
regional sewerage services.
77

Table 5.3.4
Real capital expenditure - Sewer ($ / property) - 2007-08 Dollars
State / 2005-06 2006-07 2007-08
Territory
Byron Shire Council NSW 601
South Gippslan
d Water Vic 396 266 3 18
Power & Water Corp - NT 144 401 301 Alice Springs
Country Energy NSW 152 SA Water - Country SA 256(1) 133 135 East Gippslan
d Water Vic
Regional Weighted
Average 265 188 221 (1) Total capital expenditure for regional SA was not reported in 2005-06 for benchmarking purposes. This figure is
derived utilising internal estimates consistent with the Corporation's Annual Report and NPR definitions.
Figure 5.3.7
Regiona l rea l cap ita l expenditu re - sewerage serv ices ($ per property)
700 �-------------------------------------------------------------
600 +----------------------------------------------------------• •
-. � • . OT •
• .•
. . . . . . . . . . . 500 -l---------------------------------------------:-;coo� • ..!.: • • �.-• • ------------. . . . . . . . . .
. . . . . . 400 -,....-....-. .---_ ....... ............ -............. .-.+-+-+-............... �.. • • • • • • •• • • • • • • • -----------------------
300 +--------------------------------------------------------------
i--��=-==�· =-�·����::�::;;;;;:::::::======::::::::�::::���� 200
-- • -- • --• -- • ... • ... • ....... •
. � . .... . ... . .... .
r-- - - - - - - - - - -100 +--------------------------------------------------------------
o
2005-06 2006-07 2007-08
. . .. . . . . . An nual Maximum -- SA Water - - - Annual Minimum - • - Weighted Average
Reducing the i mpact of the Corporation's wastewater treatment plants on the environment
has been a major d river of capital expend itu re in this segment. The Corporation's
Environmenta l Improvement P rogram (E IP ) has seen the completion of severa l wastewater treatment p lant E I Ps, severa l prior to 2005-06.
In 2006 the Whya l la Wastewater Treatment P lant E I P was completed and now provides
rec la imed water to supply i rrigation to the Whya l l a Golf C lub and the city's mun ic ipa l parks
a nd gardens. This rep laced the River M u rray water used for i rrigation in these a reas.
Whya l la's wastewater is now captured before it becomes so sa l ine that opportun ities for reuse a re l im ited. Wastewater is pumped to the p lant via a new pipel ine which reduces the
discharge of treated water to the Spencer G u lf.
78
5.3.3 Capital Expenditure Going Forward
forecast capital expenditure is set to peak in 2009,..10 at around $930 million (real dollars) driven by expenditure on the Adelaide Desalination Plant (ADP).
Over the next five years the focus of capital expenditure in the water business is on improving the State's water security. I n the sewerage services business the emphasis will remain on reducing the Corporation's environmental i mpact, including increasing recycling projects as well as ensuring treatment plants have the capacity to meet demand growth.
The Corporation's capita l expenditu re program peaks in 2009-10 above $930 mi l l ion in rea l terms (net of Federa l Government fu nd ing) . The key driver for this significant increase in
capita l expenditu re is spending on water security in itiatives for metropol itan Adela ide, primari ly the Adela ide Desa l i nation P lant (ADP) .
Metropolitan Water
The ADP wi l l provide up to half of Adela ide's dr inking water needs. The project received
major development approva l in 2009 after an exhaustive assessment using the State's major development process.
The development approva l addressed more than 100 separate environmenta l , social and economic issues identified by the independent Development Assessment Commission, a long with issues raised throughout the extensive pub l ic consu ltation process. SA Water conti nues
to work hard with contractors to ensure the highest leve ls of environmenta l standards for
the project.
Bu lk earthworks were nearing completion toward the end of 2008-09 and the p roject has
been fast-tracked to del iver first water from the plant in December 2010. I n late 2012 the
plant wi l l reach capacity of 100 giga l itres, provid ing up to half of Adela ide's dri nking water needs.
Although the ADP, by sheer size, dominates the Corporation's capital plan the level of
capita l expenditu re in the other segments remains constant or increases a lso.
Capita l expenditu re for metropol itan non-water secu rity expenditure dec l ines out to
2011-12, but then begins to increase s l ightly out to 2013-14.
Metropolitan Sewer
Capita l expenditu re is set to increase s ign ificantly above 2008-09 l eve ls in 2009-10 and
2010-11 as the Corporation u pgrades several of its existi ng wastewater treatment plants as
a part of its "Demand Growth" asset management focus ( refer Section 5.3.1) . Of particu lar note a re the p lanned capacity upgrades to the Christies Beach and Ald inga Wastewater Treatment P lants.
79

I n addit ion to the demand growth focus there is a lso the need to ma inta in asset condition
and performance. Projects pla nned in this a rea inc lude mechanica l and electrica l p lant
renewal at the Bol iva r Wastewater Treatment P lant and severa l other smal ler metropol itan
treatment p lants.
To improve water security, through increased re-use, the Corporation is a lso investing in the
Southern U rban Re-Use P roject. The project is pa rt of Water P roofing the South, a loca l ised
integrated water resource management strategy based entire ly in the City of Onkaparinga .
It wi l l br ing dua l reticulation c lass water to residentia l a reas south of the Onkaparinga River.
Regional Water
Capital expenditu re decl ines from 2010-11 to 2012-13 before increasing once aga in in
2013-14. The increase in 2013-14 reflects the need to u pgrade several of the Corporation's
regional water treatment plants as a part of its "Demand G rowth" asset management focus
( refer Sect ion 5 .3 .1 ) .
Driving the leve ls of capita l expenditure in 2008-09 and 2009-10 is the Corporation's continued focus of improving water qua l ity, through the Cou ntry Water Qua l ity
Improvement P rogram (CQWIP) and other water qua l ity in itiatives.
Regional Sewer
Capita l expenditu re decl i nes from 2011-12 to 2012-13 before increasing once aga in in 2013-14. The increase in 2013-14 partly reflects the need to u pgrade several of the Corporation's regiona l water treatment plants as a pa rt of its "Demand Growth" asset
management focus ( refer Section 5 .3 .1 ) .
As we l l as u pgrad ing and increasing capacity in severa l existing plants, there a re severa l
projects p lanned to improve the Corporation's environmental performance. These projects inc lude reduc ing the nutrient load at the Bird I n Hand and Angaston Wastewater Treatment
P lants a nd E I Ps at the Naracoorte, Mount Burr and Nangwarry Wastewater Treatment
P lants.
80
6. Va lue for Money The Customer Satisfaction Survey conducted by the Corporation in 2009 indicates customers are generally very satisfied with the range and quality of services provided by the Corporation.
The standard of service offered by the Corporation to its customers is predominately at the mid-to-high range in the metropolitan a rea and in the mid-range in the regional areas when compared with the service levels offered customers of the other water bodies.
While SA Water's operating costs for watersupply and wastewater services are comparatively low in Adelaide when compared with other Australian cities, average water and wastewater bil ls are comparatively mid range, but above the weighted average. To some extent this level of contribution may reflect the relative quality of assets which, in turn, as earlier demonstrated, provides a general ly high level of standards of service.
6.1 INTRODUCTION
Va lue for money for customers of a water company l ike SA Water that is highly asset-based and does not set the prices it charges, is problematic and difficu lt to assess. Demonstrating va lue for money is made even more cha l lenging when compa rab le water providers
interstate do not have the same operating conditions. For example, most do not pump
source water long distances; most have access to source water that is of genera l ly good
qua l ity; and most provide their services in geographica l conditions with soi ls that a re either sandy or more read i ly worked compared with the clay soi ls around Adela ide. To compound
problems associated with the use of compa risons, as discussed ear l ier there is a n
inconsistent a pproach to the va l uation of assets in the water industry in Austra l ia which has
a conseq uentia l impact on the calcu lation of tota l costs.
Notwithstand ing these qu ite significant obstacles it is important to consider the services
being provided in the context of the charges being levied, that is, the va lue for money for customers who purchase water and wastewater services. Va lue for money for customers is considered here in terms of:
G customer feedback - that is, what customers say about the qua l ity of services and the price;
iii an assessment of the relative qua l ity of service compared to other water bodies; and iii an assessment of the costs of provid ing the services relative to the customer's b i l l .
A brief discussion is a lso provided a bout the Corporation's Customer Assist Program that has been developed to ass ist customers in financ ia l hardship .
81

I n aggregate th is information provides some assessment of the va lue for money customers
derive from the services provided by the Corporation .
6.2 CUSTOMER FEEDBACK
As ind icated ear l ier in th is report, i n June 2009 the Corporation undertook its n inth a nnua l customer satisfaction survey to measure satisfaction with its service del ivery and
performance across a broad range of a reas. The state-wide study involved three telephone
su rveys for three target groups:
• General households - 600 interviews (400 metropol itan and 200 regiona l ) ;
• Households who have contacted SA Water - 401 i nterviews (209 metropol ita n and
192 regional ) ; and
• Bus inesses - 304 interviews (200 metropol itan and 104 regiona l ) .
Genera l household survey results Table 6 .1 shows the total resu lts of the genera l household survey. Overa l l, these resu lts
show: • very high leve ls of satisfaction with ind icators such as rel iab i l ity of supply, safety of
d rinking water and essential service provided;
• relative ly high levels of satisfaction with SA Water being professional and
competent, responsive when something goes wrong, active i n educating the pub l ic about water issues, and be ing trusted to manage the State's water and wastewater systems wel l ; and
• m ixed levels of satisfaction with the amount charged for water as it represents good
va l ue and in reducing greenhouse gas emissions.
Overal l , the su rvey confirmed SA Water is wel l regarded as a service provider with customer
satisfaction at a high rate of 8.0 (out of 10) .
Table 6.1 General Household Survey Results
Attribute Result Relia
bi l ity o
f service 8.5
Safety o
f drinking water 8.2
Essential service 8.0 Performance an
d competence 7.6
Responsiveness to a problem 7.1
Advice in e
ducating t
he pu
blic 7.0
Trusted manager o
f water an
d wastewater systems 7.0
Charges re
flect value
for money 6 .5
Reducing green
house gas emissions 6.3
82

Households who have contacted SA Water Table 6.2 shows the resu lts of the su rvey of customers who had contacted SA Water recently. In particu lar, these are resu lts of the su rvey that sought responses concern ing the
level of satisfaction with the service provided by SA Water. Overa l l, these resu lts show: 1\1 very high levels of satisfaction with SA Water's rel iab i l ity of supp ly, the safety of
dri nking water supp l ied, and the provision of a n essential service;
1\1 re lative ly high levels of satisfaction with SA Water's services for being active in
educating the publ ic about water issues and how to conserve water, being trusted to
manage the State's water and wastewater systems wel l, being responsive when
something goes wrong, and being professiona l and competent; and
1\1 mixed leve ls of satisfaction with the amount charged for water as it represents good
va l ue a nd in reducing greenhouse gas emissions.
Overa l l, the su rvey confirmed SA Water is wel l regarded as a service provider with customer
satisfaction at a h igh rate of 8.0.
Table 6.2 Household's contacted SA Water Survey Results
Attribute Result Relia
bi l ity of service 8.5
Safety of drinking water 8.0
Essential service 8.0 Professional and competent 7.9 Responsiveness to a pro
blem 7.8
Trusted manager of water and wastewater systems 7.3 Advice in educating t
he pu
blic 7.2
Charges reflect value for money 6.6
Reducing greenhouse gas emissions 6.2
Business survey results Table 6.3 shows the resu lts of the su rvey of business customers. In particu lar, these a re
resu lts of the su rvey that sought responses concerning the level of satisfaction with the
supply of ma ins water and sewerage services to their bus iness. Overa l l , these resu lts show: • very h igh levels of satisfaction with rel iab i l ity of su pply and the effort to provide
water at an acceptable pressure;
CD relatively high levels of satisfaction for SA Water being professional and competent, being trusted to manage the State's water and wastewater systems wel l ,
respons iveness when someth ing goes wrong, the leve l of commitment to improving d rinking water qua l ity, the leve l of environmental responsibi l ity; and
1\1 mixed levels of satisfaction with the va lue for money that SA Water provides in
return for what they charge and the extent future needs a re being met, not just
managing for today.
Overa l l, the su rvey confirmed SA Water is well regarded as a service provider with business customer satisfaction at a high rate of 7.8.
83

Table 6.3 Business Customer Survey Results
Attribute Relia
bi l ity of service
Effort to provide water at accepta
b le pressure
Professional and competent
Responsiveness to a problem
Commitment to improving drinking water quality
Level of environmental responsi
bility
Trusted manager of water an
d wastewater systems
Charges ref
lect va lue for money
Focus on future needs
6.3 COMPARA TlVE LEVELS OF SERVICE
Metropolitan operations
Result 8 .6 8 .3 7 .5 7 .3 7 .1 7.0 7.0 6.9 6 .7
The Corporation's performance in a range of service measures compared to other i nterstate
water ut i l ities for its metropol itan operations is summarised in Table 6.4 The compared
ut i l ities a re the same as those used in the benchmarking a na lysis of the NPR in the ear l ier
chapters of this report. In com pa ring the re lative performance, the performance of each
water ut i l ity is ranked aga inst the total n um ber of compared ut i l ities - the better performing being given a higher ranking. The number shown in brackets is the number of
ut i l ities compa red. This va ries due to the ava i lab i l ity of data.
The Table a lso makes a qua l itative assessment of the performance - they a re assessed as either high, med ium or low for a segment of the ranked scores as fo l lows :
Ranking of 1-4
Ranking of 5-8
Ranking of 9-12
H igh
Med ium Low
For example, from the Table, SA Water's metropol itan operations performance for the number of water qua l ity compla ints per 1,000 properties was the highest from a tota l of 12
compared uti l it ies. This was considered high performance. Where the Corporation has
scored "Low" performance (n umber of sewer mains breaks and chokes and net greenhouse
gas emissions), issues associated a re discussed in Sections 4.2 and 4.3 above.
84

Table 6.4 SA Water metropolitan service performance - summary comparisons
Service Standard Rank Corporation
07-08 Performance
Customer Service and Water Quality Percentage o
f popu
lation w
here micro
biological compliance
was achieved Equal 1 H ig
h
Number o
f water qual ity comp
la ints per 1,000 properties 1
(12)
High
System Performance No. o
f water main
breaks per 100
km o
f main 4
(12)
High
Number o
f sewer main
breaks and c
hokes (per 100
km)
10 (12)
Low Infrastructure
leakage index 5
(12)
Med Sustainable Future Sewage treated to a tertiary level
(%)
Equal 1 High
Recycled water (%of effluent recycled
) 1 (12)
H igh
Net greenhouse gas emissions
(tonnes C02 -equiva lent
) 12 (12)
Low Bio-solids reused
(%)
1 (12)
H igh
Sewer overflows to t
he environment
(per 100
km)
8 (12)
Med
Regional operations The resu lts of comparisons of performance of the Corporation's regional operations relative
to interstate regions regiona l ut i l it ies a re provided in Table 6.5 . A ran king is provided according to the number of uti l it ies with data supp l ied in a s imi lar manner to the
metropol itan operations.
The Table a lso makes a qua l itative assessment of the performance - either high, mediu m or low and relates this to a segment of the ran ked scores8.
5 The assessments have been aSSigned on the basis of the following number of indicators:
No. of indicators High Medium Low
7 1-2 3-4 5-7 8 1-3 4-6 7-8 9 1-3 4-6 7-9 12 1-4 5-8 9-12
85

Table 6.S SA W ater s re atlve per ormance -I . f eglOna operations - service stan ar s R . d d
Performance measure Mt Gambier Whyalla Ranl<ing Performance Ranking Performance
Customer Service and Water Quality
Number o
f water qual ity compla ints
/l,OOO 6 (7) Low 4 (7) Me
dium
properties System Performance
Number o
f water main
breaks
/100 km 1 (7) H ig
h 5 (7) Low
Number o
f breaks an
d chokes
/lOOkm 1 (7) H ig
h 2 (7) Hig
h
Sustainable Future
Net greenhouse gas emissions
(tonnes C02 - 3 (5) Me
dium 5 (5) Low
equivalent)
Overal l comparison of service level
When comparing the range of service measures with other water companies i n Austra l ia ( 12
in the metropol itan a rea and u p to 7 i n regional a reas), the Corporation d isp lays the
fo l lowing overa l l relative performance in standards of service :
Service Relative Performance Standards High Medium low Metropolitan 6 2 2 Mt Gam
bier 2 1 1
Whyalla 1 1 2
Total 9 4 5
That is, when aggregated approximately 70% of the Corporation's performance resu lts a re at the high and medium compa rative level with the remain ing 30% at the low comparative
leve l . It can therefore be concluded that the standard of service offered by the Corporation
to its customers is predominately at the mid-to-high leve l when compared with the service
levels offered customers of compared water uti l ities.
6.4 COMPARA TlVE LEVEL OF COSTS OF SERVICES AND CUSTOMER BILLS
A customer's assessment of va lue for money invariably wi l l be the intersection of va lue or
qua l ity of service and the cost or charge. Customer feedback has been d iscussed in Chapter 6.2 and a comparison of leve ls of service has been made in Chapter 6.3. This
chapter considers the relative costs of provid ing the service and the correspond ing charges
levied on customers .
The 'costs' a re reflected by the operating cost per property for water supp ly and operating cost per property for wastewater services contai ned in NPR 2007-08. This metropol itan data has been provided a l ready in this report but it is combined in Tab le 6.6 for broader
comparison pu rposes. Also, for ease of comparison, data is presented for each Austra l i an
86

main land city (based on the relevant water ut i l ity i n each State/Territory) . A weighted
average has been used to recognise the substantia l ly different number of properties served
in each city. For example, Darwin has substantia l ly h igher costs than the other cities but this has l ittle impact on the weighted average given its s ize.
Tab le 6.6 shows the operating costs per property for combined water supply and
wastewater services in Adelaide a re the lowest in 2007-08 and consistently lowest of each
city in the previous five years. Costs in Adelaide a re consistently below the weighted average cost.
Ta ble 6.6 Operating cost per property for metropolitan water supply & wastewater services
(2007-08 dollars) State I
Territory 2003-04 2004-05 2005-06 2006-07 2007-08 Metro SA Water SA 334.20 343.49 347.27 362.21 361 .00
Water Corporation - Perth WA 352.58 381 .76 391 .00
Melbourne' Vic 454.57 481 .93 447.91 449.93 449.58
Brisbane Water Qld 437.80 447.84 436.48 466. 1 4 529.00
Sydney Water NSW 404.00 424.00 346.00 445.00 589.00
ACTEW Corporation ACT 633.87 6 1 7.42 521 .44 592.70 609.00
Power and Water - Darwin NT 598.94 597.91 740.88 720.00
WeiQhted AveraQe 41 8.45 439.02 398.47 437.1 7 492.44 * This is a conso
lidation o
f data
for City West Water, Sout
h East Water and Yarra Va
l ley Water.
Charges to customers a re presented in Tab le 6.7 as a combined average water and wastewater b i l l based on a water consumption of 200kL per annum. A weighted average has
been used . Data shows that Ade la ide res idents are charged at about the mean of their
interstate counterparts but s l ightly more than the weighted average.
Table 6.7 Annual Bill (water and sewerage)
State I Territorv 2007-08 Metro Melbourne' Vic 540.9
Power and Water - Darwin NT 600.34
SA Water SA 729.92
Sydney Water NSW 732.32
Brisbane Water Qld 754.4
Water Corporation WA 796.26
ACTEW Corporation ACT 879.26
WeiQhted AveraQe 685.43 * This is a consolidation of data for City West Water, South East Water and Yarra Valley Water.
87

As a n a lternative graphica l representation, F igure 6.1 shows the combined rea l operating
costs for water and wastewater services of twelve metropol itan water providers over la id with an average ran king of th i rteen ( 13) key performance measures from the N PR 2007-08.
The table shows that SA Water's operating costs (shown in red ) are lowest of a l l the compared providers and ranked th i rd in terms of the average of the 13 key performance measures.
Figure 6.1
Water a n d Sewer 725 ---------------------------------------------.--700
� 675 OJ 0. 650 e 0. 625 -"!!!; OJ 600 -tl.O {'! 575 OJ :s: 5 5 0 OJ .oJ '"
-.:,.. 5 25 � 500 tU � ... 475 In 0 450 u tl.O 425 c
'.:; {'! 400 OJ 0. 375 0 Cii 35 0 OJ
III 0::
325 300
3.50 4.00 4.50 5.00 5.50 6.00 6.50 7.00 7.50 8.00 8.50 9.00 9.50
Average Rank (NWI 2007-08) --_ .. ----------------'
6.5 CUSTOMER ASSIST PROGRAM
SA Water recognises that there a re t imes where customers fi nd it difficu lt to meet
household expenses and other financia l ob l igations due to economic hardsh ip, temporary financ ia l d ifficu lty or tragic l ife events. I n order to provide assistance, SA Water has
introduced a Customer Assist P rogram a imed at identifying customers who a re having
d ifficu lties and p rovid ing assistance as early as poss ib le to help prevent customers fa l l ing
into a ut i l ity debt sp ira l .
Potentia l causes of hardsh ip can inc lude :
Unemployment
Low / reduced income
I I I hea lth
Domestic violence
Addictions (drugs, a lcohol, gamb l ing) Unexpected la rge or mu lt ip le b i l l s Relationship breakdown
88

Through the Customer Assist Program customers can access assistance through flexible
payment a rrangements, whi lst being sh ielded from fu rther fees and charges. As of September 2009, over 435 customers have entered the Customer Assist Program with many
more receivi ng ongoing assistance.
An integra l pa rt of SA Waters Customer Assist Program is working closely with various
organ isations which make up South Austra l ia's welfare sector. The Customer Assist Program
Co-ord inator works d i rectly with fi nancia l Counse l lors to determine the appropriate type of assistance, ensuring customers a re not negative ly and unnecessari ly impacted by fu rther
recovery action .
I n order t o promote the Customer Assist Program, S A Water co-presents a t information
forums with Origin Energy and AGL Energy. These forums a re a imed at educati ng financia l counsel lors on the assistance which is ava i l able.
Addit ional schemes that form part of the Customer Assist Program inc lude the
implementation of Centre l i nk's Centrepay functiona l ity which was introduced i n December 2009. This wi l l give customers who receive a Centre l ink benefit the opportun ity to have
nominated payments deducted from their entit lement on an a utomated regu la r basis.
An in itiative to provide identified hardship customers with assistance in the repa iring of
leaking internal pipe work is cu rrently being eva luated. The basis of this in itiative is that hardship customers who a re on fixed low incomes may not have the fi nancia l a bi l ity to perform requ i red maintenance on their i nternal pipe work, which may lead to a bnormal ly
h igh water use b i l ls .
89
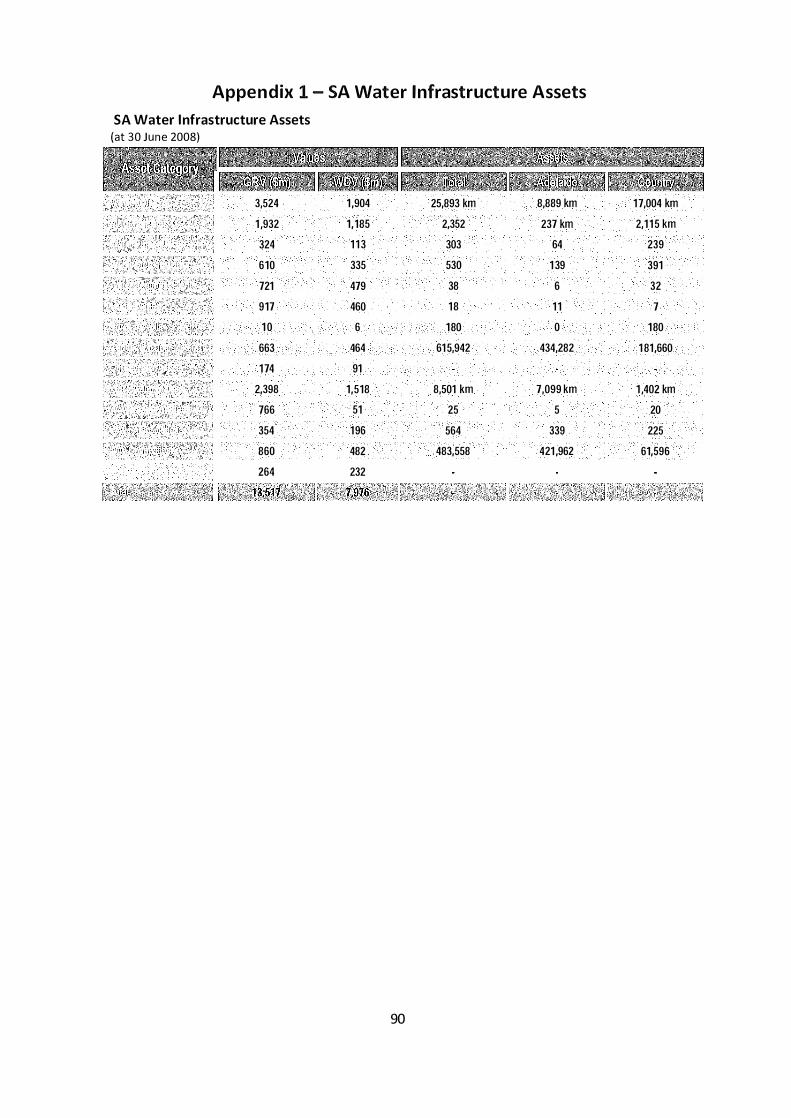
Appe n d ix 1 - SA Water I nfrastructure Assets
SA Water Infrastructure Assets (at 30 June 2008)
3,524 I : ; ' " 1 ,932
> i l ! 324 j ' ! , 610
''', I I I ) 721 917
i i' 1 0 ) ' ; 1 \ ) 1 ' 663
i ' l \ 1 74 2,398 766 354 860 264
1 ,904 1,185 1 1 3 335 479 460
6 464 91
1,518 51
196 482 232
25,893 km 8,889 km
2,352 237 km
303 64 530 1 39 38 6 18 1 1
180 0 61 5,942 434,282
8,501 km 7,099 km
25 5 564 339
483,558 421 ,962
90
1 7,004 km
2,1 1 5 km
239 391 32 7
180 1 81,660
1 ,402 km
20 225
61,596

Appendix 2 - Asset Progra m s by Major Theme & Focus Area
FUll LIST OF ASSET PROGRAMS BY MAJOR THEME AND FOCUS AREA
Major Theme Sub-theme Category Asset Program Title (Focus Area )
Strategic Improved Customer Improved Customer Service Drivers Service
Water Security Water Security
Drought Response
Water licence Purchases
Recycled Water Expansion Water leakage Management
Service Rel iabi l ity & Service Capa bi l ity Management Effic iency Energy Management
Water Qua l ity Cryptosporid ium Management Management Source Water Qua l ity Improvement
Network Water Qual ity Management
Treatment Plant Water Qua l ity Management
Country WQ - improve potable supp l ies Country WQ - minor system aesthetics
Environmental Adela ide Coasta l Waters Management
Improvement Adela ide H i l l s Backlog Sewerage
Cl imate Change- G reenhouse Impacts Environmental Improvement Program {E IP}
Environmenta l F lows EPA Water Qua l ity Pol icy Implementation
Improve Environmental Performance
Noise Management Odour Management
Overflow Abatement Program
S iudge/Bioso l ids Management
Safety Dam Safety Improvement
OHS I mprovement
Security Management
Asset Condition Water Ma ins Water Network - Major Pipel i nes & Performance Management Water Network - Trun k Mains
Water Network - Reticu lation Mains
Water Network - Anci l la ries
Wastewater Mains W/water Network - Trunk Mains Management W/water Network - Reticu lation Mains
W/water Network - Pumping Mains W/water Network - Anci l l a ries
Mecha n ica l & E lectrical M & E - Major P ipel ines Equ ipment Management M & E - Treatment P lants
M & E - Networks
Structu res Management Structu res - Major P ipel ines
Structu res - Treatment Plants Structu res - Networks
91

Appe n d ix 2 - Asset Progra m s by Major Theme & Focus A rea
Dams & Weirs M anagement
Other (smal ler asset c lass) SCADA Management
programs Cathodic Protection Management
Customer Meter F leet Management Master Meter Management
Recycled Water Ma ins
Recycled Water Treatment
Land Management
Regional Accommodation
Demand N etworks G rowth - Networks
G rowth
Treatment G rowth - Treatment Plants
Extensions and Extensions and Connections (as mandated Connections by pol icy)
Other Systems P lann ing Tools
92

Appendix 3 - Source Data
Strategic Map The Corporation's Strategic Map (from this point forward referred to as SM) provides the overa rching d i rection of the Corporation, inc lud ing its vision, core business and va l ues. The Strategic Map provides an overview of the Corporation's strategy via the Strategic
Objectives which a re supported by key performance ind icators (KP I's) a nd the associated
ta rgets that SA Water is a im ing to achieve by 2013-14. The Corporation has been using the Strategic Map to monitor its performance in key a reas s ince 2006-07 a nd to a lso guide its
p lann ing into the futu re.
In assessing performance, the Efficiency Report discusses 2006-07, 2007-08 a nd 2008-09
Strategic Map resu lts and any preva i l i ng trends. The report a l so refers to the Strategic Map ta rgets in 2013-14 to assess where the Corporation is a im ing to improve service leve ls.
National Performance Report S ince 2005-06, the National Water Commission (NWC) i n association with the Water
Services Association of Austra l ia (WSAA) has pu bl ished a National Performance Report
(NPR) .
The NPR seeks to improve performance reporting of the Austra l i an u rban water uti l ities by
ensuring defin itions a re consistent and data is accurate. The N P R highl ights trends in the
performance of each ut i l ity and enables comparisons between ut i l ities. The NPR is based on
the princip les of comparab i l ity, accuracy a nd consistency and covers a l l the critica l performance a reas i n the provision of water services inc lud ing health, customer service,
asset management, environment, finance and pricing. The accu racy of information is ensured by a ro l l ing 3 yea r auditing regime and, to ensure consistency, the NPR is based on
a nationa l ly consistent framework of defi nitions developed and agreed by NWC, the NWI pa rties and WSAA. Despite the efforts of the NWC and WSAA to ensure comparabi l ity
between the performances of ut i l ities, several factors need to be considered when ana lysi ng
trends . For example, the performance of ut i l ities is affected by structura l and geographica l
factors such as "functional responsibi l ity, water/sewerage network characteristics, customer base composition, physica l operating envi ronment"9, demand management in itiatives, age of i nfrastructure etc. F inancia l factors such as the asset va l uation methodology adopted
may a lso affect comparab i l ity.
The first sect ion of the N P R, Part A, provides a set of 30 separate performance ind icators
which have been used in the Efficiency Report to ana lyse longer term trends in performance
and to benchmark performance aga inst comparable Austra l i an water uti l ities.
Data used in this Efficiency Report is primari ly sourced from the NPR 2007-08. The N P R
2008-09 was not released a t the t ime of compi l ing th is report. The re lease date i s d u e t o be in late Apri l .
Fo r metropol itan operations, the N P R 2007-08 inc ludes data for the period 2002-03 to 2007-08.
93

Appendix 3 - Sou rce Data
For regional o perations, the 2007-08 N PR i nc l udes data from 2005-06 to 2007-08. For South
Austra l ia, the N P R on ly inc ludes regional data for Mt Gambier a nd Whya l la . This is consistent with the reporting requ i rements of the NWC that uti l it ies reporti ng in the NPR
m ust have more than 10,000 connections. Data pu bl ished in the NPR is requ i red to be
aud ited by an independent pa rty.
For the 2006-07 NPR SA Water focussed on data for the metropol itan a rea. I n 2007-08 focus
was placed on the regiona l Centres of Mt Gambier and Whya l l a . Consequently, h istorica l data for Mt Gambier and Whya l la pr ior to 2007-08 is min ima l . F u rthermore, due to the costs
of aud iting and demands on the resources of data providers, SA Water separates the aud iting requ i red for metropol itan a rea and regional centres. Another addit ion to the 2007-
08 NPR for the regional operations of SA Water is the publ ish ing of 'Country as a whole'
data i n the financia l section. F inancia l data for both Mt Gambier a nd Whya l la is not ab le to
be provided i n the N P R at this stage.
Financial Data The financia l a na lysis of past performance p resented in the Com mercia l Success chapter
(Chapter 5 ) is, as fa r as possible, based on data reported in the N P R 2007-08 which has been
sourced from the Corporation's financia l accounts. Where NPR data was not ava i lab le,
internal est imates have been included in Chapter 5, consistent with the Corporation's
Annua l Report segment reporting. Note there a re l im itations genera l ly in terms of ana lys ing
segmented data due to the a l location of ind i rect costs.
All figu res presented in Chapter 5 a re in rea l 2007-08 dol lars, consistent with the
2007-08 N PR. Capital expenditure has a lso been stated on a net of Federa l fund ing bas is,
consistent with the regu latory a pproach used to set water and sewer prices.
94

Append ix 3 - Source Data
1.5 SELECTION OF COMPARATOR WATER UTILITIES
The 82 water ut i l ities that reported in the NPR 2007-08 have been a rranged into the fo l lowing classifications for ana lytica l and presentation purposes:
• Major ut i l it ies ( large), greater than 100,000 connected properties; II Major uti l it ies (other), those between 50,000 and 100,000 connected properties; II Non-Major ut i l ities ( large), those between 20,000 and 50,000 connected properties; • Non-major ut i l ities (other), those between 10,000 and 20,000 connected
properties; and • Bu lk ut i l ities.
SA Water is represented as a major urban utility (large) for metropolitan operations and a
non-major utility (other) for its Mt Gambier and Whyalla operations.
For the purpose of this Report, comparisons for metropolitan operations are made with
twelve similar metropolitan water and wastewater utilities as follows:-
ACTEW Corporation (ACT)
SA Water (SA)
Barwon Water (Vic)
City West Water (Vic)
South East Water Ltd (Vic)
Yarra Valley (Vic)
Sydney Water (NSW)
Hunter Water (NSW)
Water Corporation (WA)
Gold Coast Water (Qld)
Brisbane Water (Qld)
Power and Water Corporation - Darwin (NT)
For regional operations, comparisons of performance are made with seven other regional
water and wastewater utilities as follows:-
Power and Water Corporation - Alice Springs (NT)
SA Water - Whyalla (SA)
South Gippsland Water (Vic)
East Gippsland Water (Vic)
SA Water - Mt Gambier (SA)
Byron Shire Council (NSW)
Country Energy (NSW)
For the benchmarking ana lysis, where a ut i l ity has not reported data the ut i l ity's name is not
shown in the Table .
95