Embed Size (px)
Citation preview

ANNUAL BANK SUPERVISION REPORT
2003-2004
NEPAL RASTRA BANK BANK SUPERVISION DEPARTMENT
CENTRAL OFFICE KATHMANDU
September 2005

1
Table of Contents Foreword S.N. Chapter Page No. 1 Bank Supervision in Nepal
1.1 Introduction 1 1.2 Principles of Supervision 1 1.3 Industry Development 3 1.4 Development in Supervisory Framework 8 1.5 Assessment of Compliance with the Basel Core Principles for
Effective Banking Supervision 9
2 Supervisory Activities in 2003/04 12 2.1 Annual Plan 12 2.2 On-site Supervision 13 2.3 Off-site Supervision 16 2.4 Major Enforcement Actions 25 2.5 Preparation for Basel-II Implementation 27 2.6 Capacity Building. 28 3 Performance Trends in the Commercial Banks 29
3.1 Overview 29 3.2 Balance Sheet Structure 30 3.3 Capital adequacy. 35 3.4 Assets Quality. 36 3.5 Earning/Profitability 41 3.6 Liquidity 42 4 Current Issued in Banking Supervision 45
4.1 Poor Corporate Governance and Insider Abuse 45 4.2 Emergence of Electronic Banking in Nepal-The need for a
regulatory framework 45
4.3 L/C Scams and forgeries in Commercial Banks 46 4.4 Need for Income Audit of Commercial Banks 46 4.5 Compliance with International financial Reporting Framework
(IFRS) 46
4.6 Other Issues and Challenges 47
Annexures Financial Statements of Commercial Banks Nepal Bank Limited 48 Rastriya Banijya Bank 49 Nabil Bank Limited 50 Nepal Investment Bank Limited 51 Standard Chartered Bank Nepal Limited 52 Himalayan Bank Limited 53 Nepal Bangladesh Bank Limited 54 Nepal SBI Bank Limited 55 Everest Bank Limited 56

2
Bank of Kathmandu Limited 57 Nepal Credit and Commerce Bank Limited 58 Lumbini Bank Limited 59 Nepal Industrial and Commercial Bank Limited 60 Machhapuchhre Bank Limited 61 Kumari Bank Limited 62 Laxmi Bank Limited 63 Siddhartha Bank Limited 64 Financial Indicator of Commercial Banks Nepal Bank Limited 65 Rastriya Banijya Bank 65 Nabil Bank Limited 65 Nepal Investment Bank Limited 66 Standard Chartered Bank Nepal Limited 66 Himalayan Bank Limited 66 Nepal Bangladesh Bank Limited 67 Nepal SBI Bank Limited 67 Everest Bank Limited 67 Bank of Kathmandu Limited 68 Nepal Credit and Commerce Bank Limited 68 Lumbini Bank Limited 68 Nepal Industrial and Commercial Bank Limited 69 Machhapuchhre Bank Limited 69 Kumari Bank Limited 69 Laxmi Bank Limited 70 Siddhartha Bank Limited 70

Foreword This annual report has been prepared covering all the activities of the Bank Supervision Department during the year 2003-04. Purpose of this report is to provide an overview of the departmental activities to the users of this report and general public at large. Bank Supervision Department has been executing supervisory functions entrusted by Nepal Rastra Bank Act 2001 so as to ensure whether commercial banks are operating prudentially and complying with regulatory requirements. The ultimate objective of the supervision lies in the protection of the depositors' interest. Tuning with the present scenario of globalization and increased economical activities in the country, commercial banks are now introducing complex and innovative banking products. This has amplified as well as diversified the functions to be performed by the Bank Supervision Department. In this light, Bank Supervision Department has adopted Risk Based Supervision both at Onsite and Offsite Level. Offsite surveillance can often identify potential problems, particularly in the interval between on-site inspections, thereby providing early detection and prompting corrective action. Onsite inspection ensures that returns received from the commercial banks are reliable and the banks are operating in line with prudential banking practice and complying with applicable laws and regulations. Nepal Rastra Bank is heading towards successful implementation of Basel II in our country. For this we have already formed an accord implementation group for proper analysis and formulation of necessary directives. This will again enhance our strength in the course of supervision. I am thankful to the team who has worked hard to prepare this Annual Supervision Report. Any constructive suggestions and recommendations from the users of this annual report shall be highly appreciated.
Rajan Singh Bhandari Executive Director
Bank Supervision Department Nepal Rastra Bank

1
1 Bank Supervision in Nepal
1.1 Introduction:
One of the missions of Nepal Rastra Bank is to promote safe, sound, accessible banking system and stable financial market through supervision and regulation of the nation's banking, financial, and payment system and through effective implementation of statutes designed to inform and protect the consumers and depositors.
Bank Supervision Department is responsible for executing the supervisory policies to ensure effective supervision of commercial banks of the country. The elements of the supervisory process encompassed in the objective of the Department include on site examination, Offsite supervision and enforcement of prescribed regulations. Department's functioning is broadly regulated by the Inspection and Supervision Bye Law, 2059.
Trained examiners and analysts in the Bank Supervision Department supervise and monitor the activities of commercial banks. In addition to monitoring the financial condition of the banks, examiners also review compliance with applicable laws and regulations and seek corrective measures where necessary. For effective supervision and enforcement action' Department function is divided in five division or units, namely Policy planning, Onsite Inspection, Offsite supervision, enforcement and Internal administration division.
1.2 Principles of Supervision:
Bank Supervision Department believes that the manner in which supervision policies are implemented is critical to the vitality of the banking system. Bank Supervision Department has adopted banking supervision principals promulgated by Basel Committee on Banking Supervision (BCBS) as guiding principals while formulating supervision plan and policies. For this reason, the Department adheres to following eight key operating principals to guide its processes:-
2
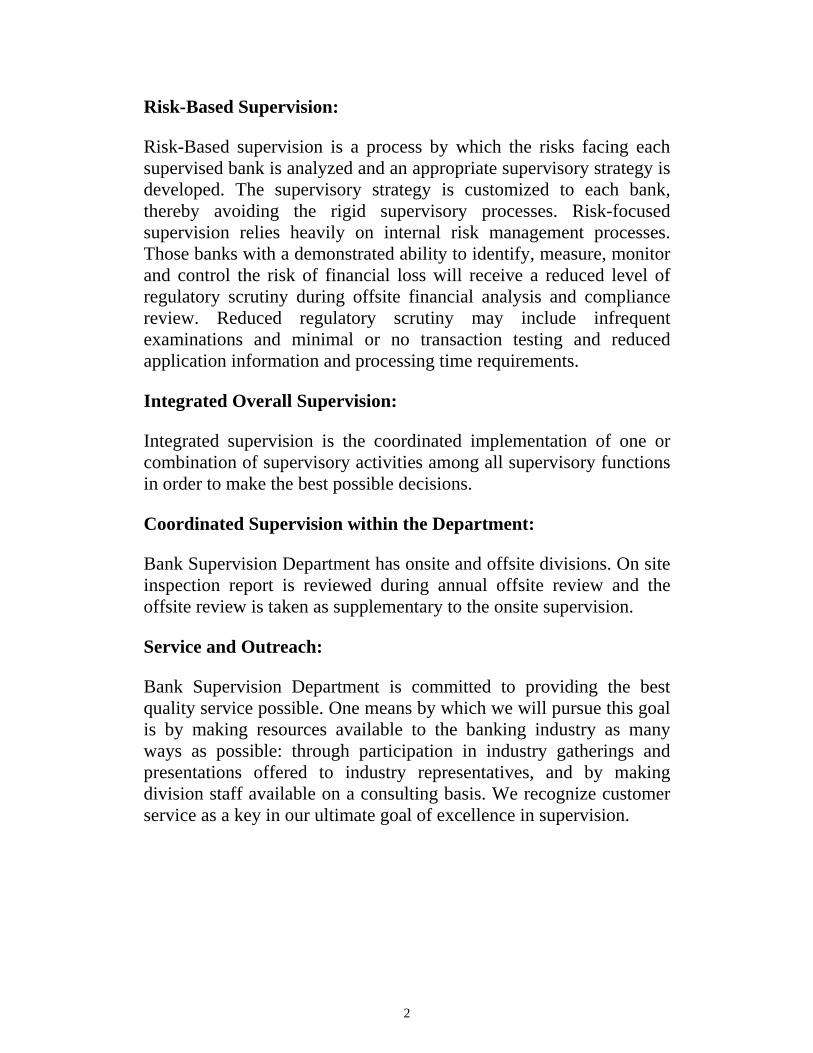
Risk-Based Supervision:
Risk-Based supervision is a process by which the risks facing each supervised bank is analyzed and an appropriate supervisory strategy is developed. The supervisory strategy is customized to each bank, thereby avoiding the rigid supervisory processes. Risk-focused supervision relies heavily on internal risk management processes. Those banks with a demonstrated ability to identify, measure, monitor and control the risk of financial loss will receive a reduced level of regulatory scrutiny during offsite financial analysis and compliance review. Reduced regulatory scrutiny may include infrequent examinations and minimal or no transaction testing and reduced application information and processing time requirements.
Integrated Overall Supervision:
Integrated supervision is the coordinated implementation of one or combination of supervisory activities among all supervisory functions in order to make the best possible decisions.
Coordinated Supervision within the Department:
Bank Supervision Department has onsite and offsite divisions. On site inspection report is reviewed during annual offsite review and the offsite review is taken as supplementary to the onsite supervision.
Service and Outreach:
Bank Supervision Department is committed to providing the best quality service possible. One means by which we will pursue this goal is by making resources available to the banking industry as many ways as possible: through participation in industry gatherings and presentations offered to industry representatives, and by making division staff available on a consulting basis. We recognize customer service as a key in our ultimate goal of excellence in supervision.

3
Open and Honest Communications:
Bank Supervision Department believes that open and honest communication is an important part of the supervisory process. As a part of these communication means' we are committed to providing banking industry with the best professional guidance and assistance possible. Informal contacts with commercial banks and industry associations are encouraged as a means by which to respond promptly to issues and development.
Reduced Regulatory Burden:
Bank Supervision Department believes that the public interest in a stable and efficient financial system is best served by minimizing the regulatory burden that is placed on the industry. The degree and regulatory burden is based on the financial soundness of each individual bank.
Use and Understanding of Technology:
Bank Supervision Department recognizes the value of technology as applied in the supervisory framework. Among other applications, management and staff are committed to employing technology to monitor the condition and operation of supervised commercial banks to the greatest possible extent.
Professional and Technical Competence:
Bank Supervision Department actively encourages the development of professionalism and technical competence among its staff. The combined effect of personal contact with banks between examination and the quarterly review and analysis of CAELS results will undoubtedly improve our staff's ability to assess and supervise the condition of any particular bank. It is also our goal for the quarterly financial analysis to foster a closer and more personal working relationship with each bank.
1.3 Industry development:
After the successful implementation of 1988 capital accord in more than 100 countries, the Basel Committee on Banking Supervision

4
reached an agreement on a number of important issues for promoting prudential and uniform banking practices as well as setting standards and guidelines for supervisory functions. Realizing the fact, it has developed a new comprehensive framework for capital requirements based on the various risk exposures of the banking business, which is also popularly known as Basel–II. The Basel–II has been introduced basically for the protection of depositor's interest by preserving the integrity of capital of Banks. It is expected that the Basel–II will be a milestone in the global banking history
Key Elements of the New Accord:
The New Accord consists of three re-enforceable pillars:
(1) Minimum capital requirements,
(2) Supervisory review process and
(3) Market discipline.
The proposals comprising of each of the three pillars are summarized below:-
Pillar 1: Minimum capital requirements:
The current accord is based on the concept of a capital ratio where the numerator represents the amount of capital a bank has available and the denominator is a measure of the risks faced by the bank and is referred to as risk-weighted assets. The resulting capital ratio may be not less than 8%.
The current accord explicitly covers three types of risks in the definition of risk-weighted assets: (1) credit risk (2) market risk, and (3) operational risk
A major innovation of the proposed Basel–II is the introduction of three distinct options for the calculation of three types of risk. It is not feasible or desirable to insist upon a one-size-fits-all approach to the measurement of either risk. Instead, for credit, operational and market risk, there are three approaches of increasing risk sensitivity to allow banks and supervisors to select the approach or approaches that they

5
believe are most appropriate to the stage of development of bank's operation and of the financial market infrastructure. The following table identifies the three primary approaches available by risk type.
Credit Risk Operational Risk Market Risk 1 Standardized
Approach Basic Indicator Approach
Variance Co-variance Approach
2 Foundation IRB Approach
Standardized Approach
Monte Carlo Simulation Approach
3 Advanced IRB Approach
Advanced Measurement Approaches (AMA)
Historical Simulation Approach
Credit risk:
A bank always faces the risk that some of its borrowers may renege on timely repayments of loan, interest on loan or meet the other terms of contract. This risk is called credit risk, which varies from borrower to borrower depending on their credit quality. Basel–II requires banks to accurately measure credit risk to hold sufficient capital to cover it.
Factors affecting credit risk can be summarized by the following formula:
Expected Loss (EL) on a loan = Exposure at default (EAD) X Loss given default (LGD) X Probability of Default (PD).
The bank can also suffer losses in excess of expected losses, say, during economic downturns. These are called unexpected losses. Ideally, a bank should recover expected loss on a loan from its customer through loan pricing. The capital base is required to absorb the unexpected losses, as and when they arise.
Market risk:
Investment is risky because of the change in their prices due to market forces. This volatility in the value of a bank's investment portfolio is known as the market risk, as it is driven by the market forces. The change in the value of the portfolio can be due to changes in interest

6
rate, fluctuation in exchange rate or the changes in the values of equity or commodities.
Operational risk:
Several events that are neither due to default by third party nor because of the volatility of the market mechanism are called operational risks and can be attributed to internal systems, processes, people and external factors.
Pillar 2: Supervisory review process:
Pillar II ensures that not only do the banks have adequate capital to cover their risks, but also that they employ better risk management practices so as to minimize the risks. Capital cannot be regarded as a substitute for inadequate risk management practices.
This pillar requires that if the banks use asset securitization and credit derivatives and wish to minimize their capital charge they need to comply with various standard and control. As a part of the supervisory process, the supervisors need to ensure that the regulations are adhered to and the internal measurement systems are standardized and validated.
The supervisory review process is based on four principles:
Principle 1: Banks should have a process for assessing their overall capital adequacy vis-à-vis their risk profile and a strategy for maintaining their capital levels.
Principle 2: Supervisors should review and evaluate bank's internal capital adequacy assessments and strategies, as well as their ability to monitor and ensure compliance with regulatory capital ratios. Supervisors should take appropriate supervisory action if they are not satisfied with the result of this process.
Principle 3: Supervisors should expect banks to operate above the minimum regulatory capital ratios and should have the ability to require banks to hold capital in excess of the minimum.

7
Principle 4: Supervisors should seek to intervene at an early stage to prevent capital from falling below the minimum levels required to support the risk characteristics of a particular bank and should require rapid remedial action if capital is not maintained or restored.
Given the kind of responsibilities, the supervisor's role assumes high importance in the Basel–II . Pillar II does not seek to harmonize supervisory processes across countries as they have different supervisory objectives, legal processes and authority of supervisors. It allows for sufficient national discretion but still it wants supervisors to maintain some degree of consistency in their approaches.
Pillar 3: Market discipline:
Banking operation is becoming complex and difficult for supervisors to monitor and control. Though supervisors try to indoctrinate corporate governance in banks, they can take indication from the market to strengthen their supervisory and monitoring activities. In this context, Basel Committee has recognized that market discipline is so important that it warrants being the third pillar of Basel–II norms.
This market discipline is brought through greater transparency by asking banks to make adequate disclosures. The potential market participants of these disclosures are supervisors, bank's customers, rating agencies, depositors and investors.
With frequent and material disclosures, outsiders can learn about the bank's risk. Armed with this information, the outsiders can always protect themselves by ending their relationships with the bank.
Market discipline has two important components:
Market signaling is the form of change in bank's share prices or change in bank's borrowing rates
Responsiveness of the bank or the supervisor to market signals
Seeing the importance of the impact that the market can have on banks, Pillar III provides a comprehensive menu of public and regulatory disclosures like disclosures related to capital structure (core and supplementary capital), capital adequacy, risk assessment and risk

8
management processes to enhance the transparency in banking operations.
Impact of Basel–II:
Basel–II norms are expected to have far-reaching consequences on the health of financial sectors worldwide because of the increased emphasis on banks' risk-management systems, supervisory review process and market discipline.
The new norms bring to front not only the issues of bank-wide risk measurement but also of active risk management.
1.4 Development in supervisory framework:
Comprehensive onsite inspection manual has been developed in line with international standard, which is based on principle of Risk Based Supervision (RBS). Capital, Assets, Management, Earnings, Liquidity and Sensitivity to market risk are well addressed in the manual providing guidance for effective on site supervision. CAMELS rating for internal purpose are basic indicators for further monitoring and necessary action in the areas of problems.
Bank Supervision Department conducts periodical financial surveillance and monitoring based on the reports and returns received from the commercial banks and provide pre-examination analysis and other analytical support to onsite supervisors and supervision Department management.
Financial analysis and reviews of the offsite division works as an early warning signal helps to identify those commercial banks, which display a high probability of financial constraints. Offsite supervision reports are useful to identify the areas of review in the pre-onsite inspection planning process. Risk focused inspection (special inspection) and corporate level inspection may be recommended if need for such requirement is identified during the offsite review.
Objectives of the Nepal Rastra Bank include regulating, inspecting, supervising and monitoring financial system. Accordingly banking legislation has been amended over time and is currently being revised and strengthened in order to make the power and authority of the

9
Nepal Rastra Bank as regulator and supervisor of commercial banks more effective. Section 84 of the Nepal Rastra Bank Act, 2058 authorizes the NRB to inspect and supervise the commercial banks. Board has framed and implemented inspection and supervision byelaw, 2059 confirming to international standard for inspection and supervision of the commercial banks licensed by the Nepal Rastra Bank.
Necessity to consolidate prevailing laws relating to bank and financial institutions was felt and Bank and Financial Institution Ordinance 2061 was enacted, which has come into effect from 4th February 2004. Some amendments in the Bank and Financial Ordinance, 2061 and Nepal Rastra Bank Act, 2058 were also made as considered necessary.
Directive in respect of Credit Information and Blacklisting was issued on 2060-06-01 repealed and new directive on 2061-02-22. To regulate consortium loans granted by bank and financial institutions directive on Consortium loans was also issued on 2061-02-18. Similarly directive regarding Provision on Non-Banking Assets was issued on 2060-10-29
1.5 Assessment of compliance with the Basel Core Principles For Effective Banking Supervision:
NRB has adopted Basel Core Principles for Effective Banking Supervision as guideline for supervision of commercial banks. Core principles methodology adopted by Basel Committee provides a uniform template for both self-assessment and independent assessment. It involves four part qualitative assessment system: compliant, largely compliant, materially non-compliant, and non-compliant. For each principle essential and additional criteria are defined. To achieve a "compliant' assessment with a principle, all essential and additional criteria must be met without any significant deficiencies. A "largely compliant" assessment is given if only minor shortcomings are observed, and these are not seen as sufficient to raise serious doubts about the authority's ability to achieve the objective of that principle. A "materially non-compliance assessment has made when the shortcomings are sufficient to raise doubts about the authority's ability to achieve compliance. A "non-compliant"

10
assessment is given when no substantial progress towards compliance has been achieved. Following self-assessment was based on this methodology.
Objectives, autonomy, powers and resources (Principle 1)
Most of the essential criteria for each of the six sub-principles of CP1 were considered to have been met. Nepal Rastra Bank Act, 2058 has legally recognized Nepal Rastra Bank as the only supervisory authority not only for commercial banks but also the whole financial Institution of the country. Powers and duties of Nepal Rastra Bank as a supervising agency have been clearly laid down.
Licensing and structure (Principles 2-5)
Bank Supervision Department has assessed "Compliant" status of these principles.
Prudential regulations and requirements (Principles 6-15)
Clear directives has been issued regarding minimal capital requirements, loan loss provisioning, single obligor limit, accounting policies, insider lending etc. Risk management policies and other internal control systems of commercial banks are periodically reviewed for effective supervision.
Supervision reports indicate commercial banks are not complying with specific directives as well as prudential guidelines. Currently NRB is in the process of issuing revised set of directives. Thus it can be concluded that there are areas of improvement to achieve compliance status with Pr. 6-15.
Methods of ongoing supervision (Principles 16-20)
Bank supervision Department has both on site and off site supervision system in place. Standard formats are prescribed for regular reporting of statistical data of the banks, which is verified, on onsite examination to establish reliability of data. Corporate level examination of banks is done to ensure supervision of the banks on consolidated basis. It is assessed that Pr. 16-19 is largely complied with.

11
However there is supervisory concern over the matter of issues raised in the earlier onsite examination remaining uncorrected in the subsequent examination. Consolidated supervision (Pr.20) was a critical issue because of the prevalence of cross-ownership and other links between and among banks and financial institutions.
Information requirements (Principle 21)
Banks are required to publish their data on quarterly basis and annual reports with complete disclosure in the statutory formats laid down by the NRB. Banks are generally inspected every year with gap of not more than two years to ensure that the data submitted by the banks are reliable and up to date and bank maintains records as per the consistent policies and practices to ensure availability of true and fair picture of the banks earnings and financial position. Efforts are being done to Inspect all Commercial bank every year.
However, difference between the provisional figure and audited figure of the financial statements is found to be above acceptable limit in respect of most of the commercial banks. Requirement of the periodical returns was almost not complied by the two public sector banks. With the expected improvement, Pr.21 system was assessed as largely compliant.
Formal powers of the supervisors (Principle 22)
Pr.22 was assessed largely compliant. Banking supervisors are entrusted with the clearly laid down powers under the Nepal Rastra Bank Act, 2058 and Bank and Financial Institution ordinance, 2061. Corrective measures are taken when prudential regulations are violated and depositors are threatened in any other ways.
Cross Border Banking (Principles 23-25)
Nepal was assessed to be compliant with Principles 23-25 because foreign banks do not have any branches in Nepal nor does any Nepalese bank have any branch outside Nepal.

12
2 Supervisory Activities in 2003/04
Enactment of Nepal Rastra Bank Act, 2058, Implementation of Inspection and Supervision Byelaw, 2059, consolidation of banking and financial institution Acts into Bank and Financial Institution Ordinance, 2061, Restructuring of the Department and capacity building program of Bank supervision Department under NRB Re-engineering had laid many opportunities and challenges in front of the Department. Responsibilities are required to be more defined clearly and priority target needs to be segregated from the general one. This requires proper planning and implementation thereof. In this context, Department prepares annual plan for onsite and offsite supervision according to which supervision work is carried out in coming year.
2.1 Annual Plan:
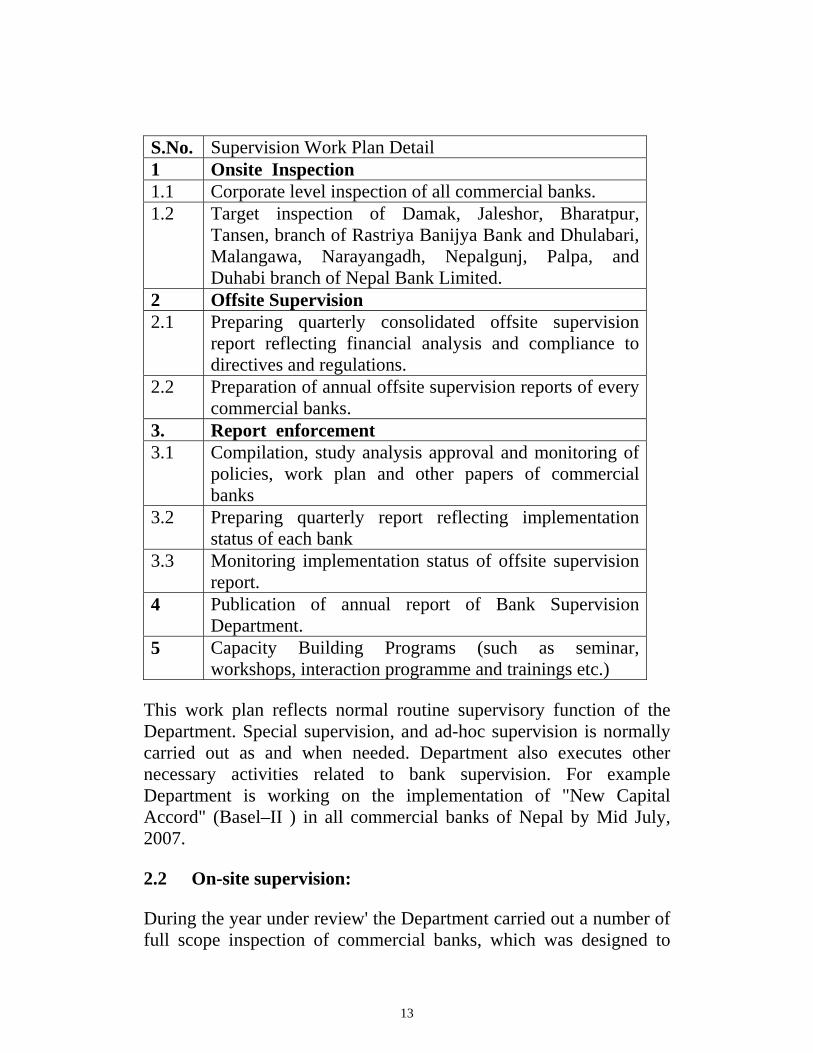
Increased number of commercial banks, increase in competition complexities of banking products and varied nature of transactions has put more challenge to improve existing supervision technique. It was felt that contemporary changes in the supervisory methods for identification of risk in the banking system are required. Accordingly, alteration in the inspection and supervision technique was made in line with "Inspection and Supervision Byelaw, 2059" and "On-site Inspection manual". Byelaw provides that all commercial banks are subject to a full scope on-site examination once a year and it also provides for deadline of the on-site and offsite reports. However, Bank Supervision Department has planned to have corporate level (full scope) on site inspection of all commercial banks in financial year 2061/62 as declared in monetary policy. Following supervision plan was made for the financial year- 2004-05.
13
S.No. Supervision Work Plan Detail 1 Onsite Inspection 1.1 Corporate level inspection of all commercial banks. 1.2 Target inspection of Damak, Jaleshor, Bharatpur,
Tansen, branch of Rastriya Banijya Bank and Dhulabari, Malangawa, Narayangadh, Nepalgunj, Palpa, and Duhabi branch of Nepal Bank Limited.
2 Offsite Supervision 2.1 Preparing quarterly consolidated offsite supervision
report reflecting financial analysis and compliance to directives and regulations.
2.2 Preparation of annual offsite supervision reports of every commercial banks.
3. Report enforcement 3.1 Compilation, study analysis approval and monitoring of
policies, work plan and other papers of commercial banks
3.2 Preparing quarterly report reflecting implementation status of each bank
3.3 Monitoring implementation status of offsite supervision report.
4 Publication of annual report of Bank Supervision Department.
5 Capacity Building Programs (such as seminar, workshops, interaction programme and trainings etc.)
This work plan reflects normal routine supervisory function of the Department. Special supervision, and ad-hoc supervision is normally carried out as and when needed. Department also executes other necessary activities related to bank supervision. For example Department is working on the implementation of "New Capital Accord" (Basel–II ) in all commercial banks of Nepal by Mid July, 2007.
2.2 On-site supervision:
During the year under review' the Department carried out a number of full scope inspection of commercial banks, which was designed to

14
provide supervisory assurance on the financial condition and soundness of the banks supervised. Onsite Inspection was carried out focusing mainly on the appraisal and verification of capital, asset quality, management, earnings, liquidity and sensitivity to risk and compliance with regulatory requirements.
During the year 2003/04 Corporate level inspection of Nepal Bank Limited, Rastriya Banijya Bank, Nabil Bank limited, Nepal SBI Bank Limited, Nepal Bangaladesh Bank Limited, Nepal Credit and Commerce Bank Limited, Lumbini Bank limited, Machhapuchhre Bank Limited and Kumari Bank Limited were completed.
Rastriya Banijya Bank
Corporate level inspection of the bank was completed on 31st Ashad 2061. Report writing was on progress. During the year under review 11 branches of Rastriya Banijya Bank were inspected including 3 branches, which were visited for Letter of Credit Inspection. However, no pertinent improvement was noticed in branch management after handover of management to the contracted People.
Nepal Bank Limited
Corporate level inspection of the bank was completed on 31st Ashad 2061. Report writing was on progress. During the year under review 11 branches of the Bank were inspected However, no remarkable change in branch management was noticed after takeover of management by foreign consulting firm.
Kumari Bank Limited
Corporate level inspection was completed during period from 2060-8-1 to 2060-10-14 on the basis of financial statements of 2060 Ashwin. The inspection report is submitted to the board for approval.
Nepal SBI Bank Limited
Corporate level inspection of the bank has been started on 2060-10-13 and completed on 2060-12-27. Inspection report is in the process of submission to the board.

15
Nepal Credit and Commerce Bank Limited
A special inspection team was assigned to review compliance status of directives given to the bank on 2060-4-9. Following directives were given to the bank as per inspection report of the inspection team.
1. To submit following documents in addition to regular return to Nepal Rastra Bank.
• Details of all new and additional loans and advances made by the bank.
• Details of Total loans outstanding, recovery of the month, Interest receivable and Interest suspense.
• Summary list of assets purchased or taken over by the bank for value above Rs. 1 Million.
2. Regarding Single obligor limit on loan disbursement, existing limit of Rs. 30 Million in Funded, Rs. 60 Million in Non-funded and 50 Million in TR continue to remain valid.
3. To implement written commitments made by Director and Managing Director on 2060-5-4.
Restriction on branch extension and deposit collection was also released and approval was given to process for public issue of Equity share.
The bank was also subject to corporate level inspection during the period from 2060-8-1 to 2060-10-26. The inspection was based on cut off date of 2060 Ashwin end. Follow up of the implementation status of directives given earlier was also made during the inspection. Inspection report is in the process of submission to the board.
Machhapuchhre Bank Limited
Corporate level inspection was completed during period from 2060-5-24 to 2060-6-20 on the basis of financial statements of 2060 Ashad. The inspection report is submitted to the board for approval.

16
Nepal Bangaladesh Bank Limited
Corporate level inspection was completed during period from 2060-8-1 to 2060-12-17. Inspection report is in the process of submission to the board.
Nabil Bank Limited
Corporate level inspection was completed on 2060-11-17. The inspection report is approved by Policy and Directives Implementation Committee for submission to the board.
Lumbini Bank Limited
Corporate level inspection of the bank was completed during 2060-5-15 to 2060-7-17. The inspection report is submitted to the board for approval.
2.3 Off-site Supervision:
Offsite supervisory activities during the year were focused on the following areas:
In the course of giving clearance to commercial banks to publish their annual accounts seven banks were instructed to make additional loan loss provision, two banks were given directives regards compliance as to minimum capital fund requirements, three banks were issued directives for non compliance of single obligor limits, five banks were instructed to publish their accounts in the statutory format prescribed by NRB some annexure of the financial statements submitted for approval were not in prescribed format, six banks were instructed to improve their credit management practices and three banks were instructed to improve their reconciliation system. One bank was also issued instruction on providing loan to Promoter shareholder against the provisions of Bank and Financial Institutions Ordinance, 2061. Banks are instructed to publish these directives in their annual reports.
Bank-wise details of instructions and directives issued in course of clearance of annual accounts are given hereunder:

17
Periodical Analysis
This was primary function of offsite supervision. This involved verification and analysis of weekly, monthly and quarterly returns received from commercial banks. Financial ratios and trend was analyzed alone with other indicators in the areas of capital, assets quality, liquidity, earnings and sensitivity to market risk. Department has prepared quarterly offsite report from second quarter of the year under review for commercial banks except for two public sector commercial banks. These two public sector banks are still defaulting in submission of periodical returns. Quarterly compliance report was also prepared as part of abovementioned reports. Capital adequacy, loan classification and provisioning, ceiling on investment in share and debentures and other regulatory requirement as well as financial conditions of the commercial banks are regularly monitored through these reports.
These reports were used as early warning signal and basis for recommendations of onsite inspection as well as indication of high-risk area or problem area.
Appraisal and Approval of Financial Statements
Annual Offsite Supervision Report of all the commercial banks was prepared and approval was given to publish financial statements with instruction to publish following directives in a separate leaflet of the annual report.
Nabil Bank Limited
• Submit Recovery and status report of loans written off on quarterly basis.
• In respect of dividends unclaimed and unpaid for more than five years, take necessary steps as per clause 3 of Section 82 of Bank and Financial Institutions Ordinance 2061
Kumari Bank Limited
• Transfer 10% of paid up capital to Capital adjustment fund before declaring dividends.

18
• Appoint coordinator of audit committee and inform Nepal Rastra Bank.
• Update credit policy in respect of Loan recovery procedures.
Bank of Kathmandu
• Make additional provision of Rs 9 lacs and accordingly make adjustments in employee's bonus.
• Provide for 100 per cent loan loss provision within next quarter in respect of two parties whose business is not in operation.
• Publish amended annexure 24 showing calculation of risk weighted assets showing claims made on bank but not accepted by bank in other contingent liabilities under 100 per cent risk weight category instead of showing it as performance bond under 50 per cent risk weight category.
• Make necessary disclosure in annexure 27 regards effect of showing income from foreign exchange operation as net of expenses while previous year income is shown in gross figures.
• Annexure of capital fund to be amended to include provisions on pass loans only under supplementary capital instead of showing provisions on pass loans as well as rescheduled & restructured loans.
Laxmi Bank Limited
• Strengthen internal audit Department by appointing requisite manpower.
• Bank to prepare its investment policy and submit a copy to NRB.
• Shortcomings in credit risk management such as some imperfect documentation to be mitigated by developing machinery to monitor credit risk.
• Internal auditor to certify investment portfolio as per investment policy and copy of it to be submitted to NRB.
• Staff loan to be shown under Other Assets in schedule 13 instead of showing it in schedule 11 under loans and advances.

19
• Publish schedule 8 and 10 as per format prescribed by NRB directives.
Everest Bank Limited
• In respect of Loans in excess of Single obligor limits either create capital charge for the same or bring them within limit by Paush 2061.
• Hold Board meetings on regular basis as per Bank and Financial Institutions Ordinance 2061.
• Prepare system security manual for the software used in bank .
• Provide for 100 per cent provision for Supreme Pipe and allied industries whose loan seems insecure within Kartik 2061 and inform Nepal Rastra Bank.
Standard Chartered Bank Nepal Limited
• In respect of dividends unclaimed and unpaid for more than five years, take necessary steps as per clause 3 of Section 82 of Bank and Financial Institutions Ordinance 2061.
Lumbini Bank Limited
• In respect of Loans in excess of Single obligor limits either create capital charge for the same or bring them within limit by Paush 2061.
• Explain cause of non-compliance of directive issued by Nepal Rastra Bank in FY 2060/61 to start the process of recovery of Loans given to the promoters (Amatya group) and to the parties in which promoters have financial interest by the end of Ashadh 2061.
• Also bank is hereby instructed to take necessary steps for recovery of such loans along with interest within 2061 Kartik and if recovery is not made in aforesaid period inform NRB after commencing recovery procedures.
• Take necessary steps either for adjustment of Rs3.76crore spent on purchase of fixed assets but shown as advances for past few years,

20
under appropriate accounting head or for recovery of the same from the concerned person.
• Recover loan given to one of the parties by Kartik 2061 and if recovery is not made in aforesaid period inform NRB after commencing recovery procedures.
• Provide for additional loan loss provision of Rs 2.56 crores for loan given to Suma Enterprises in Ashad 2061and accordingly also reverse excess Employees bonus of Rs 2.56crores by end of Kartik 2061. On such adjustment its Profit before taxes comes to only Rs 1.45crores.
• Publish schedule 8 and 10 A as per format prescribed by NRB directives.
Nepal Investment Bank Limited
• Provide 100 per cent provision on the loan given to Shivalaya Metal Pvt. Ltd since borrower is not in contact and loan is insecure by the end of Poush 2061.
• Borrower's family details and Black list details from Credit Information Bureau should be compulsorily taken before giving loans.
• Credit Policy Guidelines should be continuously updated according to the volume of business and with the passage of time.
Machhapuchhre Bank Limited
• New loans or renewal of existing loans should be done on the basis of feasibility study, credit appraisal, financial analysis etc.
• In case of working capital loans Stocks and Book debts being primary security their details should be taken on regular basis in accordance with terms of approval of working capital loans.
Nepal SBI Bank Limited
• Single Obligor limit is exceeded from time to time while sanctioning loans. Board of directors of Bank is required to give Special attention to its credit management and also towards

21
regularizing such loans by bringing them within limit by six months.
• Attention of Board of directors of Bank is invited towards increase in Amounts pending in the Agency reconciliation in comparison to past years. Also bank is required to constitute special task force to make necessary adjustments for such pending items.
• As per NRB directive supplementary capital should not include provision on restructured and rescheduled loans as provision for pass loan until the payment of interest and capital is regular for two years. Thus by excluding above revised total capital fund comes to Rs 67.14 crores and total capital fund/Risk weight assets ratio comes to 10.25 only which is less than the prescribed limit
• Since total capital fund to Risk weighted asserts ratio is less than prescribed level, bank is required to raise capital fund up to prescribed level within the prescribed time period and submit capital plan within 35 days.
Nepal Industrial and Commercial Bank Limited
• Loan facilities to be provided only after due management decision and written approval.
• Facility of Letter of credit to be provided only after due renewal of C.F.A. and extension of time period.
• Internal audit function to be strengthened according to the volume of business of the bank.
• Necessary legal action to be taken for recovery of bad loans.
• Arrangements should be made for regular physical verification of the fixed assets of the bank.
Nepal Credit and Commerce Bank Limited
• Credit facilities to be provided only after fixing the limits and obtaining all necessary procedural documents.
• Attention of the Board is invited towards need for improving credit management as wide practice of giving temporary overdraft and non recovery of the expired loans is observed.

22
• Letter of Credit and Guarantees opened in foreign currency should be shown using exchange rate prevailing as at end of Ashadh 2061.
• Amounts pending in the inter bank reconciliation and other agency accounts to be adjusted under appropriate headings.
• Attention of the board is invited to the fact that bank has not adjusted the amount pending in Notional account of Interest Earned but not collected despite instructions issued last year to do so.
• Bank is instructed to make arrangements for insurance of excess cash held in its vault.
• In respect of Letter of credit of US$1.72lacs bank is instructed to determine whether payment of the above amount is required or not and if it is not required document in respect of the above Letter of credit to be returned with adequate reasons or take steps to accept the liability.
• In respect of Loan facility given to some borrowers exceeding the Single Obligor Limit bank is required to bring such loan within limit within prescribed period or create capital charge for the same. Board attention is invited towards failure of Bank to do either of above in spite of instruction issued.
• Bank is instructed to provide 100% provision on loan given to Necon Air Limited whose business is not in operation and accordingly make additional provision of Rs23927849/- resulting in loss to the bank hence bank is instructed to reverse whole amount provided for employee's bonus.
• Provision on the non-banking assets shown under non-operating expenses instead of showing under the head of provision for loss in the Profit and loss account. Bank is instructed to publish the annual report after necessary adjustment.
• As per NRB directive supplementary capital should not include provision on restructured and rescheduled loans. Thus by excluding above revised total capital fund comes to Rs22.32 crores and total capital fund/Risk weight assets ratio comes to 3.42per cent only.

23
Sidhartha Bank Limited
• Annexure 8, 10A and 12 of balance sheet is not in the prescribed statutory format hence bank is instructed to publish above annexure after necessary adjustments.
• In annexure 13 amount of Accrued interest on loans is shown under other heading and mistake was found in annexure 24 also hence bank is instructed make necessary rectification before publishing.
• Loan to be provided only after obtaining all necessary procedural documents and after making valuation.
• Bank is instructed to make additional loan loss provision of Rs 5, 94, 64,698/- resulting in loss to the bank hence bank is instructed to reverse whole amount provided for employee's bonus.
• Management's attention is invited towards need for improving its credit management as instances of loan exceeding limits and inadequate follow-up of the security of working capital loans were found.
Himalayan Bank Limited
• Provision on the non-banking assets shown under office operating expenses instead of showing under the head of provision for loss in the Profit and loss account. Bank is instructed to publish the annual report after necessary adjustment.
• Annexure 8, 10A and 28 of balance sheet is not in the prescribed statutory format hence bank is instructed to publish above annexure after necessary adjustments.
• As per NRB directive supplementary capital should not include provision on restructured and rescheduled loans as provision for pass loan until the payment of interest and capital is regular for two years. Thus by excluding above revised total capital fund comes to Rs179.06crores and total capital fund/Risk weight assets ratio comes to 10.62 per cent only which is less than the prescribed limit.

24
• Since capital fund of the bank is not adequate bank is instructed to submit its capital plan within 35 days and is prohibited from distributing dividends till minimum capital requirements are met
• Since Bank has given additional loan to promoter shareholder holding more than 1% shareholding against Bank and Financial Institutions Ordinance, bank is instructed to recover above loan and take necessary action against such shareholder.
• Since very old items are pending in the agency and inter-branch reconciliation attention of board is invited towards need for adjusting such items under appropriate account head.
• Bank is required to give explanation for not obtaining the personal net wealth of the personal guarantors against the NRB directives.
• Since widespread practice of inadequate documentation, flow of working capital loan without proper analysis of requirement, providing loan without limits or exceeding limits was found to be existing bank is required and improvements in such areas by making necessary adjustments in credit policy.
Nepal Bangladesh Bank Limited
• Coding and regular physical verification of fixed assets at the branch levels should be done.
• Bank is instructed to bring loan in excess of Single Obligor limit within limit by prescribed time
• Bank was instructed in previous year also to bring loan given to National Hydro Power Company within prescribed limit but loan outstanding was found to have increased this year. Bank is instructed to give explanation in this regard and on creating capital charge for the loan in excess of the limit Risk Weight Assets comes to Rs 1325.80crores and Capital fund to Risk Weight Assets ratio comes only to 4.65 per cent.
• As per NRB directive supplementary capital should not include provision on restructured and rescheduled loans as provision for pass loan until the payment of interest and capital is regular for two years. Thus by excluding above revised total capital fund comes to Rs74.38 crores and total capital fund/Risk weight assets ratio comes to 5.61 per cent only which is less than the prescribed limit.
25
• Bank is instructed to make additional provision of Rs11.60 lacs and accordingly make adjustments in the employee's bonus and other related headings.
Liquidity
A modification in the software was made with help of IT Department to receive online data from commercial banks on liquidity calculation as per amended directives on compulsory liquidity maintenance. During the year 2003-04, three commercial banks were fined Rs. 15,61,286.05 due to non-maintenance of compulsory cash balance as per directives of Nepal Rastra Bank.
Priority sector and Deprived Sector Lending
Commercial banks are required to lend specified percentage of total loan to deprived sector and priority sector as per Nepal Rastra Bank Directives. Himalayan Bank Limited, Laxmi Bank Limited, Lumbini Bank Limited, Nepal Credit and Commerce Bank Limited and Everest Bank Limited were penalised Rs. 935,365.63 due to non-Compliance to directives on priority sector and deprived sector lending during financial year 2003-04
2.4 Major Enforcement Actions:
Various reports of onsite inspection, offsite supervision and special supervision are under implementation process for sixteen commercial banks. Follow up of the previous years reports and specific directives are also in progress. Major enforcement activities are summarized as under.
Laxmi Bank Limited
Inspection report together with the direction was given regarding office of the bank being located at rented house owned by chairman of the bank, which was against the provisions of Company Act and Commercial Bank Act. Satisfactory reply in respect of directives given was received along with evidence of transfer of ownership of the property by the chairman.

26
Kumari Bank Limited
A letter dated 2060-9-18 was issued directing Board of the Director of Kumari Bank Limited to deposit amount of expenses without bill and receipt (Rs. 15031705) within 35 days, which was converted in to promoters share capital, as decided by 880th Board of Director's meeting held on 2060-9-8. Legal case is pending in this regard.
NIC Bank Limited
Onsite inspection of the bank was completed on the basis of financial statements of 2059 Chaitra end. Inspection report was forwarded to the bank on 2060-9-18 for implementation. Reply of inspection report was received on 2061-1-2. Enforcement of the directives given is in the progress.
Everest Bank Limited
Onsite inspection of the bank was completed on during year 2059-60 and inspection report was forwarded to the bank on 2060-6-5. Reply of inspection report was received on 2060-11-22.
Siddhartha Bank Limited
Onsite inspection of the bank was completed on during year 2059-60 and inspection report was forwarded to the bank on 2060-6-5. Reply of inspection report was received on 2060-9-4. Bank was given additional directives on 2060-11-27 after review of the reply from the bank.
Machhapuchhre Bank Limited
Onsite inspection of the bank was completed on the basis of financial statements of 2060 Ashad end. Inspection report was forwarded to the bank on 2060-11-13 for implementation. Reply of inspection report was received and further direction was given on 2061-3-29 due to unsatisfactory implementation of the direction given.

27
Investment Bank Limited
Onsite inspection of the bank was completed on the basis of financial statements of 2059 Poush end. Inspection report was forwarded to the bank on 2061-2-18 for implementation.
Bank of Kathmandu Limited
Onsite inspection of the bank was completed on the basis of financial statements of 2059 Chaitra end and inspection report was forwarded to the bank on 2060-10-20. Reply of inspection report was received on 2061-1-10.
Himalayan Bank Limited
Onsite inspection of the bank was completed on the basis of financial statements of 2058 Poush end and inspection report was forwarded to the bank on 2060-4-13. Reply of inspection report was received on 2060-2-23 and follow up action of the report was discontinued due to satisfactory implementation status of the report.
Nepal SBI Bank Limited
Bank was again directed vide letter dated 2060-5-16 to implement all the direction given during the On-site report of 2058. Reply was received from bank on 2060-8-26 in this regard. Review of the implementation status is under consideration during successive on site inspection.
2.5 Preparation for Basel-II implementation:
The Basel Committee on Banking Supervision has issued new capital accord (Basel–II ), which shall be applicable to internationally active banks all over the world with effect from end of 2006.The commercial banks so far has shown positive attitude towards the implementation of Basel–II .
Accord implementation Group (AIG) which was formed under "New Capital Accord Implementation Preparatory Core Committee" has invited views of commercial banks regarding implementation of new accord and is in the stage of drafting, Nepal Rastra Bank's Concept

28
Paper on New Capital Accord'. According to the program this draft paper shall be forwarded to all the commercial banks for comments and recommendations. A form is also developed so that commercial banks classify their exposures as per the new approach, which shall be reviewed by the "Accord Implementation Group"
There is no doubt that the new accord though complex carries a lot of virtues and will be a milestone in improving banks internal mechanism and supervisory process. It will be beneficial to the commercial banks, as it requires review and measurement of risk, which ultimately have effect of risk management approach to comply with the accord standards.
2.6 Capacity building:
One-day interaction program with external auditors of the commercial banks was also conducted. For the first time one day interaction program with Securities Board and Office of Company Registrar was organized with active participation of the Department.
Onsite Supervision Manual to inspect, supervise and monitor commercial banks in line with the international standards was endorsed. The manual covers areas of capital adequacy, loan portfolio management, treasury operation, management information system and internal control system and information technology. Two interaction program of one day each were conducted on the On-site Inspection Manual among the supervision staffs.
Bank Supervision Department has prepared "Offsite Supervision Manual" which was approved for adoption by Nepal Rastra Bank and was implemented with effect from 15th January 2004.
29
3 Performance Trends in the Commercial Banks
3.1 Overview:
During the year 2003/04, 17 commercial banks were operating with total registered branches of 375. Out of 375 branches, 233 branches belong to two public sector banks. Two public sector commercial banks' share in total (gross) asset, gross loan and advances and deposit was 42.01 Percent, 33.87 Percent and 37.06 Percent respectively. Negative net worth of these two public sector commercial banks distorted the capital adequacy ratio of the whole commercial banks showing Capital Fund to Risk Weighted Ratio at an average of negative 8.92 Percent for the year under review. However, the capital adequacy of commercial banks excluding the public sector was 11.62 Percent. Due to such characteristic of two public sector banks, performance of these banks was discussed separately wherever considered necessary.
Analysis and consolidation of the financial data was based on the audited and published annual reports of all commercial banks. The performance of the banking industry was less than satisfactory. The salient features of the review for the year ended Ashad 2061 are given below:
• Total asset of the all commercial banks was Rs. 267936 million as at mid July 2004 which was grown by 13.44 Percent from the last year.
• Two public sector banks accounted for 42.01 Percent of the total (gross) assets of the all commercial banks.
• Total capital fund to RWA of the public sector banks was negative35.01 Percent as at Ashad end 2061 as compared to negative37.83 Percent during the previous year. This indicates that there is some improvement in these banks during this financial year.
• Investment in Government Securities and NRB Bond exhibited growth of 9.21 Percent (P.Y.36.03 Percent growth).
• Total loan was grown by 13.55 Percent and non-performing loans (NPL) declined by 9.85 Percent Percent whereas Net NPL declined by 37.53 Percent.

30
• Ratio of gross NPL to Gross loan and Advances of the commercial banks declined marginally to 22.77 Percent from highest record of 30.41 Percent in year 2001-02. However, NPL of private commercial banks was 5.74 Percent. Two public sector banks occupied 83.33 Percent NPL in the total NPL of the commercial banks.
• Interest income represented major source of income for all the commercial banks, accounting for almost two-third (68.23 Percent) of total income.
• Aggregate Credit to Deposit ratio of the commercial banks was 61.48 Percent.
• Two public sector banks have registered net profit of Rs1750.49 million during the year against the loss of 5090.30 million in previous year. In aggregate there was improvement in net profits by 211.76 Percent from previous year. Major portion of such profits is result of extraordinary gains like excess provision written back, profit on sale of assets etc.,
Analysis was based on certain adjustments, which are briefly described hereunder.
• Loans and advances are shown at gross and loan loss provision shown in liabilities side for convenience.
• Other assets include debit balance branch adjustment account and other liabilities include credit balance of branch adjustment account.
• Figures were regrouped or reclassified wherever considered necessary. For example additional loan loss provision shown in other liabilities was adjusted in total loan loss provision.
3.2 Balance Sheet Structure:
Total Assets growth rate of the commercial bank was 13.44 Percent (previous year 7.95 Percent). As in the earlier years commercial banks continued to hold most of their funds in loans and advances (47.42 Percent) followed by investments (21.86 Percent) and other assets (17.87 Percent). Cash balance, bank balance and money at call represented 1.66 Percent, 8.11 Percent and 2.15 Percent respectively.

31
Banks invested only one Percent in fixed assets. Total assets composition was very much similar during previous year except two Percent above in bank balance and two Percent below in investments compared to year under review. Similarly, composition of major components of the liabilities remained largely the same. Pertinent and alarming negative growth of 293 Percent, -67.02 Percent and -16.89 Percent was noticed in reserve and surplus during the year 2001-02 and 2002-03 respectively resulting from serious losses incurred by the two public sector banks. However, some improvement was seen in the Reserve and Surplus during the year. There was positive growth of 8.70 Percent as compared to previous year. Commercial banks sourced 77.14 Percent of their funds from the deposit and 18.20 Percent from other liabilities. The balance sheet structure of public sector as well as private sector commercial banks is shown in the table 1 below.
Rs. Million Public Sector Private Sector Commercial Banks
2001-02
2002-03
2003-04
2001-02
2002-03
2003-04
2001-02
2002-03
2003-04
Share of
public sector (in %)
Liabilities Share Capital 1553 1553 1553 4997 6225 6798 6550 7777 8351 18.59
General Reserve -28558 -33775 -32005 2275 3053 3956 -26283 -30722 -28049 114.11
Borrowing 369 214 80 2816 2980 3302 3185 3194 3382 2.36
Deposit 73258 74416 76602 92241 106876 130077 165499 181292 206678 37.06 Bills Payable 140 158 56 304 430 641 444 588 697 8.02
Other Liabilities 37767 40002 42933 4190 5021 5829 41956 45023 48762 88.05
Provision for Loan Loss 23962 25091 23330 3487 3950 4784 27449 29041 28115 82.98
Total 108491 107659 112549 110310 128536 155388 218801 236194 267937 42.01
Assets Cash Balance 2515 2436 2017 2473 2386 2438 4988 4822 4455 45.28 Bank Balance 8638 5895 10863 7835 9276 10868 16474 15171 21730 49.99 Money at Call 1544 822 852 3070 3164 4915 4613 3985 5767 14.77
Investment 11311 17074 14122 34156 38000 44459 45467 55074 58580 24.11
Loan and Advances 46290 44741 43043 56835 67163 84022 103125 111904 127065 33.87
Fixed Assets 542 617 587 1374 1574 1865 1916 2190 2452 23.93
Other Assets 37650 36074 41064 4566 6973 6821 42217 43047 47886 85.76
Total 108491 107659 112549 110310 128536 155388 218801 236194 267937 42.01

32
Charts 1 to 6 show the composition of assets and liabilities to outside parties of public sector banks, private sector banks and all commercial banks.
Chart - 1Composition of Assets in 2003-04
Money at Call0.76%
Bank Balance9.65%Cash Balance
1.79%
Investment12.55%
Loan and Advances38.24%
Fixed Assets0.52%
Other Assets36.49%
Chart - 2Composition of outside liabilities in 2003-04
Bills Payable0%
Other Liabilities30%
Provision for Loan Loss16%
Borrow ing0%
Deposit54%

33
Chart - 3Composition of Assets in 2003-04
Other Assets4.39%
Fixed Assets1.20%
Loan and Advances54.07%
Investment28.61%
Bank Balance6.99%
Money at Call3.16%
Cash Balance1.57%
Chart - 4Composition of Outside liabilities in 2003-04
Deposit89.94%
Bills Payable0.44%
Other Liabilities4.03%
Provision for Loan Loss3.31%
Borrow ing2.28%

34
Chart - 5Composition of aggregate assets in 2003-04
Loan and Advances47.42%
Money at Call2.15%
Bank Balance8.11%
Cash Balance1.66%Other Assets
17.87%
Fixed Assets0.92%
Investment21.86%
Chart - 6Composition of Outside Liabilities 2003-04
Deposit71.85%Bills Payable
0.24%
Other Liabilities16.95%
Provision for Loan Loss9.77%
Borrow ing1.18%

35
3.3 Capital Adequacy:
Aggregate Capital fund as well as that of public sector banks remained negative even though there was some improvement in capital adequacy. Though, average capital adequacy ratio of 11.62 Percent private sector banks is marginally above the minimum statutory requirement, more number of banks failed to meet minimum requirement during the year.
Negative total capital fund of Rs. 29816 million relating to two public sector banks converted the total capital base of the commercial bank into negative 8.92 Percent. Table given below clearly shows the fact.
Table 2: Capital Fund to Risk Weighted Assets ratio
(In percentage)
Year 2001-02 2002-03 2003-04Public Sector -24.55% -37.83% -35.01%Private Sector 13.82% 11.95% 11.62%Commercial banks -7.25% -11.74% -8.92%
Total capital fund was increased by 15.90 Percent compared to previous year's capital fund base of negative Rs.20510 million due to improvement in performance of the public sector banks during the year. Rate of decrease in capital fund during year 2002-03 was 80.22 Percent. Decline in the capital adequacy ratio of the private sector banks was due to higher growth in exposures in high-risk category, which resulted in growth of risk weighted assets by 18.21 Percent, without commensurate growth in the total capital fund.
In addition to capital adequacy requirement NRB has directed all commercial banks to increase paid up capital up to minimum of 1 billion by mid July 2009 as a part of strengthening the capital base.
Following Chart discloses the non-compliance status of the seven commercial banks in respect of capital adequacy requirement.

36
Chart -7 Capital fund to Risk Weight Assets
RBB
(-42
.12%
)
NIB
L(11
.18%
)
SCBL
(15.
99%
)
HBL
(10.
62%
)
SBI(1
0.25
%)
NBB
L(5.
61%
)
EBL(
11.0
7%)
BOK(
11.1
8%)
NC
CBL
(3.4
2%)
NIC
BL(1
3.75
%)
LBL(
8.71
%)
PBL(
17.8
2%)
NAB
IL(1
3.56
%)
KBL(
12.8
1%)
SBL(
19.3
6%)
LXBL
(29.
13%
)
NBL
(-24
.97%
)
-50.00%
-40.00%
-30.00%
-20.00%
-10.00%
0.00%
10.00%
20.00%
30.00%
40.00%
3.4 Assets Quality:
Assets composition
Assets composition of the commercial banks remained largely same in last three financial years. Marginal movement was observed in switch over of investment in to bank balance during the year. However, bank balance, money at call and investment together remained nearly one third of total assets during last three year. As it can be seen from the table given below major part of total assets was held in form of loans and advances and investment which falls under high-risk category of assets.
Assets Composition 2001-02 2002-03 2003-04Cash Balance 2.28% 2.04% 1.66%Bank Balance 7.53% 6.42% 8.11%Money at Call 2.11% 1.69% 2.15%Investment 20.78% 23.32% 21.86%Loan and Advances 47.13% 47.38% 47.42%Fixed Assets 0.88% 0.93% 0.92%Other Assets 19.29% 18.23% 17.87%Total 100.00% 100.00% 100.00%

37
Cash and bank balance
It was observed in case of two public sector banks and two private commercial banks that bank balances remained unreconciled and where the balances were reconciled, ledger balance differed largely with bank balance certificate and large unidentified items remained in the reconciliation statements. Bank balance of two public sector banks alone represented 38.85 Percent of total balance. Thus quality of bank balance may be considered affected than normally assumed in such circumstances.
Investment
Investment in HMG/N and NRB Bond is 73.33 Percent, in shares and debentures 0.86 Percent and others represent 25.81 Percent of total Investment of commercial banks. Major part of other investment is represented by investment in foreign banks. Investment and placement in foreign banks by the private sector banks represented 85 Percent of investment other than HMG/N and NRB bond. Question of quality of foreign placement is dependent on the quality of the foreign bank in which investment was made. Nothing as such matter of raising concern about quality of foreign investment has come to our notice during the year under review except for our concern about huge placement by Himalayan bank in Habib Bank of Pakistan.
Loans and advances
Total loans and advances of all commercial banks stood at Rs.127065 million with the increase of 13.55 Percent from the previous year. It is conservative methodology to measure quality of assets by measuring level of non-performing loans and advances only. Real quality of credit is measured by comparing total credit net of provision to non-performing credit net of provision made there of. Reason behind this logic is that provision is already made charging from profit, which would have become capital had the charge not made, and risk of credit exposure to the extent of provision made is hedged.

38
Following chart depicts figures and ratio of Total loan and NPL.
Chart -8Non Performing Loan To Total Loan
127,065
111,904103,125100,134
28,93332,09629,347 31,363
22.77%
29.31% 30.41%28.68%
0
20000
40000
60000
80000
100000
120000
140000
2000-01 2001-02 2002-03 2003-04
Rs.
Mill
ion
0.0%
5.0%
10.0%
15.0%
20.0%
25.0%
30.0%
35.0%
Perc
ent
Total Loan Non-performing Loan NPL to Total Loan
This high degradation in the quality of credit in the commercial banks is contributed by public sector. Chart given below shows the sector wise share of NPL.
23,64681%
5,70019%
25,72382%
5,640 18%
26,97084%
5,12616%
2411183%
482317%
2000-01 2001-02 2002-03 2003-04
Chart - 9Sectorwise Non-performing credit (Rs Million)
Public sector Private sector
Despite the marginal improvement in the NPL percentage compared to the year 2001-02, high increase in composition of loss loan indicates deteriorating conditions of credit quality in the commercial

39
banks. Commercial banks managed to reduce component of the substandard loan and doubtful loan but this reduction was not mainly by the way recovery rather restructuring and rescheduling credit several time was used by all commercial banks with high NPL bands.
Year 2000-01 2001-02 2002-03 2003-04Pass Loan to total loan 70.69% 69.59% 71.32% 77.23%NPL to total loan 29.31% 30.41% 28.68% 22.77%Substandard loan to total loan 11.03% 6.46% 3.72% 1.45%Doubtful loan to total loan 13.78% 10.86% 7.99% 3.21%Loss loan to total loan 4.49% 13.09% 16.97% 18.12%
Charts 10 and 11 given below are self-explanatory about quality of credit and provisioning practices of commercial banks. Chart 11 clearly shows that provisioning practice of two private commercial banks were worse than two public sector banks.
Chart - 10Non-performing Loan to Total Loan
NC
CBL
(12.
72%
)N
BBL(
10.8
1%)
HBL
(8.8
8%)
LBL(
7.36
%)
BOK(
6.66
%)
SBI(6
.25%
)
NIC
BL(3
.92%
)SC
BL(3
.77%
)
NAB
IL(3
.35%
)N
IBL(
2.47
%)
EBL(
1.72
%)
SBL(
1.61
%)
MPB
L(0.
98%
)KB
L(0.
76%
)NBL
(53.
74%
)
RBB
(57.
64%
)
0.00%
10.00%
20.00%
30.00%
40.00%
50.00%
60.00%

40
Chart - 11Net Non-performing Loan to Total Loan
NBL
(4.4
2%)
HBL
(2.7
4%)
NBB
L(1.
97%
)
BOK(
1.93
%)
SBL(
1.16
%)
LBL(
1.10
%)
SBI(0
.87%
)
NAB
IL(0
.65%
)
NIB
L(0.
60%
)
SCBL
(0.4
9%)
EBL(
0.47
%)
KBL(
0.43
%)
MPB
L(0.
10%
)
NIC
BL(0
.02%
)
LXBL
(0.0
0%)
NC
CBL
(5.3
1%)RBB
(8.4
2%)
0.00%
1.00%
2.00%
3.00%
4.00%
5.00%
6.00%
7.00%
8.00%
9.00%
0 2 4 6 8 10 12 14 16 18
Total loan loss provision was 22.13 Percent of total loan with the decline of 3.19 Percent from the previous year due to write back of excess provision by two public sector banks. See figures given below.
Year 2000-01 2001-02 2002-03 2003-04Loan Loss Provision to total loan 18.55% 26.62% 25.95% 22.13%Growth in Loan loss provision 95.36% 47.79% 5.80% -3.19%Loan Loss Provision Rs million 18572 27449 29041 28115
Other Assets
Accrued interest receivable on loan and advances covered 70.24 Percent of other assets and 97.7 Percent of this accrued interest receivable is represented by interest suspense balance in liabilities side. International Accounting Standard requires Assets to be disclosed net of provision. Branch adjustment account outstanding in liabilities side represent 6.67 Percent of other assets which is also considered contra balance included in other assets. Other items such as drafts without notice, expenses not written off and other assets, that are either not realizable or in the nature of contra items, constitute

41
about 12 Percent. Thus, almost 83 Percent of other assets are in such nature either these needs to be setoff with corresponding contra items or provision amount or of not realizable nature. This raises major supervisory concern over bogus other assets (20 Percent of total assets) depicted in published financial statements of the commercial banks.
3.5 Earning/Profitability:
Aggregate performance of commercial banks has improved with net profit of Rs 3,707million during the year after continuous losses during last three years. This improvement in performance was mainly due to the improvement in earning of two public sector banks which is mainly attributed to the extraordinary incomes like excess provision write back and profit on sale of assets etc.
But in Previous three financial years aggregate performance was very dismal with losses of Rs 7845 million, Rs 9429 million and Rs 3317 million respectively mainly due to increased provision for loan losses resulting from the deterioration in quality of the credit portfolio of two public sector banks. This is more clearly depicted by the table given below.
Public Sector Private Sector Profitability 2001-02 2002-03 2003-04 2001-02 2002-03 2003-04
Interest Income 3271729 4244369 4060922 6816476 7615219 8808736Interest Expenses 4060286 3689031 2520378 3610342 3569706 3941787Net Interest Income -788557 555338 1540544 3206134 4045513 4866949Non Interest Income 717347 537139 629274 1467400 1586188 1812559Non Interest Expenses 2387753 5261568 3283940 1730108 2238345 2445878Net Non Interest Income -1670406 -4724429 -2654666 -262708 -652157 -633319Non operating Income 276374 685793 3055982 472114 412327 495805Non Operating Expenses 7956960 1607028 191368 2704875 2032604 2772448Net Non Operating Income -7680586 -921235 2864614 -2232761 -1620277 -2276643Net Profit -10139549 -5090326 1750492 710665 1773079 1956987
42
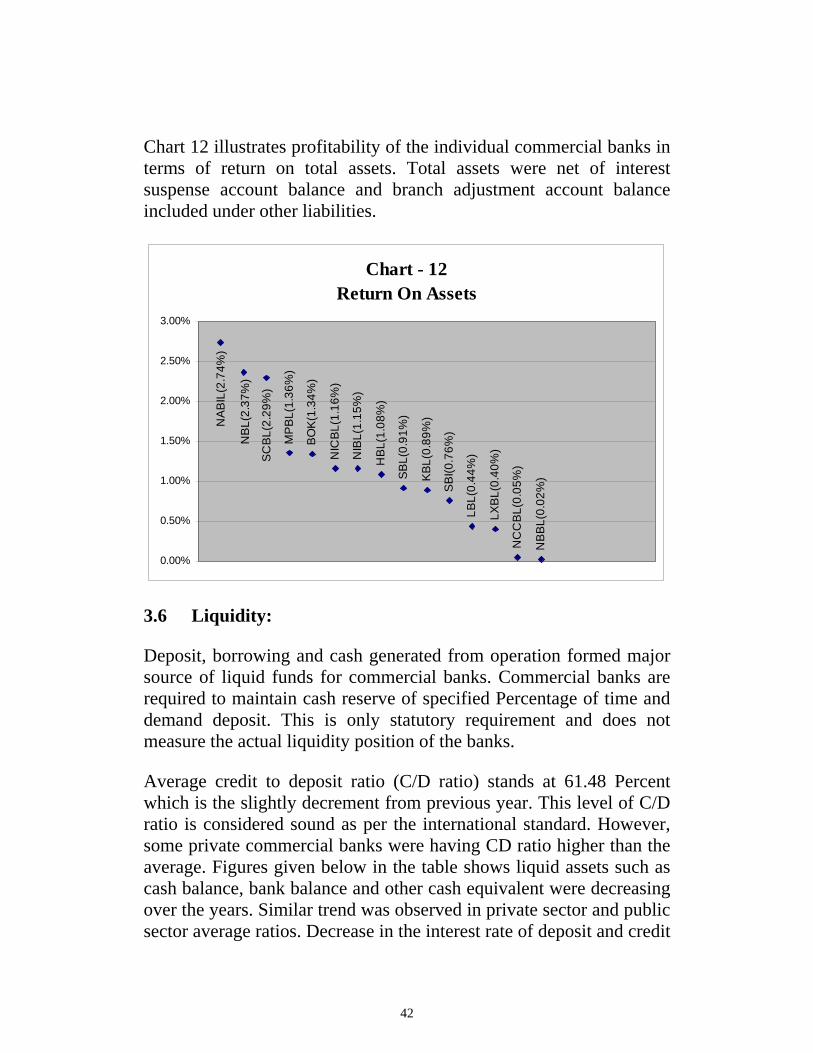
Chart 12 illustrates profitability of the individual commercial banks in terms of return on total assets. Total assets were net of interest suspense account balance and branch adjustment account balance included under other liabilities.
Chart - 12Return On Assets
MP
BL(
1.36
%)
BO
K(1
.34%
)
NIC
BL(
1.16
%)
NIB
L(1.
15%
)
HB
L(1.
08%
)
SBL(
0.91
%)
KBL
(0.8
9%)
SBI
(0.7
6%)
LBL(
0.44
%)
LXB
L(0.
40%
)
NC
CB
L(0.
05%
)
NB
BL(
0.02
%)
SC
BL(
2.29
%)
NB
L(2.
37%
)
NAB
IL(2
.74%
)
0.00%
0.50%
1.00%
1.50%
2.00%
2.50%
3.00%
3.6 Liquidity:
Deposit, borrowing and cash generated from operation formed major source of liquid funds for commercial banks. Commercial banks are required to maintain cash reserve of specified Percentage of time and demand deposit. This is only statutory requirement and does not measure the actual liquidity position of the banks.
Average credit to deposit ratio (C/D ratio) stands at 61.48 Percent which is the slightly decrement from previous year. This level of C/D ratio is considered sound as per the international standard. However, some private commercial banks were having CD ratio higher than the average. Figures given below in the table shows liquid assets such as cash balance, bank balance and other cash equivalent were decreasing over the years. Similar trend was observed in private sector and public sector average ratios. Decrease in the interest rate of deposit and credit

43
indicate increased liquidity in the market though the ratios are marginally decreasing. See table for detail.
Liquidity Ratios of Commercial Banks 2003-04 2002-03 2001-02 2000-01Total Loan to Total Deposit 61.48% 61.73% 62.31% 60.50%Cash and Equivalents to Total Assets 31.28% 32.77% 30.48% 28.13%Cash and Equivalents to Total Deposit 36.29% 28.68% 26.36% 23.74%NRB Balance to Total Deposit 8.93% 6.51% 7.01% 6.19%
However, solvencies of two public sector banks are under question due to huge negative net worth. Total assets net of provision for loan, interest suspense and branch adjustment account balance was short by Rs5769 million, and Rs15264 million to deposit liability for Nepal Bank Limited and Rastriya Banijya Bank respectively.
Rs. Million
Bank NBL RBB Adjusted Total Assets 29966 25602 Networth -9085 -21438 Total deposit 35735 40867 Excess depositors claim 5769 15264
It was also observed in three commercial banks top 50 depositors constituted major part of depositor. In such case, withdrawal of deposit by few depositors may cause liquidity problem. Seemingly and from our onsite inspection, no liquidity management plan and policy was found to be in place.
Following charts throws lights on deposit structure, growth and credit to deposit ratio.

44
Chart - 13Total Deposits and Growth
165518 165499181292
20667817.91%
-0.01%
14.00%
9.54%
0
50000
100000
150000
200000
250000
2000-01 2001-02 2002-03 2003-04
Year
Rs
mill
ion
-2.00%
0.00%
2.00%
4.00%
6.00%
8.00%
10.00%
12.00%
14.00%
16.00%
18.00%
20.00%
Gro
wth
Rat
es
70,472
68,397
26,649
72,971
66,930
25,598
84,488
67,001
29,803
0
20000
4000060000
80000
100000
120000
140000
160000
180000
200000
Rs. M
illion
2000-01 2001-02 2002-03
Chart -14Deposit structure
Saving Deposit Fixed Deposit Current Deposit
Chart - 15Credits to Deposit Ratio
60.50%
62.31%
61.73%
61.48%
60%
60%
61%
61%
62%
62%
63%
2000-01 2001-02 2002-03 2003-04Year
Perc
ent

45
4 Current Issues in Banking Supervision
4.1 Poor Corporate Governance and Insider Abuse:
It has been observed in many commercial banks that code of ethics were not signed by the directors and lending to the shareholders and directors of the bank continued despite several directives given by Nepal Rastra Bank not to do so. Strong need was felt and accordingly directives on corporate governance were issued on mid July 2001. However attitude of such banks were nonetheless unaltered and they continued transaction of insider abuse and use of fund for personal benefit.
Management failure is the ultimate result of the poor corporate governance. Now time has come to take Strong action against the banks with poor corporate culture to prevent failure of such banks.
4.2 Emergence of Electronic banking in Nepal- The need for a regulatory framework:
Electronic banking may be defined as a means by which banking business is transacted through automated processes and electronic devices such as personal computers, telephones, fax machines, Internet, card payment and other electronic channels. The increased competition, increase in volume of transactions and banking products, increased number of customers and wide number of branches resulted in computerization for quick services, speedy access even at remote locations.
In view of introduction of electronic banking in commercial banks of Nepal and maximum use of IT in the banking sector it is imperative to establish regulatory framework to ensure safety of depositor's money. The risk associated with e-banking includes all the inherent banking risks.

46
4.3 L/C scams and forgeries in commercial banks:
Several incidences of Foreign Exchange violation through forged letter of credit transactions were traced in recent few years. Nepal Rastra Bank referred such cases to Commission for Investigation of Abuse of Authority and remained undecided for many years.
NRB has no legal authority to punish the individuals and entity not licensed by it. Even if NRB is aware of involvement of any organization or individual in money laundering activities, it can only refer it to other concerned agencies and it has no legal jurisdiction over it. There should be coordinated supervisory relationships between various regulating authorities so that economic crimes are punished and prevented.
4.4 Need for Income audit of commercial banks:
It has been practice of Nepal Rastra Bank to supervise commercial banks on the basis of financial statements of the period falling between the financial years. However, commercial banks are able to avoid additional provisional requirement at the year-end and any directives given by NRB to make additional provision practically fall after the close of a particular financial year. Thus, to plug the under provisioning practices and to direct banks to provide for possible loan loss in the books of account of the period to which it relates, income statement audit (inspections) needs to be carried out. It is expected that necessary steps shall be taken in the time to come.
4.5 Compliance with International Financial Reporting Framework (IFRS):
Financial Sector Reform Program (FSRP) required Nepal Rastra Bank to comply with the IFRS and issue prudential regulations in line with international standard. As a part of FSRP two public sector commercial banks were also required to comply with the IFRS. There is need to ensure compliance of IFRS uniformly in all the commercial banks. It is to be ensured that IFRS is complied with while making recognition of items of financial statements, and disclosure requirements except for the areas already covered by local accounting standards requirements, which are similar to that of IAS. Thus there is need to issue regulation in this regard to ensure compliance with the
47
IFRS requirements. Statutory formats of the financial statements prescribed for the commercial banks also needs to be revised incorporating disclosure requirements specified in IAS 30 and other applicable IAS.
4.6 Other issues and Challenges:
Increased number of commercial banks alone with development banks and other financial institutions added to the competition in banking business. As a result of this banks are extending credits and services in all possible urban areas without strong base for human resource policy, IT infrastructure and internal control system in place. As a result, decrease in the quality of portfolio, incompatibility of the reporting system and chance of fraud and forgery increases.
However it should not be and cannot be ignored that there exists few commercial banks with good corporate governance and practices as well as complying with almost regulatory requirements. But other commercial banks do not take this as an example, rather they also point to other commercial banks reluctant comply with regulations. We, supervisors are to be aware and active in regulatory activities as well, so that implementation is practical and effective.

48
Annexure – 1 Financial statements of Commercial Banks
Financial statements of Nepal Bank Limited for FY 2000-2001 to 2003-04
Rs. In '000
FY 2000-01 FY 2001-02 FY 2002-03 FY 2003-04 Capital and Liabilities Capital 380,383 380,383 380,383 380,383 Reserves and Surplus (6,734,898) (9,934,258) (10,211,515) (9,394,908) Deposit 35,618,590 34,264,847 35,014,000 35,735,045 Borrowing 211,171 213,264 52,010 - Bills Payable 87,431 120,145 141,311 31,427 Other Liabilities 12,029,066 14,515,463 14,440,302 17,409,934
Total Liabilites 41,591,743 39,559,844 39,816,491 44,161,881 Assets Cash Balance 1,782,946 1,665,104 1,416,545 1,010,231 Bank Balance 4,483,850 4,962,013 3,178,624 4,850,838 Money At call 1,649,468 1,543,599 81,540 751,995 Investment 6,776,326 7,151,381 12,447,699 11,004,820 Loan and Advances 11,918,937 8,638,438 7,971,097 8,881,824 Fixed Assets 146,938 139,641 137,795 195,047 Other Assets 14,833,278 15,459,668 14,583,191 17,467,126
Total Assets 41,591,743 39,559,844 39,816,491 44,161,881 Expenses Interest Expenses 1,834,965 1,713,203 1,585,600 1,025,533 Staff Expenses 871,448 1,227,851 1,541,829 1,848,846 Office Expenses 158,624 158,492 225,923 299,060 Exchange loss - - - - Non operating expenses - - - - Bad debts written off - - - - Loan loss Provision 2,192,591 2,114,436 16,290 - Provision for Staff Bonus - - - 78,932 Provision for NBA - - - 18,522 Provision for Income Tax - - - -
Total 5,057,628 5,213,982 3,369,642 3,270,893 Income Interest Income 2,383,195 1,526,989 2,200,314 1,825,041 Commission and Discount 234,183 241,007 280,137 231,916 Exchange Income 133,982 183,620 42,661 71,815 Non operating Income 120,591 124,759 131,818 645,528 Other Income 7,768 66,311 462,981 1,206,984
Total 2,879,719 2,142,686 3,117,911 3,981,284 Net Profit/(Loss) (2,177,909) (3,071,296) (251,731) 710,391

49
Financial statements of Rastriya Banijya Bank for FY 2000-2001 to 2003-04
Rs. In '000
FY 2000-01 FY 2001-02 FY 2002-03 FY 2003-04 Capital and Liabilities Capital 1,172,300 1,172,300 1,172,300 1,172,300 Reserves and Surplus (11,550,356) (18,623,655) (23,563,206) (22,610,203) Deposit 40,773,660 38,993,290 39,402,273 40,866,767 Borrowing 146,926 156,167 161,950 79,966 Bills Payable 24,453 19,784 16,421 24,486 Other Liabilities 22,664,019 23,251,338 25,561,913 25,523,004
Total Liabilites 53,231,002 44,969,224 42,751,651 45,056,320 Assets Cash Balance 921,094 850,186 1,019,318 1,007,240 Bank Balance 4,167,783 3,676,460 2,716,731 6,011,850 Money At call - - 740,000 100,000 Investment 5,656,931 4,159,474 4,626,218 3,117,026 Loan and Advances 19,798,277 13,689,748 11,679,489 10,831,084 Fixed Assets 397,096 402,563 479,022 391,803 Other Assets 22,289,821 22,190,793 21,490,873 23,597,317
Total Assets 53,231,002 44,969,224 42,751,651 45,056,320 Expenses Interest Expenses 2,571,375 2,347,083 2,103,431 1,494,845 Staff Expenses 1,385,300 758,690 3,248,985 905,805 Office Expenses 324,802 242,720 244,831 230,229 Exchange loss 17,076 - - - Non operating expenses 15 19 91 - Bad debts written off - - - - Loan loss Provision 5,915,719 5,842,505 1,590,647 10,706 Provision for Staff Bonus - - - 83,208 Provision for NBA - - - - Provision for Income Tax - - - -
Total 10,214,287 9,191,017 7,187,985 2,724,793 Income Interest Income 2,833,517 1,744,740 2,044,055 2,235,881 Commission and Discount 157,590 214,520 211,484 309,803 Exchange Income 89,107 78,200 2,857 15,740 Non operating Income 14,268 7,114 6,760 147,086 Other Income 36,555 78,190 84,234 1,056,384
Total 3,131,037 2,122,764 2,349,390 3,764,894 Net Profit/(Loss) (7,083,250) (7,068,253) (4,838,595) 1,040,101

50
Financial statements of Nabil Bank Limited for FY 2000-2001 to 2003-04
Rs. In '000
FY 2000-01 FY 2001-02 FY 2002-03 FY 2003-04 Capital and Liabilities Capital 491,654 491,654 491,654 491,654 Reserves and Surplus 571,192 654,773 822,532 990,028 Deposit 15,839,008 15,506,428 13,447,661 14,119,033 Borrowing - 417,298 961,461 229,660 Bills Payable 69,697 67,753 108,944 173,499 Other Liabilities 799,100 491,346 730,373 741,612
Total Liabilites 17,770,651 17,629,252 16,562,625 16,745,486 Assets Cash Balance 208,483 318,159 187,777 286,886 Bank Balance 604,423 733,661 956,991 683,600 Money At call 522,550 31,368 670,204 918,733 Investment 7,704,309 8,199,515 6,031,176 5,835,948 Loan and Advances 7,732,637 7,437,895 7,755,950 8,189,993 Fixed Assets 248,666 237,639 251,915 338,126 Other Assets 749,583 671,015 708,612 492,200
Total Assets 17,770,651 17,629,252 16,562,625 16,745,486 Expenses Interest Expenses 578,364 462,079 317,348 282,948 Staff Expenses 147,356 147,439 210,583 180,840 Office Expenses 122,795 134,317 166,200 150,759 Exchange loss - - - - Non operating expenses - 50 - - Bad debts written off - 441,525 51,574 81,821 Loan loss Provision 165,767 - - 1,052 Provision for Staff Bonus 52,597 44,116 66,364 71,941 Provision for NBA - - - - Provision for Income Tax 181,995 137,950 199,145 201,763
Total 1,248,874 1,367,476 1,011,214 971,124 Income Interest Income 1,266,704 1,120,184 1,017,872 1,001,617 Commission and Discount 97,144 114,337 144,406 135,958 Exchange Income 159,514 154,219 144,075 157,324 Non operating Income 1,909 - 86,946 92,781 Other Income 14,979 250,374 34,151 38,755
Total 1,540,250 1,639,114 1,427,450 1,426,435 Net Profit/(Loss) 291,376 271,638 416,236 455,311

51
Financial statements of Nepal Investment Bank Limited for FY 2000-2001 to 2003-04
Rs. In '000
FY 2000-01 FY 2001-02 FY 2002-03 FY 2003-04 Capital and Liabilities Capital 169,985 169,984 295,293 295,293 Reserves and Surplus 299,108 353,485 343,250 433,755 Deposit 4,256,210 4,174,763 7,922,767 11,524,679 Borrowing 120,000 98,500 6,829 361,500 Bills Payable 5,182 6,823 31,634 57,836 Other Liabilities 166,684 170,335 414,477 582,433
Total Liabilites 5,017,169 4,973,890 9,014,250 13,255,496 Assets Cash Balance 71,497 61,523 200,971 315,383 Bank Balance 375,196 277,401 725,566 911,540 Money At call - - 40,000 310,000 Investment 1,970,278 1,822,162 1,705,241 3,862,483 Loan and Advances 2,318,830 2,564,424 5,772,141 7,130,125 Fixed Assets 33,974 35,883 191,116 249,788 Other Assets 247,394 212,497 379,215 476,177
Total Assets 5,017,169 4,973,890 9,014,250 13,255,496 Expenses Interest Expenses 163,426 130,436 189,214 326,202 Staff Expenses 33,988 41,720 61,288 89,749 Office Expenses 80,177 84,648 108,039 149,479 Exchange loss - - - - Non operating expenses 25 - - - Bad debts written off - - - - Loan loss Provision 45,282 75,188 30,335 78,767 Provision for Staff Bonus 10,428 8,679 18,906 25,719 Provision for NBA - - - 12,325 Provision for Income Tax 37,440 21,010 53,332 78,802
Total 370,766 361,681 461,114 761,043 Income Interest Income 349,755 326,224 459,510 731,403 Commission and Discount 16,204 16,198 40,812 55,747 Exchange Income 49,835 42,856 50,834 87,980 Non operating Income - 3,104 488 1,768 Other Income 11,380 30,404 26,288 36,816
Total 427,174 418,786 577,932 913,714 Net Profit/(Loss) 56,408 57,105 116,818 152,671

52
Financial statements of Standard Chartered Bank Nepal Limited for FY 2000-2001 to 2003-04
Rs. In '000
FY 2000-01 FY 2001-02 FY 2002-03 FY 2003-04 Capital and Liabilities Capital 339,549 339,549 339,549 374,640 Reserves and Surplus 772,474 895,930 1,029,359 1,121,099 Deposit 15,430,051 15,835,748 18,755,634 21,161,442 Borrowing 1,666,713 684,724 79,164 78,283 Bills Payable 35,208 51,400 54,842 59,024 Other Liabilities 838,946 635,754 741,955 847,571
Total Liabilites 19,082,941 18,443,105 21,000,503 23,642,059 Assets Cash Balance 187,660 257,845 198,755 187,705 Bank Balance 773,392 567,420 1,313,550 1,835,459 Money At call 2,612,005 2,061,964 1,657,910 2,218,599 Investment 9,559,176 9,275,885 10,357,679 11,360,328 Loan and Advances 5,407,093 5,364,006 5,695,824 6,410,242 Fixed Assets 121,807 101,066 191,711 136,234 Other Assets 421,808 814,919 1,585,074 1,493,492
Total Assets 19,082,941 18,443,105 21,000,503 23,642,059 Expenses Interest Expenses 474,401 299,860 255,154 275,809 Staff Expenses 102,121 126,510 128,328 134,685 Office Expenses 224,847 190,942 311,013 279,693 Exchange loss - - - - Non operating expenses - 18,362 15,530 10,756 Bad debts written off 872 509 - - Loan loss Provision 100,451 75,049 2,340 23,516 Provision for Staff Bonus 85,478 72,145 76,084 85,955 Provision for NBA - - - - Provision for Income Tax 243,428 184,231 208,222 235,793
Total 1,231,598 967,608 996,671 1,046,207 Income Interest Income 1,227,219 1,013,636 1,001,360 1,042,175 Commission and Discount 187,279 163,463 215,201 198,947 Exchange Income 214,861 228,100 232,522 273,050 Non operating Income 344 - - - Other Income 32,726 41,616 54,520 69,835
Total 1,662,429 1,446,815 1,503,603 1,584,007 Net Profit/(Loss) 430,831 479,207 506,932 537,800

53
Financial statements of Himalayan Bank Limited for FY 2000-2001 to 2003-04
Rs. In '000
FY 2000-01 FY 2001-02 FY 2002-03 FY 2003-04 Capital and Liabilities Capital 300,000 390,000 480,429 536,250 Reserves and Surplus 420,591 468,115 582,704 782,271 Deposit 17,636,848 18,619,375 21,007,379 22,010,333 Borrowing 79,527 534,012 645,840 659,006 Bills Payable 25,919 55,576 46,727 64,382 Other Liabilities 407,919 605,356 592,144 709,783
Total Liabilites 18,870,804 20,672,434 23,355,223 24,762,025 Assets Cash Balance 149,959 462,777 397,189 274,235 Bank Balance 1,285,216 801,896 1,582,019 1,726,949 Money At call 4,057,655 352,350 150,100 368,900 Investment 4,083,160 9,157,106 10,175,435 9,292,103 Loan and Advances 8,537,666 8,913,724 10,001,850 11,951,869 Fixed Assets 201,679 318,844 229,871 299,643 Other Assets 555,469 665,737 818,759 848,326
Total Assets 18,870,804 20,672,434 23,355,223 24,762,025 Expenses Interest Expenses 734,518 578,133 554,128 491,543 Staff Expenses 85,575 101,538 120,146 152,509 Office Expenses 141,116 155,786 177,132 211,047 Exchange loss - - - - Non operating expenses - - - - Bad debts written off - - - - Loan loss Provision 134,320 166,506 202,873 186,226 Provision for Staff Bonus 48,336 38,783 40,003 46,730 Provision for NBA - - - 10,988 Provision for Income Tax 154,323 114,023 147,896 157,522
Total 1,298,188 1,154,769 1,242,178 1,256,565 Income Interest Income 1,326,378 1,148,998 1,201,234 1,245,895 Commission and Discount 96,065 101,704 102,561 123,929 Exchange Income 119,261 104,601 109,599 112,420 Non operating Income 2,303 2,451 10,760 3,299 Other Income 31,220 32,038 30,154 34,076
Total 1,575,227 1,389,792 1,454,308 1,519,619 Net Profit/(Loss) 277,039 235,023 212,130 263,054

54
Financial statements of Nepal Bangladesh Bank Limited for FY 2000-2001 to 2003-04
Rs. In '000
FY 2000-01 FY 2001-02 FY 2002-03 FY 2003-04 Capital and Liabilities Capital 238,163 357,252 359,925 359,925 Reserves and Surplus 356,959 269,251 324,008 296,653 Deposit 8,600,813 9,534,219 10,580,648 12,807,376 Borrowing - 287,500 68,319 67,225 Bills Payable 41,554 42,729 63,929 150,924 Other Liabilities 420,723 611,282 535,783 575,870
Total Liabilites 9,658,212 11,102,233 11,932,612 14,257,973 Assets Cash Balance 242,812 364,618 309,790 352,153 Bank Balance 756,159 1,394,687 589,723 1,084,320 Money At call 397,633 100,000 100,000 - Investment 691,085 1,008,642 2,168,923 2,699,166 Loan and Advances 7,074,912 7,632,418 7,247,978 8,648,744 Fixed Assets 91,699 91,509 80,734 191,178 Other Assets 403,912 510,359 1,435,464 1,282,412
Total Assets 9,658,212 11,102,233 11,932,612 14,257,973 Expenses Interest Expenses 515,848 552,743 597,881 625,362 Staff Expenses 50,746 61,362 69,897 76,624 Office Expenses 67,446 77,198 101,404 113,762 Exchange loss - - - - Non operating expenses - 4,149 - - Bad debts written off - 23 - - Loan loss Provision 130,483 269,346 261,875 282,484 Provision for Staff Bonus 31,548 11,198 21,277 11,071 Provision for NBA - - - 118,249 Provision for Income Tax 85,180 35,000 120,000 97,000
Total 881,251 1,011,019 1,172,334 1,324,552 Income Interest Income 810,051 850,525 1,013,712 1,095,501 Commission and Discount 123,911 108,840 109,046 105,058 Exchange Income 102,097 69,706 56,300 56,160 Non operating Income 5,856 - - 7,324 Other Income 38,089 47,732 64,771 63,152
Total 1,080,004 1,076,803 1,243,829 1,327,195 Net Profit/(Loss) 198,753 65,784 71,495 2,643
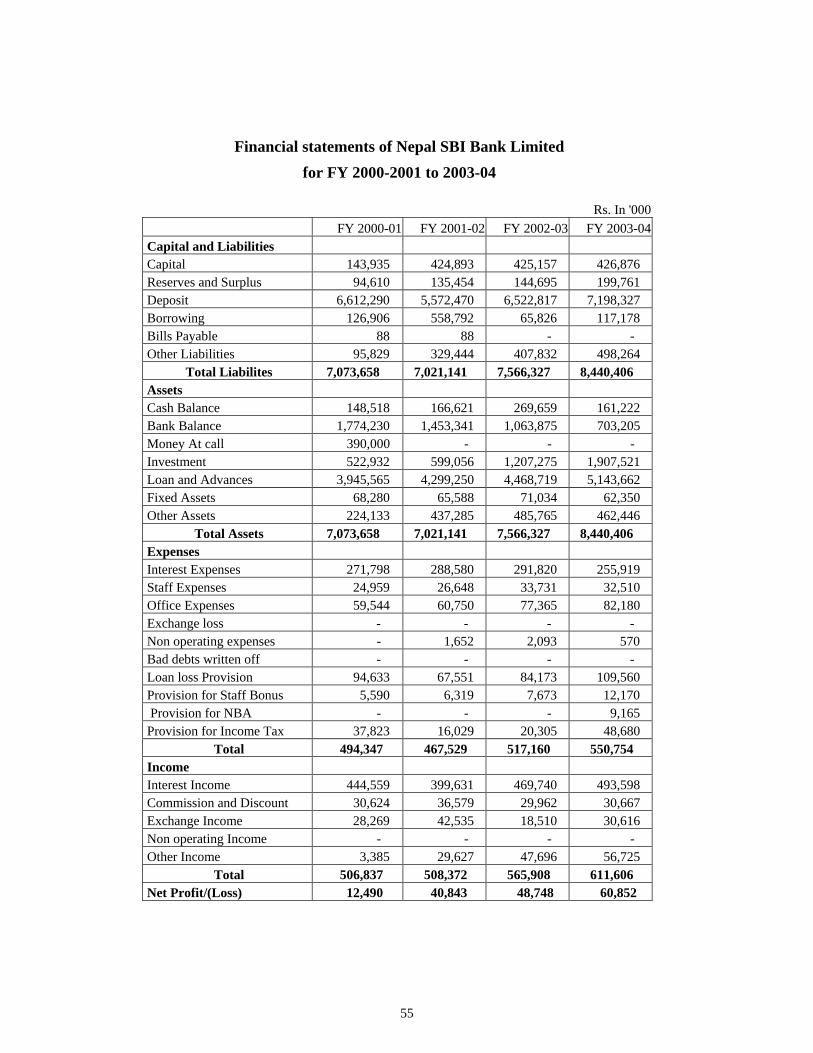
55
Financial statements of Nepal SBI Bank Limited for FY 2000-2001 to 2003-04
Rs. In '000
FY 2000-01 FY 2001-02 FY 2002-03 FY 2003-04 Capital and Liabilities Capital 143,935 424,893 425,157 426,876 Reserves and Surplus 94,610 135,454 144,695 199,761 Deposit 6,612,290 5,572,470 6,522,817 7,198,327 Borrowing 126,906 558,792 65,826 117,178 Bills Payable 88 88 - - Other Liabilities 95,829 329,444 407,832 498,264
Total Liabilites 7,073,658 7,021,141 7,566,327 8,440,406 Assets Cash Balance 148,518 166,621 269,659 161,222 Bank Balance 1,774,230 1,453,341 1,063,875 703,205 Money At call 390,000 - - - Investment 522,932 599,056 1,207,275 1,907,521 Loan and Advances 3,945,565 4,299,250 4,468,719 5,143,662 Fixed Assets 68,280 65,588 71,034 62,350 Other Assets 224,133 437,285 485,765 462,446
Total Assets 7,073,658 7,021,141 7,566,327 8,440,406 Expenses Interest Expenses 271,798 288,580 291,820 255,919 Staff Expenses 24,959 26,648 33,731 32,510 Office Expenses 59,544 60,750 77,365 82,180 Exchange loss - - - - Non operating expenses - 1,652 2,093 570 Bad debts written off - - - - Loan loss Provision 94,633 67,551 84,173 109,560 Provision for Staff Bonus 5,590 6,319 7,673 12,170 Provision for NBA - - - 9,165 Provision for Income Tax 37,823 16,029 20,305 48,680
Total 494,347 467,529 517,160 550,754 Income Interest Income 444,559 399,631 469,740 493,598 Commission and Discount 30,624 36,579 29,962 30,667 Exchange Income 28,269 42,535 18,510 30,616 Non operating Income - - - - Other Income 3,385 29,627 47,696 56,725
Total 506,837 508,372 565,908 611,606 Net Profit/(Loss) 12,490 40,843 48,748 60,852

56
Financial statements of Everest Bank Limited for FY 2000-2001 to 2003-04
Rs. In '000
FY 2000-01 FY 2001-02 FY 2002-03 FY 2003-04 Capital and Liabilities Capital 220,859 399,319 455,000 455,000 Reserves and Surplus 98,535 131,591 157,825 225,319 Deposit 4,574,509 5,466,609 6,694,964 8,063,902 Borrowing 80,000 81,767 - - Bills Payable 11,625 2,129 22,101 22,027 Other Liabilities 154,251 535,483 722,319 842,323
Total Liabilites 5,139,779 6,616,898 8,052,209 9,608,571 Assets Cash Balance 108,103 177,211 136,659 128,757 Bank Balance 716,130 425,274 1,002,910 503,047 Money At call 240,080 86,130 - 187,445 Investment 901,722 1,693,037 1,653,978 2,535,658 Loan and Advances 2,936,589 3,948,478 4,908,461 5,884,124 Fixed Assets 55,146 93,383 109,591 118,374 Other Assets 182,009 193,385 240,610 251,166
Total Assets 5,139,779 6,616,898 8,052,209 9,608,571 Expenses Interest Expenses 236,708 257,051 307,639 316,366 Staff Expenses 24,629 32,187 37,368 48,530 Office Expenses 57,278 79,030 93,585 101,571 Exchange loss - - - - Non operating expenses - - - - Bad debts written off - - - - Loan loss Provision 33,502 34,729 45,746 81,780 Provision for Staff Bonus 11,340 14,154 15,099 23,457 Provision for NBA - - - 2,237 Provision for Income Tax 32,351 38,433 41,714 67,551
Total 395,808 455,584 541,151 641,492 Income Interest Income 385,016 443,821 520,173 657,249 Commission and Discount 30,557 36,773 61,504 74,331 Exchange Income 37,096 45,414 32,208 27,794 Non operating Income 1,395 1,141 1,249 1,867 Other Income 11,449 13,783 20,198 23,818
Total 465,513 540,932 635,332 785,059 Net Profit/(Loss) 69,705 85,348 94,181 143,567

57
Financial statements of Bank of Kathmandu Limited for FY 2000-2001 to 2003-04
Rs. In '000
FY 2000-01 FY 2001-02 FY 2002-03 FY 2003-04 Capital and Liabilities Capital 233,650 463,581 463,581 463,581 Reserves and Surplus 93,523 56,604 115,552 187,164 Deposit 5,713,492 5,723,290 6,170,712 7,741,644 Borrowing 100,000 - 498,236 912,150 Bills Payable 9,943 12,565 35,144 38,709 Other Liabilities 51,326 100,606 161,592 153,095
Total Liabilites 6,201,934 6,356,646 7,444,817 9,496,343 Assets Cash Balance 171,167 193,069 157,400 139,220 Bank Balance 953,061 490,577 535,311 643,662 Money At call 291,998 127,387 30,350 272,321 Investment 419,816 667,459 1,816,149 2,477,409 Loan and Advances 4,127,047 4,613,697 4,542,700 5,646,698 Fixed Assets 102,014 94,219 93,642 83,625 Other Assets 136,831 170,238 269,265 233,408
Total Assets 6,201,934 6,356,646 7,444,817 9,496,343 Expenses Interest Expenses 310,484 285,006 276,705 286,297 Staff Expenses 30,171 50,155 51,682 47,726 Office Expenses 66,701 78,981 89,547 85,829 Exchange loss - - - - Non operating expenses 1,156 - - - Bad debts written off - - - - Loan loss Provision 62,694 127,490 82,612 88,774 Provision for Staff Bonus 10,373 2,985 13,571 20,516 Provision for NBA - - - 12,489 Provision for Income Tax 28,007 17,594 40,014 57,172
Total 509,586 562,211 554,131 598,803 Income Interest Income 465,030 473,297 496,809 567,096 Commission and Discount 46,222 47,872 60,746 77,708 Exchange Income 63,058 48,646 67,444 64,046 Non operating Income - 930 23 15,460 Other Income 626 740 11,237 1,966
Total 574,936 571,485 636,259 726,276 Net Profit/(Loss) 65,350 9,274 82,128 127,473
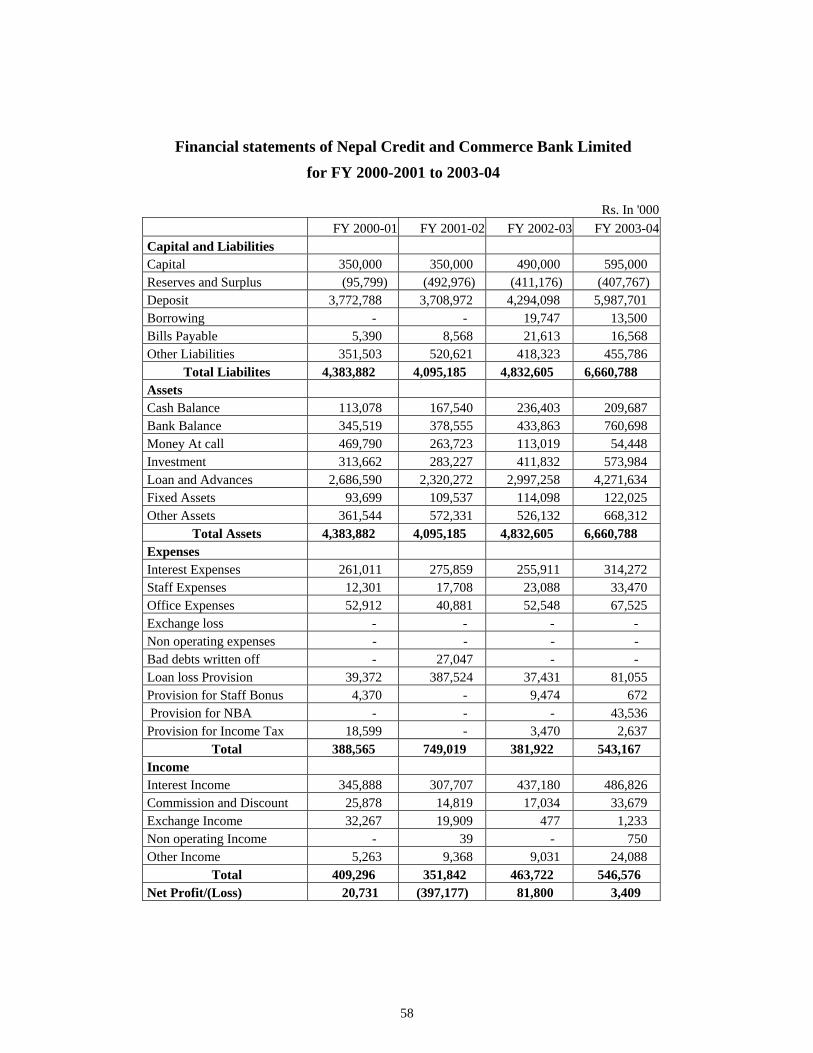
58
Financial statements of Nepal Credit and Commerce Bank Limited for FY 2000-2001 to 2003-04
Rs. In '000
FY 2000-01 FY 2001-02 FY 2002-03 FY 2003-04 Capital and Liabilities Capital 350,000 350,000 490,000 595,000 Reserves and Surplus (95,799) (492,976) (411,176) (407,767) Deposit 3,772,788 3,708,972 4,294,098 5,987,701 Borrowing - - 19,747 13,500 Bills Payable 5,390 8,568 21,613 16,568 Other Liabilities 351,503 520,621 418,323 455,786
Total Liabilites 4,383,882 4,095,185 4,832,605 6,660,788 Assets Cash Balance 113,078 167,540 236,403 209,687 Bank Balance 345,519 378,555 433,863 760,698 Money At call 469,790 263,723 113,019 54,448 Investment 313,662 283,227 411,832 573,984 Loan and Advances 2,686,590 2,320,272 2,997,258 4,271,634 Fixed Assets 93,699 109,537 114,098 122,025 Other Assets 361,544 572,331 526,132 668,312
Total Assets 4,383,882 4,095,185 4,832,605 6,660,788 Expenses Interest Expenses 261,011 275,859 255,911 314,272 Staff Expenses 12,301 17,708 23,088 33,470 Office Expenses 52,912 40,881 52,548 67,525 Exchange loss - - - - Non operating expenses - - - - Bad debts written off - 27,047 - - Loan loss Provision 39,372 387,524 37,431 81,055 Provision for Staff Bonus 4,370 - 9,474 672 Provision for NBA - - - 43,536 Provision for Income Tax 18,599 - 3,470 2,637
Total 388,565 749,019 381,922 543,167 Income Interest Income 345,888 307,707 437,180 486,826 Commission and Discount 25,878 14,819 17,034 33,679 Exchange Income 32,267 19,909 477 1,233 Non operating Income - 39 - 750 Other Income 5,263 9,368 9,031 24,088
Total 409,296 351,842 463,722 546,576 Net Profit/(Loss) 20,731 (397,177) 81,800 3,409

59
Financial statements of Lumbini Bank Limited for FY 2000-2001 to 2003-04
Rs. In '000
FY 2000-01 FY 2001-02 FY 2002-03 FY 2003-04 Capital and Liabilities Capital 350,000 350,000 350,000 350,000 Reserves and Surplus (63,318) (161,291) (72,151) (53,512) Deposit 2,097,492 2,646,106 2,959,745 3,777,605 Borrowing - 121,472 90,000 164,719 Bills Payable 7 7,675 10,684 4,574 Other Liabilities 65,023 97,688 101,890 120,818
Total Liabilites 2,449,204 3,061,650 3,440,168 4,364,204 Assets Cash Balance 63,773 98,616 83,853 114,709 Bank Balance 237,902 433,771 249,712 416,423 Money At call - - 50,000 30,000 Investment 248,868 269,871 382,750 558,187 Loan and Advances 1,735,951 2,085,332 2,441,639 2,980,398 Fixed Assets 36,330 36,526 37,240 40,079 Other Assets 126,380 137,534 194,974 224,408
Total Assets 2,449,204 3,061,650 3,440,168 4,364,204 Expenses Interest Expenses 118,804 170,499 186,484 197,322 Staff Expenses 20,188 24,169 29,470 36,396 Office Expenses 28,971 37,861 41,181 48,022 Exchange loss - - - - Non operating expenses 217 2 - 1,175 Bad debts written off - - - - Loan loss Provision 41,407 150,781 (20,239) 61,630 Provision for Staff Bonus - - 9,904 4,489 Provision for NBA - - - 11,745 Provision for Income Tax - - - 21,764
Total 209,587 383,312 246,800 382,543 Income Interest Income 157,430 266,378 308,680 361,240 Commission and Discount 5,358 8,260 13,034 14,382 Exchange Income 4,090 4,997 6,560 18,503 Non operating Income - - - - Other Income 6,574 5,704 7,665 7,058
Total 173,452 285,339 335,939 401,183 Net Profit/(Loss) (36,135) (97,973) 89,139 18,640

60
Financial statements of Nepal Industrial and Commercial Bank Limited for FY 2000-2001 to 2003-04
Rs. In '000
FY 2000-01 FY 2001-02 FY 2002-03 FY 2003-04 Capital and Liabilities Capital 499,730 499,890 499,955 499,960 Reserves and Surplus 19,385 26,206 52,146 120,438 Deposit 3,575,838 3,165,311 3,144,320 5,146,483 Borrowing - - 274,750 60,018 Bills Payable 31,506 37,357 24,354 32,921 Other Liabilities 88,961 39,889 41,994 70,247
Total Liabilites 4,215,420 3,768,653 4,037,519 5,930,067 Assets Cash Balance 127,107 139,856 95,742 79,042 Bank Balance 412,344 419,673 222,316 240,263 Money At call 352,029 46,810 29,900 129,663 Investment 567,078 753,812 1,153,262 1,760,724 Loan and Advances 2,585,419 2,278,994 2,419,522 3,561,139 Fixed Assets 45,470 54,758 50,214 43,285 Other Assets 125,973 74,750 66,563 115,951
Total Assets 4,215,420 3,768,653 4,037,519 5,930,067 Expenses Interest Expenses 180,459 197,094 142,606 183,582 Staff Expenses 21,253 26,990 33,827 35,226 Office Expenses 49,917 46,226 50,706 47,445 Exchange loss - - 26 - Non operating expenses 3 1 82 - Bad debts written off - - - - Loan loss Provision 13,525 57,516 53,481 38,615 Provision for Staff Bonus 7,903 943 4,704 10,755 Provision for NBA - - - 4,289 Provision for Income Tax 22,851 1,665 16,394 28,535
Total 295,911 330,435 301,826 348,447 Income Interest Income 294,219 297,764 291,143 363,037 Commission and Discount 26,300 18,564 21,966 27,236 Exchange Income 23,669 18,831 12,183 20,832 Non operating Income - 2,096 - 40 Other Income - - 2,476 5,561
Total 344,188 337,255 327,768 416,706 Net Profit/(Loss) 48,277 6,820 25,942 68,259

61
Financial statements of Machhapuchhre Bank Limited for FY 2000-2001 to 2003-04
Rs. In '000
FY 2000-01 FY 2001-02 FY 2002-03 FY 2003-04 Capital and Liabilities Capital 84,000 136,200 544,174 550,000 Reserves and Surplus (15,278) (56,656) (42,469) 4,222 Deposit 700,080 994,817 1,778,788 2,754,632 Borrowing - - 90,000 102,167 Bills Payable 198 2,466 3,957 5,136 Other Liabilities 12,536 27,550 25,407 32,477
Total Liabilites 781,536 1,104,377 2,399,857 3,448,634 Assets Cash Balance 21,618 31,538 45,642 65,256 Bank Balance 89,904 194,591 156,083 345,488 Money At call 40,000 - 220,000 150,000 Investment 55,018 117,484 398,356 274,407 Loan and Advances 493,362 655,061 1,464,166 2,493,108 Fixed Assets 53,507 57,080 59,225 62,413 Other Assets 28,127 48,623 56,385 57,962
Total Assets 781,536 1,104,377 2,399,857 3,448,634 Expenses Interest Expenses 24,126 64,480 76,156 113,579 Staff Expenses 7,630 11,808 17,435 19,872 Office Expenses 13,672 23,181 34,079 42,358 Exchange loss - - - - Non operating expenses 16 - - 2 Bad debts written off - - - - Loan loss Provision 5,166 20,067 6,466 15,980 Provision for Staff Bonus - - 1,701 5,188 Provision for NBA - - - - Provision for Income Tax - - - -
Total 50,610 119,536 135,837 196,979 Income Interest Income 31,174 70,089 139,040 215,207 Commission and Discount 2,751 3,113 5,654 14,840 Exchange Income 1,011 3,718 5,946 12,621 Non operating Income - 1 - - Other Income 248 267 505 1,001
Total 35,184 77,188 151,145 243,669 Net Profit/(Loss) (15,426) (42,348) 15,308 46,690

62
Financial statements of Kumari Bank Limited for FY 2000-2001 to 2003-04
Rs. In '000
FY 2000-01 FY 2001-02 FY 2002-03 FY 2003-04 Capital and Liabilities Capital - 350,000 350,000 500,000 Reserves and Surplus - (1,441) 11,033 33,403 Deposit - 1,179,894 2,513,144 4,807,936 Borrowing - 31,991 - - Bills Payable - 8,838 4,129 14,637 Other Liabilities - 23,478 107,869 138,199
Total Liabilites - 1,592,760 2,986,175 5,494,175 Assets Cash Balance - 30,276 40,800 68,472 Bank Balance - 98,878 250,905 617,006 Money At call - - - - Investment - 255,000 423,155 983,504 Loan and Advances - 1,111,559 2,105,737 3,649,008 Fixed Assets - 51,896 40,425 57,152 Other Assets - 45,151 125,153 119,033
Total Assets - 1,592,760 2,986,175 5,494,175 Expenses Interest Expenses - 48,168 92,945 163,903 Staff Expenses - 15,326 23,254 28,576 Office Expenses - 31,423 45,504 56,441 Exchange loss - - - - Non operating expenses - - - - Bad debts written off - - - - Loan loss Provision - 12,388 16,805 17,126 Provision for Staff Bonus - 226 2,373 7,680 Provision for NBA - - - - Provision for Income Tax - 696 8,879 20,437
Total - 108,227 189,760 294,163 Income Interest Income - 96,355 185,090 310,216 Commission and Discount - 3,441 9,413 16,446 Exchange Income - 9,152 7,144 14,414 Non operating Income - - 4 - Other Income - 616 582 1,773
Total - 109,564 202,233 342,849 Net Profit/(Loss) - 1,337 12,473 48,686

63
Financial statements of Laxmi Bank Limited for FY 2000-2001 to 2003-04
Rs. In '000
FY 2000-01 FY 2001-02 FY 2002-03 FY 2003-04 Capital and Liabilities Capital 350,000 275,000 330,000 549,789 Reserves and Surplus (2,778) (4,217) (3,183) 7,266 Deposit 316,099 112,597 691,810 1,684,159 Borrowing - - 70,000 317,005 Bills Payable 1,009 162 2,150 283 Other Liabilities 1,106 727 5,769 26,988
Total Liabilites 665,436 384,269 1,096,546 2,585,490 Assets Cash Balance 18,775 2,968 16,054 36,977 Bank Balance 153,442 165,690 137,555 342,490 Money At call 140,000 - - 100,000 Investment 19,757 54,027 110,914 295,107 Loan and Advances 263,077 122,880 768,184 1,733,420 Fixed Assets 46,748 26,258 30,944 32,633 Other Assets 23,637 12,446 32,895 44,863
Total Assets 665,436 384,269 1,096,546 2,585,490 Expenses Interest Expenses 1,316 354 20,096 63,177 Staff Expenses 2,925 2,877 14,394 19,198 Office Expenses 4,024 2,447 17,322 35,730 Exchange loss - - - - Non operating expenses - - - 55 Bad debts written off - - - - Loan loss Provision 2,657 1,241 6,518 9,750 Provision for Staff Bonus - - 115 1,454 Provision for NBA - - - - Provision for Income Tax - - - 2,634
Total 10,922 6,919 58,445 131,998 Income Interest Income 6,385 1,867 49,787 124,046 Commission and Discount 514 231 4,262 11,299 Exchange Income 894 522 4,534 6,076 Non operating Income 193 - 405 - Other Income - 83 491 1,026
Total 7,986 2,703 59,479 142,447 Net Profit/(Loss) (2,936) (4,216) 1,034 10,449

64
Financial statements of Siddhartha Bank Limited for FY 2000-2001 to 2003-04
Rs. In '000
FY 2000-01 FY 2001-02 FY 2002-03 FY 2003-04 Capital and Liabilities Capital - - 350,000 350,000 Reserves and Surplus - - (1,284) 16,198 Deposit - - 391,678 1,291,314 Borrowing - - 110,000 220,000 Bills Payable - - - 962 Other Liabilities - - 13,341 33,565
Total Liabilites - - 863,735 1,912,039 Assets Cash Balance - - 9,439 18,214 Bank Balance - - 55,648 53,632 Money At call - - 102,073 174,830 Investment - - 3,775 42,050 Loan and Advances - - 622,735 1,543,768 Fixed Assets - - 21,819 28,409 Other Assets - - 48,246 51,136
Total Assets - - 863,735 1,912,039 Expenses Interest Expenses - - 5,619 45,506 Staff Expenses - - 8,040 16,458 Office Expenses - - 10,163 21,668 Exchange loss - - - - Non operating expenses - - - - Bad debts written off - - - - Loan loss Provision - - 6,290 17,769 Provision for Staff Bonus - - - 2,836 Provision for NBA - - - - Provision for Income Tax - - - 8,039
Total - - 30,112 112,276 Income Interest Income - - 23,889 113,630 Commission and Discount - - 2,163 7,034 Exchange Income - - 88 2,229 Non operating Income - - - - Other Income - - 2,687 6,866
Total - - 28,827 129,759 Net Profit/(Loss) - - (1,285) 17,483

65
Annexure – 2
Financial Indicator of Commercial Bank Financial Indicator of Nepal Bank Limited
FY 2000-01 FY 2001-02 FY 2002-03 FY 2003-04Core Capital to Risk Weighted Assets -17.51% -27.03% -29.75% -25.91%Capital Fund to Risk Weighted Assets 0.00% -19.67% -28.25% -24.97%Non-Performing Loan to Total Loan 50.80% 56.27% 60.47% 53.74%Net Profit To Gross Profit -14833.87% 320.98% 106.92% 87.94%Interest Income to Loan and Advance 11.67% 7.93% 12.13% 10.17%Interest Expenses to Deposit & Borrowing 5.12% 4.97% 4.52% 2.87%Net Interest Income (Rs. in million) 548 -186 615 800Return on Assets -5.24% -7.76% -0.63% 1.61%Credit to Deposit 57.33% 56.19% 51.79% 50.20%Liquid Assets to Total Assets 35.19% 38.58% 42.27% 38.96%Liquid Assets to Total Deposit 41.09% 44.55% 48.07% 48.15%
Financial Indicator of Rastriya Banijya Bank
FY 2000-01 FY 2001-02 FY 2002-03 FY 2003-04Core Capital to Risk Weighted Assets -17.03% -35.30% -45.52% -43.27%Capital Fund to Risk Weighted Assets 0.00% -28.02% -44.28% -42.12%Non-Performing Loan to Total Loan 48.49% 55.07% 60.15% 57.64%Net Profit To Gross Profit 606.69% 576.65% 148.97% 91.72%Interest Income to Loan and Advance 10.35% 6.45% 7.68% 8.91%Interest Expenses to Deposit & Borrowing 6.28% 6.00% 5.32% 3.65%Net Interest Income (Rs. in million) 262 -602 -59 741Return on Assets -13.31% -15.72% -11.32% 2.31%Credit to Deposit 67.14% 69.34% 67.53% 61.43%Liquid Assets to Total Assets 20.03% 19.16% 20.15% 22.28%Liquid Assets to Total Deposit 26.15% 22.09% 21.86% 24.56%
Financial Indicator of Nabil Bank Limited
FY 2000-01 FY 2001-02 FY 2002-03 FY 2003-04Core Capital to Risk Weighted Assets 6.50% 10.53% 11.45% 12.12%Capital Fund to Risk Weighted Assets 10.46% 13.86% 13.05% 13.56%Non-Performing Loan to Total Loan 16.01% 7.14% 5.54% 3.35%Net Profit To Gross Profit 42.12% 30.34% 56.76% 56.08%Interest Income to Loan and Advance 15.22% 14.36% 12.55% 11.72%Interest Expenses to Deposit & Borrowing 3.65% 2.90% 2.20% 1.97%Net Interest Income (Rs. in million) 688 658 701 719Return on Assets 1.64% 1.54% 2.51% 2.72%Credit to Deposit 52.56% 50.31% 60.34% 60.55%Liquid Assets to Total Assets 22.89% 29.52% 32.63% 33.21%Liquid Assets to Total Deposit 25.69% 33.56% 40.18% 39.39%

66
Financial Indicator of Nepal Investment Bank Limited
FY 2000-01 FY 2001-02 FY 2002-03 FY 2003-04
Core Capital to Risk Weighted Assets 13.10% 15.47% 7.88% 7.22%Capital Fund to Risk Weighted Assets 0.00% 17.21% 8.85% 11.18%Non-Performing Loan to Total Loan 8.29% 4.80% 1.98% 2.47%Net Profit To Gross Profit 37.72% 35.25% 53.25% 43.84%Interest Income to Loan and Advance 14.40% 12.02% 7.76% 9.97%Interest Expenses to Deposit & Borrowing 3.73% 3.05% 2.39% 2.74%Net Interest Income (Rs. in million) 186 196 270 405Return on Assets 1.12% 1.15% 1.30% 1.15%Credit to Deposit 57.07% 65.00% 74.74% 63.68%Liquid Assets to Total Assets 14.88% 11.33% 15.16% 26.69%Liquid Assets to Total Deposit 17.54% 13.49% 17.25% 30.70%
Financial Indicator of Standard Chartered Bank Nepal Limited
FY 2000-01 FY 2001-02 FY 2002-03 FY 2003-04Core Capital to Risk Weighted Assets 11.61% 13.92% 12.31% 14.14%Capital Fund to Risk Weighted Assets 0.00% 17.39% 14.21% 15.99%Non-Performing Loan to Total Loan 5.23% 4.84% 4.13% 3.77%Net Profit To Gross Profit 50.03% 59.08% 63.88% 60.90%Interest Income to Loan and Advance 21.60% 17.80% 16.69% 15.57%Interest Expenses to Deposit & Borrowing 2.77% 1.82% 1.35% 1.30%Net Interest Income (Rs. in million) 753 714 746 766Return on Assets 2.26% 2.60% 2.41% 2.27%Credit to Deposit 36.82% 35.97% 31.99% 31.63%Liquid Assets to Total Assets 43.93% 47.02% 47.11% 51.56%Liquid Assets to Total Deposit 54.34% 54.76% 52.75% 57.60%
Financial Indicator of Himalayan Bank Limited
FY 2000-01 FY 2001-02 FY 2002-03 FY 2003-04Core Capital to Risk Weighted Assets 4.67% 6.99% 7.14% 7.66%Capital Fund to Risk Weighted Assets 0.00% 12.33% 11.03% 10.62%Non-Performing Loan to Total Loan 15.17% 8.35% 10.08% 8.88%Net Profit To Gross Profit 45.12% 42.40% 35.18% 39.59%Interest Income to Loan and Advance 14.71% 12.02% 11.08% 9.64%Interest Expenses to Deposit & Borrowing 4.15% 3.02% 2.56% 2.17%Net Interest Income (Rs. in million) 592 571 647 754Return on Assets 1.47% 1.14% 0.91% 1.06%Credit to Deposit 51.12% 51.33% 51.62% 58.70%Liquid Assets to Total Assets 40.89% 22.57% 26.24% 23.43%Liquid Assets to Total Deposit 43.76% 25.05% 29.17% 26.36%

67
Financial Indicator of Nepal Bangladesh Bank Limited
FY 2000-01 FY 2001-02 FY 2002-03 FY 2003-04
Core Capital to Risk Weighted Assets 5.94% 5.75% 6.22% 4.65%Capital Fund to Risk Weighted Assets 0.00% 9.92% 8.11% 5.61%Non-Performing Loan to Total Loan 8.34% 15.77% 12.73% 10.81%Net Profit To Gross Profit 44.57% 17.25% 15.06% 0.52%Interest Income to Loan and Advance 11.01% 10.52% 12.73% 11.36%Interest Expenses to Deposit & Borrowing 6.00% 5.63% 5.61% 4.86%Net Interest Income (Rs. in million) 294 298 416 470Return on Assets 2.06% 0.59% 0.60% 0.02%Credit to Deposit 85.56% 84.79% 75.25% 75.31%Liquid Assets to Total Assets 17.18% 24.77% 25.48% 28.16%Liquid Assets to Total Deposit 19.29% 28.85% 28.73% 31.35%
Financial Indicator of Nepal SBI Bank Limited
FY 2000-01 FY 2001-02 FY 2002-03 FY 2003-04Core Capital to Risk Weighted Assets 4.45% 10.83% 11.34% 9.47%Capital Fund to Risk Weighted Assets 0.00% 13.92% 13.78% 10.25%Non-Performing Loan to Total Loan 11.54% 6.32% 8.90% 6.25%Net Profit To Gross Profit 8.30% 31.24% 30.30% 25.31%Interest Income to Loan and Advance 10.61% 8.72% 9.79% 8.92%Interest Expenses to Deposit & Borrowing 4.03% 4.71% 4.43% 3.50%Net Interest Income (Rs. in million) 173 111 178 238Return on Assets 0.18% 0.58% 0.64% 0.72%Credit to Deposit 63.34% 82.27% 73.52% 76.85%Liquid Assets to Total Assets 37.85% 30.24% 33.34% 32.63%Liquid Assets to Total Deposit 40.49% 38.10% 38.68% 38.26%
Financial Indicator of Everest Bank Limited
FY 2000-01 FY 2001-02 FY 2002-03 FY 2003-04Core Capital to Risk Weighted Assets 8.68% 12.11% 10.48% 9.58%Capital Fund to Risk Weighted Assets 0.00% 14.30% 12.33% 11.07%Non-Performing Loan to Total Loan 3.93% 1.05% 2.20% 1.72%Net Profit To Gross Profit 47.45% 49.43% 47.87% 45.06%Interest Income to Loan and Advance 12.84% 10.97% 10.30% 10.78%Interest Expenses to Deposit & Borrowing 5.09% 4.63% 4.60% 3.92%Net Interest Income (Rs. in million) 148 187 213 341Return on Assets 1.36% 1.29% 1.17% 1.49%Credit to Deposit 65.57% 73.98% 75.42% 75.59%Liquid Assets to Total Assets 36.72% 33.66% 34.01% 34.20%Liquid Assets to Total Deposit 41.26% 40.75% 40.91% 40.75%

68
Financial Indicator of Bank of Kathmandu Limited
FY 2000-01 FY 2001-02 FY 2002-03 FY 2003-04
Core Capital to Risk Weighted Assets 5.64% 9.91% 10.44% 10.14%Capital Fund to Risk Weighted Assets 0.00% 13.99% 12.05% 11.18%Non-Performing Loan to Total Loan 7.59% 8.11% 8.67% 6.66%Net Profit To Gross Profit 39.27% 5.89% 37.62% 41.60%Interest Income to Loan and Advance 10.85% 9.68% 10.23% 9.44%Interest Expenses to Deposit & Borrowing 5.34% 4.98% 4.15% 3.31%Net Interest Income (Rs. in million) 155 188 220 281Return on Assets 1.05% 0.15% 1.10% 1.34%Credit to Deposit 75.01% 85.44% 78.69% 77.61%Liquid Assets to Total Assets 27.69% 21.30% 30.00% 36.09%Liquid Assets to Total Deposit 30.05% 23.65% 36.20% 44.27%
Financial Indicator of Nepal Credit and Commerce Bank Limited
FY 2000-01 FY 2001-02 FY 2002-03 FY 2003-04Core Capital to Risk Weighted Assets 6.20% -4.07% 1.90% 2.85%Capital Fund to Risk Weighted Assets 0.00% 2.33% 6.51% 3.42%Non-Performing Loan to Total Loan 18.93% 40.11% 20.63% 12.72%Net Profit To Gross Profit 24.96% -2283.41% 61.89% 2.60%Interest Income to Loan and Advance 11.97% 10.69% 12.87% 10.32%Interest Expenses to Deposit & Borrowing 6.92% 7.44% 5.93% 5.24%Net Interest Income (Rs. in million) 85 32 181 173Return on Assets 0.47% -9.70% 1.69% 0.05%Credit to Deposit 76.59% 77.60% 79.09% 78.78%Liquid Assets to Total Assets 25.69% 24.65% 22.73% 23.07%Liquid Assets to Total Deposit 29.85% 27.22% 25.58% 25.67%
Financial Indicator of Lumbini Bank Limited
FY 2000-01 FY 2001-02 FY 2002-03 FY 2003-04Core Capital to Risk Weighted Assets 13.47% 6.45% 8.68% 7.54%Capital Fund to Risk Weighted Assets 0.00% 12.89% 11.37% 8.71%Non-Performing Loan to Total Loan 15.54% 19.32% 11.70% 7.36%Net Profit To Gross Profit -685.41% -185.53% 113.11% 15.76%Interest Income to Loan and Advance 8.81% 11.66% 11.77% 11.21%Interest Expenses to Deposit & Borrowing 5.66% 6.16% 6.11% 5.01%Net Interest Income (Rs. in million) 39 96 122 164Return on Assets -1.48% -3.20% 2.59% 0.43%Credit to Deposit 85.16% 86.37% 88.60% 85.31%Liquid Assets to Total Assets 20.84% 20.66% 19.14% 22.78%Liquid Assets to Total Deposit 24.34% 23.90% 22.25% 26.32%

69
Financial Indicator of Nepal Industrial and Commercial Bank Limited
FY 2000-01 FY 2001-02 FY 2002-03 FY 2003-04
Core Capital to Risk Weighted Assets 16.29% 18.54% 17.44% 12.92%Capital Fund to Risk Weighted Assets 17.36% 20.90% 18.87% 13.75%Non-Performing Loan to Total Loan 5.06% 8.16% 6.66% 3.92%Net Profit To Gross Profit 52.16% 10.19% 25.81% 45.37%Interest Income to Loan and Advance 11.24% 12.57% 11.36% 9.70%Interest Expenses to Deposit & Borrowing 5.05% 6.23% 4.17% 3.53%Net Interest Income (Rs. in million) 114 101 149 179Return on Assets 1.15% 0.18% 0.64% 1.15%Credit to Deposit 73.21% 74.84% 81.51% 72.73%Liquid Assets to Total Assets 33.28% 34.14% 35.25% 28.40%Liquid Assets to Total Deposit 39.23% 40.65% 45.26% 32.73%
Financial Indicator of Machhapuchhre Bank Limited
FY 2000-01 FY 2001-02 FY 2002-03 FY 2003-04Core Capital to Risk Weighted Assets 10.59% 8.00% 23.98% 17.01%Capital Fund to Risk Weighted Assets 0.00% 10.68% 24.75% 17.82%Non-Performing Loan to Total Loan 0.91% 10.45% 2.08% 0.98%Net Profit To Gross Profit 150.35% 190.06% 65.21% 68.81%Interest Income to Loan and Advance 6.25% 10.30% 9.29% 8.47%Interest Expenses to Deposit & Borrowing 3.45% 6.48% 4.08% 3.98%Net Interest Income (Rs. in million) 7 6 63 102Return on Assets -1.97% -3.83% 0.64% 1.35%Credit to Deposit 71.21% 68.38% 84.09% 92.24%Liquid Assets to Total Assets 25.47% 24.95% 20.88% 18.33%Liquid Assets to Total Deposit 28.43% 27.70% 28.17% 22.95%
Financial Indicator of Kumari Bank Limited
FY 2000-01 FY 2001-02 FY 2002-03 FY 2003-04Core Capital to Risk Weighted Assets 83.58% 25.60% 14.22% 28.21%Capital Fund to Risk Weighted Assets 0.00% 26.79% 15.46% 29.13%Non-Performing Loan to Total Loan 0.00% 1.27% 1.70% 0.00%Net Profit To Gross Profit 1052.33% 9.13% 30.77% 51.83%Interest Income to Loan and Advance 2.40% 8.55% 8.66% 8.39%Interest Expenses to Deposit & Borrowing 0.42% 3.97% 3.70% 3.16%Net Interest Income (Rs. in million) 5 48 92 61Return on Assets -0.44% 0.08% 0.42% 0.89%Credit to Deposit 84.07% 95.48% 85.06% 76.91%Liquid Assets to Total Assets 49.89% 15.44% 17.66% 23.43%Liquid Assets to Total Deposit 105.02% 20.84% 20.98% 26.77%

70
Financial Indicator of Laxmi Bank Limited
FY 2000-01 FY 2001-02 FY 2002-03 FY 2003-04
Core Capital to Risk Weighted Assets 0.00% 133.19% 37.60% 11.90%Capital Fund to Risk Weighted Assets 0.00% 133.80% 38.56% 12.81%Non-Performing Loan to Total Loan 0.00% 0.00% 0.00% 0.76%Net Profit To Gross Profit 0.00% 141.71% 13.49% 43.02%Interest Income to Loan and Advance 0.00% 1.50% 6.42% 7.08%Interest Expenses to Deposit & Borrowing 0.00% 0.31% 2.64% 3.41%Net Interest Income (Rs. in million) 0 2 30 146Return on Assets 0.00% -1.10% 0.09% 0.40%Credit to Deposit 0.00% 110.23% 112.16% 103.96%Liquid Assets to Total Assets 0.00% 43.89% 22.75% 29.53%Liquid Assets to Total Deposit 0.00% 149.79% 36.07% 45.33%
Financial Indicator of Siddhartha Bank Limited
FY 2000-01 FY 2001-02 FY 2002-03 FY 2003-04Core Capital to Risk Weighted Assets 0.00% 0.00% 41.11% 18.50%Capital Fund to Risk Weighted Assets 0.00% 0.00% 41.85% 19.36%Non-Performing Loan to Total Loan 0.00% 0.00% 0.00% 1.61%Net Profit To Gross Profit 0.00% 0.00% -25.67% 37.90%Interest Income to Loan and Advance 0.00% 0.00% 3.80% 7.25%Interest Expenses to Deposit & Borrowing 0.00% 0.00% 1.12% 3.01%Net Interest Income (Rs. in million) 0 0 18 68Return on Assets 0.00% 0.00% -0.15% 0.91%Credit to Deposit 0.00% 0.00% 160.60% 121.41%Liquid Assets to Total Assets 0.00% 0.00% 19.79% 15.10%Liquid Assets to Total Deposit 0.00% 0.00% 43.64% 22.36%