Embed Size (px)
Citation preview

ANNUAL ACCOUNTS2013–2014

DMU is a truly global university – with students from more than 130 countries and 155 quality international partnerships providing placement opportunities around the world

1
2. CHANCELLOR, BOARD OF GOVERNORS AND COMMITTEES, SENIOR EXECUTIVE AND PROFESSIONAL ADVISORS
5. CHAIRMAN’S INTRODUCTION TO THE ANNUAL ACCOUNTS
6. OPERATING AND FINANCIAL REVIEW
26. STATEMENT ON CORPORATE GOVERNANCE
29. INDEPENDENT AUDITOR’S REPORT TO THE BOARD OF GOVERNORS OF DE MONTFORT UNIVERSITY
30. STATEMENT OF PRINCIPAL ACCOUNTING POLICIES
34. CONSOLIDATED INCOME AND EXPENDITURE ACCOUNT
35. BALANCE SHEET
36. STATEMENT OF CONSOLIDATED TOTAL RECOGNISED GAINS AND LOSSES
37. CONSOLIDATED CASH FLOW STATEMENT 38. NOTES TO THE ACCOUNTS
CONTENTS

2
CHANCELLORThe Lord Alli Hon DLitt (DMU), Hon DLitt (University of Westminster)
BOARD OF GOVERNORSMr Ian Blatchford MA (Oxon), MA (Birkbeck), FCMA, FSA (Chairman of the Board)
Mr Mike Kapur BSc (Hons), ACA, FRSA
Mr Tony Stockdale ACA
Ms Marcia Saunders BA, MA, MSc
Professor Robert Harris BA (Hons), MA, PhD
Mr Mark Anderson MA, MBA
Ms Ann Ewing BA (Hons), MBA, PhD, PGCE, MCIPD
Ms Suzanne Overton-Edwards BSc, PGCE
Mr Alan Charlton Joined September 2013CMG, CVO, MA, BLing, PGCE, FRSA
Mr Oliver Mishcon Joined September 2013LLB (Hons), Barrister
Dr Vijay Patel Joined December 2013BSc (Pharm), MRPS, GPHC, CCMI, FRSA
Ms Hilary Carty Joined March 2014BA (Hons), MBA, PGCE, CCMI
Co-opted GovernorsMs Christine Hancock BSc (Hons), Econ RN
Representative GovernorsMr Tim O’Sullivan Stepped down September 2013BSc (Hons), MA
Ms Doreen Crawford Joined November 2013BSc, MA, PGCE
Mr Ian Warrington Stepped down July 2014BSc (Hons), (DSU President – outgoing)
Mr Adil Waraich Joined July 2014(DSU President – incoming)
CHANCELLOR, BOARD OF GOVERNORS AND COMMITTEES, SENIOR EXECUTIVE AND PROFESSIONAL ADVISORS

3
Ex-Officio Governor – Chief Executive and Vice-ChancellorProfessor Dominic Shellard MA, DPhil
CLERK TO THE BOARDMrs Rebecca Jenkyn LLB (Hons)
COMMITTEES OF THE BOARD
Audit CommitteeMr Mike Kapur (Chair) Ms Marcia SaundersMr Mark AndersonMr Alan Charlton Joined June 2014
Nominations CommitteeMs Marcia Saunders (Chair) Mr Ian BlatchfordMr Tim O’Sullivan Stepped down September 2013Mr Oliver Mishcon Joined May 2014Ms Doreen Crawford Joined May 2014Mr Ian Warrington Stepped down June 2014Mr Adil Waraich Joined July 2014Professor Dominic Shellard
Remuneration CommitteeThe Lord Alli Stepped down January 2014Mr Ian Blatchford (Chair)Mr Tony Stockdale Ms Marcia Saunders Joined January 2014
Finance and Human Resources CommitteeMr Tony Stockdale (Chair)Ms Christine HancockProfessor Robert Harris Professor Dominic Shellard Ms Ann EwingMs Suzanne Overton-Edwards

4
EXECUTIVE BOARD
Professor Dominic Shellard (Chief Executive and Vice-Chancellor) MA, DPhil
Professor David Wilson (Deputy Vice-Chancellor) BA, BPhil, PhD, FHEA
Professor Andy Collop (Pro Vice-Chancellor and Dean of Faculty of Technology) BEng, PhD, DSc, CEng, FIHT
Professor Andy Downton (Pro Vice-Chancellor for Teaching and Learning) Stepped down July 2014BSc, PhD, Ceng, FIEE, SMIEEE
Professor Michael Young (Pro Vice-Chancellor for Teaching and Learning) Joined September 2014BA (Hons), PhD, PGCert
Ms Barbara Matthews (Pro Vice-Chancellor and Dean of Faculty of Art, Design and Humanities) Joined August 2013MBE, BSc
Professor Cillian Ryan (Pro Vice-Chancellor and Dean of Faculty of Business and Law) Joined September 2014BA, MA, PhD, FRSA
Professor Mandy Ashton (Pro Vice-Chancellor and Dean of Faculty of Health and Life Sciences) Stepped down July 2014OBE, BA (Hons), MSc, DPNS, RGN
Dr Simon Oldroyd (Acting Dean of Faculty of Health and Life Sciences) Joined August 2014BSC (Hons), PhD, FIBMS
Mr James Gardner (Pro Vice-Chancellor for International) BA (Hons)
Mr Ben Browne (Chief Operating Officer) MA (HRM), FCIPD
Ms Jo Cooke (Executive Director of Student and Academic Services)BA (Hons)
Mr Andrew Pemberton (Executive Director for Marketing and Communications) BSc (Hons), MA, MCIPR
Mr Jonathan Shuter (Executive Director of Finance)BA (Hons), ACMA, CGMA
Mr David Carrott (Executive Director of Estates and Commercial Services) Joined January 2014BSc, ICIOB, MaPAS
Mr Paul Marshall (Executive Director of Strategic Planning Services) Joined June 2014BSc (Hons), PGDip, ACIS
Ms Sarah Setchell (Executive Director of People and Organisational Development) Joined November 2013BA (Hons), PGDip, MCIDP
Mr Simon Ambrose (Vice-Chancellor’s Chief of Staff)LLB (Hons), MBA
PROFESSIONAL ADVISORS TO THE CORPORATION
AuditorsExternal Auditors: KPMG LLP, Birmingham Internal Auditors: PricewaterhouseCoopers LLP, Birmingham
BANKERS
National Westminster Bank plc In accordance with best practice, the Board of Governors maintains a Register of Governors’ Interests. To view the Register, contact the Clerk to the Board, Trinity House, De Montfort University, Leicester LE1 9BH.

5
THE GUIDING PRINCIPLES OF DE MONTFORT UNIVERSITY
De Montfort University (DMU) believes passionately that universities are a public good through transformation of lives, through the places in which its students and staff live and work, and through sharing their discoveries for the wider benefit of society. Our university is a community in which all staff and students learn, develop and contribute through partnerships to that shared experience. Our research, including that which crosses traditional boundaries, is central to our learning community, enhancing the quality of our courses and serving the needs of society in a transformational way. We are also an international community where students and staff from diverse backgrounds and cultures learn from and enrich each other. We seek to treat those with whom we work and with whom we come into contact with dignity, respect and integrity.
We seek to:
• enable our students and staff to create a high quality and distinctive academic experience using new and exciting approaches to learning and research
• equip our students with graduate skills and knowledge both for employment and for life
• deliver quality and add value in all that we do
• understand and respond to the needs of business and the professions
• actively promote our learning community through local engagement and partnerships, and in terms of key alliances and collaborations, both nationally and internationally
We are strongly committed to widening access to higher education and to supporting students from diverse backgrounds to enable them to achieve their full potential. We seek to communicate clearly and openly within the university and beyond, and to listen carefully to what people say to us. We encourage, in all our staff and students, an innovative and entrepreneurial attitude in our approaches to learning, research and business partnerships that enriches us and those with whom we work.
KEY FINANCIAL RESULTS FOR THE YEAR
• Surplus on continuing operations of £9.1m
• Increase in cash and short term deposits of £7.7m to £91.2m
• 22% rise in academic fees and education contracts to £115.4m
• Capital investment of £18.5m
GOVERNANCE, GOVERNORS AND STAFF
The end of this academic year brought various changes to the membership of the Board of Governors with the expiry of individuals’ periods of tenure and the appointment of new members. Mr Ian Warrington, President of De Montfort University Students’ Union (DSU), also stepped down after a year in office and the board has welcomed the new President, Mr Adil Waraich, who will serve on the board until July 2015. On behalf of the Board of Governors, I thank all those leaving the board for their contributions, commitment and support.
I would like to extend my thanks and those of the Board of Governors to the Executive Board and to all the staff at DMU for another very successful year in which we have seen our university strengthen its competitive position and achieve outstanding results in a rapidly changing environment. I would also like personally to thank my fellow governors for their continuing and unstinting support and encouragement.
Mr Ian Blatchford Chairman of the Board of Governors
I am pleased to introduce the Annual Accounts for 2013/14.
This past year has seen the university continue its pursuit of quality and distinctiveness under the direction of its Vice-Chancellor, Professor Dominic Shellard, and the Executive Board, and as overseen by its Board of Governors.
CHAIRMAN’S INTRODUCTION TO THE ANNUAL ACCOUNTS 2013/14

6
1. UNIVERSITY MISSION AND STRATEGY
Implementing our visionDMU’s Mission, Vision and Strategic Plan (2011 to 2015) were agreed by our Board of Governors at the end of the 2010/11 academic year and published in September 2011.
The university’s mission statement is:
We are a university of quality and distinctiveness, distinguished by our commitment to excellence in learning, teaching and the student experience, our life-changing research, dynamic international partnerships and vibrant links with business. We celebrate the rich cultural diversity of our staff, students and all our partnerships.
The university’s vision is expressed in six strategic aims, supported by a series of specific goals that are detailed in the strategic plan:
1. We will develop an inspiring and supportive learning environment that transforms our students and inspires them to make a real difference in society
2. We will be a university that places research excellence and innovation at the heart of our mission
3. We will focus on employability and understand the needs of business and professions, so that DMU courses are relevant and give our graduates a head start
4. We will be a recognised leader in creative education and research, built on our reputation in the creative economy and driven by innovative projects across all faculties
5. We will be a truly international university, building influential global relationships to enrich our research, teaching and cultural collaboration
6. We will make a significant contribution to global efforts to achieve environmental sustainability
Quality and distinctiveness: how we implemented our strategic plan in 2013/14Throughout 2013/14, we have continued to make strong progress towards achieving our ambitions, as shown through the following thematic sections of our Operating and Financial Review and this summary.
A focus on quality and distinctiveness has underpinned our decision-making in 2013/14. We continue to offer a high-quality student experience that has been enhanced by a coherent and targeted employability strategy. This strategy has significantly improved the proportion of our students entering graduate-level employment in their chosen careers, from 64.5% in 2011/12 to 77.3% in 2012/13, and we expect to see this positive trend continue.
We have seen outstanding student recruitment this year, once again meeting our maximum student number control recruitment targets (including an increase of 296 places, allocated following our strong recruitment in 2013). This has not, however, been at the expense of quality. Overall, we expect to see our average tariff remain at around 300 points, the equivalent of three ‘B’ grades at A-Level. We have also grown our intake of high-achieving students (those achieving A-level grades ABB or equivalent), despite fierce competition for these candidates.
DMU has a strong reputation for the quality and relevance of our research. In 2013/14 research income held steady at £5.29m, in a difficult external environment. Our research projects deliver high-quality outcomes and impact; for example, the ‘Silent Films to Talkies’ project, awarded a grant of £466,000 by the Arts and Humanities Research Council, in which our researchers are investigating the massive cultural and economic impact of introducing talking pictures (‘talkies’) into British cinema. In addition, DMU eagerly awaits the results of the Research Excellence Framework (REF) 2014. Overall, our REF submission was of a similar size to 2008 but external reviews of outputs have predicted that we should see an increase in overall quality.
Internationally, our reach, impact and influence all continue to grow. We are the UK Government’s sole education partner for the GREAT Festivals of Creativity, which are designed to support the UK’s major export industries in key existing or emerging markets. DMU stands alongside BBC Worldwide, HSBC, PricewaterhouseCoopers and Jaguar Land Rover in being a GREAT partner.
OPERATING AND FINANCIAL REVIEW 2013/14

7
In autumn 2013, we launched the sector-leading #DMUglobal programme that seeks to give more than 11,000 students an international experience. Unlike many established study or work-abroad opportunities that rely on semester or yearly placements, #DMUglobal offers students the flexibility of placements of varying duration across the world.
To grow our internationalised student body further, we have established the Leicester International Pathway College with Oxford International Education Group. We expect to have circa 110 students on pathway courses in the first year and we are working hard to maximise the proportion that will remain at DMU for further study.
Our Annual Accounts show we delivered a surplus after sustained cost control and successful income growth. This will be reinvested into our student experience and provides a firm foundation on which to pursue our strategic ambitions. The Director of Finance’s commentary provides further detail.
In our Statement of Public Benefit, we outline how the university’s core services of teaching and research fulfil our obligation to deliver public benefit, and we also focus on our successful and award-winning community engagement Square Mile project.
2. THE UNIVERSITY’S STATEMENT OF PUBLIC BENEFIT
DMU is an exempt charity by virtue of the Charities Act 1993 and as such is regulated by the Higher Education Funding Council for England (HEFCE) on behalf of the Charity Commission for England and Wales. The university’s objectives as defined in the Education Reform Act 1988 are to ‘provide higher education’, to ‘provide further education’ and to ‘carry out research and to publish the results of that research’ for the public benefit. Members of the university’s Board of Governors serve as its trustees and is collectively responsible for determining the educational character and mission of the university and providing oversight and scrutiny of its activities.
When establishing the strategic direction of the university, the Board of Governors and the Executive Board give careful consideration to the Charity Commission’s general and supplementary guidance on public benefit and also to the guidance issued by HEFCE in its capacity as principal regulator on
behalf of the commission. We consider the beneficiaries of our charitable status to be all our students, both undergraduate and postgraduate, as well as members of the general public in the UK and overseas. All are recipients of the public benefit that we aim to deliver when fulfilling our charitable objectives.
DMU believes universities are a public good. DMU transforms lives by providing the inspiring environments our students and staff live and work in, and by sharing our discoveries for the wider benefit of society. DMU is a community in which all our staff and students learn, develop and contribute to society for the good of all.
Our research is central to this ethos. It enhances the quality of our teaching and serves the needs of society.
Ours is an international community where students and staff from diverse backgrounds and cultures learn from and enrich each other’s experiences. We always seek to treat with dignity, respect and integrity all those with whom we work and come into contact with.
DMU students and staff all contribute to a high-quality and distinctive academic experience, harnessing the best new approaches to learning and research. We equip our students with graduate skills and knowledge to support both their employability and broader lives. We deliver quality and add value in all that we do and understand and respond to the needs of business and the professions.
DMU promotes its vision by engagement and partnership locally, nationally and internationally. We are strongly committed to widening access to higher education and to supporting students from diverse backgrounds. We seek to communicate clearly and openly within the university, and beyond, and to listen carefully to what people say to us.
We encourage, in all our staff and students, an innovative and entrepreneurial attitude and approach to learning, research and business partnerships which enrich us and those with whom we work.

8
Square MileDMU’s pioneering Square Mile project is one of the university’s key public-benefit activities. It offers unparalleled opportunities for our wider community to draw upon the university’s academic expertise to improve health, education and job prospects in an area near the university campus. Many projects that make up the Square Mile project are embedded into degree coursework, ensuring hundreds of participating students gain skills which make them stand out in an increasingly difficult jobs market, as well as demonstrating palpably how the work of a university can sustainably support and develop communities.
When the Square Mile project was launched, residents identified four key areas in which they felt the work of the university could benefit them: offering skills to increase employability; delivering health services and support; increasing youth activities; creating a sense of community in the Square Mile Leicester neighbourhoods of Fosse, Newfoundpool and Woodgate.
In February 2014, DMU won the Outstanding Contribution to the Community Award in the Guardian University Awards. The judges acknowledged Square Mile’s record-breaking work with The Rik Basra Leukaemia Campaign, which encouraged people to sign up to the UK stem cell register. The stem cell project has not only broken the record for the single largest recruitment drive held by a university in the UK, it also now holds the record three times for the Anthony Nolan blood cancer charity’s biggest number of sign-ups in a single day. In total, the number of potential donors identified in events supported by Square Mile is 3,851 – that’s 3,851 chances to save lives.
Square Mile was also shortlisted by the Guardian for its Homework Club, which mobilises 200 DMU students to provide one-to-one mentoring and learning support for pupils in 17 schools in Leicester. So far two schools in the area that were previously classed as in special measures by Ofsted have now been classed as satisfactory and good due to the support of student mentors for pupils. Out of the 150 year-10 pupils receiving mentoring at one inner-city secondary school, 87% have seen an improvement in their attendance, 94% have seen an improvement in attainment for their mock GCSE scores in core subjects and of 25 pupils who were on report due to behavioural issues, 19 are no longer on report. Reading and spelling ages for around 80 struggling pupils have risen significantly. In one case a pupil saw her reading age increase by two years and her spelling age rise by seven years with the sole intervention of a Square Mile mentor.
The work of Square Mile is underpinned by the Executive Board’s commitment to position the university as a public good – a vital contributor to the social, political and economic wellbeing of the community in which it is based. The Square Mile project also links to the university’s commitment to widening participation in education.
In the sections which follow, key members of the university’s Executive Board show the university’s achievements under each of our six strategic areas, showing the ways public benefit is delivered in each case and particularly in our core activities of teaching and research. In this way, we seek to show that public benefit is embedded in our mission and vision.

9
The Square Mile project demonstrates how the work of a university can support and develop communities

10
Our courses are taught by passionate and enthusiastic lecturers. Our student-focused teaching is inspired by research and our research inspired by teaching.
We have 11 National Teaching Fellows working across the university, honoured by the Higher Education Academy in recognition of their innovative and transformational teaching. To date DMU has received 18 National Teaching Fellow Awards, the third-highest total nationally.
DMU Teaching Excellence Awards recognise the work of our outstanding lecturers and include the student-nominated Vice-Chancellor’s Distinguished Teaching Awards and the DMU Teacher Fellowship Scheme. Some 19 awards were announced during 2013/14.
DMU’s strong vocational curriculum is well aligned to the increasing national focus on graduate employability and continues to attract a wide spectrum of students. There was particularly strong interest from widening-participation applicants and from black and minority ethnic groups, reflecting the population diversity of Leicester and its environs.
The university’s teaching-quality indicators have improved steadily over the last five years. The strength of our curriculum in this period has led to a real improvement in the tariff points of our students upon entry, with the figure now around 300. Due to this continued improvement, the percentage of finalist undergraduates who achieve a 2:1 or above rose to 66.5% in 2012/13. We predict this percentage will continue to improve.
Teaching satisfaction scores measured by the National Student Survey (NSS) are high (85% of students were satisfied with their course in the 2013/14 NSS) and we anticipate they will improve further as a result of our focused learning-and-teaching improvement programme. This includes the development of faculty action plans, improvements in personal tutoring and the provision of more effective student feedback.
We are continuing to invest significant resources, underpinned by robust faculty-level action plans, to improve our retention rates, particularly those for our significant majority of Office for Fair Access-countable (OFFA) students. Recent analysis of our student population, for the university’s Access Agreement with OFFA, showed 79% of DMU students were from OFFA-countable groups and face some kind of educational disadvantage.
DMU’s increasing popularity was underlined when we were named among the handful of universities who met their HEFCE student recruitment target in 2013/14. This year we have responded to strong student demand in our most popular subjects, such as biomedical science, fashion design, game art and health studies, by doubling recruitment in these areas. Retention and progression rates are improving, as we invest in additional infrastructure and services to improve the student experience.
The DMU Student Charter was developed during 2011/12, in collaboration with our students. It signals the university’s commitment to working effectively with DSU in pursuit of outstanding student experience. This has been consolidated in 2013/2014 by the achievements of an ever-improving students’ union, which recorded its highest turnout at the annual officer elections, supported a record number of students engaged in societies and volunteering and reached its highest-ever British Universities and Colleges Sport league position.
DSU has continued to work with the university in improving the academic offer, most notably contributing to the ‘refresh’ of the personal tutoring system from 2013/14. A five-year programme of investment is in progress to upgrade student facilities, with the aim of providing a high-quality and distinctive student environment that supports both academic and co-curricular student activities around the clock.
The university is continuing to invest in its well-run and sustainable estate, and we have approved £118m of investment over the next five years, including a £58m refurbishment and rebuild of our art and design teaching facility to meet the demands of 21st-century students. Other significant projects include: creating ‘soft’ workspaces for students in the Hawthorn and other academic buildings; pedestrianising and greening Mill Lane, to provide a central green lung for our campus; the Campus Centre refurbishment; and the creation of the Hawthorn Heritage Centre.
The university innovates and develops new courses that meet the changing needs of our students and of employers. To complement the increasing focus on graduate employability, we are also delivering more programmes in partnership with business and other employers, including Hewlett Packard, Deloitte and KFC. A university-wide curriculum portfolio review led to the launch of the new Leicester Media School in August 2013. This brings arts and humanities media interests from the Faculty of Art, Design and Humanities together with media technology in a single school with 1,500 students and 150 staff.
We will develop an inspiring and supportive learning environment that transforms our students and helps them to make a real difference to society.
The University’s Six Strategic Aims

11
85% of students were satisfied with their course in the 2013/14 National Student Survey
12
The university has been engaged in a number of outstanding projects over the year, supported by external research grants and contracts.
Professor Martin Grootveld, of the School of Pharmacy, is undertaking research aimed at improving treatment for people with Hodgkin’s Lymphoma, a cancer affecting some 2,000 people every year in the UK. Treatment can involve radiation therapy, chemotherapy or stem cell transplants. Leicestershire charity Hope Against Cancer has funded work to identify new biomarkers, substances that indicate the presence of cancer within the body. Research finding and identifying biomarkers specifically linked to the development of Hodgkin’s allows monitoring of its spread and its response to medical treatment. This in turn will allow doctors to give patients a more accurate prognosis for their course of treatment and to identify those who will respond best to therapies.
Dr Andrew Wright, of DMU’s Institute of Energy and Sustainable Development, is part of the team behind the UK’s first purpose-built, fully solar-powered home, on the market with a price tag of £1.2 million. The five-bedroom Solar House, built in Great Glen by Caplin Homes, has been designed to exceed the requirements of the government’s 2016 zero-carbon target. The house collects enough solar energy to provide heating and hot water, and approximately twice the electricity needed to run the system. The Solar House uses an innovative combination of existing sustainable technologies to collect and store solar energy for use throughout the year. Stakeholders hope the Solar House will demonstrate to builders that zero-carbon house building is possible, affordable and economically viable.
In September 2013, the university was awarded its 100th Knowledge Transfer Partnership (KTP) by Innovation UK, with DMU graduate Anneliese Pugh appointed a KTP technical design assistant. The £84,000 project will see academics in the School of Fashion and Textiles working with the swimwear brand Curvy Kate to transform its business model and products. DMU has a long-established relationship with Curvy Kate, through its renowned lingerie design course, BA (Hons) Contour Fashion, regarded as one of the best in the world by industry experts. Graduates have gone on to work with designers including Tommy Hilfiger, Superdry and Triumph, as well as Curvy Kate, which supplies Next, ASOS, Debenhams and New Look.
Smart-grid technology is being used to improve electricity supply to communities in rural Brazil, thanks to a new research project supported by the US and UK governments and using
DMU expertise. The university is one of just 23 in the UK to receive a grant from the Global Innovation Initiative, which aims to use academic collaboration to address world issues. Professor Subhes Bhattacharyya, of DMU’s Institute of Energy and Sustainable Development, is the principal investigator, and the team proposes to increase the quality of supply available to communities through engineering analysis, educating communities on electricity supply and helping villages become energy independent. The project will also involve staff and student exchanges, to strengthen research collaboration among partners.
A DMU academic is exploring the influence of an art form which has millions of fans worldwide. Dr Tracy Harwood, of the Faculty of Art, Design and Humanities, is exploring the impact of the digital film-making technique Machinima, which uses 3D video-game technology to create original movies. The latest research project will be funded by the Arts and Humanities Research Council as part of its cultural values project, set up to examine the impacts of arts and culture on people and society.
DMU is helping bring the past back to digital life for visitors to the £4 million King Richard III Visitor Centre in Leicester, which opened in July 2014. Our acclaimed Digital Building Heritage Group, led by Dr Douglas Cawthorne, has digitally reconstructed Richard III’s lost tomb and Grey Friars Church, the Franciscan medieval priory where his body lay after defeat at the Battle of Bosworth. The group created an animation, using computer-generated imagery, which is shown on a big screen at the centre of the exhibition called Dynasty, Death and Discovery.
Schoolchildren are enjoying new reading experiences, thanks to an exciting arts project headed by Dr Craig Vear of the Performance Research Group at DMU. Pupils at Mellor Primary School in Leicester are reading Michael Morpurgo’s War Horse and using digital technology as they learn. Special effects create trenches and battlefields and a digital reproduction of the horse itself. By doing this, it is hoped that children will become more immersed in the book. Dr Vear is working with Spark Arts for Children and digital artist Luke Woodbury on the project, called Pop-Up Play, which has been given £103,651 from the Digital R&D Fund for the Arts.
A spin-off company from DMU’s School of Pharmacy has been named East Midlands Start Up of the Year. CYP Design, which helps support drug discovery research, received the award at this year’s Medilink East Midlands Awards. The company was set up to commercialise
We will be a university that places research excellence and innovation at the heart of our mission.

13
technology developed by DMU Professor Bob Chaudhuri, whose work aims to make the discovery and creation of new drugs easier and cheaper. CYP Design aims to develop new products and services based on a set of proteins, called cytochrome P450s, or CYPs.
The proteins, found in the human liver, are mostly responsible for metabolising drugs. Crucially, they can help researchers quickly identify chemical compounds that are promising for drug development but may be toxic to humans. The technology invented by Professor Chaudhuri will allow
scientists to use the proteins at room temperature and automate toxicity testing.
The artificial pancreas created by DMU Professor Joan Taylor won the inaugural Gadget Show Live British Inventor of the Year award. The device, developed in collaboration with Renfrew Group International, a medical technology company, aims to ensure that patients will no longer have to endure injections of insulin every day. Human trials are due to begin in 2016 with the first implants taking place on the NHS within a decade.
The university was awarded its 100th Knowledge Transfer Partnership by Innovation UK
14
We will focus on employability and understand the needs of business and the professions, so that the university’s courses are relevant and give our graduates a head start.
DMU has created many innovative employability-support schemes for students and graduates since 2012/13. This has significantly improved our Destinations of Leavers from Higher Education (DLHE) survey performance, and our subsequent employability league table position rose from 128th (out of 151) in 2011/12 to 46th (out of 154) in 2012/13, the most recent DLHE survey results available. DMU is also in the top 15 institutions for performance against our Higher Education Statistics Agency (HESA) benchmark, with employability performance being 3.6% above HESA expectations.
DMU graduates continue to enter into a huge variety of occupations on leaving the university, going on to work for organisations such as the BBC, Warner Bros, Porsche, Sky TV, Dyson, Nike, GlaxoSmithKline and NASA, while others choose further study or set up their own businesses.
Autumn 2013 saw DMU launch the Graduate Champions initiative, where recent graduates were invited to take up short-term, paid internships with local, regional, national and international organisations. More than 260 graduates were placed with businesses and gained vital work experience. Positive feedback from all involved has seen the programme continue into 2014/15.
DMU has continued to support local small and medium-sized enterprises through the Benefiting Business programme. This scheme is supported by the European Regional Development Fund and encourages local employers to work with DMU to recruit interns. More than 40 graduates have been placed with employers since the scheme started in June 2013.
DMU recognises the importance of building networks as a way of developing employability for students. The Employability Mentoring project aims to recruit industry mentors to support students by offering practical advice and guidance. Feedback is positive, especially around aspiration building and employability awareness. The first mentoring partnerships were established as part of GraduatePlus in summer 2014, with 67 industry representatives signalling an interest in the programme and almost 50 students or graduates signing up.
DMU’s Frontrunners Internship Scheme has offered 565 opportunities to students since its launch in 2012. These paid internships are key to student retention, development and confidence-building and give participants vital experience to include on their CVs as they enter the ferociously competitive graduate jobs market.
The university continues to operate its own recruitment agency, Unitemps, as a way of offering work experience and the opportunity to earn while studying. Use of Unitemps internally and externally continues to grow; more than £1.3m was redirected by DMU departments to support students and graduates through Unitemps in 2013/14, a cost-saving of 20% compared to using external agencies. Between August 2013 and the end of July 2014, in excess of 113,000 hours were recorded by Unitemps candidates.
DMU continues to have an active student and graduate enterprise programme with the Campus Enterprise Opportunities team running initiatives such as start-up bursaries and the Business Venture Competition. Some 32 graduates successfully completed the funded Enterprise Inc scheme, with another 24 selected to join the programme in 2014/15.
DMU has run a number of specialist programmes to support students and alumni with their career development. The Graduate Plus residential employability coaching course ran during June and July 2014, with more than 80 graduates undertaking a three-day programme of development activities. The Graduate Plus scheme is supported by external partners and employers and has proved very popular. It will be repeated in 2014/15. In addition, the university ran a programme for undergraduates in November 2013 called Grad2Hire. This scheme supported second year students looking to apply for placement programmes and graduate schemes, and made use of external providers working alongside the Careers Guidance team.
Between 1 August 2013 and 31 July 2014, the university’s online job shop, DMU Works, published 3,000 vacancies for students and graduates. Since summer 2013, the Careers and Employability team, supported by Information Technology and Media Services, has been working on new careers-management software for students, staff, graduates and employers. The MyGateway portal, launched on 1 September 2014, brings together appointment bookings, events management, online resources and a jobs board in one system for the very first time at DMU.
DMU’s new partnership with business advisory firm Deloitte has led to the creation of an MSc in Cyber Security. This collaboration, the first of its kind in the UK, brings together world-class experts at DMU’s Cyber Security Centre and Deloitte’s industry specialists to provide the next generation of highly-trained security professionals, protecting businesses and individuals from cyber-attacks.

15
The university’s DSU Volunteering service works with 280 local organisations and charities and this year students have been involved in more than 240 projects and events. These range from mentoring young people in care, helping children to read, and supporting and building friendships with elderly people. Students have also taken part in an arts and crafts day with a local residential home, arranged workshops at a local hospital school and created artwork for a women and children’s refuge.
This year, DMU students have again broken their record for the number of hours volunteered in the local community, increasing the previous total by more than 9,000 hours. It means some 28,000 hours have been logged since last summer by DSU Volunteering. This year has also seen more students signing up, taking the total number of student volunteers to 2,400.
The year 2013/14 saw continued expansion by Careers and Employability. Employability hubs were set up in all four faculties, while a new Work-Based Learning Unit was opened in the Faculty of Art, Design & Humanities, to complement the work on the existing units in the other faculties. This increased visibility helps deliver a message that employability development is something students should be aware of from day one at DMU. More than 10,000 individual student interactions were delivered by the Careers Advisory Team, and almost 3,000 placements were secured by the work-based learning teams.
Following reconfiguration of our university calendar, more opportunities for students to engage formally in careers and employability activities outside the normal teaching timetable were implemented in 2013/14. The provision of a non-timetabled break week in the autumn and spring terms enabled us to run employability weeks, to run again in 2014/15.
The most recent DLHE survey results place DMU in the top 50 institutions for employability
16
We will be the recognised leader in creative education and research, built on our reputation in the creative economy and driven by innovative projects across all faculties.
DMU is ranked among the most creative universities by ‘Which? University?’ Our commitment to creative subjects is exemplified by their inherent connection to the ongoing campus transformation, which will significantly improve the facilities available to students of the arts, architecture and design. In addition to purpose-designed studios, workshops, seminar rooms and lecture theatres, the new building will house a digital arts centre.
Our close relationships with arts and creative organisations continue. DMU was commissioned to develop a Creative Leadership Programme for Leicester and enjoys fruitful partnerships with Phoenix cinema, Curve theatre and Dave’s Comedy Festival, among others. These links offer students excellent opportunities, including internships, access to artists and the chance to show their work in professional environments.
In addition to hosting our annual University Dance Festival, Curve supported an exhibition curated by the Fine Art Society and produced Mark Ravenhill’s Mother Clap’s Molly House, featuring a cast of DMU students.
Dave’s Comedy Festival, founded at DMU by a student 21 years ago, saw academic staff take part in Bright Club. This used their research as material for stand-up comedy. DMU also hosted Playing for Laughs, a series of talks and workshops looking at how comedy can be used to engage and support communities.
The Leicester Centre for Creative Writing was established at DMU. Readings were held at venues across Leicester featuring the work of local writers, students and staff.
The Centre for Photographic History welcomed Dr Brian May and his colleagues for a lecture on the Victorian stereoscopic photography craze known as Diableries. Melvyn Bragg and DMU alumnus David Shrigley, a Turner Prize nominee, contributed to the annual Cultural Exchanges Festival, organised by Arts and Festival Management students.
DMU students and graduates won many awards and accolades during the year. Architecture graduate Tom Bush received a Royal Institute of British Architects’ President’s Medals Student Award commendation; contour fashion graduate Nichole de Carle saw her designs worn by Beyoncé at the Grammy Awards; and product design graduate Lee Clarke won the Pertainers UK Holdings Award.
Staff and students from the School of Design worked with the Jewry Wall Museum to develop the Virtual Romans app, which brings to life Leicester’s Roman heritage. Professor Gabriel Egan and his colleagues published their work on the Shakespeare London Theatres Project, which included a website, interactive walking map, app and documentaries. A Knowledge Transfer Project with McCue International used DMU’s Design Unit expertise to improve safety in retail warehousing and an Arts and Humanities Research Council grant helped create an oral history of England international rugby union players, led by Professor Tony Collins.

17
DMU enjoys fruitful partnerships with Phoenix cinema, Curve theatre and Dave’s Comedy Festival

18
We will be a truly international university, building influential global relationships to enrich our research, teaching and cultural collaborations.
People from more than 130 nations currently study at DMU and our staff members are from 75 nations.
DMU’s vision centres on being a truly international university of quality and distinctiveness which exposes students, staff and partners to the many benefits a global perspective brings. International student recruitment, excellence in research, and greater experience and opportunities for students and staff are key objectives.
The university’s international recruitment strategy is founded on the principle of forging long-term, mutually beneficial partnerships with high-quality institutions. The partnerships forged with Chinese universities and organisations make China the most significant market for the university. In 2014/15, as in 2013/14, the university is expecting to enrol more than 600 Chinese students. DMU has Chinese regional offices in Beijing, Nanjing and Guangzhou to support local engagement with students, universities, government departments and educational partners.
A significant partnership, finalised in autumn 2013, was the agreement with Oxford International Education Group to inaugurate Leicester International Pathway College (LIPC) on the DMU campus. LIPC provides alternative routes into higher education for international students who need additional specific academic or English language support. LIPC opened its doors in June 2013 with the aim of attracting 110 students in 2014/15, the majority of whom are expected to progress on to DMU programmes the following cycle.
Another major international venture launched in 2013/14 was #DMUglobal, which aims to offer 11,000 of our students a valuable international experience over the next five years. The programme aims to enrich students’ studies and expand their cultural horizons – helping them to become global graduates, equipped to meet the needs of employers across the world.
Through #DMUglobal, the university now offers a wide range of opportunities including on-campus and UK activities, overseas study, internships, faculty-led field trips and volunteering, as well as Erasmus+ and international exchanges.
As part of DMU’s dedication to providing an unrivalled student experience and excellent employability, #DMUglobal is set to become the most comprehensive
international experience programme available at any UK university. Supported by British Airways, and harnessing DMU’s worldwide network of industry and education partners, the programme is creating opportunities accessible to all, ensuring that the majority of our students enjoy the benefits of a global experience during their studies.
Initial activities formed part of a pilot and included work placements at the FIFA World Cup, field trips to Brazil, China and Gambia and internships in DMU’s Beijing and Delhi offices. In 2014/15, activities will form part of the full programme and include faculty-led field trips to the USA, Hong Kong, Netherlands and France and international study in India and South Korea. Students can also join international experience initiatives and courses across the UK and on campus, including with our Careers and Employability team and Confucius Institute – helping students to gain important cultural, language and global leadership skills.
May 2014 saw DMU participate in the UK government’s GREAT Festival of Creativity, in Istanbul, as the event’s sole education channel partner. The ongoing purpose of this high-profile initiative is to showcase the dynamic relationship between British creativity and commerce to a global audience. DMU specialisms in the spotlight included the Professor Joan Taylor-created artificial pancreas, holographic design, footwear design and game art design. DMU will participate at festivals in Hong Kong and Shanghai in 2014/15.
DMU opened a Confucius Institute (CI) in October 2013, in partnership with the Sunwah Group and the University of Science and Technology Beijing. The CI is a creative centre for promoting Chinese culture and learning and is used by both DMU and the wider local community, including local schools.
International recruitment reached a record level in 2013/14, with more than 1,170 new enrolments, and 2014/15 recruitment is expected to meet the target of 1,262. This will have been achieved through improved performance in key markets such as India, Nigeria, Saudi Arabia and Brazil, providing diversification from the historical key market of China.
From India, a market which halved in size for recruitment by UK universities over the two years to 2012/13, we have seen resurgence in recruitment as a result of a focused presence in Delhi and Cochin. Engagement in Brazil has continued on several levels.

19
More than 110 Brazilians joined DMU in 2013/14 as part of the Brazilian government’s Science Without Borders (SWB) scheme and 128 enrolled in September 2014. The SWB programme will continue for the September 2015 intake, its future beyond that date is dependent on the results of elections in Brazil this year. DMU also
showcased a number of academic activities, including sports history and fashion, in a series of events in Sao Paulo surrounding the 2014 FIFA World Cup. To support recruitment, partnership and corporate event activity in Brazil, DMU opened an office in the British Centre in Sao Paulo in November 2013.
DMU’s vision centres on being a truly international university, exposing students, staff and partners to the many benefits a global perspective brings

20
We will make a significant contribution to global efforts to achieve environmental sustainability.
DMU continues to develop a real-world approach to sustainability through the management of its buildings, through its innovative research and by providing volunteering opportunities for students.
The university has very ambitious plans for its estate through the campus transformation programme. This has already begun, with the installation of photovoltaic panels on the roofs of three of its buildings. The 502 panels, installed at a cost of £180,000, will generate electricity for use within the DMU campus, reducing energy costs and our carbon footprint.
The university has also gained external recognition for its work on environmental management. DMU achieved Phase 3 status in the Acorn scheme for environmental management, which is awarded to organisations that can demonstrate that they are managing and reducing their environmental impacts through the implementation of an environmental management system (EMS). The introduction of an EMS at DMU is a key part of the university’s strategic plan and our ambition to be a sustainable university.
The university continues to make good progress in encouraging our staff and students to choose greener travel. Analysis of the annual Travel Survey results showed the lowest-ever percentage of staff single-occupancy car drivers (40%) and the highest-ever percentage of walkers (17%).
We have successfully encouraged more staff members to start cycling to DMU by continuing with our policy of providing free loans of bike lights and locks, free puncture-repair kits and high-visibility clothing, and by reintroducing a salary-sacrifice scheme to help staff to buy a cycle tax-free. It means 12% of DMU staff commuting to work do so by bike, approximately four times the national average.
We are also supporting our students in their travel choices through the provision of cycling facilities, cycling equipment and promoting discounted travel offers with public transport operators. Our students continue to make greener travel choices, with the majority of them travelling to DMU by public transport, walking or running. This helps to reduce the environmental impact of staff and student commuting as well as reducing the university’s carbon footprint.
As well as embedding sustainability within the management of our estate, the university continues to deliver ground-breaking research in the field of sustainability. Our researchers have won an award for designing technology that will reduce household energy bills. Dr Peter Boait and Richard Snape, of DMU’s Institute of Energy and Sustainable Development (IESD), invented the device, called Hestia, which takes the pressure off the national grid by scheduling electric heating appliances so that overall demand is levelled out and best use is made of electricity from wind and solar generators, without compromising comfort. DMU’s consortium, which included Co-operative Energy and the University of Oxford, won a prestigious Technology Strategy Board award. Hestia won its inventors £50,000 after it took the top prize in a national competition, the Dynamic Design Challenge. Hestia and other IESD innovations will be trialled in 50 homes in 2015-16.
The university also provides opportunities for our students to develop new skills and experiences in extracurricular sustainability activities. Through Green Impact, a project that DMU runs with the National Union of Students, our students have been working with the Leicestershire charity LOROS to help deliver behaviour-changing projects that encourage environmentally-friendly behaviour in the workplace. Our students have also been working with Leicestershire County Council on its Green Impact projects and with our own DMU staff on theirs.

21
502 photovoltaic panels on the roofs of three buildings will generate electricity for use within the DMU campus, reducing energy costs and our carbon footprint

22
a. Forecast recruitment of overseas students: the financial forecast reflects the work undertaken to date on our International Strategy, with forecast growth in student numbers from 2014/15 to 2018/19, supported by our partnership agreements. The university’s international student population is currently 11%, and is forecast to increase significantly. Although a challenging strategy – founded on the need to grow – with risks such as the number of international students choosing to study in the UK, and the ability to remain compliant to updates in UK border policy, our proactive approach to international recruitment and partnerships has positioned us well to achieve this plan.
b. Increased competition in the sector: the removal of the student number control limit in 2015/16 provides both an opportunity for growth and the risk of decline in student recruitment. The delivery of our strategic initiatives, and the promotion of our distinctive offerings and initiatives, will be critical to ensuring strong recruitment performance and the university’s continued academic and financial sustainability.
c. Further reductions in government funding: the financial forecast reflects the impact of anticipated cuts to the university’s HEFCE grant funding in 2015/16 and future anticipated cuts. There remains the risk, though, that cuts in government funding could be deeper, with the need to deliver further concomitant efficiencies.
d. Impact of the current funding regime on the full-time postgraduate student body: it is important to acknowledge the potential impact of the new funding regime on postgraduate recruitment, as existing undergraduates complete their studies with significant levels of debt. DMU has taken immediate action to mitigate the risk and this cycle, following the introduction of a generous scholarship award for finalists and alumni (the Vice-Chancellor’s 2020 Scholarship), we have witnessed an 18% increase in Domestic Postgraduate Taught acceptances. This has also driven a 2% increase in our employability score. The ongoing review of our postgraduate portfolio and the VC2020 scholarships will be critical to sustaining our position in this market.
3. CONCLUSION: THE FUTURE YEAR – OPPORTUNITIES AND RISKS
The university is well positioned for the opportunities and risks of the current higher education environment and those that may arise in future years. We proactively monitor and review a corporate risk register to provide alignment with the six strategic aims outlined above, and their associated key performance indicators. There are risk registers at a faculty and directorate level, which form an integral component of the annual planning exercise. As part of this work, four key opportunities and risks were identified:

23
Our exceptional employability initiatives, transformational student experience and quality courses make DMU a hugely rewarding place for current students to study and a compelling choice for potential students

24
4. FINANCIAL PERFORMANCE IN 2013/14
The university’s financial performance for 2013/14 delivers a significant surplus following sustained cost controls and successful income growth, despite the challenges faced by the sector in respect of reduced government funding and an increasingly competitive market.
Results for the yearThe university’s income and expenditure results for the year ended 31 July 2014 are summarised as follows:
Income analysisThe university’s income and expenditure results for the year ended 31 July 2014 are summarised as follows:
2013/14 £’000
2012/13 £’000
Income 160,786 152,655
Expenditure 151,695 155,247
Surplus/(deficit) on continuing operations 9,091 (2,592)
Taxation (90) (296)
Surplus/(deficit) after taxation 9,001 (2,888)
(Loss)/surplus on disposal of tangible fixed assets (5) 4,470
Surplus on continuing operations after exceptional items 8,996 1,582
Transfer from endowments 196 224
Difference between historical cost depreciation and actual depreciation charge 4,254 7,793
Historical cost surplus for the year 13,446 9,599
The university has achieved a surplus on continuing operations of £9.1m in the financial year 2013/14. This healthy surplus enables the university to increase its reserves, pay for vital capital investment and invest in the student experience and our staff.
Total income of £160.8m increased by £8.1m (5.3%) from 2012/13.
There were significant movements within the individual income categories due to the reduction in funding council grants of £10.8m (25.6%) and the increase in academic fees and education contracts of £20.9m (22.1%), as a direct result of the second year of reduced government funding and increase in student fees in the higher education sector.
Income Analysis 2013/14
Academic Feesand Education
Contracts71.8%
Other Operating
Income 4.9%
Research Grantsand Contracts
3.3%
Funding CouncilGrants19.5%
Endowment Incomeand Interest
0.5%

25
Expenditure analysisTotal expenditure of £151.7m reduced by £3.6m (2.3%) from 2012/13.
• Staff and staff restructuring costs reduced by £2.4m, reflecting lower restructuring costs in 2013/14
• Depreciation charges of £14.8m reduced by £1.6m (10%), reflecting a review of remaining asset lives
• Other operating expenses increased by £0.7m, reflecting marketing investment
Balance sheet The university’s consolidated group balance sheet at 31 July 2014 reports total net assets prior to the impact of accounting for pensions of £261.7m, an increase of £9.2m from 2012/13. This reflects the following items:
• Fixed assets of £273.0m increased by £3.7m (2012/13: £269.3m). The university invested £18.5m in new fixed assets during 2013/14, of which £9.3m was for IT transformation and £8.5m was for buildings and major works, including the Hawthorn facility refurbishment and the start of a major investment in the Fletcher Complex for Creative Arts. This was offset by the depreciation charge of £14.8m
• Current assets increased by £7.4m due to growth in cash and investments
• An increase in creditors of £1.8m, due to the timing of IT projects and a marketing campaign
Expenditure Analysis 2013/14
Income and Expenditure Reserves
Liquidity and reserves The level of income and expenditure reserves has increased by £13.8m to £109.4m, continuing a positive trend as a result of the favourable operating position.
This reflects the increase in cash and investments during the year of £7.7m, which continues to ensure that the university has a strong liquidity position to enrich the student experience, with programmes such as #DMUglobal and DMU Graduate Champions.
Depreciation9.8%
RestructuringCosts1.3%
InterestPayable
3.7%
Other OperatingExpenses
29.1%
Staff Costs56.1%
80.6m82.7m
85.7m
95.6m
109.4m
70
75
80
85
90
95
100
105
110
115
2009/10 2010/11 2011/12 2012/13 2013/14
Income and Expenditure Reserves

26
STATEMENT ON CORPORATE GOVERNANCE
CORPORATE GOVERNANCEThis statement outlines for readers of the financial statements the corporate governance procedures adopted by the Board of Governors.
The Board of Governors recognises that, as a body entrusted with both public and private funds, it has a particular duty to observe the highest standards of corporate governance at all times and to ensure that it discharges its duties with due regard for the proper conduct of a publicly-funded business. In carrying out its responsibilities, the Board of Governors is committed to demonstrating best practice in all aspects of Corporate Governance and complies with the Committee of University Chairs (CUC) Governance Code of Practice and Principles published in November 2004 and of the requirements of the Charities Act 2006 (as amended) and the Charities Act 2011.
SUMMARY OF THE UNIVERSITY’S STRUCTURE OF CORPORATE GOVERNANCEThe university’s objectives, powers and framework of governance are set out in its Instrument and Articles of Government. Under the Articles of Government, the Board of Governors has a range of powers and duties, including the ongoing responsibility for the strategic direction of the university, approval of major developments, approval of annual estimates of income and expenditure, ensuring solvency of the institution and safeguarding its assets.
It is a requirement of the Instrument of Government of the corporation that there should be a majority of board members who are non-executive and independent; and that the board should comprise no less than 12 and no more than 25 members (including the Vice-Chancellor ex-officio). Currently the board has a total of 17 members (including the Chancellor and the Vice-Chancellor ex-officio), 12 of whom are independent governors as defined under the articles together with one co-opted external governor. The remaining two members of the Board of Governors include representatives of the Academic Board and the student body. The university has a number of vacant posts to fill should it wish to broaden the depth of its membership which is actively considered at the Nominations Committee each year.
The principal officer is the Vice-Chancellor, who has responsibility to the Board of Governors for the organisation, direction and management of the university. He is also the designated Accountable Officer for the purposes of the Financial Memorandum with the Higher Education Funding Council for England. The Vice-Chancellor is supported by an Executive Board comprising the Deputy Vice-Chancellor, the Pro Vice-
Chancellor for Research and Innovation, the Pro Vice-Chancellor for Teaching and Learning, the Pro Vice-Chancellors/Deans of the respective faculties, the Pro Vice-Chancellor for International, the Chief Operating Officer, the Executive Director of Student and Academic Services, the Executive Director of Marketing and Communications, the Executive Director of Finance, the Executive Director of Estates and Commercial Services, the Executive Director of Strategic Planning Services, the Executive Director of People and Organisational Development and the Vice-Chancellor’s Chief of Staff.
CONDUCT OF BUSINESSThe Board of Governors is responsible for, amongst other matters, the determination of the educational character and mission of the university and for the general oversight of its activities. It approves the university strategy, which supports and informs the setting of the strategic and other priorities for the next year. In the conduct of its formal business and in addition to the strategic away day when required, the board meets four times a year. It has a number of formally constituted committees – Audit, Finance and Human Resources, Nominations, and Remuneration, each of which has clearly defined, delegated responsibilities.
The Audit Committee regularly meets the external and internal auditors through their attendance at each meeting of the committee. The Audit Committee considers internal audit reports and recommendations for the improvement of the university’s systems of internal control, together with management’s responses and implementation plans. It also receives and considers reports from the Higher Education Funding Council for England (HEFCE) as they affect university business, monitors adherence with regulatory requirements and discusses the results of the external audit process with the auditors. The terms of reference of the Audit Committee incorporates its role in monitoring, and reporting upon, the effectiveness of the university’s risk management, data management quality, and value for money processes and procedures. While senior executives attend meetings of the Audit Committee as necessary, they are not members and the committee may meet the internal and external auditors on their own for independent discussions.
The Finance and Human Resources Committee, inter alia, recommends to the Board of Governors annual revenue and capital budgets, and monitors performance in relation to the approved budgets. The committee also reviews and recommends to the board, the University Financial Regulations, financial policies and the annual financial statements. It reviews the accounting policies that are applied to the preparation of the financial statements and to budgets and estimates, including any significant matters of judgement that require consideration, and meets with the external auditors to discuss the financial statements.
27
It determines matters in relation to the conditions of employment of all university staff and has oversight of the implementation and operation of change management policies as they affect staff employment and of management training and development. It also has oversight of the university’s compliance with legislation relating to diversity and equality as it relates to, and impacts on, not only staff, but also students and other parties.
The Nominations Committee reviews the membership of the board, advising on the skills mix available and that required by the board to fulfil its responsibilities. It considers nominations of new external Governors, making recommendations to the Board of Governors.
The Remuneration Committee determines the annual remuneration of the Vice-Chancellor and members of his senior staff, and receives a report on the annual review of other senior academic and support staff that is conducted by the Vice-Chancellor in consultation with the Director of People and Organisational Development and Operations.
All committees of the board are required to report to the Board regularly. They do this in a variety of ways, including the formal presentation of their minutes at board meetings, with key matters being reported through to the board as substantive agenda items for wider discussion. In addition, the Audit Committee produces an annual report, which is also sent to the HEFCE Audit Assurance Service. The Vice-Chancellor also provides a report on the broader operation of the university at each board meeting. Members of the Executive Board are also present at meetings of the Board of Governors where necessary to expand on reports as appropriate and answer any other questions which may arise.
The Board of Governors periodically reviews its own effectiveness in accordance with good practice/CUC guidance; the last review was completed in January/February 2011. Newly-appointed Governors are encouraged to participate in an individual induction programme, tailored to their specific needs and experience. Additionally, all Governors are provided with the details of seminars and conferences for Governors offered by organisations such as HEFCE and the Leadership Foundation and are encouraged to be proactive in identifying opportunities for other training or support. In relation to the conduct of board business, there is considerable opportunity for Governors to request additional information through Board Committees, through the board itself and via the Clerk to the Board.
FINANCIAL RESPONSIBILITIES OF THE UNIVERSITY’S BOARD OF GOVERNORSIn accordance with the university’s Articles of Government, the Board of Governors is responsible for the oversight of the administration and management by the Executive Board of the affairs of the university and is required to present audited financial statements for each financial year.
The Board of Governors is responsible for keeping proper accounting records which disclose with reasonable accuracy at any time the financial position of the university and enable it to ensure that the financial statements are prepared in accordance with the university’s Articles, the Statement of Recommended Practice on Accounting in Higher Education Institutions and other relevant accounting standards. As a Higher Education Corporation, the board, through its designated Accountable Officer, produces financial statements for each financial year, which give a true and fair view of the state of affairs of the university and of the surplus or deficit and cash flows for that year. These statements are also submitted to HEFCE, under the terms and conditions of the Financial Memorandum agreed between the Funding Council and the university.
In causing the financial statements to be prepared, the Board of Governors has ensured that:
• Suitable accounting policies are selected and applied consistently
• Judgements and estimates are made that are reasonable and prudent
• Applicable accounting standards have been followed and subject to any material departures, disclosed and explained in the financial statements
• Financial statements are prepared on the going concern basis.
The Board of Governors has taken reasonable steps to:
• Ensure that funds from HEFCE are used only for the purposes for which they have been given and in accordance with the financial memorandum with the funding council and any other conditions which the funding council may from time-to-time prescribe
• Ensure that there are appropriate financial and management controls in place to safeguard public funds and funds from other sources
• Safeguard the assets of the university and prevent and detect fraud
• Secure the economical, efficient and effective management of the university’s resources and expenditure.

28
INTERNAL CONTROLThe key elements of the university’s system of internal control, which is designed to discharge the financial responsibilities of the Board of Governors include:
• Clear definitions of the responsibilities of, and the authority delegated to, senior officers of the university
• A comprehensive short and medium-term planning process, supplemented by detailed annual income, expenditure, capital and cash flow budgets
• A regular review of academic performance and regular reviews of financial results involving variance reporting and updates of forecast out-turns
• Clearly defined and formalised requirements for approval and control of expenditure
• Procedures for the management of investment and risk
• Comprehensive Financial Regulations, detailing financial controls and procedures
• A professional internal audit service whose annual programme is approved by the Audit Committee
On behalf of the Board of Governors the Audit Committee reviews the effectiveness of the university’s system of internal control.
RISK MANAGEMENTThe Board of Governors recognises that effective risk management is an essential element in the framework of good governance and has continued to develop its risk management systems taking full account of the HEFCE Accounts Direction and good practice guidance.
The university’s risk management approach complies with the HEFCE Accounts Direction, and also reflects the guidelines provided by the Turnbull Committee.
The system of internal control adopted by the Board of Governors is designed to manage, rather than eliminate, the risk of failure to achieve policies, aims and objectives; it can therefore only provide reasonable, and not absolute, assurance of effectiveness. It is based on an ongoing process designed to identify the principal risks to the achievement of policies, aims and objectives and the development of policy and strategy; to evaluate the nature and extent of those risks; and to manage them efficiently, effectively and economically.
In the last academic year, the university has put in place a new risk assurance framework, focused around the university’s key strategic and operational risks, that was built on the following principles:
1. The risks in the strategic risk register should flow from the Strategic Plan and Key Performance Indicators (KPIs) and should be considered as an integrated part of the institutional performance management process
2. The risks should be high level and few and manageable in number to enable Executive Board to focus on the major risks that require its attention
3. The risks should be embedded in and useful to Executive Board’s normal business rather than being seen as a separate exercise in their own right
4. Clear Executive Board-level accountability for each individual risk should be assigned
5. Scoring risk should be a matter of judgment and incorporate the full range of information available to risk owners, rather than a quantitative exercise; and
6. The risk register should be seen as an evolving document and not set in stone. As such it should be reviewed on an annual basis by the Executive Board
The framework is owned by Audit Committee on behalf of the Board of Governors, with reports flowing from Executive Board to Audit Committee on a biannual basis in October and March. Executive Board receives quarterly updates to the risk register, the contents of which are owned by relevant Executive Board members. The Director of Strategic Planning is the university’s lead officer for risk management. The board reviews an annual risk report at its September strategic away day and ensures that the register reflects the key strategic risks faced by the university. Should changes be required through the year because of a major internal or external unforeseen event, then Executive Board makes recommendations to Audit Committee to approve the change on behalf of the Board of Governors.
This process has been cascaded into the university’s faculties and directorates, ensuring that there is a consistent and aligned approach to risk management through which risks are managed at the most appropriate level in the institution.
GOING CONCERN STATEMENTAfter making enquiries, the Board of Governors has a reasonable expectation that the university has adequate resources to continue in operational existence for the foreseeable future. For this reason, it continues to adopt the going concern basis in preparing accounts.

29
We have audited the group and university financial statements (the ‘‘financial statements’’) of DMU for the year ended 31 July 2014 which comprise the Consolidated Income and Expenditure Account, the Group and University Balance Sheets, the Consolidated Cash Flow Statement, the Statement of Group Total Recognised Gains and Losses and the related notes. The financial reporting framework that has been applied in their preparation is applicable law and United Kingdom Accounting Standards (United Kingdom Generally Accepted Accounting Practice).
This report is made solely to the Board of Governors, in accordance with paragraph 13(2) of the university’s Articles of Government and section 124B of the Education Reform Act 1988. Our audit work has been undertaken so that we might state to the Board of Governors those matters we are required to state to it in an auditor’s report and for no other purpose. To the fullest extent permitted by law, we do not accept or assume responsibility to anyone other than the Board of Governors for our audit work, for this report, or for the opinions we have formed.
Respective responsibilities of the Board of Governors and auditorAs explained more fully in the Statement on Corporate Governance of the Board of Governors set out on page 26 the Board of Governors is responsible for the preparation of financial statements which give a true and fair view. Our responsibility is to audit, and express an opinion, on the financial statements in accordance with applicable law and International Standards on Auditing (UK and Ireland). Those standards require us to comply with the Auditing Practices Board’s Ethical Standards for Auditors.
Scope of the audit of the financial statementsAn audit involves obtaining evidence about the amounts and disclosures in the financial statements sufficient to give reasonable assurance that the financial statements are free from material misstatement, whether caused by fraud or error. This includes an assessment of: whether the accounting policies are appropriate to the group’s and university’s circumstances and have been consistently applied and adequately disclosed; the reasonableness of significant accounting estimates made by the Board of Governors; and the overall presentation of the financial statements. In addition, we read all the financial and non-financial information in the Annual Report to identify material inconsistencies with the audited financial statements and to identify any information that is apparently materially incorrect based on, or materially inconsistent with, the knowledge acquired by us in the course of performing the audit. If we become aware of any apparent material misstatements or inconsistencies we consider the implications for our report.
INDEPENDENT AUDITOR’S REPORT TO THE BOARD OF GOVERNORS OF DE MONTFORT UNIVERSITY
Opinion on financial statementsIn our opinion the financial statements:
• give a true and fair view of the state of the affairs of the group and university as at 31 July 2014 and of the group’s income and expenditure, recognised gains and losses and cash flows for the year then ended
• have been properly prepared in accordance with United Kingdom Generally Accepted Accounting Practice
• have been prepared in accordance with the Statement of Recommended Practice – Accounting for Further and Higher Education
Opinion on other matters prescribed in the HEFCE Audit Code of Practice issued under the Further and Higher Education Act 1992
In our opinion, in all material respects:• funds from whatever source administered by the
university for specific purposes have been properly applied to those purposes
• income has been applied in accordance with the university’s statutes
• funds provided by HEFCE have been applied in accordance with the financial memorandum and any other terms and conditions attached to them
Matters on which we are required to report by exception We have nothing to report in respect of the following matter where the HEFCE Audit Code of Practice issued under the Further and Higher Education Act 1992 requires us to report to you if, in our opinion:
• the statement of internal control included as part of the Corporate Governance Statement is inconsistent with our knowledge of the university and group.
Michael Rowley For and on behalf of KPMG LLP, Statutory Auditor Chartered Accountants One Snow Hill Snowhill Queensway Birmingham B4 6GH
a. The maintenance and integrity of the DMU website is the responsibility of the governing body; the work carried out by the auditors does not involve consideration of these matters and, accordingly, the auditors accept no responsibility for any changes that may have occurred to the financial statements since they were initially presented on the website.
b. Legislation in the United Kingdom governing the preparation and dissemination of financial statements may differ from legislation in other jurisdictions.
Notes

30
STATEMENT OF PRINCIPAL ACCOUNTING POLICIES
The following accounting policies have been applied consistently throughout the period to items which are considered material in relation to the accounts. In accordance with FRS 18, these accounting policies have been reviewed by the Board of Governors and are considered to be appropriate to the university’s activities.
1. ACCOUNTING CONVENTIONThe accounts are prepared under the historical cost convention modified to include the revaluation of land and buildings and acquired assets in accordance with both the Statement of Recommended Practice (SORP): Accounting for Further and Higher Education 2007 and applicable Accounting Standards.
2. TANGIBLE FIXED ASSETS
i) CapitalisationTangible assets are capitalised if they are capable of being used for a period that exceeds one year and:
• Individually have a cost equal to or greater than £10,000
or
• Collectively have a cost equal to or greater than £10,000 where the assets are functionally interdependent or are purchased together and intended to be used as a group under common management control
or
• Irrespective of their individual cost, form part of the initial equipping of a new building
ii) ValuationLand and buildings, included in tangible fixed assets, are recognised at current market cost. Innes England, an independent firm of commercial property consultants, valued the land and buildings as at 30 May 2012 for inclusion in the balance sheet at 31 July 2012; the basis of valuation being depreciated replacement cost for specialised property and market value for non-specialised property.
All other tangible fixed assets are stated at cost.
Assets held for resale are stated at market value and disclosed as current assets.
A review for impairment of buildings is carried out annually. If events or changes in circumstances indicate that the carrying amount of the fixed asset may not be recoverable, depreciation is adjusted accordingly.
iii) DepreciationLand is not depreciated. Freehold property is depreciated over expected useful life on a straight line basis. For existing properties, new construction and major renovations, the expected useful life is based on an external appraisal and reflects all of the buildings’ major components. Refurbishment projects are depreciated over 20 years.
Leasehold property, including improvements to leasehold property, and other leased assets are depreciated over the life of the lease. Other tangible assets are depreciated on a straight-line basis over their useful life as follows:
New buildings and major refurbishments to buildings are depreciated from the month in which they are put into service. For all other assets six months depreciation is charged in the year in which they are put into service.
Depreciation on disposals is as follows:
iv) Funded tangible fixed assets
Where assets are acquired with the aid of specific grants or donations they are capitalised and depreciated as above. The related grants and donations are treated as deferred capital grants and released to income over the expected useful life of the asset (or the period of the grant in respect of specific projects). Grants received in respect of land are released to the Income and Expenditure Account as donations in the year in which the expenditure is incurred.
EquipmentComputer equipment
Other equipment and furniture
Equipment acquired for specific projects
Expenditure which extends useful life
BuildingsUniversity-owned buildings
Leasehold property
LifespanThree years
Five years
Over the life of the project (generally three years)
Over additional useful life
LifespanOver expected useful life (20 to 50-plus years) Over life of lease
Buildings
Equipment
Up to the month before the building is taken out of use
Six months depreciation

31
v) Tangible donated fixed assetsTangible fixed assets other than land that have been donated to the university are capitalised at market value with the same amount being credited to deferred capital grants. Assets are depreciated over their estimated useful lives, and a corresponding amount is released from deferred capital grants to the Income and Expenditure Account.
vi) IT equipment and software licencesIT equipment, such as personal computers and related items, are purchased in bulk through the university’s central purchasing and supply system. These items are capitalised as a single group of equipment and depreciated in accordance with i) and iii).
IT software licences are treated as a revenue cost and are charged to the Income and Expenditure Account in the year of purchase.
vii) Heritage assetsHeritage assets are defined as assets that are held principally for their contribution to knowledge and culture. The accounting treatment and disclosure of these assets is governed by FRS 30 (Heritage Assets).
Heritage assets were recognised for the first time in the university’s financial statements in 2011/12. Adam N Scoon, an independent antiques and fine art valuer, valued the heritage assets as at 16 September 2011. Therefore those assets, which are valued either individually or as a group at or in excess of £10,000, are recognised in the Balance Sheet at this valuation where a valuation is reasonably obtainable. Heritage Assets included are not depreciated since their long economic life and high residual value are an indication that any depreciation charge is immaterial. They are subject to impairment reviews if damage or deterioration is reported. They are maintained and the cost of maintenance charged to the income and expenditure accounts as incurred.
3. INTANGIBLE ASSETSIntangible assets are recorded at cost and amortised over their expected useful life.
4. LEASESFixed assets held under finance leases and the related lease obligations are recorded in the Balance Sheet at the fair value of the leased assets at the inception of the lease. The excess of the lease payments over recorded lease obligations are treated as finance charges which are amortised over each lease term to give a constant rate of charge on the remaining balance of the obligations.
Rental costs under operating leases are charged to the Income and Expenditure Account in equal amounts over the periods of the leases.
5. FUNDING COUNCIL GRANTSFunding Council recurrent grant income represents income in support of general or specific revenue activities of the university during the period and is credited direct to the Income and Expenditure Account.
Capital grants and contributions received by the university to finance the construction or purchase of capital assets are accounted for as deferred capital grants and released to the Income and Expenditure Account over the expected useful life of the related assets.
Deferred income in respect of HEFCE capital grant, which is attributable to subsequent years, is shown as a deferred credit in the Balance Sheet.
6. STOCKSStocks are stated at the lower of cost and net realisable value. Consumable items are charged directly to the Income and Expenditure Account.
7. TAXATION STATUSThe institution is an exempt charity within the meaning of schedule 3 of the Charities Act 2011 (formerly schedule 2 of the Charities Act 1993) and is considered to pass the tests set out in Paragraph 1 Schedule 6 Finance Act 2010 and therefore it meets the definition of a charitable company for UK corporation tax purposes. Accordingly, the institution is potentially exempt from taxation in respect of income or capital gains received within categories covered by section 287 CTA2009 and sections 471, and 478-488 CTA2010 (formerly s505 of ICTA 1988) or section 256 of the Taxation of Chargeable Gains Act 1992, to the extent that such income or gains are applied to exclusively charitable purposes.
All subsidiary companies are liable to Corporation Tax and Value Added Tax in the same way as any other commercial organisation.
The university’s principal activities are exempt from Value Added Tax, but certain ancillary supplies and services are liable to Value Added Tax at various rates. Expenditure includes irrecoverable Value Added Tax charged by suppliers to the university.
8. DEFERRED TAXATIONProvision is made for deferred taxation in respect of subsidiary companies, using the liability method on all material timing differences.
9. PENSION SCHEME ARRANGEMENTSRetirement benefits to employees of the university are provided by defined benefit schemes which are funded by contributions from the university and employees. Payments

32
are made to the Teachers’ Pension Scheme, the Universities Superannuation Scheme for academic staff and to the Local Government Pension Scheme for support staff. These are all independently administered schemes. Pension costs are assessed on the latest actuarial valuations of the schemes.
The Local Government Pension Scheme is accounted for on the basis of FRS 17. The assets of the scheme are included at market value and scheme liabilities are measured on an actuarial basis using the projected unit method. The difference between the fair value of assets and liabilities measured on an actuarial basis, net of the related amount of deferred tax, are recognised in the university’s balance sheet as a pension scheme liability or asset as appropriate. A surplus is only included to the extent that the university is able to recover the surplus either through reduced contributions in the future or through refunds from the scheme. Changes in the defined asset or liability arising from factors other than cash contributions to the scheme are charged to the Income and Expenditure Account. The Teachers’ Pension Scheme and the Universities Superannuation Scheme are multi-employer schemes where the university is unable to identify its share of the underlying assets and liabilities on a consistent and reasonable basis. Contributions are charged directly to the Income and Expenditure Account as if the schemes were defined contribution scheme in accordance with FRS 17. Provision is made for enhanced pensions not accounted for under FRS 17 where employees have taken early retirement.
10. RECOGNITION OF INCOMEIncome from tuition fees represents student fees received and receivable, which are attributable to the studies undertaken in the current accounting period. Bursaries and fee waivers are included in gross income and offset in other operating expenses.
Income from research grants, contracts and other services rendered is included to the extent of the expenditure incurred during the year. Contributions towards overhead costs are aligned with expenditure and recognised based on expenditure to date.
All income from short-term deposits and endowment asset investments is credited to the Income and Expenditure Account on a receivable basis.
Income from restricted endowments not expended in accordance with the restrictions of the endowment is transferred from the Income and Expenditure Account to restricted endowments. Any realised gains or losses from dealing in the related assets are retained within the endowment in the Balance Sheet.
11. CONSOLIDATIONThe Consolidated Income and Expenditure Account and Balance Sheet include the annual accounts of the corporation, its subsidiary undertakings, except for dormant subsidiary companies, where the combined amounts involved are insignificant. Details of the university’s subsidiary undertakings are provided in note 7 to the accounts. The Annual Accounts have been consolidated under the acquisition method of accounting.
The consolidated financial statements do not include those of De Montfort University Students’ Union Limited, as it is a separate limited company in which the university has no financial interest. In 2013/14, the university made the recurrent grant to De Montfort University Students’ Union Limited of £1million (2012/13: £851,000).
12. FINANCIAL INSTRUMENTS
CashIn accordance with FRS 1, cash includes short-term, highly liquid investments that are readily convertible to known amounts of cash within 24 hours and without penalty and overdrafts.
Interest bearing borrowing Bonds & long-term borrowings are recognised initially at fair value less attributed transaction costs. Subsequent to initial recognition, interest-bearing borrowings are stated at amortised cost using the effective interest method, less any impairment losses in compliance with FRS 26 (IAS 39).
Investments in debt and equity securities Other investments in debt and equity securities held by the university are classified as being available-for-sale and are stated at fair value, with any resultant gain or loss being recognised directly in equity (in the fair value reserve), except for impairment losses. When these investments are derecognised, the cumulative gain or loss previously recognised directly in equity is recognised in profit or loss. Where these investments are interest-bearing, interest calculated using the effective interest method is recognised in profit or loss.
Investments in equity instruments that do not have a quoted market price in an active market and whose fair value cannot be reliably measured are carried at cost less any provision for impairment.
33
13. MAINTENANCE OF PREMISES The cost of routine maintenance is charged to the Income and Expenditure Account in the period in which it is incurred. The university has a long-term planned maintenance programme, which is reviewed on an annual basis. The university charges actual expenditure on long-term planned maintenance to the Income and Expenditure Account in the period in which it is incurred.
14. STAFF RESTRUCTURING COSTS Restructuring costs are recognised in respect of the direct expenditure of a reorganisation where plans are sufficiently detailed and well advanced, and where appropriate communication to those affected has been undertaken at the Balance Sheet date.
15. PROVISIONS Provisions are recognised when the university has a present and legal or constructive obligation as a result of a past event, it is probable that a transfer of economic benefit will be required to settle the obligation and a reliable estimate can be made of the amount of the obligation.
16. FOREIGN CURRENCIESThe consolidated financial statements are presented in pounds sterling, which is the group’s functional and presentation currency. The group does not include any foreign entity. In line with FRS 23 (IAS 21), transactions denominated in foreign currencies are recorded at the exchange rate on the transaction date, while assets and liabilities are translated at exchange rates at the balance sheet date. The resulting exchange rate differences are recognised in the Income and Expenditure Account.
17. ACCOUNTING FOR CHARITABLE DONATIONS
i) Unrestricted donationsCharitable donations are recognised in the accounts when the charitable donation has been received or if, before receipt, there is sufficient evidence to provide the necessary certainty that the donation will be received and the value of the incoming resources can be measured with sufficient reliability.
ii) Endowment fundsWhere charitable donations are to be retained for the benefit of the institution as specified by the donors, these are accounted for as endowments.
There are three main types:
• Unrestricted permanent endowments – the donor has specified that the fund is to be invested permanently to generate an income stream for the general benefit of the institution
• Restricted expendable endowments – the donor has specified a particular objective other than the purchase or construction of tangible fixed assets, and the institution can convert the donated sum into income
• Restricted permanent endowments – the donor has specified that the fund is to be invested permanently to generate an income stream to be applied to a particular objective
iii) Donations for fixed assetsDonations received to be applied to the cost of a tangible fixed asset are shown on the Balance Sheet as a deferred capital grant. The deferred capital grant is released to the Income and Expenditure Account over the same estimated useful life that is used to determine the depreciation charge associated with the tangible fixed asset.
Donations received to be applied to the cost of land are recognised by inclusion as ‘Other Income’ in the Income and Expenditure Account.
iv) Gifts in kind, including donated tangible fixed assetsGifts in kind are included in ‘other income’ or ‘deferred capital grants’ as appropriate using a reasonable estimate of their gross value or the amount actually realised.

34
CONSOLIDATED INCOME AND EXPENDITURE ACCOUNT
For the year ended 31 July 2014
Income Note
2014£’000Total
2013 £’000 Total
Academic fees and education contracts 1a 115,422 94,502
Funding council grants 1b 31,305 42,062
Research grants and contracts 1c 5,287 5,323
Other operating income 1d 7,980 9,903
Endowment income and interest receivable 1e 792 865
Total income 160,786 152,655
Expenditure
Staff costs 2 85,091 85,260
Staff restructuring costs 2,038 4,222
Other operating expenses 3 44,112 43,402
Interest payable 4 5,669 5,933
Depreciation 7 14,785 16,430
Total expenditure 5 151,695 155,247
Surplus/(deficit) on continuing operations after depreciation of tangible fixed assets at valuation and before tax 9,091 (2,592)
Taxation 6 (90) (296)
Surplus/(deficit) on continuing operations after depreciation of tangible fixed assets at valuation and tax and before exceptional items 9,001 (2,888)
Exceptional items: continuing operations
(Deficit)/surplus on disposal of tangible fixed assets 7 (5) 4,470
Surplus on continuing operations after depreciation of tangible fixed assets at valuation, taxation and disposal of assets 8,996 1,582
Transfer from accumulated income within endowments 9 196 224
Surplus for the year retained within general reserves 9,192 1,806
The consolidated surplus for the year includes a surplus of £9,192k (2012/13: surplus of £1,806k) attributable to the operations of the university, excluding activities of the subsidiary.
STATEMENT OF HISTORICAL COST SURPLUSES AND DEFICITSFor the year ended 31 July 2014
Note
2014 £’000Total
2013 £’000 Total
Surplus on continuing operations after depreciation of tangible fixed assets at valuation, taxation and disposal of assets 8,996 1,582
Difference between historical cost depreciation charge and actual depreciation charge for the year 18 4,254 7,793
Historical cost surplus for the year 13,250 9,375
Historical cost surplus for the year retained after transfers in respect of endowments 13,446 9,599
This statement should be read in conjunction with the report of the Chairman, the Operating and Financial Review and Notes to the Accounts.

35
BALANCE SHEET
As at 31 July 2014
Fixed assets Note
Group 2014
£’000
Group 2013
£’000
Corporation 2014
£’000
Corporation 2013
£’000
Tangible assets 7 273,014 269,266 273,014 269,266
Investments 8 186 142 496 452
273,200 269,408 273,510 269,718
Endowment asset investments 9 1,220 1,259 1,220 1,259
Current assets
Stocks 10 102 91 102 91
Debtors – amounts falling due within one year 11 7,176 7,513 7,911 7,983
Short-term deposits 12 42,010 59,965 40,675 58,929
Cash at bank and in hand 49,148 23,488 49,112 23,440
Total current assets 98,436 91,057 97,800 90,443
Creditors: amounts falling due within one year 13 (22,330) (20,486) (22,261) (20,439)
Net current assets 76,106 70,571 75,539 70,004
Total assets less current liabilities 350,526 341,238 350,269 340,981
Creditors: amounts falling due after more than one year 14 (86,279) (86,160) (86,279) (86,160)
Provisions for liabilities and charges 15 (2,571) (2,557) (2,571) (2,557)
(88,850) (88,717) (88,850) (88,717)
Total net assets excluding pension deficit 261,676 252,521 261,419 252,264
Pension deficit 27d (68,715) (39,077) (68,715) (39,077)
Total net assets including pension deficit 192,961 213,444 192,704 213,187
Represented by:
Deferred capital grants 16 36,760 37,164 36,760 37,164
Endowments
Expendable 729 780 729 780
Permanent 491 479 491 479
Total endowments 17 1,220 1,259 1,220 1,259
Reserves
Revaluation reserve 18 114,286 118,496 114,286 118,496
Income and expenditure account 18 109,410 95,602 109,153 95,345
Pension reserve 18 (68,715) (39,077) (68,715) (39,077)
Total reserves 154,981 175,021 154,724 174,764
Total reserves and endowments 156,201 176,280 155,944 176,023
Total funds 192,961 213,444 192,704 213,187
The financial statements on pages 34 to 58 were approved by the Board of Governors on 27 November 2014 and were signed on its behalf by
Mr I Blatchford Chairman
Professor D Shellard Chief Executive and Vice-Chancellor
This statement should be read in conjunction with the report of the Chairman, the Operating and Financial Review and Notes to the Accounts.
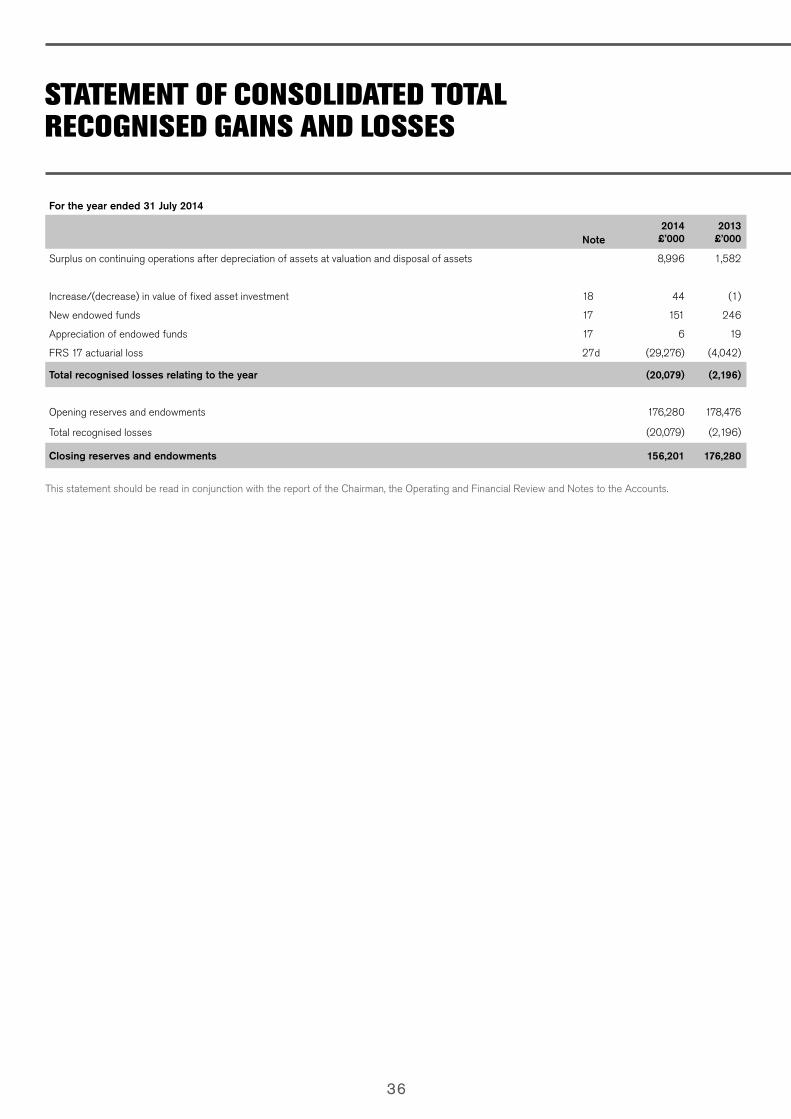
36
STATEMENT OF CONSOLIDATED TOTAL RECOGNISED GAINS AND LOSSES
For the year ended 31 July 2014
Note2014
£’0002013
£’000
Surplus on continuing operations after depreciation of assets at valuation and disposal of assets 8,996 1,582
Increase/(decrease) in value of fixed asset investment 18 44 (1)
New endowed funds 17 151 246
Appreciation of endowed funds 17 6 19
FRS 17 actuarial loss 27d (29,276) (4,042)
Total recognised losses relating to the year (20,079) (2,196)
Opening reserves and endowments 176,280 178,476
Total recognised losses (20,079) (2,196)
Closing reserves and endowments 156,201 176,280
This statement should be read in conjunction with the report of the Chairman, the Operating and Financial Review and Notes to the Accounts.

37
CONSOLIDATED CASH FLOW STATEMENT
For the year ended 31 July 2014
Note2014
£’0002013
£’000
Net cash inflow from operating activities 20 28,828 14,376
Returns on investments and servicing of finance
Interest received 21 772 725
Interest paid 21 (4,838) (4,601)
Total returns on investment and servicing of finance (4,066) (3,876)
Net cash inflow after returns on investments and servicing of finance 24,762 10,500
Capital expenditure
Payments to acquire tangible assets (18,517) (12,613)
Proceeds of sale of tangible assets - 7,373
Deferred capital grants received 1,483 947
Net cash outflow from capital expenditure (17,034) (4,293)
Net cash inflow before management of liquid resources 7,728 6,207
Management of liquid resources
Cash transferred from/(to) term deposits 22 17,955 (30,979)
Financing
Loan drawn down in year - 22
Loan repayment in year (23) (20)
Net cash (outflow)/inflow from financing (23) 2
Increase/(decrease) in cash 22 25,660 (24,770)
RECONCILIATION OF NET CASH FLOW TO MOVEMENT IN NET FUNDS
Note2014
£’0002013
£’000
Increase/(decrease) in cash in the year 22 25,660 (24,770)
Cash (outflow)/inflow from liquid resources 22 (17,955) 30,979
New loans taken out in year - (22)
Loan repayment in year 23 20
Change in net funds 7,728 6,207
Net debt at 1 August (6,592) (12,799)
Net funds/(debt) at 31 July 1,136 (6,592)
This statement should be read in conjunction with the report of the Chairman, the Operating and Financial Review and Notes to the Accounts.

38
NOTES TO THE ACCOUNTS
1. Analysis of income 2013/2014£’000
2012/2013£’000
a) Academic fees and education contracts
Home and EU students 83,784 65,421
Overseas students 17,611 15,138
Education contracts 12,539 12,151
Other contracts
Total 115,422 94,502
b) Funding council grants
Recurrent grants
Higher Education Funding Council for England 26,464 36,540
Learning and Skills Council 797 856
Specific grants
Higher Education Innovation Fund 1,155 1,167
National Scholarship Programme 1,203 683
E-Marketplace - 80
Employer engagement 1 -
Releases of deferred capital grants
Buildings 738 1,500
Equipment 947 1,236
Total 31,305 42,062
c) Research grants and contracts
Research councils 1,559 1,914
UK-based charities 434 298
European commission 752 770
Other grants and contracts 2,542 2,341
Total 5,287 5,323
d) Other operating income
Residences and catering 2,869 2,342
Other services rendered 3,507 3,588
Other income 1,389 1,532
Releases of deferred capital grants (note 16) 202 2,429
Donations 13 12
Total 7,980 9,903
e) Endowment income and interest receivable
Income from expendable endowments (note 17) 7 8
Income from permanent endowments (note 17) 11 14
Interest on short-term investments 774 843
Total 792 865

39
2. Staff costs and other details 2013/2014£’000
2012/2013£’000
a) Staff costs
Wages and salaries 70,248 70,931
Social security costs 5,856 5,914
Other pension costs 9,324 9,073
The financial effects of the adoption of FRS 17 (337) (658)
Total 85,091 85,260
b) Employee numbers 2013/2014 2012/2013
The average number of persons employed during the year, expressed as full-time equivalents, are disclosed below.
Academic
Full-time 643 664
Part-time 232 215
Support 1,021 1,038
Total 1,896 1,917
c) Vice-Chancellor emoluments
Salary 235 191
Bonus relating to prior year 45 25
Health insurance 1 2
281 218
Pension contributions 8 31
Total 289 249
The emoluments, including taxable benefits, of the Vice-Chancellor are shown on the same basis as for higher paid staff and exclude employer’s national insurance contributions.
Employer’s pension contributions in respect of the Vice-Chancellor were made for three months of the year up until October 2013 at a rate of 16%.
The Contract of Employment of the Vice-Chancellor provides for termination by the corporation on giving 12 months’ notice or the Vice-Chancellor reaching the age of 65.
d) Remuneration of other higher paid staffRemuneration of other higher paid staff, excluding employer’s pension contributions:
2013/2014 2012/2013
£100,000 - £109,999 - 1
£110,000 - £119,999 4 2
£120,000 - £129,999 - 1
£130,000 - £139,999 3 2
£140,000 - £149,999 1 -
£150,000 - £159,999 - 1
£160,000 - £169,999 1 -
£170,000 - £179,999 1 1
Compensation for loss of office payable to higher paid staff 2013/2014£’000
2012/2013£’000
Compensation payable 68 -
The severance pay was approved with the institution’s protocols for such payments.

40
3. Other operating expenses 2013/2014£’000
2012/2013£’000
External auditors remuneration Group audit 54 53
The above remuneration includes £43k in respect of the audit of the university (2013: £43k)
Auditors fees for non-audit services Other services supplied pursuant to such legislation - 6
Other services relating to taxation 32 13
Other 1 -
Internal audit services 83 82
Residences and catering 1,463 1,121
Rent, rates and insurance 1,040 736
Repairs and general maintenance 3,781 4,508
Energy 2,417 2,449
Administrative expenses 5,620 4,805
Research grants and contracts 1,766 1,695
Legal, professional and consultancy fees 6,510 5,983
General education expenses 5,699 5,202
Student bursaries 5,177 7,358
Publicity 3,090 1,836
Staff development 488 381
Travel and subsistence 1,987 1,781
Grant to De Montfort University Students’ Union Limited 1,000 851
Consumables 3,005 3,413
Other 899 1,129
Total 44,112 43,402
Other operating expenses include:
Operating leases – buildings 374 305
Operating leases – equipment 147 128
Governors
No governor has received any remuneration/waived payments for the group during the year (2013: none).
The total expenses paid to or on behalf of 17 governors was £20,506 (2013: £12,793 to 17 governors).
This represents travel and subsistence incurred in attending board and committee meetings in their official capacity.
4. Interest payable 2013/2014£’000
2012/2013£’000
Net financing costs in Pension Scheme Liabilities (under FRS 17) 699 961
Interest on bond 4,837 4,839
Bond transaction costs 133 133
Total 5,669 5,933

41
5. Analysis of 2013/2014 expenditure by activity Staff costs Other operating expenses
Interest Depreciation Total 2012/2013Total
£’000 £’000 £’000 £’000 £’000 £’000
Academic departments 49,613 9,093 - 1,896 60,602 61,232
Academic services 12,325 5,587 - 3,694 21,606 20,526
Admin and central services 6,249 2,561 - 426 9,236 10,158
General education expenditure 2,722 12,273 - 94 15,089 13,728
Staff and student facilities 5,940 4,293 - 82 10,315 9,273
Premises 5,113 6,613 - 8,227 19,953 23,442
Residences and catering 319 1,463 - 252 2,034 1,855
Research grants and contracts 2,508 1,766 - 114 4,388 4,419
Other services rendered 639 451 - - 1,090 1,059
Other expenditure - - 4,970 - 4,970 4,972
Provision for restructuring 2,038 12 - - 2,050 4,280
FRS 17 adjustment (337) - 699 - 362 303
Total 87,129 44,112 5,669 14,785 151,695 155,247
The depreciation charge has been funded by:
£’000
Deferred capital grants released (note 16) 1,627
Revaluation reserves released (note 18) 4,254
General income 8,904
Total 14,785
6. Taxation
Taxation is payable to Chinese tax authorities on activity in respect of joint education programmes with partner universities in China.
The estimate of tax due is based upon the deemed profit element of gross income received. For educational services the deemed profit is in the range of 10-30% by negotiation. Corporate income tax is calculated on deemed profit at 25%, plus a business tax of 3-5% based on the classification of service.
The estimated amount due for 2013/14 is £90,127 being tax on the income for the current year and a late payment surcharge for tax owed on prior years’ activity.
The total accrued for tax in China is the maximum estimate of £386,000 and will be finalised once negotiations have concluded.

42
7. Tangible fixed assets and depreciation Land andbuildings
Buildings under
construction
Furniture and equipment
Computer equipment
Heritage assets
Total
£’000 £’000 £’000 £’000 £’000 £’000
Group and corporation
Cost or valuation
At 1 August 2013 268,019 3,542 14,631 20,655 700 307,547
Additions at cost 5,535 2,978 745 9,280 - 18,538
Transfers to land and buildings 3,542 (3,542) - - - -
Disposals (4,370) - (10) (3,453) - (7,833)
At 31 July 2014 272,726 2,978 15,366 26,482 700 318,252
Depreciation
At 1 August 2013 12,998 - 12,925 12,358 - 38,281
Charge for the year 5,742 - 801 5,571 - 12,114
Accelerated depreciation 2,671 - - - - 2,671
Depreciation charge for the year 8,413 - 801 5,571 - 14,785
Disposals (4,370) - (5) (3,453) - (7,828)
At 31 July 2014 17,041 - 13,721 14,476 - 45,238
Net book value:
At 31 July 2014 255,685 2,978 1,645 12,006 700 273,014
At 31 July 2013 255,021 3,542 1,706 8,297 700 269,266
The net book value of tangible fixed assets held under finance leases at 31 July 2014 was nil (31 July 2013: nil). Of the net book value of land and buildings including buildings under construction, £258,663,000 as at 31 July 2014, £12,222,000 is held at cost and £246,441,000 is held at the 2012 valuation. The historical cost equivalent of the re-valued land and buildings is £132,964,000 as at 31 July 2014. Land and buildings includes £12m (2013: £12m) of university-owned land that is not depreciated.
The net book value of land and buildings is comprised as follows: Group and corporation
2013/2014£’000
2012/2013£’000
Freehold 258,247 258,175
Long lease 416 388
Total 258,663 258,563

43
8. Investments Group2013/2014
£’000
Group2012/2013
£’000
Corporation2013/2014
£’000
Corporation2012/2013
£’000
Movement in the year
Balance at beginning of year 142 343 452 653
Disposals - (200) - (200)
Appreciation/(depreciation) of investments 44 (1) 44 (1)
Balance at year end 186 142 496 452
Analysis of closing balance
Shareholding in subsidiary undertakings - - 310 310
Other investments 148 104 148 104
Shareholding in CVCP Properties PLC 38 38 38 38
Total 186 142 496 452
a) Shareholdings in subsidiary undertakingsAt year end, investments in subsidiary undertakings comprise:
Groupholding
%
Corporation 2013/2014
£
Corporation2012/2013
£
Description of activities
Directly owned by the university:
De Montfort Expertise Ltd 100 310,000 310,000 Provision of contract research and development
Leicester Business School Ltd 100 1 1 Dormant company
Leicestershire Business School Ltd 100 1 1 Dormant company
Total 310,002 310,002
All of the subsidiary undertakings are incorporated in England and Wales.
b) Other investments Holding
%
Corporation 2013/2014
£
Corporation 2012/2013
£
Description of activities
Spear Therapeutics Ltd 11.06 234 234 Drug development and research
BTG PLC <0.01 120,267 75,355 Drug development and research
CYPS Ltd 100.00 100 100 Dormant company
In Smart Ltd 100.00 100 100 Dormant company
Morvus Technology Ltd <0.40 589 589 Drug development and research
Access Pharmaceuticals Inc <0.70 2,044 2,614 Drug development and research, incorporated in USA
Mediatag Ltd 32.47 150 150 Software development
Venuesim Ltd 33.00 300 300 Software development
WZVI Ltd 10.00 100 100 Science and engineering research
IP By Design Ltd 10.00 25,000 25,000 Intellectual property management consultancy
CYP Design Ltd 20.00 2 2 Drug development and research
Total 148,886 104,544

44
9. Endowment asset investments – group and corporation 2013/2014£’000
2012/2013£’000
Balance at 1 August 1,259 1,218
New endowments invested 151 246
Increase in market value of investments 6 19
Decrease in cash balances held for endowment funds (196) (224)
Balance as at 31 July 1,220 1,259
Represented by:
Securities and fixed interest stock 230 224
Bank balances 990 1,035
Total endowment assets 1,220 1,259
10. Stocks – group and corporation 2013/2014£’000
2012/2013£’000
Goods for resale 3 3
Art and design 62 67
ITMS 37 21
Total 102 91
11. Debtors falling due within one year Group2013/2014
£’000
Group2012/2013
£’000
Corporation2013/2014
£’000
Corporation2012/2013
£’000
Student debtors 932 984 932 984
Other debtors 1,770 2,832 1,339 2,573
Research 1,009 985 1,009 985
Prepayments and accrued income 3,465 2,712 3,356 2,568
Subsidiary undertakings - - 1,275 873
Total 7,176 7,513 7,911 7,983
12. Short term deposits – group and corporation
In accordance with its established policy, the university regularly invests surplus funds on deposit or on the money market.
At 31 July 2014: £42,010,000 of group funds were on deposit (31 July 2013: £59,965,000). £40,675,000 of corporation funds were on deposit (31 July 2013: £58,929,000).
13. Creditors falling due within one year Group2013/2014
£’000
Group2012/2013
£’000
Corporation2013/2014
£’000
Corporation2012/2013
£’000
Payments received in advance 7,748 7,458 7,608 7,374
Trade creditors 3,926 3,016 3,840 2,940
Other creditors 4,088 3,390 4,088 3,390
Taxation 926 912 926 912
Social security 904 882 904 882
Accruals 4,231 4,279 4,093 4,192
Loans 14 23 14 23
Student caution deposits 366 363 366 363
Access funds (note 26) 127 163 127 163
Subsidiary undertakings - - 295 200
Total 22,330 20,486 22,261 20,439

45
14. Creditors falling due after more than one year – group and corporation 2013/2014£’000
2012/2013£’000
Bond (note 19a) 90,000 90,000
Bond transaction costs (3,729) (3,862)
Bond total 86,271 86,138
Other loans 8 22
Total 86,279 86,160
15. Provisions for liabilities and charges - group and corporation Taxation
£’000
Futurepensions
£’000
Staffrestructuring
£’000
Total
£’000
At 1 August 2013 296 1,559 702 2,557
Utilised in year - (460) (702) (1,162)
Transfer to Income and Expenditure Account 90 654 432 1,176
At 31 July 2014 386 1,753 432 2,571
The provision for future pensions represents the estimated outstanding cost to the university in respect of enhanced pension entitlements not accounted for under FRS 17 and is reviewed at each financial year end. The provision for staff restructuring relates to agreements that have been reached for early retirement and severance as at the Balance Sheet date.
16. Deferred capital grants – group and corporation Funding council grants£’000
Other grants
£’000
Total grants
£’000
Balance at 1 August 2013
Buildings 33,625 645 34,270
Equipment 2,430 464 2,894
Total 36,055 1,109 37,164
Cash receivable
Buildings 1,130 336 1,466
Equipment 17 - 17
Total 1,147 336 1,483
Released to Income and Expenditure Account
Buildings (738) (58) (796)
Equipment (947) (144) (1,091)
Total (1,685) (202) (1,887)
To fund depreciation (note 5) (1,627)
To fund revenue (260)
Total (1,887)
Balance at 31 July 2014
Buildings 34,017 923 34,940
Equipment 1,500 320 1,820
Total 35,517 1,243 36,760

46
17. Endowments – group and corporation Unrestrictedpermanent
£’000
Restrictedpermanent
£’000
Totalpermanent
£’000
Restrictedexpendable
£’000
2013/2014Total
£’000
2012/2013Total
£’000
Capital 1 412 413 769 1,182 1,140
Accumulated income - 66 66 11 77 78
Total 1 478 479 780 1,259 1,218
Investment income - 11 11 7 18 22
Expenditure - (6) (6) (208) (214) (246)
Total - 5 5 (201) (196) (224)
New endowments - 1 1 150 151 246
Appreciation in market value of investments - 6 6 - 6 19
At 31 July 2014 1 490 491 729 1,220 1,259
Represented by:
Capital value 1 419 420 725 1,145 1,182
Accumulated income - 71 71 4 75 77
Total 1 490 491 729 1,220 1,259
18. Reserves Group2013/2014
£’000
Group2012/2013
£’000
Corporation2013/2014
£’000
Corporation2012/2013
£’000
Income and expenditure reserve
At 1 August 95,602 85,700 95,345 85,443
Surplus retained in the year 9,192 1,806 9,192 1,806
Transfer from revaluation reserve 4,254 7,793 4,254 7,793
Add back pension deficit 362 303 362 303
At 31 July 109,410 95,602 109,153 95,345
Pension reserve
At 1 August (39,077) (34,732) (39,077) (34,732)
Actuarial loss on pension scheme (29,276) (4,042) (29,276) (4,042)
Deficit retained within reserves (362) (303) (362) (303)
At 31 July (68,715) (39,077) (68,715) (39,077)
Revaluation reserve
At 1 August 118,496 126,290 118,496 126,290
Increase/(decrease) in value of fixed asset investments 44 (1) 44 (1)
Contribution to depreciation (4,254) (7,793) (4,254) (7,793)
At 31 July 114,286 118,496 114,286 118,496
Total reserves 154,981 175,021 154,724 174,764

47
19. Borrowings and lease obligations – group and corporation 2013/2014Total
£’000
2012/2013Total
£’000
a) Borrowings
Borrowings in respect of bond issue, bank loans, overdrafts and other loans are repayable as follows:
In one year or less 14 23
Between one and two years 5 14
Between two and five years 3 8
In five years or more 90,000 90,000
Total 90,022 90,045
BondAn unsecured fixed rate public bond was issued in July 2012 in the sum of £110 million over a 30-year term with a coupon rate of 5.375%. £20 million are reserve bonds held without coupon by the trustee for a five-year period to July 2017. If the reserve bonds are not sold in this time they will be withdrawn. There are no capital payments to be made over the term with the bond maturing in 2042.
DMU may, at its option, redeem all, or from time to time any part of, the bonds at the higher of the principal amount of the bonds and the sum of the gross redemption yield of the benchmark gilt (4.5% Treasury Gilt 2042) and 0.40%, plus accrued interest.
The bond transactions costs of £4.0 million are amortised over the life of the bond of 30 years to interest payable, with effect from financial year 2012/13.
b) Operating leases
At 31 July 2014, the university had annual commitment under operating leases as follows:
Land and buildings
Leases expiring within two-five years 82 82
Leases expiring thereafter 306 306
Total lease payments due 388 388
Other
Leases expiring within one year - 3
Leases expiring within two-five years 118 141
Total lease payments due 118 144

48
20. Net cash flow from operating activities – group 2013/2014£’000
2012/2013£’000
Income and Expenditure Account before taxation 9,091 (2,592)
FRS 17 impact on Income and Expenditure Account (including interest) 362 303
Endowment income adjustment 196 224
Write-down Lachesis investment - 200
Write-down Charles Frears Campus value - 1,100
Interest receivable (excluding FRS 17 interest) (792) (865)
Surplus/(deficit) before interest receivable 8,857 (1,630)
Add back interest payable (excluding FRS 17 interest):
Interest on bond 4,837 4,839
Bond costs 133 133
Total interest payable 4,970 4,972
Surplus from operating activities 13,827 3,342
Release of capital grant (1,887) (5,165)
Increase/(decrease) in value of fixed asset investments 44 (1)
Depreciation 14,785 16,430
(Increase)/decrease in stock (11) 31
Decrease/(increase) in debtors 357 (2,477)
Increase in creditors 1,789 1,144
(Decrease)/increase in provisions (76) 1,072
Net cash inflow from ordinary operating activities 28,828 14,376
21. Returns on investments and servicing of finance – group 2013/2014£’000
2012/2013£’000
Income from short term investments 772 725
Interest paid (4,838) (4,601)
Total (4,066) (3,876)

49
22. Analysis of net funds – group At 1 August 2013
£’000
Non cash changes
£’000
Cash flow
£’000
At 31 July2014
£’000
Net cash
Cash at bank and in hand 23,488 - 25,660 49,148
Bank overdrafts - - - -
Total net cash 23,488 - 25,660 49,148
Liquid resources
Current asset investments 59,965 - (17,955) 42,010
Debt
Debts falling due within one year (23) (14) 23 (14)
Debts falling due after one year (90,022) 14 - (90,008)
Total debt (90,045) - 23 (90,022)
Net funds (6,592) - 7,728 1,136
23. Financial commitments – group and corporation 2013/2014£’000
2012/2013£’000
Provision has not been made for the following capital commitments at 31 July 2014.
Commitments contracted for 52,610 5,287
Authorised but not contracted for 20,178 70,338
Total 72,788 75,625 24. Contingent liabilities
There are no material contingent liabilities.
25. Related party transactions
The members of the Board of Governors have considered the requirement for disclosure concerning related parties under FRS 8.
Mr Mike Kapur, Independent Governor, held a position of Board Advisor to Leicestershire County Cricket Club. The value of services provided to the university during 2013/14 was £42,000. Mr Alan Charlton, Independent Governor, provided consultancy services to the university. The value of services provided to the university during 2013/14 was £20,000.
It is a requirement of HEFCE that transactions during the year between institutions and the autonomous, non-consolidated students’ unions are reported as a related party transaction. Mr Adil Waraich, DSU President, sits on the university’s board. The grant paid to the students’ union during the year was £1,000,000.
26. Access funds 2013/2014£’000
2012/2013£’000
Balance unspent at 1 August 163 1
Funding council grants 369 517
Interest earned 3 3
Balance before disbursement 535 521
Disbursed to students (408) (358)
Balance as at 31 July 127 163
Funding council grants are available solely for students: the university acts only as a paying agent. The grants and related disbursements are therefore excluded from the Income and Expenditure Account.
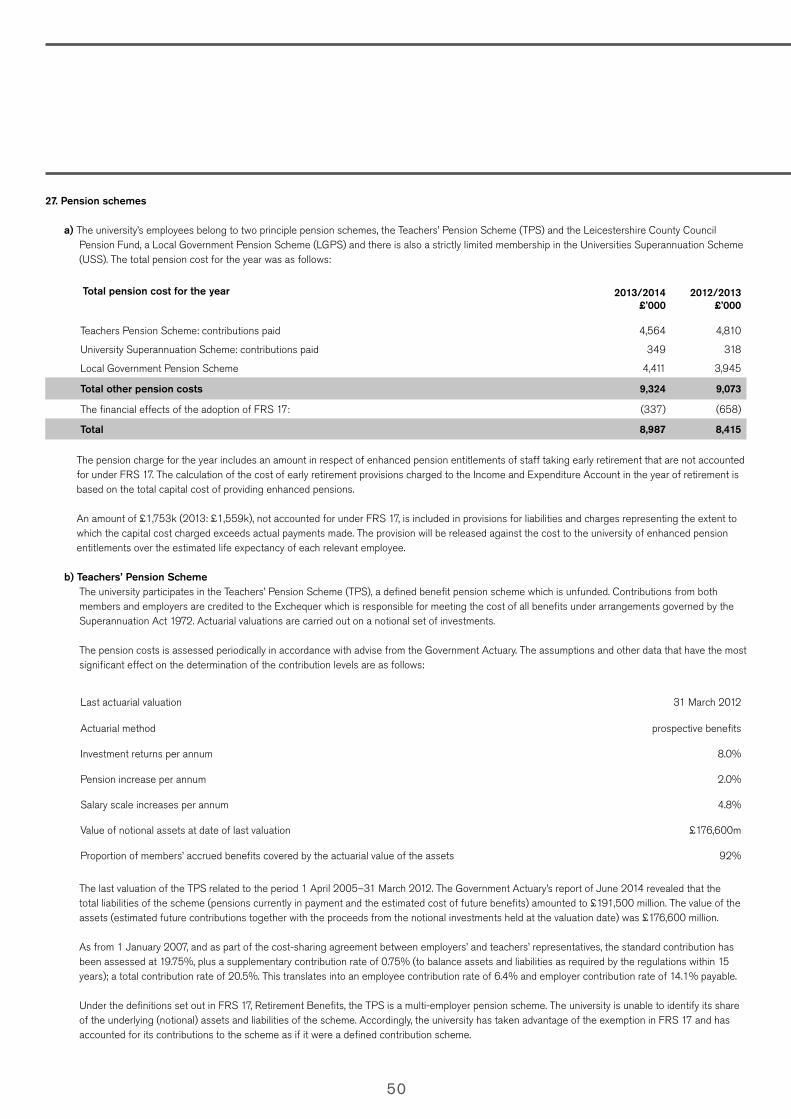
50
27. Pension schemes
a) The university’s employees belong to two principle pension schemes, the Teachers’ Pension Scheme (TPS) and the Leicestershire County Council Pension Fund, a Local Government Pension Scheme (LGPS) and there is also a strictly limited membership in the Universities Superannuation Scheme (USS). The total pension cost for the year was as follows:
Total pension cost for the year 2013/2014£’000
2012/2013£’000
Teachers Pension Scheme: contributions paid 4,564 4,810
University Superannuation Scheme: contributions paid 349 318
Local Government Pension Scheme 4,411 3,945
Total other pension costs 9,324 9,073
The financial effects of the adoption of FRS 17: (337) (658)
Total 8,987 8,415
The pension charge for the year includes an amount in respect of enhanced pension entitlements of staff taking early retirement that are not accounted for under FRS 17. The calculation of the cost of early retirement provisions charged to the Income and Expenditure Account in the year of retirement is based on the total capital cost of providing enhanced pensions.
An amount of £1,753k (2013: £1,559k), not accounted for under FRS 17, is included in provisions for liabilities and charges representing the extent to which the capital cost charged exceeds actual payments made. The provision will be released against the cost to the university of enhanced pension entitlements over the estimated life expectancy of each relevant employee.
b) Teachers’ Pension Scheme The university participates in the Teachers’ Pension Scheme (TPS), a defined benefit pension scheme which is unfunded. Contributions from both
members and employers are credited to the Exchequer which is responsible for meeting the cost of all benefits under arrangements governed by the Superannuation Act 1972. Actuarial valuations are carried out on a notional set of investments.
The pension costs is assessed periodically in accordance with advise from the Government Actuary. The assumptions and other data that have the most significant effect on the determination of the contribution levels are as follows:
Last actuarial valuation 31 March 2012
Actuarial method prospective benefits
Investment returns per annum 8.0%
Pension increase per annum 2.0%
Salary scale increases per annum 4.8%
Value of notional assets at date of last valuation £176,600m
Proportion of members’ accrued benefits covered by the actuarial value of the assets 92%
The last valuation of the TPS related to the period 1 April 2005–31 March 2012. The Government Actuary’s report of June 2014 revealed that the total liabilities of the scheme (pensions currently in payment and the estimated cost of future benefits) amounted to £191,500 million. The value of the assets (estimated future contributions together with the proceeds from the notional investments held at the valuation date) was £176,600 million.
As from 1 January 2007, and as part of the cost-sharing agreement between employers’ and teachers’ representatives, the standard contribution has been assessed at 19.75%, plus a supplementary contribution rate of 0.75% (to balance assets and liabilities as required by the regulations within 15 years); a total contribution rate of 20.5%. This translates into an employee contribution rate of 6.4% and employer contribution rate of 14.1% payable.
Under the definitions set out in FRS 17, Retirement Benefits, the TPS is a multi-employer pension scheme. The university is unable to identify its share of the underlying (notional) assets and liabilities of the scheme. Accordingly, the university has taken advantage of the exemption in FRS 17 and has accounted for its contributions to the scheme as if it were a defined contribution scheme.

51
c) Universities Superannuation Scheme The institution participates in the Universities Superannuation Scheme (USS), a defined benefit scheme which is contracted out of the State Second
Pension (S2P). The assets of the scheme are held in a separate fund administered by the trustee, Universities Superannuation Scheme Limited.
The latest triennial actuarial valuation of the scheme was at 31 March 2011. This was the second valuation for USS under the scheme-specific funding regime introduced by the Pensions Act 2004, which requires schemes to adopt a statutory funding objective, which is to have sufficient and appropriate assets to cover their technical provisions. The actuary also carries out regular reviews of the funding levels. In particular, he carries out a review of the funding level each year between triennial valuations and details of his estimate of the funding level at 31 March 2014 are also included in this note.
The triennial valuation was carried out using the projected unit method. The assumptions which have the most significant effect on the result of the valuation are those relating to the rate of return on investments (i.e. the valuation rate of interest), the rates of increase in salary and pensions and the assumed rates of mortality. The financial assumptions were derived from market yields prevailing at the valuation date. An ‘inflation risk premium’ adjustment was also included by deducting 0.3% from the market-implied inflation on account of the historically high level of inflation implied by government bonds (particularly when compared to the Bank of England’s target of 2% for CPI which corresponds broadly to 2.75% for RPI per annum).
To calculate the technical provisions, it was assumed that the valuation rate of interest would be 6.1% per annum, salary increases would be 4.4% per annum (with short-term general pay growth at 3.65% per annum and an additional allowance for increases in salaries due to age and promotion reflecting historic scheme experience, with a further cautionary reserve on top for past service liabilities) and pensions would increase by 3.4% per annum for three years following the valuation then 2.6% per annum thereafter.
Standard mortality tables were used as follows:
Male members’ mortality S1NA (“light”) YoB tables - No age rating
Female members’ mortality S1NA (“light”) YoB tables - rated down one year
Use of these mortality tables reasonably reflects the actual USS experience but also provides an element of conservatism to allow for further
improvements in mortality rates; the CMI 2099 projections with a 1.25% pa long term rate were also adopted. The assumed life expectations on retirement at 65 are:
Males (females) currently aged 65 23.7 (25.6) years
Males (females) currently aged 45 25.5 (27.6) years
At the valuation date, the value of the assets of the scheme was £32,433.5 million and the value of the scheme’s technical provisions was £35,343.7 million indicating a shortfall of £2,910.2 million. The assets therefore were sufficient to cover 92% of the benefits which had accrued to members after allowing for expected future increases in earnings.
The actuary also valued the scheme on a number of other bases as at the valuation date. On the scheme’s historic gilts basis, using a valuation rate of interest in respect of past service liabilities of 4.4% per annum (the expected return on gilts) the funding level was approximately 68%. Under the Pension Protection Fund regulations introduced by the Pensions Act 2004, the scheme was 93% funded; on a buy-out basis (ie, assuming the scheme had discontinued on the valuation date) the assets would have been approximately 57% of the amount necessary to secure all the USS benefits with an insurance company; and using the FRS 17 formula as if USS was a single employer scheme, using a AA bond discount rate of 5.5% per annum based on spot yields, the actuary estimated that the funding level at 31 March 2011 was 82%.
As part of this valuation, the trustee has determined, after consultation with the employers, a recovery plan to pay off the shortfall by 31 March 2021. In 2011, the actuary estimated that if experience remained in line with the assumptions made, the shortfall at 31 March 2014 would be £2.2 billion, equivalent to a funding level of 95%.
However, changes in market conditions between March 2011 and March 2014 have had an impact on scheme funding. The next formal triennial actuarial valuation will take place as at 31 March 2014, and work is currently underway to update the actuarial assumptions and allow for any adjustments to the overall funding approach adopted by the trustee board in consultation with stakeholders.
As work on the 2014 valuation is not yet complete the trustee cannot provide the final figure; however, an estimate has been provided using the assumptions used to deliver the 2011 actual valuation. On that basis, the actuary has estimated that the funding level under the scheme funding regime will have fallen from 92% at 31 March 2011 to 85% at 31 March 2014. The estimate is based on the results from the valuation at 31 March 2011 allowing primarily for investment returns and changes to market conditions.

52
The funding level has decreased mainly due to a decrease in real gilt yields, reducing the implied net discount rate and therefore placing a higher value on the scheme liabilities. This increase has been partially offset by a higher than expected investment return.
On the FRS 17 basis, using an AA bond discount rate of 4.5% per annum based on spot yields, the actuary estimates that the funding level at 31 March was 75%. An estimate of the funding level measured on a historic gilt basis at that date was approximately 61%.
Surpluses or deficits which arise at future valuations may impact on the institution’s future contribution commitment. A deficit may require additional funding in the form of higher contribution requirements, where a surplus could, perhaps, similarly be used to reduce contribution requirements. The sensitivities regarding the principal assumptions used to measure the scheme liabilities on a technical provisions basis as at the date of the last triennial actuarial valuation are set out below;
Assumption Change in assumption Impact on shortfall
Investment return Decrease by 0.25% Increase by £1.6 billion
The gap between RPI and CPI Decrease by 0.25% Increase by £1 billion
Rate of salary growth Increase by 0.25% Increase by £0.6 billion
Members live longer than assumed One year longer Increase by £0.8 billion
Equity markets in isolation Fall by 25% Increase by £4.6 billion
The technical provisions relate essentially to the past service liabilities and funding levels, but it is also necessary to assess the ongoing costs of newly accruing benefits. The cost of future accrual was calculated using the same assumptions as those used to calculate the technical provisions but the allowance for promotional salary increases was not as high. Analysis has shown very variable levels of growth over and above general pay increases in recent years, and the salary growth assumption built into the cost of future accrual is based on more stable, historic, salary experience. However, when calculating the past service liabilities of the scheme, a cautionary reserve has been included, in addition, on account of the variability mentioned above.
As at the 2011 valuation, the scheme was still a fully final salary scheme for future accruals and the prevailing employer contribution rate was 16% of salaries.
Following UK government legislation, from 2011 statutory pension increases or revaluations are based on the Consumer Price Index measure of price inflation. Historically these increases had been based on the Retail Prices Index measure of price inflation.
Since the valuation effective date of 31 March 2011 there have been a number of changes to the benefits provided by the scheme although these became effective from October 2011. These include:
New entrantsOther than in specific, limited circumstances, new entrants are now provided benefits on a Career Revalued Benefits (CRB) basis rather than a Final Salary (FS) basis.
Normal pension ageThe normal pension age was increased for future service and new entrants to age 65.
Flexible retirementFlexible retirement options were introduced.
Member contributions increased Contributions were uplifted to 7.5% p.a. and 6.5% p.a. for FS section members and CRB section members respectively.
Cost sharingIf the total contribution level exceeds 23.5% of salaries per annum, the employers will pay 65% of the excess over 23.5% and members would pay the remaining 35% to the fund as additional contributions.
Pension increase capFor service derived after 30 September 2011, USS will match increases in official pensions for the first 5%. If official pensions increase by more than 5% then USS will pay half of the difference up to a maximum increase of 10%.
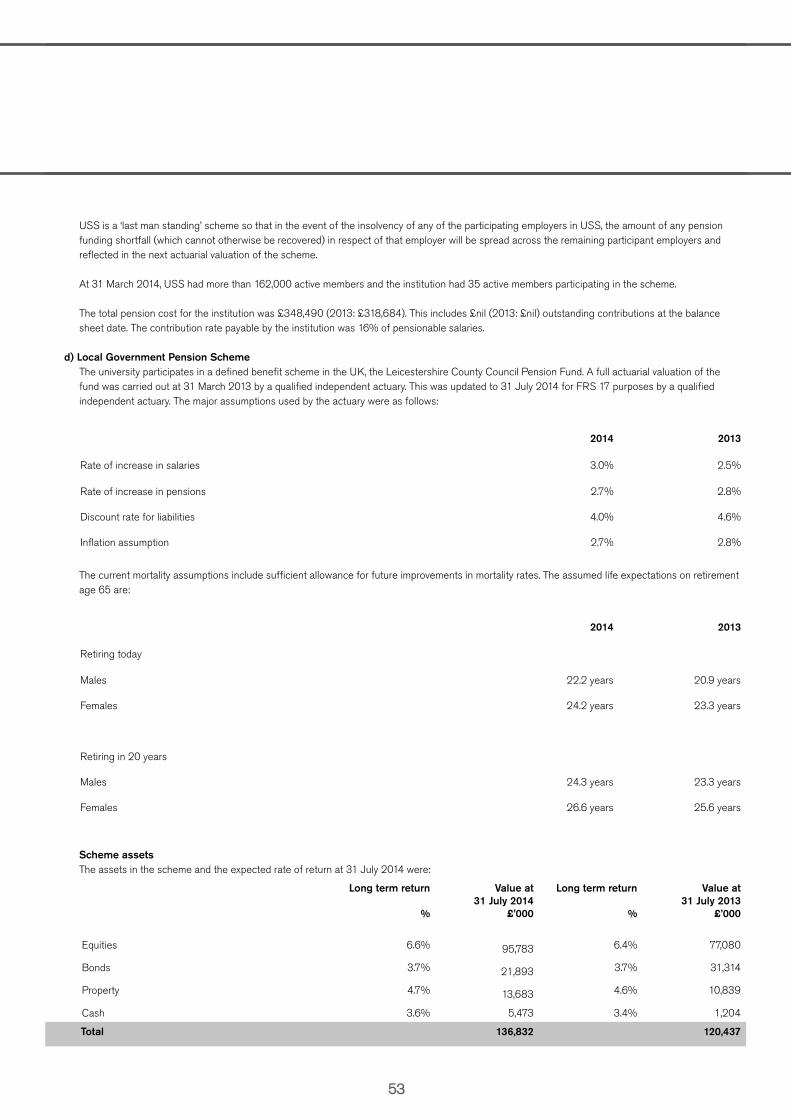
53
The funding level has decreased mainly due to a decrease in real gilt yields, reducing the implied net discount rate and therefore placing a higher value on the scheme liabilities. This increase has been partially offset by a higher than expected investment return.
On the FRS 17 basis, using an AA bond discount rate of 4.5% per annum based on spot yields, the actuary estimates that the funding level at 31 March was 75%. An estimate of the funding level measured on a historic gilt basis at that date was approximately 61%.
Surpluses or deficits which arise at future valuations may impact on the institution’s future contribution commitment. A deficit may require additional funding in the form of higher contribution requirements, where a surplus could, perhaps, similarly be used to reduce contribution requirements. The sensitivities regarding the principal assumptions used to measure the scheme liabilities on a technical provisions basis as at the date of the last triennial actuarial valuation are set out below;
Assumption Change in assumption Impact on shortfall
Investment return Decrease by 0.25% Increase by £1.6 billion
The gap between RPI and CPI Decrease by 0.25% Increase by £1 billion
Rate of salary growth Increase by 0.25% Increase by £0.6 billion
Members live longer than assumed One year longer Increase by £0.8 billion
Equity markets in isolation Fall by 25% Increase by £4.6 billion
The technical provisions relate essentially to the past service liabilities and funding levels, but it is also necessary to assess the ongoing costs of newly accruing benefits. The cost of future accrual was calculated using the same assumptions as those used to calculate the technical provisions but the allowance for promotional salary increases was not as high. Analysis has shown very variable levels of growth over and above general pay increases in recent years, and the salary growth assumption built into the cost of future accrual is based on more stable, historic, salary experience. However, when calculating the past service liabilities of the scheme, a cautionary reserve has been included, in addition, on account of the variability mentioned above.
As at the 2011 valuation, the scheme was still a fully final salary scheme for future accruals and the prevailing employer contribution rate was 16% of salaries.
Following UK government legislation, from 2011 statutory pension increases or revaluations are based on the Consumer Price Index measure of price inflation. Historically these increases had been based on the Retail Prices Index measure of price inflation.
Since the valuation effective date of 31 March 2011 there have been a number of changes to the benefits provided by the scheme although these became effective from October 2011. These include:
New entrantsOther than in specific, limited circumstances, new entrants are now provided benefits on a Career Revalued Benefits (CRB) basis rather than a Final Salary (FS) basis.
Normal pension ageThe normal pension age was increased for future service and new entrants to age 65.
Flexible retirementFlexible retirement options were introduced.
Member contributions increased Contributions were uplifted to 7.5% p.a. and 6.5% p.a. for FS section members and CRB section members respectively.
Cost sharingIf the total contribution level exceeds 23.5% of salaries per annum, the employers will pay 65% of the excess over 23.5% and members would pay the remaining 35% to the fund as additional contributions.
Pension increase capFor service derived after 30 September 2011, USS will match increases in official pensions for the first 5%. If official pensions increase by more than 5% then USS will pay half of the difference up to a maximum increase of 10%.
USS is a ‘last man standing’ scheme so that in the event of the insolvency of any of the participating employers in USS, the amount of any pension funding shortfall (which cannot otherwise be recovered) in respect of that employer will be spread across the remaining participant employers and reflected in the next actuarial valuation of the scheme.
At 31 March 2014, USS had more than 162,000 active members and the institution had 35 active members participating in the scheme.
The total pension cost for the institution was £348,490 (2013: £318,684). This includes £nil (2013: £nil) outstanding contributions at the balance sheet date. The contribution rate payable by the institution was 16% of pensionable salaries.
d) Local Government Pension Scheme The university participates in a defined benefit scheme in the UK, the Leicestershire County Council Pension Fund. A full actuarial valuation of the fund was carried out at 31 March 2013 by a qualified independent actuary. This was updated to 31 July 2014 for FRS 17 purposes by a qualified independent actuary. The major assumptions used by the actuary were as follows:
2014 2013
Rate of increase in salaries 3.0% 2.5%
Rate of increase in pensions 2.7% 2.8%
Discount rate for liabilities 4.0% 4.6%
Inflation assumption 2.7% 2.8%
The current mortality assumptions include sufficient allowance for future improvements in mortality rates. The assumed life expectations on retirement age 65 are:
2014 2013
Retiring today
Males 22.2 years 20.9 years
Females 24.2 years 23.3 years
Retiring in 20 years
Males 24.3 years 23.3 years
Females 26.6 years 25.6 years
Scheme assets
The assets in the scheme and the expected rate of return at 31 July 2014 were:
Long term return
%
Value at 31 July 2014
£’000
Long term return
%
Value at 31 July 2013
£’000
Equities 6.6% 95,783 6.4% 77,080
Bonds 3.7% 21,893 3.7% 31,314
Property 4.7% 13,683 4.6% 10,839
Cash 3.6% 5,473 3.4% 1,204
Total 136,832 120,437

54
The following amounts at 31 July were measured in accordance with the requirements of FRS 17:
2014£’000
2013 £’000
Fair value of employer assets 136,832 120,437
Present value of scheme liabilities (205,547) (159,514)
Deficit in the scheme - net pension liability (68,715) (39,077)
Analysis of amounts charged to Income and Expenditure Account 2014£’000
2013 £’000
Charged to staff costs
Past service cost -Curtailment and settlements (211) (274)
Employer contributions 4,588 4,069
337 658
Financing:
Expected return on pension scheme assets 6,657 4,975
Interest on scheme liabilities (7,356) (5,936)
Net charge (699) (961)
Net income and expenditure account cost (362) (303)
2014 £’000
2013£’000
Amounts recognised in the statement of total recognised gains and losses
Actual return less expected return on pension scheme assets (29,276) (4,042)
Actuarial losses in pension plan recognised (29,276) (4,042)
Cumulative actuarial losses (44,264) (14,988)
Movement in deficit during the year 2014 £’000
2013£’000
Deficit on scheme at 1 August (39,077) (34,732)
Movements in year:
- Current service cost (4,040) (3,137)
- Employer contributions 4,588 4,069
- Impact of settlements and curtailments (211) (274)
- Net return on assets (699) (961)
Total impact on income and expenditure account (see note 18) (362) (303)
- Actuarial losses (29,276) (4,042)
Total movement in the year (29,638) (4,345)
Deficit on scheme at 31 July (68,715) (39,077)
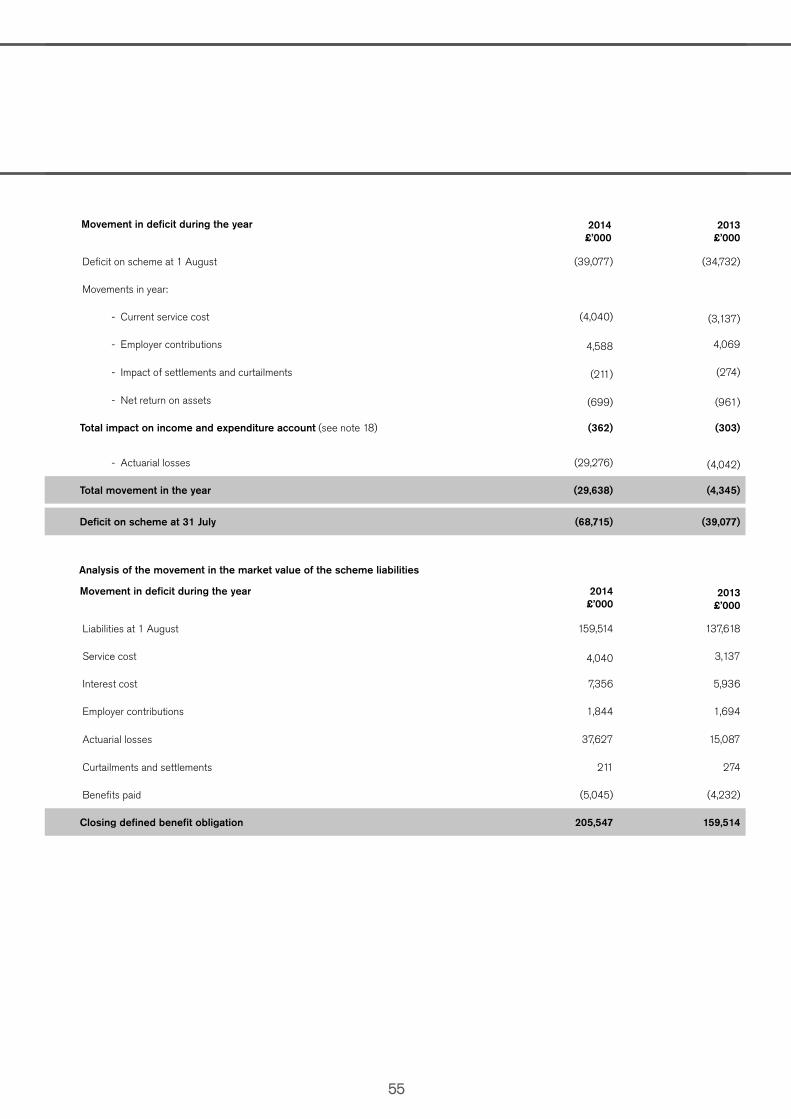
55
Movement in deficit during the year 2014 £’000
2013£’000
Deficit on scheme at 1 August (39,077) (34,732)
Movements in year:
- Current service cost (4,040) (3,137)
- Employer contributions 4,588 4,069
- Impact of settlements and curtailments (211) (274)
- Net return on assets (699) (961)
Total impact on income and expenditure account (see note 18) (362) (303)
- Actuarial losses (29,276) (4,042)
Total movement in the year (29,638) (4,345)
Deficit on scheme at 31 July (68,715) (39,077)
Analysis of the movement in the market value of the scheme liabilities
Movement in deficit during the year 2014 £’000
2013£’000
Liabilities at 1 August 159,514 137,618
Service cost 4,040 3,137
Interest cost 7,356 5,936
Employer contributions 1,844 1,694
Actuarial losses 37,627 15,087
Curtailments and settlements 211 274
Benefits paid (5,045) (4,232)
Closing defined benefit obligation 205,547 159,514

56
Analysis of the movement in the market value of scheme assets 2014 £’000
2013£’000
Opening fair value of asset plans 120,437 102,886
Expected return on assets 6,657 4,975
Contributions by members 1,844 1,694
Contributions by employer 4,588 4,069
Actuarial gains 8,351 11,045
Estimated benefits paid (5,045) (4,232)
Total 136,832 120,437
History of experience gains and losses
The experience gains and losses for the year ended 31 July 2014 were as follows:
2014£’000
2013£’000
2012£’000
2011£’000
2010£’000
Difference between the expected and actual return on scheme assets 8,351 11,045 (5,737) 1,255 6,328
Percentage of scheme assets 6.1% 9.2% (5.6%) 1.3% 6.7%
Experience (losses)/gains on liabilities (5,811) (131) (1,586) 5,282 -
Percentage of the total present value of scheme liabilities (2.8%) (0.1%) (1.2%) 4.0% 0.0%
Total actuarial losses/(gains) 29,276 4,042 1,890 (20,515) 871
Percentage of the present value of scheme liabilities 14.2% 2.5% 1.4% (15.6%) 0.6%
Sensitivity analysisThe sensitivities regarding the principal assumptions used to measure the scheme liabilities are set out below:
Change in assumptions at 31 July 2014 Approximate % increase to employer liability
Approximate monetary amount
£’000
0.5% decrease in real discount rate 11% 23,388
One year increase in member life expectancy 3% 6,166
0.5% increase in the salary rate increase rate 4% 7,625
0.5% increase in the pension increase rate 8% 15,477

57
29. Financial instruments
Risk management
The group operates a centralised treasury function which is responsible for managing the credit, liquidity, interest and foreign currency risk associated with the group’s activities. These financial risks are managed within parameters specified by the treasury management policy. Treasury management policy of the group governs all treasury management activities and sets out relevant policy objectives and control measures as driven by the University Financially Sustainability Framework. It is reviewed and approved by the University Finance and Human Resources Committee annually. Treasury management policy adopts the key recommendations of the Code of Practice on Treasury Management in Public Services as issued by Chartered Institute of Public Finance and Accountancy (CIPFA) as recommended by the Higher Education Funding Council for England (HEFCE).
The group’s principal financial instruments are the bond, cash, short term deposits and investments. The core objective of these financial instruments is to meet financing needs of the group’s operations. Additionally, the group has other financial assets and liabilities arising directly from its operations i.e. trade debtors and creditors.
Credit risk
Credit risk refers to the risk that a counterparty will default on its contractual obligations resulting in financial loss to the group. The group’s Treasury Management Policy and Bad Debt Write Off Policy lay out the framework for credit risk management. Credit risk is monitored on an on-going basis. The group’s credit risk arises from bank balances, investments, student debtors and government and commercial organisations as customers. Management of credit risk is a prime objective of treasury management policy. At 31 July 2014, the maximum exposure is represented by the carrying value of each financial asset in the balance sheet.
Student, government and commercial debtors are reviewed on an on-going basis and bad debt provisions are made if recovery of credit becomes uncertain. A debtor deemed irrecoverable is written off in accordance with Bad Debt Write Off policy. The concentration of risk is limited due to the student base being large and diverse. Treasury management policy states maximum level of investments for each counterparty to mitigate risk concentration. Similarly, the group’s investment decisions are based on strict minimum credit worthiness criteria to ensure the safety of cash and investments. Credit worthiness of the group’s banks and money market funds is regularly monitored. Generally, the group does not require collateral against financial assets.
Liquidity risk
Liquidity risk refers to the risk that the group will not be able to meet its financial obligations as they fall due. Regular monitoring of liquidity risk is an essential feature of treasury management activities.
Formal cash flow forecasts are developed, monitored and updated to ensure that adequate working capital is available and excess funds are invested to reduce the carrying cost of funds. The group policy is to maintain a minimum liquidity of one month expenditure plus 20% reserve and invest excess funds for maturity of no more than three years. At 31 July 2014, the group is holding cash deposits and investments of various maturities, none of which is greater than 12 months. The average maturity of all deposits and investments is 63 days. The group’s £1m overdraft facility with National Westminster Bank remained undrawn at the balance sheet date.
The long term financing of the group relies on £90m plus £20m retained bonds, unsecured Eurobonds maturing in June 2042. Any retained bonds held by or on behalf of the group shall be cancelled (A) at any time at the option of the group and (B) in any event on 18 July 2017. The capital amount will be paid at maturity and coupon of 5.375% is paid semi-annually. The group may, at its option, redeem all, or from time to time any part of, the bonds at the higher of the following:
(a) the principal amount of the bonds to be redeemed; (b) the sum of the Gross Redemption Yield of the benchmark gilt (4.50% Treasury Gilt 2042) and 0.40% plus accrued interest.

58
Unless previously redeemed or purchased and cancelled, the bonds will be redeemed at their principal amount on 30 June 2042. Under the terms of the bonds, for so long as any of the bonds remains outstanding, in respect of each financial year, the group is to ensure that its total borrowing costs (as defined by the trust deed) do not exceed 7% of the aggregate of:
(a) Its total consolidated income for the financial year (b) The total cash of the group as at the end of the financial year
For financial year ending on 31 July 2014, the ratio was 2.8% (2012/13 3.2%). The bonds may be redeemed at the option of the holder subject to happening of certain events mentioned in the bond trust deed. Moody’s improved the credit rating of the bonds from Aa2 negative to Aa2 stable in April 2014. Please see Note 19 (a) for the maturity profile of all borrowings.
Foreign currency risk
Foreign currency risk refers to the risk that the unfavourable movements in foreign exchange rate may cause financial loss to the group. The group’s principal foreign currency exposures generally arise from research related receipts and payments denominated in euros. There are ring-fenced euro bank accounts, set up especially for research projects funded in euros. All other receipts in foreign currencies are converted into pound sterling unless required for immediate foreign currency payments. Overall foreign currency exposure is immaterial, being an insignificant portion of the total income and expenditure. At 31 July 2014, the sterling equivalent of all euro bank balances was £0.5m (2012/13: £0.7m). Interest rate risk
Interest rate risk refers to the likelihood that changes in interest rates will result in fluctuations of the value of balance sheet items (i.e. price risk) or changes in interest income or expenses (i.e. re-investment risk).
The group’s main financing relates to 30 years £110m bonds. At 31 July 2014, balance sheet values of deposits and investments are not exposed to changes in interest rates. However, the group’s interest and investment income is exposed to changes in interest rates i.e. reinvestment rate risk. The group is prepared to accept re-investment risk to exploit opportunities where yield can be maximised without compromising capital base of the investment. The group has no outstanding derivative instruments as at 31 July 2014.
Financial instruments - fair values
The fair values of each category of the group’s financial instruments are the same as their carrying values in the group’s balance sheet, other than as noted below:
2013/14 Carrying value
£m
2013/14Fair value
£m
2012/13Carrying value
£m
2012/13Fair value
£m
5.375%, unsecured bonds due 2042
86.3 108.9 86.1 108.3
The bond is listed on the London Stock Exchange, therefore, categorised as Level 1 under the requirements of FRS 29 (IFRS 7) and valued using quoted ask price as at 31 July 2014 in compliance with FRS 26 (IAS 39). The fair value of the bond is its market value at the balance sheet date. Market value includes accrued interest and changes in credit risk and interest rate risk, and is therefore different to the reported carrying amounts.

59
NOTES

60

61

62
De Montfort UniversityThe GatewayLeicester LE1 9BH, UK
T: +44 (0)116 250 60 70E: [email protected]: dmu.ac.uk
ALTERNATIVE FORMATSWhere possible DMU publications or specific sections can be supplied in alternative media. For further information on how we can help, please contact us on +44 (0)116 250 60 70 or via email at [email protected]
©De Montfort University, December 2014.