Embed Size (px)
Citation preview

28
Annexure – 1(a): Land use details
Revised Comprehensive Development Plan of Hubli- Dharwad, Hubli 2021
Existing land use:
The land use pattern planned for the Planning District (Hubli) for the planning
year 2021 is as enumerated in the following table. It is observed that the proposed
project site is located in Commercial zone. The overall land use proposed for the
contained planning district as per the Revised Comprehensive Development Plan of
Hubli- Dharwad, Hubli 2021, is shown in the above fig.
Project
Site

29
Proposed Land use Analysis of Revised Comprehensive Development Plan
of Hubli- Dharwad, Hubli 2021
Land Use Area in
Hectare % of Total
Residential 3004.83 44.87
Commercial 444.86 6.64
Industrial 407.59 6.09
Public and Semi Public 312.62 4.67
Parks & open Spaces 773.42 11.55
Transportation 1752.18 26.18
Total 6695.50 100
Agricultural Land 100

30
Aerial view covering 500 m radius
Latitude : 15 Deg 21 Min 12.13 Sec N Longitude: 75 Deg 07 Min 51.62 Sec E
Hosur
Hubballi-Dharwad
Highway
Karwar road
Gamanagatti road
New cotton
market
KSRTC
depot
Hosur-
Unakal
bypass road
Project
Site
500 m

31
Topo map covering 10km radius
10 km PROJECT SITE
Scale: 1cm: 0.5km 20cm: 10km

32
Table: Land Use within the site
Sl. No. Land use Area in Sqmt In %
A. Total Site Area 40,945.60 100
1. Ground Coverage Area 16,822.79 41.08
2. Landscape Area 9,205.10 22.48
3. Driveway area 7,604.55 18.57
4. Area reserved for Future
Development 7,313.16 17.87
Annexure 1(b): Views of the project site dated: 12.07.2016

33
Annexure 1(c): Soil test report
Sl No Soil Properties Test Values
Pit No - 1 Pit No - 2
1. Natural Moisture Content (%) 8.16 8.86
2. Inplace Dry Density (KN/m3) 14.05 15.70
3. Specific Gravity ‘G’ 2.60 2.54
4. Voids ratio ‘e’ 0.81 0.58
5. Shear
Parameters
Cohesion (KN/m2) 31.0 26.0
Angle of shearing
resistance (degree)
15.0 18.0
SBC of Soil (KN/m2) 67.54 72
6. Factor of Safety 3.0 3.0
7. At Depth ‘m’ 1.0 1.30
34
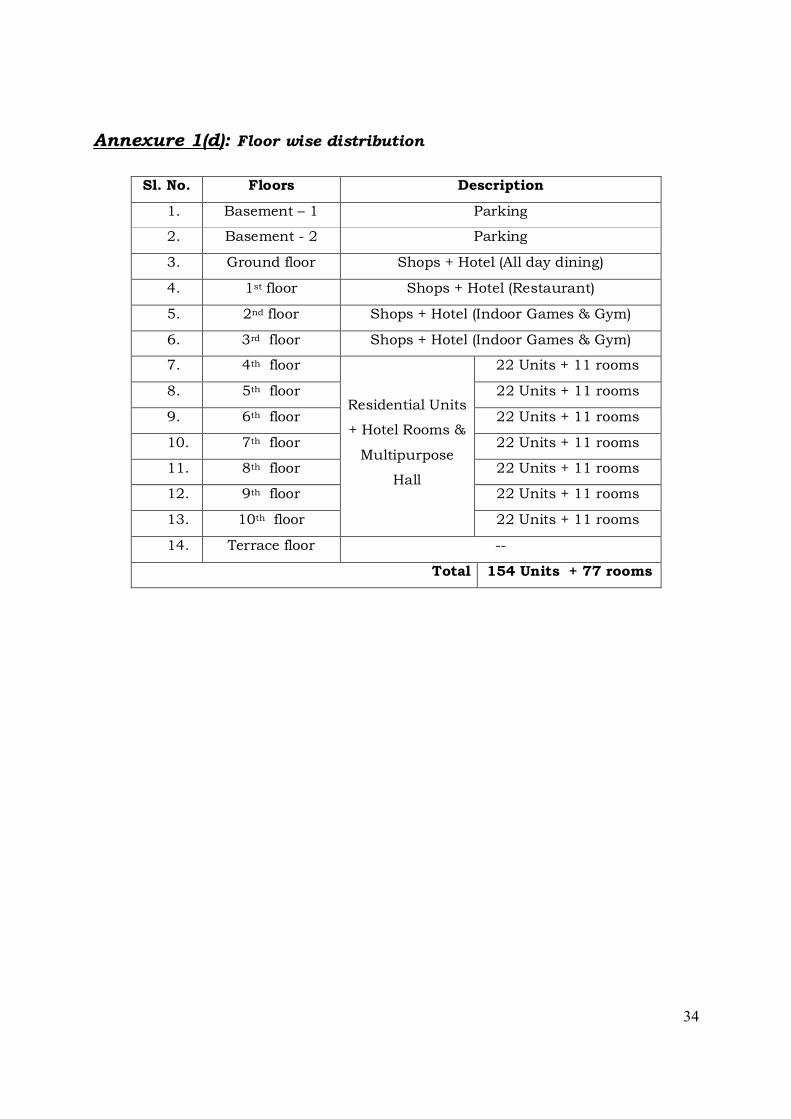
Annexure 1(d): Floor wise distribution
Sl. No. Floors Description
1. Basement – 1 Parking
2. Basement - 2 Parking
3. Ground floor Shops + Hotel (All day dining)
4. 1st floor Shops + Hotel (Restaurant)
5. 2nd floor Shops + Hotel (Indoor Games & Gym)
6. 3rd floor Shops + Hotel (Indoor Games & Gym)
7. 4th floor
Residential Units
+ Hotel Rooms &
Multipurpose
Hall
22 Units + 11 rooms
8. 5th floor 22 Units + 11 rooms
9. 6th floor 22 Units + 11 rooms
10. 7th floor 22 Units + 11 rooms
11. 8th floor 22 Units + 11 rooms
12. 9th floor 22 Units + 11 rooms
13. 10th floor 22 Units + 11 rooms
14. Terrace floor --
Total 154 Units + 77 rooms

35
Annexure 1(e): Waste Management
CONSTRUCTION PHASE:
1. SOLID WASTE GENERATION
Construction waste is generated during construction works. It mainly consists of
earth, stones, bricks, inert and non-biodegradable material such as concrete, plaster,
metal, wood, plastics etc & small quantity of domestic solid waste. The retrievable
items such as bricks, wood, metals are recycled; the domestic waste will be segregated
and will not be allowed to mix with construction waste. The excavated earth and other
wastes will be used for landscaping within the site premises.
2. DOMESTIC SEWAGE
The domestic sewage generated is about 11.4 KLD during construction; which
will be collected in collection tank and will be lifted to KUWS&DB treatment plant.
OPERATION PHASE:
1. SOLID WASTE GENERATION
The solid wastes generated during operation phase can be categorized under
three groups:
Wet Garbage like Food waste, Lawn mowing wastes etc.
Dry Garbage such as Paper, Plastic, Bottles, etc.
Sludge from Sewage Treatment Plant (STP)
Domestic/Residential Waste:
This category of waste comprises the solid wastes that originate from single and
multi – family household units. These wastes are generated as a consequence of
household activities such as cooking, cleaning, repairs, hobbies, redecoration, empty
containers, packaging, clothing, old books, writing/new paper, and old furnishings.
Households also discard bulky wastes such as furniture and large appliances which
cannot be repaired and used.
Central Pollution Control Board (CPCB) has sponsored a survey to ascertain the
status of municipal solid waste disposal in metro cities, Class-I cities and Class-II

36
towns of India. As per the survey, the per capita generation of solid waste was found to
vary from 0.019 kg/day to 0.747 kg/person/day.
The quantity and typical characteristics of domestic solid waste likely to be
generated during operational phase are given in following table. The composition of
garbage in India indicates lower organic matter and high ash or dust contents. It has
been estimated that recyclable content in solid wastes varies from 13 to 20% and
combustible material is about 80-85%.
Quantity and characteristics of Domestic Solid waste
Quantity per day 2,222 kg
Physical Characteristics Range (% by weight)
Paper 0.81
Plastic 0.5-0.9
Metals 0.3-0.9
Glass 0.3-0.9
Ash, Fine Earth, Stones 25-45
Vegetables, Leaves 40-75
Chemical Characteristics
Range (% by weight)
Moisture content 40-45
Total nitrogen 0.5-0.65
Phosphorous (as P2O5) 0.5-0.85
Potassium (as K2O) 0.7-0.8
Organic matter 32-40
Calorific value (kcal/kg) 800-1050
Source: Nationwide survey sponsored by CPCB to ascertain the status of municipal
solid waste disposal in Indian cities

37
GENERATION:
Sl No
Activity
No of keys/ Units/area
Rate of Occupancy
No of Persons
Organic waste
kg/person/day
Inorganic waste
kg/person/day
Total organic waste
kg/day
Total Inorganic
waste kg/day
Total Waste kg/day
1. Residential 154 5 770 0.3 0.2 231 154 385
2. Commercial
Shops
Ground Floor – 7500 sqmt
1person/ 3sqmt
2500 0.1 0.15 250 375 625
1st Floor – 7500 sqmt
1person/ 6sqmt
1250 0.1 0.15 125 187.5 312.5
2nd Floor – 7500 sqmt
1person/ 6sqmt
1250 0.1 0.15 125 187.5 312.5
3rd Floor – 7500 sqmt
1person/ 6sqmt
1250 0.1 0.15 125 187.5 312.5
3. Hotel Rooms – 77 Nos
2 persons/ room
154 0.3 0.2 46.2 30.8 77
Restau
rant -- 245 0.25 0.2 61.25 49 110.25
Indoor Games & Gym area -980 sqmt
1person/ 10sqmt
98 0.1 0.15 9.8 14.7 24.5
Staff -- 150 0.1 0.15 15 22.5 37.5
For Kitchen &
Others service
s
15 10 25
Total 1003.25
say 1,003
1218.5 Say
1,219
2221.75say
2,222
The total quantity of solid waste generated from the proposed project will be
2,222 kg/day, which will be disposed off safely.

38
Management:
Biodegradable wastes:
Biodegradable wastes will be segregated and will be processed in proposed
organic waste converter.
Non-biodegradable Wastes:
The recyclable portion like plastics, glass, metals etc. will be given to the waste
recyclers.
Hazardous wastes like waste oil from DG sets, used batteries etc. will be handed
over to the authorized hazardous waste recyclers.
E-Wastes will be collected separately & it will be handed over to authorized E-
waste recyclers for further processing.
2. SEWAGE TREATMENT PLANT
The sewage generated is about 431 KLD, 95% of the total water requirement.
This sewage will be treated in a Sewage Treatment Plant with designed capacity of
435KLD using MBBR (Moving bed bio-film reactor) technology. Sufficient area for this
plant has been earmarked in the layout plan. The treated water will be utilized for
secondary purposes like gardening, for flushing, for vehicle washing & for common
area floor washing.
Design detail of Sewage Treatment Plant is enclosed in the proceeding section.

FEASIBILITY REPORT FOR SEWAGE TREATMENT PLANT OF CAPACITY 435 M3/DAY FOR AKRUTI LIFESTYLE HUBLI
PROJECT
i i
FEASIBILITY REPORT ON
SEWAGE TREATMENT PLANT
FOR
M/s. SHETTY-PATIL DEVELOPERS LLP, BENGALURU
PROJECT : DEVELOPMENT OF RESIDENTIAL AND COMMERCIAL APARTMENT FOR AKRUTI LIFESTYLE, HUBLI .
ARCHITECTS
M/s. AXES ARCHITECTURAL CONSULTANTS
19, SF, METROPOLIS, Koppikar Road,
Hubli-580020
MEP CONSULTANTS
M/s. SGI STUDIO GALLI INGEGNERIA INDIA PVT. LTD.
Panama House, 6th Floor, S. No. 204 -206,
Viman Nagar, Pune - 411014
Email:[email protected]
Website : www.sampathkumarassociates.com

FEASIBILITY REPORT FOR SEWAGE TREATMENT PLANT OF CAPACITY 435 M3/DAY FOR AKRUTI LIFESTYLE HUBLI
PROJECT
ii ii
CONTENTS
1 DESIGN BASIS ............................................................................................................................................ 1
1.1 FLOW CHARACTERISTICS ....................................................................................................................... 1
1.2 RAW SEWAGE CHARACTERISTICS ...................................................................................................... 1
2 TECHNOLOGY ............................................................................................................................................ 2
2.1 MOVING BED BIOFILM REACTOR (MBBR) ....................................................................................... 2
3 ADVANTAGES OF MBBR TECHNOLOGY ............................................................................................ 5
3.1 COMPACT ........................................................................................................................................................ 5
3.2 ROBUSTNESS AND OPERATIONAL RELIABILTY ............................................................................ 5
3.3 FLEXIBILITY .................................................................................................................................................. 5
3.4 SELF CONTROLLING BIOMASS .............................................................................................................. 5
3.5 EASY UPGRADATION OF EXISTING ACTIVATED SLUDGE/EXTENDED AERATION ........ 5
4 PROCESS FLOW DIAGRAM .................................................................................................................... 6
5 PROCESS DESCRIPTION ......................................................................................................................... 7
5.1 SCREENING .................................................................................................................................................... 7
5.2 SEWAGE EQUALIZATION AND PUMPING SYSTEM: ...................................................................... 7
5.3 MBBR TREATMENT .................................................................................................................................... 7
5.3.1 BOD removal chamber ................................................................................................................ 7
5.4 AERATION SYSTEM: ......................................................................................................................................... 8
5.5 SETTLING TANK ........................................................................................................................................... 8
5.6 DISINFECTION SYSTEM: ........................................................................................................................... 8
5.7 PRESSURE SAND FILTRATION ............................................................................................................... 8

FEASIBILITY REPORT FOR SEWAGE TREATMENT PLANT OF CAPACITY 435 M3/DAY FOR AKRUTI LIFESTYLE HUBLI
PROJECT
iii iii
5.8 ACTIVATED CARBON FILTRATION ...................................................................................................... 9
5.9 SLUDGE HANDLING SYSTEM .................................................................................................................. 9
6 CIVIL TANK DETAILS ............................................................................................................................ 10
7 AIR REQUIREMENT AND SLUDGE CALCULATION ....................................................................... 11
7.1 EQUALIZATION TANK ............................................................................................................................. 11
7.2 AERTION TANK .......................................................................................................................................... 11
7.3 SLUDGE HOLDING TANK ........................................................................................................................ 12

FEASIBILITY REPORT FOR SEWAGE TREATMENT PLANT OF CAPACITY 435 M3/DAY FOR AKRUTI LIFESTYLE HUBLI
PROJECT
iv iv
LIST OF TABLES
Table 1.1: SEWAGE CHARACTRISTICS .................................................................................................................................. 1
Table 6.1: DETAILS OF CIVIL UNIT ...................................................................................................................................... 10

FEASIBILITY REPORT FOR SEWAGE TREATMENT PLANT OF CAPACITY 435 M3/DAY FOR AKRUTI LIFESTYLE HUBLI
PROJECT
v v
LIST OF FIGURES
Figure 2.1: Example of carrier media. K1 & K3 .................................................................................................................. 2
Figure 2.2: At the carriers, the microorganisms grow as biofilm ............................................................................... 3
Figure 2.3: A coarse bubble aeration system supplies the MBBRTM biofilm process with oxygen ............ 3
Figure 2.4: Grids and sieves at the outlet keep the carriers in the reactor ............................................................ 4
Figure 4.1:PROCESS FLOW DIAGRAM ................................................................................................................................... 6

FEASIBILITY REPORT FOR SEWAGE TREATMENT PLANT OF CAPACITY 405 M3/DAY FOR AKRUTI LIFESTYLE HUBLI
PROJECT
1
1 DESIGN BASIS
The Sewage Treatment Plant has been designed based on the following parameters. Based on enquiry
details, we have designed the plant for hydraulic load of 535 m3/day.
1.1 FLOW CHARACTERISTICS
Total Water Demand : 453680 Liters/Day
Assuming Diversity Factor : 0.95 x 453680 = 431000 Liters/day
Say Average Daily Flow : 431 m3/day
Considered STP Capacity : 435 m3/day
Average Hourly flow : 18.125 m3/hr.
Peak flow : 54.375 m3/hr.
1.2 RAW SEWAGE CHARACTERISTICS
Table 1.1: SEWAGE CHARACTRISTICS
PARAMETER INLET VALUE OUTLET VALUE
pH 6.5-8.5 6.5-8.5
BOD3 250-300 <10
COD 400-500 <50
Suspended Solids 200-300 <10
Free Oil & Grease 15-20 <5
All units are in mg/l except pH.

FEASIBILITY REPORT FOR SEWAGE TREATMENT PLANT OF CAPACITY 405 M3/DAY FOR AKRUTI LIFESTYLE HUBLI
PROJECT
2
2 TECHNOLOGY
2.1 MOVING BED BIOFILM REACTOR (MBBR)
The MBBRTM biofilm technology has been used for about 20 years for green field wastewater
treatment plants as well as supplementing old ones. The technology may be used for industrial as well
as municipal wastewaters.
The Moving Bed biofilm reactor is a patented process based on MBBR biofilm technology. It utilizes the
advantages of activated sludge and previous biofilm systems without being restrained by their
disadvantages. The basic idea behind MBBR is to have a continuously operating, non-cloggable biofilm
reactor with no need for backwashing, low head loss and high specific biofilm surface area. This is
achieved by growing biofilm on small carrier elements (Picture 1) that move along with water in the
reactor. The movement is caused by the aeration in the reactor. The carrier element is made of
polyethylene or polypropylene with a density of slightly less than water and shaped like small
cylinders about 9-64 mm in diameter, depending on the application. The filling rate of carriers in the
reactor may vary between 10 and 65 %, also depending on the application.
Figure 2.1: Example of carrier media. K1 & K3
The microorganisms grow on the carriers as a biofilm, see Picture 2. In the biofilm, the
microorganisms are well protected which makes the process tolerant towards variations and
disturbances and even extreme loads can be handled. With the MBBRTM biofilm technology, the
process can be made very compact, since the microorganisms in the biofilm are very efficient. The
process is also easy to maintain and the amount of active biomass is self-regulated and depends on
incoming load and hydraulic retention time. Since the carriers are continuously moving, the process is
insensitive to suspended solids in influent wastewater.

FEASIBILITY REPORT FOR SEWAGE TREATMENT PLANT OF CAPACITY 405 M3/DAY FOR AKRUTI LIFESTYLE HUBLI
PROJECT
3
Figure 2.2: At the carriers, the microorganisms grow as biofilm
The oxygen needed by the microorganisms in the process is supplied through an aeration grid
covering the bottom of the reactor, see Picture 3. The aeration is at the same time keeping the reactor
content completely mixed.
Figure 2.3: A coarse bubble aeration system supplies the MBBRTM biofilm process with oxygen
In order to retain the carrier elements in the reactor, a sieve is placed at the outlet of the reactor,
Picture 4. The air agitation is arranged so that the carrier elements are constantly being moved
upward over the surface of the sieve. This creates a scrubbing action that prevents clogging. Both the
aeration system and the sieves are designed to work well with the chosen carrier elements.
The produced excess sludge sloughs of the carrier media, bypasses the outlet sieves and passes to the
post-treatment step for further treatment and ultimate removal.

FEASIBILITY REPORT FOR SEWAGE TREATMENT PLANT OF CAPACITY 405 M3/DAY FOR AKRUTI LIFESTYLE HUBLI
PROJECT
4
Figure 2.4: Grids and sieves at the outlet keep the carriers in the reactor

FEASIBILITY REPORT FOR SEWAGE TREATMENT PLANT OF CAPACITY 405 M3/DAY FOR AKRUTI LIFESTYLE HUBLI
PROJECT
5
3 ADVANTAGES OF MBBR TECHNOLOGY
3.1 COMPACT
1. Smaller Foot Prints
2. Low Investment Cost
3.2 ROBUSTNESS AND OPERATIONAL RELIABILTY
1. Stable under large load variations
2. Tolerant to disturbances
3. Recovery very quickly after major upsets
4. No Clogging of reactors
5. No risk of Sludge Bulking
3.3 FLEXIBILITY
1. Almost all shape of reactor can be utilized
2. Possibility to utilize existing tanks for Bioreactors
3. East to expand in future
4. Can be upgraded from initial design – add more media
3.4 SELF CONTROLLING BIOMASS
1. No F/M ratio , SVI, Sludge Wasting Rates
2. No MLSS to be maintained
3.5 EASY UPGRADATION OF EXISTING ACTIVATED SLUDGE/EXTENDED AERATION
1. Minimal or no civil works requirement

FEASIBILITY REPORT FOR SEWAGE TREATMENT PLANT OF CAPACITY 405 M3/DAY FOR AKRUTI LIFESTYLE HUBLI
PROJECT
6
4 PROCESS FLOW DIAGRAM
Figure 4.1:PROCESS FLOW DIAGRAM
COURSE EQUALIZATION
TANK
BOD
REMOVAL
TREATED
SEWAGE
FILTRATION
FOCCULATION
DISINFECTION
BY OZONE
SLUDGE
HOLDING TANK
SEDIMENTATION
FLOCCULATION
FILTER PRESS
Sludge for Dispose
Liquid to EQT

FEASIBILITY REPORT FOR SEWAGE TREATMENT PLANT OF CAPACITY 405 M3/DAY FOR AKRUTI LIFESTYLE HUBLI
PROJECT
7
5 PROCESS DESCRIPTION
5.1 SCREENING
The incoming raw sewage is screened before proceeding to the treatment plant. A coarse screen of
10mm shall be used for this. Screening is important to protect the mechanical equipments in the
treatment system.
5.2 SEWAGE EQUALIZATION AND PUMPING SYSTEM:
After screening ,the raw sewage flows into a collection tank. The
Collection tank shall be sized in a manner to have adequate
volume to counter the peak flow. The equalization tank is
installed with coarse bubble aeration grids to provide aeration
for mixing and to prevent anaerobic condition in the tank. Raw
sewage transfer pumps shall pump the sewage at a uniform rate
to the aerobic treatment system. Two Pumps shall be on duty,
and the other on standby.
5.3 MBBR TREATMENT
The proposed Treatment System shall have the following major components:
a. BOD removal chamber
b. Aeration System
5.3.1 BOD removal chamber
The Aerobic treatment of the system is carried out in two reactors lined in series. All the reactors are
filled with packing media and the outlet from the Reactors are provided with sieves to retain the
packing media inside the reactors. Appropriate amount of bio-media will be filled inside the aeration
tank. These bring about the BOD reduction of the effluent. The reactor is aerated through a coarse
bubble aeration grid. Though coarse bubble aeration is provided in the tanks the Oxygen transfer
efficiency inside the reactor is more or less equal to the fine bubble diffusers due to the following
reasons:
1. The bubbles break up into fine bubbles by hitting against the packing media.

FEASIBILITY REPORT FOR SEWAGE TREATMENT PLANT OF CAPACITY 405 M3/DAY FOR AKRUTI LIFESTYLE HUBLI
PROJECT
8
2. The bubbles have a longer retention time inside the reactor due to the zig-zag motion of
the bubbles inside the aeration chamber due to the hitting of media surface.
The formation of bio-film occurs in the protected surface area of the packing media. The bacterial film
formed on the surface of the packing media will bring about the conversion of the organic material in
the waste water into CO2 and water in the presence of air. The outlet of the second MBBR is connected
to the flocculation tank.
5.4 AERATION SYSTEM:
Aeration is provided in the MBBR tanks for biomass growth and
for keeping the bio-media in suspension. Coarse bubble aeration
will provide complete mixing in the reactor. The aeration
system consists of blowers and aeration grids. One Blower shall
be on duty while the other shall be on standby.
5.5 SETTLING TANK
Flocculation is followed by settling where big particles or flocks will
settle at the bottom of the settling tank. Tube settlers are placed in the
settling tank to enhance the settling by providing more settling area.
Clear water from the settling tank overflows into the filter feed tank.
5.6 DISINFECTION SYSTEM:
The Disinfection System, which comprises of ozone generation system, ensures complete removal of
any remaining harmful organisms in the water. The water flowing into the Filter Feed Tank is dosed
with a disinfectant from above and then allowed to remain in the tank for a predetermined time so
that there is enough contact time for the disinfectant to totally disinfect the water.
5.7 PRESSURE SAND FILTRATION
Filtration system consists of a Pressure Sand Filter that removes any remaining suspended solids in
the treated water to ensure its total conformance with the discharge standards set by the regulatory
authorities. The Filter is to be backwashed from time to time with water from the Treated Water tank.

FEASIBILITY REPORT FOR SEWAGE TREATMENT PLANT OF CAPACITY 405 M3/DAY FOR AKRUTI LIFESTYLE HUBLI
PROJECT
9
5.8 ACTIVATED CARBON FILTRATION
Filtration system consists of a Activated carbon Filter that
removes any remaining odor and color in the treated water
to ensure its total conformance with the discharge standards
set by the regulatory authorities. The Filter is to be
backwashed from time to time with water from the Treated
Water tank.
5.9 SLUDGE HANDLING SYSTEM
Settled sludge from settling tank is fed into the sludge holding tank from where the sludge will be
pumped to sludge holding tank. The sludge stored in sludge holding tank will be fed to sludge
dewatering unit for solid liquid separation. The separated liquid from sludge will recycled in
equalization tank and dry sludge is used for gardening.

FEASIBILITY REPORT FOR SEWAGE TREATMENT PLANT OF CAPACITY 405 M3/DAY FOR AKRUTI LIFESTYLE HUBLI
PROJECT
10
6 CIVIL TANK DETAILS
Table 6.1: DETAILS OF CIVIL UNIT
Sr.
No. Description Sizes (meter) Water Depth Effective Volume Quantity
1 Bar Screen 1.2x1.0x1.5 0.10 m 0.18 m3 1 No.
2 Oil & Grease Tank 2.0x2.0x4.0 2.0 8 m3 1 No.
3 Equalization Tank 7.9x5.0x4.0 3.0 m 119 m3 1 No.
4 Sludge Holding Tank 3.0x2.8x4.0 3.5 m 29 m3 1 No.
5 Anoxic Tank 4.3x2.0x4.0 3.6 m 30 m3 1 No.
6 Aeration Tank 8.0x4.0x4.0 3.5 m 112 m3 1 No.
7 Settling Tank 4.0x3.0x4.0 3.3 m 40 m3 1 No.
8 Filter Feed Tank 4.0x3.2x4.0 3.0 m 38 m3 1 No.
9 Treated Water Tank 8.0x6.0x4.0 3.5 m 168 m3 1 No.

FEASIBILITY REPORT FOR SEWAGE TREATMENT PLANT OF CAPACITY 405 M3/DAY FOR AKRUTI LIFESTYLE HUBLI
PROJECT
11
7 AIR REQUIREMENT AND SLUDGE CALCULATION
7.1 EQUALIZATION TANK
Flow : 435 m3/Day.
Average Flow : 18.125 m3/hr.
Operation Hours : 22 hr
Design Flow : 19.80 m3/hr
Peak Factor = 3
Peak Duration = 3 Hrs
EQT Volume = (Design flow x Peak Factor x Peak Duration) – (Design Flow x Peak Duration)
= 119 m3
Air Required for Equalization Tank = 80 % of Tank volume = 0.80 x 110
= 95 m3/hr
7.2 AERTION TANK
Flow : 435 m3/hr.
Design Flow : 19.80 m3/hr
Inlet BOD : 300 ppm
BOD Load = Avg. Flow x Inlet BOD = 19.80 x 300 gm/hr = 5940 gm/hr
= 5.940 kg/hr
Design BOD loading rate at design temperature = 19 gm BOD/day per m2
Oxygen Required = 0.002 kg/hr
Dry Solids = 0.012 kg/hr
Air Requirement to remove the BOD
Water Depth = 3.5 m
Tank Effective Water Depth = 3.3 m

FEASIBILITY REPORT FOR SEWAGE TREATMENT PLANT OF CAPACITY 405 M3/DAY FOR AKRUTI LIFESTYLE HUBLI
PROJECT
12
Oxygen Transfer Rate (OTR) = 8 g O2/m3.m
OTR at effective water depth = 8 x 3.3 = 26.4 g O2/m3
O2 requirement for BOD removal = 0.75 kg O2/kg BOD removed
O2 requirement for BOD removed = BOD Load x O2 requirement = 5.94 x 0.75
= 4.455 kg/hr.
O2 for endogenous respiration = (Plant Capacity x Inlet BOD x Oxygen required x dry solids)
BOD Loading rate
= (435 x 300 x 0.002 x 0.012)/ 19
= 0.1648 kg/hr
Total O2 Required = O2 required for BOD removed + O2 required for endogenous respiration
= 4.455 + 0.1648 = 4.62 kg/hr
Beta Constant β = .95
Saturated concentration of O2 in water at 25o c, 1 bar = 8.24 mg/l
Saturated concentration at effective water depth, 25o c
= Saturated concn of O2 x β + . 3 x Effective water depth)
= 8.60 mg/l
Minimum DO to be Maintained = 2 mg/l
�� � �� = O required x Saturated concn x OTR at effective water Depth x Saturated concn – Do Required
= 228 m3/hr
7.3 SLUDGE HOLDING TANK
Plant Capacity : 435 M3/Day
Inlet BOD : 300 ppm

FEASIBILITY REPORT FOR SEWAGE TREATMENT PLANT OF CAPACITY 405 M3/DAY FOR AKRUTI LIFESTYLE HUBLI
PROJECT
13
Inlet COD : 500 ppm
Operation Hours : 22 Hours
Average Flow : 19.80 M3/hr
Type of Sedimentation: Settling Tank
No. of Sedimentation Units : 1 nos.
Sludge Consistency : 1% = 10 gm/Lit
Sludge produced per kg BOD5 removed : 1.1 kg of TSS
Sludge Produced = Plant Capacity x Inlet BOD x Sludge Produced per kg BOD removed
= 435 x 300 x 1.1
= 143550 g/day
= 143.55 kg/day
= 14355 l/day
Sludge Production = 14.355 m3/day
Sludge Storage Time = 2 Days
= 2 x 14.355
= 28.71 m3
Air Require for Sludge Holding Tank = 100% of Tank volume
= 29 m3/hr

39
Annexure 1(f): Traffic volume
The proposed project is a development of residential apartment, commercial retail shops
and hotel, which is coming up in Hubballi & around 3km from Hubballi railway station
and around 5km from Hubballi airport; which is having main access of 24.5m (RoW)
wide P B road.
Parking Logistic:
Description of Unit Cars/ unit No. of Units Total in
Nos.
For Commercial One car for 100sqmt
30126.94/100 = 301.26
302
For Hotel Rooms One car for
8 rooms 77 room/8 =
9.6 10
For restaurant 25 sqmt of restaurant
489.21/25 = 19.56
20
For Recreational 100 sqmt of floor area
1467.63/100= 14.67
15
For Residential units Two cars for
one flat 154 X 2 308
Total Required 655
Total Provided 710
Sufficient parking space is being provided and the details are depicted in the above table.
Traffic Flow logistics:
Since the activity is Commercial & Residential, the traffic is distributed to 3 hrs in
the morning (8.00- 11.00 AM) as ingress and 3 hrs in the evening (5.00 – 8.00
PM) as egress for commercial and vice versa for residential .
The hourly volume in PCU’s added will be 710/3 = 237 PCU’s/hr
The traffic generated from the project site being 237 PCU’s/hr will move along P B
Road/ Hubballi Dharwad Road; which get distributed towards Hubballi city &
towards Dharwad.
The impact from the proposed project will be on P B Road/ Hubballi Dharwad
Road, since it is a 24.5 m wide road; hence there won’t be any adverse impact on
the existing traffic flow from the proposed project.
There is one more entry/Exit to the project site on Karwar Road; which get
distributed towards Karwar Road & towards Gokul Road.

40
Annexure 1(g): NOC from Karnataka Urban Water Supply & Drainage
Board


41
Annexure – 2(a): Water Demand
WATER DEMAND DURING CONSTRUCTION
Water for construction will be met through external tanker water supplier. Table-
2a.1 shows details of the water requirement during construction period.
The water used for construction gets consumed into chemical reactions with
cement and also partly gets evaporated. Hence, there will be no wastewater generation
from curing or mixing processes. However, there will be discharge of domestic
wastewater to the tune of 11.4m3/day. The domestic wastewater will be collected in
collection tank and will be lifted to KUWS & DB sewage treatment plant for further
treatment.
Table 2a.1: Water Requirement for construction purpose
Sl. No.
Activity Quantity of Works (m3)
Rate of water usage m3/m3
Total requirement (m3)
1. Concrete curing 1,02,521 0.9 92,269
2. Mortar mixing and
curing for block work 1,295 0.8 1,036
3. Mortar mixing and
curing for plastering 827 0.07 60
4. Floor finishes 10,127 0.05 506
5. Sprinkling for dust
suppression --- -- 1,342
6. Roof works 7,865 0.05 394
Total 95,607
7. Domestic 400 Labours/day 30 L/day 12 KLD
Construction Period 60 Months
No. of Working Days /Month 26
Total No. of Working Days 1560
Average Water Consumption Per Day (for Construction) 61 KLD
Average Water Consumption Per Day (for Domestic) 12 KLD
Source: Civil Engineering Handbook and Indian Building Handbook
42
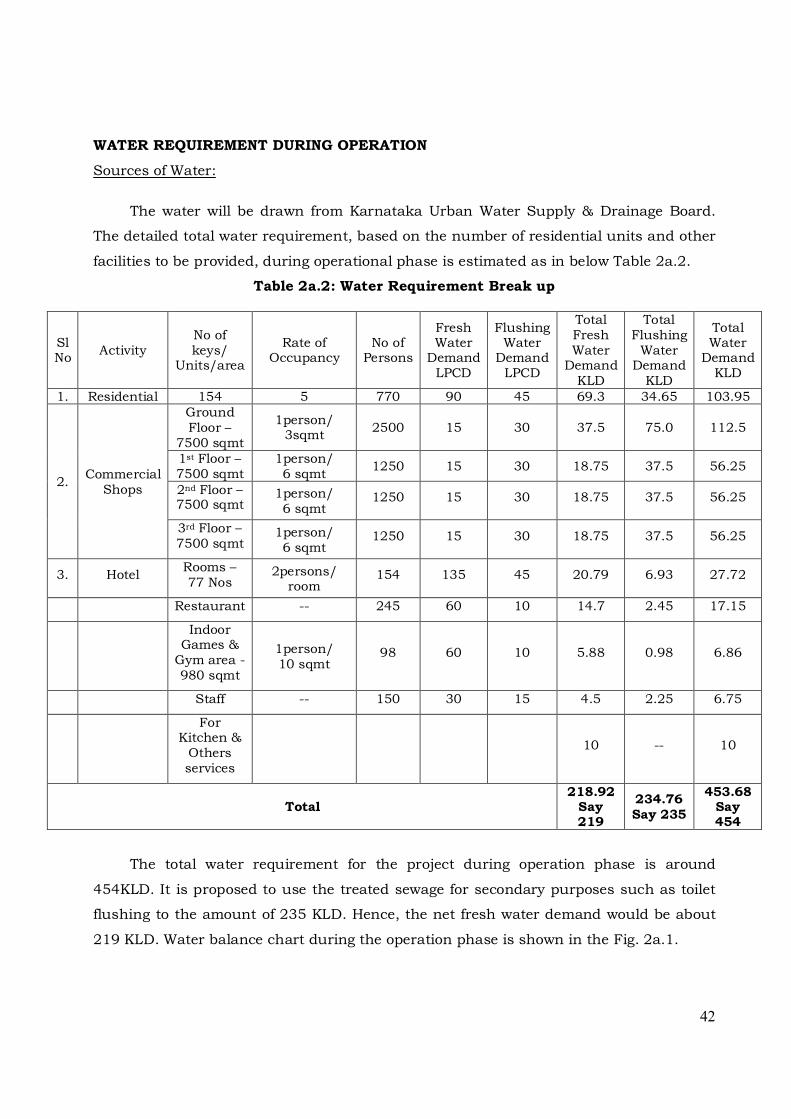
WATER REQUIREMENT DURING OPERATION
Sources of Water:
The water will be drawn from Karnataka Urban Water Supply & Drainage Board.
The detailed total water requirement, based on the number of residential units and other
facilities to be provided, during operational phase is estimated as in below Table 2a.2.
Table 2a.2: Water Requirement Break up
Sl No
Activity No of keys/
Units/area
Rate of Occupancy
No of Persons
Fresh Water
Demand LPCD
Flushing Water
Demand LPCD
Total Fresh Water
Demand KLD
Total Flushing
Water Demand
KLD
Total Water
Demand KLD
1. Residential 154 5 770 90 45 69.3 34.65 103.95
2. Commercial
Shops
Ground Floor –
7500 sqmt
1person/ 3sqmt
2500 15 30 37.5 75.0 112.5
1st Floor – 7500 sqmt
1person/ 6 sqmt
1250 15 30 18.75 37.5 56.25
2nd Floor – 7500 sqmt
1person/ 6 sqmt
1250 15 30 18.75 37.5 56.25
3rd Floor – 7500 sqmt
1person/ 6 sqmt
1250 15 30 18.75 37.5 56.25
3. Hotel Rooms – 77 Nos
2persons/ room
154 135 45 20.79 6.93 27.72
Restaurant -- 245 60 10 14.7 2.45 17.15
Indoor Games &
Gym area -980 sqmt
1person/ 10 sqmt
98 60 10 5.88 0.98 6.86
Staff -- 150 30 15 4.5 2.25 6.75
For Kitchen &
Others services
10 -- 10
Total 218.92
Say 219
234.76 Say 235
453.68 Say 454
The total water requirement for the project during operation phase is around
454KLD. It is proposed to use the treated sewage for secondary purposes such as toilet
flushing to the amount of 235 KLD. Hence, the net fresh water demand would be about
219 KLD. Water balance chart during the operation phase is shown in the Fig. 2a.1.

43
Fig. 2a.1: WATER BALANCE CHART
TOTAL WATER DEMAND FOR
ENTIRE PROJECT
454 KLD
SEWAGE GENERATED – 95%
431 KLD
STP CAPACITY –
435 KLD
Excess Water to Avenue
Plantation/construction works 92 KLD
Recycling
Car Cleaning
Purpose – 20 KLD
Floor Washing
Purpose – 10 KLD
STP TREATED WATER
431 KLD
For Landscaping
– 74 KLD
FRESH
WATER
219 KLD Flushing
Water 235 KLD
KUWS&DB / Harvested Rain water
During the Rainy
season
44
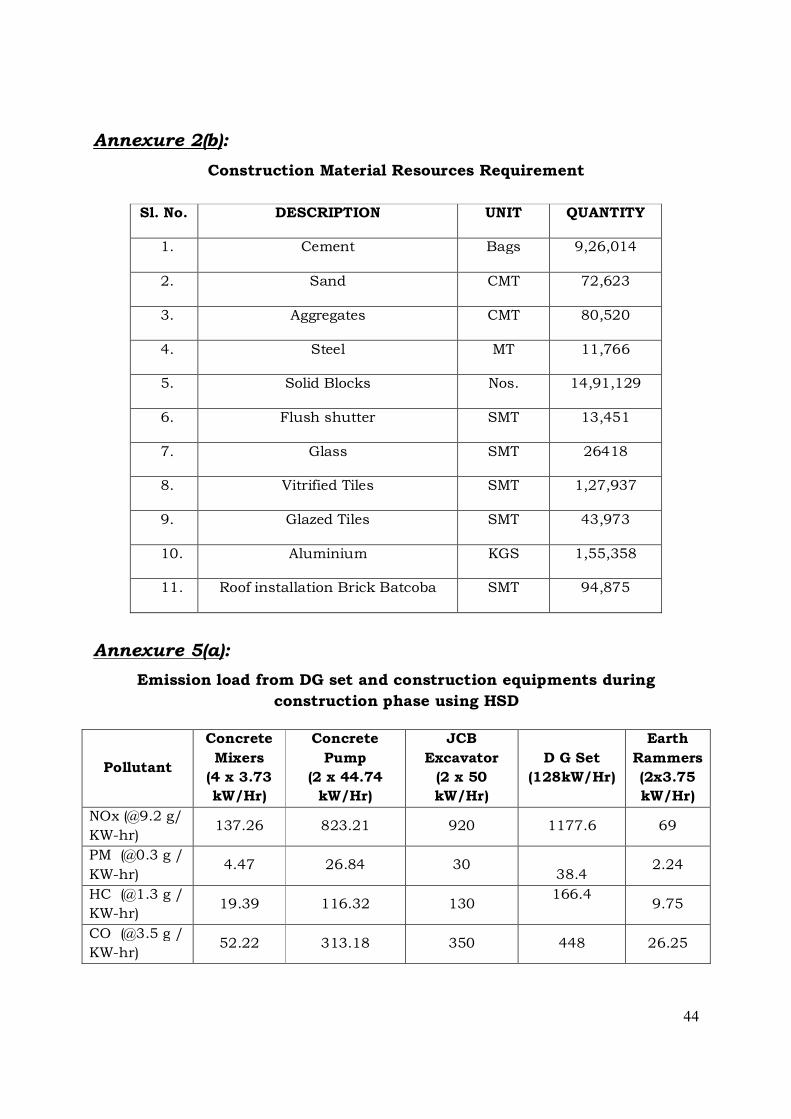
Annexure 2(b):
Construction Material Resources Requirement
Annexure 5(a):
Emission load from DG set and construction equipments during
construction phase using HSD
Pollutant
Concrete
Mixers
(4 x 3.73
kW/Hr)
Concrete
Pump
(2 x 44.74
kW/Hr)
JCB
Excavator
(2 x 50
kW/Hr)
D G Set
(128kW/Hr)
Earth
Rammers
(2x3.75
kW/Hr)
NOx (@9.2 g/
KW-hr) 137.26 823.21 920 1177.6 69
PM (@0.3 g /
KW-hr) 4.47 26.84 30
38.4 2.24
HC (@1.3 g /
KW-hr) 19.39 116.32 130
166.4 9.75
CO (@3.5 g /
KW-hr) 52.22 313.18 350 448 26.25
Sl. No. DESCRIPTION UNIT QUANTITY
1. Cement Bags 9,26,014
2. Sand CMT 72,623
3. Aggregates CMT 80,520
4. Steel MT 11,766
5. Solid Blocks Nos. 14,91,129
6. Flush shutter SMT 13,451
7. Glass SMT 26418
8. Vitrified Tiles SMT 1,27,937
9. Glazed Tiles SMT 43,973
10. Aluminium KGS 1,55,358
11. Roof installation Brick Batcoba SMT 94,875
45
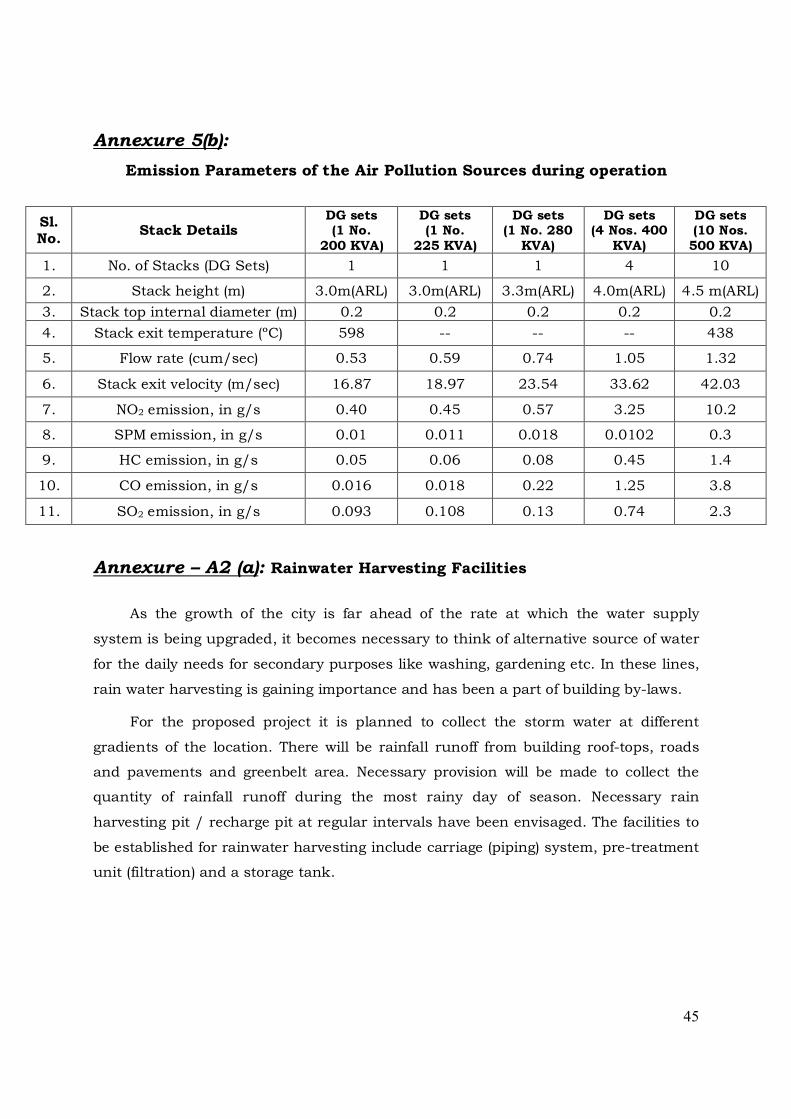
Annexure 5(b):
Emission Parameters of the Air Pollution Sources during operation
Sl. No.
Stack Details DG sets (1 No.
200 KVA)
DG sets (1 No.
225 KVA)
DG sets (1 No. 280
KVA)
DG sets (4 Nos. 400
KVA)
DG sets (10 Nos.
500 KVA)
1. No. of Stacks (DG Sets) 1 1 1 4 10
2. Stack height (m) 3.0m(ARL) 3.0m(ARL) 3.3m(ARL) 4.0m(ARL) 4.5 m(ARL)
3. Stack top internal diameter (m) 0.2 0.2 0.2 0.2 0.2
4. Stack exit temperature (ºC) 598 -- -- -- 438
5. Flow rate (cum/sec) 0.53 0.59 0.74 1.05 1.32
6. Stack exit velocity (m/sec) 16.87 18.97 23.54 33.62 42.03
7. NO2 emission, in g/s 0.40 0.45 0.57 3.25 10.2
8. SPM emission, in g/s 0.01 0.011 0.018 0.0102 0.3
9. HC emission, in g/s 0.05 0.06 0.08 0.45 1.4
10. CO emission, in g/s 0.016 0.018 0.22 1.25 3.8
11. SO2 emission, in g/s 0.093 0.108 0.13 0.74 2.3
Annexure – A2 (a): Rainwater Harvesting Facilities
As the growth of the city is far ahead of the rate at which the water supply
system is being upgraded, it becomes necessary to think of alternative source of water
for the daily needs for secondary purposes like washing, gardening etc. In these lines,
rain water harvesting is gaining importance and has been a part of building by-laws.
For the proposed project it is planned to collect the storm water at different
gradients of the location. There will be rainfall runoff from building roof-tops, roads
and pavements and greenbelt area. Necessary provision will be made to collect the
quantity of rainfall runoff during the most rainy day of season. Necessary rain
harvesting pit / recharge pit at regular intervals have been envisaged. The facilities to
be established for rainwater harvesting include carriage (piping) system, pre-treatment
unit (filtration) and a storage tank.

46
Design details:
Rational formula for calculating runoff = Q= (CIA) / 360
Q = Runoff in m3/sec
I = Intensity of rainfall in mm/hr.
A= area.
C = Co – efficient of run off as below
Intensity of rain fall = 25 mm/ hr
Terrace Area Run-off:
I = Intensity of rainfall : 25 mm /hr
A = Terrace area : 16,822.79 Sqmt
C = Co – efficient of runoff : 1.0
Q = Runoff = Coefficient of runoff * Terrace area * Peak intensity of rainfall
= 1.0 * 16822.79 * 0.025 = 420.56 say 421 m3/hr
The water from roof is collected in the roof rain water collection sump of
capacity 425 cum which will be used for domestic purposes after a pre
treatment.
Total Run-off from Hardscape & driveway:
I = Intensity of rainfall : 25 mm /hr
A =Hardscape area : 0.76 Ha
C = Co – efficient of runoff : 0.6
Q = Runoff = (CIA)/360 = (0.6X 25 X 0.76)/360 = 0.031 m3/sec
Data assumed:
Considering 20 min of rainfall
= 0.031 X 20 X 60 = 37.2 cum say 37 cum
Volume of rainwater available for recharging is = 37cum
Total Run-off from Landscape Area:
I = Intensity of rainfall : 25 mm /hr
A =Landscape : 0.92 Ha
C = Co – efficient of runoff : 0.3
Q = Runoff = (CIA)/360 = (0.3 X 25 X 0.92)/360=0.019 m3 / sec
47
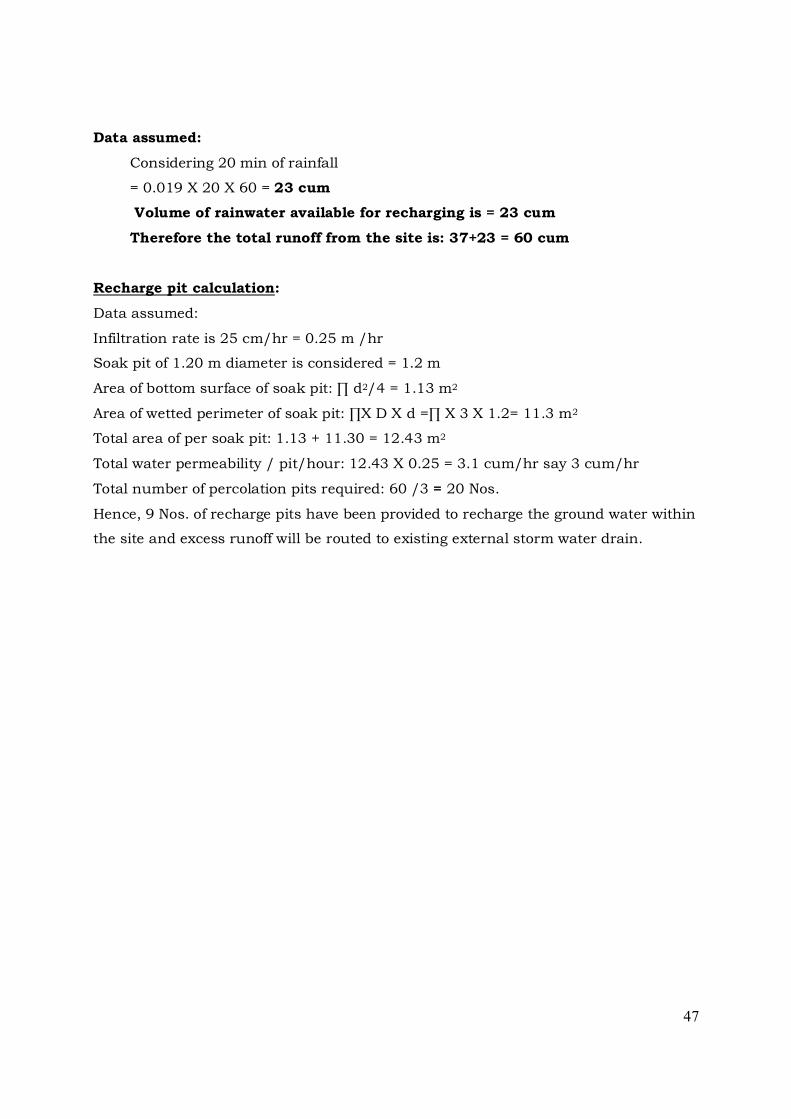
Data assumed:
Considering 20 min of rainfall
= 0.019 X 20 X 60 = 23 cum
Volume of rainwater available for recharging is = 23 cum
Therefore the total runoff from the site is: 37+23 = 60 cum
Recharge pit calculation:
Data assumed:
Infiltration rate is 25 cm/hr = 0.25 m /hr
Soak pit of 1.20 m diameter is considered = 1.2 m
Area of bottom surface of soak pit: ∏ d2/4 = 1.13 m2
Area of wetted perimeter of soak pit: ∏X D X d =∏ X 3 X 1.2= 11.3 m2
Total area of per soak pit: 1.13 + 11.30 = 12.43 m2
Total water permeability / pit/hour: 12.43 X 0.25 = 3.1 cum/hr say 3 cum/hr
Total number of percolation pits required: 60 /3 = 20 Nos.
Hence, 9 Nos. of recharge pits have been provided to recharge the ground water within
the site and excess runoff will be routed to existing external storm water drain.

48
Annexure A3: Landscape details
List of proposed Species
Sl. No. Name of the Species Common name In Nos.
1. Anthocephalus cadamba Krishna cadamba tree 20
2. Pongamia pinnata Honge tree 15
3. Azadiracta Indica Neem Tree 10
4. Bauhinia varigata Basavanapaada tree 06
5. Michelia champaca Champaka tree 08
6. Legersroemiaflos reginae Holedasavala 06
7. Casia fistula Kakkemara 05
8. Polyalthia longifolia Ashoka tree 15
9. Bombax ceiba Silk Cotton Tree 04
10. Largerstroemia microcrapa Bilinandi 06
11. Hardwickia binata Anjan 04
12. Dalbergia latifolia Black Rosewood 06
13. Ficus golmerata Atti 04
14. Terminalia Arjuna Arjun 05
15. Areca catechu Betel Palm 10
16. Acacia pennata Climbing Acacia 10
17. Tamarindus indica Hunasi 08
18. Syzygium cumini Jamun 08
19. Cassia fistula Golden shower tree 20
20. Nyctanthes arbor-tristis Night-flowering jasmine 20
21. Syzygium jambos Pannerale 20
22. Mangifera indica Mango tree 15
23. Psidium guajava Guava tree 15
24. Annona squomosa Custard apple 20
Total 260

49
Annexure 10: ENVIRONMENTAL MANAGEMENT PLAN
10.1 INTRODUCTION
The Environmental Management Plan (EMP) is aimed at mitigating the possible
adverse impact of a project and ensuring the existing environmental quality. The EMP
converse all aspects of planning, construction and operation of the project relevant to
environment. It is essential to implement the EMP right from the planning stage
continuing throughout the construction and operation stage. Therefore the main
purpose of the Environmental Management Plan (EMP) is to identify the project
specific activities that would have to be considered for the significant adverse impacts
and the mitigation measures required.
The construction phase impacts are mostly short term, restricted to the plot area
and not envisaged on the larger scale. In the operational phase the environmental
impacts are due to continuous operation of the project, hence, the emphasis in the
Environment Management plan (EMP) is to minimize such impacts. The following
mitigation measures are recommended in order to synchronize the economic
development of the project area with the environmental protection of the region.
The emphasis on the EMP development is on the following;
Mitigation measures for each of the activities causing the environmental
impact.
Monitoring plans for checking activities and environmental parameters and
monitoring responsibilities.
Role responsibilities and resource allocation for monitoring; and
Implementation of the scheduled plan.
Environmental management plan has been discussed in the following sections
separately for Construction phase and Operational phase:
10.2 EMP DURING CONSTRUCTION PHASE
During construction phase, the activities which need to be monitored and
managed from the point of pollution are explained in detail in the subsequent
sections.

50
10.2.1 LEVELLING AND SITE CLEARANCE
Proposed project site is a vacant land with few tree spices and small old sheds,
which will be cleared during site preparation, as per the site scenario site has a level
difference of 7m, so excavation and levelling will be done for site preparation.
Table 10.1: Environmental Management during Levelling and Site Clearance
Environmental Impacts
Mitigation Remarks
Noise generation:
Caused due to
Excavators and
Bulldozers
Most optimum no. of operation by the
heavy equipment.
Selection of equipment with less noise
generation to be used.
The earth moving equipment shall be
periodically checked and maintained for
noise levels. The workers shall be provided
with adequate PPE such as ear plugs to
reduce impact of high noise levels.
To reduce noise level,
Equipment provided
with noise control
devices is only used.
Dust generation:
Levelling
operations results
in the emission of
the dust.
Site will be watered at least twice a day to
reduce the dust emissions.
Barricades will be provided all around the
site to suppress the dust.
The workers shall be provided with PPE
such as nose masks and goggles to reduce
impact on health.
The construction water
requirement will be met
through External water
supplier
10.2.2 TRANSPORTATION OF CONSTRUCTION MATERIALS
During the transportation of construction materials, minimum no. of vehicles will
be used. Most optimum route is planned to reduce the impact of transportation
activity on the environment.

51
Table 10.2: Environmental Management during Transportation
Environmental Impacts
Mitigation
Noise generation Quality fuel will be used.
Periodic maintenance of vehicles is required.
Dust generation Quality packaging of the construction materials.
Construction materials shall be covered with
tarpaulin sheets to prevent the material from
being air borne.
The vehicle speed shall be regulated.
Watering to the wheels of the construction vehicle
will be done while entering to the construction
site.
The workers transporting materials shall be
provided with PPE such as nose masks to reduce
impact of air borne dust on their health.
Vehicular
emissions
Periodic emission check for vehicles is required.
Clean fuel shall be used for vehicles.
10.2.3 CONSTRUCTION ACTIVITIES
During the construction work, the following impacts are identified to monitor and
mitigate the level of impact.
Table 10.3: Environmental Management during Construction
Environmental impacts
Mitigation Remarks
Noise generation Selection of less noise generating equipment.
Personnel Protective Equipment (PPE) such
as ear plugs and helmets shall be provided
for construction workers.
The working hours shall be imposed on
construction workers.
Implementation
responsibility:
Contractor – Civil
Works.

52
Dust generation PPE in the form of nose masks shall be
provided for construction workers.
Use of water sprays to prevent the dust from
being air borne.
Providing barricades all around the project
site.
Implementation
responsibility:
Contractor
Water discharge
from
construction
works
Sewage generated will be collected & lifted to
KUWS &DB sewage treatment plant.
Implementation
responsibility:
Contractor
Air Emissions
from
construction
machinery
Periodic check and regular maintenance of
construction machinery for emissions.
Clean fuel shall be used in equipments.
Implementation
responsibility:
Contractor
10.2.3.1 WASTEWATER DISCHARGE
The sewage generated from the construction labours during construction is
estimated to be about 11.4 KLD. This will be collected in collection tank and will be
lifted to KUWS&DB sewage treatment plant.
10.2.3.2 DISPOSAL OF EXCAVATED EARTH
The excavated earth which is generated during construction will be reused for
development of landscape and pavement area formation and excess will be disposed
off safely, therefore there will not be any solid waste problem from the generation of
excavated earth.
10.2.3.3 PERSONNEL SAFETY SYSTEM
It is planned to adopt the safe working practices which shall govern all
construction works undertaken throughout the project. Following safety aids to all
labourers will be provided:
Safety helmets
Safety belts
Safety shoes
Hand gloves

53
Gumboots while concreting
Safety Goggles while welding/ Stone dressing etc.
Face masks and full body kit while pest control
Implementation of Safety procedures such as:
Using proper lifting techniques.
Using Safe Scaffolds.
Hot work permits for Fabrication and welding.
BUDGETARY ALLOCATION FOR EMP DURING CONSTRUCTION
Sl. No. EMP Aspects Cost
Capital Investment In Lakh
1. Barricades all round the site 2.08
Total 2.08
During Construction Lakhs/annum
1. Purchase of water from external authorized
suppliers
11.23
2 Disposal of Solid Waste from project site 1.5
3. Plantations of saplings around the periphery
and maintenance
5.0
4. Environmental Monitoring – Air, water, Noise 0.91
5. EMP cell 2.64
Total 21.28
10.3 EMP DURING OPERATION PHASE
Following are the identified operational phase activities in the impact
assessment, which may have impact on the environment.
1. Air quality
2. Water quality
3. Noise quality
4. Solid waste disposal
5. Landscape development
6. Storm water management

54
10.3.1 AIR QUALITY MANAGEMENT
The air pollutants likely to be emanated from the proposed project are SPM, SO2,
NO2, HC and CO mainly due to burning of liquid fuel (HSD) in DG.
Exhaust from DG set will be emitted from stack of adequate height for dispersion
of gaseous pollutants. Following table presents the EMP for air quality management
during operation phase.
Table 10.4: Air Quality Management during Operation Phase
Environmental Impacts
Mitigation
DG set Equipment selected will ensure the exhaust
emission standard as prescribed as per the latest
amendments from the CPCB.
DG will be used as stand-by unit.
Periodic check and maintenance.
Ambient air
quality
Ambient air quality monitoring as per the
prescribed norms at regular interval.
10.3.2 WATER QUALITY MANAGEMENT
Water requirement of the project will be met through KUWS&DB, as mentioned
earlier. Water balance is presented in Annexure 2(a).
The sewage generated from the proposed project is about 431 KLD which will be
treated in the proposed STP of capacity 435 KLD. The treatment scheme for domestic
effluents generated from project has also been discussed in Annexure 2(a). The STP
treated water will be reused for flushing and for gardening etc. Following table
presents the EMP for water quality.
Table 10.5: Water Quality Management during Operation Phase
Environmental impacts Mitigation
Effluent from domestic water
consumption
Treated with proposed state-of-the-art
sewage treatment plant to produce tertiary
treated water; this will be ultimately reused

55
for secondary purposes such as for flushing,
vehicle washing, common area washing and
for gardening.
Water conservation measures will be
encouraged.
10.3.3 NOISE MANAGEMENT
High noise generating units such as DG set will be provided with acoustic
enclosures. Landscape on the project boundary will further act as noise barrier and
helps in attenuation of noise. Following table presents the EMP for noise levels.
Table 10.6: Noise Management during Operation Phase
Environmental Impacts
Mitigation
Noise from DG set
area
Acoustic enclosures will be provided to DG set.
DG set will be installed in an area (utility section)
where the access will be restricted.
The use of PPE (ear plugs) will be mandatory in this
area.
Selection of equipment to ensure that the residual
noise level of < 65 dB (A).
Noise levels will be checked periodically using a noise
dosimeter.
10.3.4 SOLID WASTE MANAGEMENT
The solid wastes generated during operation phase can be categorized under
three types:
Wet Garbage: Food waste, Lawn mowing wastes etc
Dry Garbage: Paper, Plastic, Bottles, etc.
Sludge from Sewage Treatment Plant (STP)
The solid waste generated in the premises is estimated to be about 2,222kg/day.
Out of 2,222kg, 1003kg will be biodegradable waste & 1219kg will be recyclable
wastes. Further this biodegradable wastes will be segregated and will be processed in

56
organic waste converter and the recyclable wastes such as plastic materials, glass &
metal wastes will be handed over to the waste recyclers.
The sludge from the STP is estimated to be about 22 kg/day and will be used as
manure for gardening purpose.
The various mitigation measures to be adopted during collection and disposal of
wastes are as follows:
It is preferable that the container and bins used for collection of waste should
be of closed type so that the waste is not exposed and thus the possibility of
spreading of disease through flies and mosquitoes is minimized.
Collection system should be properly supervised so that quick and regular
removal of waste from the dustbin is practiced.
The biodegradable wastes will be processed in organic waste converter,
recyclable wastes such as plastic materials, glass & metal wastes are handed
over to the waste recyclers; e-waste will collected separately and handed over to
authorize e- waste recyclers for further processing.
10.3.5 LANDSCAPE DEVELOPMENT
Vegetation is the natural extension of the soil ecosystem on a site. It can provide
summer shade, wind protection, and a low-maintenance landscape that is adapted to
the local environment.
Following approach will be adopted for vegetation and ground management.
It is planned to include an ecologically knowledgeable landscape architect as an
integral member of the design team.
Preservation of existing vegetation, especially native plants, will possibly be
incorporated. Avoid fencing off property where possible to make landscape available to
community increasing project integration.
Decrease paving and monoculture lawns.
Avoid replacing mature trees with young seedlings.
Protect existing plants during construction. Delineate the “drip line” around
trees and demark or fence off areas to avoid damage.
Contain heavy equipment and stockpiling areas to predefined areas.

57
Design new plantings as diverse communities of species well adapted to the
site. Plant native species of varying ages. Select vegetation that attracts wildlife.
Avoid invasive species and monocultures (same species, same age).
10.3.6 STORM WATER MANAGEMENT
In the proposed project, it is planned to collect the storm water at different
gradients of the location. There will be rainfall runoff from building roof-tops, roads
and pavements and landscape area. Necessary provision will be made to collect the
quantity of rainfall runoff during the most rainy day of season. Necessary rain
harvesting pit /recharge pit at equal intervals around the periphery of the site have
been envisaged. A garland drains with RCC precast perforated cover will be provided
around the periphery of property. The details of the rain water harvesting facilities are
interpreted in the early section.
10.3.7 HEALTH, RISK AND DISASTER MANAGEMENT
Public health and safety
Since all the construction related activities shall be confined to the project site,
minimal health related impacts are envisaged within the project influenced area
during the construction stage.
At the project site on an average of 400 persons will be engaged, who face direct
exposure to dust and noise generated from the construction activity. This is likely to
cause health related affects such as asthma, bronchitis etc. and hearing impairments
respectively.
To minimize these anticipated impacts, suitable actions like
Use of water sprinklers to prevent dust from being air borne.
Providing suitable personal protective equipments (PPE) like mouth mask
with filters, nose mask, helmets etc.
Periodic health check up camp for the labourers will be arranged.
Provision of safety belts.
In case of injury, on site medical treatment and transport will be organized.
Employing a safety engineer.
Due to operation of the proposed project, there will be enhancement in public
health and safety.

58
Regular visit of resident medical officer to take care of the first aid and
primary medication in case of emergency for apartment occupants and
labourers.
First aid kit with primary medicines will always be available in the medical
centre.
Display of action plan and preparedness measures during emergency
situations.
Risk and disaster management plan
Disaster is an unexpected event due sudden failure of the system, external
threats, internal disturbances, earth quakes, fire and accidents. Thus an appropriate
management plan shall be incorporated.
Precautions
Once the likelihood of the disaster is suspected, preventive actions
should be undertaken by the project in-charge.
Conditional maintenance of equipments, materials, and expertise for use
during emergency.
The electrical systems shall be provided with automatic circuit breakers
activated by over current.
Fire extinguishers are provided at pre-notified locations inside the
apartments.
Proper escape routes are planned and displayed in the public domain.
Selected representatives are given proper training to guide other
inhabitants during fire accidents.
Periodic awareness programme is conducted for the occupants on their
roles during emergency situations.
Important telephone numbers like police authorities, fire department and
hospitals etc. of use during emergency situations are made available.

59
10.3.8 EMP IMPLEMENTATION SCHEDULE
Phased according to the priority, the implementation schedule is presented in
below table.
Table 10.7: Implementation Schedule for EMP
Sl. No. Recommendations Requirement
1. Air pollution control
measures
Before commissioning of
respective units.
2. Water pollution control
measures
Before commissioning of the
project.
3.
Noise control measures Along with the commissioning
of the project.
4. Solid waste management During commissioning of the
project.
5. Green belt development Stage-wise implementation.
The responsibility of EMP implementation lies with the project promoter for a
period of 5 years. Once the project is established, the EMP responsibility will be
properly handed over with clearly defined procedures and guidelines.
10.3.9 ENVIRONMENTAL MONITORING ROUTINES
A comprehensive monitoring programme is suggested in below table:

60
Table 10.8: Monitoring Schedule for Environmental Parameters
Sl. No. Particulars Monitoring
frequency
Duration of
monitoring
Important
parameters for
monitoring
I. Air Quality
1. Ambient Air monitoring
Project premises Once in a
month
24 hourly
sample
PM, SO2, NO2
2. Stack Monitoring Once in a
month
Grab SO2, SPM, NO2,
HC, CO
II Water and Wastewater Quality
1. Water Quality
i. Ground water at two
locations (up-gradient and
down-gradient) of treated
effluent discharge area/
land
Once in a
month
Grab As per KSPCB
requirements
2. Wastewater quality
i. Inlet to STP Daily Composite -
ii. Treated effluent prior to
discharge
Daily Composite -
III Soil Quality
1. Within project premises at
1 location on effluent
discharging area / land
Once in a
month
Composite
Sample
As per KSPCB
requirements
2. Ecological preservation
and up-gradation
Seasonal Visual
observations
Survival rate
IV Noise Monitoring
1. Project premises Once in a
month
Day and Night As per KSPCB
requirements
10.4 ENVIRONMENTAL LEGISLATIONS
There are many Environmental Acts & Rules which are formulated by Ministry of
Environment and Forests (MoEF) for the prevention of Environmental squalor and are
to be compiled by the Industry. All the regulations are not applicable to all. The Act
and Rules which are to be constantly perused and followed by the Industry are
enumerated in the following section.
61
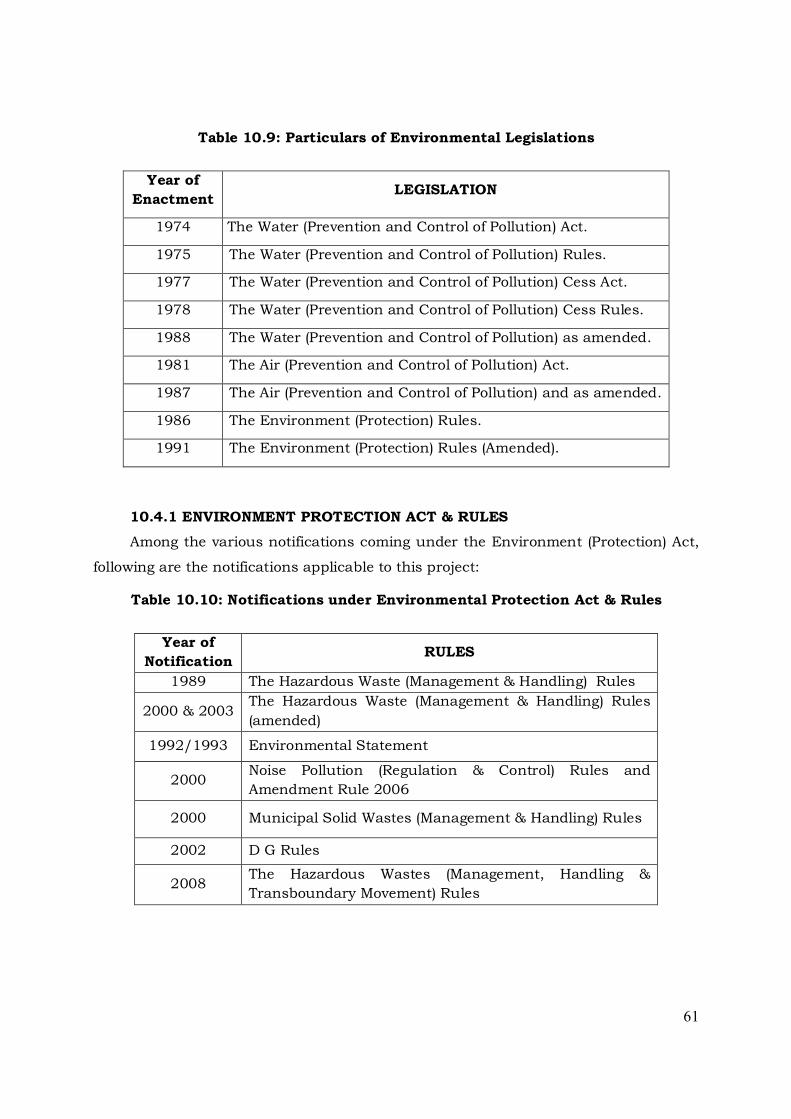
Table 10.9: Particulars of Environmental Legislations
Year of
Enactment LEGISLATION
1974 The Water (Prevention and Control of Pollution) Act.
1975 The Water (Prevention and Control of Pollution) Rules.
1977 The Water (Prevention and Control of Pollution) Cess Act.
1978 The Water (Prevention and Control of Pollution) Cess Rules.
1988 The Water (Prevention and Control of Pollution) as amended.
1981 The Air (Prevention and Control of Pollution) Act.
1987 The Air (Prevention and Control of Pollution) and as amended.
1986 The Environment (Protection) Rules.
1991 The Environment (Protection) Rules (Amended).
10.4.1 ENVIRONMENT PROTECTION ACT & RULES
Among the various notifications coming under the Environment (Protection) Act,
following are the notifications applicable to this project:
Table 10.10: Notifications under Environmental Protection Act & Rules
Year of
Notification RULES
1989 The Hazardous Waste (Management & Handling) Rules
2000 & 2003 The Hazardous Waste (Management & Handling) Rules
(amended)
1992/1993 Environmental Statement
2000 Noise Pollution (Regulation & Control) Rules and
Amendment Rule 2006
2000 Municipal Solid Wastes (Management & Handling) Rules
2002 D G Rules
2008 The Hazardous Wastes (Management, Handling &
Transboundary Movement) Rules

62
The Hazardous Waste (Management & Handling) Rules 1989 (latest
amendment 2008)
The DG Set Waste/used oil is included in the schedule-1 of list of Hazardous
Waste under Serial No.5 which states as under:
“Used/spent oil (category No.5.1) generated from industrial operations.
Using mineral/synthetic oil as lubricant in hydraulic systems or other
applications”.
Used oil defined under Rule 3 (34) means any oil derived from crude oil or
mixtures containing synthetic oil including used engine oil, gear oil, hydraulic oil,
turbine oil, compressor oil, industrial gear oil, heat transfer oil, transformer oil, spent
oil and their tank bottom sludge and suitable for re-refining, it meets the
specifications laid down in Schedule 5, but does not include waste oil.
Responsibility of the occupier and operator of a facility for handling of the wastes
is delineated as under:
1. The Occupier and the operator of a facility shall be responsible for proper
collection, reception, treatment, storage and disposal of hazardous wastes listed
in schedule –1, 2 and3 {Rule 4(1)}
2. It shall be the responsibility of the occupier and the operator of a facility, to
take all steps to ensure that the wastes listed in schedule 1,2 and 3 are
properly handled and disposed of without any adverse effects to the
environment {Rule 4(3)}.
3. Hazardous wastes shall be collected, treated, stored and disposed off only in
such facilities as may be authorized for this purpose {Rule 5(1)}.
4. Every occupier handling, or a recycler recycling, hazardous wastes shall make
application in Form-1 to the Member Secretary, State Pollution Control Board
or committee, as the case may be or any Officer designated by the State
Pollution Control Board of committee for the grant of authorization for any of
the said activities {Rule 5(2)}.
5. The Occupier or operator of a facility shall ensure that the hazardous wastes
are packaged, based on the composition in the manner suitable for handling,
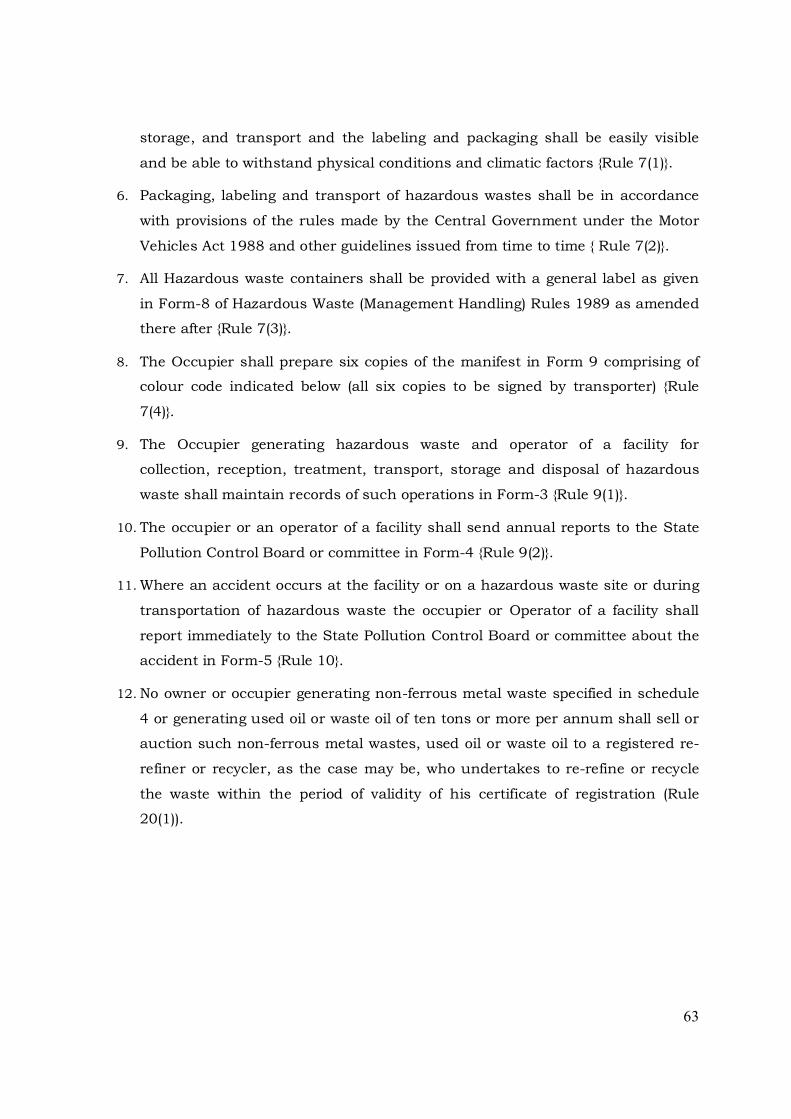
63
storage, and transport and the labeling and packaging shall be easily visible
and be able to withstand physical conditions and climatic factors {Rule 7(1)}.
6. Packaging, labeling and transport of hazardous wastes shall be in accordance
with provisions of the rules made by the Central Government under the Motor
Vehicles Act 1988 and other guidelines issued from time to time { Rule 7(2)}.
7. All Hazardous waste containers shall be provided with a general label as given
in Form-8 of Hazardous Waste (Management Handling) Rules 1989 as amended
there after {Rule 7(3)}.
8. The Occupier shall prepare six copies of the manifest in Form 9 comprising of
colour code indicated below (all six copies to be signed by transporter) {Rule
7(4)}.
9. The Occupier generating hazardous waste and operator of a facility for
collection, reception, treatment, transport, storage and disposal of hazardous
waste shall maintain records of such operations in Form-3 {Rule 9(1)}.
10. The occupier or an operator of a facility shall send annual reports to the State
Pollution Control Board or committee in Form-4 {Rule 9(2)}.
11. Where an accident occurs at the facility or on a hazardous waste site or during
transportation of hazardous waste the occupier or Operator of a facility shall
report immediately to the State Pollution Control Board or committee about the
accident in Form-5 {Rule 10}.
12. No owner or occupier generating non-ferrous metal waste specified in schedule
4 or generating used oil or waste oil of ten tons or more per annum shall sell or
auction such non-ferrous metal wastes, used oil or waste oil to a registered re-
refiner or recycler, as the case may be, who undertakes to re-refine or recycle
the waste within the period of validity of his certificate of registration (Rule
20(1)).

64
Table 10.11: Colour Code for the manifest copies
Copy number
with Colour Code Purpose
Copy 1 (White) To be forwarded by the occupier to the State
Pollution Control Board or Committee.
Copy 2 (Yellow)
To be retained by the occupier after taking
signature on it from the transporter and rest of
the four copies to be carried by the transporter.
Copy 3 (Pink) To be retained by the operator of the facility after
Signature.
Copy 4 (Orange) To be returned to the transporter by the operator
of Facility after accepting waste.
Copy 5 (Green)
To be returned by the operator of the facility to
State Pollution Control Board/Committee after
treatment and disposal of wastes.
Copy 6 (blue) To be returned by the operator of the facility to the
occupier after treatment and disposal of wastes.
ENVIRONMENTAL STATEMENT:
Under rule 14 of the Environmental Protection Rules 1986, every person carrying
on an industry, operation or process requiring Consent under Section 25 of Water
(Prevention and Control of Pollution) Act, 1974 (6 of 1974) or under Section 21 of the
Air (Prevention and Control of Pollution) Act 1981 (14 of 1981) or both or authorization
under the Hazardous Waste (Management & Handling) Rules 1989 issued under the
Environment (Protection ) Act, 1986 (29 of 1986) shall submit an Environmental
Statement Report for the financial year ending the 31st March in Form-V to the
concerned State Pollution Control Board on or before 15th Day of September every
year.

65
BUDGETARY ALLOCATION FOR EMP DURING OPERATION
Sl. No. EMP Aspect Cost in Rs
Capital Investment In Lakh
1. Sewage Treatment Plant 90.0
2. Rainwater harvesting facilities 5.35
3. Landscape development 15.0
4. Acoustic & Stacks for DG sets 51.0
5. Organic Waste Converter 5.0
Total 166.35
Operation Investment Lakh/ Annum
1. STP Maintenance 4.0
2. Landscape Maintenance 4.0
3. OWC Maintenance 3.0
4. EMP Cell 2.64
5. Environmental Monitoring-Air, Water, Noise 0.91
Total 14.55