Embed Size (px)
Citation preview
Annexures
75
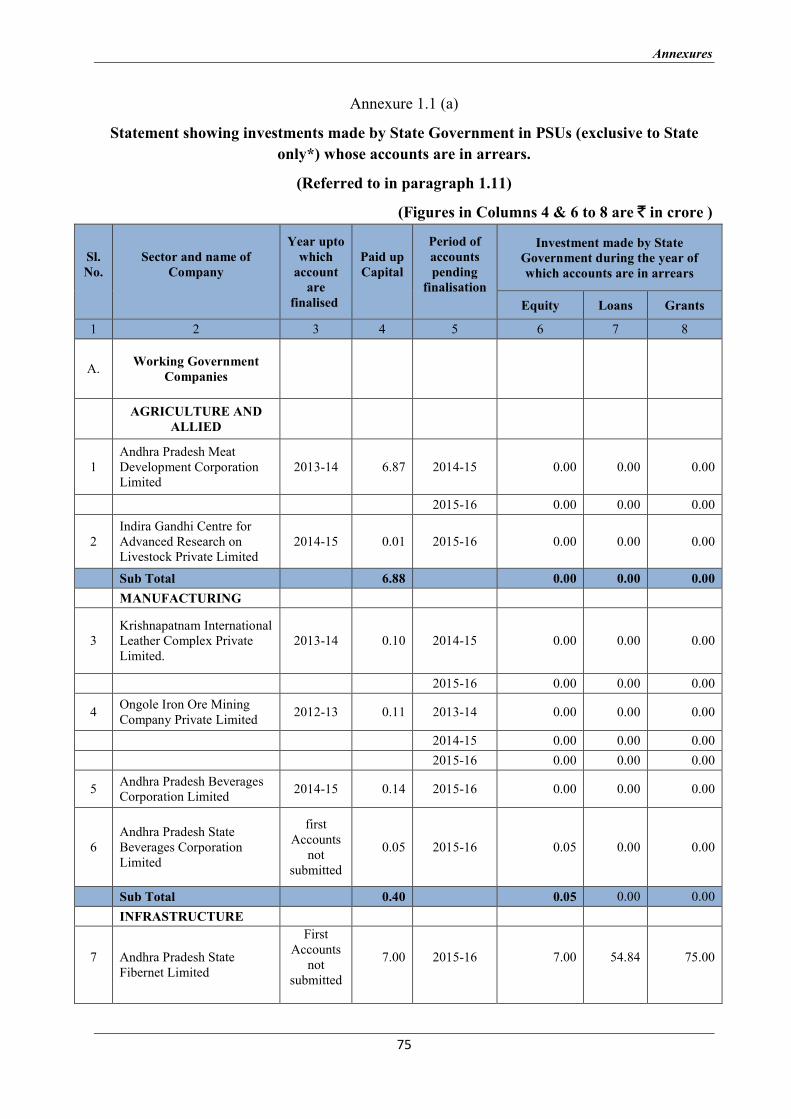
Annexure 1.1 (a)
Statement showing investments made by State Government in PSUs (exclusive to State
only*) whose accounts are in arrears.
(Referred to in paragraph 1.11)
(Figures in Columns 4 & 6 to 8 are ` in crore )
Sl. No.
Sector and name of Company
Year upto which
account are
finalised
Paid up Capital
Period of accounts pending
finalisation
Investment made by State Government during the year of which accounts are in arrears
Equity Loans Grants
1 2 3 4 5 6 7 8
A. Working Government
Companies
AGRICULTURE AND
ALLIED
1 Andhra Pradesh Meat Development Corporation Limited
2013-14 6.87 2014-15 0.00 0.00 0.00
2015-16 0.00 0.00 0.00
2 Indira Gandhi Centre for Advanced Research on Livestock Private Limited
2014-15 0.01 2015-16 0.00 0.00 0.00
Sub Total 6.88 0.00 0.00 0.00
MANUFACTURING
3 Krishnapatnam International Leather Complex Private Limited.
2013-14 0.10 2014-15 0.00 0.00 0.00
2015-16 0.00 0.00 0.00
4 Ongole Iron Ore Mining Company Private Limited
2012-13 0.11 2013-14 0.00 0.00 0.00
2014-15 0.00 0.00 0.00
2015-16 0.00 0.00 0.00
5 Andhra Pradesh Beverages Corporation Limited
2014-15 0.14 2015-16 0.00 0.00 0.00
6 Andhra Pradesh State Beverages Corporation Limited
first Accounts
not submitted
0.05 2015-16 0.05 0.00 0.00
Sub Total 0.40 0.05 0.00 0.00
INFRASTRUCTURE
7
Andhra Pradesh State Fibernet Limited
First Accounts
not submitted
7.00
2015-16
7.00
54.84
75.00
Report No. 6. of 2016 (Public Sector Undertakings)
76
Sl. No.
Sector and name of Company
Year upto which
account are
finalised
Paid up Capital
Period of accounts pending
finalisation
Investment made by State Government during the year of which accounts are in arrears
Equity Loans Grants
1 2 3 4 5 6 7 8
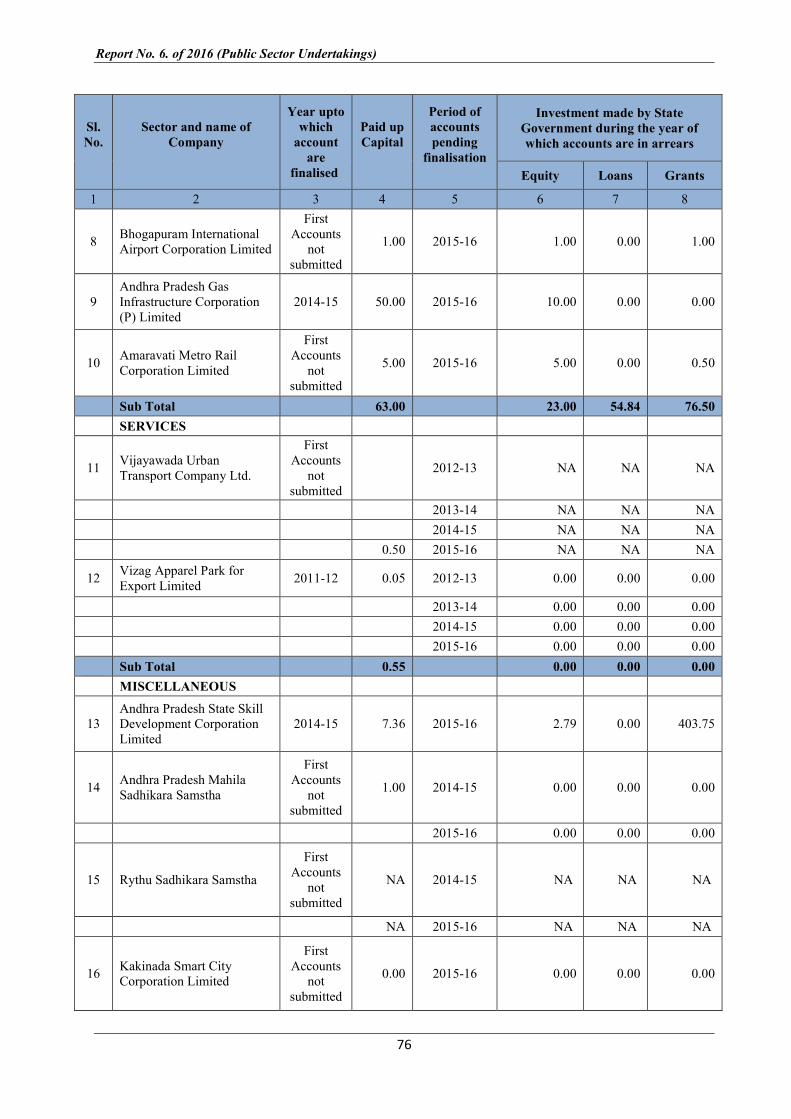
8 Bhogapuram International Airport Corporation Limited
First Accounts
not submitted
1.00 2015-16 1.00 0.00 1.00
9 Andhra Pradesh Gas Infrastructure Corporation (P) Limited
2014-15 50.00 2015-16 10.00 0.00 0.00
10 Amaravati Metro Rail Corporation Limited
First Accounts
not submitted
5.00 2015-16 5.00 0.00 0.50
Sub Total 63.00 23.00 54.84 76.50
SERVICES
11 Vijayawada Urban Transport Company Ltd.
First Accounts
not submitted
2012-13 NA NA NA
2013-14 NA NA NA
2014-15 NA NA NA
0.50 2015-16 NA NA NA
12 Vizag Apparel Park for Export Limited
2011-12 0.05 2012-13 0.00 0.00 0.00
2013-14 0.00 0.00 0.00
2014-15 0.00 0.00 0.00
2015-16 0.00 0.00 0.00
Sub Total 0.55 0.00 0.00 0.00
MISCELLANEOUS
13 Andhra Pradesh State Skill Development Corporation Limited
2014-15 7.36 2015-16 2.79 0.00 403.75
14 Andhra Pradesh Mahila Sadhikara Samstha
First Accounts
not submitted
1.00 2014-15 0.00 0.00 0.00
2015-16 0.00 0.00 0.00
15 Rythu Sadhikara Samstha
First Accounts
not submitted
NA 2014-15 NA NA NA
NA 2015-16 NA NA NA
16 Kakinada Smart City Corporation Limited
First Accounts
not submitted
0.00 2015-16 0.00 0.00 0.00
Annexures
77
Sl. No.
Sector and name of Company
Year upto which
account are
finalised
Paid up Capital
Period of accounts pending
finalisation
Investment made by State Government during the year of which accounts are in arrears
Equity Loans Grants
1 2 3 4 5 6 7 8
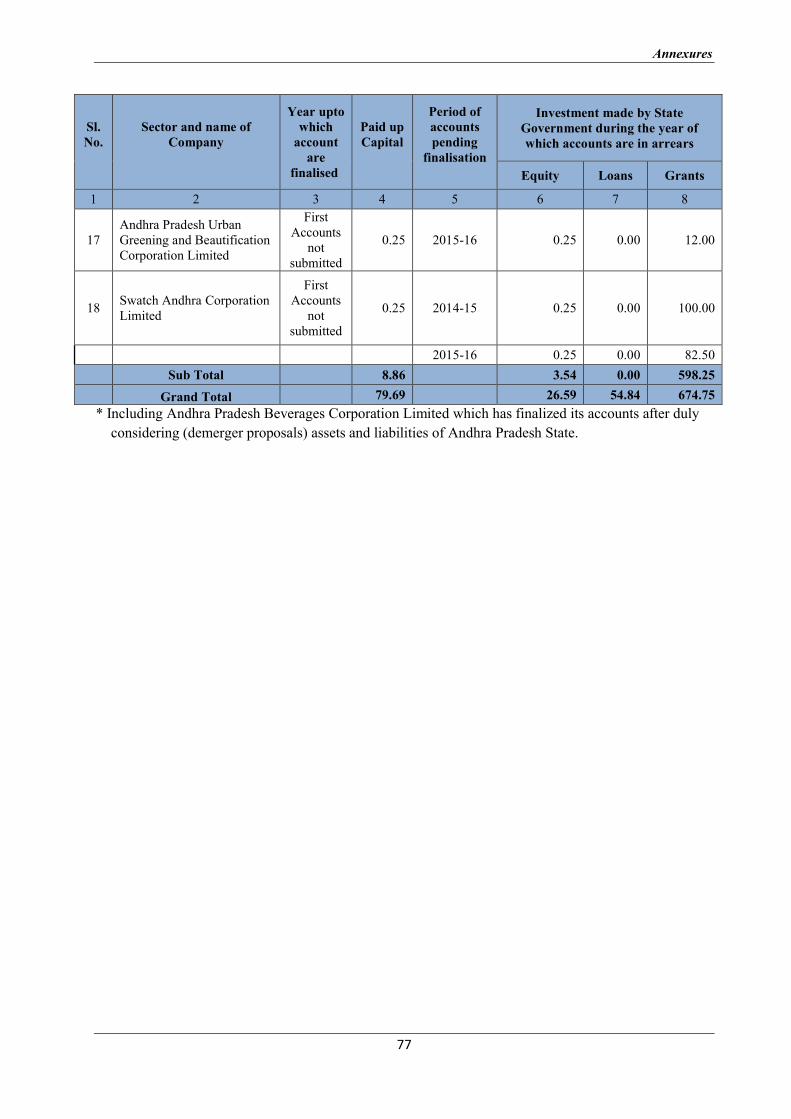
17 Andhra Pradesh Urban Greening and Beautification Corporation Limited
First Accounts
not submitted
0.25 2015-16 0.25 0.00 12.00
18 Swatch Andhra Corporation Limited
First Accounts
not submitted
0.25 2014-15 0.25 0.00 100.00
2015-16 0.25 0.00 82.50
Sub Total 8.86 3.54 0.00 598.25
Grand Total 79.69 26.59 54.84 674.75
* Including Andhra Pradesh Beverages Corporation Limited which has finalized its accounts after duly
considering (demerger proposals) assets and liabilities of Andhra Pradesh State.
Report No. 6. of 2016 (Public Sector Undertakings)
78
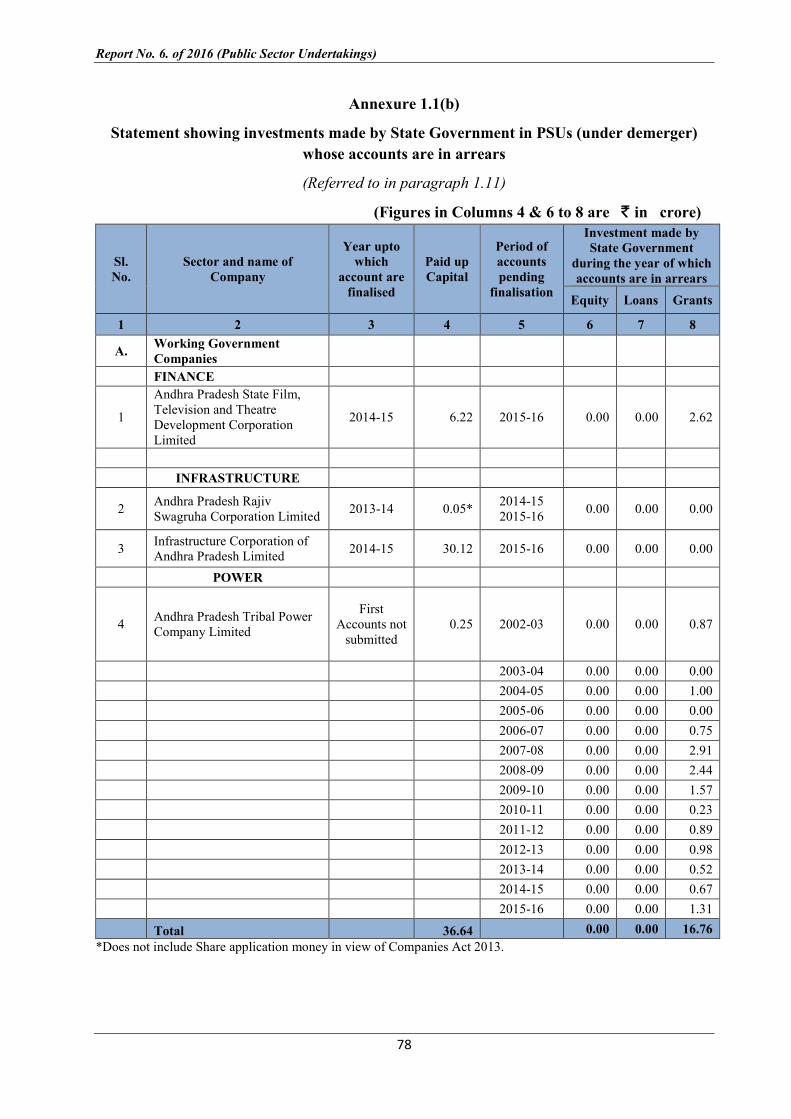
Annexure 1.1(b)
Statement showing investments made by State Government in PSUs (under demerger)
whose accounts are in arrears
(Referred to in paragraph 1.11)
(Figures in Columns 4 & 6 to 8 are ` in crore)
Sl. No.
Sector and name of Company
Year upto which
account are finalised
Paid up Capital
Period of accounts pending
finalisation
Investment made by State Government
during the year of which accounts are in arrears
Equity Loans Grants
1 2 3 4 5 6 7 8
A. Working Government Companies
FINANCE
1
Andhra Pradesh State Film, Television and Theatre Development Corporation Limited
2014-15 6.22 2015-16 0.00 0.00 2.62
INFRASTRUCTURE
2 Andhra Pradesh Rajiv Swagruha Corporation Limited
2013-14 0.05* 2014-15 2015-16
0.00 0.00 0.00
3 Infrastructure Corporation of Andhra Pradesh Limited
2014-15 30.12 2015-16 0.00 0.00 0.00
POWER
4 Andhra Pradesh Tribal Power Company Limited
First Accounts not
submitted 0.25 2002-03 0.00 0.00 0.87
2003-04 0.00 0.00 0.00
2004-05 0.00 0.00 1.00
2005-06 0.00 0.00 0.00
2006-07 0.00 0.00 0.75
2007-08 0.00 0.00 2.91
2008-09 0.00 0.00 2.44
2009-10 0.00 0.00 1.57
2010-11 0.00 0.00 0.23
2011-12 0.00 0.00 0.89
2012-13 0.00 0.00 0.98
2013-14 0.00 0.00 0.52
2014-15 0.00 0.00 0.67
2015-16 0.00 0.00 1.31
Total 36.64 0.00 0.00 16.76
*Does not include Share application money in view of Companies Act 2013.
Annexures
79
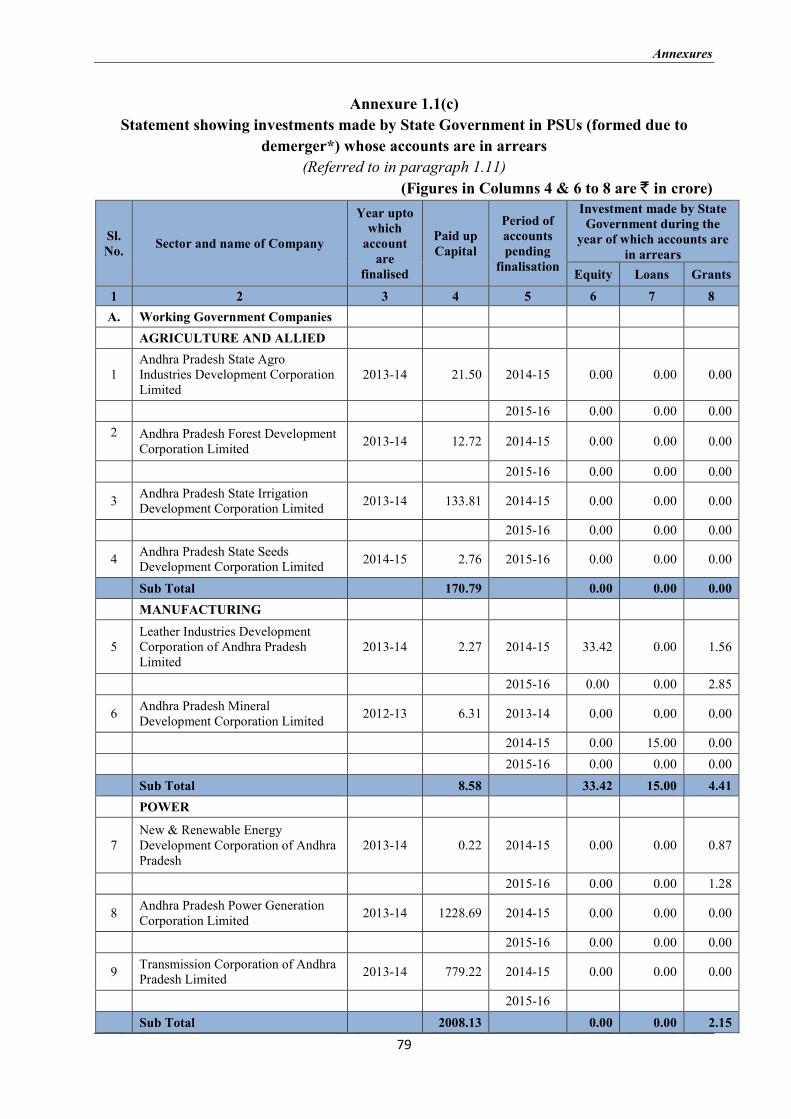
Annexure 1.1(c)
Statement showing investments made by State Government in PSUs (formed due to
demerger*) whose accounts are in arrears
(Referred to in paragraph 1.11)
(Figures in Columns 4 & 6 to 8 are ` in crore)
Sl. No.
Sector and name of Company
Year upto which
account are
finalised
Paid up Capital
Period of accounts pending
finalisation
Investment made by State Government during the
year of which accounts are in arrears
Equity Loans Grants
1 2 3 4 5 6 7 8
A. Working Government Companies
AGRICULTURE AND ALLIED
1 Andhra Pradesh State Agro Industries Development Corporation Limited
2013-14 21.50 2014-15 0.00 0.00 0.00
2015-16 0.00 0.00 0.00
2
Andhra Pradesh Forest Development Corporation Limited
2013-14 12.72 2014-15 0.00 0.00 0.00
2015-16 0.00 0.00 0.00
3 Andhra Pradesh State Irrigation Development Corporation Limited
2013-14 133.81 2014-15 0.00 0.00 0.00
2015-16 0.00 0.00 0.00
4 Andhra Pradesh State Seeds Development Corporation Limited
2014-15 2.76 2015-16 0.00 0.00 0.00
Sub Total
170.79
0.00 0.00 0.00
MANUFACTURING
5 Leather Industries Development Corporation of Andhra Pradesh Limited
2013-14 2.27 2014-15 33.42 0.00 1.56
2015-16 0.00 0.00 2.85
6 Andhra Pradesh Mineral Development Corporation Limited
2012-13 6.31 2013-14 0.00 0.00 0.00
2014-15 0.00 15.00 0.00
2015-16 0.00 0.00 0.00
Sub Total
8.58
33.42 15.00 4.41
POWER
7 New & Renewable Energy Development Corporation of Andhra Pradesh
2013-14 0.22 2014-15 0.00 0.00 0.87
2015-16 0.00 0.00 1.28
8 Andhra Pradesh Power Generation Corporation Limited
2013-14 1228.69 2014-15 0.00 0.00 0.00
2015-16 0.00 0.00 0.00
9 Transmission Corporation of Andhra Pradesh Limited
2013-14 779.22 2014-15 0.00 0.00 0.00
2015-16
Sub Total
2008.13
0.00 0.00 2.15
Report No. 6. of 2016 (Public Sector Undertakings)
80
Sl. No.
Sector and name of Company
Year upto which
account are
finalised
Paid up Capital
Period of accounts pending
finalisation
Investment made by State Government during the
year of which accounts are in arrears
Equity Loans Grants
1 2 3 4 5 6 7 8
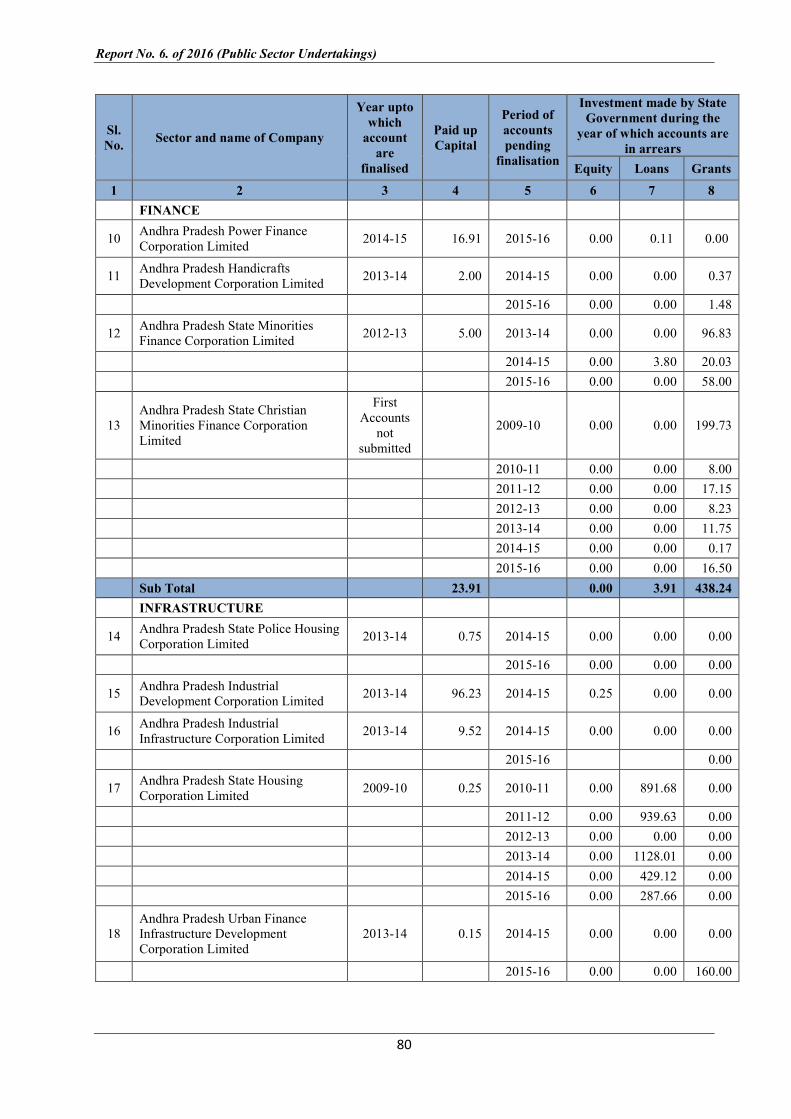
FINANCE
10 Andhra Pradesh Power Finance Corporation Limited
2014-15 16.91 2015-16 0.00 0.11 0.00
11 Andhra Pradesh Handicrafts Development Corporation Limited
2013-14 2.00 2014-15 0.00 0.00 0.37
2015-16 0.00 0.00 1.48
12 Andhra Pradesh State Minorities Finance Corporation Limited
2012-13 5.00 2013-14 0.00 0.00 96.83
2014-15 0.00 3.80 20.03
2015-16 0.00 0.00 58.00
13 Andhra Pradesh State Christian Minorities Finance Corporation Limited
First Accounts
not submitted
2009-10 0.00 0.00 199.73
2010-11 0.00 0.00 8.00
2011-12 0.00 0.00 17.15
2012-13 0.00 0.00 8.23
2013-14 0.00 0.00 11.75
2014-15 0.00 0.00 0.17
2015-16 0.00 0.00 16.50
Sub Total
23.91
0.00 3.91 438.24
INFRASTRUCTURE
14 Andhra Pradesh State Police Housing Corporation Limited
2013-14 0.75 2014-15 0.00 0.00 0.00
2015-16 0.00 0.00 0.00
15 Andhra Pradesh Industrial Development Corporation Limited
2013-14 96.23 2014-15 0.25 0.00 0.00
16 Andhra Pradesh Industrial Infrastructure Corporation Limited
2013-14 9.52 2014-15 0.00 0.00 0.00
2015-16 0.00
17 Andhra Pradesh State Housing Corporation Limited
2009-10 0.25 2010-11 0.00 891.68 0.00
2011-12 0.00 939.63 0.00
2012-13 0.00 0.00 0.00
2013-14 0.00 1128.01 0.00
2014-15 0.00 429.12 0.00
2015-16 0.00 287.66 0.00
18 Andhra Pradesh Urban Finance Infrastructure Development Corporation Limited
2013-14 0.15 2014-15 0.00 0.00 0.00
2015-16 0.00 0.00 160.00
Annexures
81
Sl. No.
Sector and name of Company
Year upto which
account are
finalised
Paid up Capital
Period of accounts pending
finalisation
Investment made by State Government during the
year of which accounts are in arrears
Equity Loans Grants
1 2 3 4 5 6 7 8
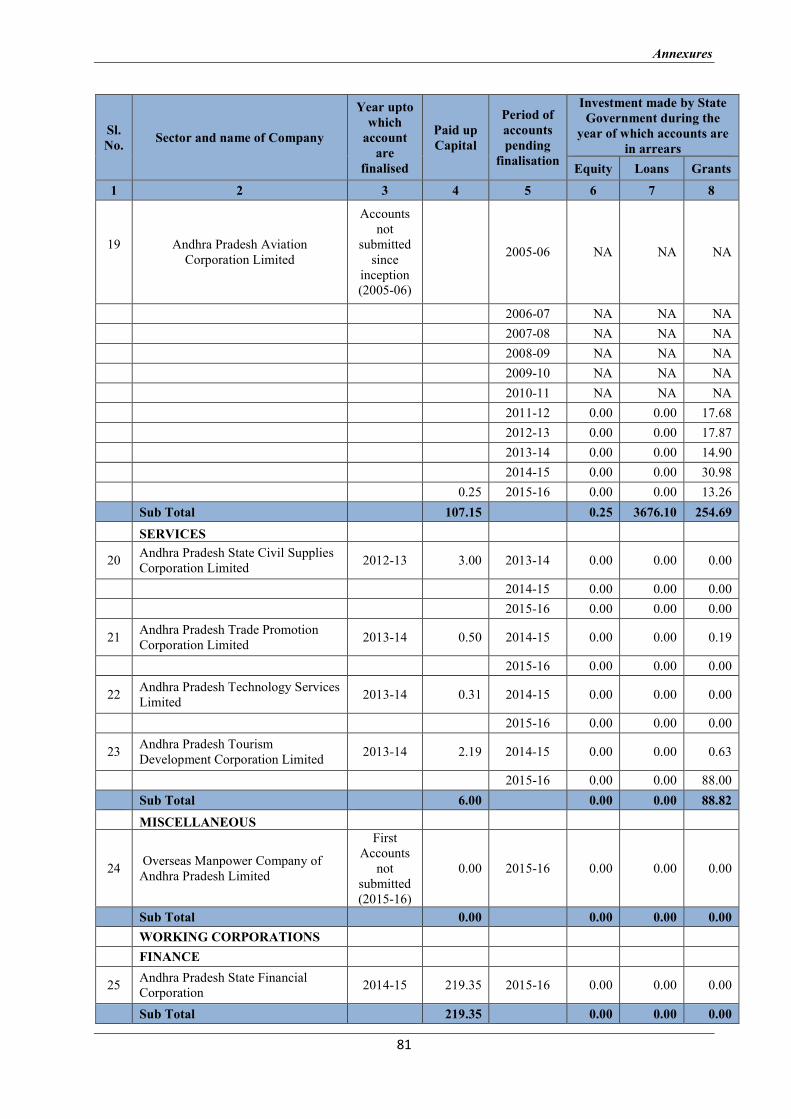
19
Andhra Pradesh Aviation Corporation Limited
Accounts not
submitted since
inception (2005-06)
2005-06 NA NA NA
2006-07 NA NA NA
2007-08 NA NA NA
2008-09 NA NA NA
2009-10 NA NA NA
2010-11 NA NA NA
2011-12 0.00 0.00 17.68
2012-13 0.00 0.00 17.87
2013-14 0.00 0.00 14.90
2014-15 0.00 0.00 30.98
0.25 2015-16 0.00 0.00 13.26
Sub Total
107.15
0.25 3676.10 254.69
SERVICES
20 Andhra Pradesh State Civil Supplies Corporation Limited
2012-13 3.00 2013-14 0.00 0.00 0.00
2014-15 0.00 0.00 0.00
2015-16 0.00 0.00 0.00
21 Andhra Pradesh Trade Promotion Corporation Limited
2013-14 0.50 2014-15 0.00 0.00 0.19
2015-16 0.00 0.00 0.00
22 Andhra Pradesh Technology Services Limited
2013-14 0.31 2014-15 0.00 0.00 0.00
2015-16 0.00 0.00 0.00
23 Andhra Pradesh Tourism Development Corporation Limited
2013-14 2.19 2014-15 0.00 0.00 0.63
2015-16 0.00 0.00 88.00
Sub Total
6.00
0.00 0.00 88.82
MISCELLANEOUS
24 Overseas Manpower Company of Andhra Pradesh Limited
First Accounts
not submitted (2015-16)
0.00 2015-16 0.00 0.00 0.00
Sub Total
0.00
0.00 0.00 0.00
WORKING CORPORATIONS
FINANCE
25 Andhra Pradesh State Financial Corporation
2014-15 219.35 2015-16 0.00 0.00 0.00
Sub Total
219.35
0.00 0.00 0.00
Report No. 6. of 2016 (Public Sector Undertakings)
82
Sl. No.
Sector and name of Company
Year upto which
account are
finalised
Paid up Capital
Period of accounts pending
finalisation
Investment made by State Government during the
year of which accounts are in arrears
Equity Loans Grants
1 2 3 4 5 6 7 8
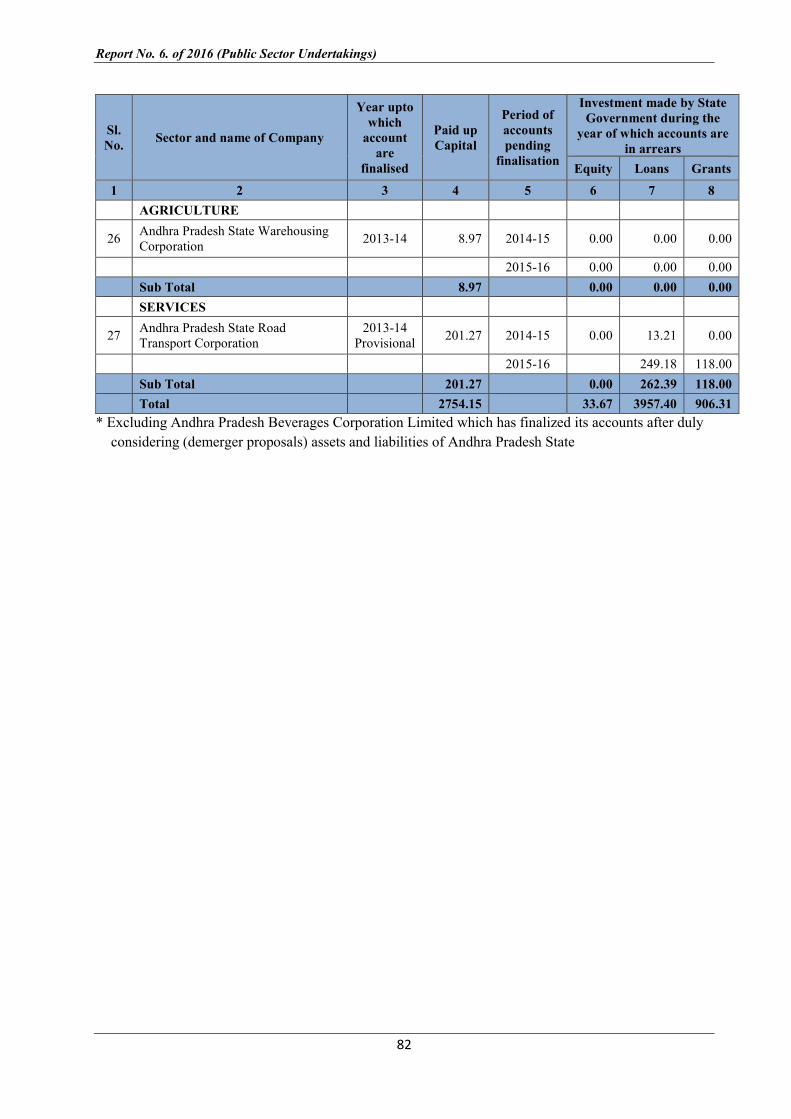
AGRICULTURE
26 Andhra Pradesh State Warehousing Corporation
2013-14 8.97 2014-15 0.00 0.00 0.00
2015-16 0.00 0.00 0.00
Sub Total
8.97
0.00 0.00 0.00
SERVICES
27 Andhra Pradesh State Road Transport Corporation
2013-14 Provisional
201.27 2014-15 0.00 13.21 0.00
2015-16 249.18 118.00
Sub Total
201.27
0.00 262.39 118.00
Total 2754.15 33.67 3957.40 906.31
* Excluding Andhra Pradesh Beverages Corporation Limited which has finalized its accounts after duly
considering (demerger proposals) assets and liabilities of Andhra Pradesh State
Annexures
83
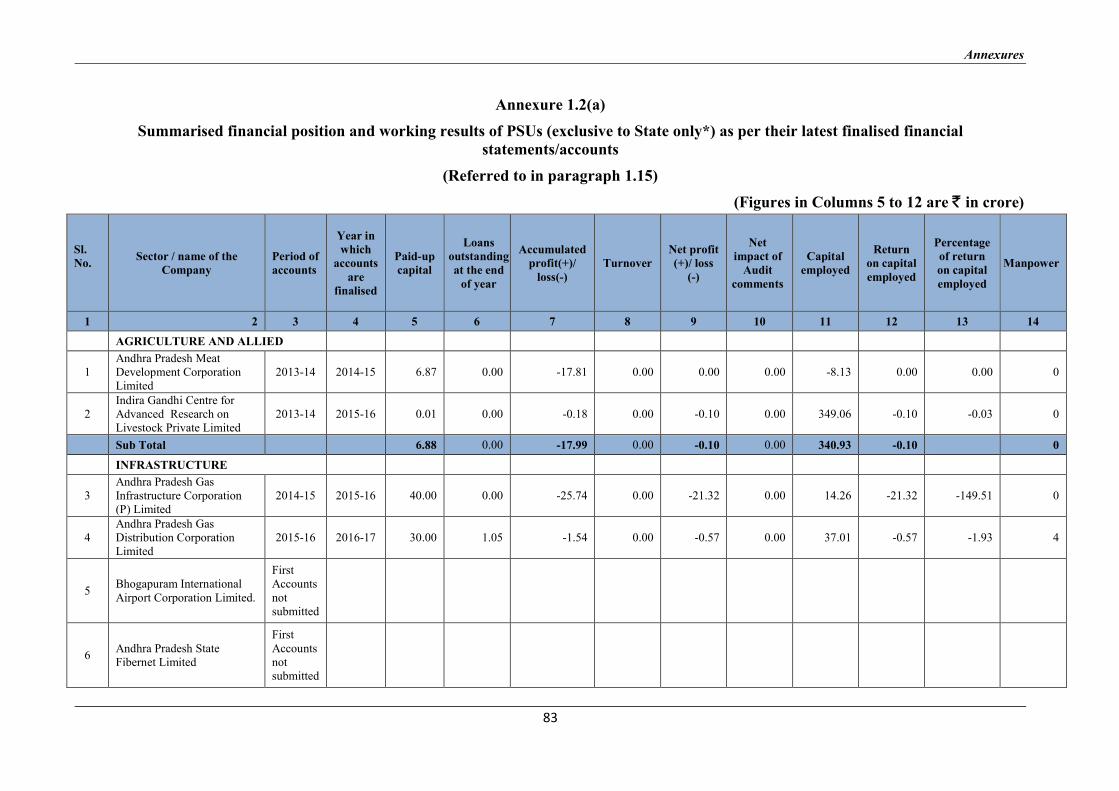
Annexure 1.2(a)
Summarised financial position and working results of PSUs (exclusive to State only*) as per their latest finalised financial statements/accounts
(Referred to in paragraph 1.15)
(Figures in Columns 5 to 12 are ` in crore)
Sl. No.
Sector / name of the Company
Period of accounts
Year in which
accounts are
finalised
Paid-up capital
Loans outstanding at the end
of year
Accumulated profit(+)/
loss(-) Turnover
Net profit (+)/ loss
(-)
Net impact of
Audit comments
Capital employed
Return on capital employed
Percentage of return on capital employed
Manpower
1 2 3 4 5 6 7 8 9 10 11 12 13 14
AGRICULTURE AND ALLIED
1 Andhra Pradesh Meat Development Corporation Limited
2013-14 2014-15 6.87 0.00 -17.81 0.00 0.00 0.00 -8.13 0.00 0.00 0
2 Indira Gandhi Centre for Advanced Research on Livestock Private Limited
2013-14 2015-16 0.01 0.00 -0.18 0.00 -0.10 0.00 349.06 -0.10 -0.03 0
Sub Total 6.88 0.00 -17.99 0.00 -0.10 0.00 340.93 -0.10
0
INFRASTRUCTURE
3 Andhra Pradesh Gas Infrastructure Corporation (P) Limited
2014-15 2015-16 40.00 0.00 -25.74 0.00 -21.32 0.00 14.26 -21.32 -149.51 0
4 Andhra Pradesh Gas Distribution Corporation Limited
2015-16 2016-17 30.00 1.05 -1.54 0.00 -0.57 0.00 37.01 -0.57 -1.93 4
5 Bhogapuram International Airport Corporation Limited.
First Accounts not submitted
6 Andhra Pradesh State Fibernet Limited
First Accounts not submitted
Report No. 6. of 2016 (Public Sector Undertakings)
84
Sl. No.
Sector / name of the Company
Period of accounts
Year in which
accounts are
finalised
Paid-up capital
Loans outstanding at the end
of year
Accumulated profit(+)/
loss(-) Turnover
Net profit (+)/ loss
(-)
Net impact of
Audit comments
Capital employed
Return on capital employed
Percentage of return on capital employed
Manpower
1 2 3 4 5 6 7 8 9 10 11 12 13 14
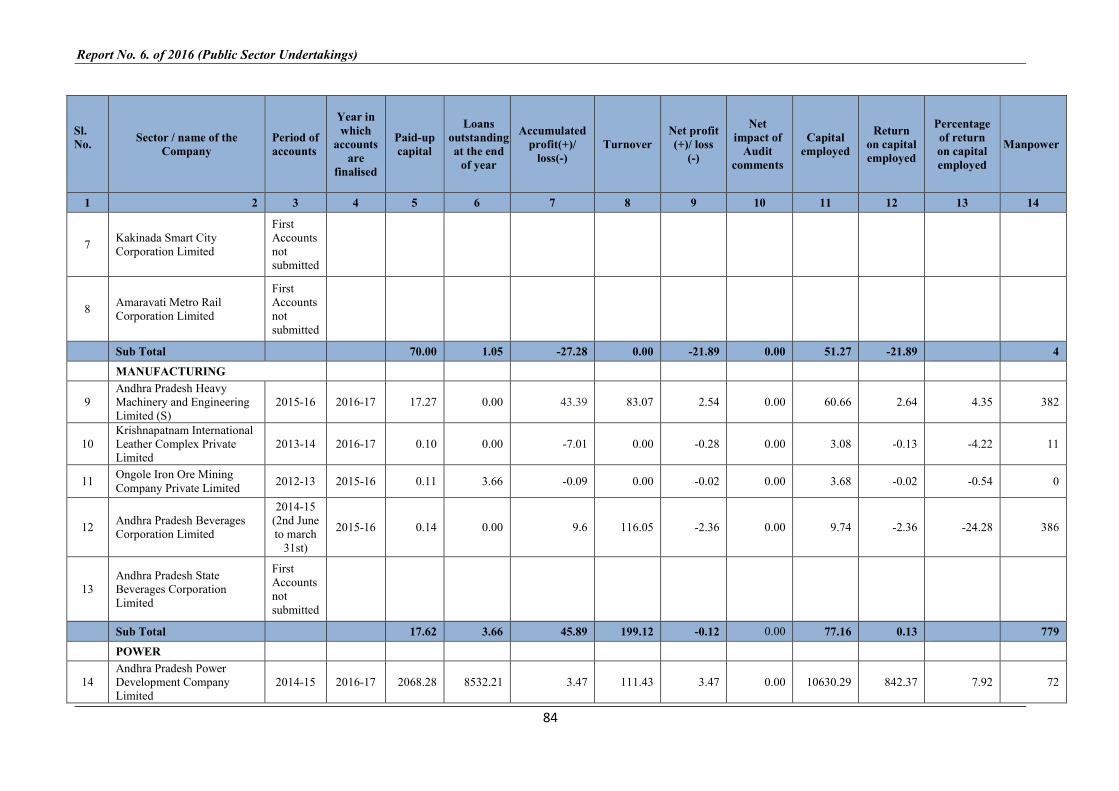
7 Kakinada Smart City Corporation Limited
First Accounts not submitted
8 Amaravati Metro Rail Corporation Limited
First Accounts not submitted
Sub Total 70.00 1.05 -27.28 0.00 -21.89 0.00 51.27 -21.89
4
MANUFACTURING
9 Andhra Pradesh Heavy Machinery and Engineering Limited (S)
2015-16 2016-17 17.27 0.00 43.39 83.07 2.54 0.00 60.66 2.64 4.35 382
10 Krishnapatnam International Leather Complex Private Limited
2013-14 2016-17 0.10 0.00 -7.01 0.00 -0.28 0.00 3.08 -0.13 -4.22 11
11 Ongole Iron Ore Mining Company Private Limited
2012-13 2015-16 0.11 3.66 -0.09 0.00 -0.02 0.00 3.68 -0.02 -0.54 0
12 Andhra Pradesh Beverages Corporation Limited
2014-15 (2nd June to march
31st)
2015-16 0.14 0.00 9.6 116.05 -2.36 0.00 9.74 -2.36 -24.28 386
13 Andhra Pradesh State Beverages Corporation Limited
First Accounts not submitted
Sub Total 17.62 3.66 45.89 199.12 -0.12 0.00 77.16 0.13
779
POWER
14 Andhra Pradesh Power Development Company Limited
2014-15 2016-17 2068.28 8532.21 3.47 111.43 3.47 0.00 10630.29 842.37 7.92 72
Annexures
85
Sl. No.
Sector / name of the Company
Period of accounts
Year in which
accounts are
finalised
Paid-up capital
Loans outstanding at the end
of year
Accumulated profit(+)/
loss(-) Turnover
Net profit (+)/ loss
(-)
Net impact of
Audit comments
Capital employed
Return on capital employed
Percentage of return on capital employed
Manpower
1 2 3 4 5 6 7 8 9 10 11 12 13 14
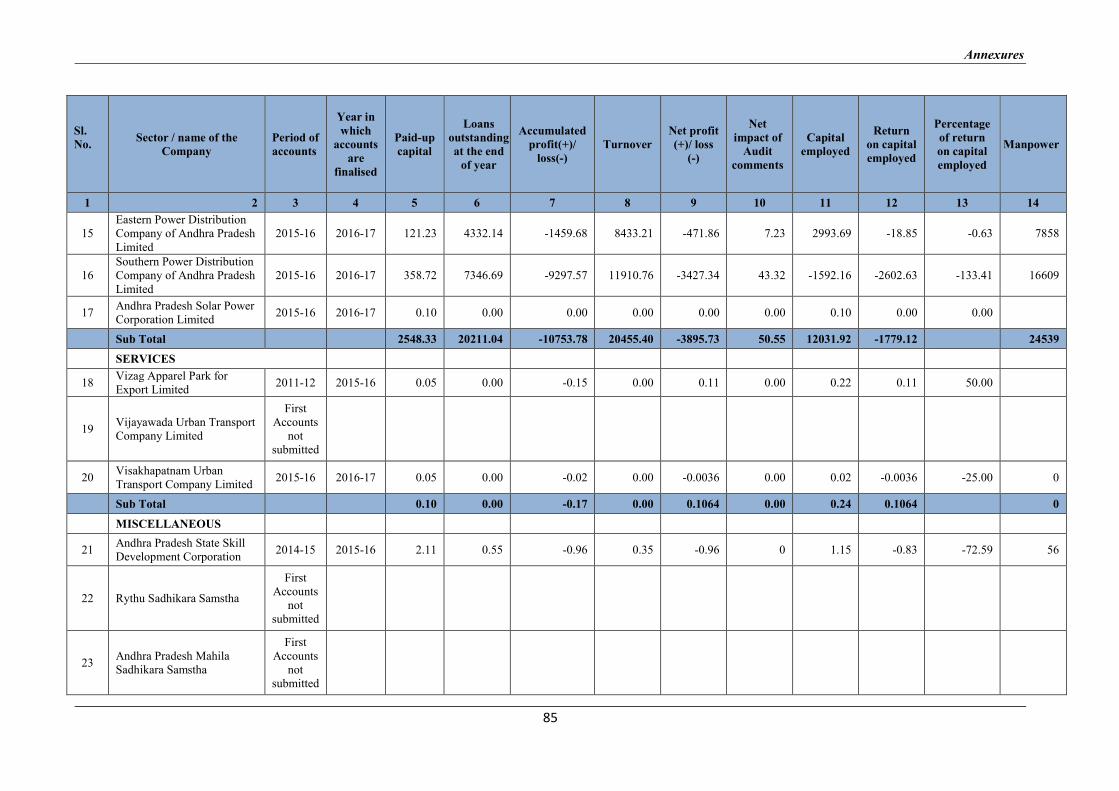
15 Eastern Power Distribution Company of Andhra Pradesh Limited
2015-16 2016-17 121.23 4332.14 -1459.68 8433.21 -471.86 7.23 2993.69 -18.85 -0.63 7858
16 Southern Power Distribution Company of Andhra Pradesh Limited
2015-16 2016-17 358.72 7346.69 -9297.57 11910.76 -3427.34 43.32 -1592.16 -2602.63 -133.41 16609
17 Andhra Pradesh Solar Power Corporation Limited
2015-16 2016-17 0.10 0.00 0.00 0.00 0.00 0.00 0.10 0.00 0.00
Sub Total 2548.33 20211.04 -10753.78 20455.40 -3895.73 50.55 12031.92 -1779.12
24539
SERVICES
18 Vizag Apparel Park for Export Limited
2011-12 2015-16 0.05 0.00 -0.15 0.00 0.11 0.00 0.22 0.11 50.00
19 Vijayawada Urban Transport Company Limited
First Accounts
not submitted
20 Visakhapatnam Urban Transport Company Limited
2015-16 2016-17 0.05 0.00 -0.02 0.00 -0.0036 0.00 0.02 -0.0036 -25.00 0
Sub Total 0.10 0.00 -0.17 0.00 0.1064 0.00 0.24 0.1064
0
MISCELLANEOUS
21 Andhra Pradesh State Skill Development Corporation
2014-15 2015-16 2.11 0.55 -0.96 0.35 -0.96 0 1.15 -0.83 -72.59 56
22 Rythu Sadhikara Samstha
First Accounts
not submitted
23 Andhra Pradesh Mahila Sadhikara Samstha
First Accounts
not submitted
Report No. 6. of 2016 (Public Sector Undertakings)
86
Sl. No.
Sector / name of the Company
Period of accounts
Year in which
accounts are
finalised
Paid-up capital
Loans outstanding at the end
of year
Accumulated profit(+)/
loss(-) Turnover
Net profit (+)/ loss
(-)
Net impact of
Audit comments
Capital employed
Return on capital employed
Percentage of return on capital employed
Manpower
1 2 3 4 5 6 7 8 9 10 11 12 13 14
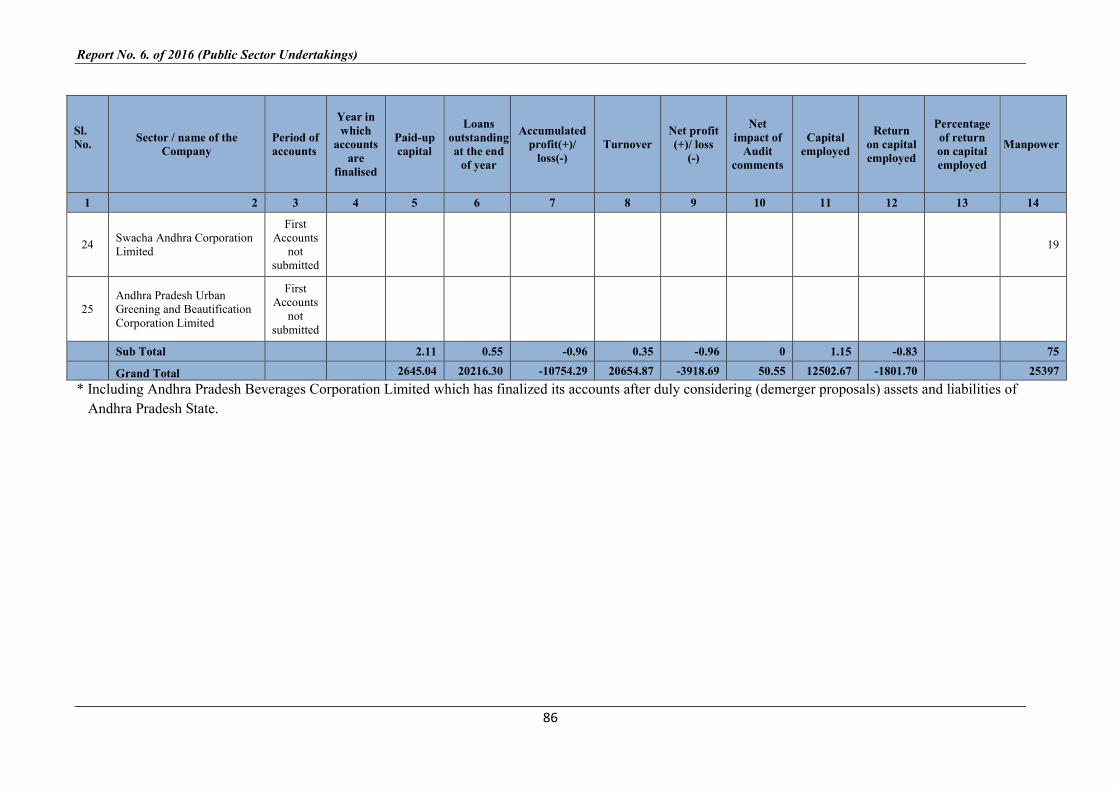
24 Swacha Andhra Corporation Limited
First Accounts
not submitted
19
25 Andhra Pradesh Urban Greening and Beautification Corporation Limited
First Accounts
not submitted
Sub Total 2.11 0.55 -0.96 0.35 -0.96 0 1.15 -0.83
75
Grand Total 2645.04 20216.30 -10754.29 20654.87 -3918.69 50.55 12502.67 -1801.70
25397
* Including Andhra Pradesh Beverages Corporation Limited which has finalized its accounts after duly considering (demerger proposals) assets and liabilities of
Andhra Pradesh State.
Annexures
87
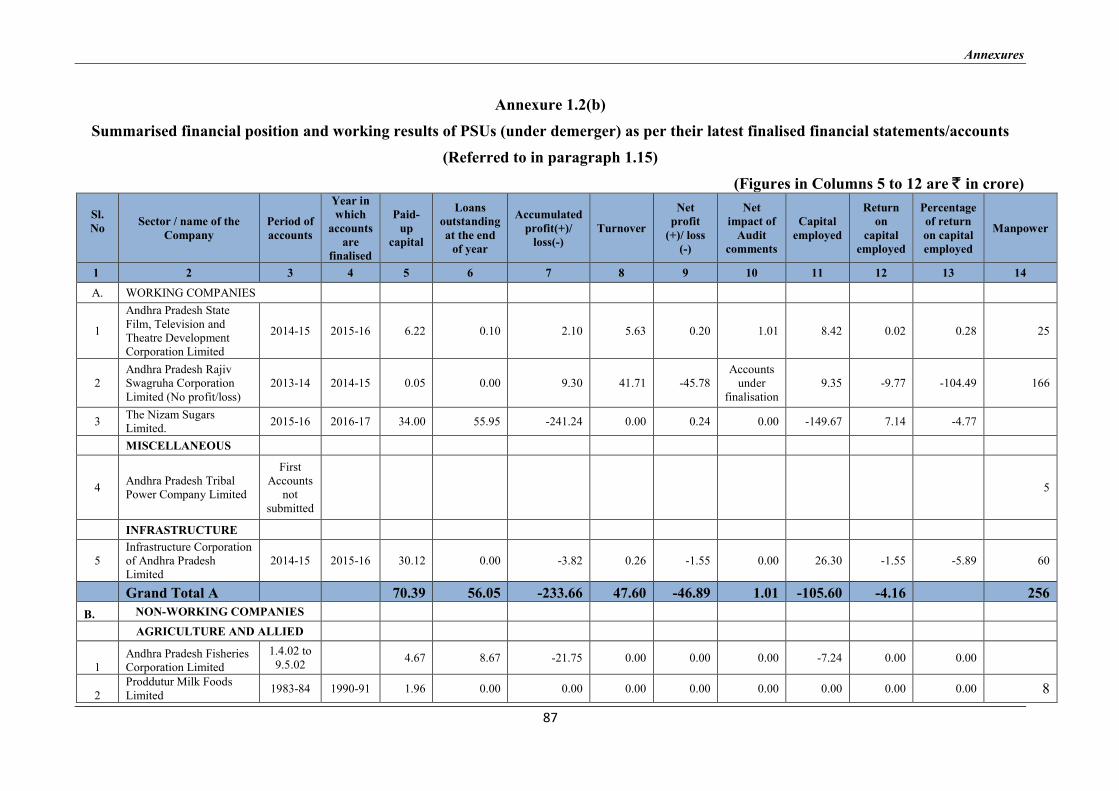
Annexure 1.2(b)
Summarised financial position and working results of PSUs (under demerger) as per their latest finalised financial statements/accounts
(Referred to in paragraph 1.15)
(Figures in Columns 5 to 12 are ` in crore)
Sl. No
Sector / name of the Company
Period of accounts
Year in which
accounts are
finalised
Paid-up
capital
Loans outstanding at the end
of year
Accumulated profit(+)/
loss(-) Turnover
Net profit
(+)/ loss (-)
Net impact of
Audit comments
Capital employed
Return on
capital employed
Percentage of return on capital employed
Manpower
1 2 3 4 5 6 7 8 9 10 11 12 13 14
A. WORKING COMPANIES
1
Andhra Pradesh State Film, Television and Theatre Development Corporation Limited
2014-15 2015-16 6.22 0.10 2.10 5.63 0.20 1.01 8.42 0.02 0.28 25
2 Andhra Pradesh Rajiv Swagruha Corporation Limited (No profit/loss)
2013-14 2014-15 0.05 0.00 9.30 41.71 -45.78 Accounts
under finalisation
9.35 -9.77 -104.49 166
3 The Nizam Sugars Limited.
2015-16 2016-17 34.00 55.95 -241.24 0.00 0.24 0.00 -149.67 7.14 -4.77
MISCELLANEOUS
4 Andhra Pradesh Tribal Power Company Limited
First Accounts
not submitted
5
INFRASTRUCTURE
5 Infrastructure Corporation of Andhra Pradesh Limited
2014-15 2015-16 30.12 0.00 -3.82 0.26 -1.55 0.00 26.30 -1.55 -5.89 60
Grand Total A 70.39 56.05 -233.66 47.60 -46.89 1.01 -105.60 -4.16 256
B. NON-WORKING COMPANIES
AGRICULTURE AND ALLIED
1 Andhra Pradesh Fisheries Corporation Limited
1.4.02 to 9.5.02
4.67 8.67 -21.75 0.00 0.00 0.00 -7.24 0.00 0.00
2 Proddutur Milk Foods Limited
1983-84 1990-91 1.96 0.00 0.00 0.00 0.00 0.00 0.00 0.00 0.00 8
Report No. 6. of 2016 (Public Sector Undertakings)
88
Sl. No
Sector / name of the Company
Period of accounts
Year in which
accounts are
finalised
Paid-up
capital
Loans outstanding at the end
of year
Accumulated profit(+)/
loss(-) Turnover
Net profit
(+)/ loss (-)
Net impact of
Audit comments
Capital employed
Return on
capital employed
Percentage of return on capital employed
Manpower
1 2 3 4 5 6 7 8 9 10 11 12 13 14
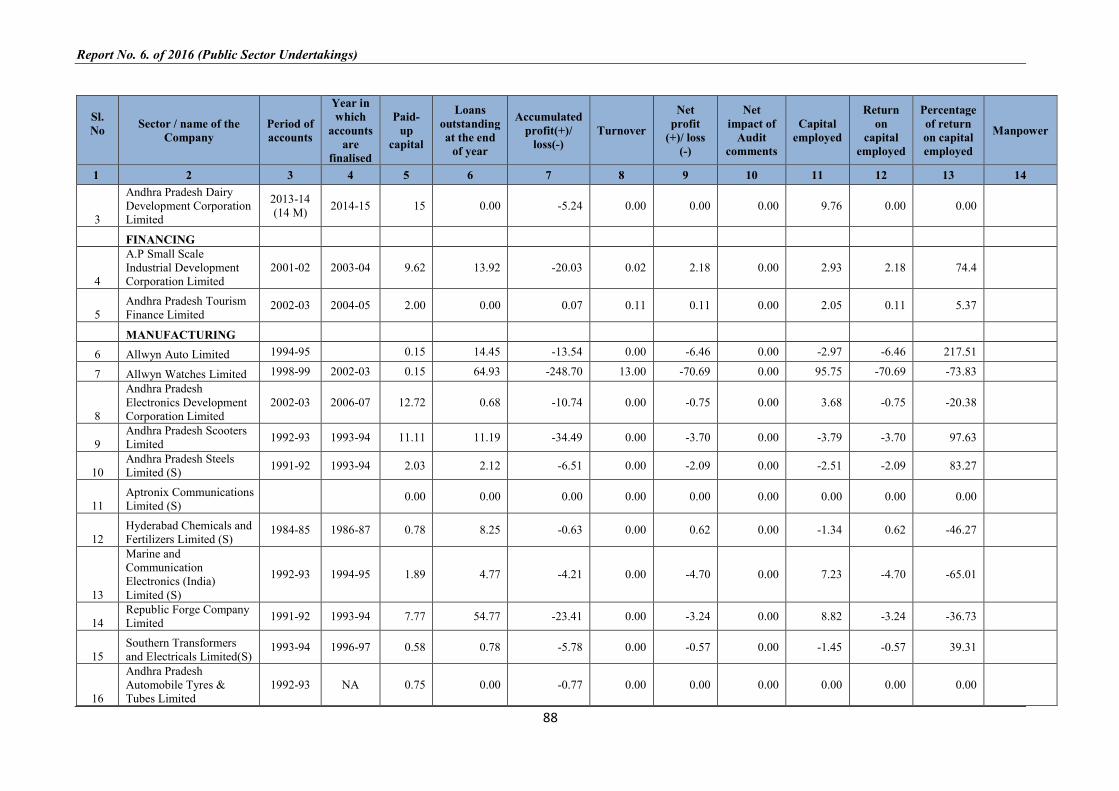
3
Andhra Pradesh Dairy Development Corporation Limited
2013-14 (14 M)
2014-15 15 0.00 -5.24 0.00 0.00 0.00 9.76 0.00 0.00
FINANCING
4
A.P Small Scale Industrial Development Corporation Limited
2001-02 2003-04 9.62 13.92 -20.03 0.02 2.18 0.00 2.93 2.18 74.4
5 Andhra Pradesh Tourism Finance Limited
2002-03 2004-05 2.00 0.00 0.07 0.11 0.11 0.00 2.05 0.11 5.37
MANUFACTURING
6 Allwyn Auto Limited 1994-95
0.15 14.45 -13.54 0.00 -6.46 0.00 -2.97 -6.46 217.51
7 Allwyn Watches Limited 1998-99 2002-03 0.15 64.93 -248.70 13.00 -70.69 0.00 95.75 -70.69 -73.83
8
Andhra Pradesh Electronics Development Corporation Limited
2002-03 2006-07 12.72 0.68 -10.74 0.00 -0.75 0.00 3.68 -0.75 -20.38
9 Andhra Pradesh Scooters Limited
1992-93 1993-94 11.11 11.19 -34.49 0.00 -3.70 0.00 -3.79 -3.70 97.63
10 Andhra Pradesh Steels Limited (S)
1991-92 1993-94 2.03 2.12 -6.51 0.00 -2.09 0.00 -2.51 -2.09 83.27
11 Aptronix Communications Limited (S)
0.00 0.00 0.00 0.00 0.00 0.00 0.00 0.00 0.00
12 Hyderabad Chemicals and Fertilizers Limited (S)
1984-85 1986-87 0.78 8.25 -0.63 0.00 0.62 0.00 -1.34 0.62 -46.27
13
Marine and Communication Electronics (India) Limited (S)
1992-93 1994-95 1.89 4.77 -4.21 0.00 -4.70 0.00 7.23 -4.70 -65.01
14 Republic Forge Company Limited
1991-92 1993-94 7.77 54.77 -23.41 0.00 -3.24 0.00 8.82 -3.24 -36.73
15 Southern Transformers and Electricals Limited(S)
1993-94 1996-97 0.58 0.78 -5.78 0.00 -0.57 0.00 -1.45 -0.57 39.31
16
Andhra Pradesh Automobile Tyres & Tubes Limited
1992-93 NA 0.75 0.00 -0.77 0.00 0.00 0.00 0.00 0.00 0.00
Annexures
89
Sl. No
Sector / name of the Company
Period of accounts
Year in which
accounts are
finalised
Paid-up
capital
Loans outstanding at the end
of year
Accumulated profit(+)/
loss(-) Turnover
Net profit
(+)/ loss (-)
Net impact of
Audit comments
Capital employed
Return on
capital employed
Percentage of return on capital employed
Manpower
1 2 3 4 5 6 7 8 9 10 11 12 13 14
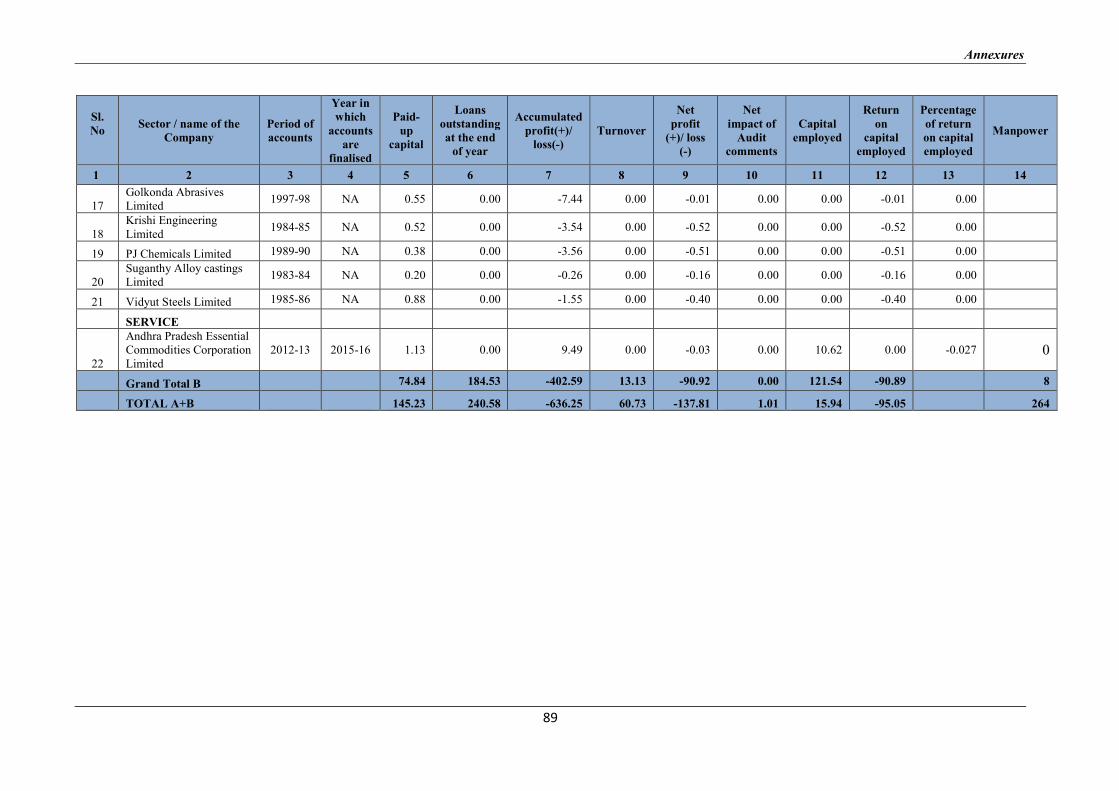
17 Golkonda Abrasives Limited
1997-98 NA 0.55 0.00 -7.44 0.00 -0.01 0.00 0.00 -0.01 0.00
18 Krishi Engineering Limited
1984-85 NA 0.52 0.00 -3.54 0.00 -0.52 0.00 0.00 -0.52 0.00
19 PJ Chemicals Limited 1989-90 NA 0.38 0.00 -3.56 0.00 -0.51 0.00 0.00 -0.51 0.00
20 Suganthy Alloy castings Limited
1983-84 NA 0.20 0.00 -0.26 0.00 -0.16 0.00 0.00 -0.16 0.00
21 Vidyut Steels Limited 1985-86 NA 0.88 0.00 -1.55 0.00 -0.40 0.00 0.00 -0.40 0.00
SERVICE
22
Andhra Pradesh Essential Commodities Corporation Limited
2012-13 2015-16 1.13 0.00 9.49 0.00 -0.03 0.00 10.62 0.00 -0.027 0
Grand Total B 74.84 184.53 -402.59 13.13 -90.92 0.00 121.54 -90.89 8
TOTAL A+B 145.23 240.58 -636.25 60.73 -137.81 1.01 15.94 -95.05 264
Report No. 6. of 2016 (Public Sector Undertakings)
90
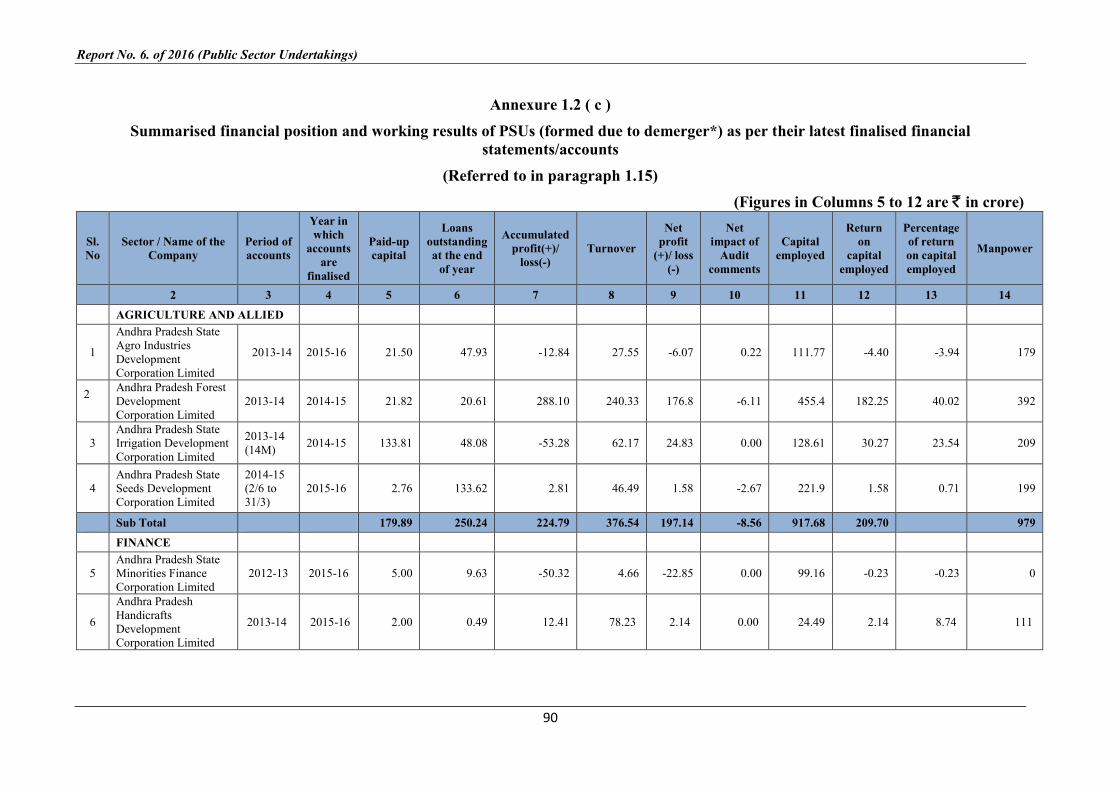
Annexure 1.2 ( c )
Summarised financial position and working results of PSUs (formed due to demerger*) as per their latest finalised financial statements/accounts
(Referred to in paragraph 1.15)
(Figures in Columns 5 to 12 are ` in crore)
Sl. No
Sector / Name of the Company
Period of accounts
Year in which
accounts are
finalised
Paid-up capital
Loans outstanding at the end
of year
Accumulated profit(+)/
loss(-) Turnover
Net profit
(+)/ loss (-)
Net impact of
Audit comments
Capital employed
Return on
capital employed
Percentage of return on capital employed
Manpower
2 3 4 5 6 7 8 9 10 11 12 13 14
AGRICULTURE AND ALLIED
1
Andhra Pradesh State Agro Industries Development Corporation Limited
2013-14 2015-16 21.50 47.93 -12.84 27.55 -6.07 0.22 111.77 -4.40 -3.94 179
2
Andhra Pradesh Forest Development Corporation Limited
2013-14 2014-15 21.82 20.61 288.10 240.33 176.8 -6.11 455.4 182.25 40.02 392
3 Andhra Pradesh State Irrigation Development Corporation Limited
2013-14 (14M)
2014-15 133.81 48.08 -53.28 62.17 24.83 0.00 128.61 30.27 23.54 209
4 Andhra Pradesh State Seeds Development Corporation Limited
2014-15 (2/6 to 31/3)
2015-16 2.76 133.62 2.81 46.49 1.58 -2.67 221.9 1.58 0.71 199
Sub Total
179.89 250.24 224.79 376.54 197.14 -8.56 917.68 209.70
979
FINANCE
5 Andhra Pradesh State Minorities Finance Corporation Limited
2012-13 2015-16 5.00 9.63 -50.32 4.66 -22.85 0.00 99.16 -0.23 -0.23 0
6
Andhra Pradesh Handicrafts Development Corporation Limited
2013-14 2015-16 2.00 0.49 12.41 78.23 2.14 0.00 24.49 2.14 8.74 111
Annexures
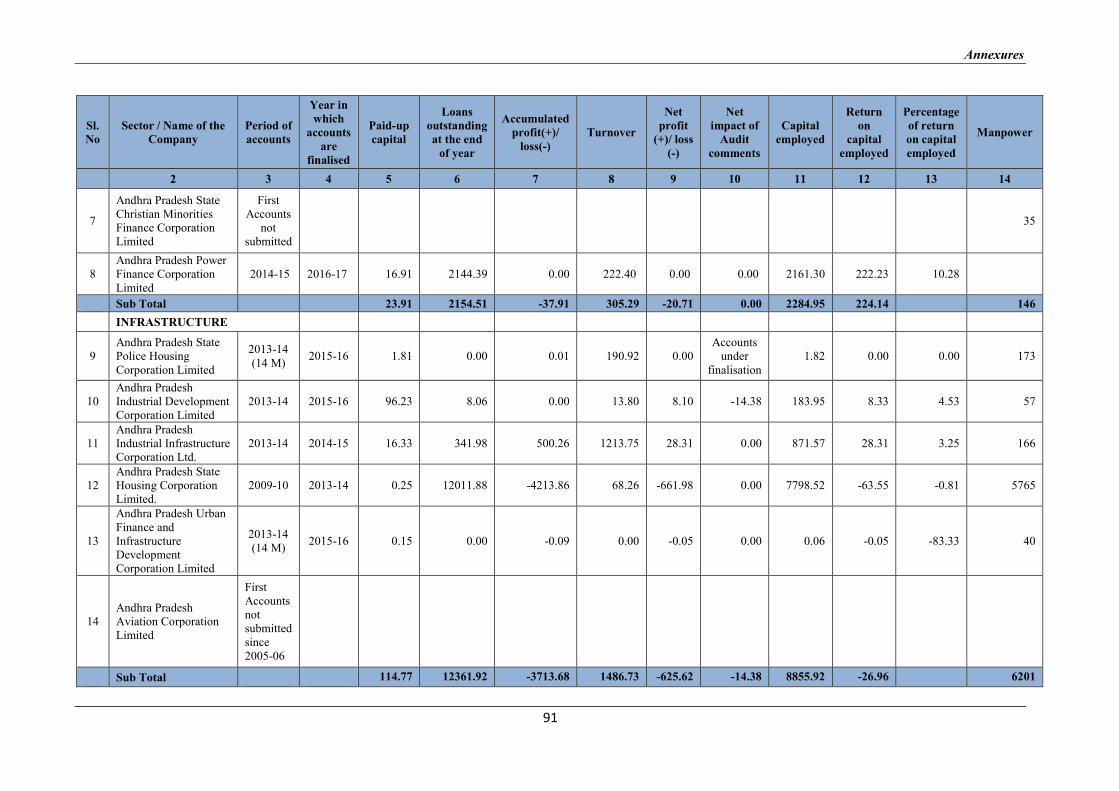
91
Sl. No
Sector / Name of the Company
Period of accounts
Year in which
accounts are
finalised
Paid-up capital
Loans outstanding at the end
of year
Accumulated profit(+)/
loss(-) Turnover
Net profit
(+)/ loss (-)
Net impact of
Audit comments
Capital employed
Return on
capital employed
Percentage of return on capital employed
Manpower
2 3 4 5 6 7 8 9 10 11 12 13 14
7
Andhra Pradesh State Christian Minorities Finance Corporation Limited
First Accounts
not submitted
35
8 Andhra Pradesh Power Finance Corporation Limited
2014-15 2016-17 16.91 2144.39 0.00 222.40 0.00 0.00 2161.30 222.23 10.28
Sub Total 23.91 2154.51 -37.91 305.29 -20.71 0.00 2284.95 224.14 146
INFRASTRUCTURE
9 Andhra Pradesh State Police Housing Corporation Limited
2013-14 (14 M)
2015-16 1.81 0.00 0.01 190.92 0.00 Accounts
under finalisation
1.82 0.00 0.00 173
10 Andhra Pradesh Industrial Development Corporation Limited
2013-14 2015-16 96.23 8.06 0.00 13.80 8.10 -14.38 183.95 8.33 4.53 57
11 Andhra Pradesh Industrial Infrastructure Corporation Ltd.
2013-14 2014-15 16.33 341.98 500.26 1213.75 28.31 0.00 871.57 28.31 3.25 166
12 Andhra Pradesh State Housing Corporation Limited.
2009-10 2013-14 0.25 12011.88 -4213.86 68.26 -661.98 0.00 7798.52 -63.55 -0.81 5765
13
Andhra Pradesh Urban Finance and Infrastructure Development Corporation Limited
2013-14 (14 M)
2015-16 0.15 0.00 -0.09 0.00 -0.05 0.00 0.06 -0.05 -83.33 40
14 Andhra Pradesh Aviation Corporation Limited
First Accounts not submitted since 2005-06
Sub Total
114.77 12361.92 -3713.68 1486.73 -625.62 -14.38 8855.92 -26.96 6201
Report No. 6. of 2016 (Public Sector Undertakings)
92
Sl. No
Sector / Name of the Company
Period of accounts
Year in which
accounts are
finalised
Paid-up capital
Loans outstanding at the end
of year
Accumulated profit(+)/
loss(-) Turnover
Net profit
(+)/ loss (-)
Net impact of
Audit comments
Capital employed
Return on
capital employed
Percentage of return on capital employed
Manpower
2 3 4 5 6 7 8 9 10 11 12 13 14
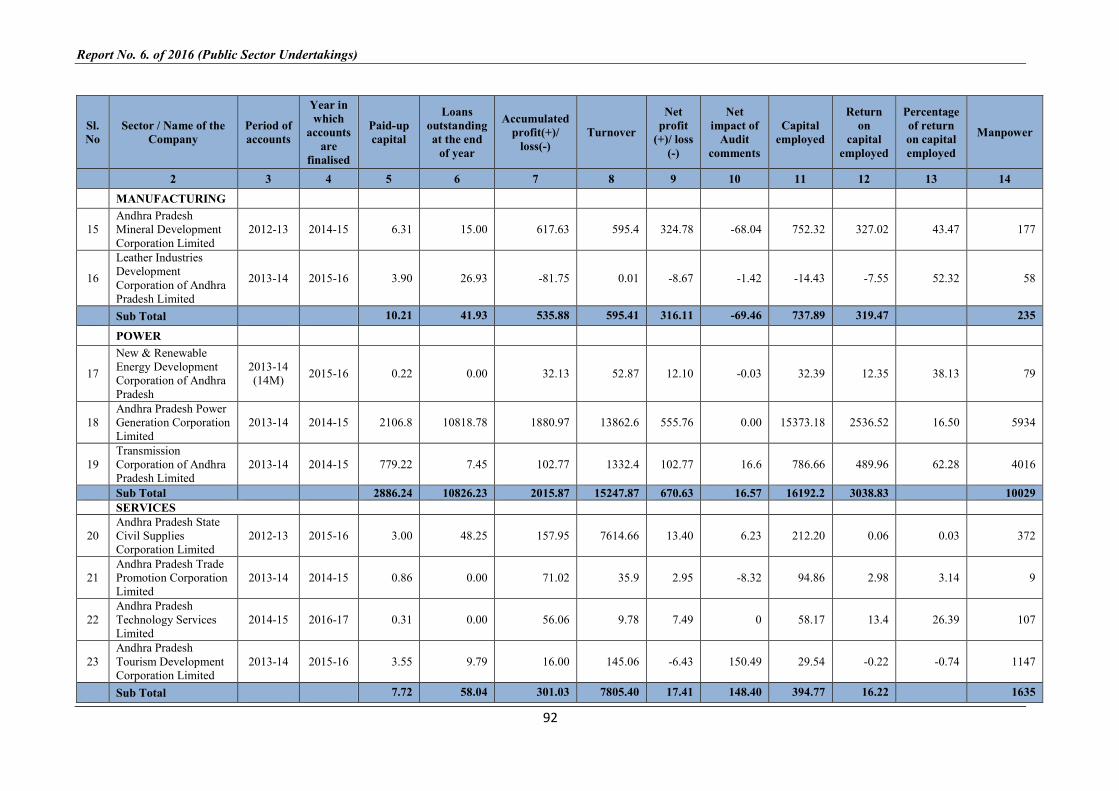
MANUFACTURING
15 Andhra Pradesh Mineral Development Corporation Limited
2012-13 2014-15 6.31 15.00 617.63 595.4 324.78 -68.04 752.32 327.02 43.47 177
16
Leather Industries Development Corporation of Andhra Pradesh Limited
2013-14 2015-16 3.90 26.93 -81.75 0.01 -8.67 -1.42 -14.43 -7.55 52.32 58
Sub Total
10.21 41.93 535.88 595.41 316.11 -69.46 737.89 319.47 235
POWER
17
New & Renewable Energy Development Corporation of Andhra Pradesh
2013-14 (14M)
2015-16 0.22 0.00 32.13 52.87 12.10 -0.03 32.39 12.35 38.13 79
18 Andhra Pradesh Power Generation Corporation Limited
2013-14 2014-15 2106.8 10818.78 1880.97 13862.6 555.76 0.00 15373.18 2536.52 16.50 5934
19 Transmission Corporation of Andhra Pradesh Limited
2013-14 2014-15 779.22 7.45 102.77 1332.4 102.77 16.6 786.66 489.96 62.28 4016
Sub Total
2886.24 10826.23 2015.87 15247.87 670.63 16.57 16192.2 3038.83 10029
SERVICES
20 Andhra Pradesh State Civil Supplies Corporation Limited
2012-13 2015-16 3.00 48.25 157.95 7614.66 13.40 6.23 212.20 0.06 0.03 372
21 Andhra Pradesh Trade Promotion Corporation Limited
2013-14 2014-15 0.86 0.00 71.02 35.9 2.95 -8.32 94.86 2.98 3.14 9
22 Andhra Pradesh Technology Services Limited
2014-15 2016-17 0.31 0.00 56.06 9.78 7.49 0 58.17 13.4 26.39 107
23 Andhra Pradesh Tourism Development Corporation Limited
2013-14 2015-16 3.55 9.79 16.00 145.06 -6.43 150.49 29.54 -0.22 -0.74 1147
Sub Total
7.72 58.04 301.03 7805.40 17.41 148.40 394.77 16.22 1635
Annexures
93
Sl. No
Sector / Name of the Company
Period of accounts
Year in which
accounts are
finalised
Paid-up capital
Loans outstanding at the end
of year
Accumulated profit(+)/
loss(-) Turnover
Net profit
(+)/ loss (-)
Net impact of
Audit comments
Capital employed
Return on
capital employed
Percentage of return on capital employed
Manpower
2 3 4 5 6 7 8 9 10 11 12 13 14
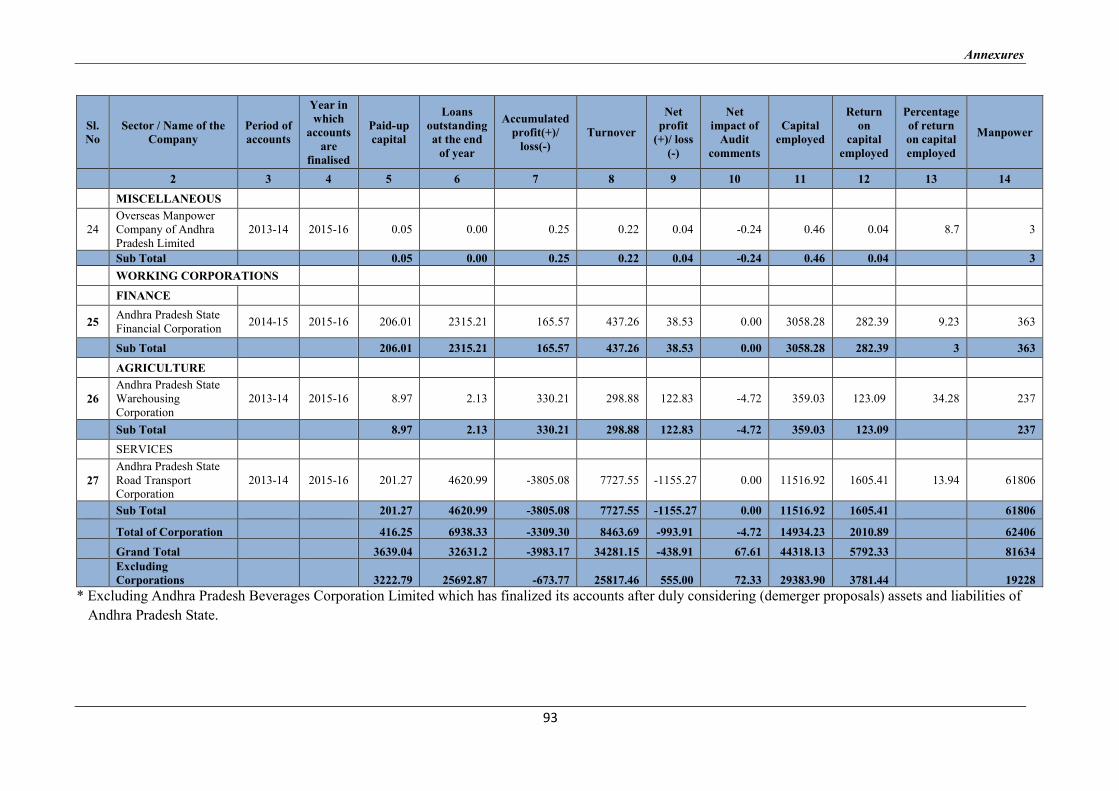
MISCELLANEOUS
24 Overseas Manpower Company of Andhra Pradesh Limited
2013-14 2015-16 0.05 0.00 0.25 0.22 0.04 -0.24 0.46 0.04 8.7 3
Sub Total
0.05 0.00 0.25 0.22 0.04 -0.24 0.46 0.04
3
WORKING CORPORATIONS
FINANCE
25 Andhra Pradesh State Financial Corporation
2014-15 2015-16 206.01 2315.21 165.57 437.26 38.53 0.00 3058.28 282.39 9.23 363
Sub Total
206.01 2315.21 165.57 437.26 38.53 0.00 3058.28 282.39 3 363
AGRICULTURE
26 Andhra Pradesh State Warehousing Corporation
2013-14 2015-16 8.97 2.13 330.21 298.88 122.83 -4.72 359.03 123.09 34.28 237
Sub Total 8.97 2.13 330.21 298.88 122.83 -4.72 359.03 123.09
237
SERVICES
27 Andhra Pradesh State Road Transport Corporation
2013-14 2015-16 201.27 4620.99 -3805.08 7727.55 -1155.27 0.00 11516.92 1605.41 13.94 61806
Sub Total
201.27 4620.99 -3805.08 7727.55 -1155.27 0.00 11516.92 1605.41
61806
Total of Corporation 416.25 6938.33 -3309.30 8463.69 -993.91 -4.72 14934.23 2010.89 62406
Grand Total 3639.04 32631.2 -3983.17 34281.15 -438.91 67.61 44318.13 5792.33 81634
Excluding Corporations 3222.79 25692.87 -673.77 25817.46 555.00 72.33 29383.90 3781.44 19228
* Excluding Andhra Pradesh Beverages Corporation Limited which has finalized its accounts after duly considering (demerger proposals) assets and liabilities of
Andhra Pradesh State.
Report No. 6. of 2016 (Public Sector Undertakings)
94
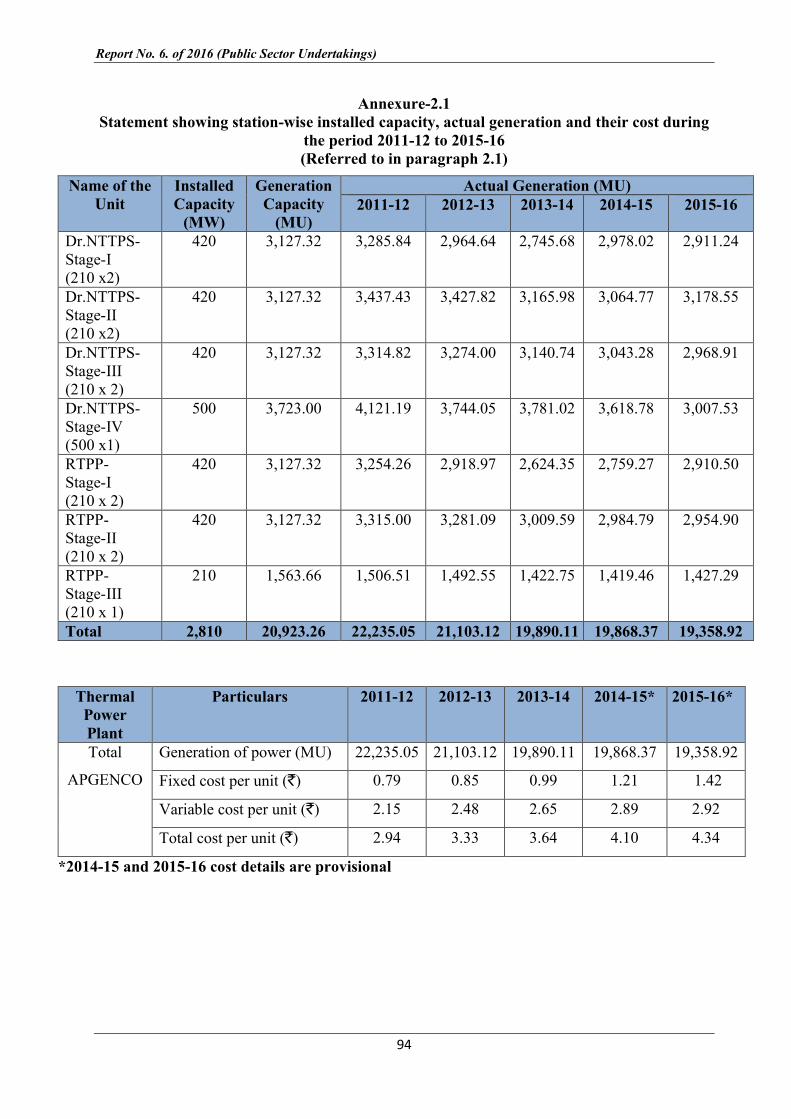
Annexure-2.1 Statement showing station-wise installed capacity, actual generation and their cost during
the period 2011-12 to 2015-16 (Referred to in paragraph 2.1)
Name of the Unit
Installed Capacity
(MW)
Generation Capacity
(MU)
Actual Generation (MU) 2011-12 2012-13 2013-14 2014-15 2015-16
Dr.NTTPS- Stage-I (210 x2)
420 3,127.32 3,285.84 2,964.64 2,745.68 2,978.02 2,911.24
Dr.NTTPS- Stage-II (210 x2)
420 3,127.32 3,437.43 3,427.82 3,165.98 3,064.77 3,178.55
Dr.NTTPS- Stage-III (210 x 2)
420 3,127.32 3,314.82 3,274.00 3,140.74 3,043.28 2,968.91
Dr.NTTPS-Stage-IV (500 x1)
500 3,723.00 4,121.19 3,744.05 3,781.02 3,618.78 3,007.53
RTPP- Stage-I (210 x 2)
420 3,127.32 3,254.26 2,918.97 2,624.35 2,759.27 2,910.50
RTPP- Stage-II (210 x 2)
420 3,127.32 3,315.00 3,281.09 3,009.59 2,984.79 2,954.90
RTPP- Stage-III (210 x 1)
210 1,563.66 1,506.51 1,492.55 1,422.75 1,419.46 1,427.29
Total 2,810 20,923.26 22,235.05 21,103.12 19,890.11 19,868.37 19,358.92
Thermal Power Plant
Particulars 2011-12 2012-13 2013-14 2014-15* 2015-16*
Total
APGENCO
Generation of power (MU) 22,235.05 21,103.12 19,890.11 19,868.37 19,358.92
Fixed cost per unit (`) 0.79 0.85 0.99 1.21 1.42
Variable cost per unit (`) 2.15 2.48 2.65 2.89 2.92
Total cost per unit (`) 2.94 3.33 3.64 4.10 4.34
*2014-15 and 2015-16 cost details are provisional
Annexures
95
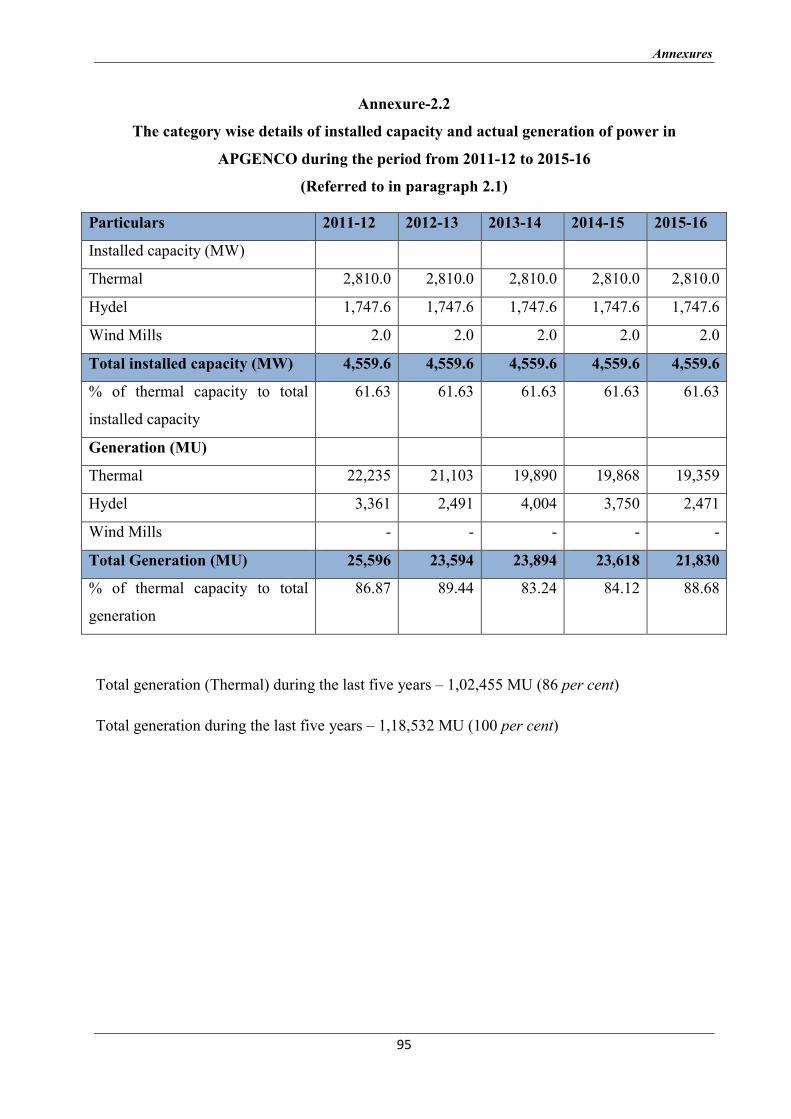
Annexure-2.2
The category wise details of installed capacity and actual generation of power in
APGENCO during the period from 2011-12 to 2015-16
(Referred to in paragraph 2.1)
Particulars 2011-12 2012-13 2013-14 2014-15 2015-16
Installed capacity (MW)
Thermal 2,810.0 2,810.0 2,810.0 2,810.0 2,810.0
Hydel 1,747.6 1,747.6 1,747.6 1,747.6 1,747.6
Wind Mills 2.0 2.0 2.0 2.0 2.0
Total installed capacity (MW) 4,559.6 4,559.6 4,559.6 4,559.6 4,559.6
% of thermal capacity to total
installed capacity
61.63 61.63 61.63 61.63 61.63
Generation (MU)
Thermal 22,235 21,103 19,890 19,868 19,359
Hydel 3,361 2,491 4,004 3,750 2,471
Wind Mills - - - - -
Total Generation (MU) 25,596 23,594 23,894 23,618 21,830
% of thermal capacity to total
generation
86.87 89.44 83.24 84.12 88.68
Total generation (Thermal) during the last five years – 1,02,455 MU (86 per cent)
Total generation during the last five years – 1,18,532 MU (100 per cent)
Report No. 6. of 2016 (Public Sector Undertakings)
96
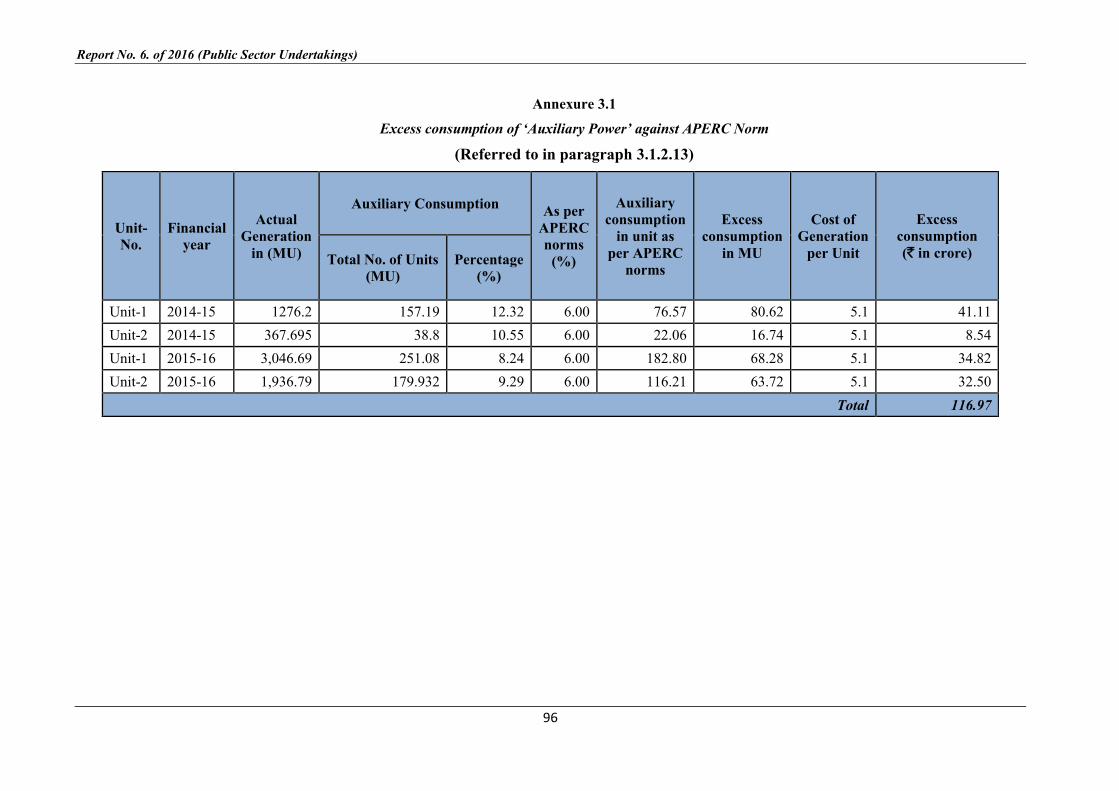
Annexure 3.1
Excess consumption of ‘Auxiliary Power’ against APERC Norm
(Referred to in paragraph 3.1.2.13)
Unit-No.
Financial year
Actual Generation
in (MU)
Auxiliary Consumption As per
APERC norms
(%)
Auxiliary consumption
in unit as per APERC
norms
Excess consumption
in MU
Cost of Generation
per Unit
Excess consumption (` in crore) Total No. of Units
(MU) Percentage
(%)
Unit-1 2014-15 1276.2 157.19 12.32 6.00 76.57 80.62 5.1 41.11
Unit-2 2014-15 367.695 38.8 10.55 6.00 22.06 16.74 5.1 8.54
Unit-1 2015-16 3,046.69 251.08 8.24 6.00 182.80 68.28 5.1 34.82
Unit-2 2015-16 1,936.79 179.932 9.29 6.00 116.21 63.72 5.1 32.50
Total 116.97


![RAIPUR DEVELOPMENT AUTHORITY, RAIPUR [CG.] · PDF fileRAIPUR DEVELOPMENT AUTHORITY, RAIPUR [CG.] ... RAIPUR [CG.] Email: ... Annexure I-List Showing The Name Of Near Relative Working](https://img.dokumen.tips/doc/110x75/5a7a236a7f8b9a4b198d8d34/raipur-development-authority-raipur-cg-development-authority-raipur-cg-.jpg)


![Annexure 1 [Reference Para 1.5] Statement Showing Names of](https://img.dokumen.tips/doc/110x75/61df5eae0b68fa64d71e6348/annexure-1-reference-para-15-statement-showing-names-of-.jpg)
