Embed Size (px)
Citation preview
Animal/Chemical Pits and Glass Holes Remedial Action Closure Report Addendum
September 2005

TABLE OF CONTENTS
LIST OF ACRONYMS ........................................................................................................................................iv
1.0 SITE BACKGROUND ..............................................................................................................................1
2.0 CHEMICAL HOLES WASTE DISPOSAL ........................................................................................1 2.1 LOW LEVEL RADIOACTIVE WASTE.....................................................................................................................2 2.2 MIXED LOW LEVEL RADIOACTIVE WASTE (MLLRW) ......................................................................................3 2.3 NON-HAZARDOUS, NON-RADIOACTIVE WASTE ..................................................................................................4 3.0 POST WASTE DISPOSAL SCOPE – RELEASE OF THE CHEMICAL HOLES AREA FROM RADIOLOGICAL CONTROLS..........................................................................................................4 3.1 INITIAL SAMPLING OF THE CHEMICAL HOLES - POST WASTE DISPOSAL ............................................................4 3.2 INITIAL SAMPLING OF THE CHEMICAL HOLES - RESULTS ...................................................................................5 3.3 SOIL EXCAVATION – POST WASTE DISPOSAL.....................................................................................................5 3.4 FINAL RADIOLOGICAL SURVEY – POST WASTE DISPOSAL .................................................................................6 3.5 FINAL ENDPOINT SURFACE SOIL SAMPLING – POST WASTE DISPOSAL ..............................................................6 4.0 SITE RESTORATION...............................................................................................................................6
5.0 REFERENCES .............................................................................................................................................7
FIGURES 1 Chemical Holes Site Plan 2 Glass Holes Area 3 Animal/Chemical Pits Area
TABLES 1 Cleanup Goals for Radionuclides ....................................................................................4 2 Glass Holes Area Pre-Excavation Soil Sample Results (Located At Back of Report) 3 Western Portion of Animal/Chemical Pits Pre-Excavation Soil Sample Results
(Located At Back of Report) 4 Eastern Portion of Animal/Chemical Pits Pre-Excavation Soil Sample Results
(Located At Back of Report) 5 Glass Holes Area Post-Excavation Soil Sample Results (Located At Back of Report) 6 Western Portion of Animal/Chemical Pits Post-Excavation Soil Sample Results
(Located At Back of Report) 7 Eastern Portion of Animal/Chemical Pits Post-Excavation Soil Sample Results
(Located At Back of Report) APPENDICES
Appendix A: Gamma Walkover Survey Maps of the Glass Holes and Animal/Chemical Pits Appendix B: ER Operations Procedures Manual, 4.18, Gamma Survey of Contaminated Soils
Using the Eberline E-600 Meter and NaI Detector Appendix C: Environmental Monitoring Procedure, EM –SOP-601, Collection of Soil
Samples

LIST OF ACRONYMS BNL Brookhaven National Laboratory EWMSD Environmental and Waste Management Services Division LLRW Low Level Radioactive Waste mg/kg milligram per kilogram MLLRW Mixed Low Level Radioactive Waste OPM Operations Procedure Manual OU Operable Unit pCi/g pico curie per gram QA/QC Quality Assurance/Quality Control ROD Record of Decision SPSS Sulfur Polymer Stabilization/Solidification

1
1.0 SITE BACKGROUND
The Animal/Chemical Pits and Glass Holes (collectively identified herein as the “Chemical Holes”) were excavated in 1997 under Remedial Action VI. A Closure Report was issued for the Remedial Action and submitted to the Unite States Department of Energy, the United States Environmental Protection Agency, and the New York State Department of Environmental Conservation. All cleanup goals for the remedial action were met. Excavation of the Chemical Holes is documented in the Animal/Chemical Pits and Glass Holes Remedial Action Closure Report (BNL, 1997). Figure 1 is a site plan illustrating the location of the Chemical Holes Area.
The purpose of this Closure Report Addendum is to:
• Document the waste disposal activities resulting from the excavation of the Chemical Holes in 1997;
• Document the additional excavation activities performed in 2005 to meet the cleanup objectives identified in the Operable Unit (OU) I Record of Decision (ROD) after the waste disposal activities were completed; and
• Document the restoration of the Chemical Holes area and the existing site conditions.
It should be noted that during 2004/2005, the western part of the Animal/Chemical Pits was used as a sediment staging area and drying bed lay down for the OU V Peconic River Project. The Animal/Chemical Pits area was utilized for this purpose due to similarity in the contaminants of concern (i.e., mercury).
2.0 CHEMICAL HOLES WASTE DISPOSAL
Wastes generated during the Chemical Holes removal action were characterized and disposed of between 1997 and 2005. Various waste streams were generated as a result of the removal action. Wastes generated included:
• Low level radioactive waste (LLRW) o Soil o Debris o Biological o Liquid o Cylinders
• Mixed low level radioactive waste (MLLRW) - primarily mercury
o Soil o Debris o Biological o Liquid o Chemical Solids

2
• Non-hazardous, Non-radioactive waste o Soil o Debris
BNL’s Environmental and Waste Management Services Division (EWMSD) documented all disposal activities. All records concerning the disposition of wastes are contained in the EWMSD waste database.
2.1 Low Level Radioactive Waste
Soil Approximately 10,000 cubic yards (yd3) of LLRW soil were generated during the 1997 Chemical Holes excavation. Soil was transported to Envirocare of Utah for disposal as LLRW. In addition, as described in Section 3.3, approximately 1,500 yd3 of soil were excavated from the eastern portion of the Animal/Chemical Pits in 2005, following disposal of the wastes excavated in 1997, and shipped via rail to Envirocare of Utah for disposal as low-level radioactive waste. Debris Approximately 1,500 yd3 of debris were generated during the 1997 Chemical Holes excavation. Debris consisted primarily of metal, wood, plastic and glass. Debris was transported to Envirocare of Utah for disposal as LLRW. Biological Approximately 2,700 pounds (lbs) of biological waste (animal carcasses) were generated during the 1997 excavation activities. Duratek Federal Services incinerated radiological wastes at their facility in Oak Ridge, TN. The ash generated from the incineration was transported to Envirocare of Utah for disposal as LLRW. Cylinders Approximately 320 intact cylinders were recovered from the 1997 excavation of the Chemical Holes. The valves on the cylinders were removed and the contents of the cylinders were sampled by Integrated Environmental Services. Approximately 300 of the cylinders were either empty of any gas or contained inert gases such as argon. The empty cylinders were either released to the Brookhaven National Laboratory (BNL) suspect metal scrap yard by BNL Radiological Control Division personnel or transported to Envirocare of Utah for disposal as LLRW. Integrated Environmental Services treated the remaining (approximately 20) cylinders containing hazardous or radioactive gas and the empty cylinders transported to Envirocare for disposal.

3
2.2 Mixed Low Level Radioactive Waste (MLLRW) Soil Approximately 5 yd3 of soil from the 1997 Chemical Holes excavation was treated for disposal as a MLLRW due to its mercury content. Soil was treated by one of two methods; sulfur polymer stabilization/solidification (SPSS) or retort. Treated soil was then transported to Envirocare of Utah for disposal as a MLLRW. Debris Approximately 2 yd3 of mercury contaminated debris from the 1997 Chemical Holes excavation was transported to Envirocare of Utah for treatment and disposal. The debris underwent macro-encapsulation and was then disposed of a MLLRW. Biological Approximately 100 lbs of biological waste from the 1997 Chemical Holes excavation was treated for mercury contamination using retort treatment conducted by Sepradyne, Inc. Residual ash was stabilized and transported for disposal as LLRW at Envirocare of Utah. Collected elemental mercury was stabilized using SPSS technology and transported to Envirocare of Utah for disposal as a MLLRW. Liquids Intact recovered liquids from the 1997 Chemical Holes excavation were characterized and bulked by compatibility. Bulked liquid waste was transported to off-site treatment vendors for solidification (Permafix or Waste Control Specialists). Solidified liquid wastes were then transported to Envirocare of Utah for disposal as MLLRW. A total of approximately 150 gallons of MLLRW liquids were treated and disposed of at Envirocare of Utah. Chemical Solids Intact recovered chemical solids from the 1997 Chemical Holes excavation were characterized and bulked by compatibility. Bulked solid waste was transported to off-site treatment vendors for solidification (Permafix or Waste Control Specialists). Chemical solid wastes were then transported to Envirocare of Utah for disposal as MLLRW. A total of approximately 1 yd3 of MLLRW solids were treated and disposed of at Envirocare of Utah. Elemental Mercury Approximately 200 lbs of elemental mercury were stabilized at BNL using SPSS technology. The solidified mercury was transported to Envirocare of Utah for disposal as MLLRW.

4
2.3 Non-hazardous, Non-radioactive Waste Soil Approximately 2,500 yd3 of soil from the 1997 excavation was transported for disposal at GROWS Landfill, a Subtitle D Facility. In addition, as described in Section 3.3, approximately 2,300 yd3 of soil were excavated from the Glass Holes and the western portion of the Animal/Chemical Pits in 2005, following disposal of the wastes excavated in 1997, and shipped via rail to the Niagara Falls Landfall Facility for disposal as non-hazardous waste.
3.0 POST WASTE DISPOSAL SCOPE – RELEASE OF THE CHEMICAL HOLES AREA FROM RADIOLOGICAL CONTROLS
Following waste disposal of the LLRW and MLLRW from the Chemical Holes excavation and the sediments from the Peconic River project, several rounds of detailed sampling and excavation of soils were performed within the Chemical Holes project area to remove residual radioactivity and mercury remaining in the surface soils, and release the area from radiological controls. The sampling and excavation activities are detailed in the following subsections. The radiological walkover surveys and surface soil sampling were performed to ensure that the areas met the OU I cleanup goals. The cleanup goals, as identified in the OU I ROD for the Chemical Holes, include 1.84 mg/kg for mercury, and individual radionuclides, as listed on Table 1:
TABLE 1
Cleanup Goals for Radionuclides Radionuclide
Remediation Goal2
(pCi/g) Cs-137
23
Sr-90
15
Ra-226
5
3.1 Initial Sampling of the Chemical Holes - Post Waste Disposal To determine the extent of the residual contamination left from the waste disposal activities and the Peconic River project, both the Glass Holes and the Animal/Chemical Pits areas were marked in a 60-foot by 60-foot grid system for sampling (Figures 2 and 3). Sampling was performed in accordance with the “Work Plan for the Release of the Chemical Holes Area from Radiological

5
Controls”, October 2003. Surface soil samples were collected at a frequency of one sample per grid and analyzed for total mercury analysis to identify areas that did not meet the cleanup goals. In the eastern portion of the Animal/Chemical Pits, samples were also collected at a frequency of one sample per grid and analyzed for radiological analyses. Prior to radiological sampling at the Glass Holes and the western portion of the Animal/Chemical Pits, two 6-inch lifts were removed from the areas and a full radiological walkover survey was performed. Results from the walkover surveys are included in Appendix A. Based on the results of the walkover survey the frequency of radiological sampling was limited to a minimum of one sample for every three grids.
3.2 Initial Sampling of the Chemical Holes - Results Glass Holes and Western Animal/Chemical Pits Based on the sampling discussed in Section 3.1, grids in the Glass Holes and the western portion of the Animal/Chemical Pits were determined to exceed the cleanup goals only for mercury, but satisfied the requirements for radionuclides. Results are included as Table 2 (Glass Holes Area Results), and Table 3 (Western Portion of the Animal/Chemical Pits Results). The areas described above were used for drying the Peconic River sediment and the analytical data of the soil fell within the total volume and characteristics of waste authorized for release to the Niagara Falls Landfill. The document entitled "Technical Basis for the Derivation of Authorized Limits for Peconic River Soils and Sediments from Brookhaven National Laboratory", April 2004, was amended to include the Chemical Holes soil ("Addendum to the Technical Basis for the Derivation of Authorized Limits for Peconic River Soils and Sediments from Brookhaven National Laboratory for the Addition of Chemical Holes Area Soils", February, 2005). The soil was subjected to the same level of confirmatory sampling as the Peconic River sediment and all of the samples were within the Authorized Release Limits. At the conclusion of the shipments to the Niagara Falls Landfill, a final analysis of the volume and total curie content of the waste was performed to verify that the criteria established in the Authorized Release were not exceeded. Eastern Animal/Chemical Pits The grids in the eastern portion of the Animal/Chemical Pits exceeded the cleanup goals for both mercury and cesium-137. Results are included as Table 4 (Eastern Portion of the Animal/Chemical Pits Results).
3.3 Soil Excavation – Post Waste Disposal Glass Holes and Western Animal/Chemical Pits Soil in the grids that exceeded the cleanup goal for mercury in the Glass Holes and the western portion of the Animal/Chemical Pits was excavated to a depth of approximately six inches. After the excavation, surface soil samples were collected to determine if additional excavation was

6
required. In several grids additional soil was excavated to meet the cleanup goal for mercury. This additional excavation resulted in 2,300 yd3 of non-hazardous, non-radioactive waste soil (as described in Section 2.3). Eastern Animal/Chemical Pits Soil in the grids that exceeded the cleanup goal for mercury and radionuclides in the eastern portion of the Animal/Chemical Pits was excavated to a depth of approximately six inches. After the excavation, surface soil samples were collected to determine if the cleanup goals were met. In several grids additional soil was excavated until all samples met the cleanup goals for both radionuclides and mercury. This additional excavation resulted in 1,500 yd3 of LLRW soil (as described in Section 2.1).
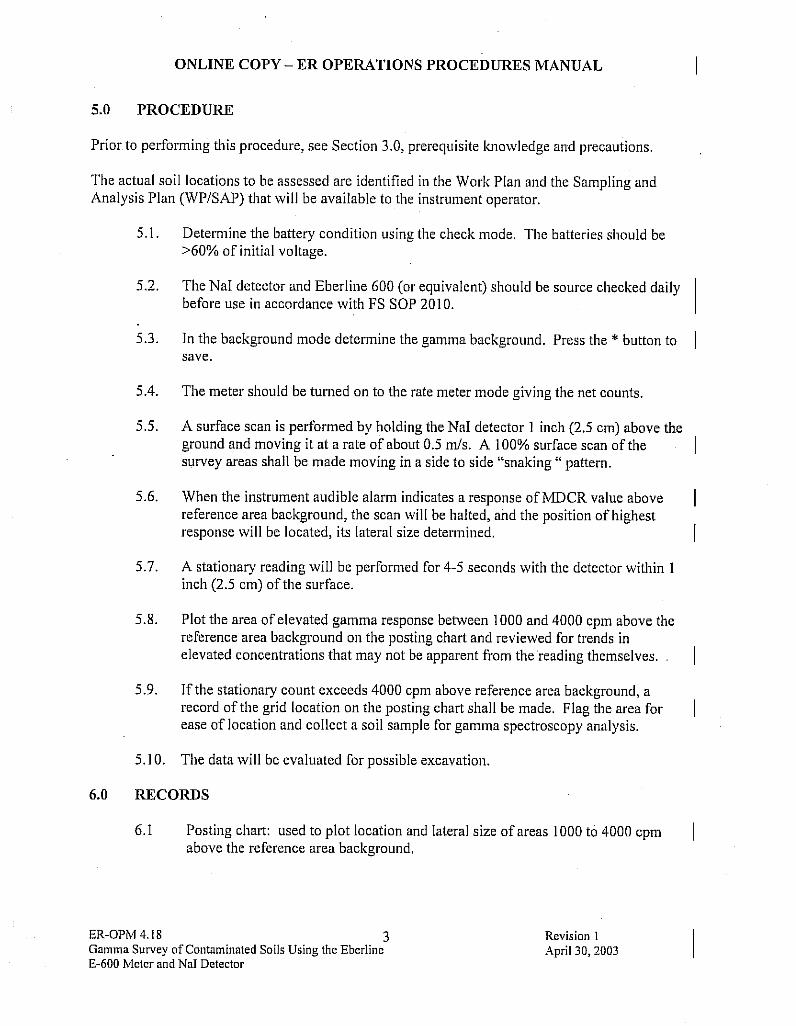
3.4 Final Radiological Survey – Post Waste Disposal After all excavation was completed, final radiological walkover surveys were performed as described in OPM procedure 4.18 “Gamma Survey of Contaminated Soils Using The Eberline E-600 Meter and NaI Detector”. The final radiological surveys are included as Appendix A.
3.5 Final Endpoint Surface Soil Sampling – Post Waste Disposal Endpoint surface soil samples were collected after the final excavation was completed based on a 60-foot by 60-foot grid system (one sample for every 3600 ft2). The grids are identified on Figures 2 and 3. Samples were collected in accordance with EM-SOP-601 “Collection of Soil Samples, Rev. 1”. Severn Trent Laboratory Laboratory analyzed all endpoint samples. Endpoint samples in the Glass Holes and western Animal/Chemical Pits were analyzed for total mercury. Endpoint sample results for the Glass Holes area are included as Table 5. Endpoint sample results for the western Animal/Chemical Pits are included as Table 6. Endpoint samples from the eastern Animal/Chemical Pits were analyzed for total mercury, gross alpha, gross beta, strontium-90, and gamma spectroscopy. Endpoint sample results for the eastern portion of the Animal/Chemical Pits are included as Table 7. Quality assurance/quality control (QA/QC) samples were collected in accordance with the “Work Plan for Release of the Chemical Holes Area from Radiological Control”, October 2003.
4.0 SITE RESTORATION Following the release of the Chemical Holes from radiological control, the areas were graded and seeded with native grass. All equipment and materials were demobilized from the site. The railcar loading dock remains intact.

7
5.0 REFERENCES Brookhaven National Laboratory (BNL), Environmental Restoration, Operable Unit I Record of Decision, August 1999. BNL, “Technical Basis for the Derivation of Authorized Limits for Peconic River Soils and Sediments from Brookhaven National Laboratory”, April 28, 2004 BNL, “Addendum to the Technical Basis for the Derivation of Authorized Limits for Peconic River Soils and Sediments from Brookhaven National Laboratory for the Addition of Chemical Holes Area Soils”, February 15, 2005 BNL, Work Plan for Release of the Chemical Holes Area from Radiological Control, October 2003 BNL, Environmental Restoration, Animal/Chemical Pits and Glass Holes Remedial Action Closure Report October 1997. BNL, Environmental Restoration, Waste Characterization Report for the Animal/Chemical Pits and Glass Holes Remedial July 2001. BNL, Radiological Controls Division, Instrumentation and Calibration Training and Qualifications Plan or Agreement, http://intranet.bnl.gov/rcd/ic/Quality Assurance/TQ/training.pdf, dated May 2000. BNL, Radiological Control Manual, https://sbms.bnl.gov/program/pd01/pd01t011.htm, as amended.

FIGURES


TABLES

Table 2Pre-Excavation
Glass Holes Area Sample Results
Compound A1-CH A2-CH A3-CH A4-CH A5-CH A6-CH A7-CH B2-CH B3-CH
Mercury 8.8 10.7 9.5 6.8 12.6 26.7 2.7 2.2 6.2Americium-241 U 0.34 0.47 NS NS NS NS NS 0.184Actinium-228 U U U NS NS NS NS NS UBeryllium-7 U U U NS NS NS NS NS UCesium-134 U U U NS NS NS NS NS UCesium-137 0.129 0.105 0.14 NS NS NS NS NS 0.135Cobalt-57 U U U NS NS NS NS NS UCobalt-60 U U U NS NS NS NS NS UEuropium-152 U U U NS NS NS NS NS UEuropium-154 U U U NS NS NS NS NS UEuropium-155 U U U NS NS NS NS NS ULead-212 U U U NS NS NS NS NS ULead-214 U U U NS NS NS NS NS UManganese-54 U U U NS NS NS NS NS UPotassium-40 5.4 5.3 6 NS NS NS NS NS 5Radium-226 U 1.77 U NS NS NS NS NS USodium-22 U U U NS NS NS NS NS UThorium-228 0.34 0.5 0.48 NS NS NS NS NS 0.45Thorium-230 U U U NS NS NS NS NS UThorium-232 0.38 0.73 0.57 NS NS NS NS NS 0.79Thorium-234 U U U NS NS NS NS NS 0.87Uranium-234 0.22 0.39 0.34 NS NS NS NS NS 0.38Uranium-235 U U U NS NS NS NS NS UUranium-238 U U U NS NS NS NS NS 0.87Zinc-65 U U U NS NS NS NS NS UStrontium-90 0.6 U U NS NS NS NS NS UGross Alpha 23 40.3 28.8 NS NS NS NS NS 31.5Gross Beta 19.8 19.2 17.2 NS NS NS NS NS 30.1
Notes:U = Not detectedNS = Not sampledMercury results in mg/kgRadionuclide results in pCi/g
Page 1 of 5

Table 2Pre-Excavation
Glass Holes Area Sample Results
Compound
MercuryAmericium-241Actinium-228Beryllium-7Cesium-134Cesium-137Cobalt-57Cobalt-60Europium-152Europium-154Europium-155Lead-212Lead-214Manganese-54Potassium-40Radium-226Sodium-22Thorium-228Thorium-230Thorium-232Thorium-234Uranium-234Uranium-235Uranium-238Zinc-65Strontium-90Gross AlphaGross Beta
Notes:U = Not detectedNS = Not sampledMercury results in mg/kgRadionuclide results in pCi/g
B4-CH B5-CH B6-CH B7-CH B8-CH C3-CH C4-CH C5-CH
5.1 4.9 0.34 NS NS 5.3 5.6 5.5NS NS U NS NS NS NS NSNS NS U NS NS NS NS NSNS NS U NS NS NS NS NSNS NS U NS NS NS NS NSNS NS U NS NS NS NS NSNS NS U NS NS NS NS NSNS NS U NS NS NS NS NSNS NS U NS NS NS NS NSNS NS U NS NS NS NS NSNS NS U NS NS NS NS NSNS NS 0.61 NS NS NS NS NSNS NS U NS NS NS NS NSNS NS U NS NS NS NS NSNS NS 5.9 NS NS NS NS NSNS NS 1.26 NS NS NS NS NSNS NS U NS NS NS NS NSNS NS 0.61 NS NS NS NS NSNS NS U NS NS NS NS NSNS NS 0.46 NS NS NS NS NSNS NS U NS NS NS NS NSNS NS 0.49 NS NS NS NS NSNS NS U NS NS NS NS NSNS NS U NS NS NS NS NSNS NS U NS NS NS NS NSNS NS U NS NS NS NS NSNS NS 25.6 NS NS NS NS NSNS NS 13.6 NS NS NS NS NS
Page 2 of 5

Table 2Pre-Excavation
Glass Holes Area Sample Results
Compound
MercuryAmericium-241Actinium-228Beryllium-7Cesium-134Cesium-137Cobalt-57Cobalt-60Europium-152Europium-154Europium-155Lead-212Lead-214Manganese-54Potassium-40Radium-226Sodium-22Thorium-228Thorium-230Thorium-232Thorium-234Uranium-234Uranium-235Uranium-238Zinc-65Strontium-90Gross AlphaGross Beta
Notes:U = Not detectedNS = Not sampledMercury results in mg/kgRadionuclide results in pCi/g
C6-CH C7-CH C8-CH C9-CH D4-CH D5-CH D6-CH D7-CH D8-CH
2.2 NS NS 0.069 0.67 5.7 0.94 0.41 26.8NS NS NS NS NS U NS NS 0.172NS NS NS NS NS U NS NS UNS NS NS NS NS U NS NS UNS NS NS NS NS U NS NS UNS NS NS NS NS 0.123 NS NS 0.089NS NS NS NS NS U NS NS UNS NS NS NS NS U NS NS UNS NS NS NS NS U NS NS UNS NS NS NS NS U NS NS UNS NS NS NS NS U NS NS UNS NS NS NS NS U NS NS UNS NS NS NS NS U NS NS UNS NS NS NS NS U NS NS UNS NS NS NS NS 4.6 NS NS 3.83NS NS NS NS NS 1.32 NS NS UNS NS NS NS NS U NS NS UNS NS NS NS NS 0.51 NS NS 0.406NS NS NS NS NS U NS NS UNS NS NS NS NS 0.69 NS NS 0.62NS NS NS NS NS U NS NS UNS NS NS NS NS 0.45 NS NS 0.255NS NS NS NS NS U NS NS UNS NS NS NS NS U NS NS UNS NS NS NS NS U NS NS UNS NS NS NS NS U NS NS UNS NS NS NS NS 28.7 NS NS 51NS NS NS NS NS 21.1 NS NS 17.6
Page 3 of 5

Table 2Pre-Excavation
Glass Holes Area Sample Results
Compound
MercuryAmericium-241Actinium-228Beryllium-7Cesium-134Cesium-137Cobalt-57Cobalt-60Europium-152Europium-154Europium-155Lead-212Lead-214Manganese-54Potassium-40Radium-226Sodium-22Thorium-228Thorium-230Thorium-232Thorium-234Uranium-234Uranium-235Uranium-238Zinc-65Strontium-90Gross AlphaGross Beta
Notes:U = Not detectedNS = Not sampledMercury results in mg/kgRadionuclide results in pCi/g
D9-CH E5-CH E6-CH E7-CH E8-CH E9-CH E10-CH F1-CH
0.13 0.021 3.1 5.9 0.17 NS NS 23.4NS NS U 0.23 NS NS NS 0.57NS NS U U NS NS NS UNS NS U U NS NS NS UNS NS U U NS NS NS UNS NS 0.101 U NS NS NS 2.55NS NS U U NS NS NS UNS NS U U NS NS NS UNS NS U U NS NS NS UNS NS U U NS NS NS UNS NS U U NS NS NS UNS NS 0.51 U NS NS NS UNS NS 0.46 U NS NS NS UNS NS U U NS NS NS UNS NS 5.1 4.3 NS NS NS 5.6NS NS U U NS NS NS 2.22NS NS U U NS NS NS UNS NS 0.51 0.48 NS NS NS 0.54NS NS U U NS NS NS UNS NS 0.5 0.77 NS NS NS 0.5NS NS U U NS NS NS UNS NS 0.46 0.43 NS NS NS 0.42NS NS U U NS NS NS UNS NS U U NS NS NS UNS NS U U NS NS NS UNS NS U U NS NS NS 3NS NS 22.1 32.8 NS NS NS 31.9NS NS 19.7 20.9 NS NS NS 36.7
Page 4 of 5

Table 2Pre-Excavation
Glass Holes Area Sample Results
Compound
MercuryAmericium-241Actinium-228Beryllium-7Cesium-134Cesium-137Cobalt-57Cobalt-60Europium-152Europium-154Europium-155Lead-212Lead-214Manganese-54Potassium-40Radium-226Sodium-22Thorium-228Thorium-230Thorium-232Thorium-234Uranium-234Uranium-235Uranium-238Zinc-65Strontium-90Gross AlphaGross Beta
Notes:U = Not detectedNS = Not sampledMercury results in mg/kgRadionuclide results in pCi/g
F2-CH F3-CH F4-CH F5-CH F6-CH F7-CH
14.4 10.6 0.24 1.3 0.36 2.20.23 0.22 NS NS U NS
U U NS NS 1.58 NSU U NS NS U NSU U NS NS U NS
0.284 0.217 NS NS U NSU U NS NS U NSU U NS NS U NSU U NS NS U NSU U NS NS U NSU U NS NS U NS
0.7 0.84 NS NS 0.95 NSU U NS NS U NSU U NS NS U NS
4.2 5.9 NS NS 8.5 NSU U NS NS 1.9 NSU U NS NS U NS
0.7 0.84 NS NS 0.95 NSU U NS NS U NS
0.67 0.74 NS NS 1.58 NSU U NS NS U NS
0.46 0.5 NS NS 0.71 NSU U NS NS U NSU U NS NS U NSU U NS NS U NSU U NS NS U NS
23.4 59 NS NS 22.6 NS23.4 28.9 NS NS 26.8 NS
Page 5 of 5

Table 3Pre-Excavation
Animal/Chemical Pits Sample ResultsWestern Portion
Compound ACP-SS-A1 ACP-SS-A2 ACP-SS-A3 ACP-SS-B1 ACP-SS-B2 ACP-SS-B3 ACP-SS-C1 ACP-SS-C2 ACP-SS-C3
Mercury 1.8 N 0.19 N 4.1 N 0.6 N 0.74 N 0.39 N 0.52 N 2.4 N 1.5 NAmericium-241 U NS NS NS NS U U U NSBeryllium-7 U NS NS NS NS U U U NSCesium-134 U NS NS NS NS U U U NSCesium-137 0.49 NS NS NS NS 2.24 U 5.74 NSCobalt-57 U NS NS NS NS U U U NSCobalt-60 U NS NS NS NS U U U NSEuropium-152 U NS NS NS NS U U U NSEuropium-154 U NS NS NS NS U U U NSEuropium-155 U NS NS NS NS U U U NSManganese-54 U NS NS NS NS U U U NSPotassium-40 NA NS NS NS NS U 4.6 5.8 NSRadium-226 U NS NS NS NS U U U NSSodium-22 U NS NS NS NS U U U NSThorium-228 0.36 NS NS NS NS 0.67 0.4 0.52 NSThorium-230 U NS NS NS NS U U U NSThorium-232 0.65 NS NS NS NS 0.77 0.45 0.63 NSUranium-234 0.37 NS NS NS NS 0.51 0.28 0.35 NSUranium-235 U NS NS NS NS U U U NSUranium-238 U NS NS NS NS 1.07 U U NSZinc-65 U NS NS NS NS U U U NSStrontium-90 1.45 J NS NS NS NS 1.88 J NA 2.14 J NSGross Alpha 23.8 NS NS NS NS 27.5 NA 31.4 NSGross Beta 24.8 NS NS NS NS 34.2 NA 29.9 NS
Notes:U = Not detectedNA = Not analyzedNS = Not SampledJ = Estimated resultND = Not DetectedN = Spiked analyte recovery is outside stated control limitsMercury results in mg/kgRadionuclide results in pCi/g
Page 1 of 2
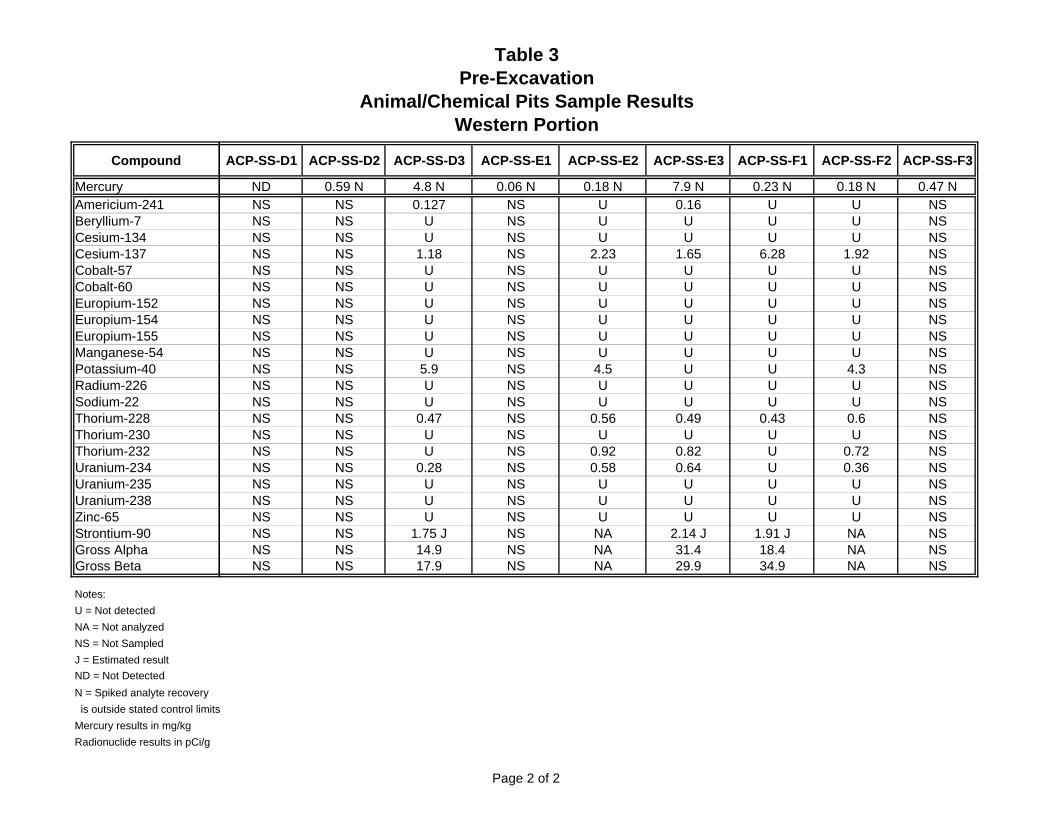
Table 3Pre-Excavation
Animal/Chemical Pits Sample ResultsWestern Portion
Compound
MercuryAmericium-241Beryllium-7Cesium-134Cesium-137Cobalt-57Cobalt-60Europium-152Europium-154Europium-155Manganese-54Potassium-40Radium-226Sodium-22Thorium-228Thorium-230Thorium-232Uranium-234Uranium-235Uranium-238Zinc-65Strontium-90Gross AlphaGross Beta
Notes:U = Not detectedNA = Not analyzedNS = Not SampledJ = Estimated resultND = Not DetectedN = Spiked analyte recovery is outside stated control limitsMercury results in mg/kgRadionuclide results in pCi/g
ACP-SS-D1 ACP-SS-D2 ACP-SS-D3 ACP-SS-E1 ACP-SS-E2 ACP-SS-E3 ACP-SS-F1 ACP-SS-F2 ACP-SS-F3
ND 0.59 N 4.8 N 0.06 N 0.18 N 7.9 N 0.23 N 0.18 N 0.47 NNS NS 0.127 NS U 0.16 U U NSNS NS U NS U U U U NSNS NS U NS U U U U NSNS NS 1.18 NS 2.23 1.65 6.28 1.92 NSNS NS U NS U U U U NSNS NS U NS U U U U NSNS NS U NS U U U U NSNS NS U NS U U U U NSNS NS U NS U U U U NSNS NS U NS U U U U NSNS NS 5.9 NS 4.5 U U 4.3 NSNS NS U NS U U U U NSNS NS U NS U U U U NSNS NS 0.47 NS 0.56 0.49 0.43 0.6 NSNS NS U NS U U U U NSNS NS U NS 0.92 0.82 U 0.72 NSNS NS 0.28 NS 0.58 0.64 U 0.36 NSNS NS U NS U U U U NSNS NS U NS U U U U NSNS NS U NS U U U U NSNS NS 1.75 J NS NA 2.14 J 1.91 J NA NSNS NS 14.9 NS NA 31.4 18.4 NA NSNS NS 17.9 NS NA 29.9 34.9 NA NS
Page 2 of 2

Table 4Pre-Excavation
Animal/Chemical Pits Sample ResultsEastern Portion
Compound Grid 1 Grid 2 Grid 3 Grid 4 Grid 5 Grid 6 Grid 7 Grid 8 Grid 9
Mercury 2.78 1.22 0.301 1.34 0.419 0.026 1.45 1.77 0.988Americium-241 0.0488 J U U U U 0.28 J U 0.642 J UBeryllium-7 0.106 J U U 0.0953 DL 0.452 DL U 0.135 DL U UCesium-134 0.0276 J-UI 0.0223 J-UI U 0.0264 J-UI U 0.0389 J-UI 0.0313 J-UI 0.0194 J-UI UCesium-137 1.2 J 5.85 2.23 J 17.9 12.9 1.99 J 19.4 244 1.88 JCobalt-57 U U U 0.00861 DL U U 0.00591 DL 0.024 DL UCobalt-60 U 0.0296 J U U U U 0.0212 J-UI U UEuropium-152 U U U U U U U U UEuropium-154 U U U U U U U U UEuropium-155 0.0345 J-UI U U U U U U U UManganese-54 U U U U U U U U USodium-22 U U U U U U U U UThorium-228 0.654 0.438 J 0.379 J 0.427 J 0.945 0.669 0.56 0.461 J 0.484 JThorium-230 0.366 J 0.28 J 0.266 J 0.275 J 0.586 0.47 J 0.276 J 0.432 J 0.293 JThorium-232 0.648 0.433 J 0.374 J 0.422 J 0.939 0.665 0.557 0.458 J 0.481 JUranium-234 0.442 J 0.333 J 0.29 J 0.363 J 0.543 J 0.443 J 0.359 J 0.496 J 0.359 JUranium-235 U U U U U U U U UUranium-238 0.43 J U U 0.468 DL 0.597 J U 0.611 DL 0.823 DL UVanadium-48 U U U U U U U U UZinc-65 U U U U U U U U U
Notes:U = Not detectedNA = Not analyzedUI = (Uncertain identification for gamma spectroscopy) - Radionuclide peaks that are detected but fail to meet the positive identification criteria.DL = Detection limit requirements not met. Data quality objectives may not be metJ = Estimated resultND = Not DetectedN = Spiked analyte recovery is outside stated control limitsMercury results in mg/kgRadionuclide results in pCi/g
Page 1 of 2

Table 4Pre-Excavation
Animal/Chemical Pits Sample ResultsEastern Portion
Compound
MercuryAmericium-241Beryllium-7Cesium-134Cesium-137Cobalt-57Cobalt-60Europium-152Europium-154Europium-155Manganese-54Sodium-22Thorium-228Thorium-230Thorium-232Uranium-234Uranium-235Uranium-238Vanadium-48Zinc-65
Notes:U = Not detectedNA = Not analyzedUI = (Uncertain identification foDL = Detection limit requiremenJ = Estimated resultND = Not DetectedN = Spiked analyte recovery is outside stated control limitsMercury results in mg/kgRadionuclide results in pCi/g
Grid 10 Grid 11 Grid 12 Grid 13 Grid 14 Grid 15
2.97 2.75 4.37 0.0413 1.65 0.474U U U 0.0969 J U UU 0.119 DL U 0.0743 DL 0.116 DL U
0.0243 J-UI 0.0195 J-UI 0.027 J-UI 0.0259 J-UI 0.0265 J-UI 0.0228 J-UI12 34.4 16.5 27.7 33.4 1.19 J
0.0182 J-UI 0.0001 DL U 0.00465 DL 0.00543 J-UI UU U U U U UU U U U U UU U U U U UU U U U U UU U U U U UU U U U U U
0.397 J 0.371 J 0.523 0.593 0.465 J 0.6380.272 J 0.28 J 0.295 J 0.349 J 0.283 J 0.354 J0.394 J 0.369 J 0.52 0.589 0.462 J 0.6340.321 J 0.352 J 0.366 J 0.483 J 0.324 J 0.394 J
U U U U U 0.101 J0.594 DL 0.954 DL 0.803 DL U 0.765 DL 0.432 J
U U U U U UU U U U U 0.0316 J-UI
Page 2 of 2

Table 5Post-Excavation
Glass Holes Area Sample Results
Compound Mercury
A1-CH 0.52A2-CH 0.31A3-CH 0.3A4-CH 0.48A5-CH 0.11A6-CH 0.8A7-CH 0.8B2-CH 0.4B3-CH 0.004B4-CH 0.1B5-CH 0.16C4-CH 0.23 JC3-CH 0.21C5-CH 0.38C6-CH 0.39D5-CH 0.19D8-CH 0.25E6-CH 0.67E7-CH 0.1F1-CH 0.5F2-CH 0.93F3-CH 0.072F7-CH 0.047
Notes:Mercury results in mg/kgJ = Estimated Result
Page 1 of 1
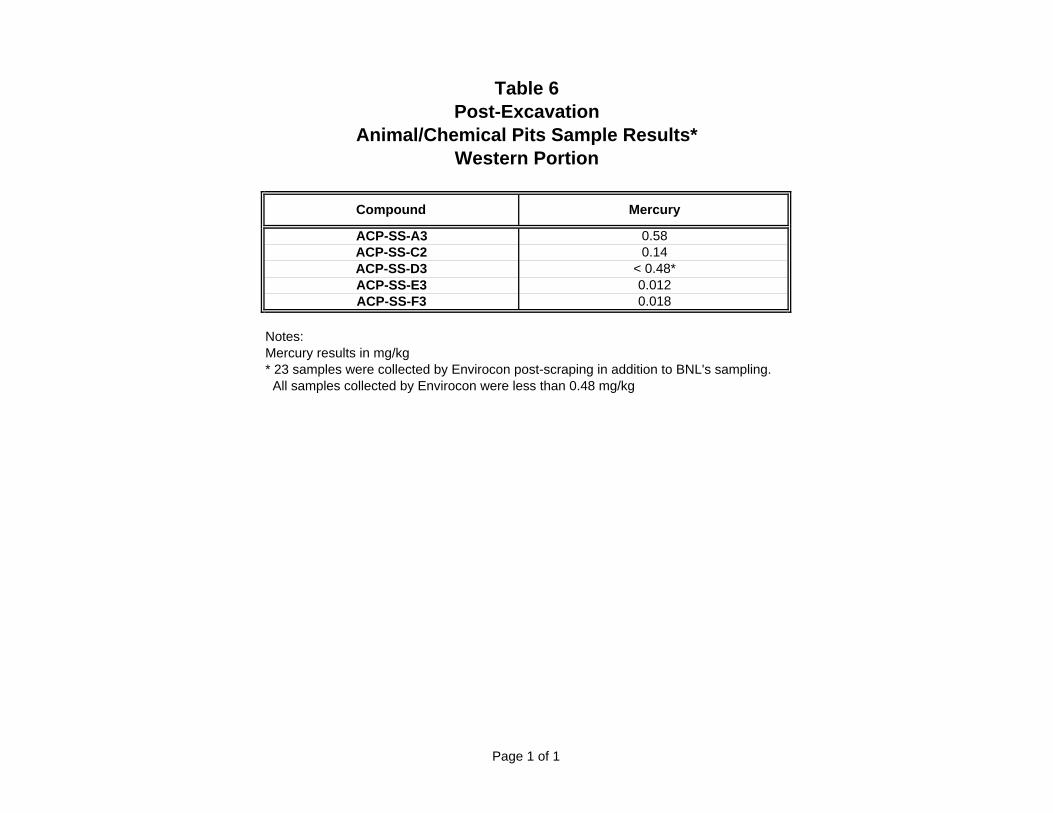
Table 6Post-Excavation
Animal/Chemical Pits Sample Results*Western Portion
Notes:Mercury results in mg/kg* 23 samples were collected by Envirocon post-scraping in addition to BNL's sampling. All samples collected by Envirocon were less than 0.48 mg/kg
ACP-SS-C2ACP-SS-D3
0.14< 0.48*
Mercury
0.58
Compound
ACP-SS-A3
0.0120.018
ACP-SS-E3ACP-SS-F3
Page 1 of 1

Table 7Post-Excavation
Animal/Chemical Pits Sample ResultsEastern Portion
Compound Grid 1 Grid 2 Grid 3 Grid 4 Grid 5 Grid 6 Grid 7 Grid 8 Grid 9 Grid 10
Mercury 1.2 N 1.22 0.301 1.34 1.7 N 0.24 0.17 N 0.71 N 1.4 N 0.21Americium-241 U U U U U U 0.14 J U 0.26 J UBeryllium-7 U U U U U U U U U UCesium-134 U U U U U U U U U UCesium-137 7.2 5.85 2.23 J 17.9 16.4 13.8 5.15 0.088 J 8.4 UCobalt-57 U U U U U U U U U UCobalt-60 U 0.0296 J U U U U U U U UEuropium-152 U U U U U U U U U UEuropium-154 U U U U U U U U U UEuropium-155 U U U U U U U U U UManganese-54 U U U U U U U U U URadium-226 U NA NA NA U U U U 0.31 J 0.31 JSodium-22 U U U U U U U U U UThorium-228 0.48 J 0.438 J 0.379 J 0.427 J 0.75 0.41 J 0.78 0.35 J 0.35 J 0.44 JThorium-230 U 0.280 J 0.266 J 0.275 J U U U U 0.39 J 0.36 JThorium-232 0.79 0.433 J 0.374 J 0.422 J 0.97 0.6 0.97 U 0.29 J 0.44 JUranium-234 0.32 J 0.333 J 0.290 J 0.363 J 0.47 J U 0.51 0.25 J 1.23 0.27 JUranium-235 U U U U U U U U U UUranium-238 U U U U U U U U 0.48 J 0.20 JVanadium-48 U U U U U U U U U UZinc-65 U U U U U U U U U UStrontium-90 0.62 J NA NA NA U U 0.64 J U U UPotassium-40 5 U U U 7 4.1 8.2 4.2 5.2 5.7Actinium-228 0.79 U U U U U U U U ULead 214 U U U U U U U U U UGross Alpha 21.1 NA NA NA 21.2 30.3 26.9 27.2 34.7 24Gross Beta 37 NA NA NA 59.6 72.9 56.9 27.3 71 23.3
Notes:Results are in pCi/gU = Result is less than the sample detection limitJ = Result is greater than the sample detection limit but less than the stated reporting limitNA = Not Analyzed
Page 1 of 2

Table 7Post-Excavation
Animal/Chemical Pits Sample ResultsEastern Portion
Compound
MercuryAmericium-241Beryllium-7Cesium-134Cesium-137Cobalt-57Cobalt-60Europium-152Europium-154Europium-155Manganese-54Radium-226Sodium-22Thorium-228Thorium-230Thorium-232Uranium-234Uranium-235Uranium-238Vanadium-48Zinc-65Strontium-90Potassium-40Actinium-228Lead 214Gross AlphaGross Beta
Notes:Results are in pCi/gU = Result is less than the sample detection limitJ = Result is greater than the sample detection limit but less than the stated reporting NA = Not Analyzed
Grid 11 Grid 12 Grid 13 Grid 14 Grid 15
0.52 N 0.034 B 0.014 BN 0.39 N 0.0085 BU U U U UU U U U U
0.41 U U 0.207 UU U U U UU U U U UU U U U UU U U U UU U U U UU U U U UU U U U UU 0.30 J U U 0.57 JU U U U U
0.283 J 0.36 J 0.48 J 0.38 J 0.54 JU 0.29 J U U 0.35 J
0.52 0.35 J U U 0.38 J0.247 J 0.28 J 0.24 J 0.38 U 0.202 J
U U U U UU 0.29 J U U 0.154 JU U U U UU U U U UU U U U U
4.4 U 4.5 4.7 4.5U U U U UU U U 0.38 U
16.3 19.8 29.7 17.3 12.219.5 37.4 26.6 30.2 14
Page 2 of 2

APPENDIX A Pre- and Post- Excavation Walkover
Surveys


APPENDIX B ER Operations Procedures Manual
4.18 Gamma Survey of contaminated Soils using the Eberline E-600 Meter and Nal
Detector


APPENDIX C Environmental Monitoring Procedure,
EM –SOP-601, Collection of Soil Samples