Embed Size (px)
Citation preview

Angio-OCT nella retinopatia diabetica
www.amedeolucente.it
XIX Congresso Oftalmo-Chirurgia in Diretta Organizzatori: R. di Lauro, L. Zeppa
Napoli, 8-9 Settembre 2017
Edema Maculare Diabetico e Patologie Vascolari Retiniche Presidente: C. Azzolini Moderatori: A. Morocutti, R. Ratiglia

Disclosure
Consulting Free
• Carl Zeiss Meditec
• Alfa Intes
• Mesofarma srl
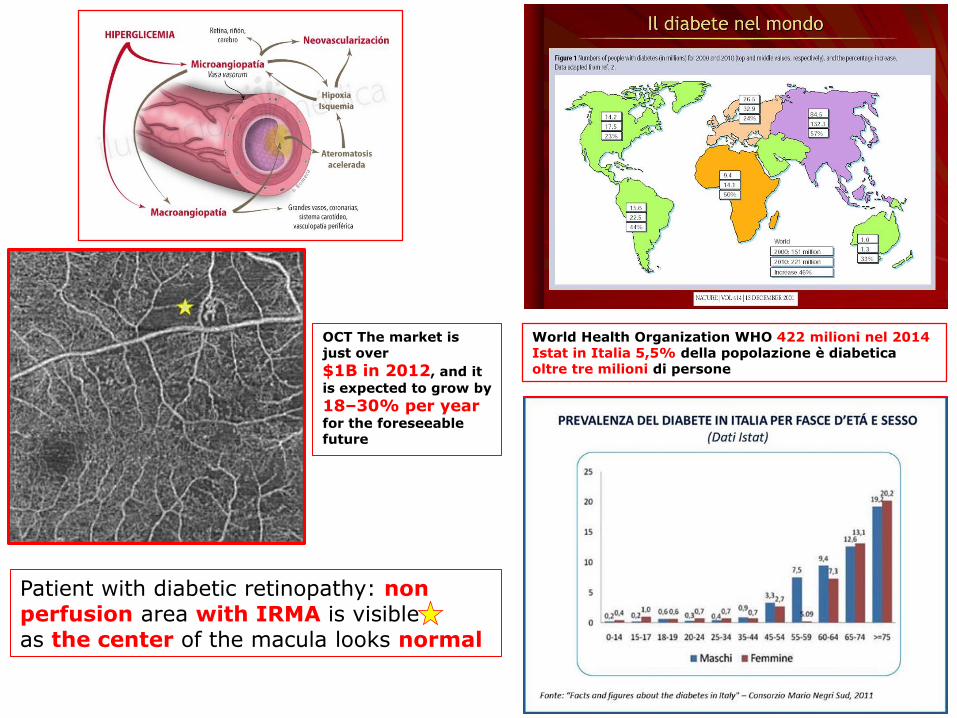
Patient with diabetic retinopathy: non perfusion area with IRMA is visible as the center of the macula looks normal
World Health Organization WHO 422 milioni nel 2014 Istat in Italia 5,5% della popolazione è diabetica oltre tre milioni di persone
OCT The market is just over
$1B in 2012, and it
is expected to grow by
18–30% per year for the foreseeable future

The high resolution of
OCTA provides information about areas
• capillary nonperfusion
• vessel dilation and attenuation
• telangiectasias
• microaneurysms
• vascular proliferation
Superficial capillary
Deep capillary
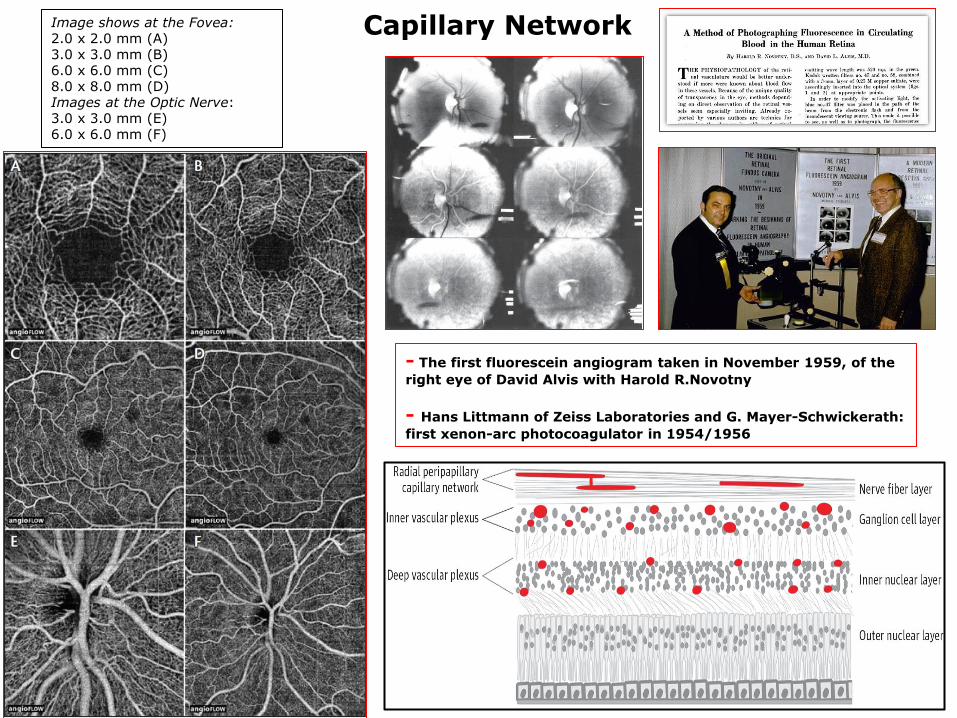
Capillary Network Image shows at the Fovea: 2.0 x 2.0 mm (A) 3.0 x 3.0 mm (B) 6.0 x 6.0 mm (C) 8.0 x 8.0 mm (D) Images at the Optic Nerve: 3.0 x 3.0 mm (E) 6.0 x 6.0 mm (F)
- The first fluorescein angiogram taken in November 1959, of the
right eye of David Alvis with Harold R.Novotny
- Hans Littmann of Zeiss Laboratories and G. Mayer-Schwickerath:
first xenon-arc photocoagulator in 1954/1956

Images can illustrate the presence of microaneurysms and areas of ischemia A)Full depth color encoded image B) Superficial Retinal Layer C) Deep Retinal Layer D) Superficial layer overlaid onto FA
A B
C D
Diabetic Retinopaty with AngioPlex with OMAG
UWF Clarus Zeiss
Daytona
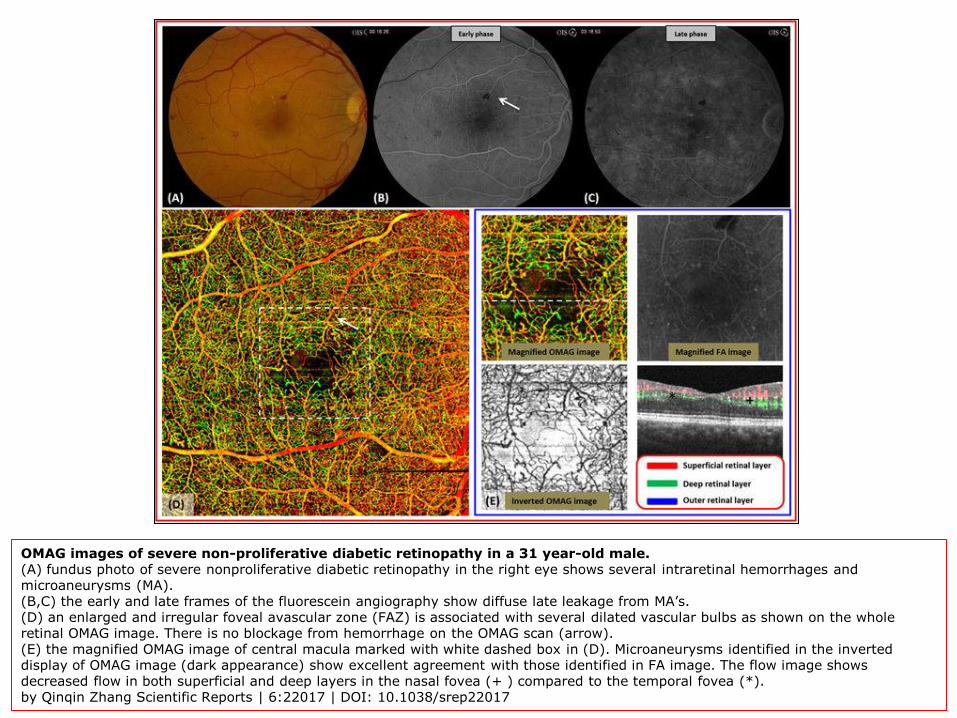
OMAG images of severe non-proliferative diabetic retinopathy in a 31 year-old male. (A) fundus photo of severe nonproliferative diabetic retinopathy in the right eye shows several intraretinal hemorrhages and microaneurysms (MA). (B,C) the early and late frames of the fluorescein angiography show diffuse late leakage from MA’s. (D) an enlarged and irregular foveal avascular zone (FAZ) is associated with several dilated vascular bulbs as shown on the whole retinal OMAG image. There is no blockage from hemorrhage on the OMAG scan (arrow). (E) the magnified OMAG image of central macula marked with white dashed box in (D). Microaneurysms identified in the inverted display of OMAG image (dark appearance) show excellent agreement with those identified in FA image. The flow image shows decreased flow in both superficial and deep layers in the nasal fovea (+ ) compared to the temporal fovea (*). by Qinqin Zhang Scientific Reports | 6:22017 | DOI: 10.1038/srep22017

OMAG images of a 31 year-old male with proliferative diabetic retinopathy. (A) fundus photo of proliferative diabetic retinopathy in the left eye. There are multiple, large fibrovascular complexes associated with pre- and intraretinal hemorrhages. (B) the late frame of the fluorescein angiography demonstrates diffuse leakage from several areas of active neovascularization. (C) the OMAG image of the whole retinal layer shows three large neovascular complexes that have penetrated into the vitreous cavity (D) the structural optical coherence tomography shows the disruption of internal limiting membrane by the neovascular complexes (dashed lines indicated with #1,2,3 in (C)) and their growth into the vitreous cavity. (E) high-definition details of the vascular complex such as the vessel caliber, volume, density of capillary network can be appreciated compared to the FA. The flow OMAG image shows the evidence of vascular flow within the superotemporal neovascularization of elsewhere marked with a white dashed box in (C). by: Qinqin Zhang et al. Scientific Reports | 6:22017 | DOI: 10.1038/srep22017

First, most new vessels had the lesions with irregular proliferation of fine vessels, which were defined as exuberant vascular proliferation (EVP) (Fig. 1B)
The second type of new vessels had pruned vascular loops of filamentous new vessels, but not EVP (Fig. 1E)
En face OCT angiograms, two distinct morphologic features of new vessels were identified
by: Akihiro Ishibazawa et al. IOVS j November 2016 j Vol. 57 j No. 14.

VISTA visualisation in a 30-year-old proliferative diabetic retinopathy patient taken over a 3mm × 3mm field of view (red indicates faster blood flow speeds; blue indicates slower speeds). Courtesy OCT Research Group, MIT-NEEC
Variable Interscan Time Analysis (VISTA) is a step towards quantitative optical coherence tomography angiography (OCTA) that allows determination of relative blood flow speeds. As a next innovation, the VISTA developers have created ‘VISTA visualisation’, a method for mapping the VISTA data into a colour-coded format to make image interpretation intuitive and easy for clinicians
The development of VISTA and VISTA visualisation represents a collaboration between teams of clinicians, optical engineers and computer scientists at MIT and the New England Eye Centre, Boston, USA; Bascom Palmer Eye Institute, Miami, USA; and the Friedrich-Alexander-University Erlangen-Nürnberg, Germany

Galileo Galilei, padre della scienza moderna Pisa, 15 febbraio 1564 – Arcetri, 8 gennaio 1642

Thank you for your kind attention


![2011022718016274[1] - sigo.it · esse stesse fotorecettori, sostituendosi cosi alle cellule retiniche danneggiate. «Rispetto agli impianti con gli elet- trodi al silicio, anche questi](https://img.dokumen.tips/doc/110x75/5c67a1c809d3f2034d8c33e6/20110227180162741-sigoit-esse-stesse-fotorecettori-sostituendosi-cosi.jpg)