Embed Size (px)
Citation preview

20A New Approach to Analysisof Single-Molecule Force Measurements
Evan Evans, Ken Halvorsen, Koji Kinoshita, and Wesley P. Wong
Abstract A common aim in probing single molecular bonds or the structural stability ofproteins is to measure the kinetic rates at which a bond dissociates or a protein changesconformation under conditions of changing force. Using sample data taken from tests ofligand–receptor unbinding and protein unfolding/refolding, we show that populations of “sin-gle molecule” events, arranged into statistical arrays expressing the numbers of bonds orinitial conformers remaining as a function of time and cumulated into histograms of tran-sitions over fixed time increments, provide the bases for a model-independent assay of thekinetic rates of transition throughout the course of an experiment. Most important, this assayfor kinetic rates can be employed with any deterministic mode of force spectroscopy, whetherthe pulling force increases or decreases with time.
20.1. Introduction
In tests of molecular complexes or structures with force probes, the common objec-tive is to measure the kinetic rate k! at which a single complex (bond) dissociates or asingle molecule changes conformation when subjected to a pulling force. As such, successin molecular force measurements requires an experimental approach that will produce ahigh probability of single-molecule events plus reliable criteria for excluding contaminat-ing events that arise from irrelevant (nonspecific) and multiple molecule attachments. Afterbriefly discussing ways to best satisfy these requirements, we show that arranging the refinedpopulation of putative “single-molecule” events into (1) an array N(ti) expressing the num-bers of bonds or initial conformers remaining as a function of time and (2) its histogram!Nk(tk) of transition events cumulated over fixed time increments !t together establish adirect (model-independent) assay for the kinetic rates of transition, k!(tk) " (!Nk/!t)/N(tk)defined at the mean sample times tk. Although formulated here in terms of the ratios of prob-ability density/probability for a two-state molecular transition [i.e., p(tk)/S(tk) = k!(tk)],
E. Evans, K. Kinoshita • Department of Biomedical Engineering, Boston University, Boston, MA 02215,USA, and Physics and Pathology, University of British Columbia, Vancouver, BC Canada V6T 2A6K. Halvorsen, W.P. Wong • The Rowland Institute at Harvard, Harvard University Cambridge MA 02142, USA
571P. Hinterdorfer, A. van Oijen (eds.), Handbook of Single-Molecule Biophysics,DOI 10.1007/978-0-387-76497-9_20, © Springer Science+Business Media, LLC 2009

572 Evan Evans et al.
the statistics-based approach can be readily extended to encompass more hierarchal andcomplex transitions if backed by appropriate evidence. Of fundamental significance, theexperimental assay for kinetic rates provides a general method to analyze results obtainedwith any deterministic mode of force spectroscopy, f(t), whether the pulling force increasesor decreases with time. Using examples of ligand–receptor unbinding and protein unfold-ing/refolding, we demonstrate that plotting the experimental assay for kinetic rates on a log-arithmic scale versus pulling force f(tk), and invoking Arrhenius phenomenology, k!(f) = k0exp[–!G(f)/kBT],1 reveals both the impact of force on the chemical energy barrier govern-ing the kinetics of single-molecule transitions, !G(f)/kBT, and the rate prefactor, k0 = 1/t0,characterizing persistence of the force-free state. As a preface to these examples, we first out-line principles of instrument design and procedures for data processing that lead to reliableassays of molecular transitions—the obvious challenge being to acquire “single-moleculeevents”.
20.2. Force Probe Design and the Quest for Single-Molecule Statistics
A molecular force probe is an ultrasensitive “spring” with a reactive tip that initiatesthe attachments to be tested. Thus, touched repeatedly to a target surface, the probe tip is pre-pared with a very low concentration of the initiator molecule to ensure rare discrete attach-ments. Since the reacting molecules on a tip and target surface are usually limited in rangeof mobility, the likelihood of forming attachments on touch depends primarily on the areaof contact and to a much lesser extent on contact time. Consequently, the probe instrumentshould be designed to touch the target surface with a small (less than a few piconewtons)compressive force regulated by feedback. With both the impingement force and duration oftouch controlled, the conditions leading to attachments will be nearly identical for every touchto a target, allowing the rare events to be viewed as a stationary-random process (amenableto characterization by Poisson statistics as described later). Equally important for the assaypresented here, a probe must have sufficient precision to report forces with #1-pN accu-racy over a wide range from minus a few piconewtons to +100 pN or more. Thus, to achievethis accuracy, the probe transducer should have a low spring constant (less than or equal toa piconewton per nanometer), as well as a nanometer-precision system for tracking its tipdisplacement.
As an example, a biomembrane force probe (BFP) [1,2] was used to test the ligand–receptor bonds described later, providing the force–time traces seen in Figure 20.1. With atunable spring constant set typically between 0.3 < !f < 0.5 pN/nm and with 3- to 4-nmprecision in video tracking of its tip, the BFP can measure forces in the range from –30to +300 pN with a standard deviation (SD) of ±1–2 pN. As other examples, two types oflaser optical trap force probes (OTFP) were used to test the unfolding/refolding of polypro-tein domains [3,4]. With spring constants set typically between 0.005 < !f < 0.1 pN/nm,the fast video tracking systems in these OTFP instruments, one with 2- to 3-nm preci-sion [3] and the other with <1-nm precision [4,5], provide much better force accuracy,SD < ±0.1 pN, as demonstrated in Figure 20.2 (also later in Figure 20.9), than a BFP.
1 Thermal energy kBT is #4.08 $ 10–21 J at room temperature.

Analysis of Single-Molecule Force Measurements 573
Figure 20.1. Force–time traces obtained from biomembrane force probe (BFP) in tests of ligand–receptor bonds:The left trace is at a slow (7 pN/s) ramp and the right trace is at a fast (700 pN/s) ramp of pulling force. A tenfoldbreak in time axis separates the two traces to illustrate the major reduction in bond lifetime (i.e., from #7 sec to#0.1 sec) that accompanies the increase in its mechanical strength (i.e., from #40 pN to #60 pN) when rampsincrease from slow to fast rates. Stars mark feedback control of the soft impingement (#–10 pN) and a brief, 0.1-secperiod of contact ending with piezo retractions of the microsphere targets at fixed speeds. The red traces are five-point moving averages of the direct traces (blue) obtained at a sampling rate of 1,500/sec. Limited by uncertainty(#±4 nm standard deviation [SD]) in video tracking of the BFP tip deflection, the spread in force (#± 2-pN SD;blue traces) increases and decreases, in proportion to the spring constant kf chosen for the experiments (here set to0.5 pN/nm by micropipet suction).
However, smaller ranges of force are usually accessible to optical trap instruments, for exam-ple, –10 to +50 pN. Since rates of molecular transitions increase rapidly when subjectedto increasing force, probe instruments have to provide high levels of precision at very fastsampling frequencies, which are limited to #2–3 $ 103/sec by viscous damping for theBFP and OTFP.
In most of the experimental examples described here, molecules were stressed byretracting a tip or target away from contact at fixed speed vpull, resulting in a “force ramp.”Although programmed to achieve a ramp of !fvpull, the actual ramp produced by steady speedretraction depends on the effective stiffness !eff of the probe spring in series with the tip–target interfacial structure. For tests exhibiting linear force increases with time (cf. Figures20.1 and 20.2), the tip–target interfaces respond like elastic springs, !t#t, and therefore, !eff= !f!t#t/(!f + !t#t). Thus, the ratio of observed ramp/nominal ramp, crf = rf /(!fvpull), pro-vides a direct assay of the tip–target interfacial stiffness, !t#t = !f crf /(1 – crf). As an exam-ple, using amino- or mercapto-silane and hetero-bifunctional polymer linkers to immobilizeproteins on glass microspheres, one finds the ratios crf to depend on the molecules chosen,typically exhibiting values between 0.7 and 0.9 with small SD (<±0.1). Close to 1, this rangeof values shows that the tip–target interface is much stiffer than the probe spring.
574 Evan Evans et al.
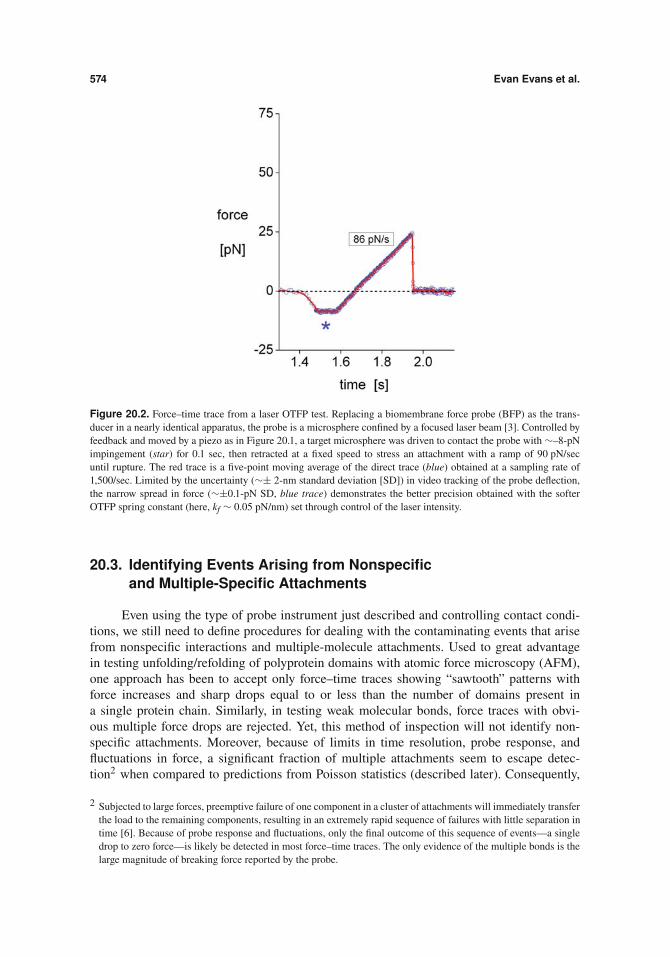
Figure 20.2. Force–time trace from a laser OTFP test. Replacing a biomembrane force probe (BFP) as the trans-ducer in a nearly identical apparatus, the probe is a microsphere confined by a focused laser beam [3]. Controlled byfeedback and moved by a piezo as in Figure 20.1, a target microsphere was driven to contact the probe with #–8-pNimpingement (star) for 0.1 sec, then retracted at a fixed speed to stress an attachment with a ramp of 90 pN/secuntil rupture. The red trace is a five-point moving average of the direct trace (blue) obtained at a sampling rate of1,500/sec. Limited by the uncertainty (#± 2-nm standard deviation [SD]) in video tracking of the probe deflection,the narrow spread in force (#±0.1-pN SD, blue trace) demonstrates the better precision obtained with the softerOTFP spring constant (here, kf # 0.05 pN/nm) set through control of the laser intensity.
20.3. Identifying Events Arising from Nonspecificand Multiple-Specific Attachments
Even using the type of probe instrument just described and controlling contact condi-tions, we still need to define procedures for dealing with the contaminating events that arisefrom nonspecific interactions and multiple-molecule attachments. Used to great advantagein testing unfolding/refolding of polyprotein domains with atomic force microscopy (AFM),one approach has been to accept only force–time traces showing “sawtooth” patterns withforce increases and sharp drops equal to or less than the number of domains present ina single protein chain. Similarly, in testing weak molecular bonds, force traces with obvi-ous multiple force drops are rejected. Yet, this method of inspection will not identify non-specific attachments. Moreover, because of limits in time resolution, probe response, andfluctuations in force, a significant fraction of multiple attachments seem to escape detec-tion2 when compared to predictions from Poisson statistics (described later). Consequently,
2 Subjected to large forces, preemptive failure of one component in a cluster of attachments will immediately transferthe load to the remaining components, resulting in an extremely rapid sequence of failures with little separation intime [6]. Because of probe response and fluctuations, only the final outcome of this sequence of events—a singledrop to zero force—is likely be detected in most force–time traces. The only evidence of the multiple bonds is thelarge magnitude of breaking force reported by the probe.
Analysis of Single-Molecule Force Measurements 575
we will demonstrate a simple conservative procedure to identify the major subset of “rawstatistics” that most likely contains the “single-molecule” events. After describing the pro-cedures, we will illustrate their impact on “raw statistics” with data from tests of molecularunbinding.
20.3.1. Dealing with Nonspecific Events
Performed under the same conditions of target impingement and retraction speed asin the tests of functional properties, we employ control experiments to identify which binsin histograms are likely to contain significant numbers of nonspecific events. Since nonspe-cific interactions in controls arise mainly at low forces, the simplest approach is to ignorethis low range of forces in histograms when the numbers become significant. Although theapproach is unsophisticated, we will show that ignoring these short-time statistics has noeffect on the assay for transition rates at longer times and higher forces. The proceduremerely sets a lower bound to the range of data analyzed. Most of the studies to be describedhere involve molecules immobilized on rigid surfaces at concentrations adjusted to yield<15%–20% specific attachments from thousands of repeated contacts. With these prepa-rations, control experiments typically yield tenfold fewer attachments. As a demonstrationrelevant to later examples, Figure 20.3 shows force histograms obtained from tests in NaClbuffer plus 5 mM ethylenediaminetetraacetic acid (EDTA) between a microsphere tip linkedcovalently with intercellular adhesion molecule-1 (ICAM-1) and a microsphere target pre-senting recombinant "2-integrin lymphocyte function-associated antigen-1 (LFA-1) held bya covalently linked activating antibody (240Q [7,8]). Touched #1,400–1,800 times at a forceof –10 pN (for 0.1 sec), less than 1%–2% of the tip–target contacts in EDTA indicated anattachment.
In marked contrast to microsphere targets, even when performed with the same softtouch and brief contact, controls for interactions at surfaces of biological cells yield muchhigher frequencies of nonspecific attachments and larger ranges of forces affecting statis-tics. Strongly dependent on the speed of target retraction, the increased number of nonspe-cific attachments and range of forces are primarily consequences of a much larger area ofcontact at a cell surface and the stronger hydrodynamic coupling (“suction”) that accompa-nies fast retraction of the “soft” target [2]. Demonstrating the enhanced nonspecific interac-tion with cell surfaces, Figure 20.4 shows another set of controls relevant to LFA-1 inter-actions in which a probe linked with an irrelevant protein (bovine serum albumin) wastouched against human neutrophilic leukocytes (PMNs), this time in buffer plus 2 mM Mn2+.Although large numbers of nonspecific forces are seen at fast retraction speeds in Figure20.4, well-defined populations of specific-integrin attachments can be observed beyond therange contaminated by nonspecific events when a probe decorated with low concentration ofICAM-1 is touched to PMNs in Mn2+. As we show in a later example (Figure 20.8), sim-ply ignoring this initial force range leaves the prominent peak of specific events amenable toanalysis.
20.3.2. Dealing with Multiple-Specific Events
Unlike nonspecific interactions, the procedure for identifying and excluding hiddenevents that originate from multiple attachments is not benign and must be consideredcarefully. Since definitive observational criteria are usually not available for rejecting events,

576 Evan Evans et al.
Figure 20.3. Controls for nonspecific interactions in tests of lymphocyte function-associated antigen-1 interac-tions that involve immobilized constructs on glass microspheres. Performed at three force rates in NaCl buffer plus5 mM ethylenediaminetetraacetic acid, force histograms show the numbers of nonspecific attachments (scaled per104 touches) obtained from 1,400–1,800 touches between a biomembrane force probe tip linked covalently with inter-cellular adhesion molecule-1 and the microsphere targets presenting recombinant #L"2 integrin held by a covalentlylinked activating antibody (240Q [6]).
the primary objective in all experiments should be to establish a stationary-random processfor formation of attachments, employing sensitive feedback to control the initial contact andreducing the concentration of molecular reactants to achieve rare events. Once accomplished,the attachment frequency A$ can be used to define the probability P0 = (1 – A$) for noattachment, from which Poisson estimates follow for the probabilities of a single attachment,

Analysis of Single-Molecule Force Measurements 577
Figure 20.4. Controls for nonspecific interactions in tests of lymphocyte function-associated antigen-1 (LFA-1)interactions at the surfaces of human neutrophilic leukocytes (PMNs). Performed at three force rates in buffer plus2 mM Mn2+, force histograms show the numbers of nonspecific attachments (scaled per 104 touches) obtained from#1,000 touches between a biomembrane force probe tip linked covalently with an irrelevant protein (bovine serumalbumin) and PMNs expressing LFA-1.
P1 = (A$ – 1) ln(1 – A$), and all multiples, Pn%2 = A$ + (1 – A$) ln(1 – A$). Since multipleattachments share the applied force (albeit with unknown distribution), we expect their tran-sitions (detachments or conformational changes) to occur at unusually long times and verylarge forces.Hence, we use the probability for multiples to conservatively identify a smallfraction of events Pn%2/A$ (typically #10%–15% or less) to be excluded at the longest transi-tion times (largest forces). Although there are only a few events, we show next that truncating“raw statistics” by this precise fraction produces arrays of events N(ti) with appropriate con-vergence at long times.

578 Evan Evans et al.
20.4. Establishing Estimators for Initial State Probabilityand Distribution of Transitions
Using data from tests between a BFP linked with ICAM-1 and microsphere targetslinked with recombinant LFA-1 (#L"2-LZ [9]), we will first demonstrate how to obtainestimators for initial state probability and its probability distribution of transitions.3 As notedin the introduction, these two observables form the basis for the direct assay of the kineticrates in force probe experiments. Figures 20.5A, B show examples of the arrays N(ti) (openblue circles) defining unnormalized probabilities of bond survival, which were obtained byexcluding a small number of “Poisson multiples” at the terminus (long-time tail) of each“raw data” set (open black circles). Equivalent to time (i.e., f = rft), the numbers of integrinattachments N(ti) that survived in 2 mM Ca2+ are plotted as a function of force in Figure20.5A for a ramp of 770 pN/sec. Based on 417 attachments from 1,703 cycles of approach-touch-retraction, the Poisson fraction Pn%2/A$ " 0.134 marked 56 events for exclusion fromthe “raw data” tail. Similarly, the numbers of integrin attachments that survived in 2 mMMg2+ are plotted in Figure 20.5B as a function of force for a ramp of 89 pN/sec. In total, 375attachments were detected from 1,804 cycles of approach-touch-retraction. Again from theattachment frequency, the Poisson fraction Pn%2/A$ " 0.112 marked 42 events for exclusionfrom the “raw data” tail. Establishing unnormalized estimators for initial state probabilities[S1(ti)], the arrays N(ti) (open blue circles) in Figures 20.5A, B are expected to be enrichedsignificantly in “single-molecule” events, which is consistent with the rapid convergencein statistics observed at large forces (long times). Plotted directly below in Figures 20.5C,D, histograms of the “raw data” show the bins of events that were excluded at long times(cross-hatched), as well as the few nonspecific events expected from controls (gray bins) atlow forces. As described later, the intervening (bright yellow) bins represent the numbers!Nk of unbinding transitions within fixed sampling periods !f (= rf !t), providing theestimators for probability density p(tk) and the rate of decrease in the initial state probability,p(tk) = –[dS1/dt]k. Unless supported by additional evidence, more-aggressive truncationsof the raw data to obtain these estimators would be unsubstantiated and likely to introduceartifacts in the assay of kinetic rates.
20.5. Two-State Transitions and the Direct Experimental Assayfor Kinetic Rates
Applicable to many types of single-molecule tests, the estimators for initial state prob-ability, i.e., S1(t) " N(ti)/N(0), characterize the likelihood that single-molecular complexes orconformers remain in the initial state throughout the course of an experiment. Treated here asa two-state transition, a first-order Markov equation describes the temporal evolution of thisinitial state to a subsequent state S2(t) of molecular dissociation or new conformation, that is,
dS1(t)/dt = &k!(t)S1(t) + k'(t)[1 & S1(t)]
S2(t) ( [1 & S1(t)]
3 Used in this chapter to illustrate the analysis of force distributions in ligand–receptor dissociation under forceramps, the sample data for interactions between ICAM-1 and "2-integrin (LFA-1 on leukocytes and recombinant#L"2-LZ heterodimer) are taken from a two manuscripts describing many tests of LFA-1 integrin interactions,which have been submitted to the Biophysical Journal for publication.

Analysis of Single-Molecule Force Measurements 579
Figure 20.5. Unbinding intercellular adhesion molecule-1 attachments to #L"2 immobilized on microspheres withramps of force. A. Tests in 2 mM Ca2+ at a ramp rate of 770 pN/sec produced 417 attachments from 1,703 contacts.Thus, a Poisson fraction of 56 putative multiples was marked for exclusion from the “raw statistics” (black opencircles), yielding the unnormalized estimator N(fk) for initial-state probability (blue open circles). B. Tests in 2 mMMg2+ at a ramp rate of 89 pN/sec produced 375 attachments from 1,804 contacts. Thus, a Poisson fraction of 42putative multiples was marked for exclusion from the “raw statistics,” again yielding the unnormalized estimatorN(fk) for initial-state probability. C, D. Histograms of the “raw data” appearing in panels A and B. The cross-hatchedbins identify the events truncated from the “raw statistics” at long times to obtain the unnormalized estimator forinitial state probability N(ti). The gray bins represent the nonspecific events expected from controls scaled to matchthe appropriate number of contacts. The bright-yellow bins containing the majority of events represent the numbers!Nk of transitions occurring within fixed sampling periods !f (= rf !t), yielding the unnormalized estimators forprobability density, p(tk) = (rf/!f)!Nk, at the bin centers fk = rftk. (The closed yellow circles in panels A and Bidentify interpolation points.)
Governing the two-state dynamics are the instantaneous frequencies of forward k!(t) andreverse k'(t) transitions. Since application of pulling forces with a “soft” spring eliminatesreverse transitions [10,11], we approximate k' as #0 and reduce the two-state dynamics toa first-order decay process, dS1(t)/dt " –k!(t)S1(t), the solution of which reflects the cumu-lated frequency of forward transition, that is, S1(t) = exp[–
!0!t k!(t)) dt) ]. As such, the
probability density p(t) now represents the “instantaneous” rate, k!(t)S1(t), at which forwardtransitions drain the initial state, and the ratio of probability density/probability becomesequivalent to the forward kinetic rate, k!(t), at any time. Hence, equally important in ourapproach to data analysis, the numbers of events !Nk in histograms, cumulated over discrete

580 Evan Evans et al.
time differences !t, provide key estimators for probability density, p(tk) " (1/!t)[!Nk/N(0)],at the bin center times tk. Interpolating among the array N(ti) to obtain the values N(tk) (iden-tified by solid yellow circles in Figures 20.5A–B), we establish the ingredients needed tospecify ratios p(tk)/S(tk) of probability density/probability and to directly assay the forwardkinetic rates, k!(tk). Perhaps most significant, this generic assay for kinetic rates is valid evenwhen transition rates vary over time, which allows the approach to be applied in all modes offorce spectroscopy as long as the history of force follows a precise function in time f(t). Sincethe estimator for probability density/probability, (1/!t) [!Nk/N(tk)], is independent of N(0),the results do not depend on the initial force (i.e., time) where we commence the analysis,which allows us to simply ignore bins at low forces in histograms containing large numbersof nonspecific events.
In the sections that follow, we will demonstrate this method of analysis using data froma variety of experiments. Along with the requirement for a well-defined population of single-molecule transitions, the key assumption underlying validity of the two-state approach is thatthe internal dynamics of transitions (e.g., pausing at metastable states or involving multiplereaction pathways) must be orders of magnitude faster than the mean time needed to reach theend state. Even so, prominent consequences of internal transitions can be perceived throughexploring a large range of force or force ramps, as recognized some time ago [12].
20.6. Experimental Example: Dissociating ICAM-1 from !2-Integrin withForce Ramps
20.6.1. Microsphere Targets
In analyzing data from force ramp experiments, we employ an equivalent and veryuseful transformation that replaces the statistical estimators based on transition times withthose based on forces, that is, p(tk)/S(tk) ( rf p(fk)/S(fk).4 By changing from transition timestk to force statistics fk = rftk, we will determine the ratios of probability density/probability,p(tk)/S(tk) " (rf /!f)[!Nk/N(fk)], from the bin contents in force histograms !Nk and valuesfor N(fk) obtained at the bin centers fk by interpolation among the initial state statistics N(fi).Finding these ratios from data at several ramps like the examples shown in Figure 20.5, weplot the results on a logarithmic scale in Fig. 20.6A, B to expose the dramatic increases inoff-rates that accompany increases in the forces. Moreover, starting from their intercepts atzero force, the off-rates of ICAM-1 from LFA-1 are seen to differ significantly in the twodivalent cation environments. Extended to higher and lower forces with ratios from fasterand slower ramps (solid green, magenta, red circles in Fig. 20.6A, B), the marked differencein kinetics becomes clear when comparing the linear regressions superposed on each dataset. Converted to a linear scale, the fits yield exponentials: koff " (2/sec) exp(f /9.6 pN) foractivation in Ca2+ and koff " (0.007/sec) exp(f /6.8 pN) for activation in Mg2+. Differing morethan 100-fold, the force-free dissociation rates obtained from the single-molecule assay arefound to be consistent with results (k0 #1/sec in Ca2+ and #0.01/sec in Mg2+) known fromprevious solution-based assays [13].
4 Note, after we submitted this chapter, a similar version of the approach described here based on analysis of forcehistograms was published independently by Dudko, Hummer, and Szabo (in Proc. Natl. Acad. Sci.105: 15755–15760, 2008). Included in their paper are excellent applications to data from tests of nanopore unzipping of DNAhairpins and tests of unfolding a protein attached by flexible linkers to an atomic force microscope.
Analysis of Single-Molecule Force Measurements 581
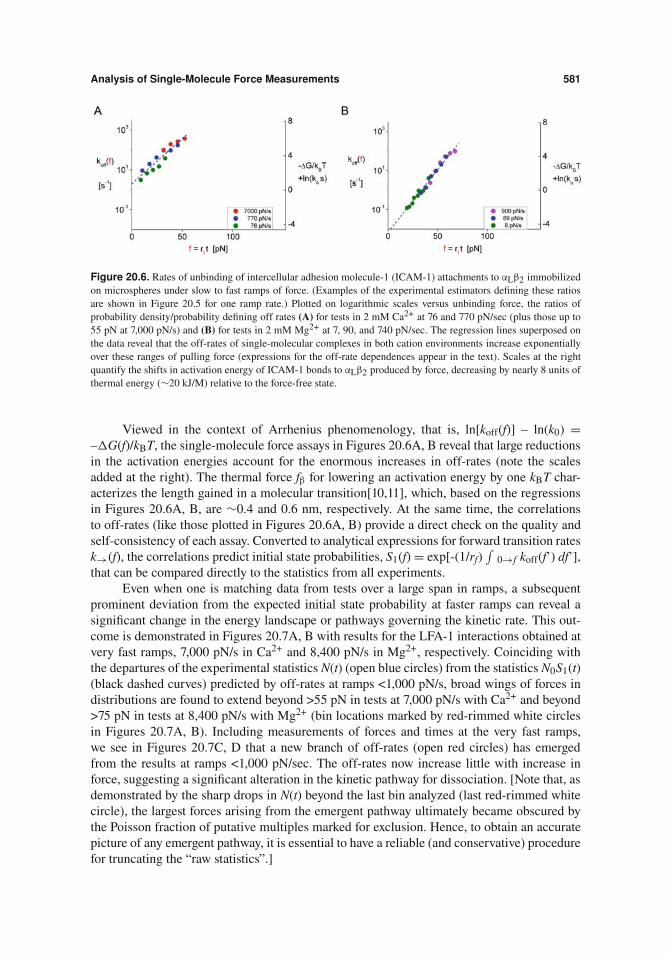
Figure 20.6. Rates of unbinding of intercellular adhesion molecule-1 (ICAM-1) attachments to #L"2 immobilizedon microspheres under slow to fast ramps of force. (Examples of the experimental estimators defining these ratiosare shown in Figure 20.5 for one ramp rate.) Plotted on logarithmic scales versus unbinding force, the ratios ofprobability density/probability defining off rates (A) for tests in 2 mM Ca2+ at 76 and 770 pN/sec (plus those up to55 pN at 7,000 pN/s) and (B) for tests in 2 mM Mg2+ at 7, 90, and 740 pN/sec. The regression lines superposed onthe data reveal that the off-rates of single-molecular complexes in both cation environments increase exponentiallyover these ranges of pulling force (expressions for the off-rate dependences appear in the text). Scales at the rightquantify the shifts in activation energy of ICAM-1 bonds to #L"2 produced by force, decreasing by nearly 8 units ofthermal energy (#20 kJ/M) relative to the force-free state.
Viewed in the context of Arrhenius phenomenology, that is, ln[koff(f)] – ln(k0) =–!G(f)/kBT, the single-molecule force assays in Figures 20.6A, B reveal that large reductionsin the activation energies account for the enormous increases in off-rates (note the scalesadded at the right). The thermal force f" for lowering an activation energy by one kBT char-acterizes the length gained in a molecular transition[10,11], which, based on the regressionsin Figures 20.6A, B, are #0.4 and 0.6 nm, respectively. At the same time, the correlationsto off-rates (like those plotted in Figures 20.6A, B) provide a direct check on the quality andself-consistency of each assay. Converted to analytical expressions for forward transition ratesk!(f), the correlations predict initial state probabilities, S1(f) = exp[-(1/rf)
!0!f koff(f’) df’],
that can be compared directly to the statistics from all experiments.Even when one is matching data from tests over a large span in ramps, a subsequent
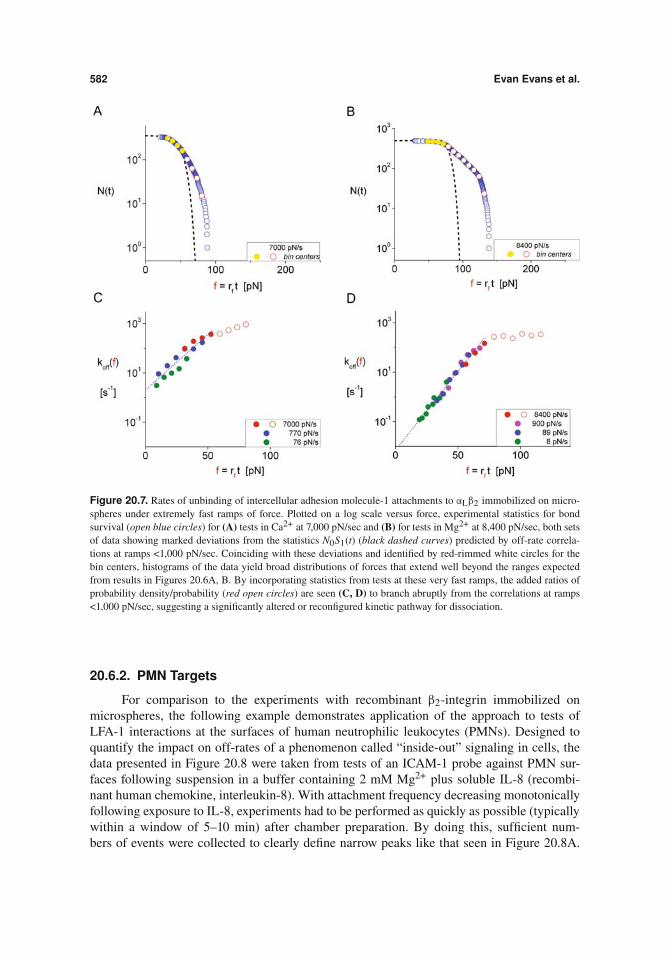
prominent deviation from the expected initial state probability at faster ramps can reveal asignificant change in the energy landscape or pathways governing the kinetic rate. This out-come is demonstrated in Figures 20.7A, B with results for the LFA-1 interactions obtained atvery fast ramps, 7,000 pN/s in Ca2+ and 8,400 pN/s in Mg2+, respectively. Coinciding withthe departures of the experimental statistics N(t) (open blue circles) from the statistics N0S1(t)(black dashed curves) predicted by off-rates at ramps <1,000 pN/s, broad wings of forces indistributions are found to extend beyond >55 pN in tests at 7,000 pN/s with Ca2+ and beyond>75 pN in tests at 8,400 pN/s with Mg2+ (bin locations marked by red-rimmed white circlesin Figures 20.7A, B). Including measurements of forces and times at the very fast ramps,we see in Figures 20.7C, D that a new branch of off-rates (open red circles) has emergedfrom the results at ramps <1,000 pN/sec. The off-rates now increase little with increase inforce, suggesting a significant alteration in the kinetic pathway for dissociation. [Note that, asdemonstrated by the sharp drops in N(t) beyond the last bin analyzed (last red-rimmed whitecircle), the largest forces arising from the emergent pathway ultimately became obscured bythe Poisson fraction of putative multiples marked for exclusion. Hence, to obtain an accuratepicture of any emergent pathway, it is essential to have a reliable (and conservative) procedurefor truncating the “raw statistics”.]
582 Evan Evans et al.
Figure 20.7. Rates of unbinding of intercellular adhesion molecule-1 attachments to #L"2 immobilized on micro-spheres under extremely fast ramps of force. Plotted on a log scale versus force, experimental statistics for bondsurvival (open blue circles) for (A) tests in Ca2+ at 7,000 pN/sec and (B) for tests in Mg2+ at 8,400 pN/sec, both setsof data showing marked deviations from the statistics N0S1(t) (black dashed curves) predicted by off-rate correla-tions at ramps <1,000 pN/sec. Coinciding with these deviations and identified by red-rimmed white circles for thebin centers, histograms of the data yield broad distributions of forces that extend well beyond the ranges expectedfrom results in Figures 20.6A, B. By incorporating statistics from tests at these very fast ramps, the added ratios ofprobability density/probability (red open circles) are seen (C, D) to branch abruptly from the correlations at ramps<1,000 pN/sec, suggesting a significantly altered or reconfigured kinetic pathway for dissociation.
20.6.2. PMN Targets
For comparison to the experiments with recombinant "2-integrin immobilized onmicrospheres, the following example demonstrates application of the approach to tests ofLFA-1 interactions at the surfaces of human neutrophilic leukocytes (PMNs). Designed toquantify the impact on off-rates of a phenomenon called “inside-out” signaling in cells, thedata presented in Figure 20.8 were taken from tests of an ICAM-1 probe against PMN sur-faces following suspension in a buffer containing 2 mM Mg2+ plus soluble IL-8 (recombi-nant human chemokine, interleukin-8). With attachment frequency decreasing monotonicallyfollowing exposure to IL-8, experiments had to be performed as quickly as possible (typicallywithin a window of 5–10 min) after chamber preparation. By doing this, sufficient num-bers of events were collected to clearly define narrow peaks like that seen in Figure 20.8A.
Analysis of Single-Molecule Force Measurements 583
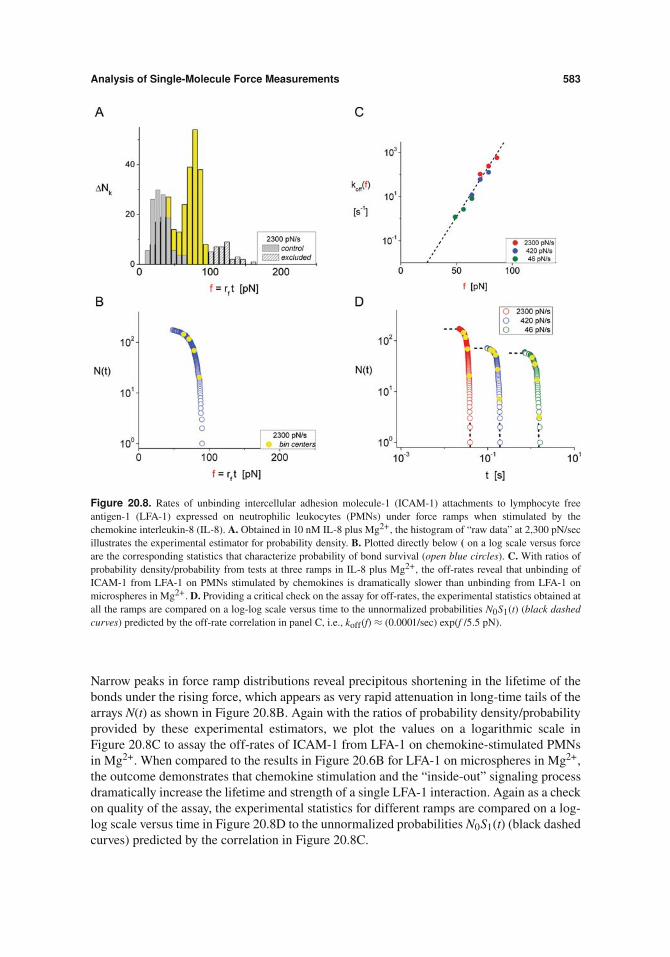
Figure 20.8. Rates of unbinding intercellular adhesion molecule-1 (ICAM-1) attachments to lymphocyte freeantigen-1 (LFA-1) expressed on neutrophilic leukocytes (PMNs) under force ramps when stimulated by thechemokine interleukin-8 (IL-8). A. Obtained in 10 nM IL-8 plus Mg2+, the histogram of “raw data” at 2,300 pN/secillustrates the experimental estimator for probability density. B. Plotted directly below ( on a log scale versus forceare the corresponding statistics that characterize probability of bond survival (open blue circles). C. With ratios ofprobability density/probability from tests at three ramps in IL-8 plus Mg2+, the off-rates reveal that unbinding ofICAM-1 from LFA-1 on PMNs stimulated by chemokines is dramatically slower than unbinding from LFA-1 onmicrospheres in Mg2+. D. Providing a critical check on the assay for off-rates, the experimental statistics obtained atall the ramps are compared on a log-log scale versus time to the unnormalized probabilities N0S1(t) (black dashedcurves) predicted by the off-rate correlation in panel C, i.e., koff(f) " (0.0001/sec) exp(f /5.5 pN).
Narrow peaks in force ramp distributions reveal precipitous shortening in the lifetime of thebonds under the rising force, which appears as very rapid attenuation in long-time tails of thearrays N(t) as shown in Figure 20.8B. Again with the ratios of probability density/probabilityprovided by these experimental estimators, we plot the values on a logarithmic scale inFigure 20.8C to assay the off-rates of ICAM-1 from LFA-1 on chemokine-stimulated PMNsin Mg2+. When compared to the results in Figure 20.6B for LFA-1 on microspheres in Mg2+,the outcome demonstrates that chemokine stimulation and the “inside-out” signaling processdramatically increase the lifetime and strength of a single LFA-1 interaction. Again as a checkon quality of the assay, the experimental statistics for different ramps are compared on a log-log scale versus time in Figure 20.8D to the unnormalized probabilities N0S1(t) (black dashedcurves) predicted by the correlation in Figure 20.8C.

584 Evan Evans et al.
20.7. Experimental Example: Unfolding/Refolding of a Polyproteinwith Force Ramps
Demonstrating the diversity of this approach, our final examples illustrate applicationsto unfolding and refolding of polyproteins. Created by Jane Clark at Cambridge University[14], the polyprotein in this example was an eight-mer sequence of four heterodimers: theR16 triple-helical repeat from chicken brain spectrin, followed by an I27 domain from car-diac muscle titin. Pulling on these polyproteins with an AFM, the creators showed that thespectrin triple-helical repeats unfold at forces between #30 and 50 pN under pulling speedsin a range from #1–4 $ 103 nm/sec [14]. Yet, as expected from earlier studies (see referencesin Ref. 15), the I27 domains remain tightly folded until several-times larger forces are reached(#150–180 pN). Less well established in probe tests of weak domains like R16, the objec-tive here is to demonstrate a direct assay for rates of unfolding and refolding polyproteinsusing the experimental statistics and histograms of transitions obtained under ascending anddescending ramps of force, respectively.
To achieve the precision in force and time needed to quantify these kinetic rates, thepoly-R16/I27 construct was tested with two arrangements of a laser OTFP, one providingdata at frequencies of 1,500/sec for fast-pulling experiments (see Figure 20.2 and Ref. 3) andthe other providing data at slower frequencies of #200/sec but with subnanometer precisionin chain length displacements (see Figure 20.9 and Refs. 4 and 5). Tethered to glass tar-gets through linkages to a cysteine residue at the C-terminus, the polyprotein attachmentsin tests were obtained by capturing the polyhistidine residues at the N-terminus with ananti-His–linked OTFP microsphere. Illustrating the kinematics of unfolding and refoldingfour R16 domains, Figure 20.9 shows the changes in length (upper panel) of a single poly-R16/I27 protein produced by the cycle of positive–zero–negative force ramps seen in the lowerpanel.
20.7.1. Unfolding Kinetics
Examining unfolding first, we focus on forces obtained from traces showing one or moreunfolding events at two ramp rates (10 and 473 pN/sec). Unfortunately, when tested at the fastramp, preemptive failure of the noncovalent linkages left just over half of the traces showingonly one unfolding event, with the next significant population showing two unfolding events;taken together, the two types of traces accounted for nearly 90% of the results. Based onstatistics of the first unfolding events at 473 pN/sec, Figures 20.10A, B demonstrate the forcehistogram and the experimental statistics characterizing the fastest unfolding kinetics in theOTFP experiments. For more slowly unfolding kinetics, we use the forces for two unfoldingevents from experiments performed with the high-resolution instrument at the slow ramp10 pN/sec, where most traces contained more than two unfolding events. Under slow loading,longer times are needed to unfold domains and the events occur at lower forces. Finding ratiosof probability density/probability from both sets of data, we plot two assays for unfoldingrates on a logarithmic scale versus force in Figure 20.10C. As shown by gray dashed lines inFigure 20.10C, both assays correlate well with a common exponential dependence on force[i.e., #exp(f/2.8 pN)], separated by approximately twofold difference in the preexponentialfactors describing “spontaneous” unfolding rates. This shift is qualitatively consistent withthe different numbers of unfolding events treated in the two cases. However, not knowingthe total number of folded domains in the attachments prior to test, we can only estimate thefrequency for unfolding a single spectrin R-16 domain. Thus, assuming that four folded and

Analysis of Single-Molecule Force Measurements 585
Figure 20.9. Changes of length (blue traces, upper panel) produced in a single poly-R16/I27 protein by a sequenceof positive– zero–negative force ramps (red traces, lower panel). Performing repeated cycles of pulling and relax-ing attached chains parallel to the optical axis of an inverted microscope, the OTFP apparatus employed reflectioninterference contrast optics and unique image analysis software to measure displacements of the probe microspherewith subnanometer precision [4,5]. Centered well above the coverglass floor of a microchamber, the strength of thetrapping potential was varied by controlling the laser intensity. Because of the large distance to the trap center and thesoft confinement along the optical axis, the force history applied to the microsphere was unaffected by the increasesand decreases in length of the polyprotein, appearing only as extremely small blips in the red force trace. Correlatedto the length increases in unfolding (upward red arrow) and decreases in refolding (downward green arrow), sepa-rations between the black dashed curves are predicted by adding a length Lc # 37 nm at each step to the thermallyfluctuating contour length described by a “worm-like chain” with persistence length b # 0.7 nm while, at the sametime, substracting 5 nm to account for the folded domain.
noninteracting domains were present in each attachment, the correlation for first unfoldingevents in the fast ramp test (red closed circles, Figure 20.10D) implies an unfolding rate of0.009/sec ÷ 4 " 0.0023/sec for a single domain, which is close to results from solution-basedassays [16]. Again checking the quality and self -consistency of the assays, experimentalstatistics from both tests are compared on a log-log scale versus time in Figure 20.10D tothe unnormalized probabilities N0S1(t) (black dashed curves) predicted by the probability offolded domains, S1(t) = exp[–(1/rf)
!0!f kunfld(f’) df’], and the correlations to unfolding rates
at each ramp.
586 Evan Evans et al.
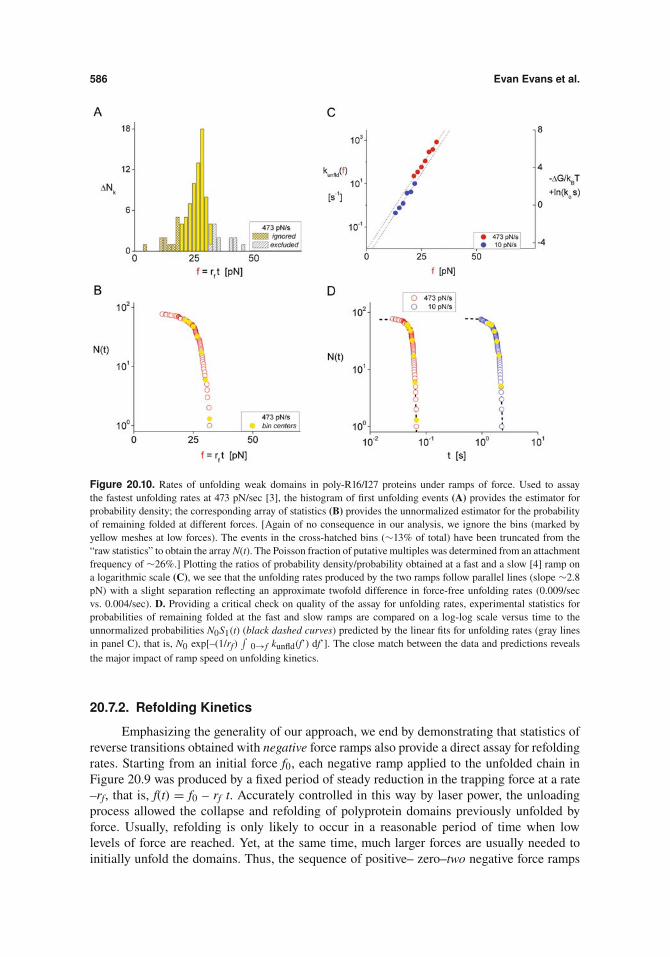
Figure 20.10. Rates of unfolding weak domains in poly-R16/I27 proteins under ramps of force. Used to assaythe fastest unfolding rates at 473 pN/sec [3], the histogram of first unfolding events (A) provides the estimator forprobability density; the corresponding array of statistics (B) provides the unnormalized estimator for the probabilityof remaining folded at different forces. [Again of no consequence in our analysis, we ignore the bins (marked byyellow meshes at low forces). The events in the cross-hatched bins (#13% of total) have been truncated from the“raw statistics” to obtain the array N(t). The Poisson fraction of putative multiples was determined from an attachmentfrequency of #26%.] Plotting the ratios of probability density/probability obtained at a fast and a slow [4] ramp ona logarithmic scale (C), we see that the unfolding rates produced by the two ramps follow parallel lines (slope #2.8pN) with a slight separation reflecting an approximate twofold difference in force-free unfolding rates (0.009/secvs. 0.004/sec). D. Providing a critical check on quality of the assay for unfolding rates, experimental statistics forprobabilities of remaining folded at the fast and slow ramps are compared on a log-log scale versus time to theunnormalized probabilities N0S1(t) (black dashed curves) predicted by the linear fits for unfolding rates (gray linesin panel C), that is, N0 exp[–(1/rf)
!0!f kunfld(f’) df’]. The close match between the data and predictions reveals
the major impact of ramp speed on unfolding kinetics.
20.7.2. Refolding Kinetics
Emphasizing the generality of our approach, we end by demonstrating that statistics ofreverse transitions obtained with negative force ramps also provide a direct assay for refoldingrates. Starting from an initial force f0, each negative ramp applied to the unfolded chain inFigure 20.9 was produced by a fixed period of steady reduction in the trapping force at a rate–rf, that is, f(t) = f0 – rf t. Accurately controlled in this way by laser power, the unloadingprocess allowed the collapse and refolding of polyprotein domains previously unfolded byforce. Usually, refolding is only likely to occur in a reasonable period of time when lowlevels of force are reached. Yet, at the same time, much larger forces are usually needed toinitially unfold the domains. Thus, the sequence of positive– zero–two negative force ramps

Analysis of Single-Molecule Force Measurements 587
was developed for the purpose of unfolding and refolding the R-16 domains, as illustrated inFigure 20.9.
In this example of refolding, we will use estimators for ratios of probability den-sity/probability that characterize refolding from the level “2” to “1” identified by the labelsabove black dotted lines sketched in Figure 20.9. As seen throughout the slow negative rampin Figure 20.9, transient up/down jumps appear along the length trace at all levels. Sum-marized by histograms in Figure 20.11A for unloading at –0.37 pN/s, the downward refold-ing events from a state of two to one unfolded domain (“2>1”) appear as yellow bins, theintermittent-upward unfolding events returning to two unfolded domains (“2<1”) as bluebins, and the downward refolding events from three to two unfolded domains (“3>2”) asred bins. [The histrogram (“3<2”) containing a few transient returns to the state of threeunfolded domains is left out of Figure 20.11A for clarity.] Careful analysis (4) of the down/upjumps (e.g. “3<2” and “2<1”) has revealed that refolding R-16 domains involves a long-lived metastable intermediate (mean lifetime #0.3 s). Although complicated by the multi-level dynamics, we show that approximating the refolding process as a two-state transitionprovides a lower bound to the rates of refolding. As such, the statistical array N(f) for refold-ing from “2>1” plotted in Figure 20.11B becomes the un-normalized estimator for probabilityof two unfolded domains, which diminishes monotonically with increase in time or equiva-lently decrease in force. Using the arrays N(f) and histograms of transitions (“2>1”) obtainedwith three negative ramps, we have plotted values (closed red, green, blue circles) of theapproximation for ratios of probability density/probability on a logarithmic scale as a func-tion of force squared (f 2/kBT) and on a linear scale of rate versus force in Figure 20.11D.The estimates of refolding rates for the three negative ramps follow a negatively sloped linewith a zero force intercept implying a spontaneous refolding rate of #400/s from a state oftwo unfolded domains. Also plotted in Figure 20.11B is the un-normalized probability “NS2” derived from summation of all transitions to/from level “2” at –0.37 pN/s. Obtainingun-normalized probabilities in this way for each negative force ramp (details to appear else-where), and computing the true estimators for probability density/probability, the outcome(red dotted lines in Figures 20.11C, D) reveals that refolding actually occurs at much fasterrates because of the transitions to/from the intervening metastable state. As indicated by thetrue estimators for probability density/probability (open red circles) from the fast unloadingrate of –1.36 pN/s, the true refolding rates and the two-state approximation begin to convergewhen refolding rates greatly exceed the rate of transient unfolding from the metastable state.The reason for correlating the results to f 2/kBT is that the unfolded domains are very floppyat low forces, and thus the energetics governing changes of end-to-end length is described bya harmonic potential [#– f 2/(2!chain)]. Also following from polymer physics, the spring con-stant of the floppy chain !chain approximately equals the spring constant for a single unfoldeddomain !unfld divided by the number of unfolded domains, !chain " !unfld /nunfld. Hence, theactivation energy for refolding one domain is expected to be augmented by the difference inelastic energy required to shorten the chain, ![f 2/(2!chain)]/!n " f 2/(2!unfld). Correlatedto f 2/kBT, the slopes obtained from linear regressions to the approximate and true refoldingrates in Figure 20.11C yield apparent spring constants (0.22 and 0.28 pN/nm respectively)that characterize the apparent harmonic-energy barrier. These slopes bracket the harmonicstiffness, 3kBT/(2bLc) " 0.236 pN/nm, based on persistence length (b # 0.7 nm) and contourlength (Lc # 37 nm) used to match the force-distance response of the poly protein with all fourR-16 domains unfolded. Converting the refolding kinetics in Figure 20.11C to a linear-linearscale, Figure 20.11D demonstrates the major suppression of refolding kinetics that accompa-nies pulling force.
588 Evan Evans et al.
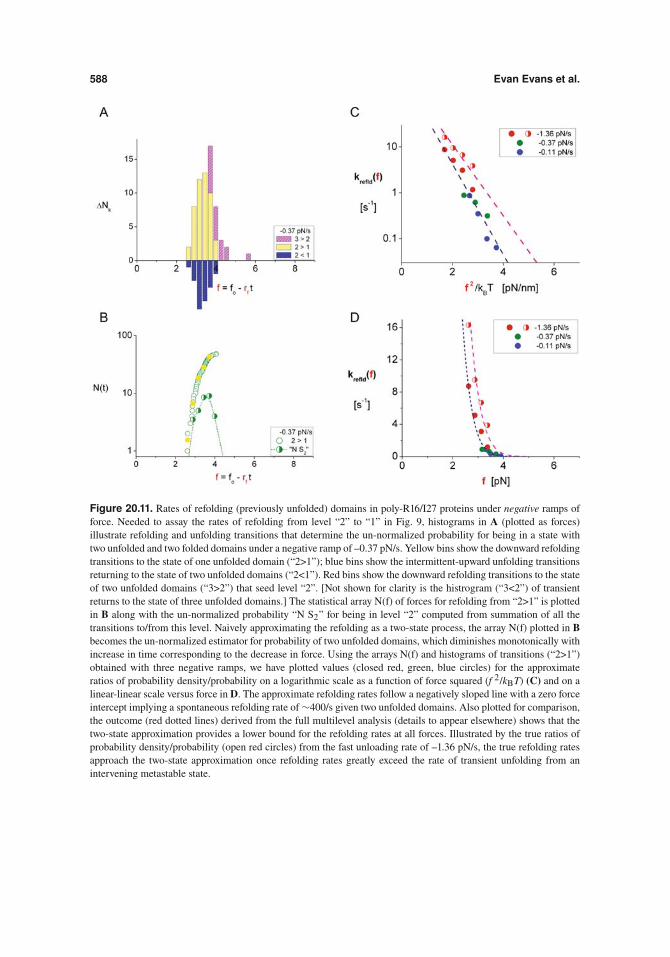
Figure 20.11. Rates of refolding (previously unfolded) domains in poly-R16/I27 proteins under negative ramps offorce. Needed to assay the rates of refolding from level “2” to “1” in Fig. 9, histograms in A (plotted as forces)illustrate refolding and unfolding transitions that determine the un-normalized probability for being in a state withtwo unfolded and two folded domains under a negative ramp of –0.37 pN/s. Yellow bins show the downward refoldingtransitions to the state of one unfolded domain (“2>1”); blue bins show the intermittent-upward unfolding transitionsreturning to the state of two unfolded domains (“2<1”). Red bins show the downward refolding transitions to the stateof two unfolded domains (“3>2”) that seed level “2”. [Not shown for clarity is the histrogram (“3<2”) of transientreturns to the state of three unfolded domains.] The statistical array N(f) of forces for refolding from “2>1” is plottedin B along with the un-normalized probability “N S2” for being in level “2” computed from summation of all thetransitions to/from this level. Naively approximating the refolding as a two-state process, the array N(f) plotted in Bbecomes the un-normalized estimator for probability of two unfolded domains, which diminishes monotonically withincrease in time corresponding to the decrease in force. Using the arrays N(f) and histograms of transitions (“2>1”)obtained with three negative ramps, we have plotted values (closed red, green, blue circles) for the approximateratios of probability density/probability on a logarithmic scale as a function of force squared (f 2/kBT) (C) and on alinear-linear scale versus force in D. The approximate refolding rates follow a negatively sloped line with a zero forceintercept implying a spontaneous refolding rate of #400/s given two unfolded domains. Also plotted for comparison,the outcome (red dotted lines) derived from the full multilevel analysis (details to appear elsewhere) shows that thetwo-state approximation provides a lower bound for the refolding rates at all forces. Illustrated by the true ratios ofprobability density/probability (open red circles) from the fast unloading rate of –1.36 pN/s, the true refolding ratesapproach the two-state approximation once refolding rates greatly exceed the rate of transient unfolding from anintervening metastable state.

Analysis of Single-Molecule Force Measurements 589
Acknowledgment
This work was supported by National Institutes of Health grants HL65333 andHL31579.
References
1. Evans E, Ritchie K, Merkel R (1995) Sensitive force technique to probe molecular adhesion and structurallinkages at biological interfaces. Biophys. J. 68: 2580–2587.
2. Evans E, Heinrich V, Leung A, Kinoshita K (2005) Nano-to-micro scale dynamics of P-selectin detachmentfrom leukocyte interfaces: I. Membrane separation from the cytoskeleton. Biophys. J. 88: 2288–2298.
3. Halvorsen KA (2007) Probing weak single molecule interactions: development and demonstration of a newinstrument. PhD dissertation, College of Engineering, Boston University, Boston MA.
4. Wong WP (2006) Exploring single-molecule interactions through 3D optical trapping and tracking: from ther-mal noise to protein refolding. PhD dissertation, Department of Physics, Harvard University, Cambridge MA.
5. Heinrich V, Wong WP, Halvorsen K, Evans E (2008) Imaging biomolecular interactions by fast three-dimensional tracking of laser-confined carrier particles. Langmuir 24: 1194–1203.
6. Williams P, Evans E (2002) In Physics of Bio-Molecules and Cells, Les Houches: Ecoles d’Ete de PhysiqueTheorique, Vol. 75 (Springer, New York), pp. 186–203.
7. Lupher ML Jr, Harris EA, Beals CR, Sui L-M, Liddington RC, Staunton DE (2001) Cellular activation ofleukocyte function-associated antigen-1 and its affinity are regulated at the I domain allosteric site. J. Immunol.167: 1431–1439.
8. Beals CR, Edwards AC, Gottschalk RJ, Kuijpers TW, Staunton DE (2001) CD18 activation epitopes induced byleukocyte activation. J. Immunol. 167: 6113–6122.
9. Huth JR, Olejniczak ET, Mendoza R, Liang H, Harris EA, Lupher ML Jr., Wilson AE, Fesik SW, StauntonDE (2000) NMR and mutagenesis evidence for an I domain allosteric site that regulates lymphocyte function-associated antigen 1 ligand binding. Proc. Natl. Acad. Sci. USA 97: 5231–5236.
10. Evans E, Ritchie K (1997) Dynamic strength of molecular adhesion bonds. Biophys. J. 72: 1541–1555.11. Evans E (2001) Probing the relation between force – lifetime – and chemistry in single molecular bonds. Annu.
Rev. Biophys. Biomol. Struct. 30: 105–128.12. Evans E, Williams P (2002) In Physics of Bio-Molecules and Cells. Les Houches: Ecoles d’Ete de Physique
Theorique, Vol. 75 (Springer, New York), pp. 145–185.13. Labadia ME, Jeanfavre DD, Caviness GO, Morelock MM (1998) Molecular regulation of the interaction
between leukocyte function-associated antigen-1 and soluble ICAM-1 by divalent metal cations. J. Immunol.161: 836–842.
14. Randles LG, Rounsevell RWS, Clarke J (2007) Spectrin domains lose cooperativity in forced unfolding. Bio-phys. J. 92: 571–577.
15. Forman JR, Clarke J (2007) Mechanical unfolding of proteins: insights into biology, structure and folding. Curr.Opin. Struct. Biol. 17: 58–66.
16. Scott KA, Batey S, Hootan KA, Clarke J (2004) The folding of spectrin domains I: Wild-type domains have thesame stability but very different kinetic properties. J. Mol. Biol. 344: 195–205.