Embed Size (px)
Citation preview

Self-serving attribution bias and CEO turnover:
Evidence from CEO interviews on CNBC
Y. Han (Andy) Kim1
Nanyang Business School, Singapore
November 25, 2011
Abstract
Self-serving attribution bias (SAB, hereafter) is a type of misattribution bias in which CEOs attribute the outperformance of the company to their own abilities, and underperformance of the company to bad luck or the economy. Using the transcripts of CEO interviews on CNBC, we find that the stock market response to the interviews of CEOs with self-referencing behavior is negative. Moreover, the CEOs with SAB are more likely to be fired and more sensitively to performance, especially if the governance is stronger. We also find that the stock market response to the announcement of forced turnovers of CEOs with SAB are significantly more positive by up to 9.7% over the event window of [-1,1] days. While we find the negative tone of the interviewing journalists increases the likelihood of forced CEO turnover and increases the turnover-performance sensitivity, the correlation between turnover and SAB is robust.
Keywords: Self-serving attribution bias, overconfidence, CEO turnover, investment cash flow sensitivity, CNBC, media, corporate governance
JEL classification: G30
1 Assistant Professor of Finance at Nanyang Business School, NTU, Singapore. [email protected], +65-6790-4639. I thank David Denis, David Hirshleifer, Ralph Koijen, Dirk Jenter, Jingoo Kang, Jun-Koo Kang, Feng Li, and Felix Meschke for insightful comments and suggestions. I also thank the Start-Up Grant of NTU (grant number:M58010013) that was used to purchase the viewership data from Nielsen Media Company. We also appreciate the excellent research assistance of Young Jae Choi, Young Ok Kwon, Youn Joo Choi, Yu Bo, Xin Kun Kuah, and Tan Chong It. All errors are mine.

1
I. Introduction
Self-serving attribution bias (SAB, hereafter) is a type of misattribution bias in which
CEOs attribute the outperformance of the company to their own abilities, and underperformance
of the company to bad luck or the economy (Miller and Ross, (1975)). Self-serving attribution
bias is an important conduit that leads people to become overconfident by attributing their
successes to internal factors, such as personal abilities, and their failures to external factors, such
as luck (Billett and Qian (2008); Daniel, Hirshleifer, and Subrahmanyam (2001); Gervais and
Odean (2001); Hirshleifer (2001); Libby and Rennekamp (2011)). Researchers have found that
overconfident CEOs tend to overinvest in projects because of their overestimation of their own
ability to generate future returns (Malmendier and Tate (2005)) and that overconfident CEOs
tend to overpay for acquisitions (Malmendier and Tate (2008)). Given that CEOs with SAB are
more likely to be overconfident, how do investors in the stock market respond when the CEO is
revealed to have SAB in his/her interviews on influential financial media, such as CNBC? We
hypothesize and find that CEO interviews where the CEO speaks more self-referencing phrases
receive significantly lower abnormal returns.
Once the shareholders learn that their CEO has SAB, it might be optimal for the
shareholders to remove the overconfident CEOs with to prevent future value destruction.
However, the relationship between CEO overconfidence and firm value is not uniform. Given
that the CEO is risk averse and his/her wealth is not diversified, a rational CEO is predicted to be
too conservative in his/her corporate decisions to maximize shareholder value (Jensen and
Meckling (1976)). In contrast, since an overconfident CEO (the CEO with SAB) would
overestimate his/her ability to deliver the result, a moderately overconfident CEO’s corporate
2
decisions would be less conservative and closer to first best solution (Gervais, Heaton, and
Odean (2011)). Consequently, researchers have found that excessively overconfident CEOs are
more likely to be fired, while moderately optimistic CEOs are not (Campbell, Gallmeyer,
Johnson, Rutherford, and Stanley (2011); Goel and Thakor (2008)). Also, Gervais, Heaton, and
Odean (2011) argue that optimal CEO incentives would be more sensitive to performance if the
CEO is extremely overconfident. Consistent with the prediction, we find that CEOs with SAB
are more likely to be fired. We also find that turnover of CEO with SAB is more sensitive to
performance, especially when the governance is stronger, such as after Sarbanes Oxley Act of
2002.
We measure the self-referencing behavior and the SAB of CEOs using transcripts of
6,931 CEO interviews on CNBC from 1997 to 2006 as in Kim and Meschke (2011). CEO
interviews on financial media are close to the ideal setting for this research: the journalist (show
host) frequently asks about the firm’s past performance and the CEO answers by attributing the
firm’s success to specific causes. Although many CEOs must go through interview preparation
supported by the companies’ Public Relations Division, the unobserved effect of PR training
would only add noise to our empirical study and bias against finding the results. Moreover,
analyzing the linguistic content of the spoken language of the CEO enables us to estimate cross-
sectional variation in the psychological bias of the CEOs, namely the SAB.
We use the computational linguistic technique in Li (2010), where he measures the SAB
using the management discussion and analyses (MD&A) sections of annual reports of public US
public companies. We also use the Linguistic Inquiry and Word Count (LIWC) dictionary.
LIWC is one of the most widely used text analysis software developed by James W. Pennebaker,
Roger J. Booth, and Martha E. Francis. We first identify the “causal” sentences from the CEOs’

3
words in the transcripts. We capture whether the singular and plural first-person pronouns (the
22 words in LWIC dictionary under “I” and “We” categories, such as I, me, my, we, our, and us)
are used in the sentences, and count it as “causal_we.” Equivalently, we capture whether second-
or third-person references (the 47 words in LWIC dictionary under “You,” “SheHe,” and “They”
categories, such as you, your, they, and their), including “competitor(s),” “industry,” or
“economy,” are used in the causal sentences, and count them as “causal_other.” For each
interview, “causal_we” minus “causal_other” divided by the total word count of the CEO is
defined as the measure of self-referencing.
We find that the investor response to self-referencing in CEO interviews is significantly
negative and permanent. Kim and Meschke (2011) find that CEO interviews on CNBC on
average result in the transitory run-up and reversal of the stock price because the CEO cannot
release any material information about economic fundamentals of the firm in the financial
television interview. Our further analysis of spline regressions clarify that the negative response
to self-referencing words of CEO is concentrated only on the top quartile of self-referencing
CEOs only. Our test result is consistent with the theoretical prediction by Campbell, Gallmeyer,
Johnson, Rutherford, and Stanley (2011) that shareholders do not like CEOs with extreme
overconfidence.
Li (2010) is the most closely related paper to ours in that he studies the relationship
between SAB of CEOs and corporate financial decisions. By parsing the texts and analyzing the
causal sentences in the management discussions and analysis (MD&A) section of annual reports,
he measures CEOs’ SAB. He finds that CEOs with SAB tend to show symptoms of
overconfidence, such as having (1) issuing more forward-looking statements; (2) issuing

4
management earnings forecasts with positive biases; (3) higher investment-cash flow sensitivity;
(4) negative investor response to acquisitions; (5) higher leverage ratio; (6) more repurchases;
and (7) less dividend payouts. We also find that CEOs with SAB show higher investment cash-
flow sensitivity. What is unique to our study is that the language contents used is the direct
words of the CEO in response to the questions of the journalist. In contrast, Li’s (2010) research
is based on the MD&A, which may be written and edited by the financial reporting group of the
company. In addition, using hand-collected data of forced CEO turnovers of Execucomp firms
from 1993 to 2008, we uniquely link the SAB to the forced CEO turnover. Our results are
comparable to the results of Campbell, Gallmeyer, Johnson, Rutherford, and Stanley (2011) who
use the conventional executive option based overconfidence measure by Malmendier and Tate
(2005) in their CEO turnover model. What is unique to our finding is the larger turnover-
performance sensitivity for the CEOs with SAB, especially under better governance, which is a
test of Gervais, Heaton, and Odean (2011).
One may argue that the CEO may be rationally using his/her language tone in self-
serving manner when cornered by the journalists who interview them. Indeed, Dyck, Volchkova,
and Zingales (2008), Kuhnen and Niessen (2011) document significant impact of media on
corporate governance. Therefore, in the robustness check section, we test whether our
documented result is a spurious correlation because of omitting the variables about the
governance role of the media. Specifically, we use the measure of negative tone of the show
hosts and interact it with stock performance. As a result, we document significant governance
impact of media even in CEO turnover setting, which is a different contribution of this paper.
Still, we show that the correlation between SAB and CEO turnover is robust throughout the
specifications.

5
II. Data
The empirical research of this paper is based on two hand-collected databases: (1) CEO
interviews on CNBC from 1997 to 2006 as in Kim and Meschke (2011); and (2) CEO turnover
data from Execucomp from 1993 to 2008. The transcripts of CEO interviews and news articles
are collected from Factiva. We then merge each interview observation with stock price data from
the Center for Research in Securities Price (CRSP) and accounting data from Compustat by hand
matching the company name in the transcript and the company code in standard databases. To be
included in the sample, each CEO interview must have valid stock return data for all 120 trading
days of the estimation window [-150, -31] and 20 trading days of the event window [-10, +10].
Each transcript is downloaded in XML format. Since the transcripts have the names of the
speakers for each sentence, we first collect and compile the list of CEO names and anchor names.
Then we split each transcript into the words of the CEO and the words of the show host. For the
words of the CEOs, we parse further and measure “causal_we” and “causal_other” as discussed
in the introduction. Then we construct the “self-referencing” measure, which is defined as
follows:
_Causal_we – Causal_other
Viewership data is obtained from Nielsen Company. We obtain stock price related data
from CRSP and accounting related data from Compustat. We obtain institutional ownership
from the Thomson Financial 13F database, executive related data from Execucomp, short-sale
data from Reg-SHO database, and microstructure data from TAQ database. Appendix B shows
the definition of the variables used throughout the paper. The mean, standard deviation, median,

6
25th percentile and 75th percentile of all the variables used in the CAR regressions of CEO
interviews are shown in Panel A of Table 1. The summary statistics of variables used in the rest
of the regressions are shown in Panel B of Table 1.
[Table 1 about here]
III. Results
We first examine whether the stock market investors respond negatively to the CNBC
interviews of the CEOs with a high self-referencing tendency. We replicate the same regression
as for Table 5 in Kim and Meschke (2011) and add one explanatory variable of the self-
attribution measure.
[Table 2 about here]
The results in Panel A of Table 2 suggest that investors respond negatively to interviews
of CEOs with self-referencing behavior on the day of the interview. One standard deviation
higher self-referencing measure (0.001939) is associated with 20 basis points lower CAR[0]
(significant at the 1% level). The sample average CEO word count is 693 words, and the
average self-referencing measure is 0.0004, which implies that there is a 0.28 incidence of net
self-referencing in a typical CEO interview. One standard deviation higher manifestation of self-
referencing implies 1.34+0.282=1.62 incidences of self-referencing. The effect is somewhat
persistent, because the coefficients of the self-referencing on CAR[1,2] regressions are also
negative and significant at the 5% level. A one standard deviation higher self-referencing
measure is associated with -23 basis points lower CAR[1,2]. The negative response on the day

7
of the interview is permanent. Therefore, we conclude that investors do not like to see CEOs
with self-serving attribution bias. The remaining results are consistent with what is documented
in Kim and Meschke (2011). The investor response to a CEO interview is positively correlated
with the attention on the day of the interview, but negatively correlated on the days after the
interview. The investor response to a CEO interview is positively correlated with the individual
investors’ order imbalance and negatively correlated with the fraction of short-selling volume.
Some readers may wonder how the supposedly non-informative CEO interviews could
provide any information such that the price response to CEOs with self-referencing words could
have negative and permanent. However, the non-informative character of the CEO interviews on
CNBC is specifically about non-contaminated CEO interviews only. Also, the transitory pricing
pressure and reversal is the average pricing pattern. Moreover, Campbell, Gallmeyer, Johnson,
Rutherford, and Stanley (2011) find that shareholders expel the CEOs with extremely high
overconfidence. Therefore, it may be that the price response is permanently negative only for
the CEOs with extremely high degree of self-referencing in the interview. To identify, we run
spline regressions. Specifically, we take the 75th percentile of self-referencing measure as the
splitting point and construct dummy variables that are 1{Self-referencing>75th percentile} and
1{Self-referencing≤75th percentile} then interact these dummy variables with the self-referencing
measure. We report the regression result in Panel B of Table 3, which confirms that the negative
price response to interview is concentrated on the extreme high self-referencing CEOs. For
majority of the CEOs, the price response related to self-referencing is indistinguishable from
zero.

8
In the subsection above, we find evidence that investors do not welcome CEO self-
referencing behavior in media interview settings. Given that CEOs can choose not to show up
for media interviews when the company is hit by negative news, we can interpret the self-
referencing in media interviews as attributing good performance to himself/herself or the
company. With our evidence that investors dislike the SAB of CEOs, we next investigate
whether CEOs with SAB are more likely to be fired, ceteris paribus. Campbell, Gallmeyer,
Johnson, Rutherford, and Stanley (2011) find that overconfident CEOs as well as diffident CEOs
are significantly more likely to be fired, because overconfident CEOs are more likely to waste
money on negative NPV projects, by overestimating the payoffs of the projects. SAB works as a
mechanism to nurture and strengthen overconfidence (Li (2010)). Therefore, we hypothesize that
CEOs with SAB are more likely to be fired. Gervais, Heaton, and Odean (2011) theoretically
predicts that for excessively overconfident managers, it is optimal for the firm to increase the
performance sensitivity of the CEO incentives to gain from shifting risk to the CEO. Therefore,
we test whether the CEO turnover is more sensitive to performance if the CEO has SAB.
Furthermore, if we divide the sample into better-governed firms and worse governed firms, it
would be the better-governed firms that shows higher turnover-performance sensitivity for CEOs
with SAB. We assume that corporate governance strength was enhanced after SOX, and we
assume that firms with higher institutional ownership have better governance.
The CEO turnover data is based on the Execucomp database. CEO turnover observations
over 1992~2001 are graciously provided by Dirk Jenter as in Jenter and Kanaan (2011). Data on
CEO turnover from 2002~2008 are hand collected using Factiva as in Kim and Kang (2011).
We also follow the classification rule of Parrino (1997) in classifying CEO turnover into either
forced or voluntary turnover, as is commonly followed in the literature (Bushman, Dai, and
9
Wang (2010); (2011); Campbell, Gallmeyer, Johnson, Rutherford, and Stanley (2011); Fich and
Shivdasani (2006); Jenter and Kanaan (2011); Kaplan and Minton (2011); Masulis, Wang, and
Xie (2011); and Parrino, Sias, and Starks (2003)). Appendix A describes the procedure in detail.
Following Adams and Ferreira (2009), we run a linear probability model of forced CEO turnover
with firm and year fixed effects. The linear probability model has an advantage over the logistic
model in the sense that (1) the latter often fails to incorporate firm fixed effects in their
maximum likelihood procedure, and (2) the interpretation of marginal effects of any interaction
terms in the latter model could be problematic as was pointed out by Ai and Norton (2003).
Following Li (2010), we construct a SAB measure by regressing the self-referencing measure on
firms’ abnormal stock market performance, which is measured by the alpha of the Fama-French
4 factor model, using market, size, book to market, and momentum factors (Carhart (1997);
Fama and French (1996)), over the estimation window of [-150,-31] trading days prior to CEO
interviews.
Our estimate of is 0.0273 with a t-statistic of 3.88. We find that CEOs with good
abnormal performance tend to attribute the good performance to themselves or their companies
as a whole. The SAB measure is constructed as follows:
1 1
We label a CEO as having SAB (1) if he/she shows abnormally high self-referencing
behavior in a CNBC interview when firm performance is good; and (2) if he/she shows
abnormally low self-referencing behavior in a CNBC interview when firm performance is bad.

10
For CEOs who gave multiple interviews in a given fiscal year, we take the SAB measure from
the most recent interview.
Following the literature on CEO turnover, we use the following control variables: (1)
One-year stock performance until the fiscal year end; (2) Return on assets, defined as operating
income before depreciation and amortization divided by total assets; (3) Idiosyncratic volatility,
measured as the root mean squared error of the monthly market model regression with the S&P
500 index; (4) Firm size, measured as the log of assets; (5) Retirement age dummy that is one
when the CEO age is in the range of 63 to 66; (6) High CEO ownership dummy that is one if the
stock ownership of the CEO is greater than 5%; (7) CEO tenure from Execucomp, which is
augmented by hand-collected information from Factiva; (8) Chairman CEO dummy that is one if
the CEO is the chairman of the board, which is obtained from the Risk Metrics database; (9)
Proportion of independent directors that is obtained from Risk Metrics; and (10) Dummy
variable that is one if the CEO had no CNBC interview in the given fiscal year.
[Table 3 about here]
In Table 3, we first run CEO turnover regressions for the firm years in Execucomp where
the CEO had a CNBC interview during the fiscal year. We also run regressions with the whole
sample of Execucomp firms from 1997 to 2006. If the CEO interview is missing for any firm
years, we assign the value of zero to 1{SAB} and assign the value of one to the 1{missing
CNBC interview}. We find that the CEOs with SAB are more likely to be fired, other things
being equal, which is consistent with Campbell, Gallmeyer, Johnson, Rutherford, and Stanley
(2011). CEOs that have SAB in the CNBC interview have a 1.5% higher probability of being
forced out. Given that the unconditional probability of being fired is 2.6%, the economic

11
magnitude is very large despite the fact that we use a linear probability model. We also find that
turnover-performance sensitivity is higher for the CEOs with SAB, which is consistent with the
prediction of Gervais, Heaton, and Odean (2011). Moreover, we find that the turnover-
performance sensitivity is disproportionately higher for the firms after SOX, which indicates that
better governed firms fire the overconfident CEOs more sensitively to the firm performance.
Next, we investigate the stock price response to the announcement of forced CEO
departures and test if the investors welcome the departure of the CEOs with SAB. Given that the
stock market response to the revelation of CEOs’ SAB through the media is negative and
significant, we predict that the investor response to the firing of CEOs with SAB would be
positive and significant. We use the Fama-French 4 factor (market, size, book to market, and
momentum) model as the asset-pricing model to generate the expected daily return. We set [-
150,-31] trading days relative to the first announcement date of a CEO turnover as the estimation
window. To determine the cleanest investor response to the CEO dismissal, we remove the CEO
turnovers that were confounded by major corporate events that were captured by our exhaustive
list from the databases. We start with 728 forced CEO turnovers from 1993 to 2008. The
contaminating events are mergers and acquisitions (SDC Platinum), earnings announcements
(IBES), restatements (GAO data) augmented by the restatement data used in Meschke and Kim
(2011) and Fahlenbrach, Low, and Stulz, (2010), and class action lawsuits (Stanford Lawsuit
Clearing House database). For the CEO dismissal announcements confounded by earnings
announcements and merger announcements, we remove the observations if the merger or
earnings announcements took place 15 calendar days before or after the CEO turnover
announcement date. We also follow stricter rules in removing the CEO dismissals that are
potentially associated with accounting restatements or class action lawsuits. If these events took

12
place two years before or after the CEO dismissal, we remove the CEO turnover observation.
Using this procedure, we are left with 373 forced CEO turnover observations. We first obtain
CAR[-1,1] of forced CEO turnover. Then we run multiple regressions as follows:
CAR 1,1 β β SAB β SAB Viewership β 1YrStkPerf β 1 Outsider
β log Assets β BEME β σ β NewsNegative
β 1 No CNBC interview ε
Where CAR[-1,1] is the cumulative abnormal return from one day prior to the CEO departure
announcement to one day after the event. 1{Outsider} is the dummy variable that is one if the
new CEO is an outsider. In studying the investor response to the announcement of forced CEO
turnover, narrowing it down to the perfectly non-confounded events is destined to be imperfect
because of the realistically limited databases the researchers have. Therefore, for the
unconfounded CEO turnover observations used in the regression, we control for the linguistic
tone of news articles about the company over the window of [-10,0] days to control for the
qualitative information that is not captured by the conventional databases that we utilize thus far.
We obtain all the news articles of the event set in Factiva, where the news sources are the Wall
Street Journal and the Dow Jones Newswires. A negative word count is done by referring to the
financial words dictionary by Loughran and McDonald (2011). Following Tetlock (2007, 2010),
we construct News Negative as the standardized measure of negativity in the linguistic tone of
the news articles as follows:
%

13
%∑ ∑ #
∑ ∑ #
We set the estimation window of news articles to be a one-year period that stops at eleven
calendar days prior to the event date. We divide the estimation window into non-overlapping
segments of 11 calendar days. Then, we obtain the %Negative for each segment, which is the
total count of negative words divided by total word count of the news articles in the segment.
is the average %Negative over the estimation window of a one-year period that stops at
eleven calendar days prior to the event date. Across all the segments, we then compute the mean
( ) and standard deviation ( ). For the unconfounded sample of forced CEO
turnover, we have 8,592 news articles over the estimation window and 590 news articles over the
event window.
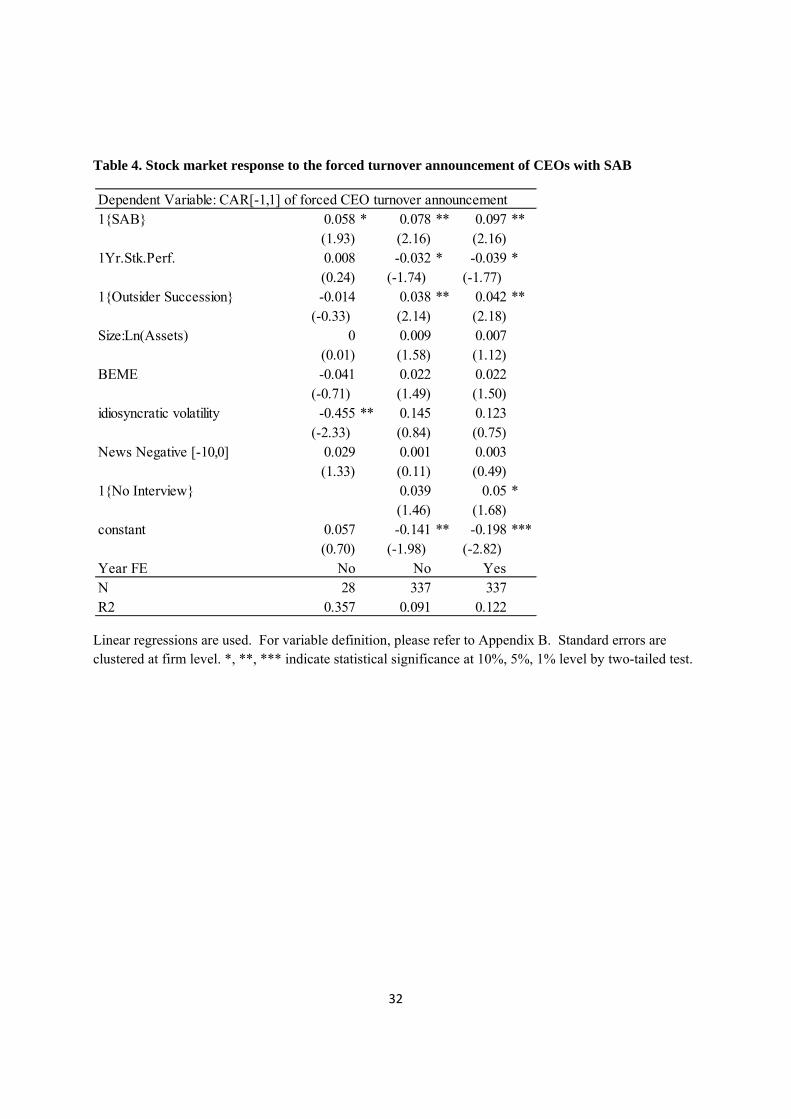
[Table 4 about here]
Table 4 shows the CAR regression result of forced CEO turnover. The results suggest
that investors welcome the dismissal of the CEO with SAB. The CAR[-1,1] is 7.8%~9.7%
higher depending on the specification with the t-statistic of 2.16. As was previously documented,
investor response to a CEO dismissal is negatively correlated with his/her prior performance and
is significantly positive if the successor is an outsider (Parrino (1997)).
Given that SAB fosters overconfidence, we find that investors in the stock market do not
particularly like the revelation of CEOs’ SAB in the media, and the investors tend to consistently
punish overconfident CEOs with SAB. We also examine whether the CEOs with SAB are more
likely to make their firms’ investments sensitive to cash flow because of previous studies’
findings. Malmendier and Tate (2005) find that overconfident CEOs are more likely to depend

14
heavily on internally generated cash flow for investments, instead of external capital markets,
because those CEOs are more optimistic about their investment projects than the investors in the
external capital market. Li (2010) also finds that firms with CEOs who show more SAB display
higher investment-cash flow sensitivity, because SAB is a trait that leads to overconfidence. We
test the same hypothesis by running the investment cash-flow sensitivity regressions, following
Malmendier and Tate (2005) using firm and year fixed effects. Table 5 indicates that, indeed,
CEOs with SAB tend to increase the investment cash-flow sensitivity of the firm. The
coefficient of the interaction between SAB and cash flow is positive and significant at the 1%
level.
[Table 5 about here]
One of the most important empirical testing ground of the investor response to the CEO’s
investment decision makings depending on the bias of the CEO is the acquisition announcements.
We obtain all the acquisition announcements that were completed from SDC Platinum over the
period of 1997~2006 where the deal value is at least 5 million dollars. Further restrictions
following Güner, Malmendier, and Tate (2008) are as follows: (1) more than 50% target shares
are acquired as a result; (2) the acquirer data has to be available in CRSP and Compustat; and (3)
exclude leveraged buyouts, recapitalization, self-tenders, subsidiary acquisition, spin-offs,
exchange offers, repurchases, minority stake purchases, privatizations, and remaining-interest
acquisitions are excluded. As a result, we have 9,031 acquisition announcements over the
sample period for the sample of firms that had CEO interviews on CNBC. For each acquisition
announcement, we match the maximum of SAB values (as well as maximum of self-serving
word counts) of CEO in the interviews during the fiscal year that ended before acquisition. Using

15
Fama-French 4 factor model, we compute the cumulative abnormal return over the [-1,1] trading
day window for each acquisition announcements and use it as the dependent variable in the
regression.
Our key explanatory variables are SAB, self-serving word count, and its square term. The
reason we provide the square term of self-serving word count is because theories by Campbell,
Gallmeyer, Johnson, Rutherford, and Stanley (2011), Gervais, Heaton, and Odean (2011) predict
that there is an optimal level of CEO overconfidence beyond which the firm value is destroyed.
Whereas SAB is simply a dummy variable (first three regressions), self-serving word count
enables (last three regressions) to capture a potential concave (hump shaped) relationship
between self-serving attribution bias and investor response to acquisition announcements. The
Then we follow the literature in providing the control variables such as dummy variable for
public targets, dummy variable for diversification, dummy variable for 100% cash deal, size of
the firm, and book-to-market. We also run regressions with industry fixed effects and year fixed
effects to control for potential omitted variable bias. The first and fourth regressions use 1 digit
SIC code in defining diversification merger. The second and fifth regressions use 2 digit SIC
code in defining diversification merger. The third and sixth regressions use 3 digit SIC code in
defining diversification merger. Since multiple acquisition announcements for the same firm
year are used in the sample as separate observations, we use clustered standard error at firm level
and year level using two dimension clustering technique by Petersen (2009).
[Table 6 about here]
The results in the first three columns of Table 6 indicate that investors welcome the
acquisition announcements by CEOs with SAB. This seems to be at odds with Li (2010) at first

16
glance, because he finds negative and significant coefficients of SAB variable in the similar
regressions. However, the theoretical arguments about overconfidence by Campbell, Gallmeyer,
Johnson, Rutherford, and Stanley (2011) predict that SAB (as a dynamic measure of
overconfidence) of the CEO up to a certain degree is preferable from the perspective of the
shareholders. The reason is that overconfident CEOs are more willing to take necessary risks
than their rational counterparts due to the overestimation of success probability in the projects by
overconfident CEO. In the last three regressions, therefore, replace the SAB dummy with the
self-referencing measure (continuous variable) and its square term to identify non-linear
relationship. We find a hump shaped relation between self-serving attribution bias and investor
response to acquisition announcements. The coefficient of the square term of self-serving word
count is statistically significant at one percent level. We reaffirm that shareholders welcome the
acquisition decision by overconfident CEOs up to a certain degree. However, we find that the
investors do not welcome acquisition decisions by extreme overconfident CEOs. This finding is
a new contribution to the literature. Malmendier and Tate (2008) identify an overconfident CEO
by defining as the CEO who held an option until the expiration even though the package was at
least 40% in-the-money entering its last year, and they find negative correlation between
overconfidence and investor response to acquisition announcements. Billet and Qian (2008)
document negative relation between CEO overconfidence and acquisition announcement
abnormal return, but they use a proxy for CEO overconfidence which is one if the acquisition
was a second or more deals in recent five years for the same CEO. Doukas and Petmezas (2007)
find similar results with Billet and Qian (2008) throughout merger waves and business cycles.
To the best of our knowledge, this is the first paper to document the concave relationship by
having a direct measure of self-attribution bias.
17
Robustness Check
Gurun (2011) finds that firms that has directors with media experience are more likely to
have significantly larger media coverage and more positive coverage. Also, Kim and Meschke
(2011) document that CNBC is more likely to interview the CEOs of larger firms and growth
firms. One may be concerned that the omitted variable such as book-to-market, which is highly
correlated with having CNBC interview, may also be correlated with the error term of the forced
turnover regression. Therefore, we include the book-to-market variable and run the same forced
turnover regression in Table 7. The results are robust.
[Table 7 about here]
Kuhnen and Niessen (2011) find that executive compensation is significantly reduced
when public opinion measured by the negative tone of the media coverage about executive
compensation is high, suggesting significant governance role of the media as in Dyck and
Zingales (2002) and Dyck, Volchkova, and Zingales (2008). In every CEO interview, there are
CNBC journalists working as the show hosts, i.e. the anchors. These journalists may bring
critical questions to the CEO to satisfy the needs of the viewers that are interested in the
company’s shareholder value, which would increase the viewership of the channel. On the same
line of thought, one may argue that the anchors’ negative language tone is actually affecting the
outcome of implicit incentive (threat of forced turnover), whereas CEOs may be only
strategically speaking in more self-serving manner to avoid a decrease in his or her market value
of human capital in the CEO labor market. To test this alternative hypothesis, we use the
negative tone of the interview hosts and hostesses, and the interaction term between the stock
performance and the negative tone of the anchors. The negativity measure is constructed as
18
follows: Across the entire interview sample, we compute the negative words spoken by the anchor
(interview host) and divide by the number of words by the anchor. Then across the interviews, we obtain
mean and standard deviation. Then we obtain standardized percentage of negative words. Then for the
firm year, we attribute the most recent interview’s value of standardized negative words for the firms that
had CNBC interview.
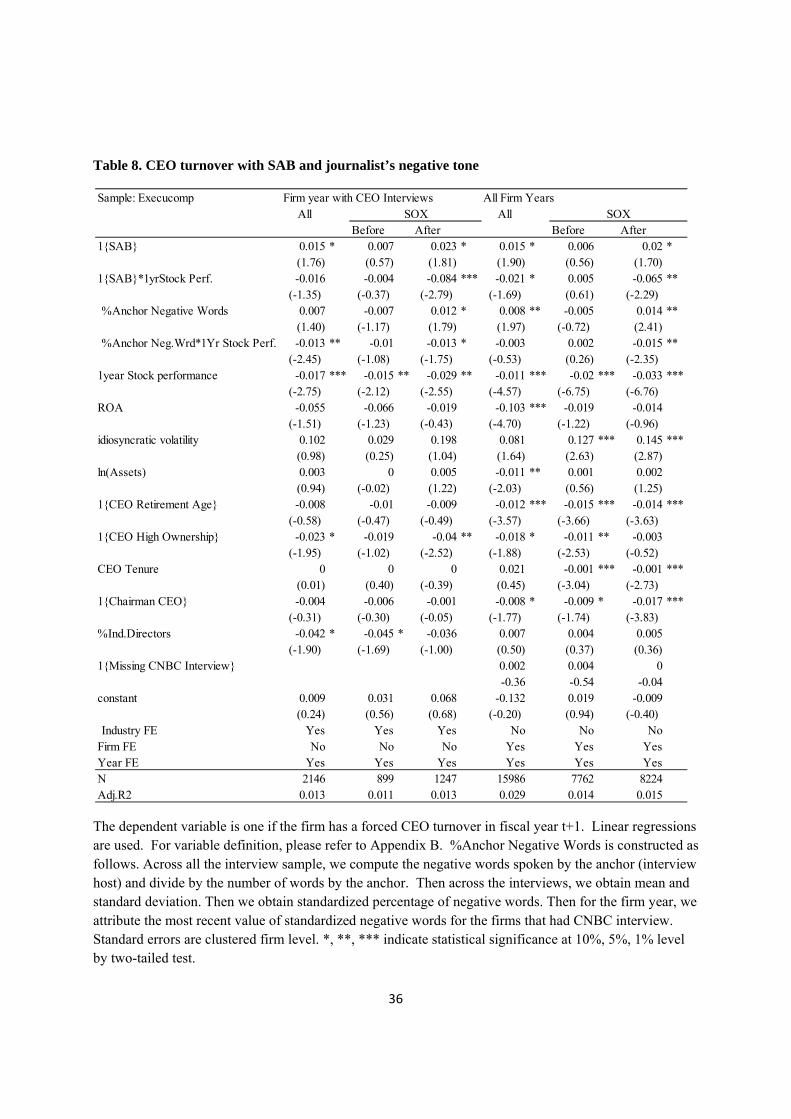
[Table 8 about here]
The result in Table 8 suggests that the positive correlation between SAB and forced turnover and
the higher turnover-performance sensitivity for the CEOs with SAB is robust to the inclusion of
journalists’ negative language tone. Thus, the result we document in this study is not a spurious
correlation coming from omitted variable bias. Moreover, we find significant governance impact of the
media even in CEO turnover setting, which is another contribution to the literature. We find that the
negative tone of the anchors increases the likelihood of forced CEO turnover. In addition, it appears that
the journalists’ negative tone makes the forced CEO turnover more sensitive to the firm performance,
especially after SOX.
One may question whether our SAB measure and self-referencing measures are capturing
the narcissism measure as in Chatterjee and Hambrick (2007). CEO narcissism measures how
much a CEO is obsessed with himself/herself in such a way that his/her words would be densely
populated with first-person singular pronouns, such as “I, my, me, mine, and myself” regardless
of the context of the CEO dialogue. Chatterjee and Hambrick’s measure of CEO narcissism is
the ratio of the count of first person singular pronouns and the count of total first person
pronouns in CEO’s interview transcript. More precisely, we refer to LIWC dictionary, and use

19
the 12 words that belong to “I” category as the first person singular pronouns2. We also use the
10 words that belong to “We” category as the first person plural pronouns3. We construct the
same measure using our CNBC interview scripts, and control for CEO narcissism in our
regressions for CEO interview response and CEO turnover.
[Table 9 about here]
Panel A of Table 9 is the CAR regression results surrounding the day of CEO interviews
as in Table 2, and shows no significant correlation between CEO’s narcissism and investor
response to his or her CNBC interviews. In Panel B, we include the self-referencing word
measures, and still find no significant coefficient for CEO narcissism. Chatterjee and Hambrick
(2007) find that CEO narcissism in and of itself does not have valuation implication, but that the
narcissistic CEOs pursue more attention drawing investment activities. Therefore, finding
narcissism of the CEO in CNBC interview may not have significant impact on price. In Panel C,
we run CEO turnover regressions as in Table 3, using CEO narcissism measure. The correlations
we document in Table 3 do not change. However, one interesting pattern emerges. Before SOX,
narcissistic CEOs were less likely to be fired, ceteris paribus, but after SOX, there is no
difference between narcissistic CEOs and non-narcissistic CEOs. Unlike overconfidence, there
is no economic theory that predicts a certain correlation between narcissism and forced CEO
turnover. However, even though it is somewhat ad-hoc, the result suggests that when
governance was poor, the narcissistic CEOs are less likely to be fired, even after controlling for
CEO power such as chairman duality and CEO ownership. In Panel D, we run CAR regressions
2 “I,” “Id,” “I’d,” “I’ll,” “I’m,” “Im,” “Ive,” “I’ve,” “me,” “mine,” “my,” and “myself” belong to the “I” category. 3 “our,” “ours,” “ourselves,” “us,” “we,” “we’d,” “we’ll,” “we’re,” “weve,” and “we’ve” belong to the “We” category. We exclude “lets,” and “let’s” from the dictionary.
20
based on the announcement of forced CEO turnovers as in Table 4. The result does not change,
and the coefficient of CEO narcissism is insignificant. Overall, we confirm that the results that
we document in this paper are not driven by narcissism, but by the self-serving attribution bias of
the CEO.
IV. Conclusion
Speech reflects the most dominant and consistent personality traits of an individual
(Chatterjee and Hambrick (2007)). As long as self-serving attribution bias is a personality trait of
a CEO, and as long as the transcripts of CEO interviews capture the spoken language of the
CEOs, our dataset enables us to directly quantify the self-serving attribution bias of the top
manager. With the novel dataset, we find that stock market investors do not welcome the CEOs
who excessively attribute the outperformance of the company to their own ability and the
underperformance of the company to bad luck or the economy. In addition, our hand-collected
CEO turnover data based on Execucomp enables us to find consistent results with the prediction
by Gervais, Heaton, and Odean (2011): CEOs with SAB are more likely to be fired sensitively to
performance, especially if the governance is stronger. CEO dismissal event study reveals that
the stock market response to the announcement of forced turnover of CEOs with SAB are
significantly more positive by up to 9.7% over the event window of [-1,1] days. We also find
inverse U-shaped relation between the stock market response to acquisition announcements and
the self-attribution bias of the CEO in CNBC interviews.
Given that SAB fosters overconfidence over time, our results have important governance
implications. Although shareholders prefer moderately overconfident CEOs due to their
21
willingness to take more risks with their psychological bias, if the bias is extreme, the
shareholders fire the CEO more frequently and sensitively to the firm performance. We also
document significant governance impact of financial media as in Kuhnen and Niessen (2011)
and Dyck, Volchkova, and Zingales (2008). The CEOs are more likely to be fired, and that,
more sensitively to firm performance, if the journalists’ language tones in the interview is more
negative.
Lastly, we add one more piece of evidence that computational linguistic technique
enables the investors in the financial market to identify overconfident CEOs by analyzing the
transcripts of CNBC interviews of the CEOs. As King (2011) reports, hedge funds are already
trading based on the sentiment captured from the transcripts of CEO interviews on CNBC. Our
paper suggests that these investors can now (1) have a better refinement of predicting forced
CEO turnover events; (2) better predict the pricing patterns on the day of CEO dismissal
announcement; and (3) better predict the pricing patterns around the acquisition announcements
through quantifying the degree of SAB of the interviewed CEOs.

22
Appendix A. Classifying forced versus voluntary CEO turnover following Parrino (1997)
For each turnover event, we search corresponding newspaper articles in Factiva. A succession is classified as forced if the news articles report that the CEO is fired, forced, ousted, or departed due to unspecified policy differences. For the remaining transitions, the CEO is considered to be forced out if the incumbent CEO is under the age of 60 and the news articles do not report the reason for the departure such as death, poor health, or accepting another position (elsewhere or within the firm). In addition, even though the CEO is said to have accepted a position outside the firm, if the firm is not a public company, but a private consulting business, the incidence is considered to be a forced turnover because the move is from a big public corporation (Execucomp firms are typically the top 1500 largest public firms in the US) to a smaller private company. However, moves to the federal or local government are not classified as forced. A ”retirement” announcement of a CEO younger than 60 is considered to be a forced turnover if the succession plan was not announced at least six months prior to the actual transition. Even for departures that were classified as forced, we reclassify them as voluntary if the departure is due to some undisclosed personal or business reasons that are unrelated to the firm’s activities. In total, we find 738 forced turnovers and 2161 voluntary turnovers over the sample period.

23
Appendix B. Variable Definition
Self referencing is measured as follows: From the CNBC interview scripts, we narrow them down to only the words spoken by the CEOs. We identify causal sentences where CEO said “because” or “hence.” For the sentences with “because,” we search whether first person pronouns, e.g. “we” or “I”, were spoken subsequently. For sentences with “hence,” we search whether first person pronouns were spoken in the previous sentence. If we identify these pronouns , we count it as one case of self-referencing (“causal_we”). We do the same exercise to find the cases of referencing others in causal sentences by using the list of words in the LWIC (Linguistic Inquiry and Word Count) dictionary by Pennebaker, Booth, and Francis under “You” “SheHe” and “They” following Li (2010). In addition, we use “economy,” “industry,” and “competitor(s)” as the third-person pronoun category, because attributing poor performance of the company to industry competitors and the economy would be a manifestation of self-serving attribution bias. If we identify these words, we count it as one case of other-referencing (causal_other). For each interview script, we count the number of words by the CEO and measure the net self referencing using the following definition:
_Causal_we – Causal_other
Viewership is the viewership of CNBC from the Nielsen Company, and is given in million people units. Institutional ownership is obtained from the Thomson Financial 13F database.
Average share turnover is the average number of shares traded divided by the total number of shares outstanding over the estimation window of [-150, -31] trading days before the interview.
Illiquidity is the mean adjusted illiquidity measure by Amihud (2002). For each trading day, we take the absolute value of the return divided by the total dollar volume of the stock. Then, over the one-year period prior to the interview, we take the average illiquidity of the stock and divide it by the average of the illiquidity measure of all the stocks in the CRSP universe over the same period.
Firm age is the year of the interview minus the minimum of two: the first year that the company appeared in Compustat or the first year the company appeared in CRSP.
Ln(BEME+1) is the natural log of the book to market of the firm prior to the interview plus one.
Ln(ME) is the natural log of the market value of equity as of the fiscal year end prior to the interview.
Abnormal small order imbalance is the order imbalance of small trades on the day of the interview minus the average order imbalance of small trades over the estimation window of the [-80,-11] trading day window. Small order imbalance is the dollar volume of buyer-initiated trades minus seller-initiated trades divided by the aggregated dollar volume of trades whose order signs are determined using the Lee-Ready (1991) algorithm. Small trade size group is trades with a dollar volume of less than or equal to $5,000 in 1991 real US dollars.
Fraction of short volume is the short selling volume in the Reg SHO database divided by the total trading volume on the day of the interview.

24
1{Laughter} is a dummy variable that is one if any of the speakers in the interview laughed during the interview. The laughter is captured in the transcript as “(laughter), (laughs), or (laughing).” CEO (Host)
Word Count is the count of the words spoken by the CEO (Host) in the transcript.
CEO (Host) Hesitate is the count of hesitating words of the CEO (Host) in the transcript that are recorded as “--,” “……,” “(unintelligible),” or “(inaudible)” divided by the total word count of the CEO (Host).
CEO (Host) Positive is the count of positive words of the CEO (Host) in the interview divided by the total word count of the CEO (Host).
CEO (Host) Negative is the count of negative words of the CEO (Host) in the interview divided by the total word count of the CEO (Host).
Article Word Count is the aggregate count of words about the company in all the newspapers in Factiva over the [-7,0] calendar days relative to the interview.
Article Positive (Negative) is the aggregate count of positive (negative) words about the company in all the newspapers in Factiva divided by the aggregated word count of the news articles over the [-7,0] calendar days relative to the interview. We use the Harvard IV Dictionary to count the words of each category, such as positive and negative.
SAB is defined as follows: We first run the following regression based on the whole CNBC interview sample.
Then the SAB measure is constructed as follows:
1 1
1yr Stock performance is the one-year stock market return until the end of fiscal year t.
ROA is operating income before depreciation and amortization divided by assets.
Idiosyncratic volatility, measured as the root mean squared error of the monthly market model regression with the S&P 500 index.
Firm size, measured as the log of assets.
Retirement age dummy that is one when the CEO age is in the range of 63 to 66.
High CEO ownership dummy that is one if the stock ownership of the CEO is greater than 5%.
CEO tenure from Execucomp, which is augmented by hand-collected information from Factiva.

25
Chairman CEO dummy that is one if the CEO is the chairman of the board, which is obtained from Risk Metrics database.
Proportion of independent directors that is obtained from Risk Metrics.
Investment is defined as the capital expenditure divided by lagged property, plant, and equipment.
Cash flow is defined as the net income plus depreciation divided by lagged property, plant, and equipment.
Q is Tobin’s Q, which is defined as book value of assets plus market value of equity minus book value of equity divided by book value of assets.
CEO narcissism is the ratio between the number of first person singular pronouns (“I” words) in the CEO’s interview transcript and the number of all first person pronouns (“I” words and “We” words) in the CEO’s interview transcript.
CEO Narcissism #"I"
#"I" #"W "
We refer to LIWC (Linguistic Inquiry and Word Count) dictionary by Pennebaker, Booth, and Francis. “I,” “Id,” “I’d,” “I’ll,” “I’m,” “Im,” “Ive,” “I’ve,” “me,” “mine,” “my,” and “myself” belong to the “I” category. “our,” “ours,” “ourselves,” “us,” “we,” “we’d,” “we’ll,” “we’re,” “weve,” and “we’ve” belong to the “We” category. We exclude “lets,” and “let’s” from the dictionary.

26
Table 1. Summary Statistics
Panel A. CEO interview sample summary statistics
Self-referencing 6931 0.0004 0.0017545 0 0 0.0005Viewership 6931 0.3223 0.1015 0.2470 0.3150 0.3860Institutional Ownership 6931 0.5637 0.2786 0.4093 0.6236 0.7728Average Share Turnover 6931 0.0123 0.0205 0.0043 0.0078 0.0150Firm Age 6931 32 19 16 30 49Illiquidity 6931 0.0026 0.0063 0.0001 0.0002 0.0014Ln(BEME+1) 6931 0.3541 0.4022 0.1445 0.2693 0.4384Ln(ME) 6931 8.2262 1.9383 6.9199 8.2327 9.5948Abnormal Small Order Imbalance 1757 0.0187 0.2103 -0.0602 0.0241 0.1185Fraction of Short Volume 1022 0.2095 0.3184 0.1325 0.1852 0.25001{Laughter} 6931 0.0584 0.2346 0.0000 0.0000 0.0000CEO Word Count 6931 702 392 491 603 759CEO Hesitate 6931 0.0027 0.0064 0.0000 0.0000 0.0034CEO Positive 6931 0.0524 0.0162 0.0429 0.0516 0.0615CEO Negative 6931 0.0138 0.0107 0.0075 0.0118 0.0173Host Word Count 6931 330 176 224 300 392Host Hesitate 6931 0.0025 0.0049 0.0000 0.0000 0.0035Host Positive 6931 0.0375 0.0147 0.0277 0.0359 0.0452Host Negative 6931 0.0179 0.0097 0.0112 0.0166 0.0231Article Word Count 2047 3,767 10,143 491 1,246 3,332 Article Positive 2047 0.0502 0.0195 0.0400 0.0493 0.0591Article Negative 2047 0.0218 0.0112 0.0146 0.0211 0.0282
75th percentileVariable N Mean Std. Dev. 25th percentile Median

27
Panel B. CEO turnover sample summary statistics
1{Forced CEO turnover} 15386 0.0268 0.1614 0.0000 0.0000 0.0000SAB 2146 0.0630 0.2429 0.0000 0.0000 1.00001 yr Stock performance 15386 0.1514 0.5221 -0.1296 0.0978 0.3384ROA 15386 0.1520 0.1248 0.0825 0.1409 0.2100Idiosyncratic volatility 15386 0.1061 0.0622 0.0670 0.0928 0.1291Size:Ln(Assets) 15386 7.6728 1.6722 6.4651 7.4719 8.72231{CEO Retirement Age} 15386 0.0898 0.2858 0.0000 0.0000 0.00001{CEO High Ownership} 15386 0.1283 0.3344 0.0000 0.0000 0.0000CEO Tenure 15386 7.8875 8.0059 2.0000 5.0000 11.00001{Chairman CEO} 15386 0.7470 0.4347 0.0000 1.0000 1.0000%Ind.Directors 15386 0.6607 0.1745 0.5556 0.6667 0.8000Chg.TDC1 13417 0.3570 3.5675 -0.7493 0.1865 1.5311Investment 14851 0.2933 1.2429 0.1264 0.2075 0.3416Cash Flow 14851 0.8406 6.4782 0.1642 0.3959 0.8836Q 14851 2.0436 1.7100 1.1961 1.5570 2.2703
75th percentileVariable N Mean Std. Dev. 25th percentile Median

28
Table 2. Investor response to CNBC interviews with self-referencing CEOs
Panel A. Interview CAR regression with self-referencing measure
(continued in the next page)
Dependent Variable: CAR[0] CAR[0] CAR[1,2] CAR[1,2]Self Referencing -103.375 *** -108.62 *** -122.884 ** -124.232 **
(-3.057) (-3.066) (-2.334) (-2.478)Viewership 1.832 ** 1.31 -1.989 ** -1.128
(2.11) (1.44) (-2.179) (-1.168)Abnormal Small Order Imbalance 5.205 *** 5.151 *** 0.666 ** 0.752 **
(6.45) (6.35) (1.97) (2.47) Fraction of Short Volume -0.01 -0.142 -0.286 *** -0.232 ***
(-0.072) (-1.132) (-4.176) (-2.983)Institutional Ownership 0.452 0.32 0.468 0.561
(0.91) (0.65) (1.06) (1.30) Avg. Turnover -11.866 ** -12.181 ** -12.339 ** -12.094 **
(-1.969) (-2.040) (-2.270) (-2.253)Firm Age 0.006 0.008 0.006 * 0.006 *
(1.32) (1.62) (1.79) (1.65) Illiquidity -18.105 -13.076 -75.725 *** -80.205 ***
(-0.744) (-0.531) (-3.029) (-3.205)Ln(BEME+1) -0.597 ** -0.551 ** 0.4 *** 0.409 ***
(-2.294) (-2.037) (2.97) (3.17) Ln(ME) -0.445 *** -0.456 *** -0.005 0
(-5.086) (-5.041) (-0.125) (-0.003)1{Laughter} 0.565 * -0.13
(1.81) (-0.716)CEO Word Count -0.356 *** 0.179 ***
(-5.317) (2.58) CEO Hesitate -0.146 ** -0.041
(-2.070) (-0.666)CEO Positive 0.368 *** -0.113 *
(3.38) (-1.726)CEO Negative -0.117 0.022
(-1.555) (0.27)

29
Linear regressions are used. For variable definition, please refer to Appendix B. Standard errors are clustered at the firm level. *, **, *** indicate statistical significance at the 10%, 5%, 1% levels by a two-tailed test.
Dependent Variable: CAR[0] CAR[0] CAR[1,2] CAR[1,2](continued)Host Word Count 0.162 * 0.017
(1.87) (0.26) Host Hesitate -0.007 0.174 ***
(-0.092) (2.99) Host Positive 0.201 *** 0.053
(2.59) (0.85) Host Negative -0.062 -0.011
(-1.097) (-0.176)Article Word Count 0.036 0.052
(0.26) (0.62) Article Positive 0.064 0.217 **
(0.61) (2.51) Article Negative 0.215 0.088
(1.02) (0.77) 1{Missing Order Imbalance} 0.072 -0.053 0.164 0.252 *
(0.19) (-0.141) (1.43) (1.82) 1{Missing Fraction of Short Turnover} -0.429 ** -0.335 * 0.359 ** 0.445 **
(-2.471) (-1.732) (2.07) (2.49) 1{Confounded Interview} -0.663 -0.688 0.234 0.244
(-1.471) (-1.483) (0.64) (0.69) 1{Unconfounded Interview} 0.27 0.221 0.096 0.131
(1.63) (1.32) (0.72) (1.01) noarticles -0.261 0.166
(-1.457) (0.69) constant 8.059 ** 8.463 * -9.632 ** -10.083 **
(2.00) (1.85) (-2.107) (-2.180)Industry FE Yes Yes Yes YesYear FE Yes Yes Yes Yes
N 6931 6931 6931 6931Adj.R2 0.018 0.022 0.018 0.019

30
Panel B. Spline regression by the interval of self referencing
Linear regressions are used. For variable definition, please refer to Appendix B. Standard errors are clustered at the firm level. *, **, *** indicate statistical significance at the 10%, 5%, 1% levels by a two-tailed test.
Dependent Variable: CAR[0] CAR[0] CAR[1,2] CAR[1,2]Self Referencing*1{Self Ref. <=75%} -30.822 -4.959 -39.374 -54.43
(-0.313) (-0.048) (-0.332) (-0.452)Self Referencing*1{Self Ref. >75%} -111.34 *** -119.98 *** -132.051 ** -130.309 ***
(-3.006) (-3.187) (-2.538) (-2.587)Other explanatory variables Yes Yes Yes YesTranscript content variables No Yes No YesNews article variables No Yes No YesIndustry FE Yes Yes Yes YesYear FE Yes Yes Yes YesN 6931 6931 6931 6931Adj.R2 0.018 0.022 0.018 0.019

31
Table 3. SAB and CEO turnover
Linear probability model of forced CEO turnover and firm year fixed effects
Linear regressions are used. For variable definition, please refer to Appendix B. The dependent variable is one if the firm has a forced CEO turnover in fiscal year t+1. For missing SAB in the regressions, we attribute the value of zero and we identify it using the 1{Missing CNBC interview} dummy. All the explanatory variables and controls are measured as of fiscal year t. Standard errors are clustered at the firm level. *, **, *** indicate statistical significance at the 10%, 5%, 1% levels by a two-tailed test.
Sample: Execucomp Firm year with CEO Interviews All Firm YearsAll All
Before After Before After1{SAB} 0.015 * 0.008 0.024 * 0.015 * 0.007 0.017 *
(1.83) (0.67) (1.95) (1.93) (0.59) (1.73) 1{SAB}*1yrStock Perf. -0.015 ** -0.015 ** -0.024 ** -0.022 * -0.01 -0.042 **
(-2.51) (-2.09) (-2.21) (-1.72) (-0.75) (-2.20)1year Stock performance -0.016 -0.001 -0.09 *** -0.01 *** -0.009 *** -0.007
(-1.34) (-0.07) (-3.00) (-4.39) (-3.62) (-1.52)ROA -0.055 -0.068 -0.017 -0.101 *** -0.106 *** -0.122 ***
(-1.52) (-1.25) (-0.39) (-4.61) (-3.26) (-3.03)idiosyncratic volatility 0.111 0.027 0.22 0.08 0.093 -0.094
(1.07) (0.23) (1.16) (1.60) (1.64) (-0.86)ln(Assets) 0.003 -0.001 0.006 -0.012 ** -0.006 -0.018
(1.04) (-0.12) (1.35) (-2.01) (-0.72) (-1.44)1{CEO Retirement Age} -0.009 -0.011 -0.01 -0.013 *** -0.013 ** -0.009
(-0.64) (-0.51) (-0.52) (-3.86) (-2.45) (-1.51)1{CEO High Ownership} -0.022 * -0.019 -0.039 ** -0.021 ** -0.013 -0.036 *
(-1.91) (-1.04) (-2.47) (-2.25) (-1.04) (-1.96)CEO Tenure 0 0 0 0.02 -0.019 *** 0.048
(-0.06) (0.44) (-0.50) (0.42) (-2.64) (0.54) 1{Chairman CEO} -0.003 -0.006 0.001 -0.007 0.004 -0.013
(-0.24) (-0.30) (0.04) (-1.34) (0.66) (-1.52)%Ind.Directors -0.043 * -0.048 * -0.036 0.006 -0.037 * 0.043
(-1.94) (-1.80) (-1.01) (0.41) (-1.85) (1.52) 1{Missing CNBC Interview} 0.002 0 0.003
(0.38) (-0.05) (0.38) constant 0.01 0.034 0.058 0.021 0.165 ** -0.139
(0.27) (0.62) (0.58) (0.17) (2.01) (-0.27)Industry FE Yes Yes Yes No No No
Firm FE No No No Yes Yes YesYear FE Yes Yes Yes Yes Yes YesN 2146 899 1247 15386 7762 7624R2 0.012 0.012 0.012 0.03 0.033 0.036
SOXSOX
32
Table 4. Stock market response to the forced turnover announcement of CEOs with SAB
Linear regressions are used. For variable definition, please refer to Appendix B. Standard errors are clustered at firm level. *, **, *** indicate statistical significance at 10%, 5%, 1% level by two-tailed test.
Dependent Variable: CAR[-1,1] of forced CEO turnover announcement1{SAB} 0.058 * 0.078 ** 0.097 **
(1.93) (2.16) (2.16) 1Yr.Stk.Perf. 0.008 -0.032 * -0.039 *
(0.24) (-1.74) (-1.77)1{Outsider Succession} -0.014 0.038 ** 0.042 **
(-0.33) (2.14) (2.18) Size:Ln(Assets) 0 0.009 0.007
(0.01) (1.58) (1.12) BEME -0.041 0.022 0.022
(-0.71) (1.49) (1.50) idiosyncratic volatility -0.455 ** 0.145 0.123
(-2.33) (0.84) (0.75) News Negative [-10,0] 0.029 0.001 0.003
(1.33) (0.11) (0.49) 1{No Interview} 0.039 0.05 *
(1.46) (1.68) constant 0.057 -0.141 ** -0.198 ***
(0.70) (-1.98) (-2.82)Year FE No No YesN 28 337 337R2 0.357 0.091 0.122

33
Table 5. SAB and investment cash flow sensitivity
The dependent variable is Investment, which is defined as the capital expenditure divided by lagged property, plant, and equipment. Linear regressions are used. For variable definition, please refer to Appendix B. Cash Flow is defined as the net income plus depreciation divided by lagged property, plant, and equipment. Q is Tobin’s Q, which is defined as the book value of assets plus the market value of equity minus the book value of equity divided by the book value of assets. For missing SAB in the regressions, we attribute the value of zero and we identify it using the 1{No Interview} dummy. Standard errors are clustered at the firm level. *, **, *** indicate statistical significance at the 10%, 5%, 1% levels by a two-tailed test.
Dependent Variable: InvestmentSelf-serving Attribution Bias -0.186 **
(-2.47)SAB*Cash Flow 0.197 **
(2.26) Cash Flow 0.056 ** 0.056 **
(2.30) (2.30) Q 0.15 0.144
(1.32) (1.28) Q*Cash Flow -0.062 *** -0.063 ***
(-2.78) (-2.88)Size:Ln(Assets) 0.169 *** 0.154 **
(2.59) (2.48) %Ind.Directors -0.13 -0.139
(-1.54) (-1.62)1{No Interview} -0.016 -0.037
(-0.62) (-1.06)constant -1.254 * -1.082
(-1.71) (-1.50)Firm FE Yes YesYear FE Yes YesN 14851 14851R2 0.661 0.674

34
Table 6. Investor response to acquisition announcement and CEO’s SAB
Dependent variable is the cumulative abnormal return on the day of announcement of acquisition by the company that had CEO interviews in the same fiscal year when CEO was interviewed. CAR was estimated using Fama-French 4 factor model over the estimation window of [-150,-31] trading days. Merger related data is from SDC Platinum. Linear regressions are used. For variable definition, please refer to Appendix B. 1{Public target} is a dummy variable that is one if the acquisition target is a public company. 1{Diversification} a dummy variable that is one if the SIC code of the target is different from that of the acquirer. The difference of SIC codes is measured at the 1 digit, 2 digit, and 3 digit SIC code level. 1{Cash Deal} is a dummy variable that is one if the acquisition is a 100% cash transaction. Standard errors are clustered firm level and year level using Petersen (2009). *, **, *** indicate statistical significance at 10%, 5%, 1% level by two-tailed test.
Dependent Variable: CAR[-1,1]SIC code different for diversification 1 digit 2 digit 3digit 1 digit 2 digit 3digit1{SAB} 0.002 ** 0.002 ** 0.002 **
(2.39) (2.41) (2.45) Self-referencing 1.64 ** 1.603 ** 1.611 **
(2.38) (2.35) (2.34) Self-referencing^2 -466.118 *** -465.257 *** -467.851 ***
(-2.91) (-2.92) (-2.91)1{Public Targets} -0.014 *** -0.014 *** -0.014 *** -0.014 *** -0.014 *** -0.014 ***
(-5.41) (-5.42) (-5.42) (-5.42) (-5.43) (-5.43)1{Diversification} -0.004 * -0.002 -0.002 -0.004 * -0.002 -0.002
(-1.75) (-1.07) (-0.91) (-1.75) (-1.04) (-0.87)1{Cash Deal} 0.006 *** 0.006 *** 0.006 *** 0.006 *** 0.006 *** 0.006 ***
(3.13) (3.09) (3.09) (3.15) (3.11) (3.11) ln(MVE} 0 0 0 0 0 0
(0.46) (0.46) (0.46) (0.71) (0.72) (0.72) BEME 0 0 0 0 0 0
(-0.29) (-0.31) (-0.27) (-0.16) (-0.17) (-0.14)constant -0.004 -0.004 -0.004 -0.005 -0.005 -0.005
(-0.17) (-0.19) (-0.20) (-0.22) (-0.24) (-0.25)Industry FE Yes Yes Yes Yes Yes YesYear FE Yes Yes Yes Yes Yes Yes
N 8925 8925 8925 8925 8925 8925R2 0.033 0.032 0.032 0.033 0.033 0.032

35
Table 7. CEO turnover with SAB controlling for BEME
The dependent variable is one if the firm has a forced CEO turnover in fiscal year t+1. Linear regressions are used. For variable definition, please refer to Appendix B. Standard errors are clustered firm level. *, **, *** indicate statistical significance at 10%, 5%, 1% level by two-tailed test.
All SOX Inst.Own.Before After Before After
Self-Serving Attribution Bias 0.014 * 0.005 0.017 * 0.005 0.017 *(1.82) (0.38) (1.75) (0.38) (1.75)
1year Stock Performance -0.009 *** -0.008 *** -0.004 -0.008 *** -0.004(-3.73) (-3.29) (-0.76) (-3.29) (-0.76)
SAB*1yr Stock Perf. -0.022 * -0.008 -0.044 ** -0.008 -0.044 **(-1.73) (-0.68) (-2.28) (-0.68) (-2.28)
ROA -0.097 *** -0.108 *** -0.109 *** -0.108 *** -0.109 ***(-4.41) (-3.31) (-2.71) (-3.31) (-2.71)
Idiosyncratic volatility 0.049 0.094 -0.167 * 0.094 -0.167 *(1.19) (1.57) (-1.79) (1.57) (-1.79)
ln(Assets) -0.014 ** -0.011 -0.019 -0.011 -0.019(-2.37) (-1.38) (-1.49) (-1.38) (-1.49)
1{CEO Retirement Age} -0.013 *** -0.014 ** -0.008 -0.014 ** -0.008(-3.70) (-2.49) (-1.36) (-2.49) (-1.36)
1{CEO High Ownership} -0.021 ** -0.013 -0.04 ** -0.013 -0.04 **(-2.29) (-1.05) (-2.09) (-1.05) (-2.09)
CEO Tenure 0.019 -0.019 *** 0.047 -0.019 *** 0.047(0.40) (-2.70) (0.52) (-2.70) (0.52)
1{Chairman CEO} -0.006 0.004 -0.012 0.004 -0.012(-1.25) (0.59) (-1.33) (0.59) (-1.33)
1{No Interview} 0.002 -0.001 0.003 -0.001 0.003(0.32) (-0.15) (0.35) (-0.15) (0.35)
%Ind.Directors 0.005 -0.04 * 0.045 -0.04 * 0.045(0.32) (-1.96) (1.57) (-1.96) (1.57)
BEME 0.007 * 0.005 0.014 0.005 0.014(1.94) (1.59) (1.44) (1.59) (1.44)
constant -0.058 0.353 *** -0.126 0.353 *** -0.126(-0.09) (3.29) (-0.24) (3.29) (-0.24)
Firm FE Yes Yes Yes Yes YesYear FE Yes Yes Yes Yes YesN 15116 7611 7505 7611 7505R2 0.031 0.034 0.037 0.034 0.037
36
Table 8. CEO turnover with SAB and journalist’s negative tone
The dependent variable is one if the firm has a forced CEO turnover in fiscal year t+1. Linear regressions are used. For variable definition, please refer to Appendix B. %Anchor Negative Words is constructed as follows. Across all the interview sample, we compute the negative words spoken by the anchor (interview host) and divide by the number of words by the anchor. Then across the interviews, we obtain mean and standard deviation. Then we obtain standardized percentage of negative words. Then for the firm year, we attribute the most recent value of standardized negative words for the firms that had CNBC interview. Standard errors are clustered firm level. *, **, *** indicate statistical significance at 10%, 5%, 1% level by two-tailed test.
Sample: Execucomp Firm year with CEO Interviews All Firm YearsAll All
Before After Before After1{SAB} 0.015 * 0.007 0.023 * 0.015 * 0.006 0.02 *
(1.76) (0.57) (1.81) (1.90) (0.56) (1.70) 1{SAB}*1yrStock Perf. -0.016 -0.004 -0.084 *** -0.021 * 0.005 -0.065 **
(-1.35) (-0.37) (-2.79) (-1.69) (0.61) (-2.29)%Anchor Negative Words 0.007 -0.007 0.012 * 0.008 ** -0.005 0.014 **
(1.40) (-1.17) (1.79) (1.97) (-0.72) (2.41) %Anchor Neg.Wrd*1Yr Stock Perf. -0.013 ** -0.01 -0.013 * -0.003 0.002 -0.015 **
(-2.45) (-1.08) (-1.75) (-0.53) (0.26) (-2.35)1year Stock performance -0.017 *** -0.015 ** -0.029 ** -0.011 *** -0.02 *** -0.033 ***
(-2.75) (-2.12) (-2.55) (-4.57) (-6.75) (-6.76)ROA -0.055 -0.066 -0.019 -0.103 *** -0.019 -0.014
(-1.51) (-1.23) (-0.43) (-4.70) (-1.22) (-0.96)idiosyncratic volatility 0.102 0.029 0.198 0.081 0.127 *** 0.145 ***
(0.98) (0.25) (1.04) (1.64) (2.63) (2.87) ln(Assets) 0.003 0 0.005 -0.011 ** 0.001 0.002
(0.94) (-0.02) (1.22) (-2.03) (0.56) (1.25) 1{CEO Retirement Age} -0.008 -0.01 -0.009 -0.012 *** -0.015 *** -0.014 ***
(-0.58) (-0.47) (-0.49) (-3.57) (-3.66) (-3.63)1{CEO High Ownership} -0.023 * -0.019 -0.04 ** -0.018 * -0.011 ** -0.003
(-1.95) (-1.02) (-2.52) (-1.88) (-2.53) (-0.52)CEO Tenure 0 0 0 0.021 -0.001 *** -0.001 ***
(0.01) (0.40) (-0.39) (0.45) (-3.04) (-2.73)1{Chairman CEO} -0.004 -0.006 -0.001 -0.008 * -0.009 * -0.017 ***
(-0.31) (-0.30) (-0.05) (-1.77) (-1.74) (-3.83)%Ind.Directors -0.042 * -0.045 * -0.036 0.007 0.004 0.005
(-1.90) (-1.69) (-1.00) (0.50) (0.37) (0.36) 1{Missing CNBC Interview} 0.002 0.004 0
-0.36 -0.54 -0.04constant 0.009 0.031 0.068 -0.132 0.019 -0.009
(0.24) (0.56) (0.68) (-0.20) (0.94) (-0.40)Industry FE Yes Yes Yes No No No
Firm FE No No No Yes Yes YesYear FE Yes Yes Yes Yes Yes YesN 2146 899 1247 15986 7762 8224Adj.R2 0.013 0.011 0.013 0.029 0.014 0.015
SOX SOX

37
Table 9. CEO’s narcissism versus self-serving attribution bias
Panel A. Stock price response to CEO interviews on CNBC using CEO narcissism
Linear regressions are used. For variable definition, please refer to Appendix B. We use heteroskedasticity robust standard errors that are adjusted for clustering by firm. All the “other controls” are the control variables used in Table 2.
Panel B. Stock price response to CEO interviews on CNBC using CEO narcissism and Self-referencing
Linear regressions are used. For variable definition, please refer to Appendix B. We use heteroskedasticity robust standard errors that are adjusted for clustering by firm. All the “other controls” are the control variables used in Table 2.
CAR[0] CAR[0] CAR[1,2] CAR[1,2]CEO Narcissism 0.332 0.461 -0.269 -0.31
(0.69) (0.95) (-0.759) (-0.849)Other controls Yes Yes Yes YesIndustry FE Yes Yes Yes YesYear FE Yes Yes Yes YesN 6931 6931 6931 6931Adj.R2 0.017 0.021 0.017 0.017
CAR[0] CAR[0] CAR[1,2] CAR[1,2]Self-Referencing -102.334 *** -107.273 *** -123.917 ** -123.874 **
(-3.049) (-3.050) (-2.360) (-2.463)CEO Narcissism 0.305 0.435 -0.302 -0.34
(0.63) (0.90) (-0.855) (-0.934)Other controls Yes Yes Yes YesIndustry FE Yes Yes Yes YesYear FE Yes Yes Yes YesN 6931 6931 6931 6931Adj.R2 0.018 0.022 0.018 0.019

38
Panel C. CEO turnover regressions with CEO narcissism
Linear regressions are used. For variable definition, please refer to Appendix B. We use heteroskedasticity robust standard errors that are adjusted for clustering by firm.
Panel D. Stock market response to the forced turnover announcement of CEOs with CEO narcissism
Linear regressions are used. For variable definition, please refer to Appendix B. We use heteroskedasticity robust standard errors that are adjusted for clustering by firm.
Sample: Execucomp Firm year with CEO interviews All firm yearsAll SOX All SOX
Before After Before After1{SAB} 0.015 * 0.008 0.025 * 0.015 * 0.008 0.017 *
(1.84) (0.66) (1.96) (1.94) (0.64) (1.73) CEO narcissism -0.021 -0.038 * -0.011 -0.01 -0.061 *** -0.004
(-1.21) (-1.87) (-0.44) (-0.56) (-2.70) (-0.14)1 year Stock Performance -0.015 ** -0.015 ** -0.024 ** -0.01 *** -0.009 *** -0.007
(-2.50) (-2.08) (-2.20) (-4.37) (-3.57) (-1.51)1{SAB}*1yrStockPerf. -0.016 -0.001 -0.091 *** -0.022 * -0.01 -0.042 **
(-1.36) (-0.10) (-3.01) (-1.73) (-0.81) (-2.21)Other controls Yes Yes Yes Yes Yes YesFirm FE No No No Yes Yes YesIndustry FE Yes Yes Yes No No NoYear FE Yes Yes Yes Yes Yes YesN 2146 899 1247 15386 7762 7624R2 0.012 0.013 0.011 0.03 0.034 0.036
Dependent Variable: CAR[-1,1] of forced CEO Turnover announcement1{SAB} 0.078 ** 0.097 **
(2.16) (2.16) CEO Narcissism 0.055 0.036
(0.51) (0.34) Other controls Yes YesYear FE Yes YesN 337 337R2 0.091 0.122

39
References
Adams, R., Ferreira, D., 2009. Women in the boardroom and their impact on governance and performance. Journal of Financial Economics 94, 291-309
Ai, C., Norton, E., C., 2003. Interaction terms in logit and probit models. Economics Letters 80, 123-129 Billett, M.T., Yiming, Q., 2008. Are overconfident CEOs born or made? Evidence of self-attribution bias
from frequent acquirers. Management Science 54, 1037-1051 Bushman, R., Dai, Z., Wang, X., 2010. Risk and CEO turnover. Journal of Financial Economics
forthcoming Campbell, T.C., Gallmeyer, M., Johnson, S.A., Rutherford, J., Stanley, B.W., 2011. CEO Optimism and
Forced Turnover. Journal of Financial Economics (JFE), Forthcoming Carhart, M., 1997. On persistence in mutual fund performance. The Journal of Finance LII, 57-82 Chatterjee, A., Hambrick, D.C., 2007. It's all about me: Narcissistic Chief Executive Officers and Their
Effects on Company Strategy and Performance. Administrative Science Quarterly 52, 351-386 Daniel, K.D., Hirshleifer, D., Subrahmanyam, A., 2001. Overconfidence, Arbitrage, and Equilibrium
Asset Pricing. The Journal of Finance 56, 921-965 Doukas, J.A., Petmezas, D., 2007. Acquisitions, Overconfident Managers and Self-attribution Bias.
European Financial Management 13, 531-577 Dyck, A., Volchkova, N., Zingales, L., 2008. The Corporate Governance Role of the Media: Evidence
from Russia. Journal of Finance 63, 1093-1135 Dyck, A., Zingales, L., 2002. The right to tell: the role of the media in development, chap. The corporate
governance role of the media. The World Bank Fama, E.F., FrencH, K.R., 1996. Multifactor Explanations of Asset Pricing Anomalies. The Journal of
Finance 51, 55-84 Fich, E.M., Shivdasani, A., 2006. Are busy boards effective monitors? The Journal of Finance LXI, 689-
724 Gervais, S., Heaton, J.B., Odean, T., 2011. Overconfidence, Compensation Contracts, and Capital
Budgeting. The Journal of Finance 66, 1735-1777 Gervais, S., Odean, T., 2001. Learning to be overconfident. Review of Financial Studies 14, 1-27 Goel, A.M., Thakor, A.V., 2008. Overconfidence, CEO Selection, and Corporate Governance. The
Journal of Finance 63, 2737-2784 Guner, A.B., Malmendier, U., Tate, G., 2008. Financial expertise of directors. Journal of financial
Economics 88, 323-354 Gurun, U.G., 2011. Good news is endogenous. Hirshleifer, D., 2001. Investor psychology and asset pricing. The Journal of Finance XVI, 1533-1597 Jensen, M.C., Meckling, W.H., 1976. Theory of the firm: managerial behavior, agency costs and
ownership structure. Journal of Financial Economics 3, 305-360 Jenter, D., Kanaan, F., 2011. CEO turnover and relative performance evaluation. The Journal of Finance
forthcoming Kaplan, S.N., Minton, B., 2011. How has CEO turnover changed? Increasingly performance sensitive
boards and increasingly uneasy CEOs. International Review of Finance forthcoming Kim, Y.H.A., Kang, M.J., 2011. Stock market liquidity and short-termism driven CEO turnover. Nanyang
Technological University working paper Kim, Y.H.A., Mescke, F., 2011. CEO interviews on CNBC. Nanyang Technological University working
paper King, R., 2011. Trading on a world o fsentiment. In: Bloomberg Businessweek, p.
http://www.businessweek.com/technology/content/feb2011/tc20110228_701998.htm Kuhnen, C.M., Niessen, A., 2011. Public opinion and executive compensation. Management Science
forthcoming

40
Li, F., 2010. Managers' self-serving attribution bias, overconfidence, and corporate financial policies. University of Michigan working paper
Libby, R., Rennekamp, K., 2011. Self-serving attribution bias, overconfidence, adn the issue of management forecast. Cornell University working paper
Malmendier, U., Tate, G., 2005. CEO over confidence and corporate investments. The Journal of Finance LX, 2661-2701
Malmendier, U., Tate, G., 2008. Who makes acquisitions? CEO overconfidence adn the market's reaction. Journal of Financial Economics 89, 20-43
Masulis, R.W., Wang, C., Xie, F., 2011. Globalizing the boardroom - the effects of foreign directors on corporate governance and firm performance. UNSW working paper
Miller, D.T., Ross, M., 1975. Self-serving biases in teh attribution of causality: Fact or fiction? Psychological Bulletin 82, 213-225
Parrino, R., 1997. CEO turnover and outside succession: A cross-sectional analysis. Journal of Financial Economics 46, 165-197
Parrino, R., Sias, R.W., Starks, L.T., 2003. Voting with their feet: institutional ownership changes around forced CEO turnover. Journal of Financial Economics 68, 3-46
Petersen, M.A., 2009. Estimating Standard Errors in Finance Panel Data Sets: Comparing Approaches. Review of Financial Studies 22, 435-480