Embed Size (px)
Citation preview
CEO Turnover in LBOs: The Role of Boards
Francesca Cornelli Oğuzhan Karakaş
National Bank of Serbia
Belgrade
1st March 2013
CEO Turnover in LBOs: The Role of Boards – Cornelli and Karakaş 2/29
• Do boards monitor CEOs? And what does that imply?
• The literature on corporate governance has shown that boardsfire CEOs following poor performance and that performanceimproves afterwards.
• But the literature has also shown that sometimes CEOs are firedfor circumstances beyond their control.
• In general, we interpret a high CEO turnover and a highsensitivity of CEO turnover to performance as the sign of anactive and effective board.
• But is it?
Motivation (1)
CEO Turnover in LBOs: The Role of Boards – Cornelli and Karakaş 3/29
Motivation (2)
• The corporate governance literature has also shown that thesensitivity of CEO turnover to performance increases when moreoutside directors sit on the board.
• Thus, outside directors are seen as non-entrenched and morelikely to act in the interest of the shareholders.
• An alternative view is that outside directors do not have enoughinside information about the role of the board to base theirdecision on anything else but publicly observed performance.
• Therefore, are outsiders better monitor (the monitoringhypothesis) or do they rely on the only (imperfect) informationthey have (the inside information hypothesis)?
CEO Turnover in LBOs: The Role of Boards – Cornelli and Karakaş 4/29
Motivation (3)
• In this paper we look at how the CEO turnover and its sensitivityto performance change when a company is taken private with thebacking of a private equity sponsor (LBO).
• Why public to private?– Some firm characteristics remain the same while the
corporate governance changes.• Why private equity?
– Private equity supporters claim it has superior corporategovernance.
– Outsider directors are replaced by private equity partnerswho (1) like outside directors are not `friends’ of the CEO, but(2) are heavily involved in the firm operation and thereforewill have inside information of the firm.
CEO Turnover in LBOs: The Role of Boards – Cornelli and Karakaş 5/29
Related literature
• Very large literature on CEO turnover:– Denis and Denis (1995), Huson, Malatesta and Parrino (2004), Kaplan and
Minton (2006), Jenter and Kanaan (2011), Bertrand and Mullainathan (2001)
• Very large literature on board monitoring:– Hermalin and Weisbach (2003), Adams, Hermalin, and Weisbach (2010),
Weisbach (1988), Coles, Daniel, and Naveen (2007) and Linck, Netter, andYang (2007).
• Large literature on private equity:– Kaplan and Stromberg (2009), Cornelli, Kominek, and Ljungqvist (2012),
Acharya, Gottschalg, Hahn, and Kehoe (2012), Gong and Wu (2011).
CEO Turnover in LBOs: The Role of Boards – Cornelli and Karakaş 6/29
Main Results
• When a company is taken private the CEO turnover decreasesand it is less sensitive to performance.
• A higher involvement of the private equity sponsors reduces theturnover and its sensitivity to performance, but increasesoperating performance.
• A more complex deals will require larger involvement butincrease turnover.
• These results put into question the usual conclusion that a higherturnover or a higher sensitivity to performance is a good sign ofcorporate governance.
• They also provide support to the inside information hypothesis.
CEO Turnover in LBOs: The Role of Boards – Cornelli and Karakaş 7/29
• Hand-collected dataset of all public to private transactions (P2P)in UK from January 1998 until October 2003 (from Capital IQ),observed until 2009.
• 148 transactions identified, of which 88 are private equity LBOs.
• Average (median) size is $328M ($105M). No clustering aroundspecific years.
• 19 deals not exited as of December 2009. 20 are secondarybuyout, 11 are IPOs, 10 are bankruptcies, 27 are trade sales, and1 is an MBO.
Our Data Set
CEO Turnover in LBOs: The Role of Boards – Cornelli and Karakaş 8/29
• We reconstruct the boards (before and after the LBO) year byyear and we look at the identity of all directors who arecategorized as (1) insiders; (2) outsiders; and (3) LBO sponsors.
• For each LBO, we find a matching company (by industry and size)that remains public.
• We found financial performance figures only for 57 or 67(depending on the measure chosen) of the LBOs.
Our Data Set
CEO Turnover in LBOs: The Role of Boards – Cornelli and Karakaş 9/29
CEO Turnover
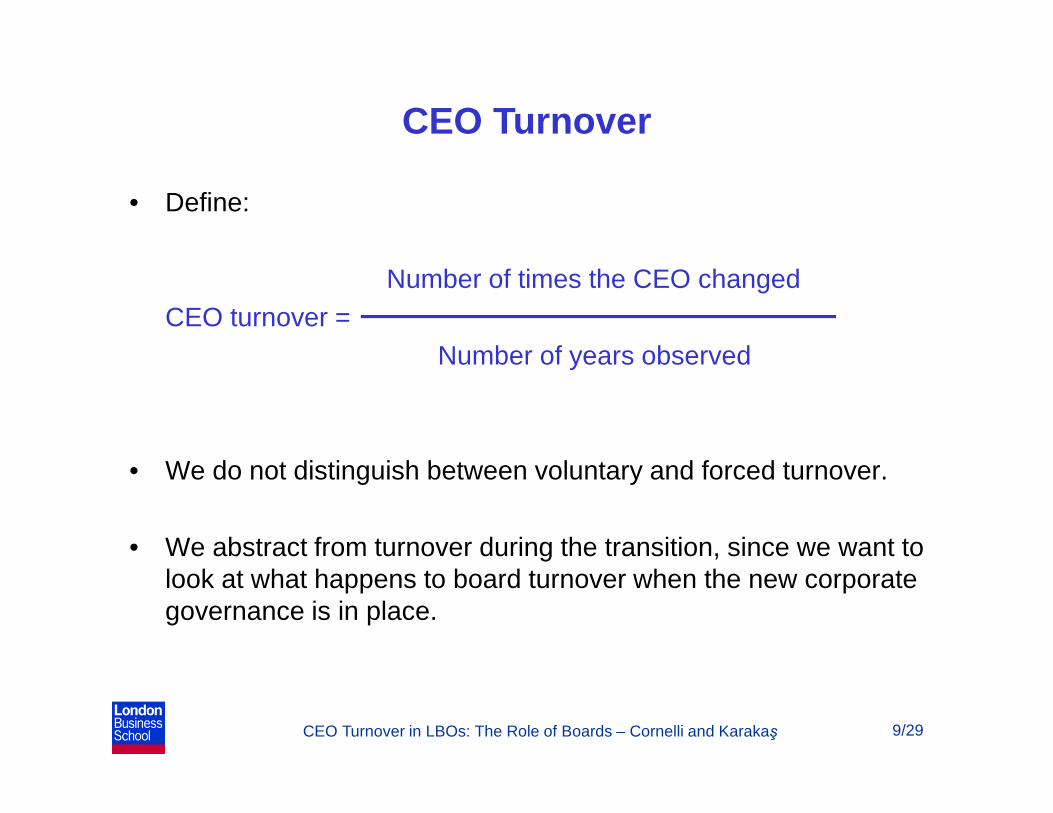
• Define:
Number of times the CEO changedCEO turnover =
Number of years observed
• We do not distinguish between voluntary and forced turnover.
• We abstract from turnover during the transition, since we want to look at what happens to board turnover when the new corporate governance is in place.
CEO Turnover in LBOs: The Role of Boards – Cornelli and Karakaş
• Let us assume private equity monitors more. What are the consequences?
• 1) More monitoring leads to higher CEO turnover if PE will not forgive CEO mistakes
• 2) More monitoring leads to lower CEO turnover if PE is able to give the CEO a longer horizon (which is what they often claim)
• We thus compare CEO turnover rate before and after the LBO and relative to the matched companies that remained public.
10/29
More or less turnover?
CEO Turnover in LBOs: The Role of Boards – Cornelli and Karakaş 11/29
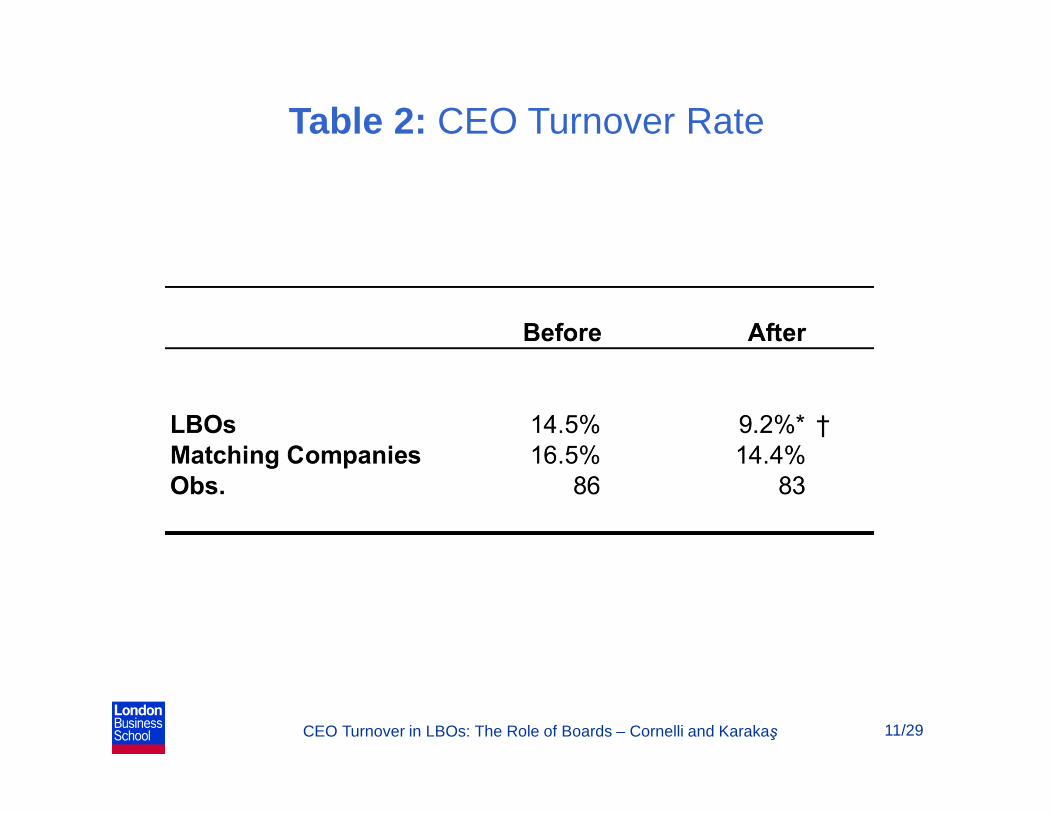
Table 2: CEO Turnover Rate
CEO Turnover in LBOs: The Role of Boards – Cornelli and Karakaş
• Press often claims PE mainly focuses on financial engineering.• We need to identify the LBOs where focus is more likely to be
corporate governance and operational engineering. • To identify these deals we focus on the board changes.• The LBO sponsors sitting on the board are the ones in charge of
the restructuring of the company.• Our underlying hypothesis is that PE partners have a high value
of time and therefore they will be more involved when there is more need for their advice or monitoring.
• Thus LBOs where LBO sponsors are not very involved are either financial engineering deals, or deals where there is no much need for monitoring/advice.
12/29
Does Private Equity Monitor?
CEO Turnover in LBOs: The Role of Boards – Cornelli and Karakaş 13/29
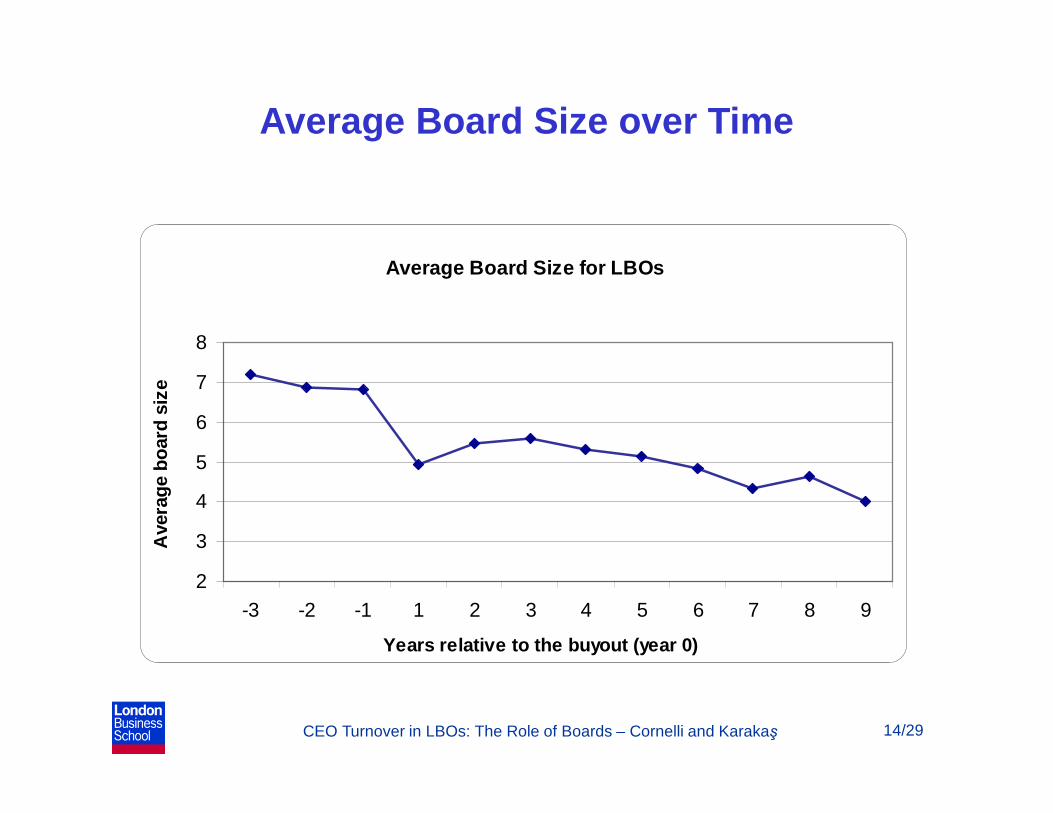
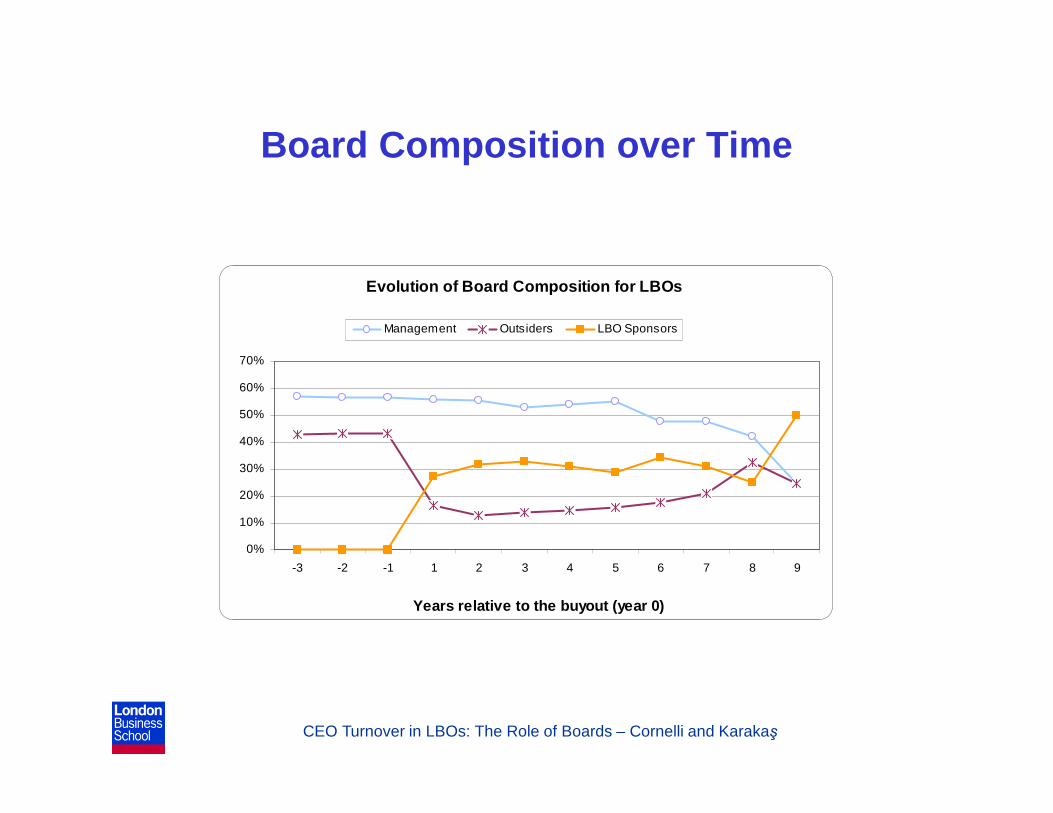
• How does the board change when the company goes from publicto private?
1. The board size decreases.– On average 15% smaller.
2. The composition of the board changes dramatically.– Outside directors are rare and are replaced by PE
employees.– Large involvement of PE employees: on average LBO
sponsors constitute 33% of the board.
The Change from Public to Private
CEO Turnover in LBOs: The Role of Boards – Cornelli and Karakaş
Average Board Size for LBOs
2
3
4
5
6
7
8
-3 -2 -1 1 2 3 4 5 6 7 8 9
Years relative to the buyout (year 0)
Ave
rag
e b
oar
d s
ize
14/29
Average Board Size over Time
CEO Turnover in LBOs: The Role of Boards – Cornelli and Karakaş
Board Composition over Time
Evolution of Board Composition for LBOs
0%
10%
20%
30%
40%
50%
60%
70%
-3 -2 -1 1 2 3 4 5 6 7 8 9
Years relative to the buyout (year 0)
Management Outsiders LBO Sponsors
CEO Turnover in LBOs: The Role of Boards – Cornelli and Karakaş 16/29
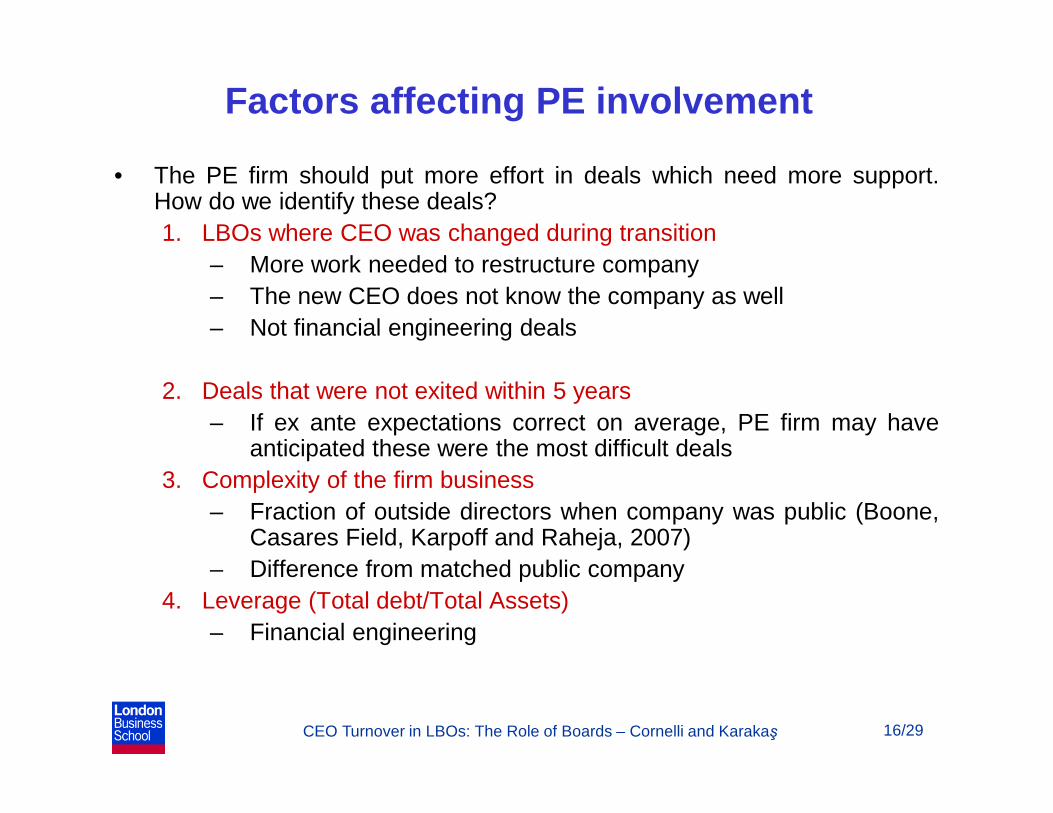
• The PE firm should put more effort in deals which need more support.How do we identify these deals?1. LBOs where CEO was changed during transition
– More work needed to restructure company– The new CEO does not know the company as well– Not financial engineering deals
2. Deals that were not exited within 5 years– If ex ante expectations correct on average, PE firm may have
anticipated these were the most difficult deals3. Complexity of the firm business
– Fraction of outside directors when company was public (Boone,Casares Field, Karpoff and Raheja, 2007)
– Difference from matched public company4. Leverage (Total debt/Total Assets)
– Financial engineering
Factors affecting PE involvement
CEO Turnover in LBOs: The Role of Boards – Cornelli and Karakaş
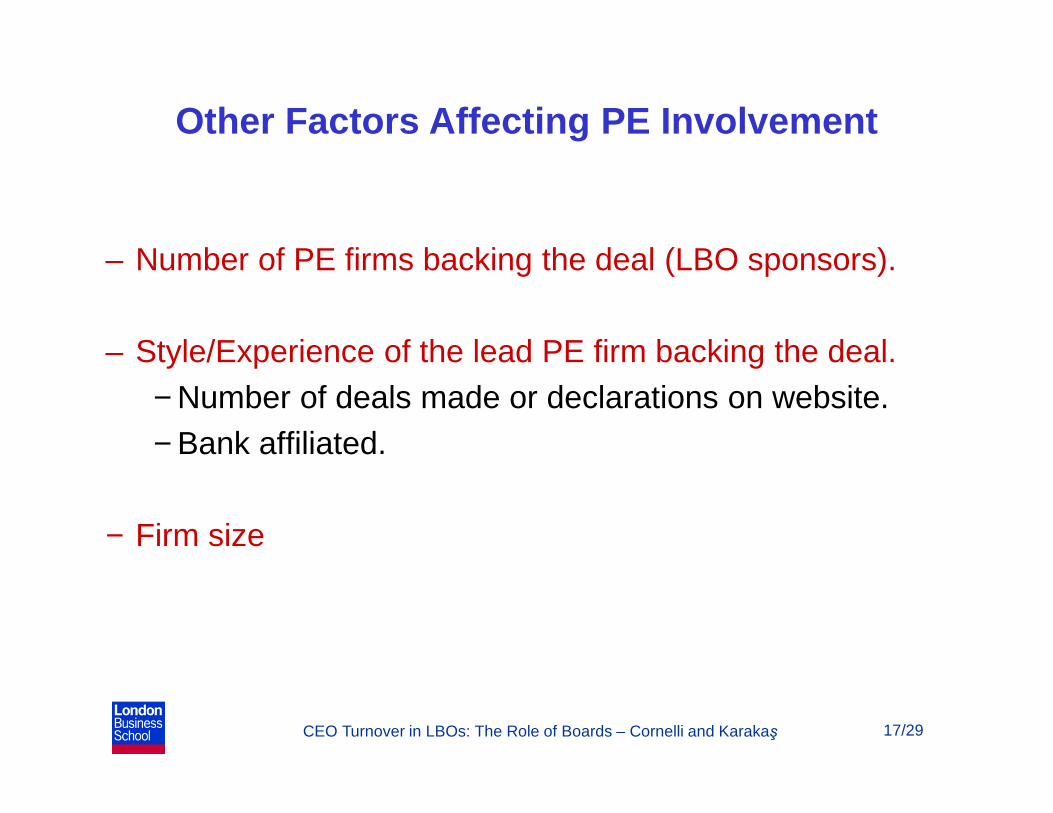
– Number of PE firms backing the deal (LBO sponsors).
– Style/Experience of the lead PE firm backing the deal.− Number of deals made or declarations on website.− Bank affiliated.
− Firm size
17/29
Other Factors Affecting PE Involvement
CEO Turnover in LBOs: The Role of Boards – Cornelli and Karakaş 18/29
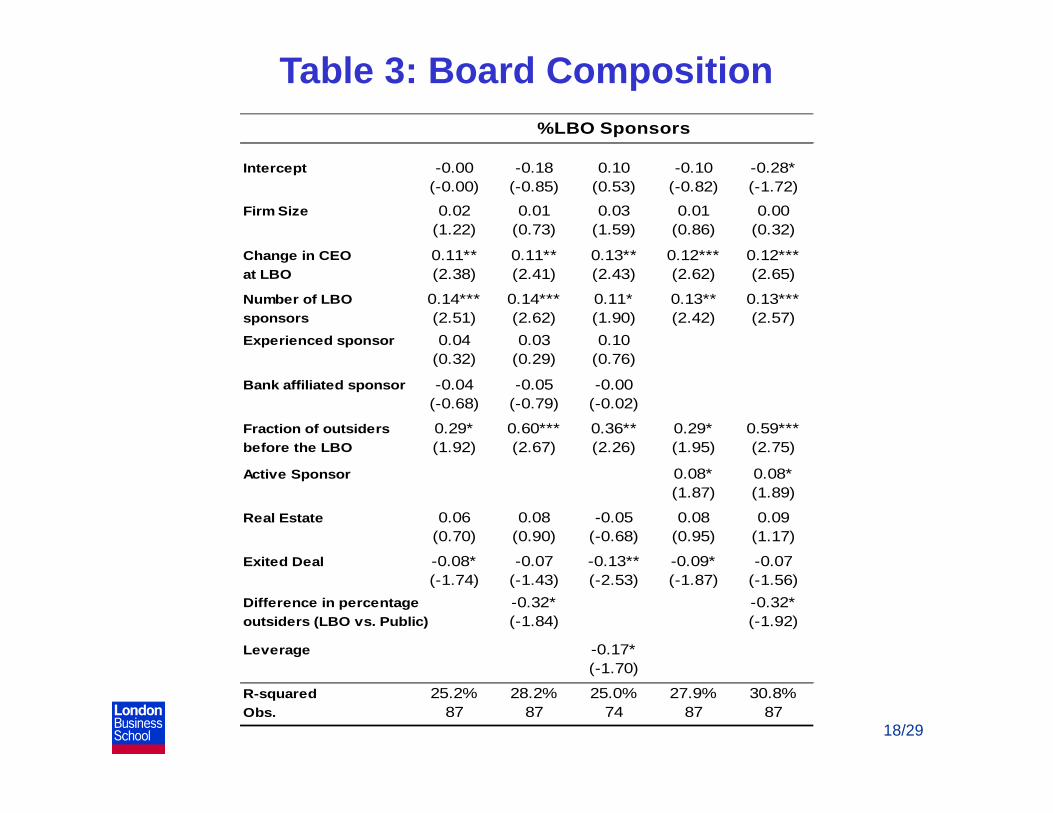
Table 3: Board Composition
Intercept -0.00 -0.18 0.10 -0.10 -0.28*(-0.00) (-0.85) (0.53) (-0.82) (-1.72)
Firm Size 0.02 0.01 0.03 0.01 0.00(1.22) (0.73) (1.59) (0.86) (0.32)
Change in CEO 0.11** 0.11** 0.13** 0.12*** 0.12***at LBO (2.38) (2.41) (2.43) (2.62) (2.65)
Number of LBO 0.14*** 0.14*** 0.11* 0.13** 0.13***sponsors (2.51) (2.62) (1.90) (2.42) (2.57)
Experienced sponsor 0.04 0.03 0.10(0.32) (0.29) (0.76)
Bank affiliated sponsor -0.04 -0.05 -0.00(-0.68) (-0.79) (-0.02)
Fraction of outsiders 0.29* 0.60*** 0.36** 0.29* 0.59***before the LBO (1.92) (2.67) (2.26) (1.95) (2.75)
Active Sponsor 0.08* 0.08*(1.87) (1.89)
Real Estate 0.06 0.08 -0.05 0.08 0.09(0.70) (0.90) (-0.68) (0.95) (1.17)
Exited Deal -0.08* -0.07 -0.13** -0.09* -0.07(-1.74) (-1.43) (-2.53) (-1.87) (-1.56)
Difference in percentage -0.32* -0.32*outsiders (LBO vs. Public) (-1.84) (-1.92)
Leverage -0.17*(-1.70)
R-squared 25.2% 28.2% 25.0% 27.9% 30.8%Obs. 87 87 74 87 87
%LBO Sponsors
CEO Turnover in LBOs: The Role of Boards – Cornelli and Karakaş 19/29
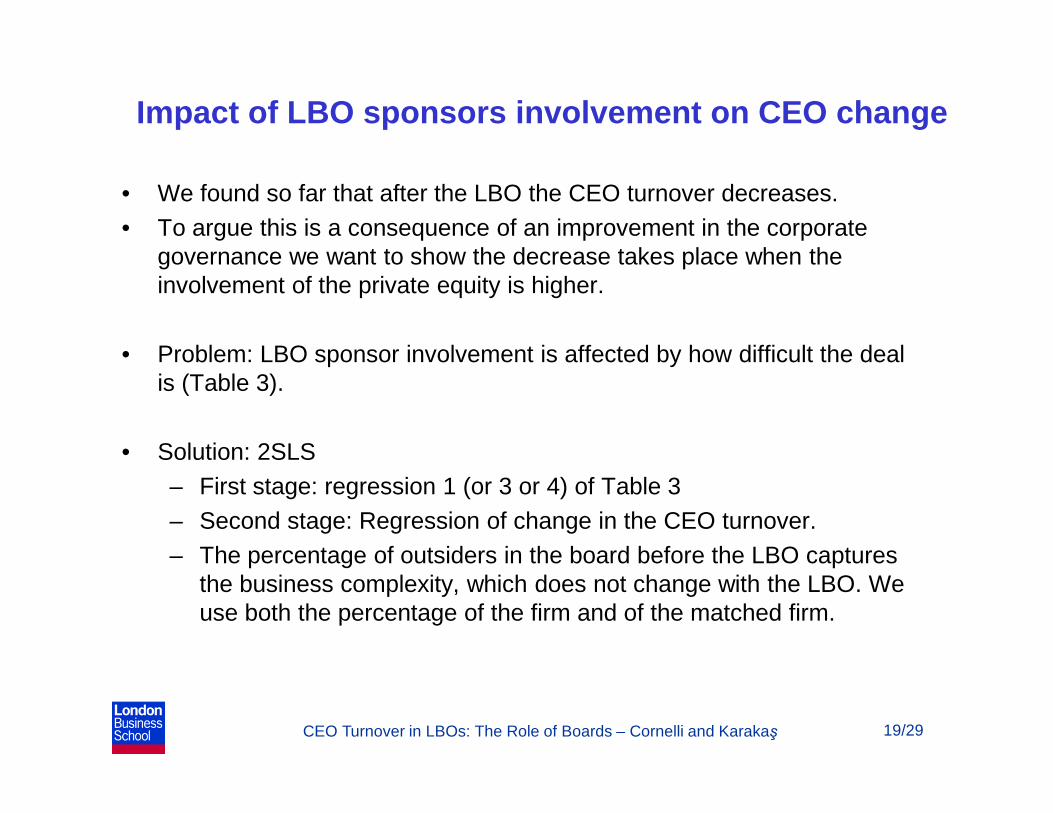
Impact of LBO sponsors involvement on CEO change
• We found so far that after the LBO the CEO turnover decreases.• To argue this is a consequence of an improvement in the corporate
governance we want to show the decrease takes place when the involvement of the private equity is higher.
• Problem: LBO sponsor involvement is affected by how difficult the deal is (Table 3).
• Solution: 2SLS – First stage: regression 1 (or 3 or 4) of Table 3– Second stage: Regression of change in the CEO turnover. – The percentage of outsiders in the board before the LBO captures
the business complexity, which does not change with the LBO. We use both the percentage of the firm and of the matched firm.
CEO Turnover in LBOs: The Role of Boards – Cornelli and Karakaş 20/29
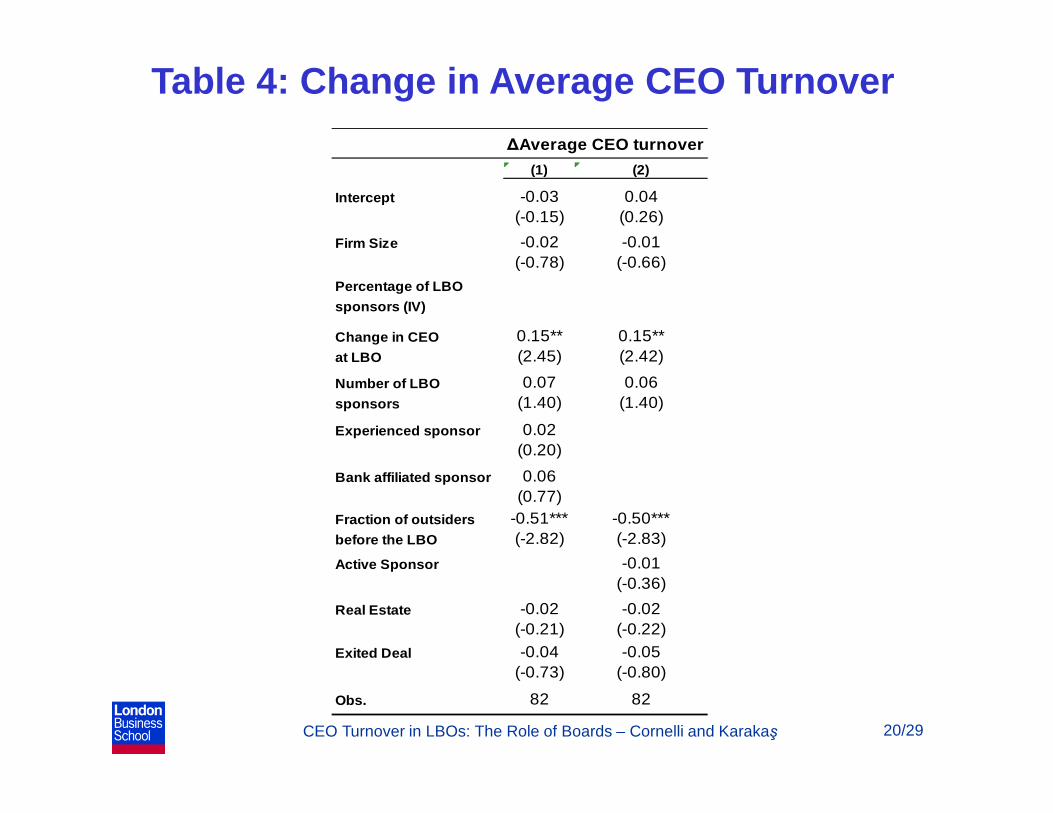
Table 4: Change in Average CEO Turnover
(1) (2)
Intercept -0.03 0.04(-0.15) (0.26)
Firm Size -0.02 -0.01(-0.78) (-0.66)
Percentage of LBO
sponsors (IV)
Change in CEO 0.15** 0.15**at LBO (2.45) (2.42)
Number of LBO 0.07 0.06sponsors (1.40) (1.40)
Experienced sponsor 0.02(0.20)
Bank affiliated sponsor 0.06(0.77)
Fraction of outsiders -0.51*** -0.50***before the LBO (-2.82) (-2.83)
Active Sponsor -0.01(-0.36)
Real Estate -0.02 -0.02(-0.21) (-0.22)
Exited Deal -0.04 -0.05(-0.73) (-0.80)
Obs. 82 82
∆Average CEO turnover
CEO Turnover in LBOs: The Role of Boards – Cornelli and Karakaş 21/29
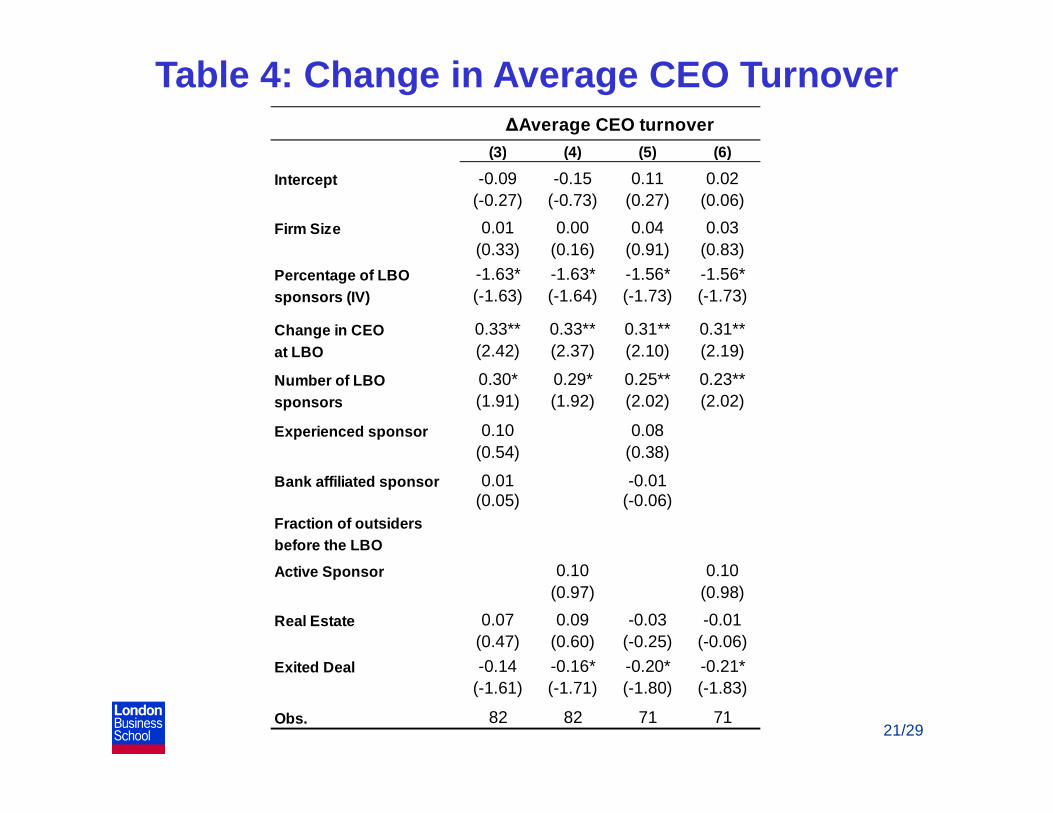
Table 4: Change in Average CEO Turnover
(3) (4) (5) (6)
Intercept -0.09 -0.15 0.11 0.02(-0.27) (-0.73) (0.27) (0.06)
Firm Size 0.01 0.00 0.04 0.03(0.33) (0.16) (0.91) (0.83)
Percentage of LBO -1.63* -1.63* -1.56* -1.56*sponsors (IV) (-1.63) (-1.64) (-1.73) (-1.73)
Change in CEO 0.33** 0.33** 0.31** 0.31**at LBO (2.42) (2.37) (2.10) (2.19)
Number of LBO 0.30* 0.29* 0.25** 0.23**sponsors (1.91) (1.92) (2.02) (2.02)
Experienced sponsor 0.10 0.08(0.54) (0.38)
Bank affiliated sponsor 0.01 -0.01(0.05) (-0.06)
Fraction of outsidersbefore the LBO
Active Sponsor 0.10 0.10(0.97) (0.98)
Real Estate 0.07 0.09 -0.03 -0.01(0.47) (0.60) (-0.25) (-0.06)
Exited Deal -0.14 -0.16* -0.20* -0.21*(-1.61) (-1.71) (-1.80) (-1.83)
Obs. 82 82 71 71
∆Average CEO turnover
CEO Turnover in LBOs: The Role of Boards – Cornelli and Karakaş
• CEO turnover decrease is smaller for difficult deals, but larger the higher is the PE involvement.
• Thus an increase in monitoring by PE decreases, rather than increasing, CEO turnover.
• Jenter and Kanaan (2012) look at public firms and find CEOs are fired for the wrong reasons (for example, industry shocks)
• Cornelli, Kominek and Ljungqvist (2012) look at private firms backed by private equity and find they do not seem to make that mistake.
• This paper reconciliates these two findings showing that it is the involvement of PE that reduces the chances of making mistakes.
22/29
CEO Turnover in LBOs: The Role of Boards – Cornelli and Karakaş
Sensitivity of CEO Turnover to performance
• The literature has argued that what matters is not turnover but its sensitivity to performance. This would allow to argue the decision to fire the CEO is taken for good reasons.
• However, the findings of Jenter and Kanaan (2012) put in question even this measure.
• We therefore also look at the CEO turnover sensitivity to performance.
23/29
CEO Turnover in LBOs: The Role of Boards – Cornelli and Karakaş
Sensitivity of CEO Turnover to performance
• There are two problems in using our approach in our context:
• 1) Most of the literature looks at the stock performance of public companies.– We follow Weisbach (1988) and look at operating
performance: changes in operating performance are considered unexpected changes
• Even for operating performance, it is harder to establish what is an unexpected change when PE wants to restructure a company.
24/29
CEO Turnover in LBOs: The Role of Boards – Cornelli and Karakaş
• We split the sample between deals where the CEO is changed during the transition and deals where it is not.
• The deals where the CEO was changed are the deals where monitoring occurs.
• The analysis follows Weisbach (1988)
• The dependent variable is the probability to fire the CEO (CEO turnover).
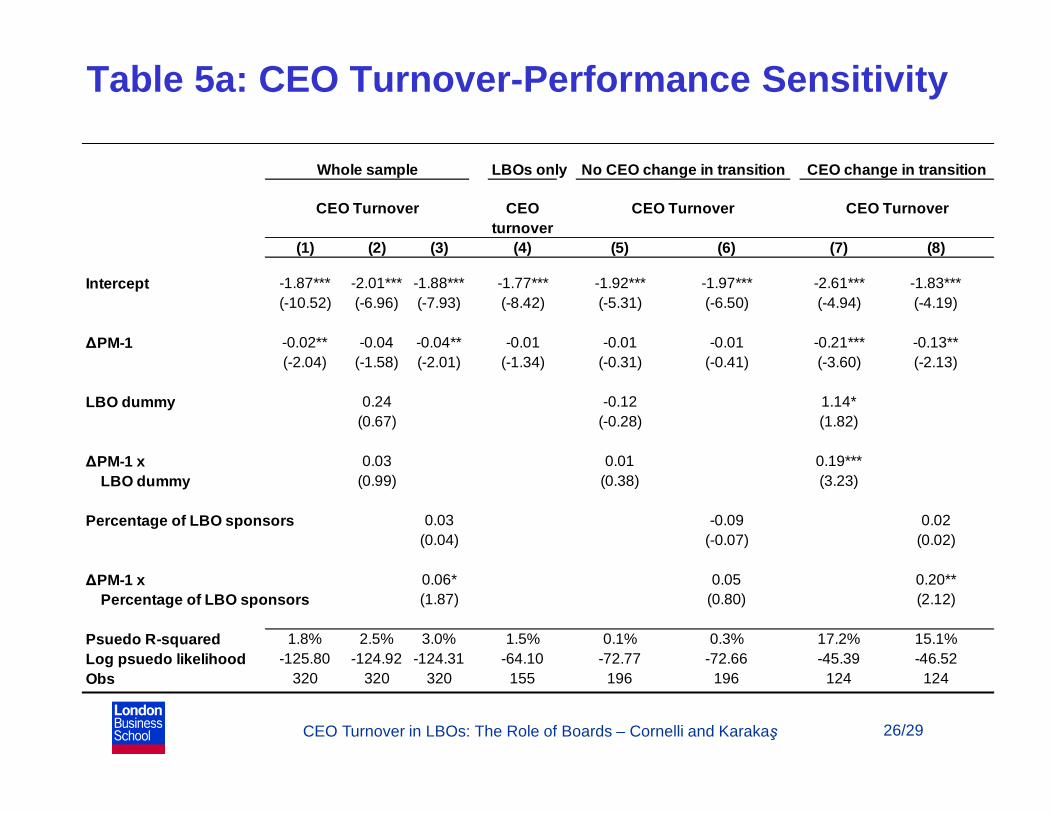
• We look at the sensitivity of CEO turnover to the change in the profit margin for the previous year.
25/29
CEO Turnover in LBOs: The Role of Boards – Cornelli and Karakaş
Table 5a: CEO Turnover-Performance Sensitivity
26/29
LBOs only
CEOturnover
(1) (2) (3) (4) (5) (6) (7) (8)
Intercept -1.87*** -2.01*** -1.88*** -1.77*** -1.92*** -1.97*** -2.61*** -1.83***(-10.52) (-6.96) (-7.93) (-8.42) (-5.31) (-6.50) (-4.94) (-4.19)
∆PM-1 -0.02** -0.04 -0.04** -0.01 -0.01 -0.01 -0.21*** -0.13**(-2.04) (-1.58) (-2.01) (-1.34) (-0.31) (-0.41) (-3.60) (-2.13)
LBO dummy 0.24 -0.12 1.14*(0.67) (-0.28) (1.82)
∆PM-1 x 0.03 0.01 0.19*** LBO dummy (0.99) (0.38) (3.23)
Percentage of LBO sponsors 0.03 -0.09 0.02(0.04) (-0.07) (0.02)
∆PM-1 x 0.06* 0.05 0.20** Percentage of LBO sponsors (1.87) (0.80) (2.12)
Psuedo R-squared 1.8% 2.5% 3.0% 1.5% 0.1% 0.3% 17.2% 15.1%Log psuedo likelihood -125.80 -124.92 -124.31 -64.10 -72.77 -72.66 -45.39 -46.52Obs 320 320 320 155 196 196 124 124
CEO Turnover CEO Turnover CEO Turnover
Whole sample No CEO change in transition CEO change in transition
CEO Turnover in LBOs: The Role of Boards – Cornelli and Karakaş
• For the deals where the CEO is changed, i.e. the ones where monitoring takes place, the turnover is sensitive to performance.
• The sensitivity for these deals is lower than in the corresponding matching companies.
• The sensitivity for these deals is lower the higher is the involvement of the sponsors.
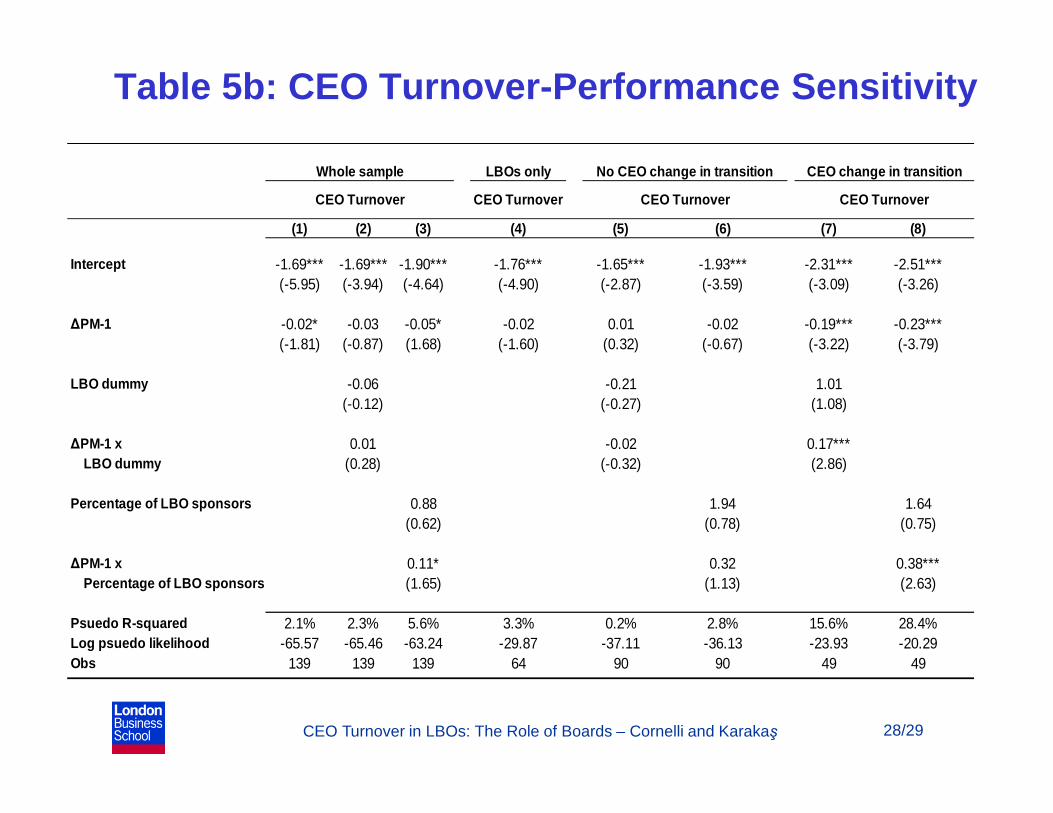
• Since we do not know whether these changes are unexpected changes, we conduct the same analysis restricting it to the cases where the change in profit margins was negative.
• The underlying idea is that they were unlikely to expect a worsening of the margins.
• Results do not change.
27/29
CEO Turnover in LBOs: The Role of Boards – Cornelli and Karakaş
Table 5b: CEO Turnover-Performance Sensitivity
28/29
LBOs only
(1) (2) (3) (4) (5) (6) (7) (8)
Intercept -1.69*** -1.69*** -1.90*** -1.76*** -1.65*** -1.93*** -2.31*** -2.51***(-5.95) (-3.94) (-4.64) (-4.90) (-2.87) (-3.59) (-3.09) (-3.26)
∆PM-1 -0.02* -0.03 -0.05* -0.02 0.01 -0.02 -0.19*** -0.23***(-1.81) (-0.87) (1.68) (-1.60) (0.32) (-0.67) (-3.22) (-3.79)
LBO dummy -0.06 -0.21 1.01(-0.12) (-0.27) (1.08)
∆PM-1 x 0.01 -0.02 0.17*** LBO dummy (0.28) (-0.32) (2.86)
Percentage of LBO sponsors 0.88 1.94 1.64(0.62) (0.78) (0.75)
∆PM-1 x 0.11* 0.32 0.38*** Percentage of LBO sponsors (1.65) (1.13) (2.63)
Psuedo R-squared 2.1% 2.3% 5.6% 3.3% 0.2% 2.8% 15.6% 28.4%Log psuedo likelihood -65.57 -65.46 -63.24 -29.87 -37.11 -36.13 -23.93 -20.29Obs 139 139 139 64 90 90 49 49
Whole sample No CEO change in transition CEO change in transition
CEO Turnover CEO Turnover CEO Turnover CEO Turnover
CEO Turnover in LBOs: The Role of Boards – Cornelli and Karakaş
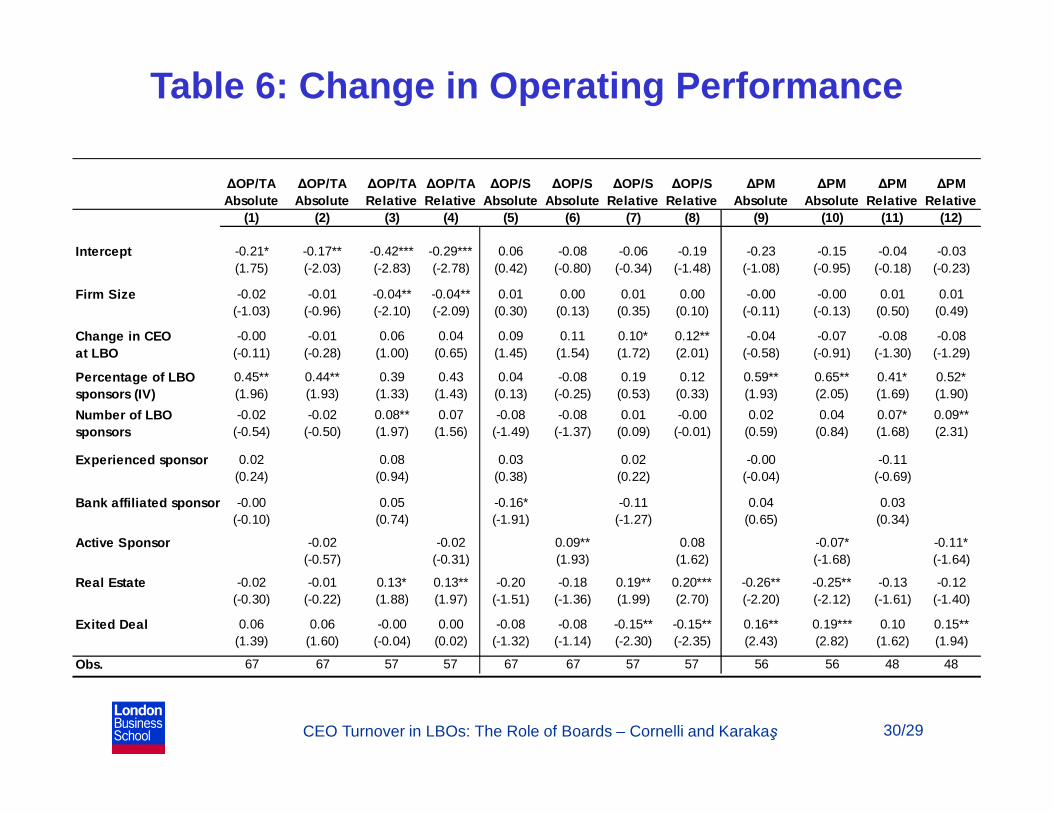
Operating Performance
• Are involvement and intervention ultimately a good thing?• Measures:
– Operating profits over sales– Operating profits over total assets – Profit Margins.
• Change in these measures change from the year just before the company is taken public to the year just before exit (or the last year if the deal has not been exited yet). – We have 67 or less observations due to data issues.
• 2SLS analysis – First stage: Regression 1 or 4 of Table 3– Second stage: Regression of changes in operating performance
both in absolute terms and relative to the matching companies.
29/29
CEO Turnover in LBOs: The Role of Boards – Cornelli and Karakaş 30/29
Table 6: Change in Operating Performance
∆OP/TA ∆OP/TA ∆OP/TA ∆OP/TA ∆OP/S ∆OP/S ∆OP/S ∆OP/S ∆PM ∆PM ∆PM ∆PMAbsolute Absolute Relative Relative Absolute Absolute Relative Relative Absolute Absolute Relative Relative
(1) (2) (3) (4) (5) (6) (7) (8) (9) (10) (11) (12)
Intercept -0.21* -0.17** -0.42*** -0.29*** 0.06 -0.08 -0.06 -0.19 -0.23 -0.15 -0.04 -0.03(1.75) (-2.03) (-2.83) (-2.78) (0.42) (-0.80) (-0.34) (-1.48) (-1.08) (-0.95) (-0.18) (-0.23)
Firm Size -0.02 -0.01 -0.04** -0.04** 0.01 0.00 0.01 0.00 -0.00 -0.00 0.01 0.01(-1.03) (-0.96) (-2.10) (-2.09) (0.30) (0.13) (0.35) (0.10) (-0.11) (-0.13) (0.50) (0.49)
Change in CEO -0.00 -0.01 0.06 0.04 0.09 0.11 0.10* 0.12** -0.04 -0.07 -0.08 -0.08at LBO (-0.11) (-0.28) (1.00) (0.65) (1.45) (1.54) (1.72) (2.01) (-0.58) (-0.91) (-1.30) (-1.29)
Percentage of LBO 0.45** 0.44** 0.39 0.43 0.04 -0.08 0.19 0.12 0.59** 0.65** 0.41* 0.52*sponsors (IV) (1.96) (1.93) (1.33) (1.43) (0.13) (-0.25) (0.53) (0.33) (1.93) (2.05) (1.69) (1.90)
Number of LBO -0.02 -0.02 0.08** 0.07 -0.08 -0.08 0.01 -0.00 0.02 0.04 0.07* 0.09**sponsors (-0.54) (-0.50) (1.97) (1.56) (-1.49) (-1.37) (0.09) (-0.01) (0.59) (0.84) (1.68) (2.31)
Experienced sponsor 0.02 0.08 0.03 0.02 -0.00 -0.11(0.24) (0.94) (0.38) (0.22) (-0.04) (-0.69)
Bank affiliated sponsor -0.00 0.05 -0.16* -0.11 0.04 0.03(-0.10) (0.74) (-1.91) (-1.27) (0.65) (0.34)
Active Sponsor -0.02 -0.02 0.09** 0.08 -0.07* -0.11*(-0.57) (-0.31) (1.93) (1.62) (-1.68) (-1.64)
Real Estate -0.02 -0.01 0.13* 0.13** -0.20 -0.18 0.19** 0.20*** -0.26** -0.25** -0.13 -0.12(-0.30) (-0.22) (1.88) (1.97) (-1.51) (-1.36) (1.99) (2.70) (-2.20) (-2.12) (-1.61) (-1.40)
Exited Deal 0.06 0.06 -0.00 0.00 -0.08 -0.08 -0.15** -0.15** 0.16** 0.19*** 0.10 0.15**(1.39) (1.60) (-0.04) (0.02) (-1.32) (-1.14) (-2.30) (-2.35) (2.43) (2.82) (1.62) (1.94)
Obs. 67 67 57 57 67 67 57 57 56 56 48 48
CEO Turnover in LBOs: The Role of Boards – Cornelli and Karakaş 31/29
Conclusions
• When a company is taken private in an LBO, outsiders are replaced by PE sponsors who actively monitor.
• We observe a decrease in the CEO turnover and its sensitivity.
• A higher involvement of LBO sponsors decreases turnover and its sensitivity and improves operating performance.
• This supports the view that sometimes the boards of public companies rely too much on short-term performance when choosing to fire the CEO.
• Moreover it supports the inside information view of the board: LBO sponsors are like outsiders with inside information and their presence reduces the CEO turnover sensitivity.