Embed Size (px)
Citation preview

Department of Electrical Engineering and Information TechnologyInstitute for Media TechnologyDistributed Multimodal Information Processing GroupProf. Dr.-Ing. Eckehard Steinbach
Android Smartphone Application for DrivingStyle Recognition
Android Smartphone Applikation für Fahrstilerkennung
Radoslav Stoichkov
Project Thesis
Author: Radoslav StoichkovAddress:
Matriculation Number:Professor: Prof. Dr.-Ing. Eckehard SteinbachAdvisor: Prof. Dr. Matthias Kranz
Dipl.-Ing. Stefan DiewaldBegin: 20.08.2012End: 12.07.2013

Department of Electrical Engineering and Information TechnologyInstitute for Media TechnologyDistributed Multimodal Information Processing GroupProf. Dr.-Ing. Eckehard Steinbach
Declaration
I declare under penalty of perjury that I wrote this Project Thesis entitled
Android Smartphone Application for Driving Style RecognitionAndroid Smartphone Applikation für Fahrstilerkennung
by myself and that I used no other than the specified sources and tools.
Munich, 24.09.2013Radoslav Stoichkov
Radoslav Stoichkov

Kurzfassung
Heutzutage gibt es viele Applikationen und Systeme, die den Fahrstil erkennen. Nur wenige vondenen sind darauf gerichtet den Fahrer zu motivieren seinen Fahrstil zu verbessern und somiteinen besseren Spritverbrauch zu erzielen und zeitgleich das Unfallrisiko minimiert. Diese Systemebenutzen meistens fahrzeugabhängige Daten wie Motorleistung, Pedalstellung, Lenkwinkel, Datenvom CAN-Bus (controller area network) usw. Die fahrzeugunabhängige Smartphones sind abe fürFahrstilerkennung sehr gut geeignet, da sie zum Alltag gehören und mit vielen Sensoren ausgestat-tet sind. Die Applikation, die in dieser Arbeit präsentiert wird, zeigt wie der Fahrstil des Fahrersohne zusätzliches Hardware erkannt werden kann. Diese Arbeit zeigt wie eine Fahrstilerkennungmit Hilfe von “Sensor Fusion” möglich ist. Dafür werden neben dem Beschleunigungssensor auchdas Magnetometer und Gyroskop genutzt. Durch die Anzeige von Hinweisen nach jedem schlech-ten Fahrmaneuver soll dem Fahrer gezeigt werden, warum er/sie gerade einen schlechten Fahrstilhat und wie er/sie diesen verbessern könnte. Die angewandte Gamification hilft die Motivationdes Fahrers aufrecht zu erhalten sorgfältig zu fahren ohne gefährliche Manöver wie zu schnellesBeschleunigung/Bremsen oder scharfes Abbiegen. Die Speicherung der Fahrtroute mittels GPSund die Anzeige der Punktzahl für jede Fahrt soll dem Fahrer die Möglichkeit geben, dass er/sieseinen/ihren Fahrstil mit dem von seinen/ihren Freunden zu vergleichen oder bei der nächstenFahrt ein besseres Ergebnis für die gleiche Strecke zu erzielen. Die durchgeführten Tests zeigen,dass Sensor Fusion ein rauschärmeres Signal liefert und an diesem lässt sich den Fahrstil erkennen.
iii

Abstract
There are plenty of applications and systems that try to analyze the driving style of the driver. Afew of them aim to stimulate the driver to improve his driving style and by this way to achieve lowerfuel consumption and to lower the risk of traffic accidents. These systems and applications usecar-dependent (and usually expensive) information such as engine power, data from the CAN-bus,pedal pressure, wheel position etc.. The smartphones are already well integrated in the everydaylife. Because of that and the various embedded sensors in them, the smartphones represent asuitable platform to compute the driving behavior of the driver.The application presented in this work shows how the driving behavior could be estimated withoutadditional hardware besides the smartphone. This work shows how the driving style recognitioncan be achieved using sensor fusion. The sensor fusion method here uses the accelerometer,geomagnetic field sensor and the gyroscope. By displaying hints after each bad maneuver thedriver should notice when he has currently bad driving style and how he can improve it. Theused gamification aims to stimulate the user to maintain a good driving style and achieve a betterscore. The storage of the drive route via the GPS and the displayed driving score for each drivegive the user the possibility to compare his driving style to his friends or the opportunity to achievea better score when driving the same route the next time. The conducted tests show that thesensor fusion achieves less noisy result suitable for evaluation of the driving behavior.
iv

Contents
Contents v
1. Introduction 1
2. Equipment 3
3. State of the Art 83.1. On-board Systems . . . . . . . . . . . . . . . . . . . . . . . . . . . . . . . . . . 83.2. Mobile Applications . . . . . . . . . . . . . . . . . . . . . . . . . . . . . . . . . 103.3. Literature review . . . . . . . . . . . . . . . . . . . . . . . . . . . . . . . . . . . 12
4. Sensor Fusion 164.1. Calibration . . . . . . . . . . . . . . . . . . . . . . . . . . . . . . . . . . . . . . 164.2. Sensor Fusion . . . . . . . . . . . . . . . . . . . . . . . . . . . . . . . . . . . . 19
5. Driving Style Estimation Algorithm and Gamification 265.1. Driving Style Estimation Algorithm . . . . . . . . . . . . . . . . . . . . . . . . . 265.2. Gamification and Hints . . . . . . . . . . . . . . . . . . . . . . . . . . . . . . . 29
6. Tests 32
7. Used Tools 397.1. Eclipse . . . . . . . . . . . . . . . . . . . . . . . . . . . . . . . . . . . . . . . . 397.2. Charts . . . . . . . . . . . . . . . . . . . . . . . . . . . . . . . . . . . . . . . . 397.3. SQLite . . . . . . . . . . . . . . . . . . . . . . . . . . . . . . . . . . . . . . . . 397.4. Reused Code . . . . . . . . . . . . . . . . . . . . . . . . . . . . . . . . . . . . . 39
8. Conclusion 41
List of Figures 42
List of Tables 44
List of Acronyms 45
v

CONTENTS vi
Bibliography 46

Chapter 1.
Introduction
In 2007 the European Commission set a goal to stimulate the low-carbon economy and to reducethe CO-2 emissions globally [1]. One step in this direction is to reduce the fuel consumption of thecars. There are some systems and applications which aim to help the driver to achieve a betterdriving style and by this way to reduce his fuel consumption, to lower the risk of traffic accidentsand to lower the maintenance costs for the vehicle. But those systems are mostly attached todifferent hardware on the vehicle side such as engine, pedals, wheel, various sensors, etc. Thiscauses the systems to be vehicle-dependent. Nowadays mobile devices such as smartphones ortablet PCs become more and more popular and they seem to be applicable for different tasks onthe daily routine and that is why their use would open the possibility to have more independentsolutions to this problem. There are already several examples of coupling a mobile device withthe vehicle’s on-board systems [2, 3] and mobile applications are also used to provide advanceddriver assistance systems [4]. The few currently available smartphone applications dedicated tothe driving style detection focus more on the funny side of driving – how fast or powerful is my carand how fast could I accelerate and leave the good and safe driving style in the background. Theyalso rely in most cases only on the accelerometer and the GPS for their computations, but theaccelerometer is very noisy and its data is not very accurate. The sensor fusion approach shouldachieve better results and use the advantages of all used sensors and none of their disadvantages[5]. Because of that, this work presents a sensor fusion solution based on the readings from theaccelerometer, magnetometer and gyroscope. By displaying hints after each bad maneuver anda score for the drive, the user shall be motivated to maintain a good driving style and would beaware how to keep it [6]. By saving the GPS locations during the drive he could compare his styleto other people or to try to improve it the next time he takes the same route.The following chapters are organized as follows: In Chapter 2 the sensors which could be foundin the smartphones are explained. Chapter 3 will present the state of the art in the literatureand the available applications that could be found at the moment on the market. In Chapter 4,the calibration procedure and the sensor fusion method are discussed. Chapter 5 shows how thealgorithm for the driving style recognition works and how the driver is motivated to keep a gooddriving style. The performed tests and their evaluation are presented in Chapter 6. The used tools
1

Chapter 1. Introduction 2
are mentioned in Chapter 7 and at the end is the conclusion in Chapter 8.

Chapter 2.
Equipment
These days the smartphones are equipped with various sensors which could be classified in threecategories: motion, position and environmental sensors [7]. The Android platform provides twohardware based sensors built-in in the phone, used to track its motion [8]. The accelerometer isthe most common sensor included in almost every smartphone and the gyroscope could be foundin many new devices. The motion sensors are used to track the device movement, for example, intilt, rotation, swing or shake movements. It could be a reflection of direct user input (for instance,a user steering a car in a game) or it could also represent a reflection of the physical environmentin which the device is sitting (for example, moving with you while driving a car) [7, 8].The purpose of the position sensors is to measure the physical position of the device. Examplesfor these are the geomagnetic field sensor (magnetometer) and the orientation sensor [7].The third category measures environmental parameters such as light, temperature, humidity, etc.[7].This work concentrates only on the sensors of the first two categories since the information fromthem is essential to determine the driving style.
Acceleration Sensor
The accelerometer has three axes: x, y and z and it measures the acceleration forces along themincluding the force of gravity. The unit of measure is m/s2.
The accelerometer and the gyroscope use the same standard sensor coordinate system (seeFigure 2.1). Therefore when the device lays flat on the table in its own natural screen orientation(portrait for the smartphones or landscape mode for the most tablets, see Figure 2.2) it wouldmeasure the following:
If the device is pushed on the left side (so it moves to the right), the x acceleration value will bepositive. The X-Axis is used to detect left or right detection movements which occur mostly when
3

Chapter 2. Equipment 4
Figure 2.1.: Coordinate system (relative to a device) that’s used by the Sensor API.
Source: http://developer.android.com/guide/topics/sensors/sensors_overview.html,accessed March 25, 2013
Figure 2.2.: Portrait and landscape screen orientation for a tablet/smartphone.
Source: http://www.data-factory.net/var/storage/images/media/images/portrait-und-landscape-sicht-bei-mobilgeraeten/46070-1-ger-DE/Portrait-und-Landscape-Sicht-bei-Mobilgeraeten_lightbox.png, accessed July 23, 2013

Chapter 2. Equipment 5
the driver is steering the car.If the device is pushed on the bottom (so it moves away from the user), the y acceleration valuewill be positive. The Y-Axis is used to measure the front/rear direction of the phone which occurwhen the driver is accelerating and/or braking.If the device is pushed toward the sky with an acceleration of A m/s2, the z acceleration valuewill be equal to A + 9.81, which corresponds to the acceleration of the device (+A m/s2) minusthe force of gravity (-9.81 m/s2). The Z-Axis is used to measure the up/down movement of thephone, which are typically caused by bad road conditions.The stationary device will have an acceleration value of +9.81, which corresponds to the acceler-ation of the device (0 m/s2 minus the force of gravity, which is -9.81 m/s2) [8, 9].A big advantage of the accelerometer is that it uses about ten times less energy than the othersensors in the phone [8].
Gyroscope Sensor
The gyroscope measures the rate of rotation of the device around its axes. The unit of measureis rad/s. The rotation is positive in the counter-clockwise direction and negative in the clockwisedirection (see Figure 4.4). Normally, the gyroscope data is integrated over time to compute arotation describing the change of angles over the passed time since the last detected rotation. Thenumeric integration cause some errors due to “bias instability”, commonly referred to a “drift”.It is produced when small, slow-changing deviations from the correct signal are integrated withrespect to time [5]. This needs to be handled and mostly it is done by comparing the gyroscopedata with the output from other sensors such as accelerometer or the gravity sensor [8, 10].
Geomagnetic Field Sensor
The magnetometer is another hardware-based sensor that can be found in most phone or tabletdevices running with Android. It measures the earth’s magnetic field in microtesla (µT) for eachof the three coordinate axes (see Figure 2.1). Usually the geomagnetic field sensor is used incombination with another sensor such as the rotation vector sensor (to measure the raw rota-tional movement) or the acceleration sensor (in order to determine the azimuth and geomagneticinclination data) [11]. However the major problem of the magnetometer is that its readings couldinfluence the received data if there is a metal or magnet nearby [12].
Orientation Sensor
The orientation sensor is used to obtain the device’s position in the application’s frame of referenceof the user. It is a software-based one (it isn’t physically available and its data is obtained from

Chapter 2. Equipment 6
other sources) deriving its data by processing the raw data from the acceleration and geomagneticfield sensors. The orientation sensor was marked as deprecated in Android 2.2 (API Level 8),because the obtaining of data from the sensors and its processing was too heavy for the system,which led to decreased sensor accuracy (in particular, this sensor is only reliable when the rollcomponent is 0) [11, 12].
Global Positioning System
The Global Positioning System (GPS) has numerous advantages, but consumes a lot of energy.Also there is a problem with the localization as it is not always very accurate and could havea localization error of about 10-20 meters [13]. Another problem is that it doesn’t have a purecoverage indoors, in tunnels or underground and could be badly affected from the environmentconditions (cloudy sky, many trees, etc.) [12]. However when the readings are accurate, thenGPS could provide various information such as location, speed, heading, distance between points,altitude [12, 14].
Sensor and Vehicle Coordinate System
The sensor framework uses a 3-axis coordinate system to express data values and is used by theaccelerometer and the gyroscope sensor as well. This system is defined relative to the device’sscreen when it is held in its default orientation (see Figure 2.1). There are a couple of characteristicfeatures which have to be mentioned. First the coordinate system does not change the positionof the axes when the device is rotated or moved in any way. Secondly, the device’s default screenorientation is not in portrait mode for every device. It could be set to the landscape mode as itis for many tablet devices [15]. The sensor framework uses a 3-axis coordinate system to expressdata values and is used by the accelerometer and the gyroscope sensor as well. This system isdefined relative to the device’s screen when it is held in its default orientation (see Figure 2.1).There are a couple of characteristic features which have to be mentioned. First the coordinatesystem does not change the position of the axes when the device is rotated or moved in anyway. Secondly, the device’s default screen orientation is not in portrait mode for every device (seeFigure 2.2). It could be set to the landscape mode as it is for many tablet devices [15].
The axes of the phone are different from the axes of the vehicle as it could be seen in the Figures2.1 and 2.3. In order to get accurate readings in each orientation in which the phone is laid inthe car, its axes should be reoriented like the vehicle axes. This is achieved with calibration of thephone’s axes and will be discussed later in Section 4.1 [16].

Chapter 2. Equipment 7
Figure 2.3.: For accurate readings regardless the phone’s position and orientation in the car, thesensor axes of the smartphone have to be reoriented according to the vehicle axes[16].
Source: Bhoraskar [16]

Chapter 3.
State of the Art
3.1. On-board Systems
There is a trend among the car industry companies to develop programs/apps/software which aretelling the driver how good his driving behavior is. Most of them work with the built-in sensors(engine sensors, wheel sensors, etc.) in the car and there is almost no need of additional hardwareto install (like a camera). Some examples are the systems of:
• Scania - Eco-ModulScania offers a product called “Scania Fahrer Eco-Modul” which is a real-time supportsystem that provides the driver with feedback and tips how to optimize his driving style.This module processes the data from several on-board sensors in the vehicle and analyzes inthis way the driving behavior of the driver. The system indicates when the trucker makes amistake such as hard acceleration, wrong gear choice, etc., and gives hints how to improvehis driving. It monitors the following 4 categories: hill driving, gear choice, anticipation(heavy accelerations and decelerations and the time interval between these events), brakeuse and displays the driver’s score on the on-board computer. This score could be an averageof all four elements or it could be shown for every single one separately. In this manner thetrucker could see which part of his driving behavior has a room for improvement [17].
• Iveco - Driving Style Evaluation SystemIveco has a system embedded in the truck STRALIS HI-WAY which is called “Driving StyleEvaluation System” and should assist the driver in terms of fuel economy. To do this itmonitors various data from the vehicle, engine and the GPS, and runs this data throughan algorithm developed by Iveco. The accumulated data is divided in several sections:acceleration, deceleration, inertia, braking frequency, fuel saving, gear-shifting, auxiliarybrake. The processing of the data is independent from the car configuration and does notaffect the speed. The tips which are given to the trucker are real-time and mostly aboutthe gear shifting and the use of brake, engine brake, acceleration and inertia forces [18].
8

Chapter 3. State of the Art 9
Figure 3.1.: Iveco Driving Style Evaluation System
Source: http://web.iveco.com/uk/Products/Pages/stralis-hi-way-driving-style-evaluation.aspx,accessed March 25, 2013
• Mercedes - AMG Performance MediaThe product of Mercedes is called AMG Performance Media. Though it is probably notdesigned to encourage the economic and careful way of driving but rather to demonstratehow fast and powerful the car is, the AMG Performance Media has plenty of data to presentto the driver. From the vehicle specific data such as motor oil temperature, engine powerand current tire pressure through lateral and longitudinal acceleration, gas and brake pedalposition, torque, wheel position, to recording a journey/race via GPS, analysis and displayof journey information such as lap times, and analysis of sectors [19–21].
• Volvo - Driver Alert ControlThe Driver Alert Control is a system of Volvo which monitors the movements of the steeringwheel and the data from a single camera. By doing so it helps to prevent accidents caused byfatigue or distraction. When the system detects that the driver is not driving in a controlledway according to his previous or usual behavior, he is alerted by an alarm and a hint is givento take a break [22].
• Punch Telematix - CarCubeCarCube is a board computer developed by Punch Telematix which has an additional drivingstyle assistant system. It provides data about the acceleration, deceleration, revolutions perminute (RPM), speed and stationary behavior of the driver. When the driver knows thathis driving style has room for improvement he could change it and this will change his fuelconsumption and maintenance costs. The German transport company Greiwing Transportmonitored its whole fleet for about a year and came to the conclusion that even by preventingthe useless fuel consumption in car traffics or when stopped they save enough money to coverthe cost for installing the board computers in all vehicles. Greiwing Transport introducedanother feature to help the drivers - if for the past month the driving style meets the set

Chapter 3. State of the Art 10
requirements from the management, then the driver gets a bonus to his salary up to 100Euro. In this way the truckers are motivated to drive more economically and environmentallyfriendly [23].
• Car2Go - EcoScoreDaimler has a subsidiary company named Car2Go, which offers car-sharing services in about20 cities in Europe and North America. Some of the vehicles are equipped with the systemEcoScore. It provides the driver with information about how environmentally sustainable hedrives. There are three categories of data which are essential for the overall score of thedriving style: acceleration, braking and consistent way of driving [24–28].
• Driver Awareness Panel (DAP)The Driver Awareness Panel is a device which monitors and analyzes the data from thevehicle CAN-bus. The possible events registered from the DAP are harsh driving, harshbraking, high RPM, over torque, anticipated driving. These events are then compared to anexisting database with fleet and vehicle performance standards and by flashing green or redLED it notifies the driver about his driving behavior [29, 30].
Conclusion: The on-board systems tend to use the acceleration and deceleration forces acting onthe car, the RPM (gear change/choice) and the anticipation of the driver in order to give himsome hints about his driving style. These systems aim to stimulate and motivate one more secureway of driving, with lower cost for fuel consumption and maintenance and in this way affectingless the environment. Because in 2012 the highest concentration of CO2 in the atmosphere1 wasmeasured, a goal was set by the European Commission to stimulate the low-carbon economy andto reduce the CO2 emissions in order to prevent a catastrophic environmental change and reducethe effects of the global warming. This is the so-called “20-20-20” target [1].By achieving a lowerfuel-consumption it could be considered that a small step is made in this direction.
3.2. Mobile Applications
Among the mobile applications that could be used to analyze the driving behavior the followingones should be mentioned:
• greenMeter: The greenMeter [31] is an app designed for iOS-based devices. Based on thereceived data from the accelerometer it offers the user information about the current drivingstyle such as fuel consumption/cost, crude oil consumption, carbon emission, environmentalimpact. It also uses the physics engine from the gMeter [32](An app designed by the samecompany). The accelerometer data gives details about the forward and lateral g forces,acceleration, velocity, distance traveled, and engine power.
1Max-Planck-Gesellschaft: http://www.mpg.de/6678112/carbon-dioxide-climate-change

Chapter 3. State of the Art 11
• DriSMo (Driving Skill Monitor): This app has the task to monitor the driving skill by usingthe acceleration sensor only. When the device is mounted in the car and calibrated, thenthe app shows information about the current driving style of the driver. In background,the GPS is used to log the trip so that its path could be drawn on a map after the tripends. In this way the problem sections (bad driving style) could be easily distinguished andthe driver could make his own conclusions where exactly he should improve his own drivingstyle. The data is also logged so that the current trip could be analyzed later or comparedwith a similar one [33].
• Driverwise.ly is an app that monitors the acceleration, braking, cornering, high and lowspeed during the drive. Based on the accumulated data from the accelerometer and GPS,it estimates how much gas was saved/wasted by the driver according to his driving style forthe above mentioned elements. A score for each section can be viewed and an overall onecould be compared with friends or other drivers via social platforms [34–36].
• Dynolicious Fusion: The Dynolicious Fusion is an iOS app, which uses sensor fusion to getmore accurate results for the accumulated data. The sensor fusion algorithms used fromthe developer company BunsenTech rely on the inputs from the accelerometer, gyroscope,magnetic field sensor, and GPS to display various information about the car and its achieve-ments on the road such as: forward, lateral and braking G-Forces, speed, wheel horsepower,time needed for 0-60 Mile-per hour and 1/4 mile, friction circle. The device can be mountedin any orientation and is automatically calibrated. The app also has a social component, sothat the user could create an online presence of his vehicle, upload photos and write storiesabout it as well as document its performance. On the other hand, he can browse the otherusers’ vehicles, follow the ones interested in and interact with their owners [37–39].
• Driver Feedback: Relies on the accelerometer to detect acceleration, deceleration and turningevents and on the GPS location in order to see after the trip a map of the route with on-screen annotations where the events occurred. Depending on the score it is possible tocompare two trips against each other [40] .
• iOnRoad Augmented Driving Pro: This app relies not only on the sensors in the phone, butalso on the GPS and the built-in camera to track for lane changes, speed limits, to give awarning about a potential collision with the front car or some other obstacle, or to monitorthe headway distance [41].
• BMW M Power Meter and Smart Speedometer: BMW M Power Meter is an app availableonly for iPhone, which gives information about the drivers’ lateral and longitudinal accelera-tion, speed, travel time for a particular distance and acceleration time up to a specific speed.The data is obtained from the accelerometer in the iPhone and is made more accurate withthe GPS readings [42–44].

Chapter 3. State of the Art 12
A similar app is the Smart Speedometer for Android, which relies on the same raw data,but measures only the acceleration and braking forces which are affecting the car, and itsspeed [45].
• There are a lot more mobile applications which measure the speed or the acceleration ofthe driver. Most of them rely only on the accelerometer, but some use the GPS data todo that as well. Examples are: SpeedView: GPS Speedometer2, Ulysse Speedometer Pro3,Carmeter - Performance - Light4, Garmin Mechanic™5, GSpeedo6, Eco Driving7, Drivea -Driving Assistant App8.
Conclusion: The majority of the current available apps use the accelerometer to provide informa-tion about the driving style of the driver. They concentrate mostly on the car’s performance, ratherthan on the driving style of the driver and are commonly used to entertain the user and to showhim how fast he can drive, instead of teaching him to drive carefully and environment-friendly.Nonetheless there are some apps that are useful in obtaining information about the driving style.
3.3. Literature review
In relation to the “20-20-20” initiative mentioned above, the technical improvements on the carscould help but the driving style still plays a crucial role in the fuel consumption as has beendemonstrated in many studies such as the one by Mierlo [46]. Studies by Toyota prove thataround 20% of the cars energy consumption could be affected by the driver [47]. To reduceenergy consumption and greenhouse gas emissions it is also necessary that the driver takes anefficient driving style. Adopting this it can make savings of 10 to 25% of fuel [48–50]. Above all,it also has further advantages (it improves comfort, reduces the risk and severity of accidents andthere is less erode of vehicle components) [51].The driving style of a person could be determined with questionnaires as Y. Chung et al. (recklessand careless, anxious, angry and hostile, and patient and careful)[52] and Taubman-Ben-Ari etal. (dissociative, anxious, risky, angry, high-velocity, distress reduction, patient, and careful) [53]did that. Bär et al. also describe in their work 5 driving styles: aggressive, anxious, economical,keen and sedate [54]. Though the different definitions, driving styles are mostly divided into threemajor categories [48, 50, 55–57]:
1. calm driving or economical driving style - mild drivers who anticipate other road user’s
2https://play.google.com/store/apps/details?id=com.linxmap.gpsspeedometer&hl=en3https://play.google.com/store/apps/details?id=com.binarytoys.speedometer4https://play.google.com/store/apps/details?id=de.oceanApp.CarMeterLight5https://play.google.com/store/apps/details?id=com.garmin.android.apps.mech&hl=en6https://play.google.com/store/apps/details?id=net.hargassner.speedo7https://itunes.apple.com/dm/app/eco-driving/id382787209?mt=88https://play.google.com/store/apps/details?id=com.driveassist.experimental&hl=en

Chapter 3. State of the Art 13
movement, traffic lights, speed limits, and avoid hard acceleration. This driving style shouldbe most fuel efficient.
2. medium driving style - normal drivers who drive with moderate acceleration and braking.This driving style is less fuel efficient compared to the calm driving style.
3. sporty driving style - aggressive drivers who drive with sudden acceleration and heavy braking.This driving style will deteriorate the fuel economy.
The driving style can not be revised as something static. It is the dynamic behavior of a driver onthe road. There are times at which a driver can be calm but aggressive at others [57].
Abnormal driving behavior like driving above the speed limit, quickly and unpredictably changingthe vehicle’s lateral position or changing speed rapidly is caused by psychological and physicalfactors. Fatigue, bad attitude, sleepiness or alcohol lead to abnormal driving style. In addition tothe errors made by the drivers, this is the cause for the majority of the car accidents [58].
Aljaafreh et al. [59] notice that the detection of abnormal driving could be split into two sections:to monitor the driver intentions (when does the driver intent to change the lanes or to brake)or to monitor the human-machine interactions (how is the driver handling the car). The firstmethod is mostly combined with the use of cameras as seen in the work of Zhu et al. who trackthe eyelid movement, facial expression or head movement and predict the drivers fatigue basedon a probabilistic method [60].According to Lee et al., another possible use of the cameras is to follow the line of sight of thedriver as well as the driving path, and to compute the correlation between them to analyze thedriving patterns and status [61]. McCall and Trivedi also rely on videos but for lane estimationand lane tracking to assist the driver in terms of lane changing and lane lane keeping [62].Besides the cameras, the physiological signals could detect abnormal driving as well. By analyzingbrain activity, skin conductance or electromyogram for the muscle activity a driver’s fatigue couldbe noticed.The second method monitors the human-vehicle interactions. Examples are the work of Krajewskiet al., who computed the fatigue from the steering behavior [63]. Or the work of Dai et al. fordetection of drunk drivers based on the acceleration readings from the sensors embedded in aphone [64].The solution of Mohamad et al. is based on real-time GPS data. They describe how the differentdriver behaviors (normal/abnormal) could be detected using real time global positioning systemdata. However, due to the fact that the GPS Signal could sometimes be lost (in a tunnel or bybad weather conditions) [58], this work rely completely on the sensor values gathered during thedrive and the GPS data is used only to display the path on a map.
Chapter 3. State of the Art 14
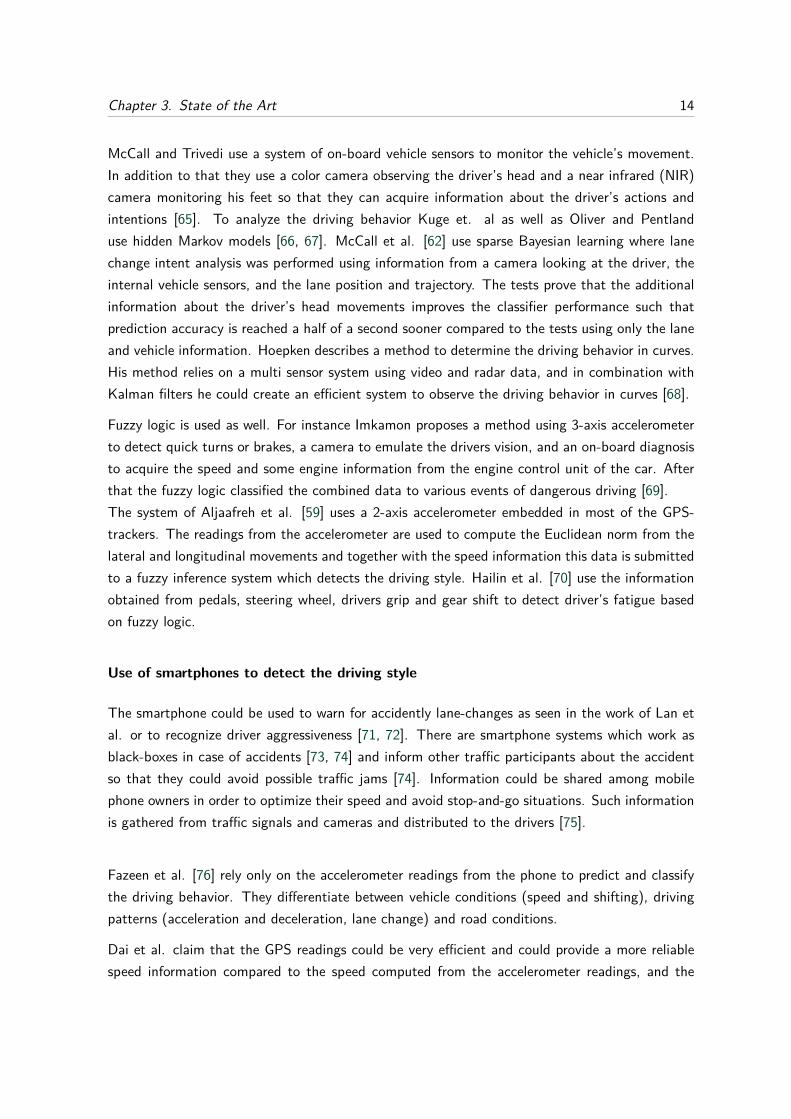
McCall and Trivedi use a system of on-board vehicle sensors to monitor the vehicle’s movement.In addition to that they use a color camera observing the driver’s head and a near infrared (NIR)camera monitoring his feet so that they can acquire information about the driver’s actions andintentions [65]. To analyze the driving behavior Kuge et. al as well as Oliver and Pentlanduse hidden Markov models [66, 67]. McCall et al. [62] use sparse Bayesian learning where lanechange intent analysis was performed using information from a camera looking at the driver, theinternal vehicle sensors, and the lane position and trajectory. The tests prove that the additionalinformation about the driver’s head movements improves the classifier performance such thatprediction accuracy is reached a half of a second sooner compared to the tests using only the laneand vehicle information. Hoepken describes a method to determine the driving behavior in curves.His method relies on a multi sensor system using video and radar data, and in combination withKalman filters he could create an efficient system to observe the driving behavior in curves [68].
Fuzzy logic is used as well. For instance Imkamon proposes a method using 3-axis accelerometerto detect quick turns or brakes, a camera to emulate the drivers vision, and an on-board diagnosisto acquire the speed and some engine information from the engine control unit of the car. Afterthat the fuzzy logic classified the combined data to various events of dangerous driving [69].The system of Aljaafreh et al. [59] uses a 2-axis accelerometer embedded in most of the GPS-trackers. The readings from the accelerometer are used to compute the Euclidean norm from thelateral and longitudinal movements and together with the speed information this data is submittedto a fuzzy inference system which detects the driving style. Hailin et al. [70] use the informationobtained from pedals, steering wheel, drivers grip and gear shift to detect driver’s fatigue basedon fuzzy logic.
Use of smartphones to detect the driving style
The smartphone could be used to warn for accidently lane-changes as seen in the work of Lan etal. or to recognize driver aggressiveness [71, 72]. There are smartphone systems which work asblack-boxes in case of accidents [73, 74] and inform other traffic participants about the accidentso that they could avoid possible traffic jams [74]. Information could be shared among mobilephone owners in order to optimize their speed and avoid stop-and-go situations. Such informationis gathered from traffic signals and cameras and distributed to the drivers [75].
Fazeen et al. [76] rely only on the accelerometer readings from the phone to predict and classifythe driving behavior. They differentiate between vehicle conditions (speed and shifting), drivingpatterns (acceleration and deceleration, lane change) and road conditions.
Dai et al. claim that the GPS readings could be very efficient and could provide a more reliablespeed information compared to the speed computed from the accelerometer readings, and the

Chapter 3. State of the Art 15
radius of curvature of the vehicle moving path could be used for recognizing certain types ofdriving behavior [64]. Nonetheless its localization accuracy represents a problem because of thelocalization error at the magnitude of several meters which can occur using GPS. Moreover, theGPS consumes much more energy than the other sensors in the phone and thus leads to higherbattery drain [9].
A future area also discussed in the work of Dai et al. [64] is that phones equipped with a cameracould be very efficient during the drive since they could capture or mark road signs and follow thedrivers’ sight line. However, their high energy consume, complicated algorithms and “intensivecomputations for the limited computation capability of mobile phones” lead the authors to a moresimple but also effective style for driving detection based on the accelerometer and orientationsensor of the phone.
Magana [51] uses the light sensor in the phone to obtain information about the environment inwhich the car is moving, because the brightness directly affects the visibility of the driver andthis influences his anticipation. Another novel method in the work of Magana is the weatherinformation involved in estimating the driving behavior. This information is obtained from theInternet connection of the smartphone.
Araujo et al. [47] present a smartphone application which uses the information from the embed-ded sensors and the vehicles state information acquired from the vehicles CAN bus (speed, fuelconsumption, GPS, etc.). The gathered data is passed to a fuzzy-based module which analyzesthe data and classifies it and then an suggestion is presented to the driver how to optimize thefuel energy consumption/driving behavior.
Langari, Murphey and Holmén attempt to classify the driving style by using “the ratio of thestandard deviation and the average acceleration extracted from the acceleration profile within aspecified window”9 [49, 50, 77]. A fuzzy rule classification was made referring to a conclusionmade by Igrashi et al.[78] that typical average acceleration ranges in a city are different for thevarious driving styles [57].
Murphey et. al [50] propose to categorize the different driving styles according to the measurehow fast the driver accelerates and decelerates. The developed algorithm extracts jerk featuresfrom the current vehicle speed within a short time-window, and classifies the current driving styleinto three categories: calm, normal and aggressive, by comparing the extracted jerk feature withthe statistics of the driver styles on the current roadway.
Few papers use dynamic time warping to detect repeating patterns of driving behavior. It comparesthe current data read from the sensors with the previously saved template data that is markedas aggressive driving style. If the current data is similar to the template data, then the currentdriving style is marked as aggressive [72, 79].
9Wang [57]

Chapter 4.
Sensor Fusion
4.1. Calibration
The axes of sensor coordinate system are pointing always in the same directions regardless of thephone’s position. For this reason a calibration of the phone and its sensors is needed, to insureindependence of the sensor values from the phone’s position and orientation in the car. Thediagram of the calibration procedure can be seen in Figure 4.1. An important notice is that ifthe car is on a slope during the calibration the readings will be affected and this will lead to poorresults.The driver is asked to keep the car motionless during the first step of the calibration. During thisperiod the pitch and roll rotation angles are determined according to the vehicle’s level. The pitchand roll are computed by measuring the angle between two given points (provided by the filteredacceleration/sensor vector) with the help of the atan2 function (see Equation 4.1, 4.2), and theirvalues are stored in the sensorHandler.
roll = 2 ∗ arctan( filteredV ectors[2]√filteredV ectors[0]2 + filteredV ectors[0]2 + filteredV ectors[0]
) (4.1)
pitch = 2 ∗ arctan( filteredV ectors[2]√filteredV ectors[1]2 + filteredV ectors[1]2 + filteredV ectors[1]
) (4.2)
The second step is to determine the XY magnitude offset. By calculating the average magnitudebetween the X and Y axis (already rotated according to the pitch and roll values computed in theprevious step) it is possible to detect if the vehicle is moving or not.
magnitude =√rotatedV ectors[0]2 + rotatedV ectors[1]2 (4.3)
If the value of the magnitude is varying a lot, then the vehicle is in motion and the calibrationprocedure has to be restarted. Otherwise, the value of the current magnitude is added to a bufferand an average counter is incremented (Equation 4.4, 4.5). After enough values have been stored
16

Chapter 4. Sensor Fusion 17
Figure 4.1.: The flow of the calibration process
Source: Hørtvedt, Kvitvik and Myrland [33]

Chapter 4. Sensor Fusion 18
in this buffer, then the XY magnitude offset is computed (Equation 4.6).
averageBuffer = averageBuffer +magnitude (4.4)
averageCounter = averageCounter + 1 (4.5)
xyMagnitudeOffset = averageBuffer
averageCounter(4.6)
The last step is to compute the yaw angle, which is done by asking the driver to drive forward.The XY magnitude has to be checked if its value is greater than a previously determined threshold,and if that is the case, the vehicle is in motion. Like the pitch and roll angles, the yaw angle iscomputed. When there are enough angles to calculate the direction, the average of them is takenas the yaw angle (Equation 4.7). It is updated in the sensorHandler and the calibration is finished.
yaw = averageBuffer
averageCounter(4.7)
After this step every accelerometer data read by the phone is rotated according to the computedroll, pitch and yaw angles, so that it points correctly according to the phone’s position in the car(see Listing 4.1 and Equations 4.8 and 4.8).
Listing 4.1: The rotate methods are called for every new accelerometer datar o t a t e ( r o l l , 0 , 2 , s en so rDataVec to r ) ;r o t a t e ( p i t ch , 1 , 2 , s en so rDataVec to r ) ;r o t a t e ( yaw , 0 , 1 , s en so rDataVec to r ) ;
pub l i c s t a t i c void r o t a t e ( double radAngle , i n t xCoord ina te , i n tyCoord ina te , f l o a t [ ] v e c t o r s ) {
. . .}
The rotate method has the following parameters:
• radAngle - The rotation angle in radians computed in the calibration step
• xCoordinate - Index of the X coordinate
• yCoordinate - Index of the Y coordinate
• sensorData - Vector with the sensor data
The following transformations are made in the rotate method:
sensorData[yCoordinate] = sensorData[xCoordinate] ∗ sin(radAngle)+
sensorData[yCoordinate] ∗ cos(radAngle)(4.8)

Chapter 4. Sensor Fusion 19
sensorData[xCoordinate] = sensorData[xCoordinate] ∗ cos(radAngle)−
sensorData[yCoordinate] ∗ sin(radAngle)(4.9)
4.2. Sensor Fusion
The obtaining of the current orientation from the phone is a common issue. There are severalapproaches to solve this problem - either using the orientation sensor, with a combination of theaccelerometer and geomagnetic-field sensor, with the gyroscope sensor or with a method calledsensor fusion [5, 12].The software-based orientation sensor was declared as deprecated from the Android developers[11].By means of the accelerometer and the magnetometer we can determine which direction is themagnetic north and which one is the magnetic south (with this information we can computethe pitch, roll and yaw angles needed for the orientation) [16]. The problem is that these twosensors have some faults in the data they are providing. The accelerometer (used to determinethe pitch and roll) and the magnetometer (used to determine the azimuth angle regarding theEarth’s magnetic field) are too noisy and give faulty results. Moreover, the magnetometer has alow reaction time and this leads to a visible lagging update of the azimuth angle when the deviceis turned horizontally [80].The gyroscope based method seems to be simple since the user can take fast and accurate angularvelocity measurement for each axis and then compute the orientation angles. But the gyroscopesthat are embedded in the most smartphones are from low quality because the high quality onesare too expensive for the smartphones [81]. The problem with this sensor is that it has bias error.This is the average output from the gyroscope when there is no rotation at all. The readingsshould point 0, 0, 0 but, since this does not happen, it leads to integration errors, where the biascould be seen as a drift increasing linearly over time (see Figure 4.2) [81][10].Because none of these methods works accurately to determine the orientation of the phone,
a new method is provided, called sensor fusion. It combines the data from these three sensorsand compensates the weakness of one sensor with the strength of the other. The combineddata is more accurate and flawless than the one used from the sensors individually. In this waythe low-noise gyroscope data is used in short time intervals for the orientation computation Inorder to filter out the drift, it is compared with the readings from the orientation data receivedfrom the accelerometer/magnetometer, which do not drift over longer periods of time. Thereare two ways how to implement the sensor fusion explained in the literature. They could bedivided into a simple and a proprietary approach. The proprietary approach is invented by thecompany Invensense. They developed sensor fusion algorithms and sensors, and built them into thehardware of the smartphone manufacturers they are working with. These sensor fusion algorithmsare not available to other developers but it is supposed that they are already integrated in some

Chapter 4. Sensor Fusion 20
Figure 4.2.: Integrated Gyro Signal, Drifted Yaw, Pitch, Roll angles when phone is at rest
Source: Ayub [81]

Chapter 4. Sensor Fusion 21
devices such as Samsung Galaxy Tab 10.1, HTC EVO 3D and Galaxy Nexus, which are using theInvensense brand gyroscopes. Therefore some authors [5, 12] advise that the developers shoulduse SensorManager.getOrientation() and Sensor.TYPE_ROTATION in their applications on suchdevices. Milette et al. hope that the sensor fusion algorithms will be soon publicly available andintegrated in the Android API, which will save the programmer some coding work. The simpleapproach was first introduced by Shane Colton. He proposed and compared several methods howto apply the sensor fusion. The most efficient one is by using Kalman filters and provide verygood results [12, 82–84]. Since these filters are too complex, another method is recommendedbased on the complementary/balanced filter [12, 80, 82].
Complementary Filter
An illustration of the method is shown in Figure 4.3 and has the following steps:
Figure 4.3.: The sensor fusion with a complementary filter
1. The data from the three sensors (accelerometer, magnetometer and gyroscope) is run sepa-rately through an exponential moving average (EMA) algorithm, which works as a low passfilter and handles the noise from the sensors.
2. The accelerometer and magnetometer build a rotation matrix with their values and theorientation is computed by this matrix.
p u b l i c f l o a t [ ] computeOrientat ionFromAccMag ( f l o a t [ ] accData ,f l o a t [ ] magnData ) {
f l o a t [ ] r o t a t i o nMa t r i x = new f l o a t [ 9 ] ;
i f ( accData != n u l l && magnData != n u l l ) {i f ( sensorManager . g e tRo t a t i o nMat r i x ( r o t a t i o nMa t r i x ,
n u l l , accData , magnData ) ) {

Chapter 4. Sensor Fusion 22
sensorManager . g e tO r i e n t a t i o n ( r o t a t i o nMa t r i x ,or ientat ionDataFromAccMag ) ;
}}
r e t u r n r o t a t i o nMa t r i x ;}
3. When the initial orientation is calculated, then the gyroscope based rotation matrix is set.At first it is initialized with the identity matrix. When the system runs through the method,it is updated with the product of the multiplication of the identity matrix and the orientationmatrix, calculated by the angles computed from the accelerometer and magnetometer in theprevious step [8].
f l o a t [ ] i n i tM a t r i x = new f l o a t [ 9 ] ;i n i tM a t r i x = computeRota t i onMat r i xF romOr i en ta t i onVec to r (
or ientat ionDataFromAccMag ) ;gy roMat r i x = mu l t i p l i c a t eMa t r i x ( gy roMatr i x , i n i tM a t r i x ) ;
Further, with every new sensor data the gyroscope based rotation matrix is updated by usingthe orientation, computed by the sensor fusion [81].
gy roMat r i x = computeRota t i onMat r i xF romOr i en ta t i onVec to r (s e n s o r F u s i o nO r i e n t a t i o n ) ;
The device coordinate system could be transformed to the earth coordinate system us-ing the three axes and their rotational angles. The vector with the orientation angles(orientationDataFromAccMag or sensorFusionOrientation) of the device coordinatesystem is multiplied by the rotation matrix, and the result is within the earth coordinatesystem. The rows of rotation matrix are projections of ECS (Earth Coordinate System) axeson DCS (Device Coordinate System) axes and the columns are the projections of the DCSaxes on ECS axes [81]. In Figure 4.4 the rotations around the different axes are shown.Equation 4.10, 4.11, 4.12 present the different rotation matrixes, and the product of theirmultiplication is the final rotation matrix (Equations 4.14) [80, 81]. y of the orientationvector represents the yaw angle, p - the pitch and r - the roll angle. Important is the orderof multiplication of these matrixes because the matrix multiplication is not commutative.
R(z) =
cos y sin y 0− sin y cos y 0
0 0 1
(4.10)

Chapter 4. Sensor Fusion 23
Figure 4.4.: Yaw/Azimuth, pitch and roll rotation around axes
Source: Ayub [81]
R(x) =
1 0 00 cos p sin p0 − sin p cos p
(4.11)
R(y) =
cos r 0 − sin r
0 1 0sin r 0 cos r
(4.12)
R(f) = R(z) ∗R(x) ∗R(y) (4.13)
R(f) =
cos r cos y + sin r sin p sin y cos p sin y − sin r cos y + cos r sin p sin y− cos r sin y + sin r sin p cos y cos p cos y sin r sin y + cos r sin p cos y
sin r cos p − sin p cos r cos p
(4.14)
f l o a t [ ] i n i tM a t r i x = new f l o a t [ 9 ] ;i n i tM a t r i x = computeRota t i onMat r i xF romOr i en ta t i onVec to r (
or ientat ionDataFromAccMag ) ;
4. The orientation data acquired from these 3 sensors is provided in different conventions.Therefore, for the sensor fusion the data has to be unified into a single convention. Theaccelerometer and the magnetometer obtain their orientation data relative to the globalcoordinate system, and the gyroscope measures the device’s rotation speed relative to thedevice’s coordinate system. This requires the gyroscope angle values to be converted into

Chapter 4. Sensor Fusion 24
the global coordinate system.
a) Integrate the gyroscope data over time to calculate the rotation vector describing thechange of angles over the time step. This is done as described by the Android API[85].
b) From the delta rotation vector create a rotation matrix with the function provided bythe Android API:
SensorManager . ge tRota t i onMat r i xF romVecto r ( d e l t aMat r i x ,d e l t aV e c t o r ) ;
c) The new rotational interval is applied to the gyroscope based rotation matrix:
gy roMat r i x = ma t r i xMu l t i p l i c a t i o n ( gyroMatr i x , d e l t aMa t r i x ) ;
d) The last step to get the gyroscope orientation in the same convention as the oneacquired by the accelerometer and the geomagnetic field sensor is calling the built-inmethod getOrientation from the SensorManager package.
SensorManager . g e tO r i e n t a t i o n ( gyroMatr i x , g y r oO r i e n t a t i o n ) ;
5. The gyroscope orientation data is run through a high pass filter and the accelerometer/-magnetometer orientation data through a low pass filter. Then, both data sets are summedand the result is the orientation from the sensor fusion.
f l o a t BALANCE_FACTOR = 0 . 9 8 ;f l o a t LOW_PASS_FACTOR = 1−BALANCE_FACTOR;s e n s o r F u s i o nO r i e n t a t i o n = BALANCE_FACTOR ∗ g y r oO r i e n t a t i o n +
LOW_PASS_FACTOR ∗ or ientat ionDataFromAccMag ;
Here the first part BALANCE_FACTOR * gyroOrientation could be considered asthe high pass filter used to remove the drift from the gyroscope data, and theLOW_PASS_FACTOR * orientationDataFromAccMag could be seen as the low pass filterused to smoothen the orientation data computed by the acceleration and the geomagneticfield sensor. In the listing below the detailed method for the complementary filter could beseen. It is also to mention that additional adaptations were made to the code as there isa problem with the data when it is around 179 ◦ [5, 80, 81]. The data goes wild between179 ◦ and −179 ◦ Therefore, it needs to be checked if one of the orientation angles isnegative, while the other one is positive. If this is the case, then 360 ◦ is added to thenegative one, the sensor fusion is performed and then 360 ◦ is removed from the result, ifthe negative value is greater than 180 ◦.
6. The gyroscope matrix is overwritten by the new angles in order to compensate the gyro driftas well as the gyroscope orientation is overwritten by the one from the sensor fusion.

Chapter 4. Sensor Fusion 25
gy roMat r i x = computeRota t i onMat r i xF romOr i en ta t i onVec to r (s e n s o r F u s i o nO r i e n t a t i o n ) ;
System . a r r a y copy ( s e n s o r F u s i o nO r i e n t a t i o n , 0 , g y r oO r i e n t a t i o n ,0 , 3) ;

Chapter 5.
Driving Style Estimation Algorithm andGamification
5.1. Driving Style Estimation Algorithm
The algorithm to detect the driving style of the driver used in this work is based on thresholdsacquired from the analyzes of the tests discussed in Chapter 6. The monitored values are fromthe accelerometer (x and y axis) and the ones from the sensor fusion (pitch and roll). With thesevalues six driving events are reviewed: acceleration, deceleration, left turn, right turn, lane changeto left, lane change to right.The algorithm works in time window frames of 5 seconds because of the conclusions from the firstconducted tests discussed in Chapter 6. In this time window the values of the accelerator sensorand the sensor fusion data are stored in LinkedLists and are analyzed.Every new value is inserted in one of the four LinkedLists (acc_x_list, acc_y_list, pitch_list,roll_list) and added to the sum of all values stored in the current LinkedList. Meanwhile theoldest value is removed from the same LinkedList and its sum. Then the average, the newminimum and maximum values are computed within this list as well as the distance between thenew minimum and maximum value. This distance is needed to detect the sharp lane changes.The hard acceleration is detected when the pitch average for the last 5 seconds is below theacceleration threshold (initially set to -0.14).The hard deceleration is detected when the current pitch data is above the deceleration threshold(initially set to 0.25).The sharp left or right turn are detected when the absolute value of the roll is above the turnthreshold. If the roll value is positive, then it is a left turn, and if it is negative, then this is thecase of a right turn (initially set to 0.3).The sharp lane change is detected when the roll data is below the threshold for sharp turn, butat the same time the distance between the minimum and maximum values of it in the 5 secondtime window is bigger than the threshold for sharp lane change (initially set to 0.3).
26

Chapter 5. Driving Style Estimation Algorithm and Gamification 27
Similar scenario, but with other data, is used for phones which do not have a gyroscope sensorand, therefore, no sensor fusion is possible. Instead of the pitch and roll values from the sensorfusion the acceleration data in the x and y axes is used for the computations with thresholds suitedfor the acceleration data. In Table 5.1 the values for the thresholds for the accelerometer andsensor fusion values could be seen.The complete is available in the listing at the end of the work.
Table 5.1.: Thresholds for driving events detectionDriving event Data used for detection Threshold
Hard acceleration pitch (average) -0.14acc_y_axis (average) 0.38
Hard deceleration pitch 0.25acc_y_axis -1.0
Sharp left turn roll 0.3acc_x_axis -1.5
Sharp right turn roll -0.3acc_x_axis 1.5
Sharp lane change roll (distance between minimum and maximum roll) | ± 0.3|acc_x_axis (distance between minimum and maximum x value) | ± 1.5|
When the system detects that the user makes one of the maneuvers - accelerate, decelerate orchange the lateral position of the car (left/right turn or lane change), then the counter for thistype of event is incremented. When a bad driving style is noticed, a special counter for this typeof bad driving behavior is incremented as well. In the end, the formula for the score can be seenin Equation 5.1. The formulas for the penalties are explained in Equations 5.2, 5.3 and 5.4
Score = 1000− (Acceleration_Penalty +Deceleration_Penalty + Turn_Penalty) (5.1)
Acceleration_Penalty = 100 ∗ (Counter_Bad_AccelerationCounter_Acceleration ) (5.2)
Deceleration_Penalty = 100 ∗ (Counter_Bad_DecelerationCounter_Deceleration ) (5.3)
Turn_Penalty = 100∗
(Counter_Bad_Left_Turn+ Counter_Bad_Right_Turn+ Counter_Bad_Lane_ChangeCounter_Turn )
(5.4)

Chapter 5. Driving Style Estimation Algorithm and Gamification 28
According to the score achieved at the end of the drive a pie chart is shown to the user, where hecould see which are the bad driving style categories (hard acceleration, hard deceleration, sharpleft turn, sharp right turn, sharp lane change) (see figure 5.1).
Figure 5.1.: The summary with the statistics from the drive showing the problem areas of theuser’s driving style
After numerous tests the overall driving style was determined as described in Table 5.2.
Table 5.2.: Score points needed for driving styleDriving style ScoreVery bad Score<750
Bad 750<Score<900Good 900<Score<975
Very good 990<Score
There is also a current driving style field visible for the user in order to give him real-time infor-mation how his current driving style is being estimated (see figure 5.2). This field is affected bythe number of sensor data acquired from the system in the last 10 seconds. When the applicationuses its default sensitivity for the sensors (SENSOR_DELAY_GAME ), this number is around 140units of data coming per second for all three used sensors. The more sensor data is marked asbad driving style in this 10 seconds, the worse driving style rating is assigned to the user.

Chapter 5. Driving Style Estimation Algorithm and Gamification 29
Figure 5.2.: The displayed current driving style with a hint how it can be improved
5.2. Gamification and Hints
Providing constructive feedback to the driver is important in correcting bad driving behaviors[76, 86]. When the system detects bad driving behavior in certain category, it shows the drivera hint. The hints are used to show and teach the driver how to improve his driving style and toachieve better results. (see Figure 5.2). The displayed hints are:
• Try to maintain uniform acceleration!
• Try to maintain uniform deceleration!
• Take the left turn slower!
• Take the right turn slower!
• Change the lanes slower!
By doing this, he could achieve better fuel economy at lower risk for a traffic accident, which willlower the costs of vehicle maintenance. With the score and the saved GPS points during the drivethe user has the possibility to review his driving style for one trip and try to improve it the nexttime, when he drives the same route. He could also compare it to another user in order to seewho has a better driving style. In Figures 5.3 and 5.4 a screenshot from the application can beseen showing the drive map and the corresponding statistics for this drive.

Chapter 5. Driving Style Estimation Algorithm and Gamification 30
Figure 5.3.: The drive map showing the route

Chapter 5. Driving Style Estimation Algorithm and Gamification 31
Figure 5.4.: The drive map showing the statistics for the saved route

Chapter 6.
Tests
Test-Mode of the application
Because some abnormal driving maneuvers had to be executed, the tests were conducted mostlyin the hours after midnight and in areas where at that time there is no traffic at all.Different smartphones were used for the tests, all of them having gyroscope along with the accel-erator and geomagnetic field sensor. Samsung Galaxy S2 (release date - 2011)1 was used duringthe early stages of the programming part, then - the Google Nexus S manufactured by Samsung(release date - 2010)2. Only for comparison the application was installed on a newer smartphone- Samsung Galaxy S3 (release date - 2012)3 and the results show that the S3 has no problemswith the extensive computations used for sensor fusion and driving style detection. This causedmore tests in order to achieve the same results, but with less extensive computations. The usedvehicle was BMW 320i E46 from 1999.
A layout filled with buttons for the different type of events that may occur during the drive wasused for the application. According to the literature ([72, 79]) the ones that I chose to include inthe application for the tests are:
• Right Turn
• Left Turn
• Acceleration
• Deceleration
• Right U-Turn
• Left U-Turn
• Right lane change
1https://de.wikipedia.org/wiki/Samsung_Galaxy_S_II2http://de.wikipedia.org/wiki/Nexus_S3Source: https://de.wikipedia.org/wiki/Samsung_Galaxy_S_3
32

Chapter 6. Tests 33
• Left lane change
• Other
Later the U-turns were left out of the scope of this work because they occur relative rare in thedaily routine and could not be easily distinguished from the left and right turns.
Figure 6.1.: The application screen used for the first tests
In Figure 6.1, the application screen with the buttons used for the first series of tests could beseen. The goal of these tests was to press the corresponding button before executing a certainmaneuver. All data was saved in the database and its schema during the tests can be seenin Figure 6.14. The fields Fused_Azimuth, Fused_Pitch and Fused_Roll represent the valuesgathered from the sensor fusion. AM_Azimuth, AM_Pitch and AM_Roll are the orientationvalues acquired from the combination of the accelerometer and magnetometer data, and werestored only to compare them with the fused data and to choose the best suitable data set for theevent recognition.
• Acceleration and hard acceleration. The separate gear shifts could be clearly distinguishedin the acceleration and hard acceleration graphics in Figures 6.2 and 6.3. Hints about anoptimal gear shifting could be discussed in a later work since this depends mostly on the

Chapter 6. Tests 34
vehicle. It is visible that the hard acceleration differs from the regular one, since for everygear shift the values in the hard acceleration case are greater.
Figure 6.2.: Regular acceleration
Source: Own creation
Figure 6.3.: Hard acceleration
Source: Own creation
• Deceleration and hard deceleration
Figure 6.4.: Regular deceleration
Source: Own creation
Figure 6.5.: Hard deceleration
Source: Own creation
• Left turn and sharp left turn
• Right turn and sharp right turn – they are opposite to the left turn and sharp left turn
• Lane change towards left and sharp lane change towards left
• Lane change towards right and sharp lane change towards right – the opposite to lane changetowards left
After further tests the data was carefully analyzed and compared and the following conclusionswere made:
• The different events occur in a time window frame from 3 up to 5 seconds.
• The hard acceleration could be more easily detected, if for threshold is taken not the highestvalue from the pitch/accelerator’s y axis, but the average of this values for the current time

Chapter 6. Tests 35
Figure 6.6.: Regular left turn
Source: Own creation
Figure 6.7.: Sharp left turn
Source: Own creation
Figure 6.8.: Regular right turn
Source: Own creation
Figure 6.9.: Sharp right turn
Source: Own creation
window.
• The hard deceleration and the sharp turns could be recognized by the highest/lowest valuesof the accelerator/sensor fusion data.
• The sharp lane change differs from the sharp turn as follow: although they have similardistance between the minimum and maximum point, the minimum and maximum values forsharp lane change are below the threshold for sharp turn.
• The sensor fusion data is suitable for driving style definition and is less noisy than theaccelerator data.
All thresholds are listed in Table 5.1.
The graphs were used initially to display the sensor values of the phone in order to see how theybehave under different circumstances. During the first tests it was clear that the read sensorvalues are different depending on the position and orientation of the phone in the car. This led tothe conclusion that a calibration is needed in order to get always one type of values, for example,when the car is accelerating. The display of the sensor values was problematic since the memory

Chapter 6. Tests 36
Figure 6.10.: Lane change to left lane
Source: Own creation
Figure 6.11.: Sharp lane change to left lane
Source: Own creation
Figure 6.12.: Lane change to right lane
Source: Own creation
Figure 6.13.: Sharp lane change to right lane
Source: Own creation
reserved for drawing the graph was increasing linear over time, and besides the lag caused by this,the program crashed occasionally. In order to get better performance while testing the programand analyzing the values, the graph-redrawing was moved to a separate thread. Afterward, thedisplay of the sensor values was removed during the drive. In a later phase, a graph was usedto display the saved values during the tests. A special section was implemented, where to selectwhich values to be displayed, at which time intervals and on what occasions (e.g. when the carwas accelerating or turning right). For longer drives the amount of time needed to draw thedata was significant. Another problem was that it was possible to extract a screenshot only ofthe current visible section of the graph, but not of the whole one. This led to extracting anddisplaying all data from the drives on a notebook with Microsoft Excel 2013, since the editing,computing and viewing possibilities were greater comparing it to the ones of the smartphone.
After the data from the sensors was analyzed, it was not neccessary to store it anymore. This ledto a new database schema, which is described in figure 6.15, and a second series of tests aimedto test the driving style formula described in Chapter 5

Chapter 6. Tests 37
Figure 6.14.: The database schema used to store the data for developing the algorithm

Chapter 6. Tests 38
Figure 6.15.: The final database schema
Source: Own creation

Chapter 7.
Used Tools
7.1. Eclipse
As development environment was used Eclipse with the Android Developer Tools (ADT) pluginand the Android SDK tools.
7.2. Charts
The charts used in the application were all implemented with the charting software libraryAChartEngine1. It provides many chart types, can contain multiple series, supports many customfeatures and most importantly for this work - can handle and display huge numbers of valuesdynamically [87, 88]
7.3. SQLite
The storage of the sensor values and all other information provided by the application was achievedin SQLite. SQLite is a software library which implements a SQL database engine and because ofits small size is included in many embedded systems, among them - Android.
7.4. Reused Code
An existing code was used for some of the sections in the application since they were alreadytested and worked fine.
1http://www.achartengine.org/index.html
39

Chapter 7. Used Tools 40
The calibration code from the Drismo application ([33]), written as a bachelor thesis by threeDanish students, was taken as basis, and edited where needed, to fit into the current application.
The sensor fusion section is similar to the one presented by Lawitzki in his master thesis ([80]).

Chapter 8.
Conclusion
This work shows how the driving style could be estimated based on the sensor fusion. It combinesthe data from the accelerometer, geomagnetic field sensor and the gyroscope, and proves that itis less noisy than the single sensor values. According to the set thresholds various driving eventscan be distinguished and recognized. Referring to these events the driving behavior of the drivercan be evaluated and classified, and with the displayed hints and used gamification the drivingstyle of the user could be influenced.As the driving style in this work was based mostly on the lateral and longitudinal forces acting ona car, in a future work the phone camera could be used to detect distance between the vehiclesor the car’s position in the lane. The speed data acquired from the GPS or computed from theacceleration sensor could be used in combination with the location data from the GPS to detectspeeding in various areas. In this work was shown that the gear shifts are clearly distinguishable andit could be investigated what influence has the gear shifting on the driver style. Another importantarea for the fuel economy is coasting, which could be further researched with its influence on thedriving style. It has to be mentioned that the vehicle, the mobile device and the nature of the roadaffect the characteristics of the sensor data. Due to this variation in characteristic, the accuracyof the system with fixed thresholds would be lower when tested under different conditions [16].Therefore, the use of dynamic time warping for the different events would provide more accurateand reliable results.
41

List of Figures
2.1. Coordinate system (relative to a device) that’s used by the Sensor API. . . . . . 42.2. Portrait and landscape screen orientation for a tablet/smartphone. . . . . . . . . 42.3. For accurate readings regardless the phone’s position and orientation in the car,
the sensor axes of the smartphone have to be reoriented according to the vehicleaxes [16]. . . . . . . . . . . . . . . . . . . . . . . . . . . . . . . . . . . . . . . . 7
3.1. Iveco Driving Style Evaluation System . . . . . . . . . . . . . . . . . . . . . . . 9
4.1. The flow of the calibration process . . . . . . . . . . . . . . . . . . . . . . . . . 174.2. Integrated Gyro Signal, Drifted Yaw, Pitch, Roll angles when phone is at rest . . 204.3. The sensor fusion with a complementary filter . . . . . . . . . . . . . . . . . . . 214.4. Yaw/Azimuth, pitch and roll rotation around axes . . . . . . . . . . . . . . . . . 23
5.1. The summary with the statistics from the drive showing the problem areas of theuser’s driving style . . . . . . . . . . . . . . . . . . . . . . . . . . . . . . . . . . 28
5.2. The displayed current driving style with a hint how it can be improved . . . . . . 295.3. The drive map showing the route . . . . . . . . . . . . . . . . . . . . . . . . . . 305.4. The drive map showing the statistics for the saved route . . . . . . . . . . . . . 31
6.1. The application screen used for the first tests . . . . . . . . . . . . . . . . . . . 336.2. Regular acceleration . . . . . . . . . . . . . . . . . . . . . . . . . . . . . . . . . 346.3. Hard acceleration . . . . . . . . . . . . . . . . . . . . . . . . . . . . . . . . . . 346.4. Regular deceleration . . . . . . . . . . . . . . . . . . . . . . . . . . . . . . . . . 346.5. Hard deceleration . . . . . . . . . . . . . . . . . . . . . . . . . . . . . . . . . . 346.6. Regular left turn . . . . . . . . . . . . . . . . . . . . . . . . . . . . . . . . . . . 356.7. Sharp left turn . . . . . . . . . . . . . . . . . . . . . . . . . . . . . . . . . . . . 356.8. Regular right turn . . . . . . . . . . . . . . . . . . . . . . . . . . . . . . . . . . 356.9. Sharp right turn . . . . . . . . . . . . . . . . . . . . . . . . . . . . . . . . . . . 356.10. Lane change to left lane . . . . . . . . . . . . . . . . . . . . . . . . . . . . . . . 366.11. Sharp lane change to left lane . . . . . . . . . . . . . . . . . . . . . . . . . . . . 366.12. Lane change to right lane . . . . . . . . . . . . . . . . . . . . . . . . . . . . . . 366.13. Sharp lane change to right lane . . . . . . . . . . . . . . . . . . . . . . . . . . . 36
42

LIST OF FIGURES 43
6.14. The database schema used to store the data for developing the algorithm . . . . 376.15. The final database schema . . . . . . . . . . . . . . . . . . . . . . . . . . . . . 38

List of Tables
5.1. Thresholds for driving events detection . . . . . . . . . . . . . . . . . . . . . . . 275.2. Score points needed for driving style . . . . . . . . . . . . . . . . . . . . . . . . 28
44

List of Acronyms
ADT Android Developer Tools
API Application Programming Interface
CAN Controller Area Network
ECS Earth Coordinate System
EMA Exponential Moving Average
DCS Device Coordinate System
NIR Near Infrared
RPM Revolutions Per Minute
TUM Technische Universität München
VMI Fachgebiet Verteilte Multimodale Informationsverarbeitung
45

Bibliography
[1] The EU climate and energy package - Policies - Climate Action - European Commission.http://ec.europa.eu/clima/policies/package/index_en.htm. [accessed March 25,2013].
[2] Stefan Diewald, Andreas Möller, Luis Roalter, and Matthias Kranz. Mobile Device Integrationand Interaction in the Automotive Domain. In AutoNUI: Automotive Natural User InterfacesWorkshop at the 3rd International Conference on Automotive User Interfaces and InteractiveVehicular Applications (AutomotiveUI 2011), November–December 2011.
[3] Stefan Diewald, Tim Leinmüller, Boris Atanassow, Lutz-Peter Breyer, and Matthias Kranz.Mobile Device Integration and Interaction with V2X Communication. In 19th World Congresson Intelligent Transport Systems (ITS), October 2012.
[4] Stefan Diewald, Andreas Möller, Luis Roalter, and Matthias Kranz. DriveAssist - A V2X-Based Driver Assistance System for Android. In Harald Reiterer and Oliver Deussen, editors,Mensch & Computer Workshopband, pages 373–380. Oldenbourg Verlag, 2012.
[5] Sensor Fusion on Android Devices: A Revolution in Motion Processing - YouTube. GoogleTech Talk August 2, 2010: http://www.youtube.com/watch?v=C7JQ7Rpwn2k. [accessedApril 04, 2013].
[6] Stefan Diewald, Andreas Möller, Luis Roalter, and Matthias Kranz. Gamification-supportedExploration of Natural User Interfaces. In Adjunct Proceedings of the 4th International Con-ference on Automotive User Interfaces and Interactive Vehicular Applications (AutomotiveUI2012), pages 47–48, October 2012.
[7] Sensors Overview | Android Developers. http://developer.android.com/guide/
topics/sensors/sensors_overview.html. [accessed March 25, 2013].
[8] Motion Sensors | Android Developers. http://developer.android.com/guide/topics/
sensors/sensors_motion.html. [accessed March 25, 2013].
[9] L. Langle and R. Dantu. Are You a Safe Driver? In International Conference on Computa-tional Science and Engineering, 2009. CSE ’09, volume 2, pages 502–507, 2009.
46

BIBLIOGRAPHY 47
[10] Johann Borenstein and Lauro Ojeda. Heuristic reduction of gyro drift in vehicle trackingapplications. Int. J. of Vehicle Autonomous Systems, 2(1/2):78–98, 2009.
[11] Position Sensors | Android Developers. http://developer.android.com/guide/topics/
sensors/sensors_position.html. [accessed March 25, 2013].
[12] Greg Milette and Adam Stroud. Professional Android Sensor Programming. John Wiley andSons, Inc., 2012.
[13] Xiaojun Zhu, Qun Li, and Guihai Chen. APT: Accurate Outdoor Pedestrian Tracking withSmartphones. 2013.
[14] Location | Android Developers. http://developer.android.com/reference/android/
location/Location.html. [accessed March 25, 2013].
[15] Sensor Coordinate System. http://developer.android.com/guide/topics/sensors/
sensors_overview.html#sensors-coords. [accessed March 25, 2013].
[16] R. Bhoraskar, N. Vankadhara, B. Raman, and P. Kulkarni. Wolverine: Traffic and roadcondition estimation using smartphone sensors. In 2012 Fourth International Conference onCommunication Systems and Networks (COMSNETS), pages 1–6, 2012.
[17] Per-Erik Nordström. Scania Fahrer Eco-Modul -– Wirtschaftlichkeit mit eigenem TraineranBord. http://www.scania.de/images/P09903DE2009. accessed March 27, 2013.
[18] stralis hi way - DRIVING STYLE EVALUATION. http://web.iveco.com/uk/Products/
Pages/stralis-hi-way-driving-style-evaluation.aspx. [accessed March 25, 2013].
[19] Multimedia systems and navigation - SLS AMG Coupé - Mercedes-Benz Singapore.http://m.mercedes-benz.com.sg/models/show/content/singapore/mpc/mpc_
singapore_website/enng/home_mpc/passengercars/mobile/mbp/new_cars/model_
overview/sls_amg/c197/highlights/performance/amgperformancemedia.html.[accessed April 04, 2013].
[20] AMG Performance Media: Internet plus Telemetrie wie im Motorsport | Daimler GlobalMedia Site > Mercedes-Benz Cars > AMG. http://media.daimler.com/dcmedia/0-
921-1388858-49-1425360-1-0-0-1425421-0-1-11694-0-0-1-0-0-0-0-0.html?TS=
1365082048135. [accessed April 04, 2013].
[21] Mercedes-Benz Niederlassung Weser-Ems - AMG Technik Lexikon - AMG Perfor-mance Media. http://www.weser-ems.mercedes-benz.de/content/germany/
retailer-2/niederlassung_weser-ems/de/home/passengercars/home/amg/
individualisierung0/amg_technik_lexikon/pmedia.html. [accessed April 04,2013].

BIBLIOGRAPHY 48
[22] Volvo Technik-Lexikon - Technik von A-Z. http://www.volvocars.com/de/sales-
services/service/specialsales/Pages/techniklexikon-d.aspx. [accessed April 04,2013].
[23] Fahrstilassistent - Punch Telematix. http://www.trimbletl-transportlogistics.com/
de/produkte-und-dienstleistungen/bordcomputer-carcube/fahrstilassistent.[accessed April 04, 2013].
[24] . https://www.car2go.com. [accessed March 25, 2013].
[25] Der car2go EcoScore »car2go Blog. http://blog.car2go.com/2012/05/25/der-car2go-
ecoscore/. [accessed April 04, 2013].
[26] Car2Go - Wikipedia, the free encyclopedia. http://en.wikipedia.org/wiki/Car2Go.[accessed March 25, 2013].
[27] car2go - Energiesparender Fahrstil wird belohnt. http://www.greenmotorsblog.de/ko-
mobilitaet/car2go-energiesparender-fahrstil-wird-belohnt/9824/. [accessedApril 04, 2013].
[28] Autoflotte online - Car2go: Jetzt den Fahrstil analysieren. http://www.autoflotte.de/
car2go-jetzt-den-fahrstil-analysieren-1126566.html. [accessed March 25, 2013].
[29] Driver Awareness panel | Squarell 2012. http://www.squarell.com/de/Products/
Products/product/78/Driver-Awareness-panel. [accessed March 25, 2013].
[30] Driver Awareness Panel | Car Tracker »VeriLocation. http://www.verilocation.com/
products-and-services/driver-centric-systems/driver-awareness-panel/. [ac-cessed March 25, 2013].
[31] greenMeter: iPhone/iPod Eco-driving App. http://hunter.pairsite.com/greenmeter/.[accessed March 25, 2013].
[32] gMeter Vehicle Performance App for iPhone, iPod, iPad. http://hunter.pairsite.com/
gmeter/. [accessed March 25, 2013].
[33] Fr. Hørtvedt, Fr. Kvitvik, and J. A. Myrland. DriSMo - the driving quality application.Bachelor thesis, Gjøvik University College, May 2011.
[34] Drivewise.ly – drive with friends! for iPhone 4, iPhone 4S, and iPhone 5 onthe iTunes App Store. https://itunes.apple.com/us/app/drivewise.ly-drive-
friends!/id610920397. [accessed April 04, 2013].
[35] Drivewise.ly. http://www.drivewise.ly/#2. [accessed March 25, 2013].
[36] Drivewise.ly, social driving! - Android Apps auf Google Play. https://play.google.com/
store/apps/details?id=com.Smoothdrive. [accessed April 04, 2013].

BIBLIOGRAPHY 49
[37] Dynolicious — Social Meets Performance. http://www.dynolicious.com/about/. [ac-cessed March 25, 2013].
[38] BunsenTech. http://www.bunsentech.com/products/fusion/index.php. [accessedApril 04, 2013].
[39] Dynolicious Fusion for iPhone 4, iPhone 4S, iPhone 5, iPod touch (4th generation), iPodtouch (5th generation), iPad 2 Wi-Fi, iPad 2 Wi-Fi + 3G, iPad (3rd generation), iPad Wi-Fi+ 4G, iPad (4th generation), iPad Wi-Fi + Cellular (4th generation), iPad mini and iPadmini Wi-Fi + Cellular on the iTunes App Store. https://itunes.apple.com/us/app/
dynolicious-fusion/id584974533?mt=8. [accessed March 25, 2013].
[40] Driver Feedback™ for iPhone, iPod touch, and iPad on the iTunes App Store. https://
itunes.apple.com/us/app/driver-feedback/id432357729?mt=8. [accessed April 04,2013].
[41] iOnRoad Augmented Driving Pro - Android Apps on Google Play. https://play.google.
com/store/apps/details?id=com.picitup.iOnRoad.pro&hl=en. [accessed March 25,2013].
[42] BMW M5 : M Power Meter. http://www.bmw.de/de/neufahrzeuge/M/m5-limousine/
2011/mpowermeter.html. [accessed April 04, 2013].
[43] BMW M Power Meter for iPhone, iPod touch, and iPad on the iTunes App Store. https://
itunes.apple.com/us/app/m-performance-meter/id344494968?mt=8. [accessed April04, 2013].
[44] BMW Downloads. http://m.bmw.de/m/mobi/de/de/general/downloads/app_detail_
pages/bmw-m-power-meter.cml. [accessed April 04, 2013].
[45] Smart Tachometer FREE - Android Apps auf Google Play<. https://play.google.
com/store/apps/details?id=com.bublik.brakeindicatortrial. [accessed March 25,2013].
[46] J. Van Mierlo, G. Maggetto, E. van de Burgwal, and R. Gense. Driving style and trafficmeasures - influence on vehicle emissionsand fuel consumption. 218(D1):43–50+, 2004.
[47] R. Araujo, A. Igreja, R. de Castro, and R.E. Araujo. Driving coach: A smartphone applicationto evaluate driving efficient patterns. In 2012 IEEE on Intelligent Vehicles Symposium (IV),pages 1005–1010, 2012.
[48] S. Zorrofi, S. Filizadeh, and P. Zanetel. A simulation study of the impact of driving patternsand driver behavior on fuel economy of hybrid transit buses. In IEEE on Vehicle Power andPropulsion Conference, 2009 VPPC ’09, pages 572–577, 2009.

BIBLIOGRAPHY 50
[49] Britt A Holmén and Debbie A Niemeier. Characterizing the effects of driver variability onreal-world vehicle emissions. Transportation Research Part D: Transport and Environment,3(2):117 – 128, 1998.
[50] Y.L. Murphey, R. Milton, and L. Kiliaris. Driver’s style classification using jerk analysis.In IEEE Workshop on Computational Intelligence in Vehicles and Vehicular Systems, 2009.CIVVS ’09, pages 23–28, 2009.
[51] V. Corcoba Magana and M. Munoz-Organero. Artemisa: An eco-driving assistant for AndroidOs. In IEEE International Conference on Consumer Electronics - Berlin (ICCE-Berlin), 2011,pages 211–215, 2011.
[52] Yi-Shih Chung and Jinn-Tsai Wong. Investigating Driving Styles and Their Connections toSpeeding and Accident Experience. Journal of the Eastern Asia Society for TransportationStudies, 8, 2010.
[53] Orit Taubman-Ben-Ari, Mario Mikulincer, and Omri Gillath. The multidimensional drivingstyle inventory–scale construct and validation. Accident Analysis & Prevention, 36(3):323 –332, 2004.
[54] T. Bär, D. Nienhuser, R. Kohlhaas, and J.-M. Zollner. Probabilistic driving style determinationby means of a situation based analysis of the vehicle data. In 2011 14th International IEEEConference on Intelligent Transportation Systems (ITSC), pages 1698–1703, 2011.
[55] N. Tricot, D. Sonnerat, and J.-C. Popieul. Driving styles and traffic density diagnosis insimulated driving conditions. In IEEE on Intelligent Vehicle Symposium, 2002, volume 2,pages 298–303, 2002.
[56] Eva Ericsson. Independent driving pattern factors and their influence on fuel-useand exhaustemission factors . Transportation Research Part D: Transport and Environment, 6(5):325 –345, 2001.
[57] Rui Wang and S.M. Lukic. Review of driving conditions prediction and driving style recog-nition based control algorithms for hybrid electric vehicles. In IEEE on Vehicle Power andPropulsion Conference (VPPC), 2011, pages 1–7, 2011.
[58] I. Mohamad, M.A.M. Ali, and M. Ismail. Abnormal driving detection using real time GlobalPositioning System data. In 2011 IEEE International Conference on Space Science andCommunication (IconSpace), pages 1–6, 2011.
[59] A. Aljaafreh, N. Alshabatat, and M.S. Najim Al-Din. Driving style recognition using fuzzylogic. In 2012 IEEE International Conference on Vehicular Electronics and Safety (ICVES),pages 460–463, 2012.

BIBLIOGRAPHY 51
[60] Zhiwei Zhu, Qiang Ji, and Peilin Lan. Real Time Non-intrusive Monitoring and Predictionof Driver Fatigue. IEEE Transactions on Vehicular Technology, 53:1052–1068, 2004.
[61] Jiann-Der Lee, Jiann-Der Li, Li-Chang Liu, and Chi-Ming Chen. A Novel Driving PatternRecognition and Status Monitoring System. In Long-Wen Chang and Wen-Nung Lie, edi-tors, Advances in Image and Video Technology, volume 4319 of Lecture Notes in ComputerScience, pages 504–512. Springer Berlin Heidelberg, 2006.
[62] J.C. McCall, M.M. Trivedi, D. Wipf, and B. Rao. Lane Change Intent Analysis Using RobustOperators and Sparse Bayesian Learning. In IEEE Computer Society Conference on ComputerVision and Pattern Recognition - Workshops, 2005. CVPR Workshops., pages 59–59, 2005.
[63] J. Krajewski, D. Sommer, U. Trutschel, D. Edwards, and M. Golz. Steering Wheel BehaviorBased Estimation of Fatigue. In in Proceedings of the Fifth International Driving Symposiumon HumanFactors in Driver Assessment, Training and Vehicle Design, pages 118–124, 2009.
[64] Jiangpeng Dai, Jin Teng, Xiaole Bai, Zhaohui Shen, and Dong Xuan. Mobile phone baseddrunk driving detection. In 2010 4th International Conference on Pervasive Computing Tech-nologies for Healthcare (PervasiveHealth), pages 1–8, 2010.
[65] J.C. McCall and M.M. Trivedi. Driver Behavior and Situation Aware Brake Assistance forIntelligent Vehicles. Proceedings of the IEEE, 95(2):374–387, 2007.
[66] N. Kuge, T. Yamamura, O. Shimoyama, and A. Liu. A driver behavior recognition methodbased on a driver model framework. In Proceedings of the Society of Automotive EngineersWorld Congress, 2000.
[67] N. Oliver and A. P. Pentland. Driver behavior recognition and prediction in a SmartCar. InJ. G. Verly, editor, Society of Photo-Optical Instrumentation Engineers (SPIE) ConferenceSeries, volume 4023 of Society of Photo-Optical Instrumentation Engineers (SPIE) Confer-ence Series, pages 280–290, June 2000.
[68] M. Hoepken. A multi sensor system to evaluate driving behavior in curves. In 12th Interna-tional IEEE Conference on Intelligent Transportation Systems, 2009. ITSC ’09, pages 1–5,2009.
[69] T. Imkamon, P. Saensom, P. Tangamchit, and P. Pongpaibool. Detection of hazardous drivingbehavior using fuzzy logic. In 5th International Conference on Electrical Engineering/Elec-tronics, Computer, Telecommunications and Information Technology, 2008. ECTI-CON 2008,volume 2, pages 657–660, 2008.
[70] Wang Hailin, Liu Hanhui, and Song Zhumei. Fatigue Driving Detection System DesignBased on Driving Behavior. In 2010 International Conference on Optoelectronics and ImageProcessing (ICOIP), volume 1, pages 549–552, 2010.

BIBLIOGRAPHY 52
[71] M. Lan, M. Rofouei, S. Soatto, and M. Sarrafzadeh. SmartLDWS: A robust and scalablelane departure warning system for the smartphones. In 12th International IEEE Conferenceon Intelligent Transportation Systems, 2009. ITSC ’09, pages 1–6, 2009.
[72] D.A. Johnson and M.M. Trivedi. Driving style recognition using a smartphone as a sen-sor platform. In 14th International IEEE Conference on Intelligent Transportation Systems(ITSC), 2011, pages 1609–1615, 2011.
[73] J. Zaldivar, C.T. Calafate, J.-C. Cano, and P. Manzoni. Providing accident detection invehicular networks through OBD-II devices and Android-based smartphones. In 2011 IEEE36th Conference on Local Computer Networks (LCN), pages 813–819, 2011.
[74] Chris Thompson, Jules White, Brian Dougherty, Adam Albright, and DouglasC. Schmidt. Us-ing Smartphones to Detect Car Accidents and Provide SituationalAwareness to EmergencyResponders. In Ying Cai, Thomas Magedanz, Minglu Li, Jinchun Xia, and Carlo Giannelli,editors, Mobile Wireless Middleware, Operating Systems, and Applications, volume 48 ofLecture Notes of the Institute for Computer Sciences, Social Informatics and Telecommuni-cations Engineering, pages 29–42. Springer Berlin Heidelberg, 2010.
[75] E. Koukoumidis, L.-S. Peh, and M. Martonosi. SignalGuru: Leveraging Mobile Phones forCollaborative Traffic Signal Schedule Advisory, 2011.
[76] M. Fazeen, B. Gozick, R. Dantu, M. Bhukhiya, and M.C. Gonzalez. Safe Driving Using MobilePhones. Intelligent Transportation Systems, IEEE Transactions on Intelligent TransportationSystems, 13(3):1462–1468, September 2012.
[77] R. Langari and Jong-Seob Won. Intelligent energy management agent for a parallel hybridvehicle-part I: system architecture and design of the driving situation identification process.IEEE Transactions on Vehicular Technology, 54(3):925–934, 2005.
[78] K. Igarashi, C. Miyajima, K. Itou, K. Takeda, F. Itakura, and H. Abut. Biometric identificationusing driving behavioral signals. In 2004 IEEE International Conference on Multimedia andExpo, 2004. ICME ’04, volume 1, pages 65–68, 2004.
[79] H. Eren, S. Makinist, E. Akin, and A. Yilmaz. Estimating driving behavior by a smartphone.In 2012 IEEE on Intelligent Vehicles Symposium (IV), pages 234–239, 2012.
[80] P. Lawitzki. Application of Dynamic Binaural Signals in Acoustic Games. Master’s thesis,Hochschule der Medien Stuttgart, 2012.
[81] Bahram Honary Shahid Ayub, Alireza Bahraminisaab. A Sensor Fusion Method for Smartphone Orientation Estimation. In 13th Annual Post Graduate Symposium on the Convergenceof Telecommunications, Networking and Broadcasting, 2012.

BIBLIOGRAPHY 53
[82] Shane Colton. The Balance Filter. A Simple Solution for Integrating Accelerometer andGyroscope Measurements for a Balancing Platform, 2007.
[83] G. Schall, Daniel Wagner, Gerhard Reitmayr, E. Taichmann, M. Wieser, D. Schmalstieg,and B. Hofmann-Wellenhof. Global pose estimation using multi-sensor fusion for outdoorAugmented Reality. In 8th IEEE International Symposium on Mixed and Augmented Reality,2009. ISMAR 2009, pages 153–162, 2009.
[84] F. Tanveer, O. T. Waheed, and Atiq ur Rehman. Design and Development of a Sensor Fusionbased Low Cost Attitude Estimator. Journal of Space Technology, 1(1):45–50, June 2011.
[85] SensorEvent | Android Developers. view-source:http://developer.android.com/
reference/android/hardware/SensorEvent.html. [accessed March 25, 2013].
[86] Stefan Diewald, Andreas Möller, Luis Roalter, Tobias Stockinger, and Matthias Kranz. Game-ful design in the automotive domain: review, outlook and challenges. In Proceedings of the5th International Conference on Automotive User Interfaces and Interactive Vehicular Appli-cations, AutomotiveUI ’13, pages 262–265, New York, NY, USA, 2013. ACM.
[87] achartengine - Charting library for Android - Google Project Hosting. https://code.
google.com/p/achartengine/. [accessed March 25, 2013].
[88] achartengine.org - News. http://www.achartengine.org/index.html. [accessed March25, 2013].