Embed Size (px)
Citation preview

Capital Market Day 2014, Austria
ANDRITZ GROUP

1. Update on major topics
impacting earnings since last CMD
4. Capital Market Days – goals and summary
2. Business areas – market update
3. Main topics 2015

Update on Montes del Plata
Full production expected for end of 2014
3 Capital Market Day 2014, Austria – ANDRITZ GROUP – Wolfgang Leitner
Substantial cost overruns
led to sharp decline of
profitability in 2013
Mill is in ramp-up phase, producing
round-the-clock and expected to
reach full production by end of year
Q1 2014 still impacted,
however no negative impact
on earnings since Q2 2014
Photo: Montes del Plata
4
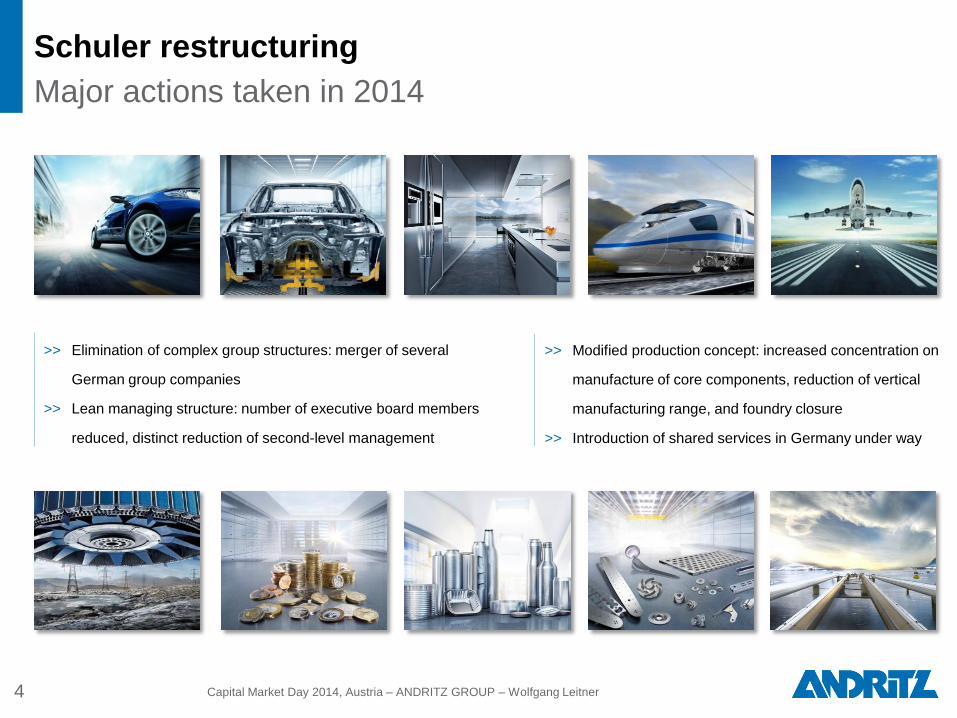
Schuler restructuring
Major actions taken in 2014
Capital Market Day 2014, Austria – ANDRITZ GROUP – Wolfgang Leitner
>> Elimination of complex group structures: merger of several
German group companies
>> Lean managing structure: number of executive board members
reduced, distinct reduction of second-level management
>> Modified production concept: increased concentration on
manufacture of core components, reduction of vertical
manufacturing range, and foundry closure
>> Introduction of shared services in Germany under way
5 Capital Market Day 2014, Austria – ANDRITZ GROUP – Wolfgang Leitner
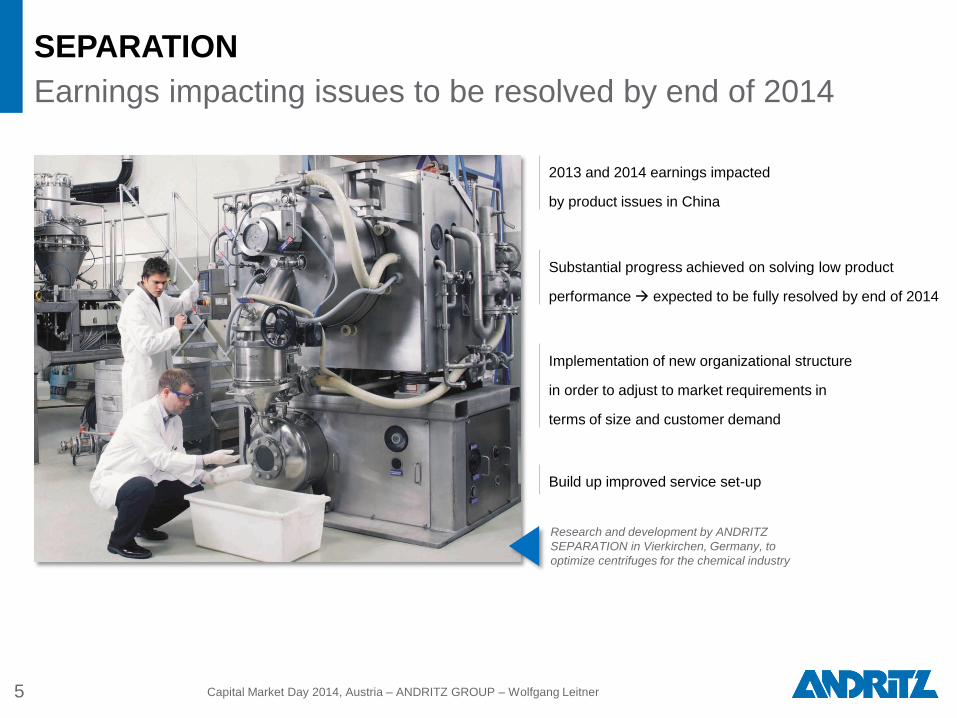
SEPARATION
Earnings impacting issues to be resolved by end of 2014
2013 and 2014 earnings impacted
by product issues in China
Build up improved service set-up
Implementation of new organizational structure
in order to adjust to market requirements in
terms of size and customer demand
Substantial progress achieved on solving low product
performance expected to be fully resolved by end of 2014
Research and development by ANDRITZ
SEPARATION in Vierkirchen, Germany, to
optimize centrifuges for the chemical industry
1. Update on major topics impacting earnings since last CMD
4. Capital Market Days – goals and summary
2. Business areas – market update
3. Main topics 2015
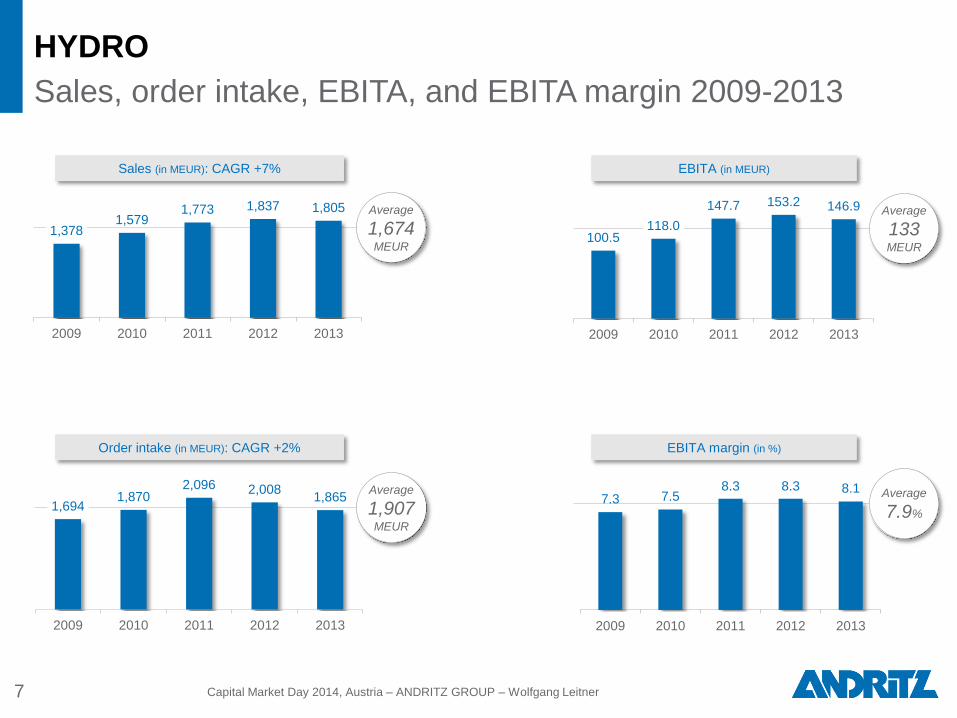
HYDRO
Sales, order intake, EBITA, and EBITA margin 2009-2013
1,378 1,579
1,773 1,837 1,805
2009 2010 2011 2012 2013
Sales (in MEUR): CAGR +7%
1,694 1,870
2,096 2,008 1,865
2009 2010 2011 2012 2013
7 Capital Market Day 2014, Austria – ANDRITZ GROUP – Wolfgang Leitner
100.5 118.0
147.7 153.2 146.9
2009 2010 2011 2012 2013
Order intake (in MEUR): CAGR +2%
EBITA (in MEUR)
EBITA margin (in %)
Average
1,674 MEUR
Average
1,907 MEUR
Average
133 MEUR
Average
7.9%
7.3 7.5 8.3 8.3 8.1
2009 2010 2011 2012 2013
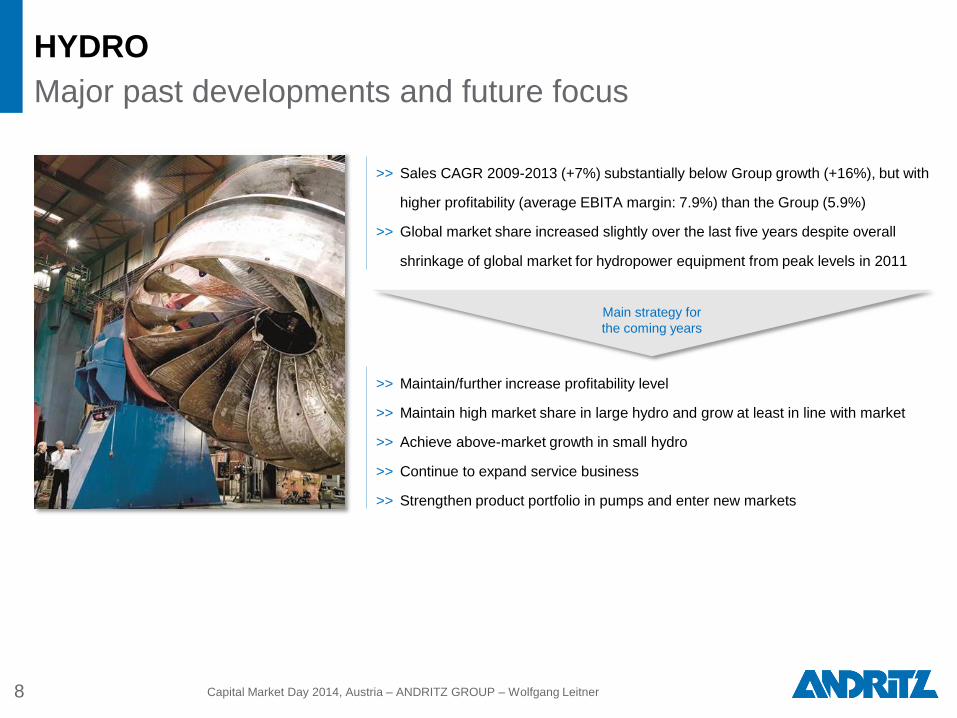
HYDRO
Major past developments and future focus
8 Capital Market Day 2014, Austria – ANDRITZ GROUP – Wolfgang Leitner
>> Sales CAGR 2009-2013 (+7%) substantially below Group growth (+16%), but with
higher profitability (average EBITA margin: 7.9%) than the Group (5.9%)
>> Global market share increased slightly over the last five years despite overall
shrinkage of global market for hydropower equipment from peak levels in 2011
Main strategy for
the coming years
>> Maintain/further increase profitability level
>> Maintain high market share in large hydro and grow at least in line with market
>> Achieve above-market growth in small hydro
>> Continue to expand service business
>> Strengthen product portfolio in pumps and enter new markets

9 Capital Market Day 2014, Austria – ANDRITZ GROUP – Wolfgang Leitner
HYDRO
Challenging, but solid market environment
Long-term
average growth
potential:
3-4% p.a.
Large-scale plants Small-scale plants Pumps
Market
update
>> Solid demand for modernizations
>> Pumped storage projects on hold due to low
electricity prices
>> Greenfield hydropower projects in emerging
markets (Africa, South America)
Good activity to continue, especially in
emerging markets (high energy demand,
low capex needs)
Demand for special pumps
to remain high (irrigation,
water transport, nuclear,
etc.)
Competition Increasing price competition on selective projects. Main competitors: GE/Alstom, Voith
Outlook Stable +

Units over 30 years old
(in % of installed capacity in operation)
10 Capital Market Day 2014, Austria – ANDRITZ GROUP – Wolfgang Leitner
Favorable modernization potential: more than half of
hydropower capacity installed worldwide over 30 years old
Installed hydropower capacity 2013
by region in %
█ Europe
█ China
█ North/Central America
█ Asia (without China)
█ South America
█ Africa
26
26 19
14
12 3
1,076 GW
74
29
80
29
38
71
Europe
China
North/Central America
Asia
South America
Africa
Sources: GlobalData, Hydropower &
Dams World Atlas, 2013
Average
55%

2000 2001 2002 2003 2004 2005 2006 2007 2008 2009 2010 2011 2012 2013 2014E 2015E 2016E 2017E 2018E 2019E 2020E 2021E 2022E 2023E 2024E 2025E
CAGR 2013-2025E
■ China +6%
■ Africa +5%
■ South America +4%
■ Asia (without China) +3%
■ North/Central America +2%
■ Europe +1%
Cumulative installed hydropower capacity in GW (I)
Average annual growth of 3.5% expected for 2013-2025
11
Source: GlobalData
Capital Market Day 2014, Austria – ANDRITZ GROUP – Wolfgang Leitner
729 738 752 773 797 822 845 877 908 939 976
1,012 1,043
1,076 1,107 1,149
1,196 1,243
1,291 1,335
1,384 1,431
1,479 1,528
1,579 1,630
+3.0%

Cumulative installed hydropower capacity in GW (II)
Strongest expected growth in China
12 Capital Market Day 2014, Austria – ANDRITZ GROUP – Wolfgang Leitner
Source: GlobalData
Hydropower capacity increase 2013-2025E:
+554 GW, thereof (in %) …
█ China
█ Asia (without China)
█ South America
█ North/Central America
█ Europe
█ Africa
54
12
12
9
8 5
554 GW

87%
13%
57%
43%
13 Capital Market Day 2014, Austria – ANDRITZ GROUP – Wolfgang Leitner
Strong potential in South America
Example Brazil
Source: Ministério de Minas e Energia, January 2014; FX-rate EUR/BRL
as of July 31, 2014
>> Very tight energy supply, but no new capacities due to anti-business electricity pricing of current government >> Brazil could/should spend 66 bn. EUR expanding its power generation capacity in 2013-2022; thereof …
Planned projects
> 1,000 MW River MW
Planned
start-up
São Luiz do Tapajós Tapajós 6,133 2019
Jatobá Tapajós 2,338 2020
Salto Augusto Baixo Juruena 1,461 2022
São Simão Alto Juruena 3,509 2022
Marabá Tocantins 2,160 2022
█ Plants approved by
governmental authorities
█ Planned plants
█ Electromechanical equipment
█ Mechanical equipment
█ Generators
█ Civil and erection work (not ANDRITZ)
Typical supply split for
hydropower plants
ANDRITZʼs potential scope of supply is ~18 bn. EUR:
… hydropower:
36 bn. EUR … solar, biomass, and
wind: 27 bn. EUR
… thermal*:
3 bn. EUR
69%
31%
17%
20%
13%
50%
* Nuclear, gas, coal, fuel oil/diesel

1.9
7.3 6.4
5.9
-1.8
2009 2010 2011 2012 2013
PULP & PAPER
Sales, order intake, EBITA, and EBITA margin 2009-2013
926 1,130
1,885
2,282 2,005
2009 2010 2011 2012 2013
Sales (in MEUR): CAGR +21%
940
1,416
2,694
1,962 1,908
2009 2010 2011 2012 2013
14 Capital Market Day 2014, Austria – ANDRITZ GROUP – Wolfgang Leitner
17.2
82.2
120.4 134.6
-35.7
2009 2010 2011 2012 2013
Order intake (in MEUR): CAGR +19%
EBITA (in MEUR)
EBITA margin (in %)
2013
2013
Average
1,646 MEUR
Average
1,784 MEUR
Average
64 MEUR
Average
3.9%
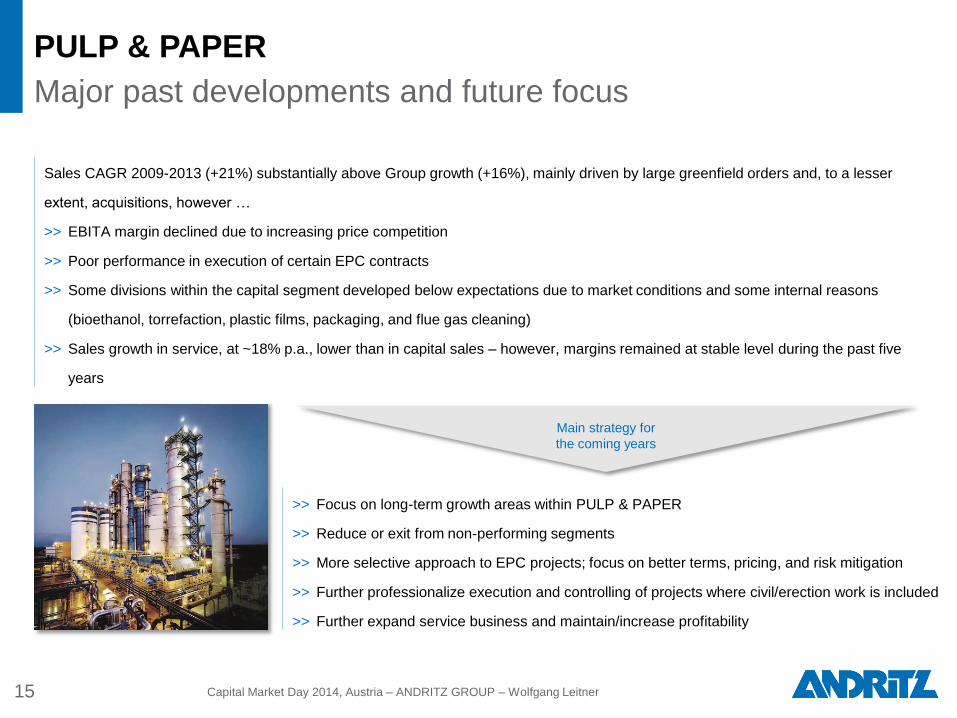
PULP & PAPER
Major past developments and future focus
15 Capital Market Day 2014, Austria – ANDRITZ GROUP – Wolfgang Leitner
Sales CAGR 2009-2013 (+21%) substantially above Group growth (+16%), mainly driven by large greenfield orders and, to a lesser
extent, acquisitions, however …
>> EBITA margin declined due to increasing price competition
>> Poor performance in execution of certain EPC contracts
>> Some divisions within the capital segment developed below expectations due to market conditions and some internal reasons
(bioethanol, torrefaction, plastic films, packaging, and flue gas cleaning)
>> Sales growth in service, at ~18% p.a., lower than in capital sales – however, margins remained at stable level during the past five
years
>> Focus on long-term growth areas within PULP & PAPER
>> Reduce or exit from non-performing segments
>> More selective approach to EPC projects; focus on better terms, pricing, and risk mitigation
>> Further professionalize execution and controlling of projects where civil/erection work is included
>> Further expand service business and maintain/increase profitability
Main strategy for
the coming years
16
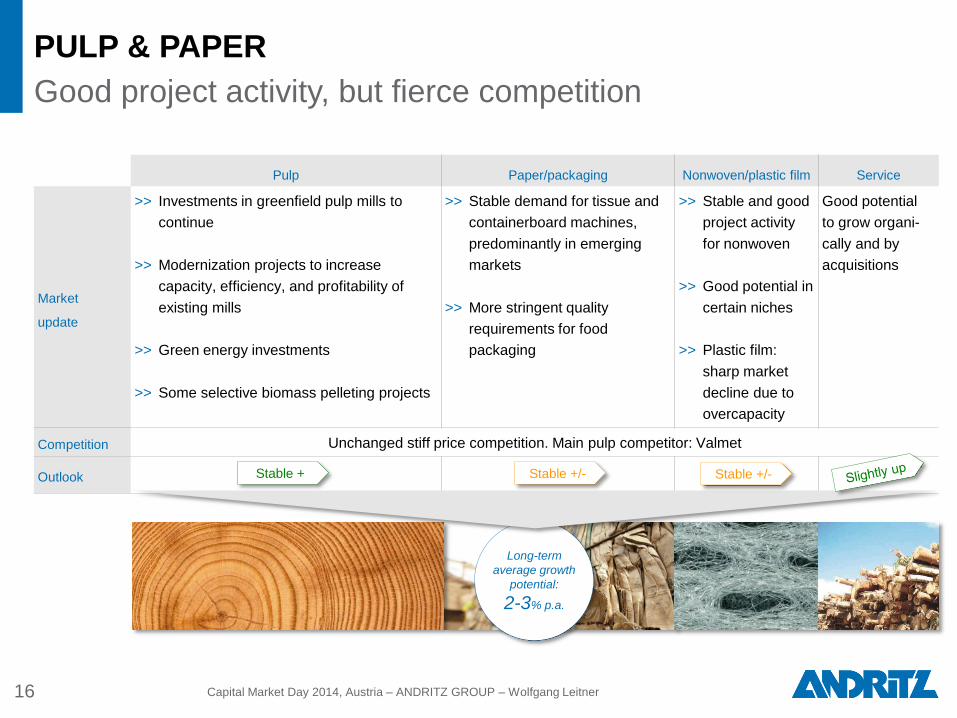
PULP & PAPER
Good project activity, but fierce competition
Capital Market Day 2014, Austria – ANDRITZ GROUP – Wolfgang Leitner
Pulp Paper/packaging Nonwoven/plastic film Service
Market
update
>> Investments in greenfield pulp mills to
continue
>> Modernization projects to increase
capacity, efficiency, and profitability of
existing mills
>> Green energy investments
>> Some selective biomass pelleting projects
>> Stable demand for tissue and
containerboard machines,
predominantly in emerging
markets
>> More stringent quality
requirements for food
packaging
>> Stable and good
project activity
for nonwoven
>> Good potential in
certain niches
>> Plastic film:
sharp market
decline due to
overcapacity
Good potential
to grow organi-
cally and by
acquisitions
Competition Unchanged stiff price competition. Main pulp competitor: Valmet
Outlook
Long-term
average growth
potential:
2-3% p.a.
Stable + Stable +/- Stable +/-
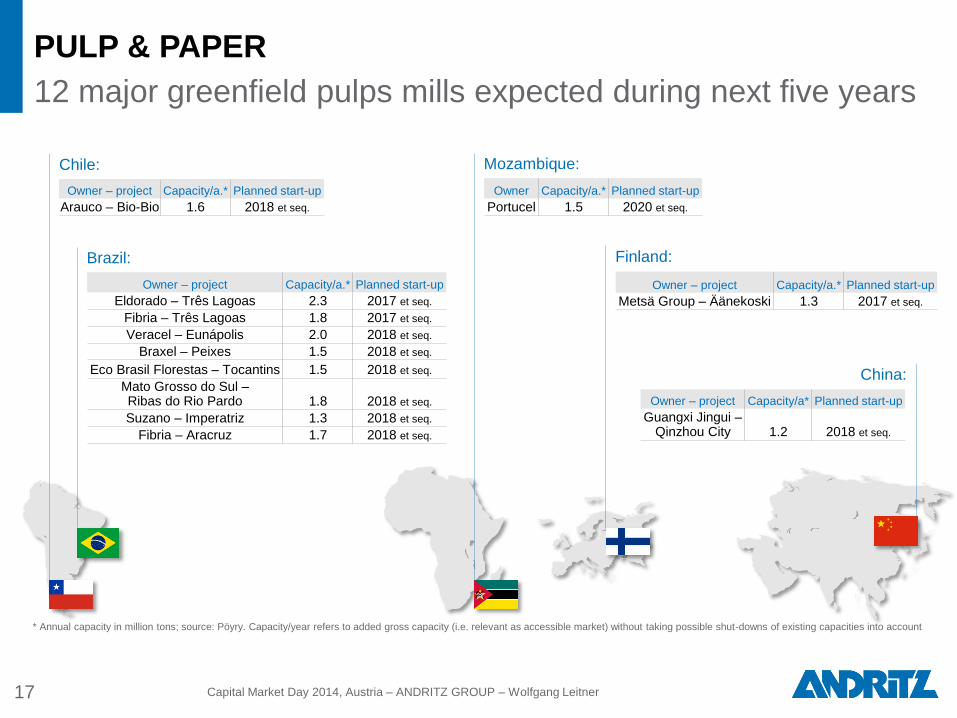
Mozambique: Chile:
Owner – project Capacity/a.* Planned start-up
Arauco – Bio-Bio 1.6 2018 et seq.
17 Capital Market Day 2014, Austria – ANDRITZ GROUP – Wolfgang Leitner
PULP & PAPER
12 major greenfield pulps mills expected during next five years
* Annual capacity in million tons; source: Pöyry. Capacity/year refers to added gross capacity (i.e. relevant as accessible market) without taking possible shut-downs of existing capacities into account
Brazil:
Owner – project Capacity/a.* Planned start-up
Eldorado – Três Lagoas 2.3 2017 et seq.
Fibria – Três Lagoas 1.8 2017 et seq.
Veracel – Eunápolis 2.0 2018 et seq.
Braxel – Peixes 1.5 2018 et seq.
Eco Brasil Florestas – Tocantins 1.5 2018 et seq.
Mato Grosso do Sul – Ribas do Rio Pardo 1.8 2018 et seq.
Suzano – Imperatriz 1.3 2018 et seq.
Fibria – Aracruz 1.7 2018 et seq.
Owner Capacity/a.* Planned start-up
Portucel 1.5 2020 et seq.
Finland:
Owner – project Capacity/a.* Planned start-up
Metsä Group – Äänekoski 1.3 2017 et seq.
China:
Owner – project Capacity/a* Planned start-up
Guangxi Jingui – Qinzhou City 1.2 2018 et seq.
4.3
5.4 5.2
6.2
4.1*
2009 2010 2011 2012 2013
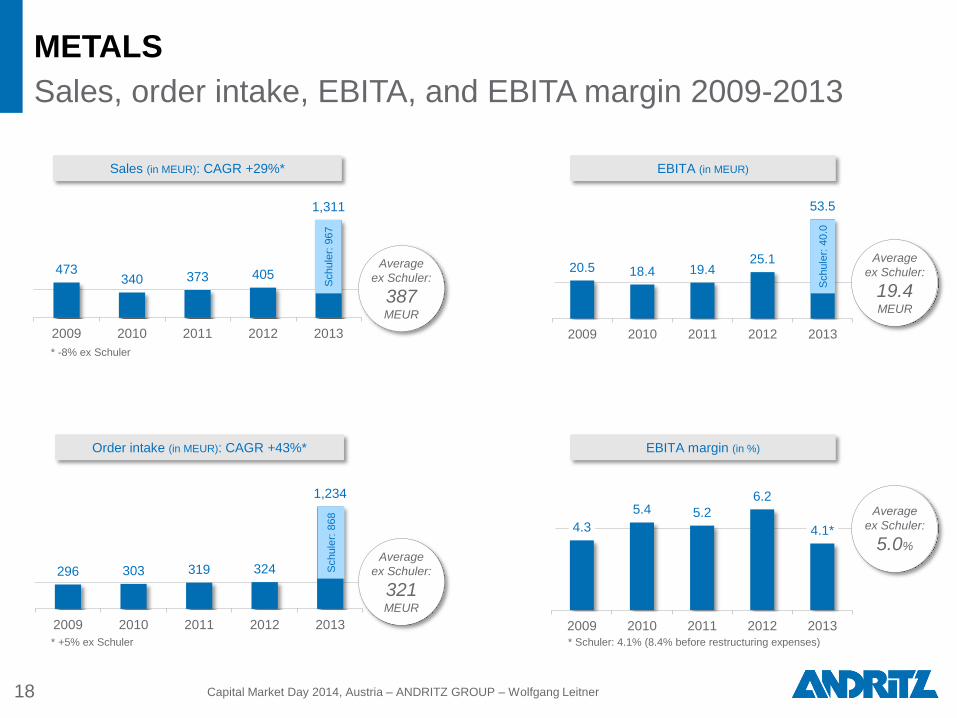
METALS
Sales, order intake, EBITA, and EBITA margin 2009-2013
473 340 373 405
1,311
2009 2010 2011 2012 2013
Sales (in MEUR): CAGR +29%*
296 303 319 324
1,234
2009 2010 2011 2012 2013
18 Capital Market Day 2014, Austria – ANDRITZ GROUP – Wolfgang Leitner
20.5 18.4 19.4 25.1
53.5
2009 2010 2011 2012 2013
Order intake (in MEUR): CAGR +43%*
EBITA (in MEUR)
EBITA margin (in %)
* -8% ex Schuler
* +5% ex Schuler
Average
ex Schuler:
387 MEUR
Schule
r: 9
67
S
chule
r: 8
68
Schule
r: 4
0.0
* Schuler: 4.1% (8.4% before restructuring expenses)
Average
ex Schuler:
321 MEUR
Average
ex Schuler:
19.4 MEUR
Average
ex Schuler:
5.0%
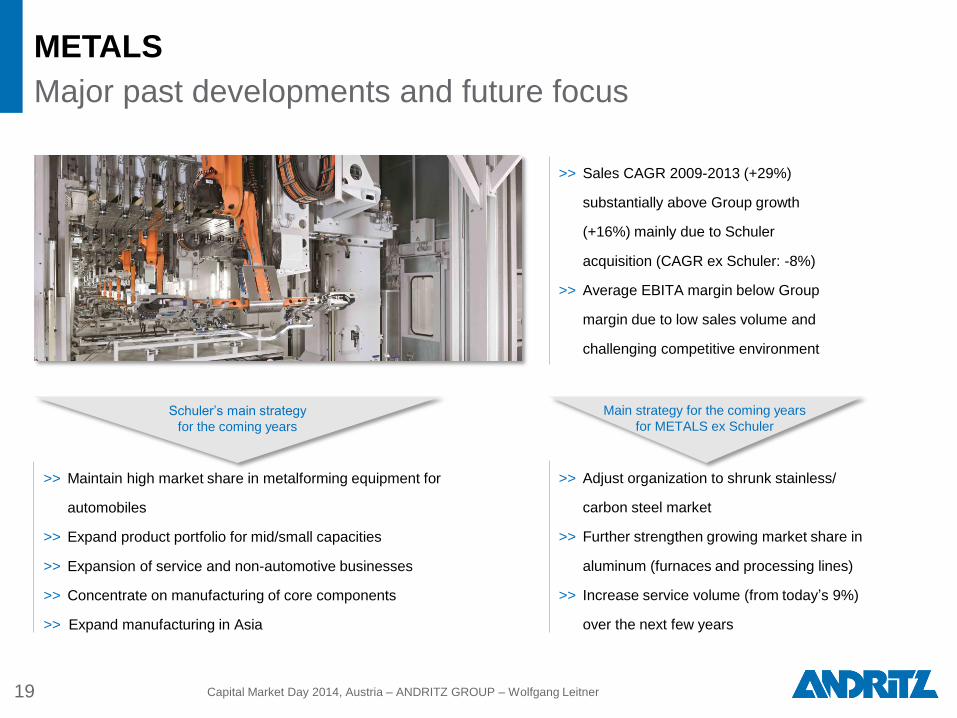
METALS
Major past developments and future focus
19 Capital Market Day 2014, Austria – ANDRITZ GROUP – Wolfgang Leitner
>> Sales CAGR 2009-2013 (+29%)
substantially above Group growth
(+16%) mainly due to Schuler
acquisition (CAGR ex Schuler: -8%)
>> Average EBITA margin below Group
margin due to low sales volume and
challenging competitive environment
Schulerʼs main strategy
for the coming years
>> Maintain high market share in metalforming equipment for
automobiles
>> Expand product portfolio for mid/small capacities
>> Expansion of service and non-automotive businesses
>> Concentrate on manufacturing of core components
>> Expand manufacturing in Asia
Main strategy for the coming years
for METALS ex Schuler
>> Adjust organization to shrunk stainless/
carbon steel market
>> Further strengthen growing market share in
aluminum (furnaces and processing lines)
>> Increase service volume (from todayʼs 9%)
over the next few years
20
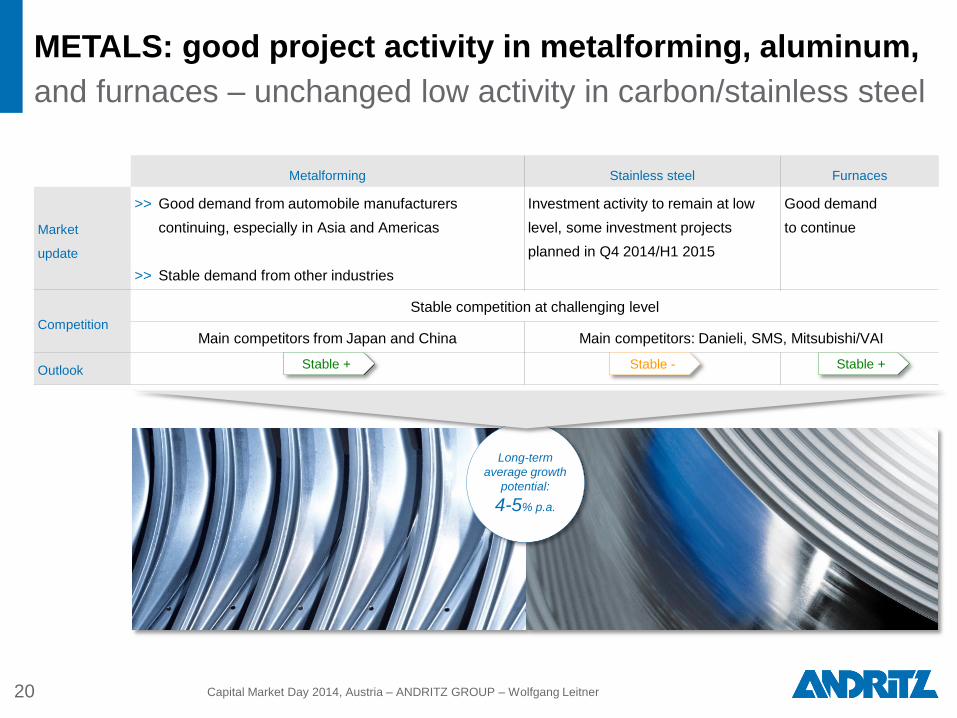
METALS: good project activity in metalforming, aluminum,
and furnaces – unchanged low activity in carbon/stainless steel
Capital Market Day 2014, Austria – ANDRITZ GROUP – Wolfgang Leitner
Long-term
average
growth
potential
2-3% p.a.
Metalforming Stainless steel Furnaces
Market
update
>> Good demand from automobile manufacturers
continuing, especially in Asia and Americas
>> Stable demand from other industries
Investment activity to remain at low
level, some investment projects
planned in Q4 2014/H1 2015
Good demand
to continue
Competition
Stable competition at challenging level
Main competitors from Japan and China Main competitors: Danieli, SMS, Mitsubishi/VAI
Outlook
Long-term
average growth
potential:
4-5% p.a.
Stable + Stable - Stable +

2011 2012 2013 2014E 2015E 2016E 2017E 2018E
Long-term growth of automobile production
to support growth of Schuler
21 Capital Market Day 2014, Austria – ANDRITZ GROUP – Wolfgang Leitner
Source: IHS Global Insight
77 82 83 87 92 97 100 103
Global production volume in million car units (CAGR global 2013-2018E: +4%)
Share in production volume 2013
CAGR 2013-2018E
█ Europe 22% +4%
█ Greater China 25% +7%
█ Japan/Korea 16% -1%
█ Middle East/Africa 2% +6%
█ North America 20% +2%
█ South America 5% +6%
█ South Asia 10% +8%

Average
5.7%
6.2
7.7 7.8 6.9
-0.1
2009 2010 2011 2012 2013
SEPARATION
Sales, order intake, EBITA, and EBITA margin 2009-2013
421 505
566 653
590
2009 2010 2011 2012 2013
Sales (in MEUR): CAGR +9%
419
544 598 629 604
2009 2010 2011 2012 2013
22 Capital Market Day 2014, Austria – ANDRITZ GROUP – Wolfgang Leitner
25.9
39.0 44.0 44.9
-0.6
2009 2010 2011 2012 2013
Order intake (in MEUR): CAGR +10%
EBITA (in MEUR)
EBITA margin (in %)
Average
547 MEUR
Average
559 MEUR
Average
31 MEUR
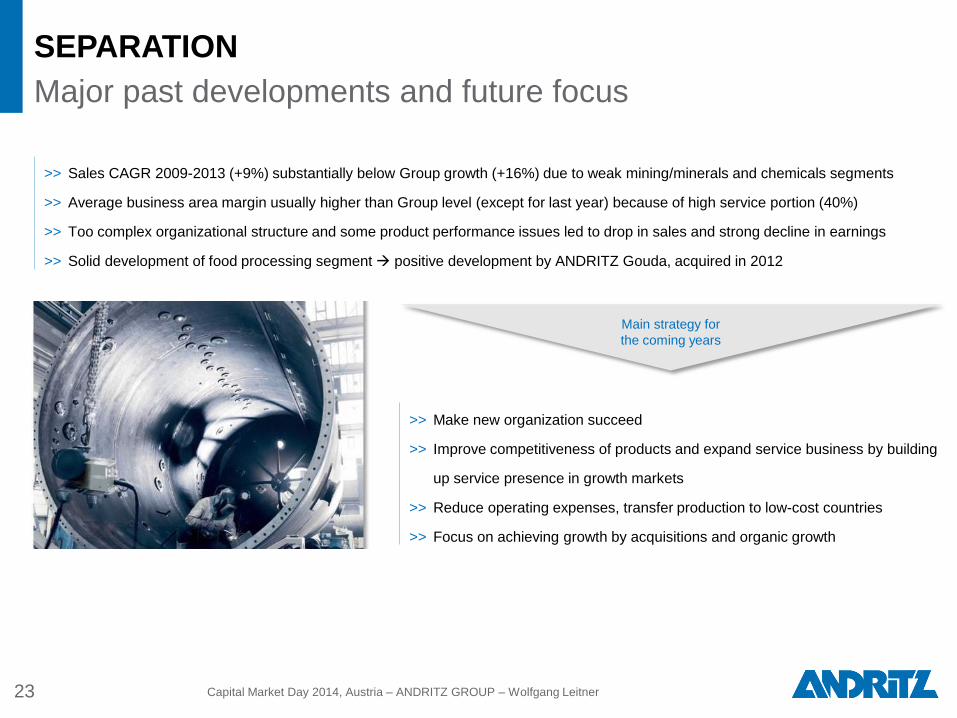
SEPARATION
Major past developments and future focus
23 Capital Market Day 2014, Austria – ANDRITZ GROUP – Wolfgang Leitner
>> Sales CAGR 2009-2013 (+9%) substantially below Group growth (+16%) due to weak mining/minerals and chemicals segments
>> Average business area margin usually higher than Group level (except for last year) because of high service portion (40%)
>> Too complex organizational structure and some product performance issues led to drop in sales and strong decline in earnings
>> Solid development of food processing segment positive development by ANDRITZ Gouda, acquired in 2012
>> Make new organization succeed
>> Improve competitiveness of products and expand service business by building
up service presence in growth markets
>> Reduce operating expenses, transfer production to low-cost countries
>> Focus on achieving growth by acquisitions and organic growth
Main strategy for
the coming years
24
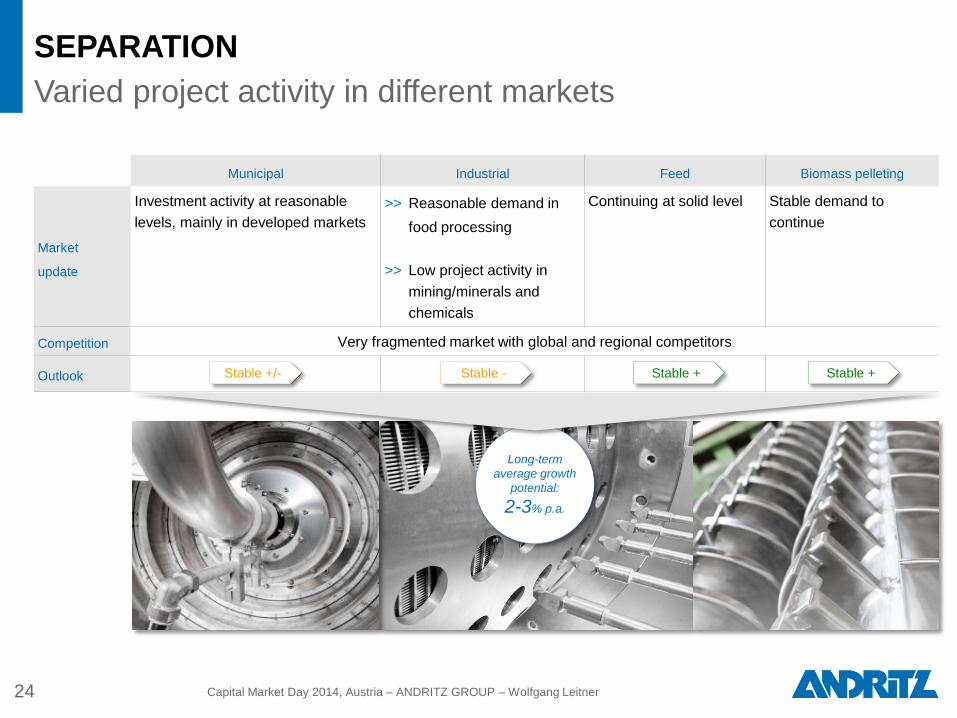
SEPARATION
Varied project activity in different markets
Capital Market Day 2014, Austria – ANDRITZ GROUP – Wolfgang Leitner
Municipal Industrial Feed Biomass pelleting
Market
update
Investment activity at reasonable
levels, mainly in developed markets
>> Reasonable demand in
food processing
>> Low project activity in
mining/minerals and
chemicals
Continuing at solid level Stable demand to
continue
Competition Very fragmented market with global and regional competitors
Outlook
Long-term
average growth
potential:
2-3% p.a.
Stable - Stable +/- Stable + Stable +

1. Update on major topics impacting earnings since last CMD
4. Capital Market Days – goals and summary
2. Business areas – market update
3. Main topics 2015
26
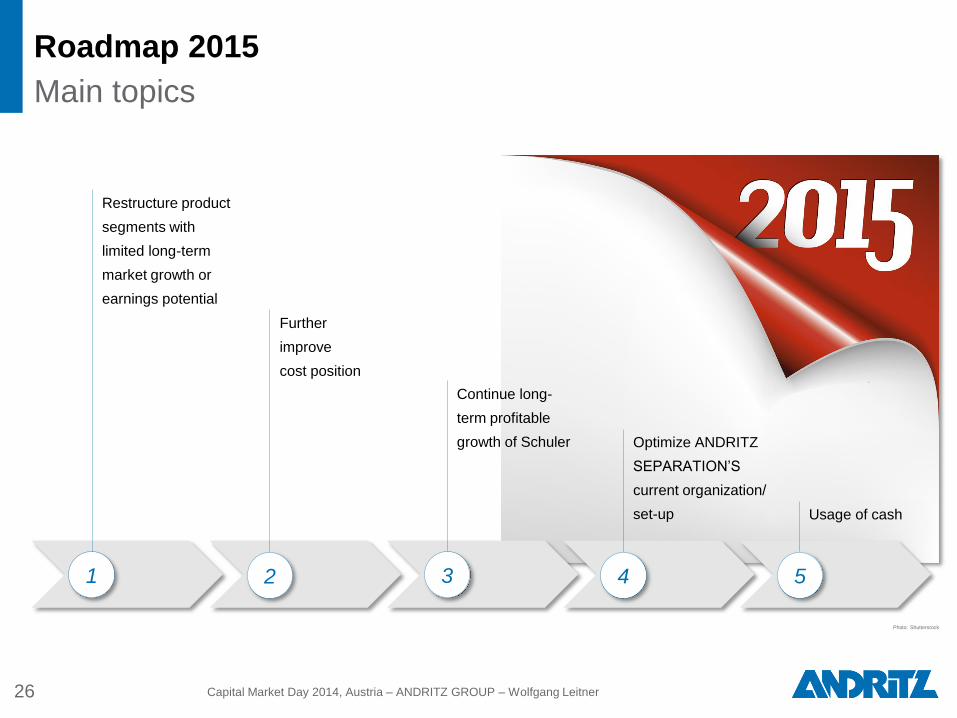
Roadmap 2015
Main topics
Capital Market Day 2014, Austria – ANDRITZ GROUP – Wolfgang Leitner
Restructure product
segments with
limited long-term
market growth or
earnings potential
Photo: Shutterstock
Continue long-
term profitable
growth of Schuler
Further
improve
cost position
Usage of cash
Optimize ANDRITZ
SEPARATIONʼS
current organization/
set-up
4 3 5 1 2
27 Capital Market Day 2014, Austria – ANDRITZ GROUP – Wolfgang Leitner
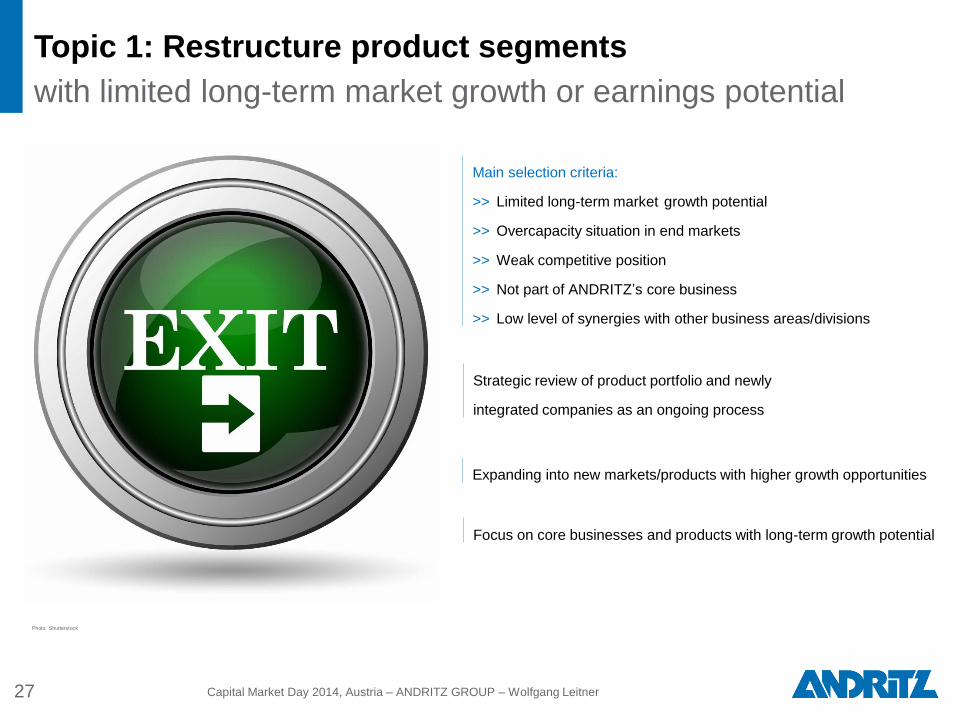
Topic 1: Restructure product segments
with limited long-term market growth or earnings potential
Strategic review of product portfolio and newly
integrated companies as an ongoing process
Main selection criteria:
>> Limited long-term market growth potential
>> Overcapacity situation in end markets
>> Weak competitive position
>> Not part of ANDRITZʼs core business
>> Low level of synergies with other business areas/divisions
Photo: Shutterstock
Expanding into new markets/products with higher growth opportunities
Focus on core businesses and products with long-term growth potential
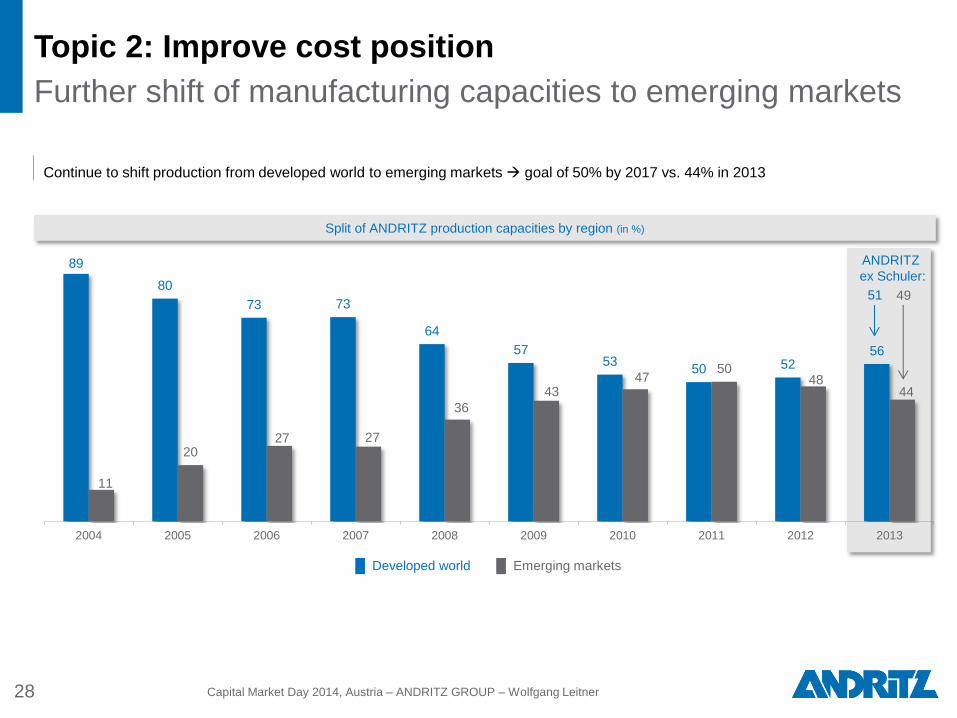
Topic 2: Improve cost position
Further shift of manufacturing capacities to emerging markets
28 Capital Market Day 2014, Austria – ANDRITZ GROUP – Wolfgang Leitner
89
80
73 73
64
57 53
50 52 56
11
20 27 27
36
43 47
50 48
44
2004 2005 2006 2007 2008 2009 2010 2011 2012 2013
ANDRITZ
ex Schuler:
Split of ANDRITZ production capacities by region (in %)
Continue to shift production from developed world to emerging markets goal of 50% by 2017 vs. 44% in 2013
49 51
█ Developed world █ Emerging markets
29 Capital Market Day 2014, Austria – ANDRITZ GROUP – Wolfgang Leitner
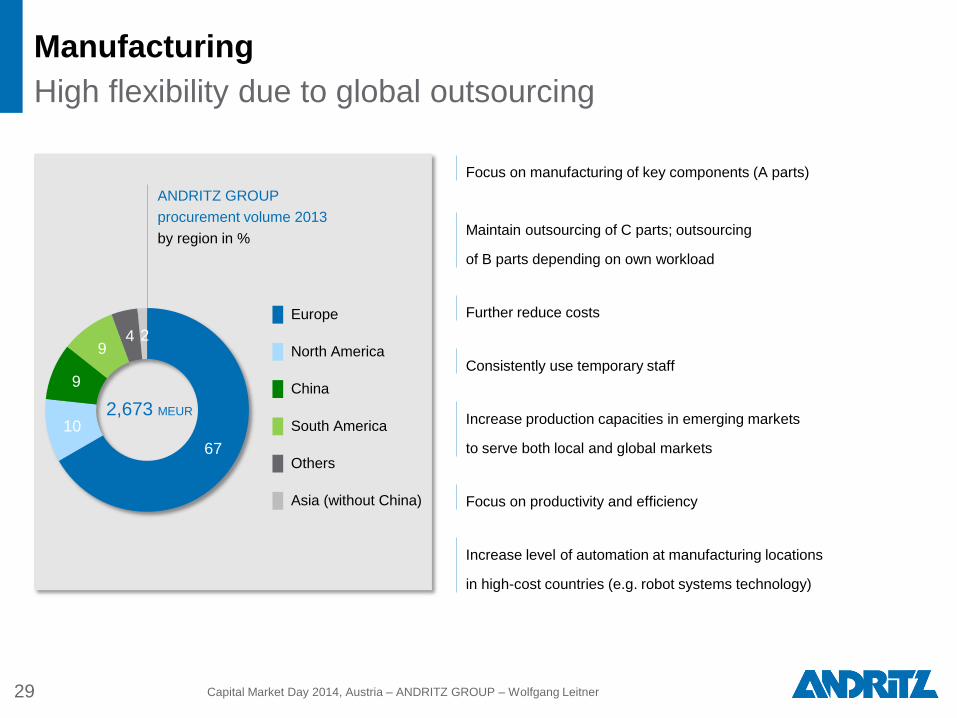
Focus on manufacturing of key components (A parts)
Further reduce costs
Maintain outsourcing of C parts; outsourcing
of B parts depending on own workload
Increase production capacities in emerging markets
to serve both local and global markets
Increase level of automation at manufacturing locations
in high-cost countries (e.g. robot systems technology)
Focus on productivity and efficiency
Consistently use temporary staff
Manufacturing
High flexibility due to global outsourcing
ANDRITZ GROUP
procurement volume 2013
by region in %
67
10
9
9 4 2
█ Europe
█ North America
█ China
█ South America
█ Others
█ Asia (without China)
2,673 MEUR

Capital Market Day 2014, Austria – ANDRITZ GROUP – Wolfgang Leitner
Focus on service
30
Strong contribution towards customer satisfaction
Increased importance of life cycle support (day-to-day business)
Good potential to grow organically and by acquisitions
EBITA margin substantially above Group average

CAGR sales 2009-2013:
■ Capital sales: +15%
■ SEPARATION
service sales:
+10%
■ METALS
service sales:
+98%*
■ PULP & PAPER
service sales:
+18%
■ HYDRO
service sales:
+8%
2009 2010 2011 2012 2013
3,198
3,554
4,596
5,177
5,711
31 Capital Market Day 2014, Austria – ANDRITZ GROUP – Wolfgang Leitner
Service sales as % of total sales
Development of service sales
Strong contribution towards overall sales growth since 2009
+17%
27%
29%
27%
26%
28%
* +6% ex Schuler

Topic 3: Schuler
Continue long-term profitable growth
32 Capital Market Day 2014, Austria – ANDRITZ GROUP – Wolfgang Leitner
Cupping press, designed for production of 3,000 cans per minute
Schulerʼs strategy program:
>> Reduce complexity
>> Develop products for B-segment markets
>> Create new production concept
>> Expand production in emerging markets
Annual cost savings 2015E et seq.:
15-20 MEUR out of restructuring
Long-term EBITA margin goal:
8.5%

Topic 4: SEPARATION
Optimization of current organization/set-up in 2015
33 Capital Market Day 2014, Austria – ANDRITZ GROUP – Wolfgang Leitner
Profitability actions:
>> Competitive product portfolio
>> Optimized product costs
>> Transfer of manufacturing to low-cost countries
>> Further reduction of operating expenses
Main focus of reorganization:
>> Straight-line organization
>> Empowered product homes
>> Customer focus
>> Competitive machines
ANDRITZ decanter centrifuges for Sungai
Semenyith, Malaysia, one of the largest drinking
water treatment plants in South East Asia
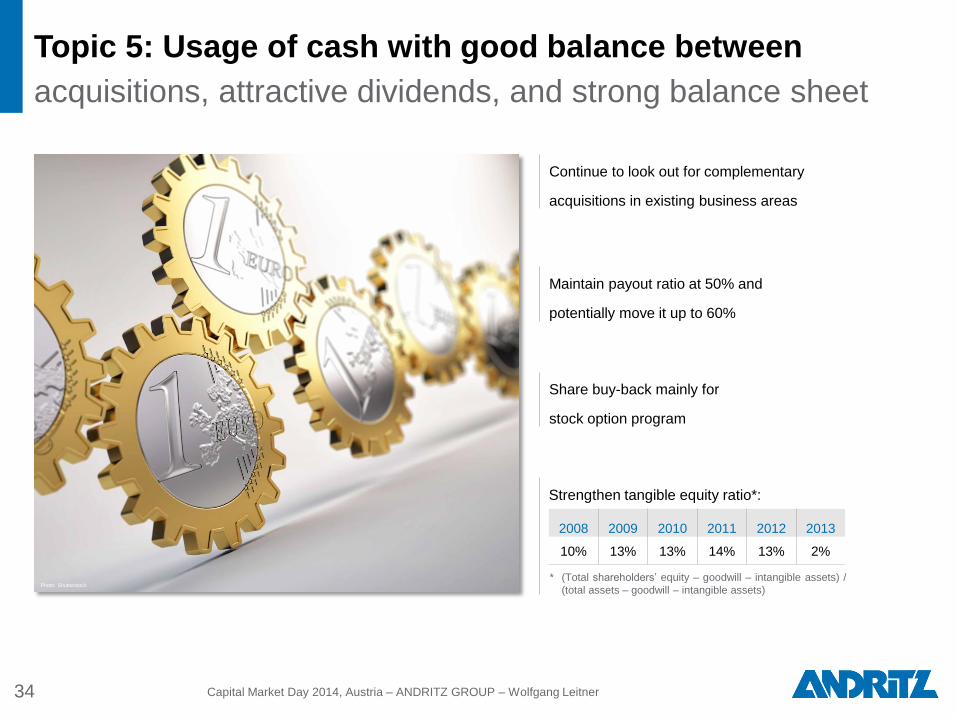
Strengthen tangible equity ratio*:
Topic 5: Usage of cash with good balance between
acquisitions, attractive dividends, and strong balance sheet
34 Capital Market Day 2014, Austria – ANDRITZ GROUP – Wolfgang Leitner
* (Total shareholdersʼ equity – goodwill – intangible assets) /
(total assets – goodwill – intangible assets)
Share buy-back mainly for
stock option program
Maintain payout ratio at 50% and
potentially move it up to 60%
Continue to look out for complementary
acquisitions in existing business areas
Photo: Shutterstock
2008 2009 2010 2011 2012 2013
10% 13% 13% 14% 13% 2%

1. Update on major topics impacting earnings since last CMD
4. Capital Market Days – goals and summary
2. Business areas – market update
3. Main topics 2015
2007 2008 2009 2010 2011 2012 2013
Review of Capital Market Day goals:
Dividend goals achieved, EBITA margin goal pending
* Excluding restructuring expenses: 6.0%
36 Capital Market Day 2014, Austria – ANDRITZ GROUP – Wolfgang Leitner
Share of
renewable
energy
sales
>50%
4.0/4.5 bn.
EUR
5.0 bn. EUR
~40% ~50% ~50% ~50%
7.0% over the cycle
>> Goal achieved in 2010 and 2011: 7.2% in each case
>> Goal almost achieved in 2012: 6.9%
>> Average 2010-2013: 6.1%
~78% Payout
ratio:
3.0 bn. EUR
7.0%
(achieved
6.5%)
7.0%
(achieved
5.1%*)
Regain
7.0%
(achieved
2.9%)
Goal
pending
Goal
achieved
Goal
not
achieved
Sales:
EBITA
margin:

4.7
5.2 5.3 5.1
6.3 6.1 6.1
6.4 6.5
5.1*
7.2 7.2 6.9
2.9**
937
1,319 1,110 1,225
1,481 1,744
2,710
3,283 3,610
3,198 3,554
4,596
5,177
5,711**
0
1,000
2,000
3,000
4,000
5,000
6,000
0.0
1.0
2.0
3.0
4.0
5.0
6.0
7.0
8.0
2000 2001 2002 2003 2004 2005 2006 2007 2008 2009 2010 2011 2012 2013 2014E 2015E
EBITA margin (%) Sales (MEUR)
* Including restructuring expenses ** Including Schuler as of March 1, 2013; no pro forma figures are available for the reference periods of previous years
Target to continue long-term profitable growth
Goal: maintain 7% and improve to 8% with top-line sales growth
37
%
MEUR
Capital Market Day 2014, Austria – ANDRITZ GROUP – Wolfgang Leitner
Long term:
maintain 7%
and improve to
8% with top-line
sales growth
Average
2005-2009:
6.0% Average
2000-2004:
5.3%
5.9 5.7
7.3 7.3 7.5
8.3 8.3 8.1
7.1
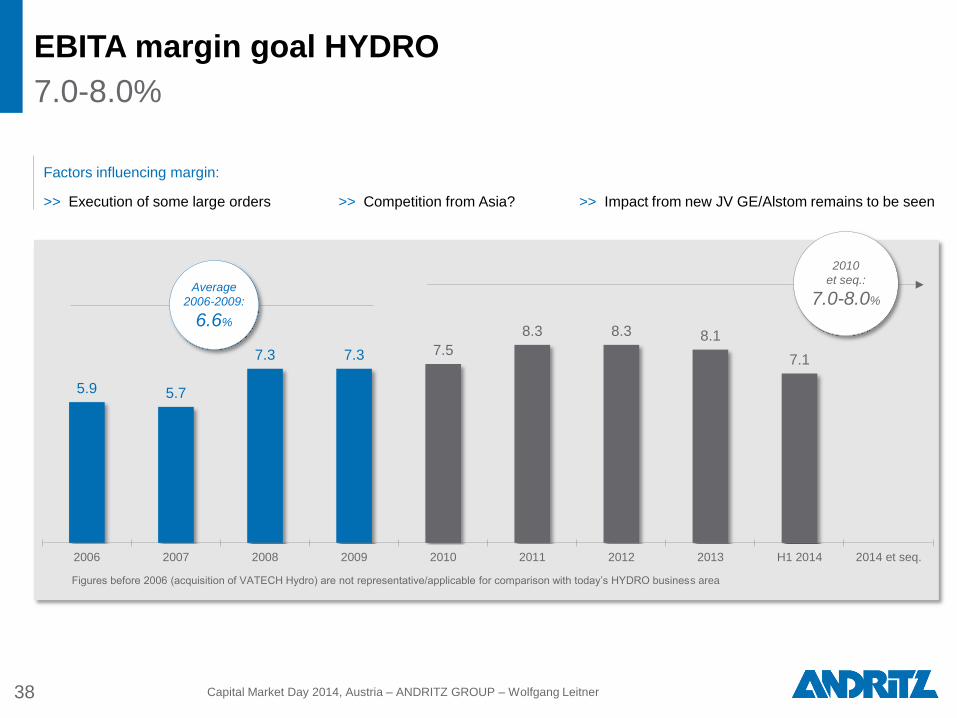
2006 2007 2008 2009 2010 2011 2012 2013 H1 2014 2014 et seq.
EBITA margin goal HYDRO
7.0-8.0%
38
Figures before 2006 (acquisition of VATECH Hydro) are not representative/applicable for comparison with today’s HYDRO business area
Factors influencing margin:
>> Execution of some large orders >> Competition from Asia? >> Impact from new JV GE/Alstom remains to be seen
Capital Market Day 2014, Austria – ANDRITZ GROUP – Wolfgang Leitner
2010
et seq.:
7.0-8.0% Average
2006-2009:
6.6%
5.1
6.1 5.8 6.1
7.3
6.2 5.8 6.0
5.0
1.9*
7.3 6.4
5.9
-1.8
4.3
2000 2001 2002 2003 2004 2005 2006 2007 2008 2009 2010 2011 2012 2013 H1 2014 2014 etseq.
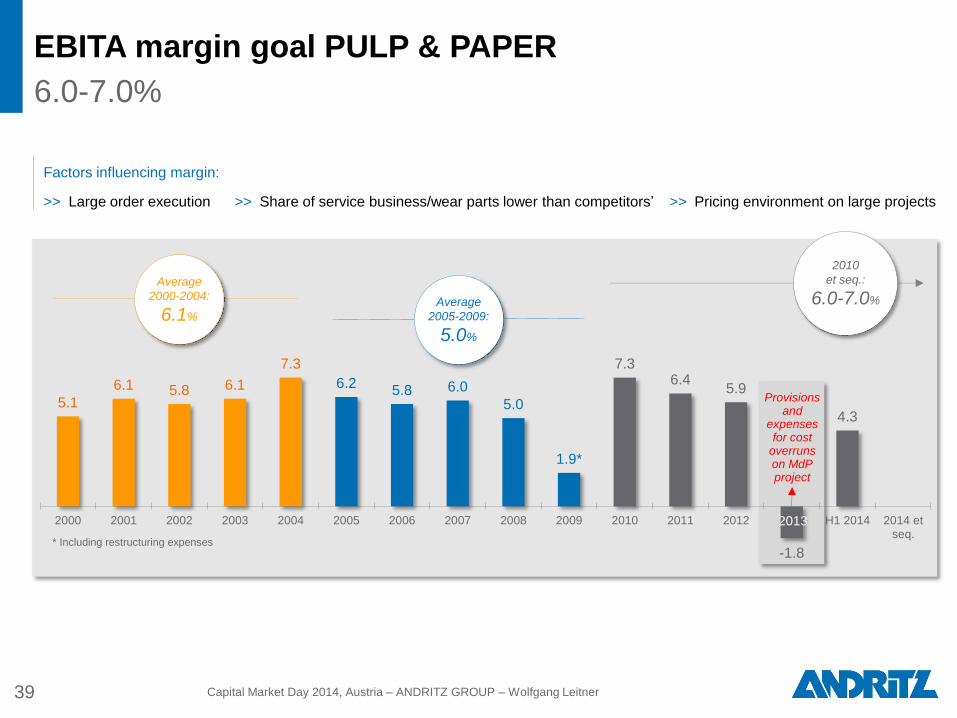
EBITA margin goal PULP & PAPER
6.0-7.0%
39
Provisions and
expenses for cost
overruns on MdP project
* Including restructuring expenses
Factors influencing margin:
>> Large order execution >> Share of service business/wear parts lower than competitorsʼ >> Pricing environment on large projects
Capital Market Day 2014, Austria – ANDRITZ GROUP – Wolfgang Leitner
2010
et seq.:
6.0-7.0%
2013
Average
2005-2009:
5.0%
Average
2000-2004:
6.1%
EBITA margin goal METALS
7.0-8.0%
40
Factors influencing margin:
>> Development of automobile market
>> Expansion of service business
>> Success of Schuler restructuring
3.8 3.6
4.8
2.5
5.1 5.8
6.9 7.5
7.1
4.3
5.4 5.2
6.2
4.1
5.4
2000 2001 2002 2003 2004 2005 2006 2007 2008 2009 2010 2011 2012 2013 H1 2014 2014 etseq.
Restruc- turing
at Schuler
Capital Market Day 2014, Austria – ANDRITZ GROUP – Wolfgang Leitner
2010
et seq.:
7.0-8.0% Average
2005-2009:
6.3%
Average
2000-2004:
4.0%
>> Unchanged low investment activity in stainless
steel due to ongoing overcapacities
>> M&A
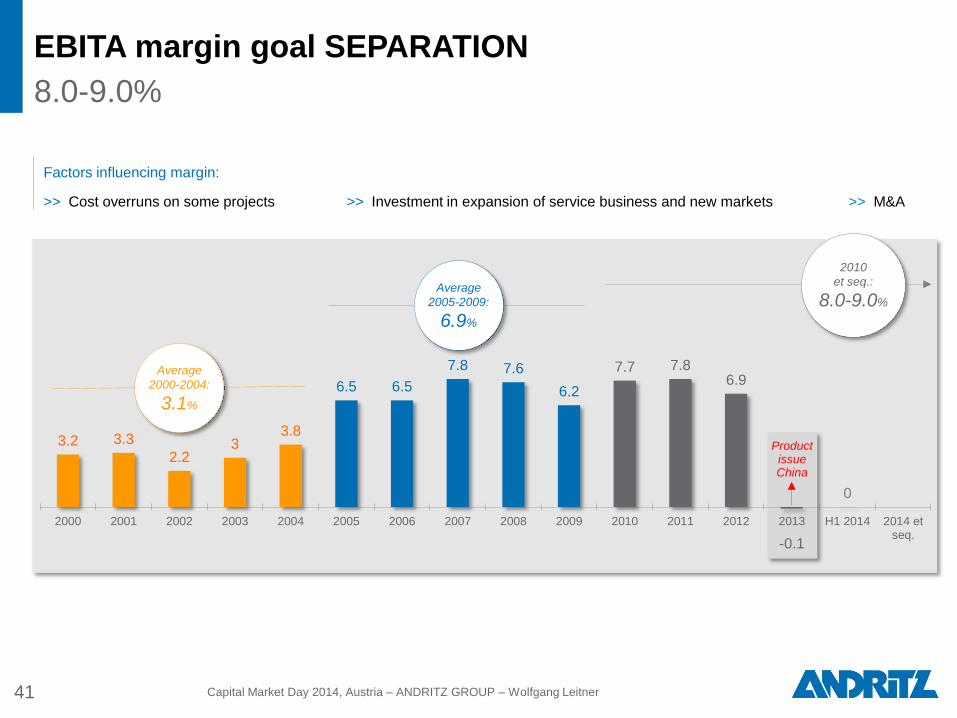
EBITA margin goal SEPARATION
8.0-9.0%
41
Factors influencing margin:
>> Cost overruns on some projects >> Investment in expansion of service business and new markets >> M&A
3.2 3.3
2.2 3
3.8
6.5 6.5
7.8 7.6
6.2
7.7 7.8 6.9
-0.1
0
2000 2001 2002 2003 2004 2005 2006 2007 2008 2009 2010 2011 2012 2013 H1 2014 2014 etseq.
Product issue China
Capital Market Day 2014, Austria – ANDRITZ GROUP – Wolfgang Leitner
2010
et seq.:
8.0-9.0%
Average
2005-2009:
6.9%
Average
2000-2004:
3.1%
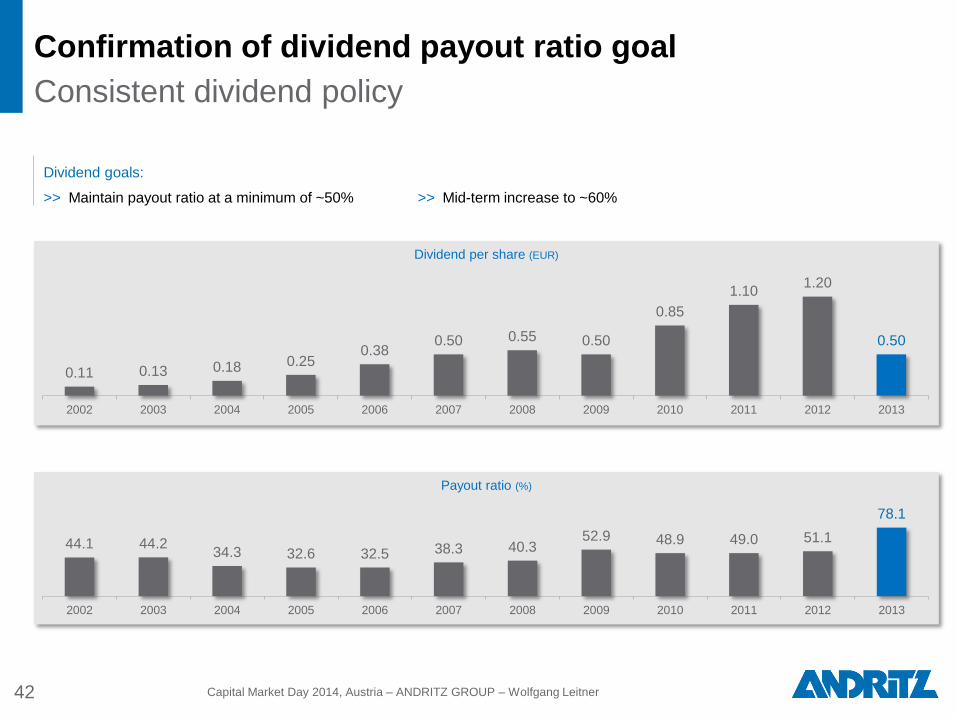
Payout ratio (%)
Dividend per share (EUR)
Confirmation of dividend payout ratio goal
Consistent dividend policy
42
44.1 44.2 34.3 32.6 32.5 38.3 40.3
52.9 48.9 49.0 51.1
78.1
2002 2003 2004 2005 2006 2007 2008 2009 2010 2011 2012 2013
0.11 0.13 0.18 0.25 0.38
0.50 0.55 0.50
0.85
1.10 1.20
0.50
2002 2003 2004 2005 2006 2007 2008 2009 2010 2011 2012 2013
Dividend goals:
>> Maintain payout ratio at a minimum of ~50% >> Mid-term increase to ~60%
Capital Market Day 2014, Austria – ANDRITZ GROUP – Wolfgang Leitner
43
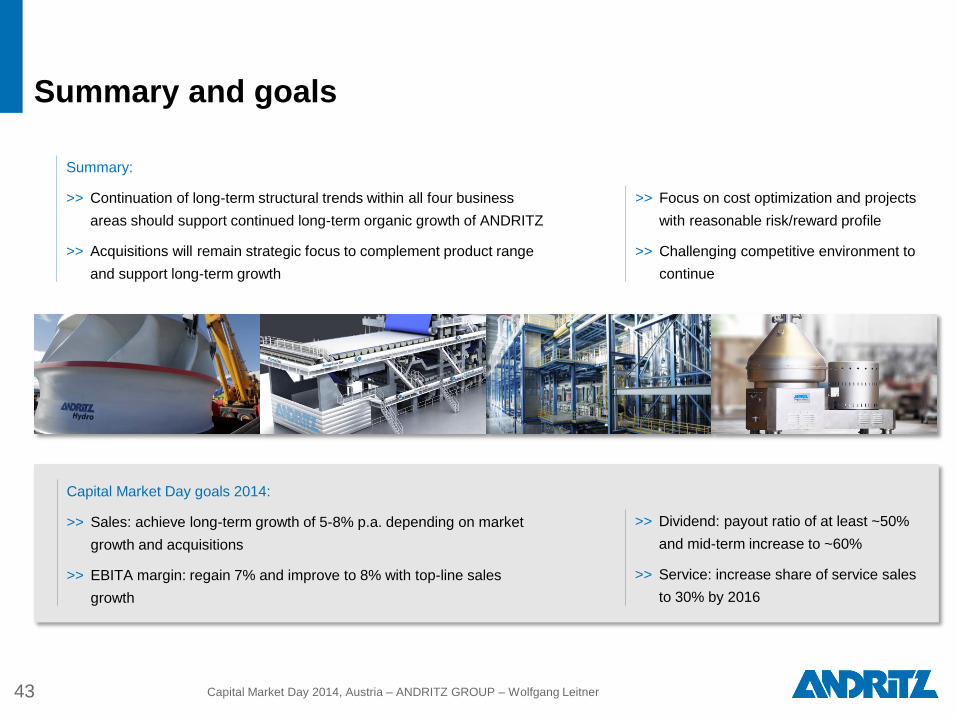
Summary and goals
Summary:
>> Continuation of long-term structural trends within all four business
areas should support continued long-term organic growth of ANDRITZ
>> Acquisitions will remain strategic focus to complement product range
and support long-term growth
>> Focus on cost optimization and projects
with reasonable risk/reward profile
>> Challenging competitive environment to
continue
Capital Market Day goals 2014:
>> Sales: achieve long-term growth of 5-8% p.a. depending on market
growth and acquisitions
>> EBITA margin: regain 7% and improve to 8% with top-line sales
growth
>> Dividend: payout ratio of at least ~50%
and mid-term increase to ~60%
>> Service: increase share of service sales
to 30% by 2016
Capital Market Day 2014, Austria – ANDRITZ GROUP – Wolfgang Leitner

Capital Market Day 2014, Austria
ANDRITZ GROUP


![5a. BIOPALIWA 1 h [tryb zgodno [ci]fluid.wme.pwr.wroc.pl › ~spalanie › dydaktyka › spalanie... · Toryfikacja biomasy (torrefaction) Toryfikacja (torrefaction) polega na traktowaniu](https://img.dokumen.tips/doc/110x75/5f1e44597d33705ff735f910/5a-biopaliwa-1-h-tryb-zgodno-cifluidwmepwrwrocpl-a-spalanie-a-dydaktyka.jpg)