Embed Size (px)
Citation preview

Financial report 2014
FIN
AN
CIA
L R
EP
OR
T 2
014

Thema 1
Annual report 2014
AN
NU
AL R
EP
OR
T 2
014
Glo
bal challeng
es
GB14_cover-aussen_v005a_ENG_cmyk.indd 3
25.02.15 09:03
ANDRITZ is a truly global company. This is demonstrated not only by the fact that we have 250 sites in more than 40 countries throughout the world where almost 25,000 employees work every day, but also by our many international projects in which we provide our customers with state-of-the-art technologies and best services. Internationality and global presence also mean dealing with a lot of challenges. These include risks, but also opportunities in connection with the execution of projects, which involve ANDRITZ employees from many countries and numerous local suppliers and which are sometimes exposed to external factors. In the annual report 2014, our aim is to describe the challenges and opportunities that arise from our international presence in order to give you a better picture of the global ANDRITZ GROUP. The annual report and the financial report 2014 are available for download at www.andritz.com or can be requested as printed copies free of charge by sending an e-mail to [email protected].
Global challenges

02 Key financial figures of the ANDRITZ GROUP
Unit 2014 2013 2012* 2011 2010
Order intake MEUR 6,101.0 5,611.0 4,924.4 5,706.9 4,131.9
Order backlog (as of end of period) MEUR 7,510.6 7,388.5 6,614.8 6,683.1 5,290.9
Sales MEUR 5,859.3 5,710.8 5,176.9 4,596.0 3,553.8
Return on sales1) % 5.0 1.6 6.5 6.8 6.9
EBITDA2) MEUR 472.0 255.2 418.6 386.2 307.3
EBITA3) MEUR 379.5 164.1 357.8 331.5 257.6
Earnings Before Interest and Taxes (EBIT) MEUR 295.7 89.8 334.5 312.7 245.5
Earnings Before Taxes (EBT) MEUR 299.4 80.3 330.4 321.7 247.9
Net income (including non-controlling interests) MEUR 210.0 53.2 241.3 231.5 177.0
Net income (without non-controlling interests) MEUR 210.9 66.6 242.7 230.7 179.6
Cash flow from operating activities MEUR 342.1 93.7 346.5 433.8 704.5
Capital expenditure4) MEUR 106.5 111.4 109.1 77.0 68.8
Free cash flow5) MEUR 245.8 -11.5 239.7 361.1 644.9
Free cash flow per share6) EUR 2.4 -0.1 2.3 3.5 6.2
Employees (as of end of period; without apprentices) - 24,853 23,713 17,865 16,750 14,655
Fixed assets MEUR 1,780.0 1,759.0 1,390.8 1,151.8 858.9
Current assets MEUR 4,187.6 3,812.4 3,770.2 3,414.8 3,176.9
Total shareholders’ equity7) MEUR 1,014.8 929.5 1,033.8 938.9 794.4
Provisions MEUR 1,056.2 993.6 725.4 667.3 582.8
Liabilities MEUR 3,896.6 3,648.3 3,401.8 2,960.4 2,658.6
Total assets MEUR 5,967.6 5,571.4 5,161.0 4,566.6 4,035.8
Equity ratio8) % 17.0 16.7 20.0 20.6 19.7
Return on equity9) % 29.5 8.6 32.0 34.3 31.2
Return on investment10) % 5.0 1.6 6.5 6.8 6.1
Liquid funds11) MEUR 1,701.6 1,517.0 2,047.8 1,814.5 1,594.7
Net liquidity12) MEUR 1,065.1 893.1 1,285.7 1,400.6 1,177.0
Net debt13) MEUR -659.4 -585.0 -1,053.3 -1,198.4 -992.0
Net working capital14) MEUR -570.9 -539.4 -631.8 -639.2 -556.1
Capital employed15) MEUR 387.0 443.6 -36.5 -128.6 -86.0
Gearing16) % -65.0 -62.9 -101.9 -127.6 -124.9
EBITDA margin % 8.1 4.5 8.1 8.4 8.6
EBITA margin % 6.5 2.9 6.9 7.2 7.2
EBIT margin % 5.0 1.6 6.5 6.8 6.9
Net income/sales % 3.6 0.9 4.7 5.0 5.0
ROE17) % 20.7 5.7 23.3 24.7 22.3
EV18)/EBITDA - 7.8 15.1 9.0 5.0 7.8
Depreciation and amortization/sales % 2.9 2.8 1.6 1.6 1.7
* Adjusted to comply with IAS 19 and IFRS 3
1) EBIT (Earnings Before Interest and Taxes)/sales 2) Earnings Before Interest, Taxes, Depreciation, and Amortization 3) Earnings Before
Interest, Taxes, Amortization of identifiable assets acquired in a business combination and recognized separately from goodwill at the amount of
78,038 TEUR (2013: 70,529 TEUR), and impairment of goodwill at the amount of 5,747 TEUR (2013: 3,800 TEUR) 4) Additions to intangible
assets and property, plant and equipment 5) Cash flow from operating activities minus capital expenditure plus payments from the sale of
intangible assets and property, plant and equipment 6) Free cash flow/total number of shares 7) Total shareholders’ equity including non-
controlling interests 8) Shareholders’ equity/total assets 9) EBT (Earnings Before Taxes)/shareholders’ equity 10) EBIT (Earnings Before
Interest and Taxes)/total assets 11) Cash and cash equivalents plus marketable securities plus loans against borrowers’ notes 12) Liquid
funds plus fair value of interest rate swaps minus financial liabilities 13) Interest bearing liabilities including provisions for severance payments,
pensions, and jubilee payments minus cash and cash equivalents, marketable securities and loans against borrowers’ notes 14) Non-current
receivables plus current assets (excluding marketable securities, cash and cash equivalents as well as loans against borrowers’ notes) minus
other non-current liabilities and current liabilities (excluding financial liabilities and provisions) 15) Net working capital plus intangible assets
and property, plant and equipment 16) Net debt/total shareholders’ equity 17) ROE (Return On Equity): net income/total shareholders’
equity 18) EV (Enterprise Value): market capitalization as of end of year minus net liquidity
All figures according to IFRS. Due to the utilization of automatic calculation programs, differences can arise in the addition of rounded totals and
percentages. MEUR = million euros, TEUR = thousand euros.
The Schuler Group was consolidated into the consolidated financial statements of the ANDRITZ GROUP as of March 1, 2013. No pro forma
figures are available for the reference periods of the previous years.
KEY FINANCIAL FIGURESOF THE ANDRITZ GROUP

03 Key financial figures of the business areas
HYDRO Unit 2014 2013 2012 2011 2010
Order intake MEUR 1,816.7 1,865.4 2,008.4 2,096.2 1,870.1
Order backlog (as of end of period) MEUR 3,708.6 3,722.4 3,842.3 3,671.4 3,376.0
Sales MEUR 1,752.3 1,804.8 1,836.8 1,772.9 1,579.2
EBITDA MEUR 177.2 176.8 182.4 174.3 139.9
EBITDA margin % 10.1 9.8 9.9 9.8 8.9
EBITA MEUR 144.8 146.9 153.2 147.7 118.0
EBITA margin % 8.3 8.1 8.3 8.3 7.5
Capital expenditure MEUR 39.4 44.5 56.7 44.3 41.5
Employees (as of end of period; without apprentices) - 8,339 7,445 7,469 7,285 6,530
PULP & PAPER Unit 2014 2013 2012 2011 2010
Order intake MEUR 1,995.7 1,907.7 1,962.4 2,694.1 1,415.5
Order backlog (as of end of period) MEUR 1,875.4 1,885.6 2,018.1 2,230.0 1,107.3
Sales MEUR 1,969.3 2,005.3 2,282.2 1,884.9 1,129.8
EBITDA MEUR 127.6 -11.5 156.2 138.1 99.9
EBITDA margin % 6.5 -0.6 6.8 7.3 8.8
EBITA MEUR 102.9 -35.7 134.6 120.4 82.2
EBITA margin % 5.2 -1.8 5.9 6.4 7.3
Capital expenditure MEUR 28.1 26.0 36.4 22.5 18.4
Employees (as of end of period; without apprentices) - 7,236 7,136 6,774 6,208 5,046
METALS Unit 2014 2013 2012 2011 2010
Order intake MEUR 1,692.8 1,233.8 324.2 318.6 302.7
Order backlog (as of end of period) MEUR 1,566.1 1,427.6 451.4 465.1 521.0
Sales MEUR 1,550.4 1,311.0 404.7 372.7 340.2
EBITDA MEUR 134.0 76.6 28.0 21.5 21.2
EBITDA margin % 8.6 5.8 6.9 5.8 6.2
EBITA MEUR 110.2 53.5 25.1 19.4 18.4
EBITA margin % 7.1 4.1 6.2 5.2 5.4
Capital expenditure MEUR 27.9 32.7 2.6 1.8 1.9
Employees (as of end of period; without apprentices) - 6,432 6,300 1,129 945 937
The Schuler Group was consolidated into the consolidated financial statements of the ANDRITZ GROUP as of March 1, 2013 and is allocated to
the METALS business area. No pro forma figures are available for the reference periods of the previous years.
SEPARATION Unit 2014 2013 2012 2011 2010
Order intake MEUR 595.8 604.1 629.4 598.0 543.6
Order backlog (as of end of period) MEUR 360.5 352.9 303.0 316.6 286.6
Sales MEUR 587.3 589.7 653.2 565.5 504.6
EBITDA MEUR 33.2 13.3 52.0 52.3 46.3
EBITDA margin % 5.7 2.3 8.0 9.2 9.2
EBITA MEUR 21.6 -0.6 44.9 44.0 39.0
EBITA margin % 3.7 -0.1 6.9 7.8 7.7
Capital expenditure MEUR 11.1 8.2 13.4 8.4 5.5
Employees (as of end of period; without apprentices) - 2,846 2,832 2,493 2,312 2,143
KEY FINANCIAL FIGURESOF THE BUSINESS AREAS

04 Profile, strategy, and vision
Company profile: worldwide presence
ANDRITZ is a globally leading supplier of plants, equipment, and services for hydropower stations, the pulp and paper industry, the metalworking and steel industries, and for solid/liquid separation in the municipal and indus-
trial sectors. The publicly listed technology Group is headquartered in Graz, Austria, and has a staff of almost
25,000 employees. ANDRITZ operates over 250 sites worldwide.
Strategy: global market leadership
1. Extend position in Europe and North America, make use of opportunities in South America and Asia All four ANDRITZ business areas serve markets with long-term and sustained growth potential. Within these
markets, the Group focuses on rapidly growing segments, for example the supply of plants and equipment to
generate renewable energy from hydropower or biomass. In terms of global regions, this means that the ANDRITZ GROUP is extending its existing position in Europe and North America and making use of the growth
and sales opportunities in the emerging markets of South America and Asia.
2. Global and local customer proximity
The ANDRITZ GROUP is globally present. Customers benefit from this network through the global ANDRITZ
know-how on the one hand and the local proximity of ANDRITZ on the other hand. Based on this mixture of global and local customer proximity, the Group supports its customers in achieving their goals in terms of
productivity, profitability, and sustainability.
3. Technological and cost leadership
ANDRITZ relies on technological and cost leadership in order to safeguard its market position and make use of
opportunities for growth. As part of its organic expansion, ANDRITZ invests an average of 3% of its annual sales in research and development in order to be the preferred supplier in terms of technology and costs. The main
priority is to develop customized technologies that enhance the productivity of customers’ plants, minimize
operating costs, and maximize energy efficiency and environmental protection. In addition, ANDRITZ is constantly seeking to improve internal cost structures through operational and organizational measures. These
include regional and logistical optimization of manufacturing capacities, pooling of procurement activities, as well
as cost discipline both in operating units and central functions across the Group. ANDRITZ also aims to con-tinue its growth externally and is looking for companies that complement the existing product and service port-
folio. The goal is to be a single-source supplier with full-line capabilities in all business areas.
Vision: market leadership in sustainable technologies
The ANDRITZ GROUP has the goal of achieving market leadership in all of the markets it serves and of
strengthening and extending its current top position on the market. At the same time, the Group aims to contin-ue its long-term, profitable growth. ANDRITZ intends to achieve this goal by offering the best technologies avail-
able on the market and providing products and services that create sustained economic, social, and ecological
benefits for customers, for society, and for the environment.
Long-term profitability
The ANDRITZ GROUP has been pursuing a strategy of long-term, profitable growth for many years. Organic growth, complementary acquisitions, and a solid balance sheet structure are the fundamental cornerstones to
reach the financial targets set. ANDRITZ has been able to increase its sales by an annual average of about 14%
since 2000 and step-by-step its profitability (EBITA margin) at the same time. Whereas the EBITA margin aver-aged 5.3% from 2000 to 2004, it rose to 6.0% between 2005 and 2009. The goal set in 2010 of increasing the
EBITA margin to 7% was achieved in 2010, 2011, and 2012. However, due to provisions and expenses for cost
overruns in connection with deliveries for a pulp mill in South America, there was a significant decline in profita-bility in 2013. In 2014, a significant improvement in earnings and profitability was achieved. The medium-term
goal for the coming years is to increase the EBITA margin towards 7 to 8% in step with the planned sales growth.
PROFILE, STRATEGY, AND VISION

05 Business areas: profile and market development 2014
ANDRITZ HYDRO
ANDRITZ HYDRO is one of the leading global suppliers of electromechanical equipment for hydropower plants. With over 170 years of accumulated experience and more than 30,000 turbines installed, totaling approximately
420,000 megawatts output, the business area supplies the complete product range, including turbines, genera-
tors, and additional equipment of all types and sizes – “from water to wire” for small hydro applications up to large hydropower plants with outputs of more than 800 megawatts per turbine unit. ANDRITZ HYDRO is also
well positioned in the growing modernization, refurbishment, and upgrade market for existing hydropower plants.
Pumps (for water transport, irrigation of agricultural land, and applications in various industries) and turbogener-ators for thermal power plants are also allocated to the business area.
Market development 2014 Global project activity for electromechanical equipment for hydropower plants was satisfactory in 2014 and
practically unchanged compared to the previous year, but still substantially below the peak level in 2011. In
Europe, in particular, some larger modernization and rehabilitation projects were postponed temporarily or stopped due to the continuing low propensity to invest. In the emerging markets, especially in South America
and Africa, there were some new hydropower projects currently being implemented or in the planning phase.
Project activity for small-scale hydropower plants and for pumps was solid.
ANDRITZ PULP & PAPER
The business area is a leading global supplier of equipment, systems, and services for the production and pro-cessing of all types of pulps, paper, tissue, and cardboard. The technologies cover the processing of logs, an-
nual fibers, and waste paper; the production of chemical pulp, mechanical pulp, and recycled fibers; the
recovery and reuse of chemicals; the preparation of paper machine furnish; the production of paper, tissue, and board; the calendering and coating of paper; as well as treatment of reject materials and sludge. The service
range includes modernization, rebuilds, spare and wear parts, service and maintenance, as well as machine
transfer and second-hand equipment. Biomass, steam, and recovery boilers, as well as gasification plants for power generation, flue gas cleaning plants, production equipment for biofuel (second generation), biomass
torrefaction equipment, plants for the production of nonwovens, dissolving pulp, plastic films, and panelboards
(MDF), and recycling plants are also allocated to the business area.
Market development 2014
The international pulp market saw satisfactory development in 2014. Continuing good demand, mainly from international tissue and packaging paper producers, and stable supply, led to a price increase in long-fiber pulp
(northern bleached softwood kraft) from around 860 US dollars at the beginning of January to approximately
930 US dollars per ton by the end of 2014. The price of short-fiber pulp (eucalyptus) decreased from around 780 US dollars at the beginning of January to about 740 US dollars per ton at the end of 2014. The reasons for
this were the subdued demand from Chinese paper producers and the increasing pulp supply from new pulp
mills that started up production in 2014. The market for pulp mill equipment developed well. A number of larger modernization orders were awarded and the investment and project activity for new pulp mills was satisfactory.
However, the competitive environment for pulp equipment suppliers continued to be challenging, with high price
pressure particularly on large projects.
BUSINESS AREAS: PROFILE AND MARKET DEVELOPMENT 2014

06 Business areas: profile and market development 2014
ANDRITZ METALS
The business area is technology and global market leader in metalforming via the Schuler Group, in which ANDRITZ has a stake of more than 95%. Schuler offers presses, automation solutions, dies, process know-how,
and services for the entire metalworking industry. Its customers include car manufacturers and their suppliers, as
well as companies in the forging, household equipment, packaging, energy, and electrical industries. Schuler is also the market leader in coin minting technology and offers system solutions for the aerospace and railway
industries. In addition, ANDRITZ METALS is one of the leading global suppliers of complete lines for the produc-
tion and processing of cold-rolled strip made of stainless steel, carbon steel, aluminum, and non-ferrous metal. The lines comprise equipment for cold rolling, heat treatment, surface finishing, strip coating and finishing,
punching and deep drawing, and for the regeneration of pickling acids. The business area also supplies turnkey
furnace systems for the steel, copper, and aluminum industries, as well as welding systems for the metalworking industry.
Market development 2014 International project activity in the metalforming sector, especially for the automotive and automotive supplying
industries, was good during the reporting period. While investment activity in Europe remained at a satisfactory
level, several large orders were awarded by international car manufacturers and their suppliers, particularly in China. As a result of the continuing overcapacities in the international steel and stainless steel industries as well
as the weak demand due to the overall economic situation, project activity for plants and equipment for the
production and processing of stainless steel, carbon steel, and non-ferrous metal strip continued to be low. However, good investment activity was noted in the aluminum industry.
ANDRITZ SEPARATION The business area is one of the leading global suppliers of technologies and services in the solid/liquid separa-
tion sector, as well as for the production of animal feed and biomass pellets. The comprehensive product portfo-
lio for solid/liquid separation comprises centrifuges, filters and drying plants, screens, thickeners, separators, and transportation systems. The industries served include municipal and industrial wastewater treatment, chem-
icals, food and beverages, as well as mining and minerals. The service sector focuses on plant modernization,
spare and wears parts, and process optimization.
Market development 2014
Investment and project activity for solid/liquid separation equipment saw mixed development in the industries served by ANDRITZ during 2014. While demand in the municipal/industrial waste water treatment sector as well
as in the food and chemical industries was solid, investment activity in the mining industry continued to be low.
Project activity in the animal feed industry was good – both for mill expansion projects and new greenfield plants. The biomass pelleting segment noted solid project activity.

07 The ANDRITZ share
Relative share price performance of the ANDRITZ share versus the ATX since the IPO
Key figures of the ANDRITZ share Unit 2014 2013 2012 2011 2010
Earnings per share EUR 2.04 0.64 2.35 2.25 1.74
Dividend per share EUR 1.00¹ 0.50 1.20 1.10 0.85
Payout ratio % 49.0 78.1 51.1 49.0 48.9
Price-earnings-ratio (based on closing price at end of
year) 22.40 71.23 20.66 14.24 19.77
Equity attributable to shareholders per share EUR 9.63 8.70 9.76 8.75 7.34
Highest closing price EUR 47.58 54.94 50.00 37.75 34.46
Lowest closing price EUR 37.00 37.93 32.83 27.41 19.75
Closing price at end of year EUR 45.69 45.59 48.54 32.05 34.40
Market capitalization (as of end of period) MEUR 4,751.8 4,741.4 5,048.2 3,333.2 3,577.1
Performance % 0.0 -9.4 +47.9 -7.6 +67.8
ATX weighting (as of end of period) % 11.6479 9.5082 10.6128 9.2705 7.3211
Average daily number of shares traded² Share unit 305,027 316,787 345,754 568,138 461,546
Source: Vienna Stock Exchange 1) Proposal to the Annual General Meeting 2) Double count, as published by the Vienna Stock Exchange
Basic data of the ANDRITZ share
ISIN code AT0000730007
First listing day June 25, 2001
Types of shares No-par value shares, bearer shares
Total number of shares 104 million
Authorized capital none
Free float < 75%
Stock exchange Vienna (Prime Market)
Ticker symbols Reuters: ANDR.VI; Bloomberg: ANDR, AV
Stock exchange indices ATX, ATX five, ATX Global Players, ATX Prime, WBI
Financial calendar 2015
March 15 Results for the business year 2014
March 26 Annual General Meeting
March 31 Ex-dividend
April 2 Dividend payment
May 6 Results for the first quarter of 2015
August 7 Results for the first half of 2015
November 6 Results for the first three quarters of 2015
The financial calendar with updates, as well as information on the ANDRITZ share, can be found on the Investor Relations page at the ANDRITZ web site: www.andritz.com/share.
100%
500%
900%
1,300%
1,700%
2,100%
June 2001 2002 2003 2004 2005 2006 2007 2008 2009 2010 2011 2012 2013 2014
ANDRITZ
ATX
THE ANDRITZ SHARE

Management report 09
Corporate Governance report 27
Report of the Supervisory Board 35
Consolidated financial statements 2014 of the ANDRITZ GROUP 36 Consolidated income statement 37
Consolidated statement of comprehensive income 38
Consolidated statement of financial position 39
Consolidated statement of cash flows 40
Consolidated statement of changes in equity 41
Notes to the consolidated financial statements 42
Statement by the Executive Board,
pursuant to article 82 (4) of the (Austrian) Stock Exchange Act 110
Auditor’s report – consolidated financial statements 111

09 Management report
GENERAL ECONOMIC CONDITIONS The global economy showed a mixed development in the most important regions of the world in 2014. While the economy in the USA was very robust, Europe and most of the emerging countries in Asia and especially in
South America were impacted by the sustained weak economic environment.
In the USA, there was a noticeable increase in economic activity in the course of the year. Especially private
consumption, which is the main contributor to GDP growth in the USA, saw very positive development. The
unemployment rate continued to fall, reaching a level of around 6% at the end of the year. At the end of October, the US Federal Reserve (FED) stopped its bond-buying program completely and announced that the key interest
rate will remain at its historically low level close to zero until further notice.
In Europe, the economy remained very subdued during the reporting period. Forecasts of GDP growth were
constantly revised downwards by economic research institutes in the course of the year. The main reason for
this was the weak economic development of the two largest national economies in the euro zone, Germany and France. The two-way trade embargo between the European Union and Russia is also having a negative influ-
ence on the economy and has caused a significant decline in sales in many industries. Against this backdrop,
the European Central Bank (ECB) lowered the key interest rate in the euro zone to the new record low of 0.05% and decided to buy up so-called asset-backed securities (ABS) in order to provide the market with additional
liquidity and stimulate the economy in the euro zone.
Most of the emerging markets also only saw very slow economic development in 2014. With the exception of
China, where stable GDP growth of slightly more than 7% was achieved, most of the emerging countries noticed
only minimal and, in some cases, even negative economic growth.
Source: Research reports by various banks, OECD
BUSINESS DEVELOPMENT Notes All figures according to IFRS
Due to the utilization of automatic calculation programs, differences can arise in the addition of rounded totals
and percentages MEUR = million euros; TEUR = thousand euros
The Schuler Group was consolidated into the consolidated financial statements of the ANDRITZ GROUP as
of March 1, 2013 and is allocated to the METALS business area
Change in the scope of consolidated financial statements
Information on the scope of consolidated financial statements can be found in the notes to the consolidated financial statements – chapter D, Scope of consolidated financial statements, and chapter E, Acquisitions.
Sales Sales of the ANDRITZ GROUP amounted to 5,859.3 MEUR in the 2014 business year (+2.6% versus 2013:
5,710.8 MEUR). This slight increase is attributable to the Schuler Group, which contributed 1,178.4 MEUR
(2013: 966.6 MEUR) to sales and was included in the 2013 financial figures for 10 months only (first-time con-solidation of Schuler: March 1, 2013). Excluding Schuler, the Group’s sales would have decreased slightly by
1.3%. This is mainly due to lower project-related sales generation in the HYDRO business area. The business
areas’ development in detail: 2014 (MEUR) 2013 (MEUR) +/- (%)
HYDRO 1,752.3 1,804.8 -2.9%
PULP & PAPER 1,969.3 2,005.3 -1.8%
METALS 1,550.4 1,311.0 +18.3%
SEPARATION 587.3 589.7 -0.4%
MANAGEMENT REPORT

10 Management report
Share of service sales of Group and business area sales in % 2014 2013
ANDRITZ GROUP 29 28
HYDRO 26 25
PULP & PAPER 35 36
METALS 18 17
SEPARATION 43 39
Order intake
In 2014, the order intake of the Group increased to 6,101.0 MEUR, thus up by 8.7% compared to the previous year (2013: 5,611.0 MEUR). The Schuler Group contributed 1,193.7 MEUR (2013: 868.4 MEUR); excluding
Schuler, the order intake would have increased by 3.5%. The business areas’ development in detail:
HYDRO: At 1,816.7 MEUR, the order intake was slightly below the level of the previous year (-2.6% versus 2013: 1,865.4 MEUR).
PULP & PAPER: The order intake developed very satisfactory and increased to 1,995.7 MEUR (+4.6% versus
2013: 1,907.7 MEUR). This is mainly due to the order received from Klabin to supply major equipment for a new pulp mill in Brazil.
METALS: Compared to the previous year's reference period, the order intake increased by 37.2% to
1,692.8 MEUR (2013: 1,233.8 MEUR), which was largely attributable to the favorable development in the metalforming sector (Schuler) and the aluminum processing equipment sector.
SEPARATION: At 595.8 MEUR, the order intake reached practically the level of the previous year (-1.4%
versus 2013: 604.1 MEUR).
41 (43)
16 (16)
15 (13)
13 (13)
11 (11)
4 (4)
Europe
North America
South America
China
Asia (without China)
Others
Sales by region 2014(2013) in %
30 (32)
34 (35)
26 (23)
10 (10)
HYDRO
PULP & PAPER
METALS
SEPARATION
Sales by businessarea 2014(2013) in %
37 (41)
18 (18)
14 (12)
12 (14)
12 (11)
7 (4)
Europe
North America
South America
Asia (without China)
China
Others
Order intakeby region
2014 (2013) in %
30 (33)
32 (34)
28 (22)
10 (11)
HYDRO
PULP & PAPER
METALS
SEPARATION
Order intake bybusiness area
2014 (2013) in %

11 Management report
Order backlog
As of December 31, 2014, the order backlog of the ANDRITZ GROUP amounted to 7,510.6 MEUR, which is an increase of 1.7% compared to the end of last year (December 31, 2013: 7,388.5 MEUR). The Schuler Group
contributed 1,057.9 MEUR to the order backlog (2013: 1,040.4 MEUR).
Earnings The EBITA of the Group amounted to 379.5 MEUR (+131.3% versus 2013: 164.1 MEUR) and the EBITA margin
increased to 6.5% (2013: 2.9%). Earnings were thus considerably higher compared to the very low reference
figure of last year, which was negatively impacted by additional costs in the PULP & PAPER business area (for a pulp mill project in South America), METALS business area (restructuring of the Schuler Group to continue the
growth and strategy project initiated in 2011 for integration of Müller-Weingarten), and SEPARATION business
area (market launch of a new product series and restructuring measures). The EBITA of the METALS business area was positively impacted by the release of the remainder of the provisions made for restructuring in 2013.
Consolidated income statement
(in MEUR) 2014 2013 +/-
Sales 5,859.3 5,710.8 +2.6%
Changes in inventories of finished goods, work in
progress and capitalized cost of self-constructed assets 3.1 2.2 +40.9%
Other operating income 122.1 120.8 +1.1%
Cost of materials -3,155.0 -3,232.4 -2.4%
Personnel expenses -1,574.0 -1,518.2 +3.7%
Other operating expenses -783.6 -828.0 -5.4%
EBITDA 471.9 255.2 +84.9%
Depreciation, amortization and impairment of intangible
assets and property, plant, and equipment -170.5 -161.6 +5.5%
Impairment of goodwill -5.7 -3.8 +50.0%
EBIT 295.7 89.8 +229.3%
Financial result 3.7 -9.5 +138.9%
EBT 299.4 80.3 +272.9%
Income taxes -89.4 -27.1 +229.9%
NET INCOME 210.0 53.2 +294.7%
Thereof attributable to:
Shareholders of the parent 210.9 66.6 +216.7%
Non-controlling interests -0.9 -13.4 +93.3%
Basic earnings per no-par value share (in EUR) 2.04 0.64 +218.8%
33 (36)
18 (17)16 (15)
15 (16)
10 (11)
8 (5)
Europe
Asia (without China)
North America
South America
China
Others
Order backlog byregion as of
December 31, 2014(December 31, 2013)
in %
49 (50)
25 (26)
21 (19)
5 (5)
HYDRO
PULP & PAPER
METALS
SEPARATION
Order backlog bybusiness area as ofDecember 31, 2014
(December 31, 2013)in %

12 Management report
Allocation of expenses 2014 (2013) in %
54.5% of total operating expenses were attributable to material expenses in 2014 (2013: 57.3%), thus the mate-
rial expenses to sales ratio amounted to 53.8% (2013: 56.6%). The material expenses to sales ratio was signifi-cantly below the previous year’s reference period, which was impacted by several additional costs as mentioned
in section “Earnings”. The share of personnel expenses showed a stable development compared to the previous
year’s reference period and amounted to 27.7% (2013: 26.4%), thus the personnel expenses to sales ratio amounted to 26.9% (2013: 26.6%).
Other operating expenses amounted to 783.6 MEUR (2013: 828.0 MEUR) and mainly include sales expenses (travel expenses and fees), rents and leases as well as repairs and maintenance. Other operating income
amounted to 122.1 MEUR and thus practically reached the level of the previous year (2013: 120.8 MEUR), and
mainly include exchange rate gains from valuation of open forward contracts, government grants, and rental income.
The depreciation and amortization of intangible assets and of property, plant, and equipment amounted to 170.5 MEUR in 2014 (2013: 161.6 MEUR). The slight increase is mainly due to the fact that Schuler was only
included in last year’s income statement for only ten months.
In 2014, the Group’s goodwill impairment amounted to 5.7 MEUR (2013: 3.8 MEUR), and the impairment charg-
es for intangible and tangible assets were 6.4 MEUR (2013: 7.1 MEUR). The goodwill impairment relates to
companies of the HYDRO (4.3 MEUR) and the METALS business areas (1.4 MEUR) where the business did not develop according to plan. In addition, impairment of pilot plants was recorded.
The financial result improved significantly to 3.7 MEUR (2013: -9.5 MEUR). This positive development is mainly due to the higher average net liquidity compared to the previous year’s reference period.
The tax rate decreased to 29.9% (2013: 33.7%). This decrease is mainly due to higher tax credits from prior periods as well as tax incentives and tax-free income (see also notes to the consolidated financial statements,
chapter H, 8. Income taxes).
The net income of the Group amounted to 210.0 MEUR (+294.7% versus 2013: 53.2 MEUR), 210.9 MEUR of
which are attributable to the shareholders of the parent company and -0.9 MEUR to non-controlling interests.
The earnings per share increased to 2.04 EUR (2013: 0.64 EUR). At the Annual General Meeting on March 26,
2015, the Executive Board will propose an increase of dividend to 1.00 EUR (2013: 0.50 EUR) per share for the
2014 business year. This is equal to a payout ratio of around 49.0% (2013: around 78.1%).
55 (57)
28 (26)
14 (14)
3 (3)
Cost of materials
Personnel expenses
Other operating expenses
Depreciation
Distribution of totalexpenses

13 Management report
Earnings and dividend per share/payout ratio
Net worth position and capital structure
The net worth position and capital structure as of December 31, 2014 remained solid. Total assets amounted to
5,967.6 MEUR (December 31, 2013: 5,571.4 MEUR). The equity ratio reached 17.0% (December 31, 2013: 16.7%).
Liquid funds (cash and cash equivalents plus marketable securities plus loans against borrowers’ notes) amounted to 1,701.6 MEUR as of December 31, 2014 (December 31, 2013: 1,517.0 MEUR), net liquidity (liquid
funds plus fair value of interest rate swaps minus financial liabilities) amounted to 1,065.1 MEUR (Decem-
ber 31, 2013: 893.1 MEUR).
In addition to the high net liquidity, the ANDRITZ GROUP also had the following credit and surety lines for per-
formance of contracts, down payments, guarantees, and so on, at its disposal: Credit lines: 325 MEUR, thereof 122 MEUR utilized
Surety lines: 5,857 MEUR, thereof 3,231 MEUR utilized
On the asset side, property, plant and equipment (715.3 MEUR), goodwill (538.5 MEUR), and intangible assets
(242.6 MEUR) were the most important items in non-current assets (1,979.8 MEUR). The most important items
in the other current assets, amounting to 2,376.2 MEUR, were trade accounts receivable, including cost and earnings of projects under construction in excess of billings (1,182.4 MEUR) booked according to the percent-
age-of-completion method, and inventories (693.2 MEUR).
On the liabilities side, the other current liabilities (3,549.4 MEUR) mainly include advance payments received and
billings in excess of cost and earnings of projects under construction booked according to the percentage-of-
completion method (1,454.9 MEUR), provisions (507.4 MEUR), and trade accounts payable (493.4 MEUR). The most important items in other liabilities (1,047.2 MEUR) were outstanding invoices for order-related costs
Earnings per share (EUR)
Dividend per share (EUR)
Payout ratio
2010 2011 2012 2013 2014
1.74
2.252.35
0.64
2.04
0.85
1.101.20
0.50
1.00
48.9% 49.0%
51.1%
78.1%
49.0%
Long-termassets: 33%
Short-termassets: 40%
Cash and cash equivalentsand marketable securities: 27%
Shareholders’equity incl. minorityinterests: 17%
Financialliabilities: 11%
Otherlong-termliabilities: 13%
Other short-termliabilities: 59%
1,014.8MEUR
657.0MEUR
746.4MEUR
3,549.4MEUR
1,979.8MEUR
2,376.2MEUR
1,611.6MEUR
Assets
Shareholders’ equity and liabilities

14 Management report
(588.1 MEUR), as well as unused vacation and other personnel-related accruals (213.3 MEUR). Non-current
liabilities, at 746.4 MEUR, largely contained provisions (548.8 MEUR) and deferred tax liabilities (137.7 MEUR).
Further information on provisions is shown in the notes to the consolidated financial statements – chapter J,
Notes to the consolidated statement of financial position.
Capex and cash flow
Investments in tangible and intangible assets amounted to 106.5 MEUR in 2014 and focused mainly on work-shop modernizations as well as the construction and/or purchase of office buildings (2013: 111.4 MEUR).
The cash flow from operating activities, at 342.1 MEUR, was significantly above the previous year’s reference figure (2013: 93.7 MEUR). This was primarily attributable to the 219.1 MEUR increase in Earnings Before Taxes
(EBT).
The cash flow from investing activities amounted to -85.3 MEUR (2013: 83.0 MEUR).
The cash flow from financing activities amounted to -50.9 MEUR (2013: -390.2 MEUR). The significant change mainly resulted from the redemption of a corporate bond in 2013.
Further important key figures at a glance
Unit 2014 2013 2012* 2011 2010
Return on sales1) % 5.0 1.6 6.5 6.8 6.9
EBITDA2) MEUR 472.0 255.2 418.6 386.2 307.3
Earnings Before Interest and Taxes
(EBIT) MEUR 295.7 89.8 334.5 312.7 245.5
Earnings Before Taxes (EBT) MEUR 299.4 80.3 330.4 321.7 247.9
Net income (including non-controlling
interests) MEUR 210.0 53.2 241.3 231.5 177.0
Free cash flow3) MEUR 245.8 -11.5 239.7 361.1 644.9
Free cash flow per share4) EUR 2.4 -0.1 2.3 3.5 6.2
Return on equity5) % 29.5 8.6 32.0 34.3 31.2
Return on investment6) % 5.0 1.6 6.5 6.8 6.1
Net debt7) MEUR -659.4 -585.0 -1,053.3 -1,198.4 -992.0
Net working capital8) MEUR -570.9 -539.4 -631.8 -639.2 -556.1
Capital employed9) MEUR 387.0 443.6 -36.5 -128.6 -86.0
Gearing10) % -65.0 -62.9 -101.9 -127.6 -124.9
* Adjusted to comply with IAS 19 and IFRS 3
1) EBIT (Earnings Before Interest and Taxes)/sales 2) Earnings Before Interest, Taxes, Depreciation, and Amortization 3) Cash flow from
operating activities minus capital expenditure plus payments from the sale of intangible assets and property, plant and equipment 4) Free cash
flow/total number of shares 5) EBT (Earnings Before Taxes)/total shareholders’ equity 6) EBIT (Earnings Before Interest and Taxes)/total
assets 7) Interest bearing liabilities including provisions for severance payments, pensions, and jubilee payments minus cash and cash
equivalents, marketable securities and loans against borrowers’ notes 8) Non-current receivables plus current assets (excluding marketable
securities, cash and cash equivalents as well as loans against borrowers’ notes) minus other non-current liabilities and current liabilities
(excluding financial liabilities and provisions) 9) Net working capital plus intangible assets and property, plant and equipment 10) Net
debt/total shareholders’ equity
Important acquisitions ANDRITZ acquired the metal processing company Herr-Voss Stamco Inc., USA, during the reporting period and
has thus enlarged its service and product offerings for North American customers in the metals sector. ANDRITZ
Herr-Voss Stamco is one of the leading suppliers of coil and sheet metal processing solutions for both ferrous and non-ferrous applications worldwide and has a comprehensive service portfolio for the metal processing
industry.

15 Management report
RISK MANAGEMENT AND CORPORATE RISKS The ANDRITZ GROUP is a globally-operating company serving a variety of industrial markets and customers. As such, the Group is subject to certain general and industry-specific risks. ANDRITZ has a Group-wide control and
steering system whose main task is to identify nascent risks at an early stage and – if possible – to take coun-
termeasures.
Main characteristics of the internal controlling and risk management system for the accounting
process The Executive Board is responsible for implementing a suitable internal controlling and risk management system
for the accounting process and financial reporting. For this purpose, binding Group-wide regulations and guide-
lines/policies have been implemented for the major business risks and also for the financial reporting process.
The accounting department, which includes financial accounting, reports directly to the Executive Board.
Organizational measures have been made to ensure that the legal requirements to make complete, correct, timely, and orderly entries in the books and other records are met. The entire process from procurement to
payment is subject to guidelines/policies that are intended to minimize any essential risks these processes may
entail. These measures and rules include separation of functions, signature authorization matrices, and signatory powers for authorizing payments applying on a collective basis only and restricted to a small number of employ-
ees, as well as system-supported checks by the financial software in use (SAP).
By using a standardized, Group-wide financial reporting system, together with instant occasion-driven reporting
on major events, the Group endeavors to ensure that the Executive Board is properly informed on all relevant
issues. The Supervisory Board is informed in Supervisory Board meetings held at least once every quarter on the current business development, including operative planning and the medium-term strategy of the Group,
with direct and immediate information being provided to the Supervisory Board in special cases. In addition, the
Chairman of the Supervisory Board receives a monthly report including the key financial figures with comments. Internal control and risk management are among the topics dealt with in audit committee meetings.
Internal Auditing, set up as a executive department, audits individual processes or Group companies according to an audit plan defined for each year, and also in special cases.
Financial risks ANDRITZ has a Group-wide risk management system whose goal is to identify nascent risks and to implement
countermeasures. This is an important element in the active corporate management.
Monitoring and management of financial risks are integral parts of the accounting and controlling activities within
the ANDRITZ GROUP. Continuous controlling and regular reporting are intended to increase the likelihood of
identifying major risks at an early stage and allow countermeasures to be implemented if necessary. Still, there is no guarantee that the monitoring and risk control systems are sufficiently effective.
The essential risks for the business development of the ANDRITZ GROUP relate above all to the Group’s de-pendence on the general economic environment and the development of the industries it serves, to whether
major orders are received and to the risks they entail; and to whether adequate sales proceeds are realized from
the high order backlog. Furthermore, unexpected cost increases during the execution of orders constitute a considerable risk, particularly in so-called turnkey or EPC orders, where the Group may assume responsibility for
engineering, civil work, and erection of a factory in addition to delivery of ANDRITZ equipment and systems.
Please see “Risks related to major orders and other contracts” below.
The financial difficulties and the continuing, challenging overall economic development (particularly in Europe
and individual emerging markets) also constitute a serious risk for the ANDRITZ GROUP’s financial development. In addition, the two-way trade embargo between the European Union and Russia constitutes a risk for the eco-
nomic development of both of these economic regions. A significant economic weakness may lead to delays in
the execution of existing orders and to the postponement or cancellation of existing projects. Cancellations of existing contracts could adversely affect the ANDRITZ GROUP’s order backlog, which in turn would have a
negative impact on the utilization of the Group’s manufacturing capacities.
Complete or partial goodwill impairments resulting from acquisitions may also negatively influence the earnings
development of the ANDRITZ GROUP if the targeted financial goals for these companies cannot be reached. In
addition, there is always some risk that partial or full impairment will have to be made for some trade accounts receivable.

16 Management report
For the majority of orders, the risk of payment failure by customers is mitigated by means of bank guarantees
and export insurance. However, there is no guarantee that there will not be any individual payment failures that will have a substantial negative impact on earnings development of the Group if they occur. Risks related to
deliveries to countries with medium to high political risks are typically also insured to a large extent. However,
the requirements for full hedging of these risks are not always available. Quarterly credit risk reporting to the Executive Board has been implemented in order to ensure transparency with respect to financial risks on pro-
jects and to implement immediate countermeasures if necessary. The reporting shows the maximum expected
unsecured credit risk for external orders with a value of over one million euros, which are billed according to percentage of completion (POC), as well as customer ratings.
ANDRITZ processes orders for the HYDRO business area in Brazil through its subsidiary ANDRITZ HYDRO S.A. (formerly ANDRITZ HYDRO Inepar do Brasil S.A.), in which ANDRITZ holds a majority interest. The minority
shareholder, Inepar S/A Industria e Construcoes (“Inepar”), has entered into a judicial reorganization process.
There is no guarantee that the reorganization process will be successful and that Inepar will not become bank-rupt and liquidated. An Inepar bankruptcy could have a considerable negative financial impact on ANDRITZ,
especially due to claims of joint and several liability. ANDRITZ has substantial tax credits in Brazil from various
transfer taxes. Some of these tax credits were seized as security by the tax authorities for tax liabilities of Inepar and its affiliates on the premise that ANDRITZ HYDRO S.A. is part of the Inepar economic group. ANDRITZ has
also received certain labor claims from employees of Inepar entities claiming that ANDRITZ HYDRO S.A. is jointly
and severally liable for such claims. ANDRITZ is vigorously contesting these labor and tax claims in several labor and tax collection lawsuits in Brazil.
Exchange rate risks in connection with the execution of the order backlog are minimized and controlled by de-rivative financial instruments, in particular by forward exchange contracts and swaps. Net currency exposure of
orders in foreign currencies is hedged by forward contracts.
In order to minimize the financial risks as best possible and to enhance monitoring, control, and assessment of
its financial and liquidity position, the ANDRITZ GROUP implemented both a comprehensive treasury policy and
a transparent information system.
The ANDRITZ GROUP’s position in terms of liquidity is very good, and the Group has high liquidity reserves. The
Group avoids dependence on one single or only a few banks. To ensure independence, no bank will receive more than a certain defined amount of the business in any important product (cash and cash equivalents, finan-
cial liabilities, financial assets, guarantees, and derivatives). With this diversification, ANDRITZ is seeking to
minimize the counterparty risk as best possible. Nevertheless, if one or more banks were to become insolvent, this would have a considerable negative influence on the earnings development and shareholders’ equity of the
ANDRITZ GROUP. In addition, the lowering of ANDRITZ’s credit rating by several banks can limit the financial
leeway available to ANDRITZ, particularly regarding sureties to be issued.
ANDRITZ pursues a risk-averse investment strategy. Cash is largely invested in low-risk financial assets, such as
government bonds, government-guaranteed bonds, money market funds, investment funds to cover pension obligations, loans against borrowers’ notes insured by a certificate of deposit, or term deposits. However, turbu-
lences on the international financial markets may lead to unfavorable price developments for various securities in
which the Group has invested or make them non-tradable. This could have an adverse effect on the ANDRITZ GROUP’s financial result or shareholders’ equity due to necessary depreciation or value adjustments. The crisis
has also heightened the risk of default by some issuers of securities, as well as by customers. The Executive
Board is informed at regular intervals of the extent and volume of current risk exposure in the ANDRITZ GROUP.
Although the risk of the complete or partial breakdown of the euro zone and of a possible collapse of the euro
currency system has diminished in the past few months, but it still cannot be ruled out entirely. In such negative case, a complete or partial breakdown of the euro zone would very probably have a negative effect on the financial,
liquidity, and earnings development of the Group. For further information on risks, please refer to the ANDRITZ
annual financial report 2014.
For further information, see consolidated financial statements – chapter M, risk management.
17 Management report
Impact of exchange rate fluctuations
Fluctuations in exchange rates in connection with execution of the order backlog are hedged as best possible by forward rate contracts. Exchange rate risks resulting from the recognition of equity are not hedged.
The currency devaluations at the beginning of 2014 in many emerging countries, such as Brazil, Argentina, Indonesia, Turkey, and India, as well as the subsequent increase in key interest rates by the respective central
banks could also lead to a significant weakening of the economy in these countries, which may have a negative
impact on the development of sales, earnings, and order intake of the ANDRITZ GROUP. In addition, projects in these countries may be canceled or delayed because currency devaluations have made many projects consid-
erably more expensive for customers and thus substantially reduced their profitability. The weakness of curren-
cies in many emerging countries could negatively impact the consolidated balance sheet as well as sales and earnings development of the ANDRITZ GROUP (translation risk).
Non-financial risks In the manufacturing sector, precise planning, high commitment, and flexibility of employees are essential factors
to ensure short lead times and on-time production. Internally, ANDRITZ uses flextime contracts and a flexible
contingent of temporary workforce to cope with cyclical fluctuations and peaks in workload. Also, the fluctua-tions in capacity utilization that are typical for project-related business can be better balanced with a targeted
make-or-buy strategy and best possible utilization of the company’s own manufacturing capacities. At the same
time, process-relevant key components for ANDRITZ plants and products are mainly manufactured and assem-bled in the Group’s own workshops. Simple components, on the other hand, are largely purchased from quali-
fied suppliers, who are subjected to regular quality and adherence to delivery checks. The ANDRITZ GROUP
tries to balance out fluctuations in capacity utilization as best possible by allocating orders to the various sites around the world and locally by using temporary workforce. However, ANDRITZ cannot exclude the possibility
that it will always be able to compensate immediately for larger fluctuations in capacity utilization, which could in
turn have a negative impact on earnings development of the Group.
In Human Resources, special emphasis was placed on developing and strengthening the necessary staff re-
sources. This includes interesting career opportunities, incentive plans, and focused management training pro-grams. The ANDRITZ GROUP seeks to attract well-trained and highly qualified employees, and also tie them to
the company in the long-term. High quality standards in the selection process guarantee that the most suitable
candidates are recruited for the positions becoming vacant. As part of succession planning, internal candidates for succession to key positions are identified in order to have enough candidates available in the short and
medium term.
Local development programs for special target groups (for example employees working in sales or management
staff in the manufacturing department) were intensified in many of the Group’s companies. The expectation that
many business opportunities for the ANDRITZ GROUP will also emerge in China in the future was taken into account by focusing on management training in Chinese companies. In developing the programs, care is taken
wherever possible to combine these training courses with globally organized personnel development programs.
Several so-called “change projects” were conducted to optimize reorganization measures in individual divisions and business areas. However, ANDRITZ cannot exclude the possibility that it is not able to fill vacant positions
immediately with people who meet the requirements and are qualified for the position concerned.
Risks in connection with the general economic development
Effects of the financial and economic crisis
The weak global economic development constitutes a considerable risk for the future financial development of the ANDRITZ GROUP and could lead to delays in the execution of existing orders and to postponement or
termination of current projects. This may entail a decline in the Group’s order intake. Possible cancellations of
existing orders could have a negative impact on the ANDRITZ GROUP’s order backlog. Both factors may have an adverse effect on the future sales and earnings developments of the Group and also on the Group’s order
backlog.
Risks related to the industries in which the Group operates
Volatility of incoming orders
Some customers and industries served by the ANDRITZ GROUP are directly dependent on general economic development and thus subject to frequent fluctuations in the demand for their products. This is especially true of
the PULP & PAPER and the METALS business areas, but all business areas can be affected. The prices for
equipment and products supplied by ANDRITZ in these segments are, in part, directly dependent on the prevail-ing relationship between supply and demand for the goods produced by such equipment and products of
ANDRITZ. Possible price fluctuations are, therefore, can have a direct influence on each customer’s capital

18 Management report
investment decisions, with subsequent influence on the Group’s order intake. This may lead to some volatility in
the development of the Group’s order intake.
Customer concentration
In many of the industries served by ANDRITZ, there is a trend towards consolidation and mergers. This applies above all to the pulp and paper industry, and also the steel industry. Such consolidation may result in the Group
having to negotiate with fewer companies in the future, which, however, have greater purchasing power. The
dependence on key customers may increase, and this could have direct consequences on the Group’s financial development.
Uncertainty of future contracts Among other things, the Group’s future performance depends on its securing new contracts. It can be difficult to
predict when an order for which the ANDRITZ GROUP has provided a quotation will actually be awarded. Con-
tract awards are often affected by events outside the control of the Group, such as prices, demand, general economic conditions, the granting of governmental approvals, and the securing of project financing. This uncer-
tainty can cause difficulties in matching the Group’s fixed costs and predicted order volume.
Safety and environmental matters
The Group’s operations are subject to numerous local, national, and supranational environmental regulations.
The Group uses and generates hazardous substances in its manufacturing operations. In addition, many of the Group’s current and former properties are, or were, used for industrial purposes, and disposal of waste at dis-
posal sites has been arranged. It is possible that in the future the Group may be subject to liabilities relating to
the investigation and clean-up of contaminated areas. The business areas occasionally assume joint liability for environmental risks in certain projects.
In addition, the ANDRITZ GROUP supplies many systems with products and/or processes that pose the risk of serious or fatal injury (also to a larger number of people), or of substantial property damage. Several systems
involve the use of dangerous and hazardous chemicals and materials. Products of ANDRITZ are also used in the
primary cooling circuits of nuclear power plants. The Group provides installation and other services on industrial sites containing dangerous and hazardous chemicals and materials. In the event of an accident, for example a
spill of such hazardous materials, a fire, or an explosion, the Group could be held liable for property damage,
personal or fatal injury, and environmental remediation.
Insurance
While the ANDRITZ GROUP maintains insurance programs to cover typical insurable risks related to its business, there can be no guarantee that this insurance can fully cover potential losses, that the insurers will be liable to
pay damages, nor that the amount of the Group's insurance will be adequate. Moreover, the Group is involved in
certain industries (for example the space and nuclear industries) for which risks are uninsurable or where it is not always possible to comply with all of the conditions required to contract insurance. Any material liability not
covered by insurance would have a substantial adverse effect on the Group’s financial condition.
Risks related to the Group’s business
Currencies
The Group has operations and subsidiaries in a large number of countries outside of the euro zone, and a signif-icant portion of its sales and costs are denominated in non-euro currencies, mainly in US dollars. The currencies
in these countries are subject to fluctuations in exchange rates. Currency risks in connection with orders that are
not invoiced in euros are minimized by derivative financial instruments, in particular forward contracts and swaps.
Although the Group attempts to hedge the net currency exposure of those orders not invoiced in euros by ar-
ranging forward contracts, currency fluctuations can result in the recognition of exchange rate losses in the Group’s financial statements. Developments of exchange rates may also have translation effects on the Group’s
sales and earnings whose values are converted into euros. In addition, shifts in exchange rates may affect
ANDRITZ’s position relative to its competitors, although many competitors of ANDRITZ are also based in the euro zone. As some of ANDRITZ’s major customers are based outside of the euro zone, changes in exchange
rates could lead to delays in project decisions by those customers. Also, the shareholders’ equity of the
ANDRITZ GROUP is not hedged and is thus susceptible to being affected by changes in the exchange rate.
Competitive position
The ANDRITZ GROUP does business in highly competitive markets in which only a few large suppliers bid for only a few large orders. In addition, there are many small companies competing locally that have a comparatively
low cost base. This competitive position has a negative impact on sales margins of the Group. There is no as-
surance that the Group can maintain its current market position in the future.

19 Management report
As the Group’s competitive position is also based on proprietary technology, the increase in product piracy and
industrial espionage facilitated by the digital era and the accompanying increase in intellectual property piracy can also have an adverse effect on the Group’s competitive position. The Group makes efforts to protect its
intellectual property, but there can be no assurance that these efforts will be successful.
Acquisition and integration of complementary business segments
One of the Group’s main strategic goals is to become a full-line supplier in all of its business areas through
organic growth and complementary acquisitions. In the course of implementing this strategy, the Group has acquired and integrated a number of companies with worldwide operations since 1990.
There is, however, no guarantee that the Group will be successful in identifying and acquiring appropriate acqui-sition candidates in the future, or that suitable candidates and sufficient financing will be available. In the past,
ANDRITZ was successful in integrating newly acquired companies, but there is no guarantee that planned ob-
jectives and synergies can be realized for all acquisitions in the future (including the ongoing integration of the most recently acquired companies), or that the Group may not be exposed to new or legacy risks that have not
been properly managed or identified.
The Schuler Group acquired in 2013 derives approximately 80% of its sales from the automotive industry, which
is generally exposed to severe cyclical swings. Thus, possible negative cyclical fluctuations can have a negative
impact on the sales and earnings development of the Schuler Group and thus of the ANDRITZ GROUP.
Legal proceedings
In the course of its business, the ANDRITZ GROUP is party to numerous legal proceedings before both adminis-trative and judicial courts and bodies, as well as before arbitration tribunals. The substantial majority of such
proceedings is of a nature considered typical of the Group’s business, including contract and project disputes,
product liability claims, and intellectual property litigation. Where appropriate, provisions are made to cover the expected outcome of proceedings to the extent that negative outcomes are likely and reliable estimates can be
made. There is no guarantee, however, that these provisions will be sufficient. Given the amounts at stake in
some of these disputes, a negative decision for ANDRITZ in one or several of these legal disputes may have a material adverse effect on the earnings and liquidity position of the Group.
The project related disputes include an arbitration filed by ANDRITZ Pulp Technologies Punta Pereira S.A., a subsidiary of the ANDRITZ GROUP, against Celulosa y Energia Punta Pereira S.A. (“CEPP”), a joint venture
between Stora Enso and Arauco in connection with several delivery contracts for equipment and systems for
CEPP’s Montes de Plata pulp mill in Uruguay. ANDRITZ claims are approximately 200 MEUR. CEPP has coun-terclaimed of 110 MUSD (91 MEUR). ANDRITZ disputes the claims brought by CEPP.
The product liability cases include a number of cases alleging injuries and/or death resulting from exposure to asbestos. ANDRITZ Inc., a subsidiary of the ANDRITZ GROUP, is one of many defendants in 66 asbestos cases
(status as of December 31, 2014; 23 cases as of December 31, 2013) in the USA. In aggregate, the cases
involve 445 plaintiffs (428 plaintiffs as of December 31, 2013). All of the cases relate to claims against multiple defendants. ANDRITZ Inc. does not believe it should be found liable in connection with any of these claims and
intends to defend each claim vigorously.
Compliance
The ANDRITZ GROUP is subject to a variety of legal compliance risks, including compliance with anti-trust and
anti-bribery laws in Austria and other countries where the Group conducts business. The Group has established a Compliance Committee to control its compliance efforts and has adopted a number of compliance policies,
including policies prohibiting the misuse of insider trading, the violation of applicable anti-trust laws and anti-
bribery laws, as well as a global Business Code of Conduct. While the Group attempts to make sure that such policies are observed, there can be no assurance that no violations will occur or have occurred. Any such viola-
tion could have a lasting adverse impact on the financial position and reputation of the Group and could also
lead to the cancellation of existing orders.
Risks related to major orders and other contracts
Payment risks from customers Much of the ANDRITZ GROUP’s business involves handling major projects with a large contract value. If a cus-
tomer fails to meet its payment obligations for one of these projects, this may have a negative effect on the net
worth and liquidity position of the Group. The ANDRITZ GROUP tries to limit these risks by securing payment guarantees from banks and export credit insurance agencies. Even in projects covered by export credit insur-
ance, typically only up to 85% of the sales price is secured through such insurance. However, the conditions for
complete coverage are not always met. Moreover, much of the Group’s service business is not secured by bank

20 Management report
guarantees. Worsening economic conditions could adversely affect the ability of certain customers to meet their
payment obligations to ANDRITZ.
In addition, there is always some risk that partial or full provisions will have to be made for some trade accounts
receivable.
Performance risk of projects
In conjunction with the delivery of equipment and services supplied by ANDRITZ, the Group is under contractual obligation in many cases to provide performance guarantees and to meet certain deadlines. If the performance
data stated are not achieved or if deadlines are not met, the Group may have to perform remedial work at its
own expense or pay damages. If a guaranteed performance level is missed by a wide margin, deadlines are significantly exceeded, or the customer does not accept the plant for other reasons, the customer may have the
right to terminate the agreement and return the subject of the contract to ANDRITZ for a full refund and recover
damages. Such action could have an adverse effect on the Group’s financial development.
Cost overruns
Many of the Group’s projects are based on long-term, fixed price contracts. The sales and operating margins realized in a fixed price contract may vary from original estimates as a result of changes in costs, especially
fluctuating material costs, especially on projects that include engineering and/or construction of complete plants.
In addition, since certain parts of the Group’s supplies are outsourced, the Group may be forced to quote at a
fixed price to the customers without knowing the exact cost of the parts purchased. While estimates are made
using empirical data and quotes from potential suppliers, these may not always be completely accurate. The Group has experienced significant losses on certain past and pending projects in this regard, and similar difficul-
ties and losses may occur in the future in a way that would adversely affect the Group’s financial condition.
EPC/turnkey contract risks
In many projects, ANDRITZ also has responsibility for plant-wide engineering and/or installation and construction
in addition to the supply of ANDRITZ equipment and systems. These contracts bear the risks discussed above, but also entail certain risks relating to greater on-site responsibilities, including environmental matters, local labor
conditions, as well as risks relating to geology, construction, and installation. Additionally, the Group is exposed
to the risks inherent in managing the third parties providing construction, installation, and engineering services on these projects (such as strikes and other labor disruptions, which can lead to delays in start-up, or failure to
meet deadlines). The Group has put risk management procedures in place, including insurance programs, con-
tract policies, and project management discipline, to reduce these EPC-related risks as far as contracts allow. Nevertheless, there is no guarantee that these procedures are sufficient to prevent negative financial conse-
quences. The Group has experienced significant losses on certain past and pending projects in this regard, and
similar difficulties and losses may occur in the future in a way that would adversely affect the Group’s financial condition.
Consortium risks In many EPC and other projects, the ANDRITZ GROUP participates with third parties with whom it shares sever-
al joint liabilities. While the Group attempts to make sure that risks in such projects are properly allocated, there
can be no assurance that this will always be successful. Moreover, the inability of one of the Group’s consortium partners to fulfill its obligations on the project, including indemnity obligations to the Group, may have an ad-
verse material impact on the financial results and the liquidity of the Group.
Limitations of liability
Liabilities arising out of the Group’s contracts may include liabilities for customers’ loss of profits and other
liabilities that can vastly exceed the value of the contract in question. While the Group endeavors to include appropriate limitations of liability in its contracts, there can be no assurance that appropriate limitations will in
fact be in place in all contracts or that such limitations will be enforceable under the applicable law.
Government contracts
A certain amount of the orders handled by the business areas are placed by government entities. These projects
can involve the performance, liability, and EPC/turnkey contract risks described above. Due to public bid re-quirements and local laws, it may not always be possible for the Group to obtain its desired contractual safe-
guards, and thus it may remain more exposed to such risks in connection with these projects.

21 Management report
Risks related to the capital markets
Dependence on the development of international financial markets Apart from company-related occurrences, development of the ANDRITZ share price is also dependent on fluctu-
ations in prices on the international financial markets. Major price fluctuations and high volatility on major stock
markets may have an adverse effect on the ANDRITZ share price.
Recommendations by analysts
As a publicly listed company, ANDRITZ is regularly assessed by financial analysts and institutional investors. Analysts’ recommendations to buy or sell ANDRITZ shares and subsequent investment decisions by sharehold-
ers may cause considerable fluctuations in the share price. The ANDRITZ GROUP has consistently followed a
policy of open and transparent information exchange with shareholders and the financial community to minimize unfounded fluctuations in its share price.
Active trading of ANDRITZ shares The high level (close to 75%) of public free float of ANDRITZ’s total outstanding shares and the intensive investor
relations activities have led to active trading in ANDRITZ shares on the Vienna Stock Exchange. There is no
assurance, however, that active trading will be maintained in the future. If active trading were not maintained, the liquidity and market price of ANDRITZ shares would suffer adverse effects and investors may not be able to sell
their shares at what they perceive to be an acceptable price. In the absence of active trading or in the event of a
major change in market capitalization, the ANDRITZ share could be removed from various international industrial and stock exchange indices, for example the ATX, the leading index of the Vienna Stock Exchange, or other
indices. This could result in major changes in the price of the ANDRITZ share.
Non-financial performance indicators
Manufacturing
Due to the good development in order backlog, 2014 was marked by high capacity utilization rates in the manu-facturing sector. At the ANDRITZ manufacturing locations, the figures budgeted were achieved and even ex-
ceeded at many locations.
Investments in the manufacturing sector concentrated on quality and efficiency measures in production capaci-
ties both in the emerging markets of Asia and Eastern Europe (particularly in China, Hungary, and Slovakia) and
at the existing locations in Central Europe and North America.
Human resources
At the end of 2014, the ANDRITZ GROUP had a total of 24,853 employees (+4.8% versus December 31, 2013: 23,713 employees).
Group Human Resources is responsible for coordination and planning of the main personnel processes through-
out the Group. The main tasks in this field are succession planning and filling any key positions that become
vacant. Diversity is one of the factors that have always played an important role in selecting new employees. Internal successor candidates are sought out and trained in group-wide management programs. As a result, the
proportion of internal successor candidates has risen significantly in the past few years. In order to achieve this,
ANDRITZ created two leadership programs. “High potentials” are identified systematically and developed further by means of a Group-wide development program. In addition to global personnel development measures, the
ANDRITZ GROUP also has several regional programs to enhance the potential of its employees. The “Austrian
60 (62)
14 (11)
11 (11)
9 (9)
5 (6) 1 (1)
Europe
South America
North America
China
Asia (withoutChina)
Others
Employees by regionas of December 31, 2014(December 31, 2013) in %

22 Management report
Young Talent Program” for example is used to identify and support high-potential employees in order to build up
a group of candidates who will be able to take over key positions in the future.
ANDRITZ helps its employees to achieve the best possible work-life balance. For example, employees with
young children are offered flexible part-time options. In addition, the Graz location runs a company kindergarten.
Another important focus lies on preventive health care for employees. Here, the emphasis lies on preventive
measures in the areas of physical and mental health. Numerous employees benefit from initiatives, seminars, and workshops on health topics offered at ANDRITZ locations all around the world.
Environmental matters The ANDRITZ GROUP is committed to promoting environmental protection and conservation of natural re-
sources. Due to the standardization of core processes, ANDRITZ endeavors to ensure that all plants and sys-
tems delivered to ANDRITZ customers around the world comply with the highest environmental standards. Environmental protection measures focused particularly on energy-saving by insulating building façades and
pipework, modernizing heating systems, and reducing standby times in manufacturing plants. A reduction in
CO2 emissions was achieved by continuously replacing older trucks with new vehicles using hybrid technology, and gradually introducing energy-saving and cost-efficient lighting for offices and manufacturing workshops.
Important investments were also made in continuous modernization of the machinery in operation, which led to
an increase in energy efficiency at the manufacturing locations. A project to generate solar energy is being pre-pared at the Graz location in Austria. Numerous initiatives in waste prevention, waste separation, and recycling
at the ANDRITZ locations worldwide also made an important contribution towards environmental protection.
RESEARCH AND DEVELOPMENT The ANDRITZ GROUP’s expenses for Research and Development (R&D) activities on new processes and prod-ucts amounted to 84.3 MEUR in the reporting period (2013: 92.6 MEUR).
Important focuses in the development of new and innovative technologies are higher environmental protection, reducing the input of energy and resources in the production of machinery and plants, and also extending their
life cycle. In this way, ANDRITZ helps its customers worldwide to comply with environmental specifications in the
best possible way and to generate economic value added by reducing costs and increasing productivity. Con-tract-related development work is often conducted in collaboration with customers.
Main research and development work by business area: HYDRO
Development of new technical solutions for hydropower plants in order to provide balancing power to stabilize
the electrical grid is one of ANDRITZ HYDRO's main focuses. Work is currently concentrating primarily on per-forming rapid adjusting processes without limiting the service life of the equipment at the same time. The new
developments are based on extensive measurements at different Francis units in Norway, Canada, Austria, and
on the Philippines, which made it possible to conduct a detailed analysis of machine behavior in different operat-ing modes, especially regarding start/stop. ANDRITZ is also working on simulation and optimization of these
new technical solutions as part of the “Green Storage Grid” project by Vienna University of Technology, Austria.
ANDRITZ HYDRO embarked on a research project at the Electric Drives and Machines Institute of Graz Universi-
ty of Technology, Austria, which has a new assistant professorship established to optimize generators and full-
power converters with variable rotation speed. The results of this project will be used mainly in the operation of pumped storage power stations, which have to be operated flexibly and adjusted quickly.
Other developments relate to progress in the green technologies sector. For example, an oil-free turbine gover-nor was developed, which is also an important component in a long-term environmental protection project by
the Swedish utility company Vattenfall.
Special focus lay on the development and design of single- and double-flow multi-stage pumps with different
specific speeds. Thanks to their close collaboration, hydraulic and mechanical developers were able to imple-
ment an innovative mechanical concept that saves on material and features a competitive hydraulic design. Thus, ANDRITZ Pumps offers standardized and specific customer solutions for multi-stage pumps used in water
transport as well as in other power and industrial applications ranging from a few kW to 35 MW drive power.
ANDRITZ HYDRO’s newly developed product platform HIPASE will be used in future to provide information on
control and electrical protection equipment in hydropower plants. The automation platform is a unique new
approach worldwide to standardize different equipment specifications (for electrical protection, voltage regulator

23 Management report
and the synchronization device) and use the latest and most advanced hardware and software technologies. It
features uniform hardware and user interface as well as a uniform configuration and engineering process.
In order to make innovative progress, ANDRITZ HYDRO has established a business area-wide platform for inno-
vation and exchange of information. In particular, locations without an R&D or engineering department can be involved more closely in the innovation process and profit from the know-how within the ANDRITZ network.
PULP & PAPER The R&D work by the PULP & PAPER business area in the reporting year focused on optimizing production
processes and machinery for processing all types of pulps (chemical, mechanical, and recycled fiber) to make
the production of pulp and paper more efficient, more sustainable, and more profitable.
In the dispersion sector, the development of a modified screw conveyor led to enhanced pulp dewatering and
thus up to 15% higher consistency in dispersing. This results in energy savings and a reduction of impurities.
Thanks to its multi-stage injectors, the new ANDRITZ SelectaFlot system improves aeration so that impurities
and ink particles can be removed more efficiently in the deinking process. The new design based on a circulat-ing fluidized bed achieves savings of up to 50%.
The TwinFlo refiner, which has been successful on the market for many years, has also been adapted. The new refiner design makes it possible to reduce the speed of rotation at higher motor output and thus provides a
substantial increase in performance.
The business area is also concentrating on the generation of power from sustainable, renewable fuel sources for
the pulp and paper industry and also for utilities and municipal power plants. At the moment, large circulating
fluidized bed boilers with an output of more than 100 megawatts are being developed in order to use biomass in place of fossil fuels to a large extent. In addition, the business area is working on further development of wet
and dry flue gas cleaning processes.
An additional focus lies on the development of solutions and methods for processing residual materials and
recovering raw materials and energy. In the reject treatment sector, collaboration with Alucha, one of the leading
developers worldwide of pyrolysis processes for industrial applications, has enabled the business area to offer complete pyrolysis plants. When treating rejects from liquid packaging board, fibers are recovered and the resid-
ual fraction is separated into aluminum, gas, and oil by means of pyrolysis. Heat or electricity can be generated
from the pyrolysis gas generated, and the recycled aluminum can be sold again.
In the recycling machinery sector, ANDRITZ MeWa has made improvements to rotary shears and granulators.
The recycling material can now be fed to the cutter much more efficiently and with less risk of disruptions, which provides higher and more even throughput combined with low wear.
In the nonwovens sector, wetlace technology was developed further. This technology combines wetlaid pro-cesses with hydroentanglement and embossing. The technology can produce biodegradable and flushable
wipes and provide them with customized embossing (e.g. logos or short texts on ecologically compatible use of
these wipes). At the same time, wetlace technology provides a significant reduction in the use of resources by optimizing water loops and recycling waste products within the production process.
Furthermore, the business area is developing a process in which CO2 will be used as a raw material for the production of bio-plastics. In this project, CO2 from flue gases is used to grow the bacteria or algae needed in
bio-plastics production. The process is currently being tested in a pilot plant in cooperation with partners from
research and industry. ANDRITZ is also a partner in the two EU research projects HiPerCap and Nanosim, which deal with CO2 separation.
In the service sector, the PULP & PAPER business area is focusing on increasing the profitability of customer plants by making significant water, chemical, and energy savings.
METALS With its ECOFORM program, Schuler is taking an important step towards sustainability and energy efficiency in
press shops. ECOFORM enables the customer to achieve production that is efficient in consumption of both
energy and resources and provides increased productivity at the same time. The program covers the energy analysis in the press shop, where savings potentials are computed by means of energy consumption measure-
ment, evaluation, and analysis of the actual situation. Furthermore, the main focuses of the energy efficiency
program are the use of energy-efficient components, innovative system solutions such as intelligent energy

24 Management report
recovery, as well as start/stop and standby systems or intelligent control solutions for energy optimization in
processes.
ANDRITZ METALS developed two technologies for treating mixed acids and reducing the level of nitrates in the
effluent from stainless steel pickling plants: In the Pyromars process, the waste pickling liquor produced is treat-ed to provide a re-usable mixed acid regenerate, which significantly reduces the nitrate load. Thanks to an addi-
tional ZEMAP plant (Zero Effluent Mixed Acid Pickling), the remaining acid rinsing and pickling effluent recovered
again in the Pyromars process can be concentrated. The advantage here is that the nitrate load in the effluent drops almost to zero, the effluent volume is significantly reduced, and a mixed oxide of iron, chromium, and
nickel can be recovered and further used in stainless steel production.
Another ANDRITZ METALS focus lies in lightweight automotive construction. For tailored welded blanks, the
developments concentrated primarily on combining hot-forming steel grades of different strengths so that the
car bodywork deforms in the softer areas if there is an accident and the impact energy can thus be better ab-sorbed. However, more than 90% of these hot-forming steels used in the automotive industry have an alumi-
num-silicon coating (AlSi coating), which has a negative effect on the quality of the weld, although it does
prevent a layer of scale from forming during heat treatment. By using a new ablation technique, AlSi-coated sheets can also be welded to tailored welded blanks with excellent weld seam quality. This new, innovative
technique is being implemented under a collaboration agreement between ANDRITZ Soutec and ArcelorMittal
Tailored Blanks.
SEPARATION
ANDRITZ SEPARATION focused its R&D activities in 2014 on reducing the energy consumption of centrifuges. For example, the Series D decanter centrifuge now has a completely new design. As a result, the energy con-
sumption can be reduced by up to 40%, thus achieving the same performance at a lower overall cost. At the
moment, work is also proceeding to extend the decanter product portfolio to cover the food sector.
2014 saw the launch of a completely new sludge dewatering unit for municipal and industrial waste water treat-
ment plants and for food applications. The C-Press, a screw press providing high performance combined with compact design, features low operating costs. In addition to a long life cycle, the press also offers other benefits,
such as easy operation, low maintenance, and 30% less water consumption than comparable equipment due to
a bi-sequential cleaning process. The new C-press thus complies with all EU regulations on such issues as safety, hygiene, and environmental protection.
The business area is also focusing on extending the portfolio for separators. At the moment, a nozzle separator designed primarily to minimize potential contaminants is being developed for dairy product applications.
In the course of launching a new product family on the market, ANDRITZ FEED & BIOFUEL has developed a batch-type mixer with a capacity of 4,000 liters for the feed industry. The new mixer offers shorter mixing times
as well as new functionalities, including a self-cleaning program.
The new series of the FeedMax pellet mill driven by a gear wheel was launched on the market in 2014, and the
first machine went into service in South America. The design features include a new, improved gear box as well
as a new roller bearing system for the main shaft with 80% longer life cycle. The new series is fitted with an extended die width for a higher throughput and a new monitoring system that detects roll slippage and thus
improves process control.
Corporate Governance report
The Corporate Governance report is available in the following section or on the ANDRITZ website
www.andritz.com.
Significant events after reporting period
The status of the global economy and the financial markets did not change substantially in the period between the date of the balance sheet and publication of the present report.

25 Management report
OUTLOOK According to economic experts, the global economy will again show no significant growth in 2015. Whereas the economy in the USA will grow substantially in the coming year and is expected to see a GDP growth of about
2.9%, the economy in Europe will continue to show very subdued development and only grow by approximately
0.8%. With the exception of China, also most countries in the emerging markets of Asia and South America will only show moderate growth according to experts.
In view of this anticipated overall economic environment, no substantial change – compared to the satisfactory level of 2014 – is expected in project activity in the markets served by the ANDRITZ GROUP. In addition to some
larger modernization projects, individual large-scale projects in the hydropower and pulp sectors are likely to be
awarded.
Internally, ANDRITZ will focus on cost discipline and optimization of organizational and company structures in
2015. In order to continue growth, continued emphasis will be placed on research and development as well as on opportunities to acquire companies with complementary technologies.
Based on these expectations and the order backlog at the end of 2014, the ANDRITZ GROUP currently expects a slight increase in sales for 2015 and targets an increase in net income compared to the previous year.
However, if the global economy suffers severe setbacks in 2015, this could have a negative impact on ANDRITZ’s business development. This may lead to organizational and capacity adjustments and, as a result, to
financial provisions that could have a negative effect on earnings.
SHARES AND SHAREHOLDER STRUCTURE Disclosure according to Article 243a of the Austrian Commercial Code (Unternehmensgesetzbuch – UGB)
The capital stock of ANDRITZ AG as of December 31, 2014 amounted to 104,000,000 EUR. The proportionate amount of the capital is 1.00 EUR per no-par value share.
There are no limitations concerning the voting rights or the transfer of shares. 25% plus one share are held by SARS Achtundfünfzigste Beteiligungsverwaltung GmbH, whose Managing Director is Wolfgang Leitner, Presi-
dent and CEO of ANDRITZ AG. Wolfgang Leitner holds a 99.6% interest in Cerberus Vermögens-
beteiligungsverwaltung GmbH and is Managing Director of this company, authorized to act alone on its behalf. Custos Privatstiftung, of which Wolfgang Leitner is a co-founder, holds a stake of 0.4% in Cerberus Vermögens-
beteiligungsverwaltung GmbH. Cerberus Vermögensbeteiligungsverwaltung GmbH holds a stake of 0.769% in
ANDRITZ AG, 3.99% is held by Certus Beteiligungs GmbH. The remaining ANDRITZ AG shares are held by national and international institutional investors and by private investors.
The Austrian Takeover Commission, set up by the Vienna Stock Exchange, notified ANDRITZ AG at the begin-ning of October 2014 that a review procedure is being instituted pursuant to Section 33 of the Austrian Takeover
Act. The object of the procedure is to review whether there was wrongfully no mandatory takeover offer submit-
ted (Section 22 et seq. of the Austrian Takeover Act) in connection with the reorganization measures implement-ed by the core shareholders of ANDRITZ AG in August 2014, particularly by Custos Privatstiftung and Certus
Beteiligungs GmbH, and in connection with re-transition of a securities loan for ANDRITZ AG shares existing
since 2004. At the copy of deadline of the present financial report the proceeding from the takeover commission has not been finished.
At present, there is no authorized capital. On March 22, 2013, the Annual General Meeting authorized the Executive Board to buy back up to 10% of the total shares of ANDRITZ AG between October 1, 2013 and
March 31, 2016. At the beginning of October 2013, the Executive Board of ANDRITZ AG decided to make use
of this authorization and buy back shares between November 12, 2013 and March 31, 2016. There is no author-ization of the members of the Executive Board – especially regarding the possibility to issue or buy back shares
– that do not result directly from legal stipulations.
As far as is known to the company, there are no holders of shares with special controlling rights. Employees
exercise their voting rights directly. Furthermore, there are no stipulations regarding the appointment and remov-
al of the members of the Executive Board and the Supervisory Board, nor regarding modifications of the com-pany’s Articles of Association that do not result directly from legal stipulations.
There are no significant agreements in which the company participates that would become effective, would change, or end in the event of a change in the control of the company following a takeover bid.

26
Acc
are cont
to a
accu
Com
chanemp
Graz
The
Discl
Certa
state
expec
place
revisi
The a
up to
chapt
made
inform
ording to the te
entitled, in thetrol leading to a
accelerate matu
umulated up to
mpensation agr
nge of control. ployees.
z, February 25,
Executive Boa
Wolfgang Leitner
President and CEO
laimer:
ain statements cont
ments, which conta
ctations and are su
e undue reliance o
ions to the forward-
annual financial rep
o the copy deadline
ter “corporate risks
e in the annual fin
mation related to th
erms of the AN
e event of a cha substantial im
urity of their bon
the day of repa
eements exist
No such comp
2015
rd of ANDRITZ
Humbe
PULP &
(Service
SEPAR
tained in the annua
ain the words “beli
bject to risks and u
on such forward-loo
-looking statements
port 2014 and the a
e on February 25,
s” and in the manag
ancial report 2014
e future is provided
NDRITZ corpora
hange of contrompairment of the
nds and to requ
ayment.
between the c
pensation agree
AG
rt Köfler
& PAPER
& Units),
RATION
biom
l financial report 20
eve,” “intend,” “ex
ncertainties that ma
oking statements.
s made herein, exce
nnual report 2014 c
2015. If the premis
gement report in the
and the annual re
d without guarantee
ate bond 2012
ol by a large ne issuer’s ability
uire immediate
ompany and m
ements exist fo
Friedrich Papst
METALS,
HYDRO (pumps),
SEPARATION (feed
mass pelleting segm
014 and in the annu
xpect,” and words o
ay cause actual res
The company disc
ept where it would b
contain assumption
ses for these assu
e annual financial r
eport 2014. Althou
.
-2019 issued in
ew shareholdey to fulfill its obl
repayment at t
members of its
or the members
Joachim
d/
ments)
PULP &
(Capital
ual report 2014 con
of a similar meanin
ults to differ materia
claims any obligati
be required to do so
s and forecasts wh
mptions and foreca
eport 2014 do arise
gh the greatest ca
Manageme
n July 2012, al
r taking place igations from th
the nominal val
Executive Boar
s of the Superv
Schönbeck
& PAPER
Systems)
nstitute “forward-loo
g, reflect the Exec
ally. As a result, rea
on to publicly ann
o under applicable la
hich were based on
asts do not occur,
e, actual results ma
aution was exercise
ent report
ll holders of a b
and this changhe bond, be en
ue plus any int
rd in the event
visory Board or
Wolfgang Sempe
HYDRO
oking statements.”
cutive Board’s belie
aders are cautioned
nounce the result o
aw.
the information av
or risks indicated
ay vary from the for
ed in preparing da
bond
ge of titled
erest
of a
r any
r
These
fs and
not to
of any
ailable
in the
ecasts
ata, all
27 Corporate Governance report
The present report explains the structures, processes, and rules implemented with respect to financial manage-
ment and towards shareholders, which ANDRITZ obeys in the corporate governance sector. As a publicly listed company with headquarters in Austria, the formal framework for corporate governance is derived from Austrian
law, the articles of association, and the rules of procedure for the corporate bodies, as well as the Austrian Code
of Corporate Governance.
Commitment to the Austrian Corporate Governance Code
ANDRITZ has adopted the rules of conduct laid down in the Austrian Code of Corporate Governance without restriction and regards the Code as an essential requirement for implementation of responsible company man-
agement, which is directed towards creating sustainable and long-term added value and a high degree of trans-
parency for shareholders and other stakeholders. The Executive Board and the Supervisory Board, as well as the entire staff of the ANDRITZ GROUP, are committed to complying with the Code.
The Austrian Code of Corporate Governance applicable to the business year (January 2015 edition) is publicly accessible and available on the website of the ANDRITZ GROUP at www.andritz.com as well as on the website
of the Austrian Working Group for Corporate Governance at www.corporate-governance.at.
The Austrian Code of Corporate Governance is based on a voluntary commitment and goes beyond the legal
requirements for corporations. ANDRITZ obeys the rules of the Code almost entirely. In the interests of the basic
principle of "Comply or Explain" in the code, ANDRITZ justifies its non-observance or non-compliant observance of those rules that go beyond the legal requirements (so-called C-rules) as follows:
Rule 27 and Rule 30 (Disclosure of the basic principles of the remuneration system for the Executive Board): The variable portion is exclusively based on the net income; there are no non-financial criteria that impact the extent
of the variable remuneration. The ANDRITZ GROUP operates in business areas that show considerable differ-
ences in some respects, this is why it is not possible to define uniform non-financial criteria for the entire Group. This fulfills the requirements of the objectivity and clear traceability concepts. The sustainability aspect was
taken into account in designing the stock option program.
CORPORATE GOVERNANCE REPORT

28 Corporate Governance report
Composition of the Executive Board
The Executive Board of ANDRITZ AG was composed of five members as of December 31, 2014. The Executive Board mandate of Karl Hornhofer who had been responsible for capital systems in the PULP & PAPER business
area and Group-wide for quality and safety management since January 1, 2007, ended on September 30, 2014.
Joachim Schönbeck was appointed as a new member of the Executive Board as of October 1, 2014.
Name (date of birth) Function
Date of first
appointment to the
Executive Board
End of current
mandate
Supervisory Board
mandates in other
companies in Austria
and abroad
Wolfgang Leitner
(March 27, 1953)
President &
CEO
October 1, 1987 (CFO)
June 29, 1994
(President & CEO) June 28, 2018
Schuler AG (listed until
October 30, 2014);
Haas Beteiligungs- und
Management GmbH;
Haas Food Equipment
GmbH;
Franz Haas Vermögens-
und Beteiligungs
Aktiengesellschaft;
HBB Haas Beratung und
Beteiligungen GmbH
Humbert Köfler
(January 11, 1961)
Member of the
Executive
Board April 1, 2007 March 31, 2020 None
Friedrich Papst
(November 6, 1952)
Member of the
Executive
Board April 1, 1999 March 31, 2015
Schuler AG (listed until
October 30, 2014)
Joachim Schönbeck
(January 30, 1964)
Member of the
Executive
Board October 1, 2014 September 30, 2017 Westag & Getalit AG
Wolfgang Semper
(March 9, 1958)
Member of the
Executive
Board April 1, 2011 March 31, 2019 None
Wolfgang Leitner Areas of responsibility:
Central Group functions such as Human Resources Management, Controlling and Accounting, Treasury, Corpo-
rate Communications, Investor Relations, Internal Auditing, Information Technology
Professional career:
Member of the Managing Board of AGIV AG, founder and President of GENERICON Pharma GmbH, Manage-ment Consultant at McKinsey & Company, Research Chemist at Vianova/HOECHST
Humbert Köfler Areas of responsibility:
PULP & PAPER (Service & Units) and SEPARATION
Professional career:
Head of the Paper Mill Services division at ANDRITZ AG, Head of the Mechanical Pulping Systems division at
ANDRITZ AG, Regional Sales Manager at ANDRITZ Sprout-Bauer GmbH, Export Marketing Manager at Biochemie GmbH

29 Corporate Governance report
Friedrich Papst
Areas of responsibility: HYDRO (Pumps), METALS, SEPARATION (Feed and Biofuel Technologies), as well as Group-wide Manufacturing
and Procurement
Professional career:
Vice President of ANDRITZ Sprout-Bauer Inc., Director of Manufacturing at ANDRITZ AG, Director of Production
Planning at ANDRITZ AG
Joachim Schönbeck
Areas of responsibility: PULP & PAPER (Capital systems) as well as Group-wide Quality and Safety Management
Professional career: Spokesman of SMS Holding GmbH and Chairman of the Management Board of SMS Meer GmbH, management
positions at SMS Group, Siemens, and Mannesmann
Wolfgang Semper
Areas of responsibility:
HYDRO (except the Pumps division) and Group-wide Automation
Professional career:
President of ANDRITZ HYDRO GmbH and Head of the Large Hydro division of the HYDRO business area, man-agement functions at VA TECH VOEST MCE and Voest-Alpine MCE, Technical Calculations Engineer at
Voest-Alpine AG
Composition of the Supervisory Board The ANDRITZ AG Supervisory Board consists of six appointed members and three delegated members.
In the 2014 business year, long-standing members of the Supervisory Board Hellwig Torggler (on the Superviso-
ry Board since 2000) and Peter Mitterbauer (since 2003) withdrew from the Supervisory Board upon their retire-
ment. Monika Kircher and Ralf Dieter were elected as new members of the Supervisory Board of ANDRITZ AG by the Annual General Meeting of Shareholders in March 2014 for the 5-year maximum period allowed by the
Articles of Association.
Name (date of birth) Function
Date of first
appointment to the
Supervisory Board
End of current
mandate
Supervisory Board
mandates in other listed
companies in Austria and
abroad
Appointed members:
Christian Nowotny
(July 23, 1950)
Chairman of the
Supervisory
Board December 29, 1999
Until the Annual
General Meeting in
2017
Schuler AG (listed until
October 30, 2014)
Klaus Ritter
(April 20, 1940)
Deputy-Chairman
of the
Supervisory
Board March 30, 2004
Until the Annual
General Meeting in
2016 None
Ralf Dieter
(March 25, 1961)
Member of the
Supervisory
Board March 21, 2014
Until the Annual
General Meeting in
2019
Homag Group AG
(Chairman);
Schuler AG (listed until
October 30, 2014)
Monika Kircher
(July 8, 1957)
Member of the
Supervisory
Board March 21, 2014
Until the Annual
General Meeting in
2019 None
Fritz Oberlerchner
(June 16, 1948)
Member of the
Supervisory
Board March 29, 2006
Until the Annual
General Meeting in
2015 STRABAG AG, Cologne
Kurt Stiassny
(October 6, 1950)
Member of the
Supervisory
Board December 29, 1999
Until the Annual
General Meeting in
2015 None

30 Corporate Governance report
Name (date of birth) Function
Date of first
appointment to the
Supervisory Board
End of current
mandate
Supervisory Board
mandates in other listed
companies in Austria and
abroad
Delegated members:
Georg Auer
(October 12, 1974)
Member of the
Supervisory
Board July 1, 2011 None
Isolde Findenig
(April 1, 1956)
Member of the
Supervisory
Board January 1, 2012 None
Andreas Martiner
(November 11, 1964)
Member of the
Supervisory
Board February 14, 2001 None
Information relating to the independence of the Supervisory Board
Regarding the independence criteria, the Supervisory Board of ANDRITZ AG follows the guidelines laid down in
the Corporate Governance Code. According to these guidelines, all members of the Supervisory Board of ANDRITZ AG can be seen as independent. No member of the Supervisory Board of ANDRITZ AG holds more
than 10% of the total of shares.
Disclosure of information on the remunerations of the Executive Board and Supervisory Board
The remuneration report explains the extent and structure of the remunerations paid to members of the Execu-
tive Board and of the Supervisory Board of ANDRITZ AG.
Executive Board remunerations
The Executive Board remunerations in the 2014 business year amounted to 8,398,462 EUR (2013: 3,910,238 EUR) and are divided as follows:
(in EUR) Fixed Variable
Other
remunerations Total
Wolfgang Leitner (President and CEO) 800,000 1,849,661 9,681 2,659,342
Humbert Köfler 235,000 937,944 9,178 1,182,122
Friedrich Papst 272,907 1,499,283 9,390 1,781,580
Joachim Schönbeck 100,000 205,000 0 305,000
Wolfgang Semper 345,000 934,948 10,959 1,290,907
Karl Hornhofer (retired from the Executive
Board as of September 30, 2014) 235,000 937,944 6,567 1,179,511
Basic principles of the remuneration policy The principles applied in establishing the remuneration of the Executive Board and of senior managers comply
almost entirely with the Austrian Code of Corporate Governance.
The remuneration of the Executive Board is composed of a fixed and a variable/success-based portion, which
depends on the net income generated. The maximum value for the variable annual remuneration was fixed at
three times the fixed annual remuneration. Any amounts in excess of this sum will be credited as a variable remuneration for the following years. If the net income of the Group falls short of a defined minimum amount,
this results in a ‘malus’ that is also carried forward to the following years and to a reduction in future variable
salary components. The other remunerations relate primarily to taxable benefits in kind for company cars.
In all share option programs for managerial staff and the Executive Board since the IPO, participation was con-
tingent on investing at least 20,000 EUR in ANDRITZ shares for managerial staff and 40,000 EUR for members of the Executive Board no later than the allocation date of the options. This investment must be maintained
continuously until exercise of the options by those persons subscribing to the option program and evidence
thereof must be brought when the options are exercised. There is a waiting period of three years before options can be exercised if the contract of employment is still in force (exception: end of employment contract as
scheduled according to contract provisions).

31 Corporate Governance report
The following options were exercised by the Executive Board in the 2014 business year:
(in EUR) Number of options
Average exercise price
per option (in EUR)
Wolfgang Leitner (President and CEO) none -
Humbert Köfler none -
Friedrich Papst none -
Joachim Schönbeck none -
Wolfgang Semper 5,000 23.18
Karl Hornhofer (retired from the Executive Board as of
September 30, 2014) 20,000 23.18
The members of the Executive Board are entitled to receive pension scheme benefits. In addition to a retirement
pension, these include benefits in the event of occupational disability, as well as pension payments for depend-
ents following the death of the beneficiary. The retirement pension is normally paid as from a certain age provid-ed that the employment contract has already been terminated by this date. The administration work has been
outsourced to a pension fund. The pension contracts are based predominantly on a defined contribution system.
In the event that the employment contract is terminated prematurely, contributions made up to this point shall still be vested. The pension amount to which the beneficiary is entitled is not subject to an escalation clause
before any benefits become payable; after this, annual adjustments can be made to take account of the devel-
opment in wages and salaries and of ANDRITZ’s economic status.
Each member of the Executive Board shall, upon termination of his/her function and concurrent termination of
employment, be entitled to severance payments in the meaning of Article 23 of the Austrian Employees Act unless such termination is the result of justified dismissal.
ANDRITZ AG took out Directors’ and Officers’ liability insurance (D&O insurance) for 2014. The expenses are borne by the company. The D&O insurance covers certain personal liability risks of persons in the ANDRITZ
GROUP acting under responsibility. The annual cost is approximately 260,000 EUR (including Schuler).
Supervisory Board remunerations
Subject to approval by the Annual General Meeting, the Supervisory Board remunerations (including attendance
fees) for the 2014 business year amount to a total of 295,000 EUR (2013: 297,500 EUR) and are divided be-tween the individual Supervisory Board members as follows:
(in EUR)
Remuneration (including
attendance fees)
Christian Nowotny (Chairman of the Supervisory Board) 65,000
Klaus Ritter (Deputy Chairman of the Supervisory Board) 57,500
Ralf Dieter 27,500
Monika Kircher 27,500
Fritz Oberlerchner 42,500
Kurt Stiassny 42,500
Retired from the Executive Board as of March 21, 2014
Hellwig Torggler 20,000
Peter Mitterbauer 12,500
No Supervisory Board remuneration was paid to the Supervisory Board members delegated by the employee
representative organizations.
The remuneration scheme of the Supervisory Board is composed of a fixed and an attendance-related portion.
The fixed portion is a global sum, which is to be distributed such that the chairman of the Supervisory Board
receives double the amount and his deputy one-and-a-half-times the amount paid to the other members. The second portion consists of a lump sum fee paid in respect of each meeting that the member attends.
The remuneration report for the Executive Board and the Supervisory Board of ANDRITZ AG is available in the notes to the annual financial report 2014.

32 Corporate Governance report
Working procedures for the Executive Board and the Supervisory Board
Allocation of competencies in the Executive Board The Executive Board of ANDRITZ AG holds board meetings at regular intervals on essential, Group-relevant
topics and single business areas. The competencies and responsibilities of the individual Executive Board mem-
bers are listed in the notes on the Executive Board members in this Corporate Governance report. The rules of procedure for the Executive Board contain a comprehensive catalog of those business transactions requiring the
prior approval of the Supervisory Board in addition to those stated in the mandatory regulations in the Corpora-
tion Act.
Supervisory Board committees
The Supervisory Board of ANDRITZ AG established an audit committee that held two meetings in the 2014 business year to deal with the annual and consolidated financial statements for 2014, prepare the review of the
annual and consolidated financial statements for 2014 and of the proposal for distribution of profits, additionally
to deal with issues concerning the auditor, and implementation of the internal control and risk management systems in the ANDRITZ GROUP.
The Supervisory Board has also established a nomination and remuneration committee that held two meetings in 2014 and whose scope of activities includes the remuneration paid to the Executive Board members and the
content of their employment contracts, as well as appointments to Executive and Supervisory Board positions
that become vacant, and succession planning matters.
The ANDRITZ AG Supervisory Board held five regular meetings in the 2014 business year (four regular meetings,
one constituent meeting). The focal points of these meetings were monitoring of the current business develop-ment of the ANDRITZ GROUP, including possible deviations from the budget, the strategic goals, medium-term
planning for the individual business areas, as well as specific topics, such as acquisitions of companies, granting
of joint procurations, and other business subject to approval. The chairman and deputy-chairman receive a monthly report on the main developments. One business area is presented at each of the regular Supervisory
Board meetings and this business area's strategy is discussed. A comprehensive report on Group-wide compli-
ance is provided at one of the Supervisory Board meetings; this meeting also deals with the results of internal audits, and any measures resulting from these audits are presented and discussed.
Committee Members
Audit committee Christian Nowotny (Chairman)
Klaus Ritter (Deputy-Chairman) Monika Kircher
Andreas Martiner
Nomination and remuneration committee Christian Nowotny (Chairman)
Klaus Ritter (Deputy-Chairman) Fritz Oberlerchner
Auditors Deloitte Audit Wirtschaftsprüfungs GmbH, Vienna, was selected as independent auditor for the 2014 financial
statements and the consolidated financial statements by the 107th Annual General Meeting of ANDRITZ AG,
which convened on March 21, 2014.
Measures to promote the appointment of women to the Executive Board, the Supervisory Board, and to
management posts The Executive Board has no female members. The Supervisory Board has two female members, thus the pro-
portion of women is approximately 22%. There are women in management functions in the first and second
reporting levels in numerous sectors. The proportion of women in the total workforce was 15.4% (2013: 15.3%) as of December 31, 2014.
The ANDRITZ GROUP supports and encourages the appointment of women, particularly in technical sectors. Here, in many countries ANDRITZ is frequently confronted with the situation that there are still far fewer women
than men in technical professions or completing university courses on technical subjects.
Thus, ANDRITZ supports various initiatives to encourage women to opt for a technical profession or take a
degree in a technical subject. These initiatives include participating regularly in various events like recruiting and
job orientation days for young women at universities. ANDRITZ also takes measures and makes investments to improve employees' work-life balance. The company-run nursery school set up beside the headquarters of the

33 Corporate Governance report
ANDRITZ GROUP in Graz and the flexible working hours available to employees with young children are two
examples of these measures. When creating office space as part of new building projects, consideration is always given to the establishment of child care facilities for the children of employees. In addition, considerable
attention is paid to maintaining a strict equal opportunities policy in the recruitment process. In its efforts to
promote female employees, ANDRITZ will refrain from any measures that would discriminate against male em-ployees.
Internal auditing The Internal Auditing Group function, which reports directly to the President & CEO of the ANDRITZ GROUP,
conducts comprehensive audits on companies on the basis of a comprehensive risk analysis and the require-
ments of the Executive Board. The aim of these audits is to ensure compliance with Group guidelines and sound economic principles and to highlight potential for improvement in the work processes. A two-year plan for rou-
tine audits is prepared every year; in suspicious circumstances, audits are in certain cases also conducted
without warning. The goal is to evaluate risk management, internal controls, and business management pro-cesses in order to ensure as far as possible that business risks are identified adequately and dealt with in an
appropriate manner. In the 2014 business year, Internal Auditing conducted 40 audits worldwide (2013:
38 audits), the results of which were presented to the ANDRITZ Executive Board in the form of audit reports. The audit reports also contain specific recommendations for action to be taken.
Compliance ANDRITZ has a Group-wide compliance committee comprising five members from the Legal, Human Resources,
Controlling, and Investor Relations departments and which reports directly to the President & CEO as an inde-
pendent Group function. In addition, eight regional compliance officers and one compliance manager assist the committee in its work. The compliance committee reports in detail twice a year to the Executive Board on im-
portant events and measures.
The goal of compliance activities is to update the existing rules within the company on the topics of anti-
corruption, anti-trust laws, anti-discrimination, bans on insider trading, export controls, and data protection, as
well as monitoring this compliance and providing training on these topics. In addition, current topics and trends in the compliance sector should be taken up promptly and implemented in suitable actions and/or new rules. All
compliance documents are summarized in the Corporate Manual, which is available to all employees in the
ANDRITZ Intranet for reference purposes on all important information relating to basic business principles and processes and is applicable Group-wide. The regional compliance officers are available to employees on the
spot as direct contacts and training instructors.
ANDRITZ employees are requested to report any suspected violations of compliance regulations immediately. An
electronic mailbox for compliance matters has been set up for this purpose and is reviewed by the members of
the committee under strictest confidentiality. Furthermore, a whistle-blowing hotline is available to employees in the USA so that they can report information on potential violations immediately and anonymously.
ANDRITZ Code of Business Conduct and Ethics The ANDRITZ GROUP is committed to integrity, respect, reliability, and sustainability. In view of the Group's
growth in the past few years and in order to ensure that the common values, requirements, and guidelines are
understood and obeyed by all employees, all other persons who represent ANDRITZ, but also by business partners such as customers and suppliers, ANDRITZ uses a Group-wide applicable Code of Business Conduct
and Ethics. The code summarizes the basic business principles and the rules of conduct of the ANDRITZ
GROUP in areas of activity with five important stakeholder groups: employees, customers and competitors, business partners and shareholders, local authorities, and governments and legislators.
All employees, including temporary staff, must obey this code. We also expect contractors, suppliers, consult-ants, representatives, agents, and others who may be temporarily assigned to work for ANDRITZ to comply with
this Code in connection with any work or services performed on our behalf. A common understanding of correct
business conduct is considered an important foundation for further corporate development, as well as in devel-oping solutions for our customers, providing profitable growth to our shareholders or creating and maintaining a
rewarding work environment for employees. The code is also an essential element in subcontracting work to
suppliers and in daily collaboration with suppliers.
Compliance with the guide is reviewed primarily by the Compliance Group function, which reports to the Execu-
tive Board. Non-compliance with the code by employees can have serious consequences and lead to discipli-nary measures up to and including termination of employment and even to criminal prosecution in certain
instances. The consequences of non-compliance with the code on the part of suppliers, consultants or other
service providers vary according to the extent and seriousness of the violation.

34 Corporate Governance report
External evaluation of the corporate governance report
ANDRITZ AG has not yet had an external evaluation conducted on compliance with the provisions of the Austri-an Code of Corporate Governance. However, there are plans to arrange for such an external evaluation in the
next few years in accordance with the provisions of the Austrian Code of Corporate Governance.
Graz, February 2015
The Executive Board of ANDRITZ AG
Wolfgang Leitner m.p. Humbert Köfler m.p. Friedrich Papst m.p. Joachim Schönbeck m.p. Wolfgang Semper m.p.
(President and CEO)

35 Report of the Supervisory Board
The Supervisory Board and the Executive Board held five meetings (four regular meetings, one constituent meet-
ing) during the reporting period for in-depth discussions on the economic situation and strategic development of the company, as well as on major events, capital expenditures, and other measures. In the course of regular
reporting and in all meetings, the Executive Board informed the Supervisory Board extensively in writing and
verbally, by means of detailed reports on the business and financial situation of the Group and its affiliates, as well as on topics regarding human resources, medium-term planning, capital expenditure, and acquisition pro-
jects. Additional information was provided on special occurrences. The Chairman of the Supervisory Board and
the Chief Executive Officer were also in regular contact to review the company’s strategy and business devel-opment.
The Presidium of the Supervisory Board acted on behalf of the company in matters concerning the Executive Board. The nomination and remuneration committee dealt in two meetings with matters relating to the Executive
Board.
None of the members of the Supervisory Board was absent from more than half of the meetings.
Specific topics were discussed in two meetings in depth by the audit committee and subsequently reported on to the Supervisory Board. All members of the audit committee attended the committee meetings.
With regard to the financial statements for 2013, the audit committee called in the annual auditor to attend its meeting on February 27, 2014 in order to review the financial statements, consolidated financial statements, the
management report, and the Executive Board’s proposal for distribution of profits. In addition, a statement was
drawn up on the auditor designated for the 2014 business year, his legal relationship with the ANDRITZ GROUP and the members of its Boards was verified, the auditing fees were negotiated, and a recommendation for the
auditor appointment was made. Further items on the agenda were the auditor’s report on the function of the risk
management system in the company, a report on the Internal Auditing department, and the compliance report.
At the meeting of the audit committee held on December 4, 2014, the committee – with the auditor also present
– discussed organization, scheduling, and auditing of the 2014 financial statements, as well as a report by the Executive Board on the form and functioning mode of the internal control system.
The mandates of Hellwig Torggler and Peter Mitterbauer expired at the end of the Annual General Meeting on March 21, 2014. Following the recommendation by the Supervisory Board, Monika Kircher and Ralf Dieter were
elected to the Supervisory Board by the Annual General Meeting until the end of the Annual General Meeting in
2019. At the Supervisory Board meeting following the Annual General Meeting on March 21, 2014, and held on the same day, Christian Nowotny was elected as Chairman and Klaus Ritter as Deputy-Chairman of the Supervi-
sory Board. Christian Nowotny (Chairman) and Klaus Ritter (Deputy-Chairman) were elected as members of the
audit committee, as were Monika Kircher and Andreas Martiner. Christian Nowotny, Klaus Ritter, and Fritz Ober-lerchner were elected as members of the nomination and remuneration committee.
The financial statements and management report of ANDRITZ AG and the consolidated financial statements for 2014 drawn up according to IFRS were audited (including the accounts) and certified by Deloitte Audit
Wirtschaftsprüfungs GmbH, Vienna, who had been appointed as auditors by the Annual General Meeting. The
Supervisory Board examined the documents in accordance with Article 96 of the Corporation Act and approved the financial statements, which are hereby adopted in accordance with Article 96, para. 4, of the Corporation
Act; the Supervisory Board also examined and approved the Executive Board’s proposal for distribution of prof-
its. The final results of the audits conducted did not give rise to any objections.
The Supervisory Board would like to thank Hellwig Torggler and Peter Mitterbauer for their many years of
service for the ANDRITZ GROUP, characterized by their specialist knowledge and sense of responsibility.
Graz, February 2015
Christian Nowotny Chairman of the Supervisory Board
REPORT OF THE SUPERVISORY BOARD

Consolidated financial statements 2014 of the ANDRITZ GROUP Consolidated income statement 37
Consolidated statement of comprehensive income 38
Consolidated statement of financial position 39
Consolidated statement of cash flows 40
Consolidated statement of changes in equity 41
Notes to the consolidated financial statements 42
Statement by the Executive Board
pursuant to article 82 (4) of the (Austrian) Stock Exchange Act 110
Auditor’s report – consolidated financial statements 111

37 Consolidated income statement
For the 2014 financial year
(in TEUR) Notes 2014 2013
Sales 1. 5,859,269 5,710,773
Changes in inventories of finished goods and work in progress -1,460 -1,964
Capitalized cost of self-constructed assets 4,522 4,187
5,862,331 5,712,996
Other operating income 2. 122,141 120,834
Cost of materials 3. -3,154,951 -3,232,438
Personnel expenses 4. -1,573,972 -1,518,201
Other operating expenses 5. -783,552 -827,984
Earnings Before Interest, Taxes, Depreciation and Amortization (EBITDA) 471,997 255,207
Depreciation, amortization and impairment of intangible assets and property,
plant, and equipment 6. -170,549 -161,620
Impairment of goodwill 11. -5,747 -3,800
Earnings Before Interest and Taxes (EBIT) 295,701 89,787
Expense from associated companies -65 -185
Interest income 36,763 26,479
Interest expenses -37,662 -35,069
Other financial result 4,635 -735
Financial result 7. 3,671 -9,510
Earnings Before Taxes (EBT) 299,372 80,277
Income taxes 8. -89,385 -27,085
NET INCOME 209,987 53,192
Thereof attributable to:
Shareholders of the parent 210,874 66,609
Non-controlling interests -887 -13,417
Basic earnings per no-par value share (in EUR) 9. 2.04 0.64
Diluted earnings per no-par value share (in EUR) 9. 2.03 0.64
Proposed or paid dividend per no-par value share (in EUR) 23. 1.00 0.50
The following notes to the consolidated financial statements form an essential part of the present consolidated income statement.
CONSOLIDATED INCOME STATEMENT

38 Consolidated statement of comprehensive income
For the 2014 financial year
(in TEUR) Notes 2014 2013
Net income 209,987 53,192
ITEMS THAT MAY BE RECLASSIFIED SUBSEQUENTLY TO
PROFIT OR LOSS:
Currency translation adjustments
Gains/losses arising during the year 33,443 -44,211
Reclassification adjustments relating to foreign operations
disposed of in the year -9 1,402
Currency translation adjustments 33,434 -42,809
Available-for-sale financial assets L)
Available-for-sale financial assets – net change in fair value 552 -1,002
Available-for-sale financial assets – reclassified to profit or loss -54 -175
Related income taxes -93 295
Available-for-sale financial assets, net of tax 405 -882
Cash flow hedges L)
Net change in fair value -5,240 -329
Reclassification to profit or loss -273 0
Related income taxes 1,677 128
Cash flow hedges, net of tax -3,836 -201
ITEMS THAT WILL NOT BE RECLASSIFIED TO PROFIT OR
LOSS: 26.
Actuarial gains/losses -78,219 8,383
Related income taxes 18,867 -1,734
Actuarial gains/losses, net of tax -59,352 6,649
OTHER COMPREHENSIVE INCOME FOR THE YEAR -29,349 -37,243
TOTAL COMPREHENSIVE INCOME FOR THE YEAR 180,638 15,949
Thereof attributable to:
Shareholders of the parent 182,107 33,898
Non-controlling interests -1,469 -17,949
The following notes to the consolidated financial statements form an essential part of the present consolidated statement of comprehensive
income.
CONSOLIDATED STATEMENT OF COMPREHENSIVE INCOME

39 Consolidated statement of financial position
As of December 31, 2014
(in TEUR) Notes 2014 2013
ASSETS
Intangible assets 10. 242,593 309,458
Goodwill 11. 538,475 530,067
Property, plant, and equipment 12. 715,255 673,479
Other investments 14. 71,225 45,649
Trade accounts receivable 15. 62,522 16,849
Cost and earnings of projects under construction in excess of billings 19. 25,634 0
Other receivables and assets 16. 111,738 75,338
Deferred tax assets 8. 212,406 200,318
Non-current assets 1,979,848 1,851,158
Inventories 17. 693,234 673,761
Advance payments made 18. 150,207 152,786
Trade accounts receivable 15. 705,819 620,821
Cost and earnings of projects under construction in excess of billings 19. 476,549 509,534
Other receivables and assets 16. 350,339 376,368
Marketable securities 20. 154,294 159,107
Cash and cash equivalents 21. 1,457,335 1,227,860
Current assets 3,987,777 3,720,237
TOTAL ASSETS 5,967,625 5,571,395
SHAREHOLDERS’ EQUITY AND LIABILITIES
Share capital 104,000 104,000
Capital reserves 36,476 36,476
Retained earnings 857,601 759,261
Equity attributable to shareholders of the parent 998,077 899,737
Non-controlling interests 16,721 29,743
Total shareholders’ equity 23. 1,014,798 929,480
Bonds 24. 370,130 510,658
Bank loans and other financial liabilities 24. 44,803 44,483
Obligations under finance leases 24. 14,564 15,324
Provisions 25./26. 548,840 438,563
Other liabilities 27. 59,910 54,374
Deferred tax liabilities 8. 137,672 159,040
Non-current liabilities 1,175,919 1,222,442
Bonds 24. 150,839 0
Bank loans and other financial liabilities 24. 75,907 63,004
Obligations under finance leases 24. 802 962
Trade accounts payable 493,436 453,219
Billings in excess of cost and earnings of projects under construction 19. 1,203,593 1,081,412
Advance payments received 251,288 269,066
Provisions 25. 507,356 555,063
Liabilities for current taxes 46,470 39,622
Other liabilities 27. 1,047,217 957,125
Current liabilities 3,776,908 3,419,473
TOTAL SHAREHOLDERS’ EQUITY AND LIABILITIES 5,967,625 5,571,395
The following notes to the consolidated financial statements form an essential part of the present consolidated statement of financial position.
CONSOLIDATED STATEMENT OF FINANCIAL POSITION
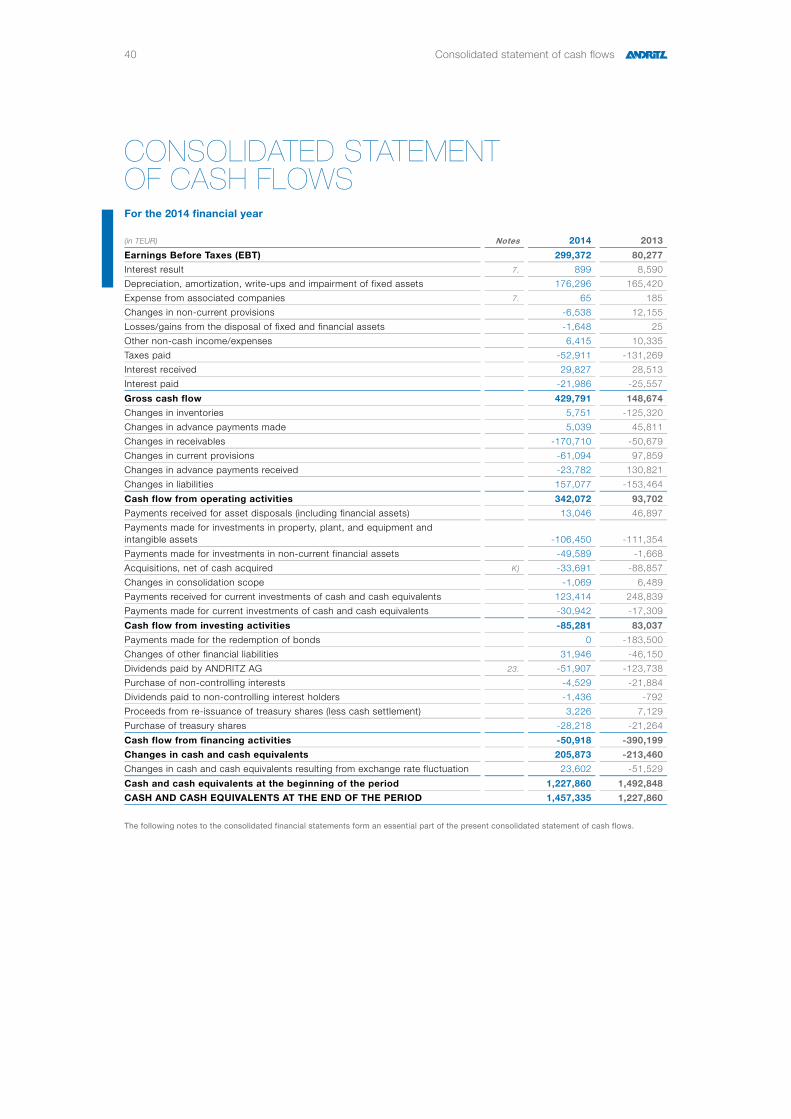
40 Consolidated statement of cash flows
For the 2014 financial year
(in TEUR) Notes 2014 2013
Earnings Before Taxes (EBT) 299,372 80,277
Interest result 7. 899 8,590
Depreciation, amortization, write-ups and impairment of fixed assets 176,296 165,420
Expense from associated companies 7. 65 185
Changes in non-current provisions -6,538 12,155
Losses/gains from the disposal of fixed and financial assets -1,648 25
Other non-cash income/expenses 6,415 10,335
Taxes paid -52,911 -131,269
Interest received 29,827 28,513
Interest paid -21,986 -25,557
Gross cash flow 429,791 148,674
Changes in inventories 5,751 -125,320
Changes in advance payments made 5,039 45,811
Changes in receivables -170,710 -50,679
Changes in current provisions -61,094 97,859
Changes in advance payments received -23,782 130,821
Changes in liabilities 157,077 -153,464
Cash flow from operating activities 342,072 93,702
Payments received for asset disposals (including financial assets) 13,046 46,897
Payments made for investments in property, plant, and equipment and
intangible assets -106,450 -111,354
Payments made for investments in non-current financial assets -49,589 -1,668
Acquisitions, net of cash acquired K) -33,691 -88,857
Changes in consolidation scope -1,069 6,489
Payments received for current investments of cash and cash equivalents 123,414 248,839
Payments made for current investments of cash and cash equivalents -30,942 -17,309
Cash flow from investing activities -85,281 83,037
Payments made for the redemption of bonds 0 -183,500
Changes of other financial liabilities 31,946 -46,150
Dividends paid by ANDRITZ AG 23. -51,907 -123,738
Purchase of non-controlling interests -4,529 -21,884
Dividends paid to non-controlling interest holders -1,436 -792
Proceeds from re-issuance of treasury shares (less cash settlement) 3,226 7,129
Purchase of treasury shares -28,218 -21,264
Cash flow from financing activities -50,918 -390,199
Changes in cash and cash equivalents 205,873 -213,460
Changes in cash and cash equivalents resulting from exchange rate fluctuation 23,602 -51,529
Cash and cash equivalents at the beginning of the period 1,227,860 1,492,848
CASH AND CASH EQUIVALENTS AT THE END OF THE PERIOD 1,457,335 1,227,860
The following notes to the consolidated financial statements form an essential part of the present consolidated statement of cash flows.
CONSOLIDATED STATEMENT OF CASH FLOWS

41 Consolidated statement of changes in equity
For the 2014 business year
Attributable to shareholders of the parent
Non-
control-
ling in-
terests
Total
share-
holders’
equity
(in TEUR) Notes
Share
capital
Capital
reserves
Other
retained
earnings
IAS 39
reserve
Actuarial
gains/
losses
Currency
trans-
lation
adjust-
ments
Treasury
shares Total
Status as of January 1, 2013 104,000 36,476 925,558 695 -30,886 -7,410 -20,940 1,007,493 26,302 1,033,795
Net income 0 0 66,609 0 0 0 0 66,609 -13,417 53,192
Other comprehensive income for the year 0 0 0 -1,076 6,673 -38,308 0 -32,711 -4,532 -37,243
Total comprehensive income for the year 0 0 66,609 -1,076 6,673 -38,308 0 33,898 -17,949 15,949
Dividends 23. 0 0 -123,738 0 0 0 0 -123,738 -792 -124,530
Changes from acquisitions 0 0 0 0 0 0 0 0 34,008 34,008
Changes through deconsolidation 0 0 27 0 -27 0 0 0 0 0
Capital increase 0 0 0 0 0 0 0 0 0 0
Changes in treasury shares 23. 0 0 -25,959 0 0 0 12,483 -13,476 0 -13,476
Changes concerning share option programs 23. 0 0 5,576 0 0 0 0 5,576 0 5,576
Transactions with non-controlling interests 0 0 -10,058 0 0 0 0 -10,058 -11,826 -21,884
Other changes 0 0 42 0 0 0 0 42 0 42
Status as of December 31, 2013 104,000 36,476 838,057 -381 -24,240 -45,718 -8,457 899,737 29,743 929,480
Status as of January 1, 2014 104,000 36,476 838,057 -381 -24,240 -45,718 -8,457 899,737 29,743 929,480
Net income 0 0 210,874 0 0 0 0 210,874 -887 209,987
Other comprehensive income for the year 0 0 0 -3,301 -58,704 33,237 0 -28,768 -581 -29,349
Total comprehensive income for the year 0 0 210,874 -3,301 -58,704 33,237 0 182,106 -1,468 180,638
Dividends 23. 0 0 -51,907 0 0 0 0 -51,907 -1,436 -53,343
Changes through deconsolidation 0 0 -830 0 0 0 0 -830 0 -830
Capital increase 0 0 11,868 0 0 -2,697 0 9,171 -8,033 1,138
Changes in treasury shares 23. 0 0 -1,641 0 0 0 -24,490 -26,131 0 -26,131
Changes concerning share option programs 23. 0 0 6,104 0 0 0 0 6,104 0 6,104
Transactions with non-controlling interests 0 0 -2,401 0 -4 -33 0 -2,438 -2,090 -4,528
Other changes 0 0 -17,642 -2 -53 -38 0 -17,735 5 -17,730
Status as of December 31, 2014 104,000 36,476 992,482 -3,684 -83,001 -15,249 -32,947 998,077 16,721 1,014,798
The following notes to the consolidated financial statements form an essential part of the present consolidated statement of changes in equity.
CONSOLIDATED STATEMENT OF CHANGES IN EQUITY

42 Notes to the consolidated financial statements
As of December 31, 2014
A) GENERAL ANDRITZ AG is incorporated under the laws of the Republic of Austria and has been listed on the Vienna Stock
Exchange since June 2001. The ANDRITZ GROUP (the “Group” or “ANDRITZ”) is a leading producer of high-technology industrial machinery and operates through four strategic business areas: HYDRO, PULP & PAPER,
METALS, and SEPARATION.
The average number of employees in the Group amounted to 24,211 in 2014 and 22,908 in 2013. The regis-
tered office address of the Group’s headquarters is at Stattegger Strasse 18, 8045 Graz, Austria.
The consolidated financial statements are the responsibility of the Executive Board and are acknowledged by
the Supervisory Board.
Various amounts and percentages set out in these consolidated financial statements have been rounded. As a
result, totals may differ from the amounts shown. If not stated otherwise, amounts are given in thousands of
euros.
B) ACCOUNTING PRINCIPLES The financial statements were prepared in accordance with all International Financial Reporting Standards (IFRS)
published by the International Accounting Standards Board (IASB) and endorsed by the European Union; appli-cation of these standards is mandatory for 2014. All interpretations published by the International Financial
Reporting Interpretations Committee (IFRIC), which must also be observed for 2014, have been applied. The
consolidated financial statements meet the requirements of Section 245a UGB (Austrian Commercial Code) on exempting consolidated financial statements according to internationally recognized accounting standards.
The International Accounting Standards Board (IASB) is working on numerous projects. In 2014, the following mandatory amendments to standards are to be considered:
Standard/Interpretation Title
Effective for annual
financial statements
for periods beginning
on or after
Endorsement by
EU
IFRS 10 Consolidated financial statements January 1, 2014 December 29, 2012
IFRS 11 Joint arrangements January 1, 2014 December 29, 2012
IFRS 12 Disclosures of interests in other entities January 1, 2014 December 29, 2012
IAS 27 (as revised in
2011) Separate financial statements January 1, 2014 December 29, 2012
IAS 28 (as revised in
2011) Investments in associates and joint ventures January 1, 2014 December 29, 2012
IAS 32 (as revised in
2011)
Offsetting of financial assets and financial
liabilities January 1, 2014 December 29, 2012
The guidelines contained in IAS 27 and SIC 12 dealing with controlling and consolidation in consolidated finan-cial statements is replaced by the IFRS 10 published. The notes for consolidated companies and non-
consolidated special-purpose entities (so-called structured companies) will be determined by IFRS 12.
In order to consolidate a company, it is still necessary to be able to control the other company, although the
term “control” has been modified slightly compared to IAS 27. According to IFRS 10, a controlling relationship
assumes the power of disposition, (positive and/or negative) rates of return, as well as a link between power of disposition and rates of return. Power of disposition is considered to be the means of controlling those activities
by the associated company that have a substantial influence on the variable returns.
Power of disposition can be verified by means of voting rights or other contract rights. An investor has the power
of disposition if he owns more than 50% of the voting rights in an associated company and if there are no other
agreements or circumstances preventing this.
The IFRS 11 standard replaces the regulations in IAS 31 and SIC 13. IFRS 11 abolishes the possibility of propor-
tionate consolidation for joint ventures. This option was available according to IAS 31 in addition to inclusion at equity.
NOTES TO THE CONSOLIDATED FINANCIAL STATEMENTS

43 Notes to the consolidated financial statements
According to IFRS 11, a joint arrangement must be examined to determine whether it is a joint venture or a joint
operation. If it is a joint venture, it is basically mandatory to apply the equity method. If it is a joint operation, the assets, liabilities, income, and expenses must be accounted for proportionately in the consolidated financial
statements. The disclosure of joint arrangements in the notes is specified by IFRS 12.
ANDRITZ generally holds significantly more than 50% of the voting rights in its main subsidiaries and therefore
the new standards do not have any substantial influence on the consolidated financial statements.
Adjustments to IAS 27, IAS 28, and IAS 32 do not have any substantial influence on the consolidated financial
statements.
C) STANDARDS THAT HAVE BEEN PUBLISHED BUT NOT YET APPLIED ANDRITZ has not adopted the following accounting pronouncements that have been issued by the IASB, but are
not yet in effect:
Standard/Interpretation Title
Effective for annual
financial statements
for periods
beginning on or after
Endorsement by
EU
IAS 19 Change of defined benefit plans: employee
contributions January 1, 2015 pending
IFRS 14 Regulatory deferral accounts January 1, 2016 pending
IFRS 11 Change of accounting of interests in joint
operations January 1, 2016 pending
IAS 16 and IAS 38 Clarification of acceptable methods of
depreciation and amortization January 1, 2016 pending
IAS 16 and IAS 41 Change of agriculture; bearer plants January 1, 2016 pending
IFRS 10 and IAS 28 Change of sale or contribution of assets
between an investor and its associate or
joint venture January 1, 2016 pending
IFRS 10, IFRS 12, and IFRS
28
Change of investment entities - exception
from consolidation January 1, 2016 pending
IAS 1 Change; disclosure initiative January 1, 2016 pending
IFRS 15 Revenue from contracts with customers January 1, 2017 pending
IFRS 9 Financial instruments January 1, 2018 pending
This list contains an extract of the changes that may be relevant for ANDRITZ.
IFRS 15 establishes a comprehensive framework for determining, whether, how much, and when revenue is
recognized. It replaces existing revenue recognition guidance, including IAS 18 Revenue, IAS 11 Construction Contracts, and IFRIC 13 Customer Loyalty Programs. IFRS 15 is effective for annual reporting periods beginning
on or after January 1, 2017.
IFRS 9, published in July 2014, replaces the existing guidance in IAS 39 Financial Instruments. IFRS 9 includes
revised guidance on the classification and measurement of financial instruments, including a new expected
credit loss model for calculating impairment on financial assets, and the new general hedge accounting require-ments. It also carries forward the guidance on recognition and derecognition of financial instruments from IAS
39. IFRS 9 is effective for annual reporting periods beginning on or after January 1, 2018.
ANDRITZ is assessing the potential impact on its consolidated financial statements resulting from the application
of IFRS 15 and IFRS 9.
The other new or amended standards mentioned in the table are not expected to have any significant impact on
the consolidated financial statements.

44 Notes to the consolidated financial statements
D) CONSOLIDATION GROUP The consolidated financial statements include ANDRITZ AG and those it controls, where their influence on the assets, liabilities, financial position, and profit or loss of the Group is not of minor importance (see note S, Group
companies).
The consolidation scope changed as follows during the financial year:
2014 2013
Full consolidation Equity method Full consolidation Equity method
Balance as of January 1 146 3 117 4
Acquisition of companies 6 0 33 0
Disposal of companies 0 0 0 0
Changes in consolidation type
Additions 0 0 6 0
Disposals -3 0 -5 -1
Reorganization -10 0 -5 0
Balance as of December 31 139 3 146 3
Thereof attributable to:
Domestic companies 7 0 7 0
Foreign companies 132 3 139 3
Due to their minor importance for the assets, liabilities, financial position, and profit or loss, 59 subsidiaries
(2013: 60) were not included. These subsidiaries are recognized as investments in non-consolidated companies at cost less any impairment losses in “Other investments”. The influence of the non-consolidated subsidiaries,
both individually and overall, on the net assets, financial position, and results of operations of the Group was of
minor importance.
E) ACQUISITIONS Herr-Voss Stamco, Inc. In November 2014, the ANDRITZ GROUP acquired Herr-Voss Stamco Inc., headquartered in Callery, Pennsylva-
nia, USA for 32,270 TEUR. The company has about 300 employees and generates annual sales of approximate-
ly 50 MEUR.
Herr-Voss Stamco generates a major portion of its sales with service business. In addition to a very comprehen-
sive service portfolio, the company is one of the leading suppliers of coil and sheet metal processing solutions for both ferrous and non-ferrous applications worldwide. Herr-Voss Stamco was established 100 years ago and
has around 1,600 customer references inside and outside North America. Many of these customers operate in
the currently buoyant North American automotive and oil and gas industries.
Certain assets of ABB Schweiz AG
The ANDRITZ GROUP acquired certain assets and employees of the hydrogenerator service business sector of ABB Schweiz AG in order to strengthen the service basis for hydrogenerators in Switzerland.
ANDRITZ Hydro AFI Inc. In 2014, ANDRITZ established ANDRITZ Hydro AFI Inc., with its headquarters in Paris, Ontario, Canada, for the
acquisition of assets in the amount of 3,227 TEUR from the former AFI Hydro Inc., Canada. For the HYDRO (HY)
business area, this acquisition provides a boost in engineering, manufacture, and maintenance of gates for hydropower plants.
The aggregated purchase price of the business combinations effected in 2014 amounted to 35,497 TEUR, while direct costs of acquisition amounted to 309 TEUR.

45 Notes to the consolidated financial statements
The total of the estimated fair values of the assets acquired and liabilities assumed for the acquisitions on the
basis of exchange rates as per dates of transactions are as follows:
(in TEUR)
IFRS net book
value
Fair value
allocations Fair value
Intangible assets 37 9,343 9,380
Property, plant, and equipment 20,146 0 20,146
Inventories 7,128 0 7,128
Trade and other receivables 10,935 0 10,935
Liabilities -20,240 -2,372 -22,612
Non-interest bearing net assets 18,006 6,971 24,977
Marketable securities 0 0 0
Cash and cash equivalents 1,806 0 1,806
Financial assets 0 0 0
Financial liabilities -89 0 -89
Goodwill 0 8,803 8,803
Non-controlling interests 0 0 0
Net assets 19,723 15,774 35,497
Since their acquisition, these companies have contributed 9,543 TEUR to the ANDRITZ GROUP’s sales and
-1,417 TEUR to the ANDRITZ GROUP’s EBIT. If the businesses had been acquired at the beginning of 2014, the
impact on consolidated sales would have been 48,492 TEUR and 1,763 TEUR on the Group’s EBIT.
Initial accounting for the businesses acquired in 2014 is based on preliminary figures.
Acquisitions in 2013
The Group acquired the remaining 50% of Modul Systeme Engineering AG (including its subsidiaries), a compa-
ny headquartered in Laufen, Germany. The net assets recognized in the consolidated financial statements as of December 31, 2013 were based only on a preliminary assessment of the fair value.
The details were adjusted in accordance with IFRS 3 to illustrate the correction of the preliminary amounts. The goodwill and pension obligations were adjusted by 577 TEUR.
F) ACCOUNTING AND VALUATION PRINCIPLES The principal accounting policies adopted in preparing the consolidated financial statements of ANDRITZ are as
follows:
a) Consolidation principles
The separate financial statements of all fully consolidated companies compiled in accordance with uniform
standards throughout the Group and complying with IFRS provisions form the basis of the consolidated financial statements.
Inter-company receivables, liabilities, and internal service charges, including interim results within the Group, were eliminated. The consolidated financial statements were compiled on the basis of uniform accounting prin-
ciples for comparable business transactions.
Business combinations are accounted for by applying the acquisition method, whereby the purchase price is
offset against the proportional share in the acquired company’s net assets (capital consolidation). In doing so,
the values at the acquisition date that corresponds to the date at which control of the acquired company was attained are used as a basis. The acquired identifiable assets, liabilities and contingent liabilities are generally
recognized at their fair values irrespective of the extent attributable to non-controlling interests.
Application of the acquisition method requires certain estimates and assumptions to be made, especially con-
cerning the fair values of the intangible assets and of the property, plant, and equipment acquired, of the liabili-
ties assumed at the acquisition date, and of the useful lives of the intangible assets and of the property, plant, and equipment acquired.
Non-controlling interests can be measured either at cost (partial goodwill method) or at fair value (full goodwill method). The choice of method can be made on a case-to-case basis. It is the general practice within the
ANDRITZ GORUP to use the partial goodwill method.

46 Notes to the consolidated financial statements
In step acquisitions, where a company is acquired in several stages, the fair values of the acquired entity’s as-
sets and liabilities are measured in accordance with IFRS 3 (Business Combinations) at the date on which con-trol is obtained. Any resulting adjustments to the fair value of the existing interest are recognized in profit or loss.
The carrying amount of the assets and liabilities already recognized in the statement of financial position is then
adjusted accordingly.
b) Subsidiaries
Subsidiaries are entities controlled by the Group. The Group controls an entity when it is exposed to, or has rights to, variable returns from its involvement with the entity and has the ability to affect those returns through
its power over the entity. The financial statements of subsidiaries are included in the consolidated financial
statements from the date on which control commences until the date on which control ceases.
Changes in the Group's interest in a subsidiary that do not result in a loss of control are accounted for as equity
transactions.
When the Group loses control over a subsidiary, it derecognizes the assets and liabilities of the subsidiary, and
any related non-controlling interests and other components of equity. Any resulting gain or loss is recognized through profit or loss.
c) Currency conversion The consolidated financial statements are compiled in euros.
Foreign currency transactions Foreign currency transactions are recorded in the functional currency by applying the exchange rate between
the functional currency and the foreign currency at the date of the transaction. Exchange rate differences arising
on the settlement of monetary items at rates different from those at which they were initially recorded during the periods are recognized in the income statement in the period in which they arise.
Foreign subsidiaries Foreign consolidated subsidiaries are regarded as foreign entities since they are financially, economically, and
organizationally autonomous. Their functional currencies are the respective local currencies. Financial state-
ments of foreign consolidated subsidiaries are translated at year-end rates to the presentation currency (EUR) with respect to the statement of financial position. Expenses and income are translated using the average ex-
change rates for the year. All resulting translation differences are included in currency translation adjustments in
equity.
The major exchange rates used for foreign currency translation changed as follows during the reporting year:
In number of units
per 1 EUR Rate at reporting date Average rate for year
Currency December 31, 2014 December 31, 2013 2014 2013
BRL Brazilian real 3.22 3.26 3.13 2.87
CAD Canadian dollar 1.41 1.47 1.47 1.37
CHF Swiss franc 1.20 1.23 1.21 1.23
CNY Chinese yuan 7.54 8.35 8.17 8.23
DKK Danish kroner 7.45 7.46 7.46 7.46
GBP Pound sterling 0.78 0.83 0.81 0.85
INR Indian rupee 76.72 85.37 81.09 77.88
SEK Swedish kronor 9.39 8.86 9.10 8.66
USD US dollar 1.21 1.38 1.33 1.33
d) Intangible assets
Intangible assets are accounted for at cost. After initial recognition, intangible assets are accounted for at cost less accumulated amortization and any accumulated impairment losses. With the exception of goodwill, the
intangible assets have a specific useful life and are therefore amortized on a straight-line basis over the best
estimate of their useful lives. The amortization period and the amortization method are reviewed annually at each financial year-end.
Intangible assets are reviewed for impairment losses whenever events or changes in circumstances indicate that the net book value of an asset may be higher than the amount recoverable (the higher of fair value less costs-to-

47 Notes to the consolidated financial statements
sell and value-in-use of an asset or of a cash-generating unit). Whenever the net book value of an asset exceeds
its recoverable amount, an impairment loss is recognized.
Amounts paid for concessions, industrial rights, and similar rights are capitalized and then amortized on a
straight-line basis over the expected useful life. The expected useful life lies between 3 and 15 years. Intangible assets acquired as a result of business combinations are customer relations, order backlog, technology, and
brand names. Their useful lives in certain transactions lie between 3 and 10 years for customer relationship,
between 1 and 3 years for order backlog, between 3 and 10 years for technology, and amount to 10 years for brand names.
Research and development costs Expenses for development work are capitalized if a newly developed product or process can be clearly defined,
is feasible from a technical, economic and capacity point of view, and if the company intends to use the product
or process itself or to market the product or process. Furthermore, capitalization requires the expenses attribut-able to the intangible asset to be measured reliably during the development period and covered by future cash
inflows with a sufficient degree of probability after their completion. Expenses for development work meeting
these criteria are capitalized at production cost. The production costs include all costs directly attributable to the development process as well as a reasonable portion of the overheads relating to development. If there is no
previous indication of possible impairment, the capitalized costs are checked annually for impairment losses up
to completion of a development project. After completion, the capitalized development expenses are amortized as scheduled over the expected life cycle of the products.
Expenses for research are recognized directly through profit or loss.
e) Goodwill
IFRS 3 has been applied for business combinations and any resulting goodwill. According to this standard, goodwill is measured as the residual of the cost of the business combination after recognizing the acquired
identifiable assets, liabilities, and contingent liabilities at fair value. Following a review of the amounts stated, the
resulting value from the comparison of cost and fair value of the net assets of the acquired negative goodwill is recognized immediately in the income statement.
Any goodwill arising from business combinations is not amortized. However, it is tested for impairment losses in accordance with IAS 36 at least annually or more frequently if events or changes in circumstances indicate that
it might be impaired. In determining whether the recognition of an impairment loss is required, goodwill is allo-
cated to the cash-generating units that are expected to benefit from the synergies of the business combination. If the net book value exceeds the value-in-use that is calculated by using a Discounted Cash-Flow (DCF) calcu-
lation and the fair value less costs of disposal is not higher, an impairment loss is recognized. An impairment
loss recognized for goodwill will not be reversed in a subsequent period.
Future payment surpluses are based on internal forecasts, which are prepared in detail for the next financial year
and with simplifications for the following two years, and reflect the historical performance and best estimates on future developments. The discount rate used for DCF calculation is based on an interest rate representing the
actual assessment of possible changes in exchange rates as well as specific risks of an asset. In consideration
of the applicable currency and the corresponding risk profile, a discount rate between 8.59% and 17.24% (2013: between 8.52% and 15.30%) was applied before tax.
Substantial goodwill was allocated at the acquisition date to existing cash-generating units of ANDRITZ AG (1999), of the pulp business acquired through the ANDRITZ-Ahlstrom Group (2000/2001), of the
VA TECH HYDRO Group in the HYDRO business area (2006), and of the Schuler Group (2013). As the composi-
tion of the original cash-generating units has changed in the course of time due to reorganizations and changes in the reporting structure, the goodwill was reallocated accordingly.
f) Property, plant, and equipment Property, plant, and equipment are stated at cost less accumulated depreciation and amortization, and any
accumulated impairment losses. When assets are sold or retired, their costs and accumulated depreciation and
amortization are eliminated from the accounts and any gain or loss resulting from their disposal is included in the income statement.
The cost of property, plant, and equipment comprises its purchase price, including import duties and non-refundable purchase taxes, and any directly attributable costs of putting the asset into working condition and
bringing it to the appropriate location for its intended use. Expenditure incurred after the fixed assets have been
put into operation, such as repair, maintenance, and overhaul costs, is charged to the income statement in the

48 Notes to the consolidated financial statements
period in which the costs are incurred. Depreciation and amortization is calculated on a straight-line basis over
estimated useful life as follows:
Buildings 20-50 years
Technical equipment, and machinery 4-10 years
Tools, office equipment, and vehicles 3-10 years
The useful life and the depreciation and amortization methods are reviewed periodically to ensure that the meth-
od and period of depreciation and amortization are consistent with the expected pattern of economic benefits
from items of property, plant, and equipment.
Assets under construction are considered as plant and properties under construction and are stated at cost.
These include production costs and other direct costs.
Property, plant, and equipment are reviewed for impairment losses whenever events or changes in circumstances
indicate that the net book value of an asset may be higher than the amount recoverable (the higher amount of fair value less costs-to-sell and value-in-use of an asset or of a cash-generating unit). Whenever the net book
value of an asset exceeds its recoverable amount, an impairment loss is recognized. Recoverable amounts are
estimated for individual assets or, if this is not possible, for the cash-generating unit.
Government grants
Investment grants are deducted from the cost of the asset. Grants related to income are recorded as other operating income in the income statement.
Borrowing costs Borrowing costs that are directly attributable to the acquisition, construction, or production of a qualifying asset
are generally capitalized as part of the cost of the asset. All other costs of borrowing are expensed in the period
in which they are incurred.
g) Leases
A lease is an agreement whereby the lessor assigns to the lessee the right to use an asset for an agreed period of time in return for a payment or series of payments. Leases are classified as either finance or operating leases.
Leasing transactions that transfer substantially all the risks and reward incidental to ownership of the leased
asset to the lessee are classified as finance leases. All other leasing agreements are classified as operating leases. Where ANDRITZ is the lessee in a finance lease, the leased asset is capitalized at the lower of the fair
value or present value of the minimum lease payments at the beginning of the lease term and recognized simul-
taneously under financial liabilities. The leased asset is depreciated by the straight-line method over the ex-pected useful life or, where shorter, over the term of the relevant lease. Where the Group is the lessee in an
operating lease, the lease payments are generally expensed on a straight-line basis over the term of the leasing
agreement. The leased asset remains on the balance sheet of the lessor under property, plant, and equipment.
h) Shares in associated companies
The Group's interests in equity-accounted investees comprise interests in associated companies. There are no interests in joint ventures.
Associated companies are those entities in which the Group has significant influence, but not control or joint control over the financial and operating policies. A joint venture is an arrangement in which the Group has joint
control, whereby the Group has rights to the net assets of the arrangement rather than rights to its assets and
obligations for its liabilities.
i) Other investments
These non-current assets consist primarily of non-current securities, loans against borrowers’ notes, shares in non-consolidated companies, and other shares.
Non-current securities and loans against borrowers’ notes are initially recognized at cost including transaction costs and are classified as available-for-sale investments. In subsequent periods, marketable securities are
valued at fair value. Changes in these fair values are recognized as other comprehensive income in equity until
the security is disposed of or an impairment loss is recognized. In this case, the cumulative change previously recognized in equity is included in the income statement of the period. Interest income is recognized directly in
the income statement for the period in which it is incurred.

49 Notes to the consolidated financial statements
Equity instruments that do not have a quoted market price in an active market and whose fair value cannot be
reliably measured are recorded at cost. This relates to other shares and shares in non-consolidated companies.
Financial assets classified as loans and receivables are measured at amortized costs using the effective interest
method less any impairment losses.
j) Trade accounts receivable
Receivables are initially recognized at fair value and then at amortized cost after valuation allowances for doubt-ful accounts.
k) Inventories Inventories, including work in progress and unfinished services, are valued at the lower of purchase or produc-
tion cost and net realizable value after valuation provisions for obsolete and slow-moving items. The net realiza-
ble value is the selling price in the ordinary course of business minus costs of completion, marketing, and distribution. Cost is determined primarily on the basis of the FIFO method. For processed inventories, cost
includes the applicable allocation of fixed and variable overhead costs. Unrealizable inventory is fully written off.
Contracts other than construction contracts are valued at production cost. For these contracts, sales are recog-nized when the ownership of the goods is transferred (“completed contract method”).
l) Construction contracts Receivables from construction contracts and the related sales are accounted for using the percentage of com-
pletion method. The construction contracts are characterized that they are agreed on the basis of individual
contract terms at fixed prices. The extent of completion (“stage of completion”) is established by the cost-to-cost method. Reliable estimates of the total costs and sales prices and the actual figures of the accumulated
costs are available on a monthly basis. Estimated contract profits are recorded in earnings in proportion to
recorded sales. In the cost-to-cost method, sales and profits are recorded in consideration of the ratio of accu-mulated costs to the estimated total costs to complete each contract. Changes to total estimated contract
costs and losses, if any, are recognized in the income statement for the period in which they are determined. For
remaining technological and financial risks that might occur during the remaining construction period, an individ-ually assessed amount is included in the estimated contract costs. Impending losses out of the valuation of
construction contracts are recognized when it is probable that the total contract costs will exceed the contract
sales. For possible customer warranty claims, provisions are accounted for according to the profit realization. Upon completion of a contract, the remaining warranty risk is reassessed.
m) Marketable securities Marketable securities consist of government bonds, bonds and securities of top-rated banks, money market
funds and funds. They are held for the purpose of investing liquid funds and are not generally intended to be
retained on a long-term basis. Marketable securities are initially recognized at fair value plus transaction costs, and are classified as available-for-sale investments. In subsequent periods, marketable securities are valued at
fair value. Changes in these fair values are recognized as other comprehensive income until the security is dis-
posed of or impaired losses are applied. In case of a significant and not merely temporary decline in value, impairment losses are recognized in the income statement for the period concerned.
n) Cash and cash equivalents Cash includes cash in hand and cash at banks. It may also include cash equivalents comprising short-term
investments that have original maturities of three months or less and are not subject to any risk of change in
value.
o) Share capital
Only ordinary shares exist, and all shares have been issued and have the same rights.
The share capital of ANDRITZ AG amounts to 104,000 TEUR, divided into 104 million shares of no-par value.
p) Capital reserves
Capital reserves are created in accordance with Austrian legal requirements and include share premium
amounts.
q) Retained earnings
Retained earnings particularly include retained income, IAS 39 reserve, actuarial gains and losses, and currency translation adjustments.

50 Notes to the consolidated financial statements
r) Provisions
A provision is recognized when, and only when, the enterprise has a current obligation (legal or constructive) as a result of a past event and it is probable (i.e. more likely than not) that an outflow of resources embodying
economic benefits will be required to settle the obligation, and a reliable estimate can be made of the amount of
the obligation. Provisions are reviewed at each balance sheet date and adjusted to reflect the current best esti-mate. Where the effect of the time value of money is significant, the amount of a provision is the present value of
the expenditure expected to be required to settle the obligation.
s) Employee benefits
Pension obligations
A number of Group companies provide defined benefit pension plans to certain employees. The obligations are valued every year by professionally qualified independent actuaries. The obligations and expenses arising from
pension benefits are determined using the projected unit credit method. The projected unit credit method con-
siders each period of service as giving rise to an additional unit of benefit entitlement and measures each unit separately to build up the final obligation. The plan assets are deducted at fair value from this gross pension
benefit obligation. This results in the net debt and the net asset value, respectively, to be reported.
Due to the net interest approach, the Group determines the net interest cost (net interest revenue) by multiplying
the net debt (net asset value) at the beginning of the period by the interest rate based on discounting of the
performance-related gross pension benefit obligation at the beginning of the period. The net interest component resulting from pension benefit obligations and plan assets is included in the consolidated income statement
under interest result.
All remeasurement effects are shown in other comprehensive income. The remeasurement component includes
the actuarial gains and losses from measurement of the performance-related gross pension benefit obligation on
the one hand and the difference between actually realized return on plan assets and the typically assumed re-turn on the other hand. In the event that the plan has been overfunded, the remeasurement component also
contains the change in net asset value from applying the asset ceiling if this has not been considered in the net
interest component.
If the present value of a defined benefit obligation changes as a result of plan changes or curtailments, ANDRITZ
shows the resulting effects in the gains and losses for the period. Past service costs are generally recognized at the time the plan change occurs.
The pension obligation is measured at the present value of estimated future cash flows using different discount rates for different countries.
Other Group companies provide defined contribution plans for certain employees. The related costs are ex-pensed as they occur.
Severance obligations In some countries it is legally obligated to make severance payments in certain cases of termination of employ-
ment. No severance payments are made in the event of a voluntary resignation by the employee. Appropriate
provisions are made for severance obligations. The obligations are valued every year by professionally qualified independent actuaries. The obligations and expenses arising out of pension benefits are determined using the
projected unit credit method. The projected unit credit method considers each period of service as giving rise to
an additional unit of benefit entitlement and measures each unit separately to build up the final obligation. The plan assets are deducted at fair value from this gross obligation. This results in the net debt and the net asset
value, respectively, to be reported.
Due to the net interest approach, the Group determines the net interest expense (net interest earnings) by multi-
plying the net debt (net asset value) at the beginning of the period by the interest rate based on discounting of
the gross obligation at the beginning of the period. The net interest component resulting from severance pay-ment obligations and plan assets are included in the consolidated income statement under interest result.
All revaluation effects are shown in other comprehensive income. The revaluation component includes the actu-arial gains and losses from measurement of the gross obligation on the one hand, and the difference between
actually realized return on plan assets and the typically assumed return on the other hand. In the event that the
plan has been overfunded, the revaluation component also contains the change in net asset value from applying the asset ceiling if this has not been considered in the net interest component.

51 Notes to the consolidated financial statements
If the present value of a defined benefit obligation changes as a result of plan changes or curtailments, ANDRITZ
shows the resulting effects in the gains and losses for the period. Past service costs are generally recognized at the time the plan change occurs.
The pension obligation is measured at the present value of estimated future cash flows using different discount rates for different countries.
Other Group companies provide defined contribution plans for certain employees. The related costs are ex-pensed as they occur.
t) Management share option programs Share Option Program 2010
The 103rd Annual General Meeting held on March 26, 2010 adopted a share option program for managers and
members of the Executive Board. The number of options granted to the different managers varies – depending on the area of responsibility – between 12,000, 20,000, 30,000, and 40,000 shares for managers, 80,000 for
Executive Board members, and 100,000 for the Chief Executive Officer (CEO). The options are to be drawn from
the pool of shares bought back under the corporate share buy-back program. One share option entitles the holder to the purchase of one share. In order to exercise a share option, eligible persons must have been in
active employment with ANDRITZ AG or one of its affiliates as from May 1, 2010 until each date of exercise of
an option. Another requirement is that managers must have invested at least 20,000 EUR in ANDRITZ shares from their own resources, and members of the Executive Board at least 40,000 EUR.
The exercise price of the option is the unweighted average closing price of ANDRITZ shares in the four calendar weeks following the 103rd Annual General Meeting held on March 26, 2010.
The options can be exercised between May 1, 2013 and April 30, 2015 (i.e. period of exercise) provided that the average unweighted closing price of the ANDRITZ share over twenty consecutive trading days within the period
from May 1, 2012 to April 30, 2013 is at least 15% above the exercise price and the earnings per share in the
2011 financial year (based on the total number of shares listed); or the earnings per share in the 2012 financial year (based on the total number of shares listed) are at least 15% above the earnings per share in the 2009
financial year (based on the total number of shares listed); or the average unweighted closing price of the
ANDRITZ share over twenty consecutive trading days within the period from May 1, 2013 to April 30, 2014 is at least 20% above the exercise price and the earnings per share in the 2012 financial year (based on the total
number of shares listed); or the earnings per share in the 2013 financial year (based on the total number of
shares listed) are at least 20% above the earnings per share in the 2009 financial year (based on the total num-ber of shares listed).
If the conditions of exercise are met, 50% of the options can be exercised immediately, 25% after three months, and the remaining 25% after a further three months. Share options can only be exercised by way of written
notification to the company. The share options are not transferable. The shares purchased under the share
option program are not subject to a ban on sales over a certain period.
The options granted in 2010 totaled 2,066,000. The fair value of the options at the time of granting amounted to
8,362 TEUR, where no expense was recognized in 2014. The calculation of fair value was based on an option pricing model. The share price at the time of granting the options was the closing price of the ANDRITZ share on
May 4, 2010 and amounted to 22.34 EUR. The exercise price of 23.18 EUR was calculated in accordance with
the rules of the share option program. A period of three years was assumed for the duration of the options. The expected dividend yield was fixed at 2.5%, using a discount rate of 4.8%. The value published by the Vienna
Stock Exchange was applied as expected volatility. No further option granting parameters were used in the
calculation.
Share Option Program 2012
The 105th Annual General Meeting held on March 22, 2012 adopted another share option program for managers and members of the Executive Board. The number of options granted to the different managers varies – de-
pending on the area of responsibility – between 12,000, 20,000, 30,000 and 40,000 shares for managers,
80,000 for Executive Board members, and 100,000 for the Chief Executive Officer (CEO). The options are to be drawn from the pool of shares bought back under the corporate share buy-back program. One share option
entitles the holder to the purchase of one share. In order to exercise a share option, eligible persons must have
been in active employment with ANDRITZ AG or one of its affiliates as from May 1, 2012 until each date of exer-cise of an option. Another requirement is that managers must have invested at least 20,000 EUR in ANDRITZ
shares from their own resources, and members of the Executive Board at least 40,000 EUR.

52 Notes to the consolidated financial statements
The exercise price of the option is the unweighted average closing price of ANDRITZ shares in the four calendar
weeks following the 105th Annual General Meeting held on March 22, 2012.
The options can be exercised between May 1, 2015 and April 30, 2017 (i.e. period of exercise) provided that the
average unweighted closing price of the ANDRITZ share over twenty consecutive trading days within the period from May 1, 2014 to April 30, 2015 is at least 15% above the exercise price and the earnings per share in the
2013 financial year (based on the total number of shares listed); or the earnings per share in the 2014 financial
year (based on the total number of shares listed) are at least 15% above the earnings per share in the 2011 financial year (based on the total number of shares listed); or the average unweighted closing price of the
ANDRITZ share over twenty consecutive trading days within the period from May 1, 2015 to April 30, 2016 is at
least 20% above the exercise price and the earnings per share in the 2014 financial year (based on the total number of shares listed); or the earnings per share in the 2015 financial year (based on the total number of
shares listed) are at least 20% above the earnings per share in the 2011 financial year (based on the total num-
ber of shares listed).
If the conditions of exercise are met, 50% of the options can be exercised immediately, 25% after three months,
and the remaining 25% after a further three months. Share options can only be exercised by way of written notification to the company. The share options are not transferable. The shares purchased under the share
option program are not subject to a ban on sales over a certain period.
The options granted in 2012 totaled 2,146,000. The fair value of the options at the time of granting amounts to
13,553 TEUR, thereof 4,518 TEUR have been reported as proportionate expense in 2014. The calculation of fair
value was based on an option pricing model. The share price at the time of granting the options was the closing price of the ANDRITZ share on May 11, 2012 and amounts to 39.17 EUR. The exercise price of 37.15 EUR was
calculated in accordance with the rules of the share option program. A period of 3.2 years was assumed for the
duration of the options. The expected dividend yield was fixed at 2.5%, using a discount rate of 1.25%. The expected volatility was calculated on the basis of the historical development of the ANDRITZ share during the
38 months preceding the grant.
Share Option Program 2014
The 107th Annual General Meeting held on March 21, 2014 adopted another share option program for managers
and members of the Executive Board. The number of options granted to the different managers can be up to 20,000 depending on the respective area of responsibility, and up to 37,500 for the members of the Executive
Board. The options are to be drawn from the pool of shares bought back under the corporate share buy-back
program. One share option entitles the holder to the purchase of one share. In order to exercise a share option, eligible persons must have been in active employment with ANDRITZ AG or one of its affiliates as from
May 1, 2014 until the date of exercise of an option. Another requirement is that managers must have invested at
least 20,000 EUR in ANDRITZ shares from their own resources, and members of the Executive Board at least 40,000 EUR.
The exercise price of the option is the unweighted average closing price of ANDRITZ shares in the four calendar weeks following the 107th Annual General Meeting held on March 21, 2014.
The options can be exercised between May 1, 2017 and April 30, 2019 (i.e. period of exercise) provided that the average unweighted closing price of the ANDRITZ share over twenty consecutive trading days within the period
from May 1, 2016 to April 30, 2017 is at least 15% above the exercise price and the earnings per share in the
2015 financial year (based on the total number of shares listed); or the earnings per share in the 2016 financial year (based on the total number of shares listed) are at least 20% above the earnings per share in the 2012
financial year (based on the total number of shares listed); or the average unweighted closing price of the
ANDRITZ share over twenty consecutive trading days within the period from May 1, 2017 to April 30, 2018 is at least 20% above the exercise price and the earnings per share in the 2016 financial year (based on the total
number of shares listed); or the earnings per share in the 2017 financial year (based on the total number of
shares listed) are at least 25% above the earnings per share in the 2012 financial year (based on the total num-ber of shares listed).
If the conditions of exercise are met, 50% of the options can be exercised immediately, 25% after three months, and the remaining 25% after a further three months. Share options can only be exercised by way of written
notification to the company. The share options are not transferable. The shares purchased under the share
option program are not subject to a ban on sales over a certain period.
The options granted in 2014 totaled 1,012,500. The fair value of the options at the time of granting amounts to
8,159 TEUR; 1,586 TEUR thereof were reported as proportionate expense in 2014. The calculation of fair value

53 Notes to the consolidated financial statements
was based on an option pricing model. The share price at the time of granting the options was the closing price
of the ANDRITZ share on June 2, 2014 and amounts to 43.36 EUR. The exercise price of 44.42 EUR was calcu-lated in accordance with the rules of the share option program. The expected dividend yield was fixed at 2.5%.
As discount rate an interpolated value of German benchmark bonds was used. The expected volatility was
calculated on the basis of the historical development of the ANDRITZ share.
Due to the fact that the management share option programs do not include cash settlements, these corre-
sponding expenses are recorded directly as equity, according to the International Financial Reporting Standards.
u) Financial instruments
A financial instrument is a contract between two entities that gives rise to a financial asset at one entity and a financial liability or equity instrument of another entity.
Under IAS 39, all financial assets and liabilities, including derivative financial instruments, are to be covered in the balance sheet. The accounting for financial instruments is recognized on the trade date.
The valuation of financial instruments is based on their classification into the categories as specified below and then explained:
Financial assets at fair value through profit or loss
Loans and receivables Available-for-sale (AFS) financial assets
Held to maturity investments
Financial liabilities at fair value through profit or loss Other financial liabilities measured at amortized costs
Financial assets at fair value through profit or loss Financial assets at fair value through profit or loss are assets which are either held by the Group for trading or
which are designated at fair value through profit or loss.
Assets classified as held for trading are assets acquired or held for the purpose of selling or repurchasing in the
short term or which are derivatives (except those that are designated as an effective hedging instrument).
Designated financial assets at fair value through profit or loss essentially include any financial assets that are
designated irrevocably on initial recognition as one to be measured at fair value with fair value changes in profit
or loss regardless of the intention of trade (fair value option).
The fair value option for a financial instrument is not exercised within the Group.
Financial assets generating profits from short-term fluctuations in the market price or dealer’s margin are also
not kept.
The Group uses derivative financial instruments to manage its exposure to foreign exchange rate risk and com-
modity price risk. In the Group, those derivatives that do not meet the strict criteria of a hedge according to
IAS 39 (Hedge Accounting) are assigned to this category. Derivatives are initially recognized at fair value at the date on which the company enters into a derivative contract and are subsequently reassessed to their fair value
at each balance sheet date. Any change in value resulting from changes in fair value is recognized in income
statement.
Depending on the fair value of the derivative, it is recognized either under other receivables or other liabilities.
Loans and receivables
The Group classifies trade receivables, cost and earnings of projects under construction in excess of billings,
loans, and other receivables with fixed or determinable payments that are not quoted in an active market as “loans and receivables”. Loans and receivables are measured at amortized costs less any impairment losses.
Available-for-sale (AFS) financial assets Available-for-sale financial assets are non-derivative financial assets that are designated as available for sale or
are not classified as financial assets at fair value through profit or loss, or loans and receivables. Equity securi-
ties (e.g. shares), debt securities (e.g. bonds), and other investments (e.g. fund shares) held by the Group are designated as AFS financial assets.

54 Notes to the consolidated financial statements
AFS financial assets are stated at fair value. Changes in value resulting from changes in fair value are recognized
in other comprehensive income as change in the reserve for financial investments (IAS Reserve), with the excep-tion of impairment losses, interest calculated using the effective interest method, and foreign exchange gains
and losses on monetary assets, which are recognized directly through profit or loss. Where the financial instru-
ment is disposed of or is determined to be impaired, the cumulative changes previously recognized in the finan-cial investments reserve is included in profit or loss for the period.
The fair value of AFS monetary assets denominated in a foreign currency is determined in that foreign currency and translated at the spot rate at the balance sheet date. The change in fair value attributable to translation
differences that result from a change in amortized cost of the asset is recognized in profit or loss.
Dividends on AFS equity instruments are recognized in profit or loss when the Group’s right to receive payments
is established.
Held to maturity
This category will not be further elaborated because the Group does not have a held-to-maturity portfolio.
Financial liabilities at fair value through profit or loss
The Group classifies its financial liabilities at fair value through profit or loss if the financial liability is held for
trading or if it is a derivative that is not designated or effective as a hedging instrument. The fair value option for a financial instrument is not exercised within the Group.
The Group uses derivative financial instruments to manage its exposure to interest and foreign exchange rate risk and to commodity price risk. In the Group, those derivatives that do not meet the strict criteria of a hedge
according to IAS 39 (Hedge Accounting) are assigned to this category. Derivatives are initially recognized at fair
value at the date of entering into a derivative contract. Any change in value resulting from changes in fair value is recognized in the income statement.
Depending on the fair value of the derivative, it is recognized either under other receivables or other liabilities.
The Group does not keep any financial liabilities that generate profits from short-term fluctuations in the market
price or dealer’s margin.
Other financial liabilities measured at amortized costs
Other financial liabilities, including borrowings, are initially measured at fair value, net of transaction costs. Sub-sequently, they are measured at amortized costs using the effective interest method, with interest cost recog-
nized on an effective yield basis.
Impairment of financial assets
Financial assets, other than those at fair value through profit or loss, are assessed for indicators of impairment at
each balance sheet date. Financial assets are impaired where there is objective evidence that, as a result of one or more events that occurred after the initial recognition of the financial asset, the estimated future cash flows of
the investment have been negatively impacted. For financial assets carried at amortized costs, the amount of
the impairment is the difference between the asset’s net book value and the present value of estimated future cash flows, discounted at the original effective interest rate.
The carrying value of a financial asset is reduced by the impairment loss directly for all financial assets with the exception of trade receivables. When a trade receivable is uncollectible, it is written off against the allowance
account. Subsequent recoveries of amounts previously written off are credited against the allowance account.
Changes in the carrying value of the allowance account are recognized through profit or loss.
The previously recognized impairment loss is reversed through profit or loss up to the extent of the initial im-
pairment if, in a subsequent period, the amount of the impairment loss decreases and the decrease can be related objectively to an event occurring after the impairment was recognized. The reversal shall not result in a
carrying value of the financial asset that exceeds what the amortized cost would have been, if the impairment
had not been recognized at the date the impairment is reversed. The exceptions are AFS equity instruments, for which any increase in fair value subsequent to an impairment loss is recognized in other comprehensive income.
No reversal is made if the reasons for impairment of equity instruments, which are measured at cost, no longer
apply.

55 Notes to the consolidated financial statements
Financial liabilities and equity instruments issued by the Group – classification as debt or equity
Debt and equity instruments are classified either as financial liabilities or as equity in accordance with the substance of the contractual arrangement.
Equity instruments An equity instrument is any contract that evidences a residual interest in the assets of an entity after deducting
all of its liabilities. Equity instruments are recorded at the proceeds received, net of direct issue costs.
Fair value of financial instruments
The fair value of financial assets (liabilities) is the amount for which an asset could be exchanged, or a liability
settled, between knowledgeable, willing parties in an arm’s length transaction.
Measurement of financial instruments at fair value follows a three-level hierarchy and is oriented according to the
proximity of the applied measurement factors to an active market.
Level 1 involves the measurement of financial instruments, such as securities, listed on active markets. In this
context, a quoted market price is the best evidence for the fair value if financial assets (liabilities) are traded on active markets.
If no active market exists, generally accepted valuation techniques are used to determine what the price would have been on the measurement date in an arm’s length exchange motivated by normal business considerations.
Valuation techniques include using recent arm’s length market transactions between knowledgeable, willing
parties, and if available, reference to the current fair value of another instrument that is substantially the same, discounted cash flow analysis, and option pricing models. These financial instruments belong to those measured
according to level 2 if their measurement is based on market-related, recognized financial valuation models,
where the measurement factors can be observed directly or indirectly on active markets.
If the main measurement factors cannot be observed on active markets, the financial instrument is assigned to
level 3.
If no quoted market price and no reliable valuation techniques are available, the financial instrument is measured
at cost.
Hedge Accounting
ANDRITZ designated the bonds issued and the corresponding interest rate swaps as being a hedging relation-ship accounted for as a fair value hedge according to IAS 39. At the inception of the hedge relationship, the
ANDRITZ GROUP documented the relationship between the hedging instrument and hedged item, together with
its risk management objectives and its strategy for undertaking various hedge transactions. Furthermore, the Group documents at the inception of the hedge and on an ongoing basis whether the swaps are highly effective
in offsetting changes in fair values or cash flows of the hedged item.
The Group also uses hedge accounting for other interest and currency derivatives. As these form an effective
hedge according to the requirements of IAS 39 (Hedge Accounting), they are recorded as fair value hedge or as
cash flow hedge.
Fair value hedge
Applying the rules for hedge accounting, the change in the fair value as hedging instrument is recognized through profit or loss. The gain or loss on the hedged item attributable to the changes of the hedged risk results
in an adjustment of the net book value of the hedged item, which is also recognized through profit or loss. In this
manner, the gains and losses resulting from the changes in fair value of the hedging instrument and the hedged item offset each other if the hedge is 100% effective. Hedge accounting is discontinued when the Group revokes
the hedging relationship, the hedging instrument expires or is sold, terminated, or exercised, or no longer quali-
fied for hedge accounting. The adjustment to the net book value of the hedged item arising from the hedged risk is released to profit or loss from that date.
Cash flow hedge According to the rules for hedge accounting, the changes in the fair value of a hedging instrument that qualifies
as a highly effective cash flow hedge are recognized directly in the IAS 39 reserve in shareholders’ equity. Oth-
erwise gains and losses initially recognized in equity for all other cash flow hedges are transferred from IAS 39 reserve to net profit or loss in the same period or periods during which the hedged firm commitment or forecast
transaction affects the income statement.

56 Notes to the consolidated financial statements
Embedded derivatives
IAS 39 outlines the accounting of derivatives that are embedded in non-derivative financial instruments (embed-ded derivatives). Some hybrid contracts contain both a derivative and non-derivative component. In these cas-
es, the derivative component is regarded as an embedded derivative and the non-derivative component
represents the host contract. If the economic characteristics and risks of embedded derivatives are not closely related to those of the host contract and the contract is not rated at fair value, the embedded derivative is sepa-
rated from the host contract and carried at fair value. The host contract will continue to be measured in accord-
ance with the relevant accounting standard. Changing values of the fair valued embedded derivatives in the Group’s consolidated financial statements are shown as “held for trading” in the financial assets at fair value
through profit or loss. The net book value of the embedded derivative is recognized in the balance sheet as
other receivables or other liabilities.
Recognition and derecognition
If the Group qualifies as a party to the contract concerning the contract regulations, financial assets and finan-cial liabilities are recognized in the consolidated statement of financial position in accordance with the substance
of the contractual arrangement. Financial assets and liabilities included in the balance sheet include cash and
cash equivalents, marketable securities, trade and some other accounts receivable and payable, non-current receivables, interest-bearing borrowings, issued bonds, and investment securities.
Financial instruments are recognized and derecognized on the trade date. This is the day of purchase or sale of a financial asset on which the contract terms require delivery of the financial asset within the time frame estab-
lished by the market concerned.
Financial assets are initially measured at fair value plus transaction costs, except for those financial assets clas-
sified as being at fair value through profit or loss. These are initially measured at fair value without transaction
costs. Financial instruments are offset when the Group has a legally enforceable right to offset and intends to settle either on a net basis or to realize the asset and settle the liability simultaneously.
v) Revenue recognition (except for construction contracts) Revenue is recognized when it is probable that the economic benefits associated with the transaction will flow to
the enterprise and the amount of the revenue can be measured reliably. Sales are recognized net of sales taxes
and discounts when delivery has taken place and transfer of risks and rewards has been completed. Interest is recognized pro rata based on the respective interest rate. Dividends are recognized when the shareholders’ right
to receive payment is established.
w) Income taxes
Tax expenditure includes current and deferred taxes. Current and deferred taxes are recognized in profit or loss
except to the extent that the taxes are linked to a business combination or to items recognized in other compre-hensive income.
Actual taxes are the expected tax due or tax receivable on the taxable income or the tax loss for the financial year based on the rates of taxation effective on the reporting date and all adjustments to the tax debt in respect
of previous years. Actual tax liabilities also contain all tax debts arising as a result of dividends being declared.
Deferred taxes are recognized in respect of temporary differences between the net book value of assets and
liabilities for Group accounting purposes and the amounts used for income tax purposes. Deferred taxes are not
recognized for: taxable temporary differences in the initial recognition of goodwill
temporary differences in the initial recognition of assets or liabilities in a business transaction which is not a
business combination and affects neither the accounting profit nor the taxable profit temporary differences in connection with holdings in subsidiaries, associated companies, and joint ventures
provided that the Group is able to control the timing of the reversal of the temporary difference and it is likely
that the temporary difference will not be reversed in the foreseeable future.
Deferred taxes are measured in accordance with the taxation rates (and regulations) applying on the balance
sheet date or have essentially been passed as law and are expected to be applicable on the date when the deferred tax credits are realized or deferred tax liabilities are settled.
A deferred tax asset is recognized for unused tax losses, unused tax credits, and deductible temporary differ-ences to the extent that it is probable that future taxable profit will be available against which it can be utilized.
Deferred tax credits are assessed at every reporting date and reduced to the extent to which it is no longer likely

57 Notes to the consolidated financial statements
that the related tax advantage will be realized. In this assessment the Group targets tax preview for the next five
financial years.
To the extent that the deferred taxes relate to the same taxable entity and the same tax authority and that there
is also a legally enforceable right to offset actual tax receivables against actual tax liabilities, deferred tax assets and liabilities are offset. Actual tax receivables and liabilities are offset if a legal right exists towards a tax authori-
ty to settle on a net basis.
x) Contingent assets and liabilities
Contingent liabilities are not recognized in the financial statements. They are disclosed unless the possibility of
an outflow of resources embodying economic benefits is remote. A contingent asset is not recognized in the financial statements, but disclosed when an inflow of economic benefits is probable.
G) USE OF ESTIMATES Preparation of the consolidated financial statements requires the management to make estimates and assump-
tions that can affect the reported amounts of assets, liabilities, income, and expenses as well as amounts re-
ported in the notes. Actual results may differ from these estimates.
a) Estimates
The Group has made estimates in the process of applying the company’s accounting policies. Additionally, at the balance sheet date, the Group made the following key assumptions concerning the future and has identified
other key sources of estimation uncertainty at the balance sheet date that bear a significant risk of causing a
material adjustment to the net book values of assets and liabilities within the next financial year:
Construction contracts
The accounting for construction contracts is based on estimations for costs and recoverable earnings. Although these estimations are based on all information available on the balance sheet date, substantial changes after the
balance sheet date are possible. These changes could lead to adjustments of assets and may influence earn-
ings in subsequent periods.
Pensions and other employee benefits
The valuation of the various pension plans is based on a methodology using such parameters as the expected discount rate, salary and pension increases, and return on plan assets. If the relevant parameters develop mate-
rially differently than expected, this could have a material impact on the Group’s defined benefit obligation and
subsequently, on the related expenses.
Provisions
Provisions are also recognized and measured on the basis of an estimate of the scale and likelihood of occur-rence of future events and of an estimate of the discounting rate of interest. Past experience is also used as far
as possible.
Impairment
The impairment analysis for goodwill, other intangible assets, and tangible assets is based primarily upon dis-
counted, estimated future cash flows from the continued use and disposal of an asset at the end of its useful life. Factors like lower than anticipated sales and resulting decreases of net cash flows and changes in the dis-
count rates used could lead to impairment. Regarding the net book value of goodwill, intangible assets, and
property, plant and equipment, please refer to note “J) notes to the consolidated statement of financial position”.
Management share option programs
The share option plans are measured based on the fair value of the options on the granting date. The estimated fair value of these options is based on parameters such as volatility, interest rate, share price, duration of the
option, and expected dividend. The interpretation of market information necessary for the estimation of fair
values also requires a certain degree of subjective judgment. This can result in a difference between the figures recorded and values subsequently realized in the marketplace.
Deferred tax In assessing the recoverability of deferred tax assets, the Group considers whether it is probable that all the
deferred tax assets will be realized. The ultimate realization of deferred tax assets is dependent upon the gen-
eration of future taxable income during the periods in which the temporary differences become deductible. If the company does not generate sufficient taxable income, deferred tax assets on loss carry-forwards cannot be
used and a valuation allowance will have to be recorded.
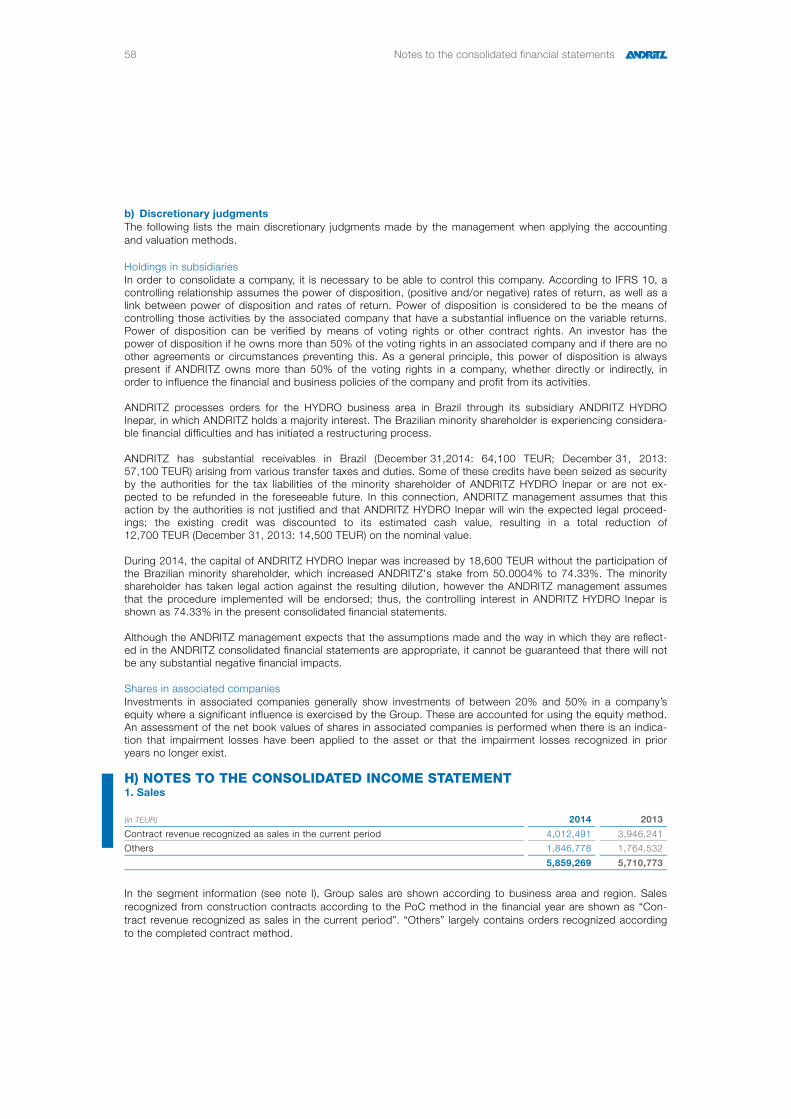
58 Notes to the consolidated financial statements
b) Discretionary judgments
The following lists the main discretionary judgments made by the management when applying the accounting and valuation methods.
Holdings in subsidiaries In order to consolidate a company, it is necessary to be able to control this company. According to IFRS 10, a controlling relationship assumes the power of disposition, (positive and/or negative) rates of return, as well as a link between power of disposition and rates of return. Power of disposition is considered to be the means of controlling those activities by the associated company that have a substantial influence on the variable returns. Power of disposition can be verified by means of voting rights or other contract rights. An investor has the power of disposition if he owns more than 50% of the voting rights in an associated company and if there are no other agreements or circumstances preventing this. As a general principle, this power of disposition is always present if ANDRITZ owns more than 50% of the voting rights in a company, whether directly or indirectly, in order to influence the financial and business policies of the company and profit from its activities. ANDRITZ processes orders for the HYDRO business area in Brazil through its subsidiary ANDRITZ HYDRO Inepar, in which ANDRITZ holds a majority interest. The Brazilian minority shareholder is experiencing considera-ble financial difficulties and has initiated a restructuring process. ANDRITZ has substantial receivables in Brazil (December 31,2014: 64,100 TEUR; December 31, 2013: 57,100 TEUR) arising from various transfer taxes and duties. Some of these credits have been seized as security by the authorities for the tax liabilities of the minority shareholder of ANDRITZ HYDRO Inepar or are not ex-pected to be refunded in the foreseeable future. In this connection, ANDRITZ management assumes that this action by the authorities is not justified and that ANDRITZ HYDRO Inepar will win the expected legal proceed-ings; the existing credit was discounted to its estimated cash value, resulting in a total reduction of 12,700 TEUR (December 31, 2013: 14,500 TEUR) on the nominal value. During 2014, the capital of ANDRITZ HYDRO Inepar was increased by 18,600 TEUR without the participation of the Brazilian minority shareholder, which increased ANDRITZ's stake from 50.0004% to 74.33%. The minority shareholder has taken legal action against the resulting dilution, however the ANDRITZ management assumes that the procedure implemented will be endorsed; thus, the controlling interest in ANDRITZ HYDRO Inepar is shown as 74.33% in the present consolidated financial statements. Although the ANDRITZ management expects that the assumptions made and the way in which they are reflect-ed in the ANDRITZ consolidated financial statements are appropriate, it cannot be guaranteed that there will not be any substantial negative financial impacts. Shares in associated companies Investments in associated companies generally show investments of between 20% and 50% in a company’s equity where a significant influence is exercised by the Group. These are accounted for using the equity method. An assessment of the net book values of shares in associated companies is performed when there is an indica-tion that impairment losses have been applied to the asset or that the impairment losses recognized in prior years no longer exist.
H) NOTES TO THE CONSOLIDATED INCOME STATEMENT 1. Sales
(in TEUR) 2014 2013
Contract revenue recognized as sales in the current period 4,012,491 3,946,241
Others 1,846,778 1,764,532
5,859,269 5,710,773
In the segment information (see note I), Group sales are shown according to business area and region. Sales
recognized from construction contracts according to the PoC method in the financial year are shown as “Con-
tract revenue recognized as sales in the current period”. “Others” largely contains orders recognized according to the completed contract method.

59 Notes to the consolidated financial statements
2. Other operating income
(in TEUR) 2014 2013
Exchange rate gains 40,400 36,694
Government grants 9,956 11,487
Insurance income 4,288 10,360
Rental income 6,958 6,208
Profit on disposal of intangible and tangible assets 3,125 1,171
Others 57,414 54,914
122,141 120,834
3. Cost of materials (in TEUR) 2014 2013
Expenses for raw materials, supplies and goods purchased 2,359,864 2,386,973
Expenses for services purchased 795,087 845,465
3,154,951 3,232,438
4. Personnel expenses (in TEUR) 2014 2013
Wages and salaries 1,264,062 1,197,955
Social security and payroll-related duties 213,012 198,708
Other social expenses 55,758 46,029
Pension expenses 35,917 36,727
Severance expenses 5,223 38,782
1,573,972 1,518,201
In the 2014 financial year, contributions reported as expenditure in the amount of TEUR 1,823 (2013: 1,789) to employee pension funds in connection with defined-contribution severance payments are included in the per-
sonnel expenses for Austria.
5. Other operating expenses
(in TEUR) 2014 2013
Sales expenses 325,372 344,140
Repairs and maintenance 72,747 72,673
Rents and leases 72,767 72,372
Administrative expenses 56,595 60,436
Exchange rate losses 51,146 36,372
Insurance premiums and charges 32,925 35,721
Bank charges, guarantees, and similar 26,266 31,447
Expenses for valuation allowance for receivables 13,876 19,819
Expenses for industrial patents, rights, licenses 10,343 9,999
Losses on disposal of intangible and tangible assets 1,638 1,638
Others 119,877 143,367
783,552 827,984

60 Notes to the consolidated financial statements
6. Depreciation, amortization and impairment of intangible assets and property, plant and equipment
(in TEUR) 2014 2013
Intangible assets
Depreciation and amortization 85,381 78,011
Impairment 770 522
Property, plant, and equipment
Depreciation and amortization 78,818 76,552
Impairment 5,580 6,535
170,549 161,620
In the 2014 fiscal year, an impairment of pilot plants was recorded in the amount of 5.571 TEUR (2013: TEUR
3.498).
7. Financial result
(in TEUR) 2014 2013
Expense from associated companies -65 -185
Interest result -899 -8,590
Other financial result 4,635 -735
3,671 -9,510
The interest result contains 9,691 TEUR (2013: 9,702 TEUR) for interest costs on pensions, severance payments
and jubilee payments, as well as on expected return on plan assets.
8. Income taxes
Expenditure for taxes on income and earnings comprises the following items:
(in TEUR) 2014 2013
Current tax expense -73,733 -97,667
Deferred tax expense/benefit relating to the origination and reversal of temporary
differences -15,652 70,582
-89,385 -27,085
The changes in deferred taxes are as follows:
(in TEUR) 2014 2013
Deferred tax assets 200,318 125,252
Deferred tax liabilities -159,040 -93,912
Balance as of January 1 41,278 31,340
Deferred taxes recognized in comprehensive income 20,451 -1,311
Changes of scope of consolidation, Exchange rate differences, Other differences 28,657 -59,333
Changes of deferred taxes recognized through income statement
Deferred taxes relating to the origination and reversal of temporary differences such as
change of temporary differences not accrued for -16,260 75,158
Tax effect from change in tax rate 608 -4,576
Balance as of December 31 74,734 41,278
thereof
Deferred tax assets 212,406 200,318
Deferred tax liabilities -137,672 -159,040

61 Notes to the consolidated financial statements
The maturities of the deferred taxes before offset with the same tax jurisdiction comprise the following:
(in TEUR) 2014 2013
Deferred tax assets, to be realized in more than 12 months 173,237 148,426
Deferred tax assets, to be realized within 12 months 503,227 482,408
Deferred tax assets 676,464 630,834
Deferred tax liabilities, to be realized in more than 12 months -115,577 -127,745
Deferred tax liabilities, to be realized within 12 months -486,153 -461,811
Deferred tax liabilities -601,730 -589,556
Transfer of the calculated income tax expenditure to the effective tax expenditure is shown as follows. The cal-
culated tax expenditure, amounting to 74,843 TEUR, is obtained by multiplying the result before tax, amounting
to 299,372 TEUR, by the 25% rate of taxation applicable for ANDRITZ AG:
(in TEUR) 2014 2013
Earnings Before Taxes (EBT) 299,372 80,277
Calculated tax expense (25% in 2014 and 25% in 2013) -74,843 -20,069
Increase (-)/Decrease (+) of tax expense by:
Non-deductible expenses -17,944 -8,897
Tax allowances 5,821 4,048
Tax free income (expenses) from investments 41 458
Tax differential 1,648 2,004
Tax effect from change in tax rate 608 -4,576
Tax income/expense from prior periods 4,503 1,071
Non-deductible impairment of goodwill -2,843 -1,114
Non-allowable withholding taxes, foreign operating site taxes -9,962 -10,599
Others 3,586 10,589
Effective tax expense -89,385 -27,085
in % of EBT -29.9% -33.7%
The nominal income tax rates applying to subsidiaries abroad at the end of the financial year were between
10.0% and 39.0% (2013: between 14.4% and 38.9%).
Deferred tax assets and liabilities as of December 31, 2014 and 2013 are the result of the following temporary
valuation differences between the book values in the IFRS balance sheet and the relevant tax bases.
2014 2013*
Deferred tax Deferred tax
(in TEUR) Assets liabilities Assets liabilities
Intangible assets 2,249 -64,249 1,979 -83,490
Property, plant, and equipment 8,453 -32,734 8,220 -28,022
Financial assets 1,681 -7,893 1,928 -9,602
Inventories 293,492 -67,664 269,381 -60,394
Other receivables and assets 46,999 -94,641 31,520 -96,987
352,874 -267,181 313,028 -278,495
Provisions 130,360 -25,173 132,400 -34,569
Liabilities 124,654 -309,376 132,547 -279,746
255,014 -334,549 264,947 -314,315
Tax loss carry-forwards 151,167 0 149,076 0
Deferred tax assets/liabilities 759,055 -601,730 727,051 -592,810
Valuation allowance for deferred tax assets -82,591 0 -92,963 0
Offset within legal tax units and jurisdiction -464,058 464,058 -433,770 433,770
Net deferred tax assets and liabilities 212,406 -137,672 200,318 -159,040
* Adjusted in accordance with IAS 8

62 Notes to the consolidated financial statements
High amounts for deferred tax assets for inventories and deferred tax liabilities for liabilities are due to different
presentation in local tax statements and IFRS as well as netting of inventories and liabilities in local tax state-ments.
On the date of the balance sheet, the Group has operating loss carry-forwards amounting to 696,121 TEUR (2013: 691.726 TEUR). Included are corporate tax loss carry-forwards in Germany which are amounting to
210,389 TEUR (2013: 240,299 TEUR), trade tax loss carry-forwards amounting to 132,764 TEUR (2013:
142,073 TEUR), and interest carry-forwards amounting to 12,841 TEUR (2013: 7,574 TEUR). In addition, there is a fiscal unit for corporation tax purposes in Germany between ANDRITZ Deutschland Beteiligungs GmbH as
controlling company and 13 controlled companies.
Estimates of the future realization of deferred tax assets are decisive in assessing the recoverability of deferred
tax assets. This realization is dependent on the generation of future taxable profits during the periods in which
temporary assessment differences and tax loss carry-forwards can be utilized. This assessment takes account of the probability of the deferred tax liabilities being reversed as well as the future taxable profits. Due to careful
planning, loss carry-forwards are only included to the extent that taxable income can be expected. Tax preview
for the next five financial years is targeted in this assessment.
As a result, no deferred tax assets have been recognized for the following issues (gross values):
(in TEUR) 2014 2013*
Deductible temporary differences 44,943 140,950
Tax loss carry-forwards 353,746 244,818
* Adjusted in accordance with IAS 8
9. Earnings per share
Basic earnings per share (as stated further below in the consolidated income statement) are calculated by divid-ing the net income for the period attributable to shareholders of the parent company by the weighted average
number of ordinary shares outstanding during the period.
Diluted basic earnings per share are calculated by dividing the net income for the period attributable to share-
holders of the parent company by the weighted average number of ordinary shares outstanding during the peri-
od with consideration of share options.
(in TEUR) 2014 2013
Net income attributable to shareholders of the parent 210,874 66,609
Weighted average number of no-par value shares 103,606,533 103,412,589
Effect of potential dilution of share options 284,720 852,786
Weighted average number of no-par value shares and share options 103,891,253 104,265,375
Basic earnings per no-par value share (in EUR) 2.04 0.64
Diluted earnings per no-par value share (in EUR) 2.03 0.64
I) SEGMENT REPORTING Business areas
For management purposes, the Group is divided into four business areas on a worldwide basis:
HYDRO (HY)
Electromechanical equipment – in particular turbines and generators – for new hydropower stations and mod-ernization of existing hydropower stations; pumps for the pulp and paper industry and other applications (e.g.
for drinking water supply).
PULP & PAPER (PP)
Plants and services for the production of all types of pulp (chemical pulp, mechanical, recycled fiber pulps),
paper, board, tissue, and medium-density fiberboard (MDF); biomass boilers for power generation; systems for the production of plastic film.

63 Notes to the consolidated financial statements
METALS (ME)
Presses, automation solutions, dies, process know-how, and services for the entire metalworking industry; complete lines for the production and processing of cold-rolled strip made of stainless steel, carbon steel, alu-
minum, and non-ferrous metal; turnkey furnace systems for the steel, copper, and aluminum industries, as well
as welding systems for the metalworking industry.
SEPARATION (SE)
Plants, equipment, and services for solid/liquid separation in the municipal sector and for certain industries (e.g. mining, chemical and petrochemical industries, food industry), as well as plants, equipment, and services for the
production of animal feed and biomass pellets (mainly wood pellets).
These strategic business areas form the basis of the internal reporting structure to the Executive Board as the
key decision maker.
The accounting and valuation principles of the individual segments are the same as those of the Group (see
note “F) Accounting and valuation principles”.
According to the internal reporting structure, all sales and all direct and indirect expenses (including overhead
and administrative costs) are allocated to business areas and reflect the management structure of the organiza-
tion and the predominant sources of risks and opportunities. The key measure of operating performance for the Group is Earnings Before Interest, Taxes, Depreciation, and Amortization (EBITDA). There are no substantial
inter-segmental transactions. All consolidation effects related to income statement are included in the relevant
business area.
Geographical segmentation
The Group's activities are mainly conducted in Europe, North America, South America, and Asia.
External sales allocated by geographical segments are based on the geographical location of the company’s
customers.
There are no sales from transactions with a single external customer that amount to 10% or more of the Group’s
sales.
2014
Business area information (in TEUR) HY PP ME SE Total
Sales 1,752,317 1,969,262 1,550,395 587,295 5,859,269
Earnings Before Interest, Taxes, Depreciation and
Amortization (EBITDA) 177,255 127,592 133,978 33,172 471,997
Earnings Before Interest, Taxes and Amortization
(EBITA) 144,825 102,859 110,154 21,646 379,484
Capital expenditure 39,320 28,145 27,879 11,106 106,450
Depreciation, amortization and impairment of
intangible assets and property, plant, and equipment 36,935 34,687 79,120 19,807 170,549
Share of net profit/loss of associates 0 -65 0 0 -65
Shares in associated companies 0 0 0 0 0
Information according to geographical segments
(in TEUR) Europe
North
America
South
America Asia
Rest of the
world and
consolidation Total
External sales 2,404,794 957,436 890,748 1,396,829 209,462 5,859,269
Non-current assets 885,827 143,552 164,695 86,457 415,687 1,696,218
Capital expenditure 58,840 10,790 10,154 26,566 100 106,450
External sales for Europe contain an amount of 199,851 TEUR for sales realized in Austria. Non-current assets
of 292,917 TEUR are located in Austria.
Non-current assets consist of property, plant and equipment, goodwill, intangible assets, trade accounts receiv-
able, as well as other non-current receivables and other assets.

64 Notes to the consolidated financial statements
2013
Business area information (in TEUR) HY PP ME SE Total
Sales 1,804,752 2,005,331 1,310,948 589,742 5,710,773
Earnings Before Interest, Taxes, Depreciation and
Amortization (EBITDA) 176,772 -11,514 76,604 13,345 255,207
Earnings Before Interest, Taxes and Amortization
(EBITA) 146,934 -35,656 53,465 -627 164,116
Capital expenditure 44,511 25,965 32,651 8,227 111,354
Depreciation, amortization and impairment of
intangible assets and property, plant, and equipment 34,562 33,870 70,486 22,702 161,620
Share of net profit/loss of associates 0 -185 0 0 -185
Shares in associated companies 0 0 0 0 0
Information according to geographical segments
(in TEUR) Europe
North
America
South
America Asia
Rest of the
world and
consolidation Total
External sales 2,472,678 898,417 766,240 1,347,466 225,972 5,710,773
Non-current assets 937,764 97,445 62,624 73,267 434,091 1,605,191
Capital expenditure 85,424 8,447 5,335 12,032 116 111,354
External sales for Europe contain an amount of 238,667 TEUR for sales realized in Austria. Non-current assets
of 285,798 TEUR are located in Austria.
Non-current assets consist of property, plant and equipment, goodwill, intangible assets, trade accounts receiv-
able, as well as other non-current receivables and other assets.
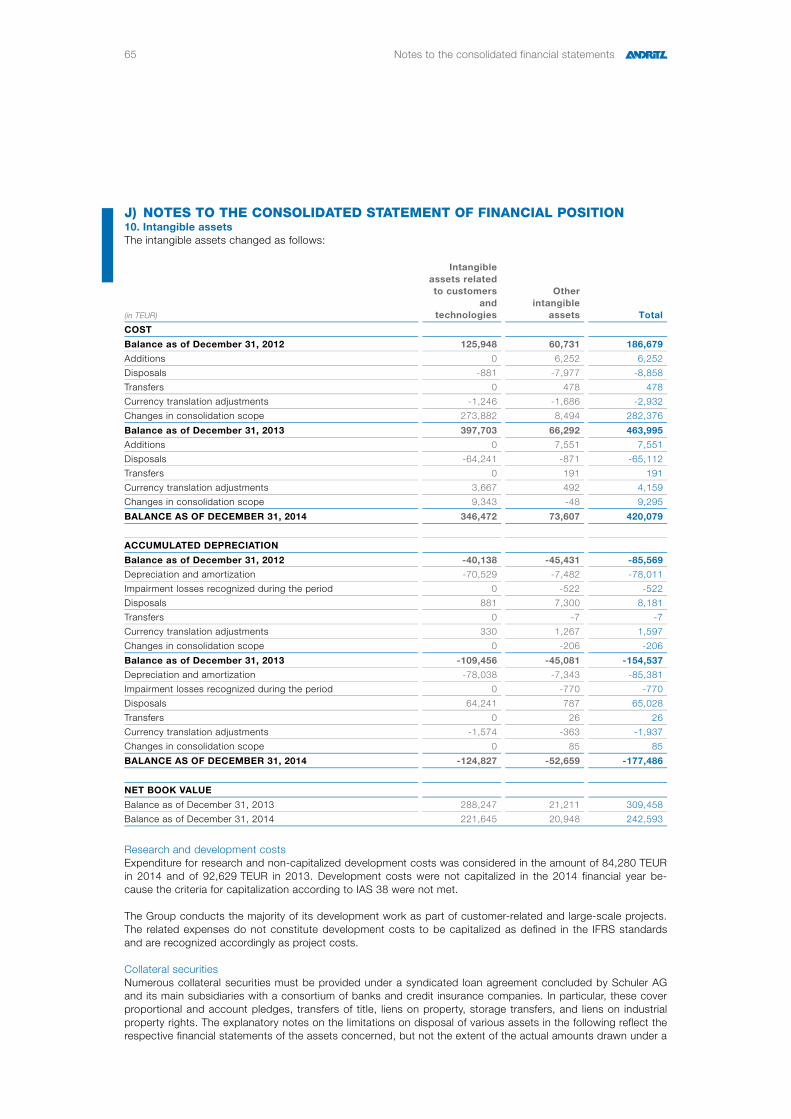
65 Notes to the consolidated financial statements
J) NOTES TO THE CONSOLIDATED STATEMENT OF FINANCIAL POSITION 10. Intangible assets The intangible assets changed as follows:
(in TEUR)
Intangible
assets related
to customers
and
technologies
Other
intangible
assets Total
COST
Balance as of December 31, 2012 125,948 60,731 186,679
Additions 0 6,252 6,252
Disposals -881 -7,977 -8,858
Transfers 0 478 478
Currency translation adjustments -1,246 -1,686 -2,932
Changes in consolidation scope 273,882 8,494 282,376
Balance as of December 31, 2013 397,703 66,292 463,995
Additions 0 7,551 7,551
Disposals -64,241 -871 -65,112
Transfers 0 191 191
Currency translation adjustments 3,667 492 4,159
Changes in consolidation scope 9,343 -48 9,295
BALANCE AS OF DECEMBER 31, 2014 346,472 73,607 420,079
ACCUMULATED DEPRECIATION
Balance as of December 31, 2012 -40,138 -45,431 -85,569
Depreciation and amortization -70,529 -7,482 -78,011
Impairment losses recognized during the period 0 -522 -522
Disposals 881 7,300 8,181
Transfers 0 -7 -7
Currency translation adjustments 330 1,267 1,597
Changes in consolidation scope 0 -206 -206
Balance as of December 31, 2013 -109,456 -45,081 -154,537
Depreciation and amortization -78,038 -7,343 -85,381
Impairment losses recognized during the period 0 -770 -770
Disposals 64,241 787 65,028
Transfers 0 26 26
Currency translation adjustments -1,574 -363 -1,937
Changes in consolidation scope 0 85 85
BALANCE AS OF DECEMBER 31, 2014 -124,827 -52,659 -177,486
NET BOOK VALUE
Balance as of December 31, 2013 288,247 21,211 309,458
Balance as of December 31, 2014 221,645 20,948 242,593
Research and development costs
Expenditure for research and non-capitalized development costs was considered in the amount of 84,280 TEUR in 2014 and of 92,629 TEUR in 2013. Development costs were not capitalized in the 2014 financial year be-
cause the criteria for capitalization according to IAS 38 were not met.
The Group conducts the majority of its development work as part of customer-related and large-scale projects.
The related expenses do not constitute development costs to be capitalized as defined in the IFRS standards
and are recognized accordingly as project costs.
Collateral securities
Numerous collateral securities must be provided under a syndicated loan agreement concluded by Schuler AG and its main subsidiaries with a consortium of banks and credit insurance companies. In particular, these cover
proportional and account pledges, transfers of title, liens on property, storage transfers, and liens on industrial
property rights. The explanatory notes on the limitations on disposal of various assets in the following reflect the respective financial statements of the assets concerned, but not the extent of the actual amounts drawn under a

66 Notes to the consolidated financial statements
credit facility. The collateral securities result in limitations on disposal of intangible assets in the amount of
24,437 TEUR (2013: 25,981 TEUR).
11. Goodwill
The following table illustrates the changes in the amount of goodwill for the periods ended December 31, 2014 and 2013:
(in TEUR) 2014 2013
COST
Balance as of January 1 705,036 490,360
Currency translation adjustments 16,715 -7,747
Changes in consolidation scope 8,803 222,423
Remeasurement (IFRS 3) 577 0
Balance as of December 31 731,131 705,036
ACCUMULATED IMPAIRMENT
Balance as of January 1 174,969 175,971
Currency translation adjustments 11,940 -4,393
Impairment losses recognized during the period 5,747 3,800
Changes in consolidation scope 0 -409
Remeasurement (IFRS 3) 0 0
Balance as of December 31 192,656 174,969
NET BOOK VALUE
Balance as of January 1 530,067 314,389
Balance as of December 31 538,475 530,067
The remeasurement (IFRS 3) results from the final assessment of the acquisition of Modul Systeme Engineering
AG, Germany (including its subsidiaries).
These are divided between the cash generating units as follows:
(in TEUR) 2014 2013
Schuler 215,061 215,061
VA TECH HYDRO 97,775 97,775
ANDRITZ AG 59,596 59,596
ANDRITZ Ahlstrom 21,188 20,564
Iggesund 12,029 12,029
Others 132,826 125,042
538,475 530,067
These are divided between the business areas as follows:
(in TEUR) 2014 2013
HYDRO 120,428 123,667
PULP & PAPER 123,499 120,123
METALS 253,428 245,627
SEPARATION 41,120 40,650
538,475 530,067
Impairment In the 2014 financial year, an impairment of goodwill was made in an amount of 5,747 TEUR because business
did not develop according to plan. This impairment of goodwill relates to the HYDRO business area in the
amount of 4,283 TEUR and to the METALS business area in the amount of 1,464 TEUR. In 2013, impairment losses of 3,800 TEUR were recorded for goodwill in the HYDRO business area.
Discretionary judgments and forward-looking assumptions ANDRITZ conducts the regular impairment test of goodwill once a year in the fourth quarter of the year con-
cerned. Planning is conducted generally at the level of individual cash-generating units and is based on internal

67 Notes to the consolidated financial statements
planning, which is prepared for the next three financial years. After these planning periods a growth rate of 1.3%
is assumed. Under consideration of the applicable currency and the corresponding risk profile, a discount rate between 8.59% and 17.24% (2013: between 8.52% and 15.30%) was applied before tax.
In order to validate the values in use determined as of December 31, 2014, other scenarios were conducted with respect to the calculation parameters described above. The management considered the following scenari-
os possible:
A change of +/-0.5 percentage points in the discount rate A change of +/-10 percentage points in the planned cash flows
The change would have required the following effects on the impairment if all other parameters remained the same:
2014 (in TEUR) Discount rate Planned cash flows
Change +0.5% -0.5% +10% -10%
IMPAIRMENT -351 254 254 -620
2013
(in TEUR) Discount rate Planned cash flows
Change +0.5% -0.5% +10% -10%
IMPAIRMENT -316 685 959 -2,531
The present sensitivity analysis may not be representative of the actual changes because it is considered unlikely
that deviations from the assumptions made occur in isolation due to the fact that some of the assumptions are
related to others.

68 Notes to the consolidated financial statements
12. Property, plant and equipment
Property, plant and equipment changed as follows:
(in TEUR)
Land and
buildings
Technical
equipment,
and
machinery
Other
equipment,
factory and
office
equipment
Assets
under
construc-
tion and
advance
payments Total
COST
Balance as of December 31, 2012 353,519 387,368 140,568 22,722 904,177
Additions 17,759 30,325 20,740 36,278 105,102
Disposals -2,402 -13,169 -9,936 -41 -25,548
Transfers 13,677 29,666 -4,431 -39,390 -478
Currency translation adjustments -5,724 -15,454 -6,423 -803 -28,404
Changes in consolidation scope 95,452 50,456 19,952 17,561 183,421
Other adjustments 1,612 13,751 6,868 0 22,231
Balance as of December 31, 2013 473,893 482,943 167,338 36,327 1,160,501
Additions 19,931 27,563 18,830 32,575 98,899
Disposals -4,190 -10,257 -11,163 -31 -25,641
Transfers -5,271 28,267 -1,851 -21,336 -191
Currency translation adjustments 10,779 12,001 3,419 1,823 28,022
Changes in consolidation scope 9,862 9,659 1,171 20 20,712
Other adjustments 899 4,983 34 0 5,916
BALANCE AS OF DECEMBER 31, 2014 505,903 555,159 177,778 49,378 1,288,218
ACCUMULATED DEPRECIATION
Balance as of December 31, 2012 -106,035 -218,745 -85,197 -13 -409,990
Depreciation and amortization -15,045 -39,807 -21,700 0 -76,552
Impairment losses recognized during the
period -365 -4,499 -1,671 0 -6,535
Disposals 1,109 10,116 8,301 13 19,539
Transfers 0 -4,255 4,262 0 7
Currency translation adjustments 1,596 6,444 3,168 0 11,208
Changes in consolidation scope -135 -2,059 -274 0 -2,468
Other adjustments -1,612 -13,751 -6,868 0 -22,231
Balance as of December 31, 2013 -120,487 -266,556 -99,979 0 -487,022
Depreciation and amortization -16,898 -42,069 -19,851 0 -78,818
Impairment losses recognized during the
period -950 -4,617 -13 0 -5,580
Disposals 1,792 5,604 9,663 0 17,059
Transfers 90 -3,486 3,370 0 -26
Currency translation adjustments -3,333 -6,967 -2,363 0 -12,663
Changes in consolidation scope 0 26 -23 0 3
Other adjustments -899 -4,856 -161 0 -5,916
BALANCE AS OF DECEMBER 31, 2014 -140,685 -322,921 -109,357 0 -572,963
NET BOOK VALUE
Balance as of December 31, 2013 353,406 216,387 67,359 36,327 673,479
Balance as of December 31, 2014 365,218 232,238 68,421 49,378 715,255
Collateral securities
Property, plant, and equipment amounting to 63,793 TEUR have been pledged as collateral security as of De-
cember 31, 2014 (December 31, 2013: 74,203 TEUR).
Commitments
The commitments arising from contracts for expenditure on property, plant and equipment are only within the ordinary scope of business. As of December 31, 2014, these commitments amounted to 12,855 TEUR (2013:
14,695 TEUR).

69 Notes to the consolidated financial statements
Borrowing costs
No borrowing costs relating to qualifying assets were capitalized in the financial years 2014 and 2013 as the amounts were immaterial.
Government grants In the 2014 financial year, government grants amounting to 135 TEUR (2013: 245 TEUR) were paid for capital
expenditure on buildings, plant and machinery and offset against the costs. Other grants in the amount of
9,956 TEUR (2013: 11,487 TEUR) were recognized directly as other operating income.
Changes in consolidation scope
In addition to the acquisition of subsidiaries, the changes in consolidated companies originate from changes of the consolidation method of Group companies.
Finance leases The following assets are included in the tangible fixed assets:
(in TEUR) 2014 2013
Land and buildings 13,661 14,005
Technical equipment, and machinery 232 246
Other equipment, factory and office equipment 122 268
14,015 14,519
The lease contracts have terms from 3 up to 180 months.
13. Associated companies In an associated company the Group does exercise significant influence, however there is no control or joint control. ANDRITZ has no shares in joint arrangements nor in non-consolidated structured companies. Information relating to the associated companies can be found in the following table:
Associated Companies Headquarters
Proportion of ownership interests
and voting rights
2014 2013
Enmas ANDRITZ Pvt. Ltd. Chennai, India 40.00% 40.00%
Viafin Brazil Oy Teuva, Finland 40.00% 40.00%
A&V Montagens INDUSTRIAIS Ltda. Lapa, Brazil 40.00% 40.00% The associated companies are assigned to the PULP & PAPER business area. All of the above mentioned associated companies are accounted for using the at-equity method. Another
4 associated companies (2013: 4) were not included in the at-equity method of accounting due to their minor
importance for the assets, liabilities, financial position, and profit or loss of ANDRITZ. These subsidiaries are recognized as investments in non-consolidated companies at cost less any impairment losses in “Other invest-
ments”.
The following overview shows the items from the statement of financial position and the income statement for
companies accounted for using the equity method:
(in TEUR) 2014 2013
Disclosures of financial position
Assets 4,138 3,854
Liabilities 5,166 4,608
Disclosures of the income statement
Sales 1,274 2,022
Result for the year -278 -351

70 Notes to the consolidated financial statements
The income from associated companies amounted to -65 TEUR (2013: -185 TEUR) in the consolidated income
statement of the Group.
The summarizing financial information for associated companies is shown in aggregate form because the indi-vidual companies can be considered of minor importance. ANDRITZ AG has the following interest in the income of associated companies: (in TEUR) 2014 2013
Share of profit (loss) from continuing operations -111 -140
Share of post-tax profit (loss) from discontinued operations 0 0
Share of other comprehensive income 2 -1
SHARE OF TOTAL COMPREHENSIVE INCOME -109 -141
AGGREGATE CARRYING AMOUNT OF THE INTERESTS IN ASSOCIATES 0 0
Non-recognized losses of associated companies for the business year and cumulatively up to Decem-ber 31, 2014 comprise the following: (in TEUR) 2014 2013
UNRECOGNISED LOSS OF ASSOCIATES -44 0
CUMULATIVE SHARE OF LOSS OF ASSOCIATES -1,031 -987
The non-recognized losses for the reporting year relate entirely to Enmas ANDRITZ Pvt. Ltd.
Changes in the participation rate in associated companies There have been no changes in the participation rate in associated companies compared to the previous year.
14. Other investments Other investments comprise the following:
(in TEUR) 2014 2013
Loans against borrowers’ notes 45,000 20,000
Shares in non-consolidated companies 5,744 8,233
Other shares 4,847 6,113
Investment securities 7,100 7,184
Others 8,534 4,119
71,225 45,649
In the 2014 financial year, impairment for shares in non-consolidated companies was recognized in the amount of 0 TEUR (2013: 1,856 TEUR).
The shares in non-consolidated companies include restricted right of use amounting to 128 TEUR (2013: 159 TEUR).
If no quoted market prices are available and none of the factors relevant for valuation models can be measured reliably, investments in non-consolidated companies and other investments are recognized at cost.

71 Notes to the consolidated financial statements
15. Trade accounts receivable
(in TEUR) 2014 2013
Trade accounts receivable - current 705,819 620,821
Trade accounts receivable - non-current 62,522 16,849
768,341 637,670
thereof neither past due nor impaired 490,443 432,485
thereof past due but not impaired 273,405 195,200
thereof impaired 58,695 60,226
Valuation allowance -54,202 -50,241
Before accepting any new customer, the Group uses an internal credit scoring system to assess the potential customer’s creditworthiness and defines credit limits per customer. Limits and scoring attributed to customers
are reviewed regularly.
Included in the Group’s trade receivable balance are debts with a carrying value of 273,405 TEUR (2013:
195,200 TEUR,) which are past due at the reporting date and for which the Group has not recognized any valua-
tion allowance as there has not been a significant change in creditworthiness and the amounts are still consid-ered recoverable.
The valuation allowance for trade accounts receivable changed as follows:
(in TEUR) 2014 2013
Balance as of January 1 -50,241 -39,166
Currency translation adjustments -1,811 1,779
Charged to expenses -13,876 -19,819
Use 6,683 8,893
Release 6,295 5,860
Changes in consolidation scope -1,252 -7,788
BALANCE AS OF DECEMBER 31 -54,202 -50,241
The Group has the following liabilities, which are past due but not impaired, on the balance sheet date:
(in TEUR) 2014 2013
Up to 60 days past due 107,670 103,101
61 to 120 days past due 37,628 37,442
More than 120 days past due 128,107 54,657
273,405 195,200
In determining the recoverability of a trade receivable, the Group considers any change in the creditworthiness
from the date on which the credit was initially granted up to the reporting date. Determination of impairments
also considers collateralization of payments by bank guarantees and export insurance. The Executive Board believes that no further credit provision is required in excess of the allowance for doubtful debts already recog-
nized.
The disposal limitations arising due to the granting of collateral securities amount to 67,303 TEUR (2013:
88,987 TEUR). The parties receiving collateral security have no rights allowing them to sell or re-pledge the
collateral securities provided.

72 Notes to the consolidated financial statements
16. Other receivables and assets
(in TEUR) 2014 2013
Loans against borrowers’ notes 45,000 110,000
Receivables from value-added tax and from other taxes and changes 116,872 101,029
Receivables from prepaid income taxes 28,695 41,173
Foreign exchange forward contracts at fair value 23,079 32,208
Prepayments and deferred charges 28,011 25,678
Embedded derivatives at fair value 47,647 16,396
Bills of exchange receivable 11,199 14,277
Interest rate swaps at fair value 20,496 10,526
Others 141,078 100,419
462,077 451,706
thereof other current receivables 350,339 376,368
thereof other non-current receivables 111,738 75,338
The valuation allowances on the other receivables changed as follows:
(in TEUR) 2014 2013
Balance as of January 1 -6,427 0
Currency translation adjustments 8 0
Charged to expenses -1,055 -1,986
Use 787 102
Release 699 625
Changes in consolidation scope 0 -5,168
Balance as of December 31 -5,988 -6,427
17. Inventories
(in TEUR) 2014 2013
Finished goods 96,726 72,103
Work in progress 372,547 384,225
Materials and supplies 223,961 217,433
693,234 673,761
The valuation allowances on inventories were recognized in the income statement at 629 TEUR (2013:
-14,333 TEUR).
The disposal limitations arising due to the granting of collateral securities amount to 86,836 TEUR (2013:
105,261 TEUR).
18. Advance payments made
The advance payments made and presented in the statement of financial position relate to pending purchase orders for ongoing contracts.

73 Notes to the consolidated financial statements
19. Construction contracts
(in TEUR) 2014 2013
Contract revenue recognized as sales in the current period 4,012,491 3,946,241
Contract costs incurred and recognized profits (less recognized losses) to date 10,232,508 9,326,011
Advance payments received and progress billings 10,933,918 9,897,889
Amount of retentions 12,970 15,117
The net amounts of the construction contracts comprise the following:
(in TEUR) 2014 2013
Contract costs incurred and recognized profits (less recognized losses) to date 10,232,508 9,326,011
Less advance payments received and progress billings -10,933,918 -9,897,889
-701,410 -571,878
Recognized in the financial statements as receivables and payables:
Cost and earnings of projects under construction in excess of billings 502,183 509,534
Billings in excess of cost and earnings of projects under construction -1,203,593 -1,081,412
-701,410 -571,878
The following advance payments and payment instalments were past due on the balance sheet date.
(in TEUR) 2014 2013
61 to 120 days past due 13,244 11,427
More than 120 days past due 76,845 46,779
90,089 58,206
The disposal limitations arising due to the granting of collateral securities amount to 81,241 TEUR (2013:
82,596 TEUR). The parties receiving collateral security have no rights allowing them to sell or re-pledge the
collateral securities provided.
20. Marketable securities
(in TEUR) 2014 2013
Government bonds 0 84,073
Bonds 81,839 73,941
Funds 72,455 1,093
154,294 159,107
21. Cash and cash equivalents
(in TEUR) 2014 2013
Cash in banks 381,442 492,456
Time deposits 1,075,893 735,404
1,457,335 1,227,860
22. Non-current assets available for sale and discontinued business areas
There were no non-current assets available for sale and discontinued business areas classified according to IFRS 5 on December 31, 2014.

74 Notes to the consolidated financial statements
23. Equity
(in TEUR) 2014 2013
Share capital 104,000 104,000
Capital reserves 36,476 36,476
IAS 39 reserve -3,684 -381
Other retained earnings 894,232 768,099
Treasury shares -32,947 -8,457
Total 998,077 899,737
Non-controlling interests 16,721 29,743
TOTAL SHAREHOLDERS’ EQUITY 1,014,798 929,480
IAS 39 reserve
The table below shows the movements in the IAS 39 reserve in equity:
(in TEUR)
Unrealized
gain/loss on
hedging activities
Unrealized
gain/loss on
securities
Unrealized
gain/loss total
IAS 39 reserve
Balance as of December 31, 2012 0 695 695
Gains and losses from changes in fair value -318 -1,002 -1,320
Related deferred income taxes 124 251 375
Transfers to income statement 0 -175 -175
Related deferred income taxes 0 44 44
Balance as of December 31, 2013 -194 -187 -381
Gains and losses from changes in fair value -5,054 552 -4,502
Related deferred income taxes 1,539 -101 1,438
Transfers to income statement -273 -54 -327
Related deferred income taxes 82 8 90
Other adjustments 0 -2 -2
BALANCE AS OF DECEMBER 31, 2014 -3,900 216 -3,684
Dividends
For 2014, a dividend of 1.00 EUR per outstanding share is proposed by the Executive Board. The dividend of
51,907 TEUR for 2013, which is equal to 0.50 EUR per share, was proposed by the Executive Board and ap-proved at the 107th Annual General Meeting on March 21, 2014. The dividend was paid to the shareholders on
March 27, 2014.
On February 25, 2015, the Executive Board authorized the consolidated financial statements according to IFRS
for the year ended December 31, 2014.
On February 19, 2014, the Executive Board authorized submission of the consolidated financial statements
according to IFRS for the year ended December 31, 2013, to the Supervisory Board. The consolidated financial
statements were presented to the Supervisory Board and subsequently to the Annual General Meeting.
Treasury shares
Based on authorizations of the Annual General Meeting and with approval from the Supervisory Board, the Executive Board adopted share buy-back and share resale programs for buying up to 10,400,000 no-par value
shares between October 1, 2013 and March 31, 2016.
In 2014, 672,000 shares were bought back at an average price of EUR 41.97 per share. 76,000 no-par value
shares were resold at a price of 23.18 EUR per share to eligible executives under the management share option
plan and 9,886 no-par value shares were transferred to employees of ANDRITZ in the course of employee par-ticipation programs. As of December 31, 2014, the company held 803,107 treasury shares at a market value of
36,694 TEUR. It is planned to use these shares for the management share option plan and the employee parti-
cipation programs.

75 Notes to the consolidated financial statements
The following table shows the changes in the number of shares outstanding:
(in TEUR)
Number of
shares
Treasury
shares
Shares
outstanding
Balance as of December 31, 2012 104,000,000 739,254 103,260,746
Purchase of treasury shares 0 433,600 -433,600
Used to cover share options and employee participation programs 0 -955,861 955,861
Balance as of December 31, 2013 104,000,000 216,993 103,783,007
Purchase of treasury shares 0 672,000 -672,000
Used to cover share options and employee participation programs 0 -85,886 85,886
Balance as of December 31, 2014 104,000,000 803,107 103,196,893
Management share option programs
Due to the fact that the management share option plans do not include cash settlements, these corresponding expenses are recorded directly as equity according to the International Financial Reporting Standards.
The options granted in 2010 totaled 2,066,000. The fair value of the options at the time of granting amounts to 8,362 TEUR, where no expense was recognized in 2014.
2,146,000 options were granted in 2012. The fair value of the options at the time of granting amounts to 13,553 TEUR; 4,518 TEUR thereof were reported as proportionate expense in 2014.
Furthermore, 1,012,500 options were granted in 2014. The fair value of the options at the time of granting amounts to 8,159 TEUR; 1,586 TEUR thereof were reported as proportionate expense in 2014.
Movements in options under the share option plans for the 2014 and 2013 financial years were as follows:
2014 2013
Number of
options
Average exercise
price per option
(in EUR)
Number of
options
Average exercise
price per option
(in EUR)
Balance as of January 1 2,215,000 36.07 4,045,000 30.59
Options granted 1,012,500 44.42 0 0
Options exercised -76,000 23.18 -1,722,000 23.18
Options expired and forfeited -84,000 35.15 -108,000 36.50
Balance as of December 31, 2014 3,067,500 39.17 2,215,000 36.07
Exercisable at year-end 84,000 23.18 172,000 23.18
Non-controlling interests
The share ownership of third parties in Group entities is recognized in this item.

76 Notes to the consolidated financial statements
The following overview contains information on those ANDRITZ subsidiaries in which it does not have a control-ling interest:
Name of subsidiary Headquarters
Proportion of
ownership interests
and voting rights held
by non-controlling
interests
Profit (loss)
allocated to non-
controlling
interests
Accumulated
non-controlling
interests
2014 2013 2014 2013 2014 2013
ANDRITZ - Wolfensberger Special
Alloy Foundry Co. Ltd. Foshan, China 5.00% 5.00% -72 -47 -330 -235
PT. ANDRITZ HYDRO Jakarta,
Indonesia 49.00% 49.00% 552 1,106 1,099 1,389
ANDRITZ HYDRO Inepar do Brasil
S/A
Araraquara,
Brazil 25.67% 50.00% -2,738 -11,144 -1,499 10,144
ANDRITZ HYDRO Hammerfest AS Hammerfest,
Norway 40.12% 40.57% 436 53 8,172 7,296
ANDRITZ HYDRO Hammerfest (UK)
Limited
Glasgow, United
Kingdom 40.12% 40.57% -455 -3,335 -11,300 -10,241
Shanghai Shende Machinery Co.
Ltd. Shanghai, China 20.00% 20.00% 11 -80 1,681 1,506
Schuler Aktiengesellschaft (sub
group)
Göppingen,
Germany 3.38% 3.98% 1,378 30 18,898 19,884
TOTAL 16,721 29,743
The share of equity and result attributable to non-controlling interests is shown separately in the consolidated statement of financial position, in the consolidated income statement, and in the statement of comprehensive income. The purchase method was applied for all companies acquired. Companies that were purchased or sold in the course of the year were included in the consolidated financial statements as from the date of purchase or up to the time of their sale.

77 Notes to the consolidated financial statements
The summarized financial information on subsidiaries with significant non-controlling interests is the following:
2014
(in TEUR)
ANDRITZ
HYDRO Inepar
do Brasil S/A
ANDRITZ
HYDRO
Hammerfest AS
ANDRITZ
HYDRO
Hammerfest
(UK) Limited
Schuler
Aktien-
gesellschaft
(sub group)
Current assets 74,126 29,221 5,450 841,357
Non-current assets 70,509 8 946 400,998
Current liabilities -97,382 -7,680 -36,323 -573,477
Non-current liabilities -13,186 0 -2,348 -297,000
Non-controlling interests of sub group -6,297
NET ASSETS 34,067 21,549 -32,274 365,580
PROPORTION OF OWNERSHIP INTERESTS
AND VOTING RIGHTS HELD BY NON-
CONTROLLING INTERESTS 25.67% 40.12% 40.12% 3.38%
NET BOOK VALUE OF NON-CONTROLLING
INTERESTS* 8,745 8,644 -12,947 18,647
SALES 118,158 0 711 1,178,495
Profit/loss -5,147 1,087 -77 32,985
Other comprehensive income 0 0 0 -13,147
TOTAL COMPREHENSIVE INCOME -5,147 1,087 -77 19,838
Thereof attributable to:
Shareholders of the parent -3,826 651 -46 19,168
Non-controlling shareholder -1,321 436 -31 670
DIVIDENDS PAID TO NON-CONTROLLING
INTEREST HOLDERS 0 0 0 -195
Cash flow from operating activities -25,871 -1,500 3,192 152,058
Cash flow from investing activities 3,511 0 -5 -20,712
Cash flow from financing activities 22,051 1,309 4 195
TOTAL -309 -191 3,190 131,541
* The share of non-controlling interests of Schuler Aktiengesellschaft (sub group) amounting to 6,297 TEUR is included in the book value of non-
controlling interests.
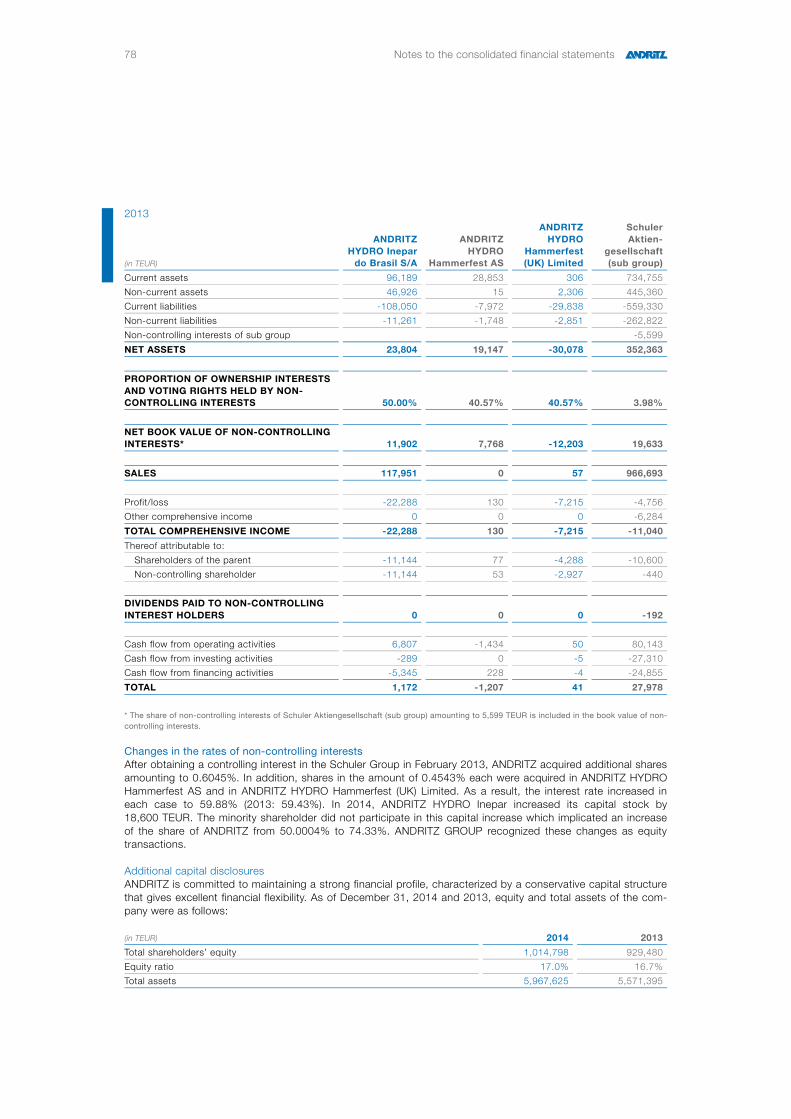
78 Notes to the consolidated financial statements
2013
(in TEUR)
ANDRITZ
HYDRO Inepar
do Brasil S/A
ANDRITZ
HYDRO
Hammerfest AS
ANDRITZ
HYDRO
Hammerfest
(UK) Limited
Schuler
Aktien-
gesellschaft
(sub group)
Current assets 96,189 28,853 306 734,755
Non-current assets 46,926 15 2,306 445,360
Current liabilities -108,050 -7,972 -29,838 -559,330
Non-current liabilities -11,261 -1,748 -2,851 -262,822
Non-controlling interests of sub group -5,599
NET ASSETS 23,804 19,147 -30,078 352,363
PROPORTION OF OWNERSHIP INTERESTS
AND VOTING RIGHTS HELD BY NON-
CONTROLLING INTERESTS 50.00% 40.57% 40.57% 3.98%
NET BOOK VALUE OF NON-CONTROLLING
INTERESTS* 11,902 7,768 -12,203 19,633
SALES 117,951 0 57 966,693
Profit/loss -22,288 130 -7,215 -4,756
Other comprehensive income 0 0 0 -6,284
TOTAL COMPREHENSIVE INCOME -22,288 130 -7,215 -11,040
Thereof attributable to:
Shareholders of the parent -11,144 77 -4,288 -10,600
Non-controlling shareholder -11,144 53 -2,927 -440
DIVIDENDS PAID TO NON-CONTROLLING
INTEREST HOLDERS 0 0 0 -192
Cash flow from operating activities 6,807 -1,434 50 80,143
Cash flow from investing activities -289 0 -5 -27,310
Cash flow from financing activities -5,345 228 -4 -24,855
TOTAL 1,172 -1,207 41 27,978
* The share of non-controlling interests of Schuler Aktiengesellschaft (sub group) amounting to 5,599 TEUR is included in the book value of non-
controlling interests.
Changes in the rates of non-controlling interests After obtaining a controlling interest in the Schuler Group in February 2013, ANDRITZ acquired additional shares
amounting to 0.6045%. In addition, shares in the amount of 0.4543% each were acquired in ANDRITZ HYDRO
Hammerfest AS and in ANDRITZ HYDRO Hammerfest (UK) Limited. As a result, the interest rate increased in each case to 59.88% (2013: 59.43%). In 2014, ANDRITZ HYDRO Inepar increased its capital stock by
18,600 TEUR. The minority shareholder did not participate in this capital increase which implicated an increase
of the share of ANDRITZ from 50.0004% to 74.33%. ANDRITZ GROUP recognized these changes as equity transactions.
Additional capital disclosures ANDRITZ is committed to maintaining a strong financial profile, characterized by a conservative capital structure
that gives excellent financial flexibility. As of December 31, 2014 and 2013, equity and total assets of the com-
pany were as follows:
(in TEUR) 2014 2013
Total shareholders’ equity 1,014,798 929,480
Equity ratio 17.0% 16.7%
Total assets 5,967,625 5,571,395

79 Notes to the consolidated financial statements
ANDRITZ is not subject to any statutory capital requirements. Commitments exist to sell shares in connection
with established share-based payment plans. In recent years, commitments from share-based payment have primarily been satisfied through buy-back of the company’s shares.
The Group manages its capital to ensure that entities in the Group will be able to continue as a going concern while optimizing the return to shareholders through the optimization of the debt and equity balance. Bonds were
issued in the past to safeguard the financial stability and also to build the foundation for further growth of the
ANDRITZ GROUP. The capital structure of the Group consists of debt, cash and cash equivalents, and equity attributable to shareholders of the parent, comprising share capital, capital reserves, and retained earnings.
The capital structure is reviewed on an ongoing basis. The cost of capital and the risks associated with each class of capital are considered as a part of this review. Based on this, the Group is committed to optimize its
overall capital structure through the payment of dividends, new share issues, and share buy-backs, as well as
the issue of new debt or the redemption of existing debt.
The Group’s overall strategy remains unchanged from 2013.
24. Maturities of financial liabilities
2014
(in TEUR)
Remaining
term less
than 1 month
Remaining
term between
1 and 3
months
Remaining
term between 4
and 12 months
Remaining
term between
1 and 5 years
Remaining
term over
5 years Total
Bonds 0 150,839 0 370,130 0 520,969
Bank loans and other
financial liabilities 3,401 31,457 41,049 38,448 6,355 120,710
Obligations under
finance leases 58 138 606 2,639 11,925 15,366
3,459 182,434 41,655 411,217 18,280 657,045
2013
(in TEUR)
Remaining
term less
than 1 month
Remaining
term between
1 and 3
months
Remaining
term between 4
and 12 months
Remaining
term between
1 and 5 years
Remaining
term over
5 years Total
Bonds 0 0 0 156,566 354,092 510,658
Bank loans and other
financial liabilities 5,665 24,486 32,853 38,020 6,463 107,487
Obligations under
finance leases 73 205 684 2,779 12,545 16,286
5,738 24,691 33,537 197,365 373,100 634,431
The interest-bearing borrowings primarily consist of current bank loans at floating interest rates and fixed rates.
There are no substantial credit defaults in the ANDRITZ GROUP; all of the financial liabilities are settled in gen-
eral on the due date.
The net book value of liabilities corresponds essentially to the fair value.

80 Notes to the consolidated financial statements
25. Provisions
2014
(in TEUR)
Balance
as of
January
1, 2014
Currency
translation
adjust-
ments
Changes
in con-
soli-
dation
scope
Re-
classi-
fication Use Release
Addi-
tions
Un-
winding
of dis-
count
effect
Balance
as of
Decem-
ber 31,
2014
Provisions for
severance payments 90,089 59 0 0 4,814 0 10,052 2,996 98,382
Provisions for
pensions 183,354 924 5,708 0 4,285 0 82,072 -7,091 260,682
Order-related non-
current provisions 140,988 1,740 0 -28,517 8,396 34,322 50,714 59 122,266
Other non-current
provisions 24,132 507 0 14,629 11,427 -16,491 21,607 1,571 67,510
Non-current
provisions 438,563 3,230 5,708 -13,888 28,922 17,831 164,445 -2,465 548,840
Order-related current
provisions 496,703 6,349 956 -40,501 73,626 152,095 142,052 0 379,838
Other current
provisions 58,360 824 2,690 54,389 28,304 38,443 77,931 71 127,518
Current provisions 555,063 7,173 3,646 13,888 101,930 190,538 219,983 71 507,356
2013
(in TEUR)
Balance
as of
January
1, 2013
Currency
translation
adjust-
ments
Changes
in con-
soli-
dation
scope
Re-
classi-
fication Use Release
Addi-
tions
Un-
winding
of dis-
count
effect
Balance
as of
Decem-
ber 31,
2013
Provisions for
severance payments 85,263 -45 -102 0 5,811 0 7,658 3,126 90,089
Provisions for
pensions 100,254 -1,741 99,380 0 7,459 452 -12,737 6,109 183,354
Order-related non-
current provisions 108,361 -4,273 14,677 8,796 17,231 34,102 64,568 192 140,988
Other non-current
provisions 18,348 -60 4,838 284 506 8 493 743 24,132
Non-current
provisions 312,226 -6,119 118,793 9,080 31,007 34,562 59,982 10,170 438,563
Order-related current
provisions 394,071 -9,945 50,493 -8,511 61,266 87,963 219,763 61 496,703
Other current
provisions 19,150 -1,208 4,422 -569 4,419 2,093 43,077 0 58,360
Current provisions 413,221 -11,153 54,915 -9,080 65,685 90,056 262,840 61 555,063
Order-related provisions primarily include provisions for order-related risks and impending losses.
ANDRITZ expects the order-related non-current provisions generally to result in cash outflows during the next three years. For order-related current provisions, the company expects cash outflows within the next financial
year.
26. Employee benefits
Pensions plans
Some Group companies provide defined benefit pension plans for some classes of employees. Provisions for pension obligations are established for benefits payable in the form of retirement, disability, and surviving de-
pendent pensions. The benefits offered vary according to the legal, fiscal, and economic conditions in each
country. Benefits are dependent on years of service and, in some cases, on the respective employee’s compen-sation.

81 Notes to the consolidated financial statements
According to IAS 19.138, the pension plans are itemized according to the different geographic locations. The
pension plans largely relate to Germany, Austria, and to Switzerland. The "Other" category primarily relates to France, Finland, the Netherlands, and Canada.
The following table shows the changes in pension benefit obligation from January 1 to December 31, 2014 and 2013:
2014
(in TEUR)
Germany and
Austria Switzerland Other Total
Defined benefit obligation as of
January 1 216,848 156,075 54,307 427,230
Currency translation adjustments 163 3,644 2,618 6,424
Current service cost 3,708 4,775 390 8,873
Interest cost on obligations 7,489 3,452 2,439 13,380
Actuarial gains (-) and losses (+)
from change in demographic
assumptions 361 0 -56 305
Actuarial gains (-) and losses (+)
from change in financial
assumptions 47,342 26,819 8,310 82,471
Actuarial gains (-) and losses (+)
from change in experience
adjustments 288 4,240 -391 4,137
Benefits paid -10,912 -11,949 -2,614 -25,475
Contributions by the plan
participants 2,512 3,241 0 5,753
Past service cost 0 -3,373 -511 -3,884
Effects of plan curtailments and
settlements 0 0 44 44
Other changes 805 0 0 805
Changes in consolidation scope 0 4,024 20,283 24,307
Defined benefit obligation as of
December 31 268,604 190,948 84,819 544,370
Fair value of plan assets -48,688 -168,481 -66,631 -283,800
Reduction of assets 111 0 0 111
Defined benefit liability as of
December 31 220,027 22,467 18,188 260,681
Other changes amounting to 805 TEUR contain adjustments according to IFRS 3 from the final evaluation of the
acquisition of Modul Systeme Engineering AG, Germany (including its subsidiaries). In addition, 288 TEUR are
captured as other changes in the plan assets. In total, this causes an adjustment of provisions amounting to
577 TEUR.

82 Notes to the consolidated financial statements
2013
(in TEUR)
Germany and
Austria Switzerland Other Total
Defined benefit obligation as of
January 1 84,820 110,022 63,883 258,725
Currency translation adjustments -56 -2,070 -5,038 -7,164
Current service cost 2,628 4,796 722 8,146
Interest cost on obligations 6,714 2,300 2,389 11,403
Actuarial gains (-) and losses (+)
from change in demographic
assumptions 0 0 1,177 1,177
Actuarial gains (-) and losses (+)
from change in financial
assumptions -1,286 -5,589 -5,659 -12,534
Actuarial gains (-) and losses (+)
from change in experience
adjustments -514 -1,469 782 -1,201
Benefits paid -10,061 -6,945 -1,861 -18,867
Contributions by the plan
participants 1,878 2,686 0 4,564
Past service cost 2,257 -1,117 -40 1,100
Effects of plan curtailments and
settlements -47 0 -2,283 -2,330
Other changes 0 53,461 236 53,697
Changes in consolidation scope 130,514 0 0 130,514
Defined benefit obligation as of
December 31 216,847 156,075 54,308 427,230
Fair value of plan assets -46,126 -154,730 -44,732 -245,588
Reduction of assets 649 1,063 0 1,712
Defined benefit liability as of
December 31 171,370 2,408 9,576 183,354
The weighted average term of defined benefit obligations amounted to 12.96 years for Germany and Austria
(2013: 11.96 years), 16.84 years for Switzerland (2013: 18.90 years), and 10.36 years for others (2013:
7.34 years) as of December 31, 2014. In total, the weighted average term of defined benefit obligations amount-ed to 13.11 years on December 31, 2014 (2013: 12.60 years).
The following table reconciles the fair value of plan assets:
2014
(in TEUR)
Germany and
Austria Switzerland Other Total
Fair value of plan assets as of January 1 46,126 154,730 44,732 245,588
Currency translation adjustments 59 3,393 2,048 5,500
Interest revenue 1,660 3,398 2,067 7,125
Return on plan assets (excl. interest revenue) 2,296 6,912 4,138 13,346
Contributions by the employer 2,474 4,701 1,657 8,832
Contributions by the plan participants 3 3,242 0 3,245
Benefits paid -4,158 -11,949 -2,531 -18,638
Effects of plan curtailments and settlements 0 0 0 0
Other changes 228 0 -25 203
Changes in consolidation scope 0 4,055 14,544 18,599
Fair value of plan assets as of December 31 48,688 168,482 66,630 283,800
Other changes in 2014 result from adjustments according to IFRS 3 from the final evaluation of the acquisition of
Modul Systeme Engineering AG, Germany (including its subsidiaries).

83 Notes to the consolidated financial statements
2013
(in TEUR)
Germany and
Austria Switzerland Other Total
Fair value of plan assets as of January 1 14,644 100,681 43,146 158,471
Currency translation adjustments -20 -1,523 -3,880 -5,423
Interest revenue 1,486 2,139 1,669 5,294
Return on plan assets (excl. interest revenue) 292 -529 2,411 2,174
Contributions by the employer 1,077 4,526 3,360 8,963
Contributions by the plan participants 0 2,686 0 2,686
Benefits paid -2,487 -6,945 -1,976 -11,408
Effects of plan curtailments and settlements 0 0 0 0
Other changes 0 53,697 0 53,697
Changes in consolidation scope 31,134 0 0 31,134
Fair value of plan assets as of December 31 46,126 154,732 44,730 245,588
The plan assets are invested as follows:
2014
(in TEUR)
Germany and
Austria Switzerland Other Total
Equity instruments 6,286 32,270 20,230 58,786
thereof listed on an active market 6,216 32,270 20,230 58,716
Debt instruments 10,270 74,869 29,903 115,042
thereof listed on an active market 9,233 74,869 29,903 114,005
Property, plant, and equipment 630 38,603 0 39,233
thereof listed on an active market 0 4,156 0 4,156
Other assets 31,503 22,738 16,498 70,739
thereof listed on an active market 729 19,211 9,609 29,549
48,689 168,480 66,631 283,800
2013
(in TEUR)
Germany and
Austria Switzerland Other Total
Equity instruments 6,079 30,448 19,149 55,676
thereof listed on an active market 5,879 30,448 19,149 55,476
Debt instruments 8,074 71,538 15,789 95,401
thereof listed on an active market 8,074 71,538 15,789 95,401
Property, plant, and equipment 681 35,312 0 35,993
thereof listed on an active market 0 2,914 0 2,914
Other assets 31,291 17,433 9,794 58,518
thereof listed on an active market 383 14,102 3,432 17,917
46,125 154,731 44,732 245,588
The actual investment gain from plan assets in 2014 amounted to 7.02% (2013: investment gain of 3.18%).

84 Notes to the consolidated financial statements
The pension costs comprise:
(in TEUR) 2014 2013
Current service cost 8,873 8,146
Past service cost -3,884 1,100
Effects of plan curtailments and settlements 44 -2,330
5,033 6,916
Payments to defined contribution plans 30,884 29,811
35,917 36,727
Basic actuarial assumptions for calculation of pension obligations as of December 31, 2014 and 2013, of the main Group companies are as follows:
2014
(in %)
Germany and
Austria Switzerland Other
Discount rate 1.95 1.26 3.54
Wage and salary increases 2.31 1.00 1.62
Retirement benefit increases 1.96 0.00 0.30
2013
(in %)
Germany and
Austria Switzerland Other
Discount rate 3.50 2.26 4.05
Wage and salary increases 2.50 0.98 2.55
Retirement benefit increases 2.00 0.01 0.53
The financing status changed as follows:
(in TEUR) 2014 2013 2012 2011 2010
Present value of defined benefit obligation 544,370 427,230 258,725 217,494 198,284
Fair value of plan assets 283,800 245,588 158,471 132,187 126,437
Deficit of the plan 260,570 181,642 100,254 85,307 71,847
Payments to the pension fund for defined benefits are expected in the amount of 12,491 TEUR for 2015.
As of December 31, 2014, there are no extraordinary risks specific to the company or to the plan nor substantial
risk concentrations according to IAS 19.139.
Discretionary judgments and forward-looking assumptions
The valuation of existing pension provisions is based on assumptions relating to the discount rate, retirement
age, life expectancy, future salary increases, and increases in pension benefits.
A change of +/- 0.5 percentage points in the discount factor, of +/- 0.5 percentage points in the salary increase,
of +/- 0.5 percentage points in pension benefits, and of +/- 1 year in life expectancy would have the following effects on the present value of the pension obligation if all other parameters remain the same:

85 Notes to the consolidated financial statements
2014
(in TEUR)
Germany
and Austria Switzerland Other Total
Discount rate +0.5% -17,267 -14,423 -5,822 -37,512
-0.5% 19,396 16,488 6,521 42,405
Wage and salary increases +0.5% 978 1,694 750 3,422
-0.5% -911 -1,685 -712 -3,308
Retirement benefit increases +0.5% 11,341 12,141 709 24,191
-0.5% -10,270 -963 -476 -11,709
Life expectancy +1 year 9,319 4,993 1,927 16,239
-1 year -9,352 -5,104 -1,866 -16,322
2013
(in TEUR)
Germany
and Austria Switzerland Other Total
Discount rate +0.5% -12,738 -8,281 -3,575 -24,594
-0.5% 14,092 9,537 3,977 27,606
Wage and salary increases +0.5% 700 57 607 1,364
-0.5% -657 -114 -606 -1,377
Retirement benefit increases +0.5% 8,342 8,435 607 17,384
-0.5% -7,551 342 -571 -7,780
Life expectancy +1 year 4,832 2,870 1,022 8,724
-1 year -4,928 -2,945 -939 -8,812
The sensitivity analysis presented above may not be representative of the actual changes in the defined benefit
obligation as it is unlikely that the change in assumptions would occur in isolation of one another as some of the
assumptions may be correlated.
Severance obligations
In accordance with IAS19.138, a breakdown of severance obligations to the different geographical location is omitted, since they largely relate to Germany and Austria.
The following table shows the changes in defined benefit obligations from January 1 to December 31, 2014 and 2013:
(in TEUR) 2014 2013
Defined benefit obligation as of January 1 91,088 86,100
Currency translation adjustments 183 -205
Current service cost 2,733 3,183
Interest cost on obligations 3,065 3,196
Actuarial gains (-) and losses (+) from change in demographic assumptions -90 -62
Actuarial gains (-) and losses (+) from change in financial assumptions 10,975 2,770
Actuarial gains (-) and losses (+) from change in experience adjustments -3,418 1,976
Benefits paid -4,858 -5,870
Effects of plan curtailments and settlements 0 0
Changes in consolidation scope 0 0
Defined benefit obligation as of December 31 99,678 91,088
Fair value of plan assets -1,296 -999
Defined benefit liability as of December 31 98,382 90,089
The weighted average term of the benefit obligation on December 31, 2014, is 11.5 years (13.1 years in the
previous year).

86 Notes to the consolidated financial statements
The following table reconciles the fair value of plan assets:
(in TEUR) 2014 2013
Fair value of plan assets as of January 1 999 837
Currency translation adjustments 124 -160
Interest revenue 100 70
Return on plan assets (excl. interest revenue) -31 11
Contributions by the employer 148 198
Contributions by the plan participants 0 0
Benefits paid -44 -59
Effects of plan curtailments and settlements 0 0
Changes in consolidation scope 0 102
Fair value of plan assets as of December 31 1,296 999
The plan assets are invested as follows:
(in TEUR) 2014 2013
Equity instruments 0 129
thereof listed on an active market 0 129
Debt instruments 1,009 824
thereof listed on an active market 0 0
Property, plant, and equipment 0 0
thereof listed on an active market 0 0
Other assets 287 46
thereof listed on an active market 91 46
1,296 999
The expenses for severance payments consist of:
(in TEUR) 2014 2013
Current service cost 2,733 3,183
Effects of plan curtailments and settlements 0 0
2,733 3,183
Payments to defined contribution plans 2,490 35,600
5,223 38,783
The financing status changed as follows:
(in TEUR) 2014 2013 2012 2011 2010
Present value of defined benefit obligation 99,678 91,088 86,100 78,571 74,596
Fair value of plan assets 1,296 999 837 716 660
Deficit of the plan 98,382 90,089 85,263 77,855 73,936
The basic actuarial assumptions used to determine severance obligations were the same as used for pension obligations.
Discretionary judgments and forward-looking assumptions The valuation of existing severance payment provisions is based on assumptions relating to the discount rate,
retirement age, life expectancy, and future salary increases.
A +/- 0.5 percentage point change in the discount factor and a change of +/- 0.5 percentage points in the salary
increase would have the following effects on the present value of the severance obligation if all other parameters
remain the same:

87 Notes to the consolidated financial statements
(in TEUR) 2014 2013
Sensitivity
+0.5%
Sensitivity
-0.5%
Sensitivity
+0.5%
Sensitivity
-0.5%
Discount rate -4,631 5,027 -4,025 4,587
Wage and salary increases 4,916 -4,554 4,542 -4,013
The sensitivity analysis presented above may not be representative of the actual changes in the defined benefit obligation as it is unlikely that the change in assumptions would occur in isolation of one another as some of the
assumptions may be correlated.
27. Other liabilities
(in TEUR) 2014 2013
Outstanding invoices for order-related costs 588,126 570,853
Unused vacation and other personnel-related accruals 213,323 200,830
Liabilities from value-added tax and from other taxes and charges 60,400 45,422
Liabilities from commissions 8,445 24,222
Foreign exchange forward contracts at fair value 76,815 22,635
Embedded derivatives at fair value 15,801 18,103
Prepayments and deferred charges 8,357 12,756
Others 135,860 116,678
1,107,127 1,011,499
thereof other current liabilities 1,047,217 957,125
thereof other non-current liabilities 59,910 54,374
1,107,127 1,011,499
The net book value of other liabilities corresponds essentially to the fair value.

88 Notes to the consolidated financial statements
K) NOTES TO THE CONSOLIDATED STATEMENT OF CASH FLOWS Cash flows from company acquisitions*
(in TEUR) Business area Total Total
HY ME 2014 2013
Intangible assets 752 8,628 9,380 282,126
Property, plant, and equipment 2,138 18,008 20,146 178,868
Inventories 0 7,128 7,128 170,854
Trade and other receivables 0 10,935 10,935 272,235
Liabilities -2,164 -20,448 -22,612 -739,824
Non-interest bearing net assets 726 24,251 24,977 164,259
Marketable securities 0 0 0 0
Cash and cash equivalents 1,772 34 1,806 342,317
Financial assets 0 0 0 2,992
Financial liabilities 0 -89 -89 -109,970
Goodwill 729 8,074 8,803 222,833
Non-controlling interests 0 0 0 -34,008
Total purchase price 3,227 32,270 35,497 588,423
Purchase price paid -3,227 -32,270 -35,497 -431,173
Cash and cash equivalents acquired 1,772 34 1,806 342,316
Net cash flow -1,455 -32,236 -33,691 -88,857
Liabilities from purchase price not paid 0 0 0 -4,446
Fair value of investments previously held under equity method 0 0 0 -152,804
Purchase price not paid in cash 0 0 0 -157,250
* Converted by using exchange rates as per dates of transaction
The initial accounting for the businesses acquired in 2014 is based on preliminary figures. The final evaluation of the balance sheet items disclosed in the cash flows from acquisition will be carried out according to the regula-
tions of IFRS 3 (revised) “Business Combinations”.
L) REPORTING ON FINANCIAL INSTRUMENTS a) Fair value of financial instruments
The fair value is the amount for which financial instruments could be exchanged between knowledgeable, willing parties in an arm’s length transaction.
Other investments The fair values of publicly traded securities and participations are based on quoted market prices. If no public
listings are available, the fair values were calculated on the basis of discounted cash flows expected in the fu-
ture.
Shares in non-consolidated companies and other shares are stated at cost except shares of listed companies
because the fair value cannot be determined reliably. Investments in associated companies are measured using the equity method unless they are only of minor importance.
Non-current securities are classified as financial assets available for sale and are valued at their quoted market price at the balance sheet date.
Trade accounts receivable The fair value of non-current receivables with a remaining term of over one year is the same as the present
values, taking the current interest rate parameter into consideration in each case. In the current trade accounts
receivable it is assumed that the fair values are the same as the net book values.
Receivables and other assets
The fair value of non-current receivables and other assets with a remaining term of over one year is the same as the present values, taking the current interest rate parameter into consideration in each case. In the current
accounts receivable and other assets, it is assumed that the fair values are the same as the net book values.

89 Notes to the consolidated financial statements
Financial instruments that are valued at fair value through profit or loss and those that are included in a hedge
accounting instrument comprise currency and interest rate hedging contracts. Derivatives traded on the stock exchange are valued at quoted market prices. The fair value of foreign exchange and commodity forward con-
tracts is based on current forward rates. Interest rate swaps and forward rate agreements are based on dis-
counted cash flows, where the market interest rate for the remaining term is applied. Both the credit risk of the contracting part and the Group’s own credit risk are included in a Credit Value Adjustment (CVA) for assets and
in a Debit Value Adjustment (DVA) for liabilities.
Marketable securities
The fair values of publicly traded instruments are based on quoted market prices. The Group’s securities are
classified as financial assets available for sale.
Cash and cash equivalents
The net book value of cash and cash equivalents is the same as the market value due to the relatively short-term maturity of these financial instruments.
Financial liabilities The fair value of non-current financial liabilities is determined as present values of the expected future cash
flows. The discount rates are based on the current interest rates available for liabilities with the same maturity
profile.
Trade accounts payable
It is assumed that the fair values are the same as the net book values of these financial instruments due to their short-term maturities.
Other liabilities The financial liabilities classified at fair value through profit or loss relate to derivatives that are not included in
hedge accounting. For details of these financial instruments and derivatives included in hedge accounting,
please refer to the information provided under “Receivables and other assets”.
The other current liabilities are valued at amortized cost. Other non-current liabilities with a remaining term of
over one year are the same as the present values, taking the current interest parameters into account.
b) Information on financial instruments according to categories
The following table shows the allocation of financial assets and liabilities to the IFRS categories and to the three levels of the fair value hierarchy. It distinguishes fair value measurements by the significance of the inputs used
and reflects the availability of market inputs observed when estimating fair values.
The levels of the fair value hierarchy and their application to financial assets and liabilities are described below:
Level 1: Prices quoted in active markets for identical assets or liabilities.
Level 2: Inputs other than market prices quoted that can be observed for the asset or liability, either directly (i.e.
as prices) or indirectly (i.e. derived from prices).
Level 3: Inputs for the asset or liability that are not based on market data observed.
The net book value is to be assumed as a realistic estimate for cash and cash equivalents, current trade ac-
counts receivable and other receivables, current trade liabilities and other liabilities due to the short remaining
term.
Those financial instruments, for which there are no liquid markets available and where none of the factors rele-
vant for valuation models can be observed on active markets, are shown in the table as Level 3.

90 Notes to the consolidated financial statements
(in TEUR) Net book value December 31, 2014 Fair value December 31, 2014
Notes
Held for
trading
Hedge
accounting
Loans and
receivables
Available
for sale
Other
financial
liabilities
None IAS 39
valuation
category Total
thereof
level 1
thereof
level 2
thereof
level 3 Total
ASSETS
Other investments 14.
Securities and loans against borrowers' notes - non-
current 45,000 45,000 45,029 45,029
Shares in non-consolidated companies and other shares* 10,591 10,591 10,591 10,591
Investment securities 7,100 7,100 7,100 7,100
Others 8,534 8,534 8,534 8,534
Trade accounts receivable 15.
Trade accounts receivable - non-current 62,522 62,522 62,645 62,645
Trade accounts receivable - current 705,819 705,819 705,819 705,819
Other receivables and assets 16.
Securities and loans against borrowers' notes - current 45,000 45,000 45,000 45,000
Other receivables and assets - non-current 70,107 70,107 70,156 70,156
Other receivables and assets - current 198,853 56,706 255,559 255,559 255,559
Cost and earnings of projects under construction in
excess of billings 19. 502,183 502,183 502,183 502,183
Derivatives L) 23,269 20,496 43,765 43,765 43,765
Embedded derivatives L) 47,646 47,646 47,646 47,646
Marketable securities 20. 154,294 154,294 154,294 154,294
Cash and cash equivalents 21. 1,457,335 1,457,335 1,457,335 1,457,335
TOTAL ASSETS 70,915 20,496 3,095,353 171,985 56,706 3,415,455 161,394 3,243,671 10,591 3,415,656
LIABILITIES
Financial liabilities 24.
Bonds - non-current 370,130 370,130 370,130 370,130
Bonds - current 150,839 150,839 150,839 150,839
Bank loans and other financial liabilities - non-current 44,803 44,803 44,803 44,803
Bank loans and other financial liabilities - current 75,907 75,907 75,907 75,907
Obligations under finance leases 15,366 15,366 15,366 15,366
Trade accounts payable 493,436 493,436 493,436 493,436
Other liabilities 27.
Other liabilities - non-current 33,402 33,402 33,488 33,488
Other liabilities - current 912,304 68,757 981,061 981,061 981,061
Billings in excess of cost and earnings of projects under
construction 19. 1,203,593 1,203,593 1,203,593 1,203,593
Derivatives L) 71,623 5,240 76,863 76,863 76,863
Embedded derivatives L) 15,801 15,801 15,801 15,801
TOTAL LIABILITIES 87,424 5,240 2,080,821 1,287,716 3,461,201 3,461,287 3,461,287
* This contains the equity holdings valued at cost for which fair values cannot be determined reliably (10,591 TEUR)

91 Notes to the consolidated financial statements
(in TEUR) Net book value December 31, 2013 Fair value December 31, 2013
Notes
Held
for
trading
Hedge
accounting
Loans and
receivables
Available
for sale
Other
financial
liabilities
None IAS 39
valuation
category Total
thereof
level 1
thereof
level 2
thereof
level 3 Total
ASSETS
Other investments 14.
Securities and loans against borrowers' notes - non-
current 20,000 20,000 20,185 20,185
Shares in non-consolidated companies and other shares* 14,346 14,346 14,346 14,346
Investment securities 7,184 7,184 7,184 7,184
Others 4,119 4,119 4,119 4,119
Trade accounts receivable 15.
Trade accounts receivable - non-current 16,849 16,849 16,770 16,770
Trade accounts receivable - current 620,821 620,821 620,821 620,821
Other receivables and assets 16.
Securities and loans against borrowers' notes - current 110,000 110,000 110,000 110,000
Other receivables and assets - non-current 47,635 47,635 46,700 46,700
Other receivables and assets - current 168,069 66,851 234,920 234,920 234,920
Cost and earnings of projects under construction in excess
of billings 19. 509,534 509,534 509,534 509,534
Derivatives L) 31,614 11,141 42,755 42,755 42,755
Embedded derivatives L) 16,396 16,396 16,396 16,396
Marketable securities 20. 159,107 159,107 159,107 159,107
Cash and cash equivalents 21. 1,227,860 1,227,860 1,227,860 1,227,860
TOTAL ASSETS 48,010 11,141 2,724,887 180,637 66,851 3,031,526 166,291 2,850,060 14,346 3,030,697
LIABILITIES
Financial liabilities 24.
Bonds - non-current 510,658 510,658 510,658 510,658
Bonds - current
Bank loans and other financial liabilities - non-current 44,483 44,483 44,483 44,483
Bank loans and other financial liabilities - current 63,004 63,004 63,004 63,004
Obligations under finance leases 16,286 16,286 16,286 16,286
Trade accounts payable 453,219 453,219 453,219 453,219
Other liabilities 27.
Other liabilities - non-current 36,501 36,501 35,778 35,778
Other liabilities - current 875,875 58,178 934,053 934,053 934,053
Billings in excess of cost and earnings of projects under
construction 19. 1,081,412 1,081,412 1,081,412 1,081,412
Derivatives L) 22,479 363 22,842 22,842 22,842
Embedded derivatives L) 18,103 18,103 18,103 18,103
TOTAL LIABILITIES 40,582 363 1,983,740 1,155,876 3,180,561 3,179,838 3,179,838
* This contains the equity holdings valued at cost for which fair values cannot be determined reliably (14,346 TEUR)

92 Notes to the consolidated financial statements
No financial instruments measured at fair value were transferred between the hierarchy levels during the report-
ing period.
Shares in non-consolidated companies and other shares (disclosed under level 3) are accounted for at cost, as
their fair value cannot be reliably measured.
c) Fair value hedges
The Group uses interest rate swaps to hedge the change in fair value of emitted bonds due to interest rate changes. If the hedge is determined to be effective, the net book value of the hedged item is adjusted for
changes in the fair value attributable to the hedged risk.
The following table shows the changes recognized through profit or loss from hedged items and hedging in-
struments in fair value hedging relationships:
(in TEUR) 2014 2013
From hedged item -10,311 17,595
From hedging instrument 9,970 -18,011
Losses recognized through profit or loss -341 -416
The portfolio of bonds (hedged items) changed as follows:
(in TEUR) 2014 2013
Balance as of January 1 510,658 711,753
Gains (-)/Losses (+) recognized through profit or loss 10,311 -17,595
Issue 0 0
Settlements 0 -183,500
Balance as of December 31 520,969 510,658
d) Cash flow hedges
The following table shows reconciliation of the reserve for cash flow hedges in the equity:
(in TEUR) Cash flow hedge reserve
Balance as of December 31, 2012 0
Gains and losses from changes in fair value -318
Related deferred income taxes 124
Transfers to income statement 0
Related deferred income taxes 0
Balance as of December 31, 2013 -194
Losses from changes in fair value -5,054
Related deferred income taxes 1,539
Transfers to income statement -273
Related deferred income taxes 82
BALANCE AS OF DECEMBER 31, 2014 -3,900
Changes representing the effective portions of the hedge accounting and recognized in equity (IAS 39 reserve)
are shown in the consolidated statement of comprehensive income. The cumulative effects in equity are re-
leased to income and recognized in the income statement under billings or cost of materials (foreign exchange
derivatives) and in other income or other expenses (interest rate derivatives), respectively, when the underlying
hedge transaction is realized.
e) Derivative financial transactions
The fair value of foreign exchange forward contracts and embedded derivatives is determined using forward exchange market rates at the balance sheet date. The Group’s own credit risk as well as the credit risk of the
contracting partner were included in the fair value measurement.

93 Notes to the consolidated financial statements
Derivative financial transactions – classified according to remaining term – are as follows:
2014
(in TEUR) Remaining terms nominal values Fair value
Not
exceeding
1 year
more than 1
year Total positive negative
Interest rate related forward
contracts
Interest rate swaps 150,000 350,000 500,000 20,496 0
Foreign exchange related forward
contracts
Foreign exchange forward contracts 1,466,345 475,229 1,941,574 23,079 -76,815
Embedded derivatives 387,363 76,158 463,521 47,647 -15,801
1,853,708 551,387 2,405,095 70,726 -92,616
Other forward contracts
Commodity forward contracts 4,871 627 5,498 190 -48
Total 2,008,579 902,014 2,910,593 91,412 -92,664
2013
(in TEUR) Remaining terms nominal values Fair value
Not
exceeding
1 year
more than 1
year Total positive negative
Interest rate related forward
contracts
Interest rate swaps 1,765 500,000 501,765 10,526 -38
Foreign exchange related forward
contracts
Foreign exchange forward contracts 1,009,532 515,631 1,525,163 32,208 -22,635
Embedded derivatives 282,053 213,478 495,532 16,396 -18,103
1,291,585 729,109 2,020,695 48,604 -40,739
Other forward contracts
Commodity forward contracts 4,869 704 5,573 21 -168
Total 1,298,219 1,229,813 2,528,033 59,151 -40,945
The fair values of the foreign exchange forward contracts classified according to transaction currency are as
follows:
(in TEUR)
Not exceeding
1 year more than 1 year Total 2014 Total 2013
US dollar -36,042 -13,490 -49,532 2,912
Swiss franc -226 -217 -443 -2,529
Euro -2,946 -1,685 -4,631 5,997
Other currencies 1,795 -926 869 3,191
-37,419 -16,318 -53,737 9,571

94 Notes to the consolidated financial statements
The fair values of the embedded derivatives classified according to transaction currency are as follows:
(in TEUR)
Not exceeding
1 year
more than 1
year Total 2014 Total 2013
US dollar 21,125 12,393 33,518 -5,621
Swiss franc 344 151 495 3,082
Euro -1,593 -789 -2,382 754
Other currencies 197 17 214 77
20,073 11,772 31,845 -1,708
f) Details of offsetting according to IFRS 7 The following table shows the amounts that were offset in the statement of financial position according to
IAS 32, as well as potential effects of master offsetting or similar agreements:
(in TEUR) 2014 2013
Derivatives positive negative positive negative
Gross amounts before netting 91,412 -92,664 59,151 -40,945
Accrued gross amounts 0 0 0 0
Net amounts reported in the balance sheet 91,412 -92,664 59,151 -40,945
Other amounts in scope, that are not netted in the
balance sheet -5,168 5,168 -2,708 2,708
NET AMOUNTS 86,244 -87,496 56,443 -38,237
g) The net gains and losses for each category of financial instruments are as follows: The overviews provided below reflect the net gains or losses from financial instruments considered in the income
statement according to the categories of IAS 39.
2014
(in TEUR)
Held for
trading
Hedge
accounting
Loans and
receivables
Available
for sale
Other
financial
liabilities
Changes in fair values recognized in profit or loss -24,101 9,970 -7,581 54 -10,311
Changes in fair values recognized in equity -5,054 552
Recycling out of equity -273 -54
Other results comprised in the income statement 31,001 7,172 -28,054
Net gains/losses -24,101 4,643 23,420 7,724 -38,365
2013
(in TEUR)
Held for
trading
Hedge
accounting
Loans and
receivables
Available
for sale
Other
financial
liabilities
Changes in fair values recognized in profit or loss 7,186 -18,011 -13,959 175 17,595
Changes in fair values recognized in equity -318 -1,002
Recycling out of equity 0 -175
Other results comprised in the income statement 24,847 721 -24,784
Net gains/losses 7,186 -18,329 10,888 -281 -7,189

95 Notes to the consolidated financial statements
M) RISK MANAGEMENT As a global company serving a variety of different markets and customers, the Group is subject to certain gen-eral and industry-specific risks. These risks mainly relate to the industries the Group serves (e.g. uncertainty of
future contracts, volatility of incoming orders, customer concentration, etc.), the Group’s business (e.g. currency
exposure, competitive position, legal proceedings, etc.), and to major orders (e.g. payment risks, liabilities and performance of projects, cost overruns, etc.).
ANDRITZ has a long-established Group-wide control and risk management system whose main task is to identi-fy nascent risks at an early stage and to take countermeasures. This is an important element in the active risk
management system within the Group.
Despite having this monitoring and risk management system in place, it cannot be guaranteed that all risks will
be identified at an early stage, and consequently the assets, liabilities, financial position, and profit or loss of the
Group could be adversely affected.
The essential risks for the business development of the ANDRITZ GROUP relate above all to the Group’s de-
pendence on the general economic development and the development of the industries it serves, to whether major orders are received and to the risks they entail, and to whether adequate sales proceeds are realized from
the high order backlog. In addition, unexpected increases in costs and difficulties in achieving the guaranteed
performance parameters in the plants that ANDRITZ supplies present substantial risks during the project execu-tion. A possible malfunction in the components and systems supplied by ANDRITZ can have serious conse-
quences for individuals and on material assets.
The financial difficulties and the continuing, challenging overall economic development (particularly in Europe
and individual emerging markets) also constitute a serious risk for the ANDRITZ GROUP’s financial development.
In addition, the two-way trade embargo between the European Union and Russia constitutes a risk for the eco-nomic development of both of these economic regions. A significant economic weakness may lead to delays in
the execution of existing orders and to the postponement or cancellation of existing projects. Cancellations of
existing contracts could adversely affect the ANDRITZ GROUP’s order backlog, which in turn would have a negative impact on the utilization of the Group’s manufacturing capacities and on the development of sales and
earnings.
Complete or partial goodwill impairments resulting from acquisitions may also negatively influence the earnings
development of the ANDRITZ GROUP if the targeted financial goals for these companies cannot be reached. In
addition, there is always some risk that partial or full impairment will have to be made for some trade accounts receivable.
As a result of its worldwide business activities, the ANDRITZ GROUP is also confronted with financial risks. Risks relating to liquidity, interest rate changes, loans, und exchange rates are of central importance here.
a) Liquidity risks In order to minimize the financial risks as best possible and to enhance monitoring, control, and assessment of
its financial and liquidity position, the ANDRITZ GROUP has implemented both a comprehensive treasury policy
and a transparent information system.
The Group manages liquidity risks especially by holding adequate financial reserves, by issuing bonds, by requir-
ing substantial customer advances, and by reconciling maturity date profiles of financial assets, receivables, and liabilities. A liquidity forecast with a defined planning horizon, quarterly updates of this forecast, and unused
credit facilities ensure the necessary liquidity for the ANDRITZ GROUP.
The Group endeavors to mitigate the risk of payment failure by customers as best possible by means of bank
guarantees and export insurance. However, there is no guarantee that there will not be any individual payment
failures that will have a substantial negative impact on development of earnings and liquidity of the Group if they do occur.
The ANDRITZ GROUP’s position in terms of liquidity is very good, and it currently has high liquidity reserves. The Group avoids dependence on one single or only a few banks. To ensure independence, no bank will receive
more than a certain defined amount of the business in any important financial product (cash and cash equiva-
lents, financial liabilities, financial assets, guarantees, and derivatives).
With this diversification, ANDRITZ is seeking to minimize the counterparty risk as best possible. The risk of a
possible default (insolvency) by individual or several counterparties is minimized by means of an internal coun-

96 Notes to the consolidated financial statements
terparty limit system. In this system, the maximum investment limit for each individual counterpart is determined
in view of the respective counterparty’s credit rating (by international rating agencies such as Moody’s, Standard & Poor’s, Fitch) and the credit default swap-spreads (CDS-spreads – indicator of the probability of the counter-
party defaulting). The counterparty limit is adjusted on a monthly basis so that it is possible to react quickly in
the event of credit rating changes at short notice. If there are larger, short-term changes in CDS spreads or counterparty ratings, exposure to the counterparty is reduced immediately.
ANDRITZ pursues a risk-averse investment strategy. Cash is largely invested in low-risk financial assets, such as government bonds, government-guaranteed bonds, money market funds, investment funds to cover pension
obligations, loans against borrowers’ notes insured by a certificate of deposit, or term deposits. However, turbu-
lences on the international financial markets may lead to unfavorable price developments for various securities in which the Group has invested (for example investment funds, bonds), or make them non-tradable. This could
have an adverse effect on the ANDRITZ GROUP’s financial result or shareholders’ equity due to necessary de-
preciation and amortization or valuation allowances. The crisis has also heightened the risk of default by some issuers of securities, as well as by customers. The Executive Board is informed on a monthly basis about the
extent and volume of current risk exposure and the respective counterparty limits in the ANDRITZ GROUP.
b) Exchange rate risks
The currency risks of the Group occur due to the fact that the Group’s operations and production sites are
located in different countries worldwide that do not have the euro as their local currency.
When it receives orders that are not billed in euros, the Group enters into foreign exchange forward contracts in
order to exclude or minimize the foreign exchange risk (hedging). Foreign exchange forward contracts are con-cluded exclusively with first-class national or international banks whose credit rating is checked continuously by
Group Treasury in order to avoid a “cluster risk”. The measures and regulations needed in connection with hedg-
ing of orders not billed in euros are stated in the Group-wide treasury policy.
A substantial number of the ANDRITZ GROUP’s subsidiaries are outside the euro zone. Since ANDRITZ AG
reports in euros, the company converts the financial statements of these companies into euros in the consoli-dated financial statement. In order to address translation-related foreign exchange risks, it is generally assumed
for the purposes of risk management that investments in foreign companies are made in the long term and the
results are reinvested continuously, thus goodwill from the acquisition of foreign subsidiaries has been shown since 2005 using the exchange rate at the time of acquisition, allocated to the company acquired, and translat-
ed at the exchange rate as of balance sheet date. The effects of fluctuations in exchange rate when converting
net asset items into euros are included in currency translation adjustments in Group equity.
c) Raw material price risks
Raw materials are exposed to price fluctuation risks due to the volatility of the raw material markets. The Group uses commodity forwards mainly to hedge the price risk for copper, which is used in manufacturing generators.
Contracts are concluded exclusively with first-class banks whose credit rating is checked continuously by Group
Treasury.
d) Political risks
The countries in which the Group is active include some that are classified as a political risk or as very danger-ous. Order stoppages and terrorist activities may result from political changes that could have an effect on the
development of the order intake, the liquidity, and the financial structure of the Group. Risks related to deliveries
to countries with medium to high political risks typically are insured to a large extent. However, the requirements for full hedging of these risks are not always available. The measures and procedures in this respect are speci-
fied in the Group-wide credit risk policy. In addition also natural disasters or pandemics could affect negatively
the development of order intake, the liquidity, and financial structure of the Group.
e) Tax risks
ANDRITZ companies are subject to local tax laws in the respective countries and have to pay taxes on income as well as other taxes. Changes in tax legislation and different interpretations of the regulations applying in each
case can result in subsequent tax burdens. As a result, the tax rate can be exposed either to positive or nega-
tive fluctuations.
ANDRITZ has substantial tax credits in Brazil from various transfer taxes. Some of these tax credits were seized
as security by the tax authorities for tax liabilities of Inepar and its affiliates on the theory that ANDRITZ HYDRO S.A. was part of the Inepar economic group. ANDRITZ has also received certain labor claims from employees of
Inepar entities claiming that ANDRITZ HYDRO S.A. is jointly and severally liable for such claims. ANDRITZ is
vigorously contesting these labor and tax claims in several labor and tax collection lawsuits in Brazil.

97 Notes to the consolidated financial statements
f) Credit risks
In order to control the credit risks from trade receivables outstanding, the ANDRITZ GROUP has established a uniform risk management process and compiled an appropriate Group-wide policy. In the ANDRITZ subsidiaries,
the respective credit risk managers are responsible for conducting regular credit rating analyses on customers
and project risk analyses, including the valuation of collateral securities. In particular, collateral securities include credit insurance, advance payments, letters of credit, and guarantees. In order to minimize the credit risks,
financial transaction are only conducted within defined limits and with banks and partners with an investment
grade rating.
Credit risks, or the risk of counterparties defaulting, are controlled by the application of credit approvals, limits,
and monitoring procedures. Where appropriate, the Group obtains guarantees from governmental export agen-cies or similar private institutions to reduce the risk of a counterpart defaulting.
Credit risk associated with cash, cash equivalents, and securities is low, as a wide distribution with simul-taneously defined minimum criteria for the creditworthiness of the contractual partners are determining factors
for the conservative investment strategy.
For certain financial assets and financial liabilities, the Group has a legally enforceable right to offset. These
amounts are only reported on a net basis. Valuation allowances are included for all known risks. The possibility
of a future shortfall in payment exceeding the recorded valuation allowance cannot be avoided with certainty. Without considering risk minimization strategies as described above, the carrying values of financial assets
recorded in the financial statements represent the Group’s maximum exposure to credit risk in the correspond-
ing categories.
(in TEUR) 2014 2013
Held for trading 70,915 48,010
Available for sale* 161,394 166,291
Loans and receivables 1,666,713 1,538,200
Derivatives (hedge accounting) 20,496 11,141
Cash and cash equivalents 1,457,335 1,227,860
3,376,853 2,991,502
* Excluding shares in non-consolidated companies and other investments
The available-for-sale category includes a balance of impairment of 2,319 TEUR (2013: 3,476 TEUR). The loans
and receivables category includes a valuation allowances for trade receivables of 54,202 TEUR (2013:
50,241 TEUR).
The Group does not have any significant credit risk exposure to any single counterparty or any group of coun-
terparties having similar characteristics. The Group defines counterparties as having similar characteristics if they are related entities. In 2014, the three largest customers contributed less than 10% of the total order intake
of the Group. On an overall basis, there is no significant concentration of credit risk.
g) Interest rate risks
In February 2008, ANDRITZ AG issued bonds for a nominal value of 150 MEUR with a tenor of seven years and
a nominal interest rate of 5.25% p.a. For this bond, interest rate swaps have been used to hedge the risk arising from the fixed interest rate of the bond. The interest rate swaps change the fixed interest rate for the whole
period to a variable interest rate based on the three-month Euribor. Therefore, ANDRITZ AG is exposed to the
risk of a changing interest rate concerning the cash flows, but the fair value of the bond is hedged and hedge accounting in the sense of IAS 39 was applied.
In July 2012, ANDRITZ AG issued further bonds for a nominal value of 350 MEUR with a tenor of seven years and a nominal interest rate of 3.875% p.a. For this bond, interest rate swaps have been used to hedge the risk
arising from the fixed interest rate of the bond. The interest rate swaps changed the fixed interest rate of the
bond for the whole period to a variable interest rate. Therefore, ANDRITZ AG is exposed to the risk of a chang-ing interest rate concerning the cash flows, but the fair value of the bond is hedged and hedge accounting in the
sense of IAS 39 was applied.
The basic contractual parameters of the swaps are similar to those of the bonds, and therefore the hedges were
virtually 100% effective in hedging the fair value exposure to interest rate movements. By applying the rules for
hedge accounting, the gain or loss from the swaps to fair value was recognized through profit or loss. The gain or loss attributable to the changes of the hedged interest rate risk caused an adjustment to the net book value

98 Notes to the consolidated financial statements
of the bonds and was also recognized through profit or loss. As a result, the gains and losses resulting from the
swaps and the bonds offset each other. The market value of the swaps designated as fair value hedge changes as follows:
(in TEUR) 2014 2013
Fair value of swaps as of January 1 10,526 28,537
Fair value of swaps as of December 31 20,496 10,526
Gains/loss recognized through profit or loss 9,970 -18,011
The ANDRITZ GROUP believes that the exposure to interest rate risk of remaining financial assets and liabilities
is low due to the risk-averse strategy; additional significant derivative instruments for hedging these interest risks are not used. The interest rate risks are managed by internal Cash-flow-at-Risk (CfaR) and Value-at-Risk (VaR)
calculations and by pre-specified limits. The limits are set for CfaR and VaR using a benchmarking approach.
Observation of the defined limits is monitored on a quarterly basis.
The weighted average interest rates at the balance sheet date were as follows:
(in %) 2014 2013
Cash on current accounts 0.4 0.5
Current deposits 2.7 2.2
Securities - current 1.1 1.2
Securities - non-current 0.8 1.2
Overdrafts on current accounts 9.9 8.1
Current loans 6.6 4.8
Non-current loans 6.3 5.0
Bonds - current 1.3 0.0
Bonds - non-current 2.6 2.2
The interest rates refer to the remaining terms of the respective financial asset/liability.
h) Sensitivity analyses
The Group’s activities are primarily exposed to the financial risks of changes in foreign currency, changes in fair value, and changes in interest rates. The Group enters into financial derivatives to manage its exposure to for-
eign currency risk and the risk of changes in fair values. These market risk exposures are measured using sensi-
tivity analyses:
Foreign currency sensitivity
The sensitivity analysis provides an approximate quantification of the risk exposure in the event that certain specified parameters were to be changed under a specific set of assumptions. Exchange rate risks occur par-
ticularly with US dollars (USD), Swiss francs (CHF), Chinese yuan (CNY), Canadian dollars (CAD), and Indian
rupees (INR). The following explanations detail the sensitivity to a rise or fall in the US dollar, Swiss franc, etc., against the euro (EUR) from the Group’s point of view. The change shows the amount applied in internal report-
ing of foreign currency risk and reflects the Group’s assessment of a possible change in foreign exchange rates.
Currency risks in the meaning of IFRS 7 arise as a result of financial instruments that are denominated in a cur-rency other than the functional currency and are of a monetary nature. Translation differences from converting
the financial statements of foreign Group companies into the Group currency are disregarded.
The sensitivity analysis includes the important financial instruments of the ANDRITZ GROUP outstanding on the
balance sheet date.

99 Notes to the consolidated financial statements
This has the following impact on the net income of the Group compared to the net income reported and on the
Group equity compared to the Group equity reported:
(in TEUR) 2014 2013
+10% -10% +10% -10%
Currency relation
EUR/USD*
Cash flow hedge reserve -2,137 2,137 -476 476
Net income -44,526 44,526 -30,079 30,079
EUR/CHF
Net income -1,575 1,575 -678 678
EUR/CNY
Net income 7,231 -7,231 6,892 -6,892
EUR/CAD
Net income -1,010 1,010 -482 482
EUR/INR
Net income -1,251 1,251 -1,571 1,571
* Previous year adjusted according to IAS 8 due to mistake in carry forward
The ANDRITZ GROUP is exposed to currency risks from derivatives included in a cash flow hedge against ex-
change rate fluctuations in cash flows according to IAS 39. Changes in the exchange rate for the foreign curren-
cies of the underlying transactions influence the unrealized profits from cash flow hedges recognized in other comprehensive income through the change in fair value of the hedging transactions. However, this only applies
to the extent that the changes in fair value of the hedging instruments are not compensated in the same amount
by countervailing developments in the value of the underlying transactions. This is regularly during the lead time of customer orders in foreign currency, if the customer orders are hedged at 100% at the beginning of the pro-
jects. Up to placing of the order, the change in fair value of the derivative is not offset by any countervailing value
development by the underlying transaction or only according to the percentage of completion, with the result that the value balance of underlying and hedging transaction on the balance sheet date is to be included in
other comprehensive income.
The changes compared to the net income reported are mainly due to the market valuation of foreign exchange
forward contracts at new rates, which are used to hedge plan items and are not included in any hedge accord-
ing to IAS 39. These changes in derivative fair values are offset by the hedged order backlog; the change in value is neither recognized in the net income, nor in the Group’s equity.
Interest rate sensitivity The sensitivity analysis has been determined based on the bonds’ exposure to interest rates. There is no risk of
a changing interest rate concerning the cash flows for ANDRITZ AG as the issuer of the fixed-interest bearing
bonds, although a change in the interest rate would affect the fair value of the bonds. However, interest swaps were used for the bonds to hedge the risk from the change in fair value.
Interest rate sensitivity is assumed at 100 basis points in internal reporting on the interest risk. This reflects the Group’s estimate with respect to a possible change in the interest rate.
If interest rates are 100 basis points higher and all other variables are kept constant, this would cause a de-crease in the fair value of the swaps and a countervailing change in the net book value of the bonds through
profit or loss by virtually the same amount.

100 Notes to the consolidated financial statements
2014 2013
Changes in market interest rates in basis points +100 -100 +100 -100
Impact on the result before tax
Swaps TEUR -12,726 12,819 -19,552 20,616
Bonds TEUR 12,726 -12,819 19,552 -20,616
TEUR 0 0 0 0
A rise in the interest level by 100 basis points, while simultaneously keeping all other variables constant, would
have led to an increase in the interest result of 9,386 TEUR in the 2014 financial year (2013: increase of
9,142 TEUR). A decline in the interest level would have led to a decrease in the interest result in the same amount.
N) LEASES The Group has entered into various operating lease agreements for machinery, offices, and other facilities as lessee. Lease terms do not contain restrictions on the Group’s activities concerning dividends, additional debt,
or further leasing.
Real estate at the Göppingen location, including the buildings and other important elements, were sold by the
Schuler Group in 2007 as part of a sale-and-rent-back transaction and rented back again for a term of 20 years.
The actual rental was initially 4,940 TEUR. The rent is adjusted annually according to the German consumer price index (4% max.). In addition, the real estate in São Paulo belonging to the Schuler Group was sold in 2009
and then rented back for a term of 10 years. A purchase or extend option at terms better than the expected
market conditions or residual value guarantees is available at the end of the lease terms.
Future minimum lease payments under non-cancellable operating leases are as follows:
(in TEUR) 2014 2013
Not exceeding 1 year 44,360 40,294
1 to 5 years 102,298 86,642
After 5 years 57,564 58,925
204,222 185,861
ANDRITZ leases facilities for its business operations that are classified as finance leases and largely cover rental
of real estate. Future minimum lease payments under non-cancellable finance leases are as follows:
(in TEUR) 2014 2013
Not exceeding 1 year 1,203 1,397
1 to 5 years 4,088 4,293
After 5 years 12,481 13,456
Total minimum lease payments 17,772 19,146
Less amount representing interest -2,406 -2,860
Present value of leasing payments 15,366 16,286
Less current portion -802 -962
Non-current lease obligations 14,564 15,324
O) CONTINGENT LIABILITIES AND OFF-BALANCE SHEET TRANSACTIONS In the course of its business, the ANDRITZ GROUP is party to numerous legal proceedings before both adminis-trative and judicial courts and bodies, as well as before arbitration tribunals. The substantial majority of such
proceedings is of a nature considered typical of the Group’s business, including contract and project disputes,
product liability claims, and intellectual property litigation. Where appropriate, provisions are made to cover the expected outcome of proceedings to the extent that negative outcomes are likely and reliable estimates can be
made. There is no guarantee, however, that these provisions will be sufficient. A negative decision for ANDRITZ
in one or several of these legal disputes may have an adverse effect on the earnings and liquidity position of the Group. The product liability cases include a number of cases alleging injuries and/or death resulting from expo-
sure to asbestos.

101 Notes to the consolidated financial statements
ANDRITZ Inc., a subsidiary of the ANDRITZ GROUP, is one of many defendants in 66 asbestos cases (status as
of December 31, 2014; 23 cases as of December 31, 2013) in the USA. In aggregate, the cases involve 445 plaintiffs (428 plaintiffs as of December 31, 2013). All of the cases relate to claims against multiple defend-
ants. ANDRITZ Inc. does not believe it should be found liable in connection with any of these claims and intends
to defend each claim vigorously.
There are no take-back obligations other than the guarantee claims customary within the industry. The Executive
Board is not aware of any further risks and rewards originating from off-balance sheet transactions.
P) RELATED PARTY TRANSACTIONS Under IAS 24 (Related Party Disclosures), related parties should be disclosed if they are not already included as a consolidated company in the consolidated financial statements of ANDRITZ AG.
In addition to the companies included in the consolidated financial statements, the Group has direct or indirect relations in the ordinary course of business with non-consolidated subsidiaries and associated companies that
are considered as related parties of the Group.
Transactions with associated companies and non-consolidated companies are not material. As the Group’s
transfer-pricing policy provides for transfer pricing at arm’s length, no transactions are conducted that do not
comply with market standards. The non-inclusion of non-consolidated entities in the consolidated financial statements has no significant impact on the Group’s assets, liabilities, financial position, and profit or loss.
The extent of business relations towards non-consolidated Group companies and associated companies is shown in the following table:
(in TEUR) 2014 2013
Trade and other receivables 6,234 9,126
from non-consolidated subsidiaries 6,004 8,909
from associated companies 230 217
Liabilities 4,007 5,257
from non-consolidated subsidiaries 3,678 4,924
from associated companies 329 333
Sales 18,571 7,165
from non-consolidated subsidiaries 18,571 7,165
from associated companies 0 0
Expenses -9,744 -35,932
from non-consolidated subsidiaries -9,681 -26,989
from associated companies -63 -8,943
Under IAS 24, the Group also reports on transactions between itself and its related persons and their family
members, respectively. Members of the Executive Board and of the Supervisory Board, as well as their families,
have been defined as related parties.
A company attributed to the President and CEO of ANDRITZ AG has ceded operation of a corporate jet aircraft
owned by the company to a professional private aviation firm from which ANDRITZ AG has chartered around 34% of annual flight hours of these aircraft for business trips by the President and CEO and other members of
the Executive Board in 2014. The related expenses amounted to 400.3 TEUR in 2014 (2013: 643.0 TEUR). As of
December 31, 2014, liabilities in an amount of 0 TEUR (2013: 47.6 TEUR) were recognized.
This and other business relations with companies in which members of the Supervisory Board or the Executive
Board are involved are conducted at usual market terms and are of minor importance, both individually and collectively.
25% plus one share are held by SARS Achtundfünfzigste Beteiligungsverwaltung GmbH, whose Managing Di-rector is Wolfgang Leitner, President and CEO of ANDRITZ AG. Wolfgang Leitner holds a 99.6% interest in Cer-
berus Vermögensbeteiligungsverwaltung GmbH and is Managing Director of this company, authorized to act
alone on its behalf. Custos Privatstiftung, of which Wolfgang Leitner is a co-founder, holds a stake of 0.4% in Cerberus Vermögensbeteiligungsverwaltung GmbH. Cerberus Vermögensbeteiligungsverwaltung GmbH holds a
stake of 0.769% in ANDRITZ AG, 3.99% is held by Certus Beteiligungs GmbH. The remaining ANDRITZ AG
shares are held by national and international institutional investors and by private investors.

102 Notes to the consolidated financial statements
The remuneration disclosed in accordance with IAS 24 for remuneration of key managers of the Group included
the remuneration of the current Executive and Supervisory Boards.
Emoluments of the Executive Board
The remuneration of the Executive Board is composed of a fixed and a variable/success-based portion. The amount of the variable portion depends on the net profit. For new contracts with members of the Executive
Board, the maximum value for the variable annual remuneration was fixed at three times the fixed annual remu-
neration. Any amounts in excess of this sum will be credited as a variable remuneration for the following years. If the net income of the Group falls short of a defined minimum amount, this results in a ‘malus’ that is also carried
forward to the following years and in a reduction in future variable salary components.
In all share option programs for managerial staff and the Executive Board since the IPO, participation was con-
tingent on investing at least 20,000 EUR in ANDRITZ shares for managerial staff and 40,000 EUR for members
of the Executive Board not later than the allocation date of the options. This investment must be maintained continuously until exercise of the options by those persons subscribing to the option program, and evidence
thereof must be brought when the options are exercised. There is a waiting period of three years before options
can be exercised if the contract of employment is still in force (exception: end of employment contract as scheduled according to contract provisions).
The members of the Executive Board are entitled to receive pension scheme benefits. In addition to a retirement pension, these include benefits in the event of occupational disability, as well as pension payments for depend-
ents following the death of the beneficiary. The retirement pension is normally paid as from a certain age provid-
ed that the employment contract has already been terminated by this date. The administration work has been outsourced to a pension fund. In the event that the employment contract is terminated prematurely, contribu-
tions made up to this point shall still be vested. The pension amount to which the beneficiary is entitled is not
subject to an escalation clause before any benefits become payable; after this, annual adjustments can be made to take account of the development in wages and salaries and of ANDRITZ’s economic status.
Each member of the Executive Board shall, upon termination of his function and concurrent termination of em-ployment, be entitled to severance payments in the meaning of Article 23 of the Austrian Employees Act unless
such termination is the result of justified dismissal.
The principles applied in establishing the remuneration of the Executive Board and of senior managers comply
with the Austrian Code of Corporate Governance.
The following expenses have been recognized for the Executive Board:
(in TEUR) 2014 2013
Short-term benefits 8,398 3,910
Post-employment benefits 723 608
Share-based expenses 1,501 1,362
10,622 5,880
A provision of 5,530 TEUR in 2014 (5,223 TEUR in 2013) was recorded for pensions of former members of the
Executive Board and their dependents; expenses for these pensions amounted to 270 TEUR in 2014 (546 TEUR
in 2013).
ANDRITZ AG took out Directors’ and Officers’ liability insurance (D&O insurance) for 2014. The costs are cov-
ered by the company. The D&O insurance covers certain personal liability risks of persons in the ANDRITZ GROUP acting under responsibility. The annual cost is approximately 260 TEUR (including Schuler).
Remuneration of the Supervisory Board The remuneration scheme of the Supervisory Board is composed of a fixed and an attendance-related portion.
The fixed portion is a global sum, which is to be distributed such that the chairman of the Supervisory Board
receives double the amount and his deputy one-and-a-half-times the amount paid to the other members. The second portion consists of a lump sum fee paid in respect of each meeting that the member attends. Subject to
approval by the Annual General Meeting, the Supervisory Board remunerations for the 2014 business year
amount to a total of 295 TEUR (2013: 298 TEUR).

103 Notes to the consolidated financial statements
Q) EXPENSES FOR SERVICES RENDERED BY THE GROUP AUDITOR The expenses for services rendered by the Group auditor comprise the following:
(in TEUR) 2014 2013
Year-end audit 489 477
Other reviews 10 0
Tax advisory services 177 167
Other services 0 18
676 662
R) EVENTS AFTER THE BALANCE SHEET DATE There were no events of material significance after the balance sheet date.

104 Notes to the consolidated financial statements
S) LIST OF SUBSIDIARIES
2014 2013
Company Headquarters Interest
Type of
consoli-
dation Interest
Type of
consoli-
dation
Anstalt für Strömungsmaschinen GmbH Graz, Austria 100.00% NC 100.00% NC
ANDRITZ Technology and Asset Management
GmbH
Graz, Austria 100.00% FC 100.00% FC
ANDRITZ Finance GmbH Vienna, Austria 100.00% FC 100.00% FC
ANDRITZ Power & Water GmbH Vienna, Austria 100.00% FC 100.00% FC
ANDRITZ FEED & BIOFUEL (China) Ltd. Foshan, China - - 100.00% FC
ANDRITZ Energy & Environment GmbH Raaba, Austria 100.00% FC 100.00% FC
ANDRITZ Environmental Engineering
(Shanghai) Co., Ltd.
Shanghai, China 100.00% FC 100.00% FC
AE Energietechnik GmbH Raaba, Austria 100.00% NC 100.00% NC
ANDRITZ Deutschland Beteiligungs GmbH Krefeld, Germany 100.00% FC 100.00% FC
ANDRITZ Ritz Immobilien GmbH Krefeld, Germany 100.00% FC 100.00% FC
TANIAM GmbH & Co. KG Pullach im Isartal,
Germany
100.00% FC 100.00% FC
ANDRITZ GmbH Hemer, Germany 100.00% FC 100.00% FC
ANDRITZ Kaiser GmbH Bretten-Gölshausen,
Germany
100.00% FC 100.00% FC
ANDRITZ Sundwig GmbH Hemer, Germany 100.00% FC 100.00% FC
ANDRITZ Fiedler GmbH Regensburg,
Germany
100.00% FC 100.00% FC
ANDRITZ SEPARATION GmbH Cologne, Germany 100.00% FC 100.00% FC
ANDRITZ Fliessbett Systeme GmbH Ravensburg,
Germany
100.00% FC 100.00% FC
Lenser Verwaltungs GmbH Senden, Germany 100.00% FC 100.00% FC
ANDRITZ S.R.L. Cisnadie, Romania 100.00% NC 100.00% NC
Lenser Filtration GmbH Senden, Germany 100.00% FC 100.00% FC
Lenser Asia Sdn. Bhd. Kuala Lumpur,
Malaysia
100.00% FC 100.00% FC
ANDRITZ HYDRO GmbH Ravensburg,
Germany
100.00% FC 100.00% FC
ANDRITZ Küsters GmbH Krefeld, Germany 100.00% FC 100.00% FC
ANDRITZ Kufferath GmbH Düren, Germany 100.00% FC 100.00% FC
AKRE Real Estate GmbH Düren, Germany 100.00% FC 100.00% FC
ANDRITZ MAERZ GmbH Düsseldorf, Germany 100.00% FC 100.00% FC
Modul Systeme Engineering GmbH Laufen, Germany 100.00% FC 100.00% FC
Modul Systeme Projekt Verwaltungs
GmbH
Laufen, Germany 100.00% NC 100.00% NC
Modul Systeme Projekt GmbH & CO.
KG
Laufen, Germany - - 100.00% FC
ANDRITZ KMPT GmbH Vierkirchen,
Germany
100.00% FC 100.00% FC
ANDRITZ KMPT Inc. Florence / Kentucky,
USA
100.00% FC 100.00% FC
ANDRITZ Ritz GmbH Schwäbisch Gmünd,
Germany
100.00% FC 100.00% FC
ANDRITZ Atro GmbH Nürnberg, Germany 100.00% FC 100.00% FC
ANDRITZ Ritz Pte. Ltd. Singapore,
Singapore
100.00% FC 100.00% FC
Ritz Pumps South Africa (Pty) Ltd. Boksburg, South
Africa
23.00% NC 23.00% NC
Ritz Verwaltungsgesellschaft mit
beschränkter Haftung
Schwäbisch Gmünd,
Germany
100.00% NC 100.00% NC
ANDRITZ MeWa GmbH Gechingen, Germany 100.00% FC 100.00% FC
MEWA RECYCLING Keleti Régió Kft. Győr, Hungary 100.00% NC 100.00% NC

105 Notes to the consolidated financial statements
ANDRITZ FBB GmbH Mönchengladbach,
Germany
100.00% FC 100.00% FC
ANDRITZ HYDRO GmbH Vienna, Austria 100.00% FC 100.00% FC
ANDRITZ HYDRO S.A.S. Grenoble, France 100.00% FC 100.00% FC
ANDRITZ HYDRO Private Limited Bhopal, India 100.00% FC 100.00% FC
ANDRITZ HYDRO S.L. Madrid, Spain 100.00% FC 100.00% FC
ANDRITZ HYDRO S.r.l., Unipersonale Vicenza, Italy 100.00% FC 100.00% FC
ANDRITZ HYDRO AG Kriens, Switzerland 100.00% FC 100.00% FC
ANDRITZ HYDRO S.A. de C.V. Morelia, Mexico 100.00% FC 100.00% FC
ANDRITZ HYDRO AS Jevnaker, Norway 100.00% FC 100.00% FC
ANDRITZ HYDRO S.A. El Dorado, Panama 100.00% NC 100.00% NC
ANDRITZ HYDRO BRASIL Ltda. São Paulo, Brazil 100.00% FC 100.00% FC
ANDRITZ HYDRO Ltd. Sti. Ankara, Turkey 100.00% FC 100.00% FC
PT. ANDRITZ HYDRO Jakarta, Indonesia 51.00% FC 51.00% FC
ANDRITZ HYDRO S.A. Lima, Peru 100.00% NC 100.00% NC
ANDRITZ HYDRO (Pty) Ltd Kyalami, South
Africa
100.00% NC 100.00% NC
ANDRITZ HYDRO Ltda. Bogota, Colombia 100.00% FC 100.00% FC
ANDRITZ HYDRO s.r.o. Prague, Czech
Republic
100.00% NC 100.00% NC
ANDRITZ India Private Limited New Delhi, India 100.00% NC 100.00% NC
ANDRITZ HYDRO C.A. Caracas, Venezuela 100.00% NC 100.00% NC
ANDRITZ Power Sdn. Bhd. Kuala Lumpur,
Malaysia
100.00% NC 100.00% FC
ANDRITZ HYDRO INC. Makati City,
Philippines
100.00% NC 100.00% NC
ANDRITZ Ulu Jelai Project Sdn. Bhd. Kuala Lumpur,
Malaysia
100.00% NC 100.00% NC
PHP Philippines Hydro Project, Inc. Makati City,
Philippines
24.98% NC 24.98% NC
ANDRITZ HYDRO Hammerfest AS Hammerfest, Norway 59.88% FC 59.43% FC
ANDRITZ HYDRO Hammerfest (UK)
Limited
Glasgow, United
Kingdom
59.88% FC 59.43% FC
VA TECH Escher Wyss Peru S.A.C. Lima, Peru 100.00% NC 100.00% NC
ANDRITZ HYDRO UNIPESSOAL LDA Porto, Portugal 100.00% NC 100.00% NC
ANDRITZ HYDRO DRC SARL Kinshasa,
Democratic Republic
of the Congo
100.00% NC 100.00% NC
AH Pumpstorage GmbH Vienna, Austria 60.00% NC - -
ANDRITZ HYDRO Beteiligungsholding
GmbH
Graz, Austria 100.00% FC 100.00% FC
ANDRITZ HYDRO Brasilien
Beteiligungsgesellschaft mbH
Graz, Austria 100.00% NC 100.00% NC
HGI Holdings Limited Limassol, Cyprus 100.00% NC 100.00% NC
ZAO HGI PCS St. Petersburg,
Russia
75.00% NC 75.00% NC
ANDRITZ SEPARATION (India) Private Ltd. Chennai, India 100.00% FC 100.00% FC
ACB Entwicklungsgesellschaft mbH Vienna, Austria 73.00% NC 73.00% NC
ANDRITZ FEED & BIOFUEL A/S Esbjerg, Denmark 100.00% FC 100.00% FC
ANDRITZ FEED & BIOFUEL Brasil Ltda. Curitiba, Brazil 100.00% NC 100.00% NC
ANDRITZ Slovakia s.r.o. Humenné, Slovakia 100.00% FC 100.00% FC
ANDRITZ Chile Ltda. Santiago de Chile,
Chile
100.00% FC 100.00% FC
ANDRITZ (USA) Inc. Roswell / Georgia,
USA
100.00% FC 100.00% FC
ANDRITZ Inc. Roswell / Georgia,
USA
100.00% FC 100.00% FC
Precision Machine and Supply, Inc. Spokane /
Washington, USA
51.00% FC 51.00% FC
ANDRITZ SEPARATION Inc. Arlington / Texas,
USA
100.00% FC 100.00% FC

106 Notes to the consolidated financial statements
ANDRITZ HYDRO Corp. Charlotte / North
Carolina, USA
100.00% FC 100.00% FC
ANDRITZ Metals Inc. Canonsburg /
Pennsylvania, USA
100.00% FC 100.00% FC
ANDRITZ Environmental Solutions Inc. Wilmington /
Delaware, USA
100.00% FC 100.00% FC
HVS Acquisition, Inc. Roswell / Georgia,
USA
100.00% FC - -
Genesis Worldwide II, Inc. Roswell / Georgia,
USA
100.00% FC - -
Herr-Voss Stamco, Inc. Callery /
Pennsylvania, USA
100.00% FC - -
Breakaway Services LLC Roswell / Georgia,
USA
100.00% FC - -
RCI HV, Inc. Chesterton / Indiana,
USA
100.00% FC - -
ANDRITZ S.A.S. Vélizy-Villacoublay,
France
100.00% FC 100.00% FC
ANDRITZ Selas S.A.S. Asnières-sur-Seine,
France
100.00% FC 100.00% FC
Lenser Filtration S.a.r.l. Haguenau, France - - 100.00% FC
Jaybee Eng. (Holdings) Pty. Ltd. Carrum Downs /
Victoria, Australia
100.00% FC 100.00% FC
ANDRITZ Pty. Ltd. Carrum Downs /
Victoria, Australia
100.00% FC 100.00% FC
ANDRITZ Ingeniería S.A. Madrid, Spain 100.00% FC 100.00% FC
ANDRITZ Brasil Ltda. Curitiba, Brazil 100.00% FC 100.00% FC
ANDRITZ SEPARATION Industria e
Comércio deEquipamentos de
Filtraçâo Ltda.
Pomerode, Brazil 100.00% FC 100.00% FC
Sindus ANDRITZ Ltda. Porto Alegre, Brazil 100.00% FC 100.00% FC
Sindus ANDRITZ Uruguay S.A. Río Negro, Uruguay 100.00% NC 100.00% NC
ANDRITZ HYDRO Inepar do Brasil S/A Araraquara, Brazil 74.33% FC 50.00% FC
ANDRITZ Pilão Equipamentos Ltda. São Paulo, Brazil 100.00% FC 100.00% FC
ANDRITZ Oy Helsinki, Finland 100.00% FC 100.00% FC
Savonlinna Works Oy Savonlinna, Finland 100.00% FC 100.00% FC
ANDRITZ Hydro Oy Tampere, Finland 100.00% FC 100.00% FC
Warkaus Works Oy Varkaus, Finland 100.00% FC 100.00% FC
Enmas ANDRITZ Pvt. Ltd. Chennai, India 40.00% EQ 40.00% EQ
Carbona Oy Helsinki, Finland - - 100.00% NC
Viafin Brazil Oy Teuva, Finland 40.00% EQ 40.00% EQ
A&V Montagens INDUSTRIAIS Ltda. Lapa, Brazil 40.00% EQ 40.00% EQ
ANDRITZ HYDRO Canada Inc. Peterborough /
Ontario, Canada
100.00% FC 100.00% FC
ANDRITZ HYDRO Ltd./Ltee. Pointe Claire /
Quebec, Canada
100.00% FC 100.00% FC
ANDRITZ HYDRO Installations Inc. Pointe Claire /
Quebec, Canada
100.00% NC 100.00% NC
ANDRITZ Ltd./Ltée. Lachine / Quebec,
Canada
100.00% FC 100.00% FC
ANDRITZ Paper Machinery Ltd. Lachine / Quebec,
Canada
100.00% FC 100.00% FC
Universal Dynamics Group Ltd. Richmond / British
Columbia, Canada
- - 100.00% FC
ANDRITZ Automation Ltd. Richmond / British
Columbia, Canada
100.00% FC 100.00% FC
IDEAS Simulation & Control Ltd. Richmond / British
Columbia, Canada
- - 100.00% FC
Universal Dynamics Group (USA) Ltd. Richmond / British
Columbia, Canada
- - 100.00% FC
9181-9896 Quebec Inc. Pointe Claire /
Quebec, Canada
100.00% NC 100.00% NC

107 Notes to the consolidated financial statements
9182-0399 Quebec Inc. Pointe Claire /
Quebec, Canada
100.00% NC 100.00% NC
Hemicycle Controls Inc. Chambly / Quebec,
Canada
100.00% FC 100.00% FC
ANDRITZ HYDRO AFI, Inc. Paris / Ontario,
Canada
100.00% FC - -
ANDRITZ AB Örnsköldsvik / Växjö,
Sweden
100.00% FC 100.00% FC
ANDRITZ HYDRO AB Nälden, Sweden 100.00% FC 100.00% FC
ANDRITZ Ltd. Newcastle-under-
Lyme, United
Kingdom
100.00% FC 100.00% FC
ANDRITZ (China) Ltd. Foshan, China 100.00% FC 100.00% FC
Shanghai FOAO Enterprise Management
Consulting Co., Ltd.
Shanghai, China 100.00% NC 100.00% NC
Shanghai Shende Machinery Co. Ltd. Shanghai, China 80.00% FC 80.00% FC
Shanghai Shenliang Mechanical
Equipment and Erection Co. Ltd.
Shanghai, China 80.00% NC 80.00% NC
ANDRITZ - Wolfensberger Special Alloy
Foundry Co. Ltd.
Foshan, China 95.00% FC 95.00% FC
ANDRITZ Technologies H.K. Ltd. Hong Kong, China 100.00% FC 100.00% FC
ANDRITZ Thermtec Holding B.V. Rotterdam, The
Netherlands
100.00% FC 100.00% FC
ANDRITZ Thermtec B.V. Rotterdam, The
Netherlands
100.00% FC 100.00% FC
ANDRITZ Technologies Pvt. Ltd. Bangalore, India 100.00% FC 100.00% FC
ANDRITZ FEED & BIOFUEL Ltd. Hull, United
Kingdom
100.00% FC 100.00% FC
ANDRITZ FEED & BIOFUEL B.V. Geldrop, The
Netherlands
100.00% FC 100.00% FC
ANDRITZ B.V. Den Helder, The
Netherlands
100.00% FC 100.00% FC
ANDRITZ Singapore Pte. Ltd. Singapore,
Singapore
100.00% FC 100.00% FC
ANDRITZ (Thailand) Ltd. Bangkok, Thailand 100.00% NC 100.00% NC
ANDRITZ Uruguay S.A. Fray Bentos,
Uruguay
100.00% FC 100.00% FC
ANDRITZ Industrias S.A. Fray Bentos,
Uruguay
100.00% NC 100.00% NC
ANDRITZ Pulp Technologies Punta Pereira
S.A.
Montevideo,
Uruguay
100.00% FC 100.00% FC
ANDRITZ K.K. Tokyo, Japan 100.00% FC 100.00% FC
ANDRITZ DELKOR (Pty) Ltd. Kyalami, South
Africa
100.00% FC 100.00% FC
GKD Delkor (Pty) Ltd. Kyalami, South
Africa
100.00% NC 100.00% NC
PT. ANDRITZ Jakarta, Indonesia 100.00% FC 100.00% FC
ANDRITZ Australia Pty Ltd. Melbourne / Victoria,
Australia
100.00% NC 100.00% NC
LLC ANDRITZ St. Petersburg,
Russia
100.00% FC 100.00% FC
LLC ANDRITZ HYDRO Moscow, Russia 100.00% NC 100.00% NC
ANDRITZ Kufferath s.r.o. Levice, Slovakia 100.00% FC 100.00% FC
ANDRITZ Kft. Tiszakécske,
Hungary
100.00% FC 100.00% FC
ANDRITZ Perfojet S.A.S. Montbonnot Saint-
Martin, France
100.00% FC 100.00% FC
ANDRITZ Biax S.A.S. Le Bourget du Lac,
France
100.00% FC 100.00% FC
ANDRITZ Frautech S.R.L. Vicenza, Italy 100.00% FC 100.00% FC
ProGENF IP GmbH Wolfsburg, Germany 30.00% NC 30.00% NC
ANDRITZ Como S.R.L. Grandate, Italy 100.00% NC 100.00% NC

108 Notes to the consolidated financial statements
ANDRITZ Iggesund Tools AB Iggesund, Sweden 100.00% FC 100.00% FC
ANDRITZ Iggesund Tools, Inc. Oldsmar / Florida,
USA
100.00% FC 100.00% FC
ANDRITZ Iggesund Tools Canada Inc. Laval / Quebec,
Canada
100.00% FC 100.00% FC
ANDRITZ Boisfer Iggesund S.A.S. Miribel, France - - 100.00% FC
ANDRITZ Iggesund Tools Oy Helsinki, Finland - - 100.00% NC
ANDRITZ (NZ) Ltd. Tauranga, New
Zealand
100.00% NC 100.00% NC
ANDRITZ Asselin-Thibeau S.A.S. Elbeuf, France 100.00% FC 100.00% FC
ANDRITZ Beteiligungsgesellschaft IV GmbH Krefeld, Germany 100.00% FC 100.00% FC
Schuler Aktiengesellschaft Göppingen,
Germany
96.62% FC 96.02% FC
Schuler Pressen GmbH Göppingen,
Germany
96.62% FC 96.02% FC
SUPERA Grundstücks-
Vermietungsgesellschaft mbH & Co.
Objekt Weingarten KG
Schönefeld,
Germany
96.62% FC 96.02% FC
Nora Grundstücks-
Vermietungsgesellschaft mbH & Co.
Objekt Weingarten KG
Grünwald, Germany 96.62% FC 96.02% FC
Schmiedetechnik & Service GmbH Weingarten,
Germany
- - 96.02% NC
Schuler Italia S.r.l. Turin, Italy 86.96% NC 86.42% NC
ATIS GmbH Deggenhausertal,
Germany
- - 96.02% NC
Schuler (Dalian) Forming
Technologies Co., Ltd.
Dalian, China 96.62% FC 96.02% FC
Schuler Sales & Service (Shanghai)
Co., Ltd.
Shanghai, China 96.62% FC 96.02% FC
Beutler Nova AG Gettnau, Switzerland 96.62% FC 96.02% FC
Schuler Presses UK Limited Walsall, United
Kingdom
96.62% FC 96.02% FC
BCN Technical Services Inc. Hastings, USA 96.62% FC 96.02% FC
Müller Weingarten de México S.A.
de C.V.
Puebla, Mexico 96.62% FC 96.02% FC
Schuler Thailand Co. Ltd. Bangkok, Thailand 96.62% NC 96.02% NC
Gräbener Pressensysteme GmbH & Co
KG
Netphen, Germany 96.62% FC 96.02% FC
Schuler SMG GmbH & Co. KG Waghaeusel,
Germany
- - 96.02% FC
Schuler Hydrap Geschäftsführungs
GmbH
Esslingen, Germany - - 96.02% NC
Schuler Hydrap GmbH & Co. KG Esslingen, Germany - - 96.02% FC
Rena Grundstücksverwaltungsge
sellschaft mbH & Co.
Vermietungs-KG
Pullach im Isartal,
Germany
96.62% FC 96.02% FC
Tianjin SMG Presses Co. Ltd. Tianjin, China 96.62% NC 96.02% NC
Schuler (Tianjin) Metal Forming
Technologies Center Co., Ltd.
Tianjin, China 96.62% FC - -
Schuler Automation GmbH & Co. KG Heßdorf, Germany 96.62% FC 96.02% FC
Schuler Cartec GmbH & Co. KG Göppingen,
Germany
- - 96.02% FC
Schuler Cartec Engineering GmbH &
Co. KG
Weingarten,
Germany
96.62% FC 96.02% FC
Schuler Cartec Verwaltungs GmbH Weingarten,
Germany
- - 96.02% FC
Müller Weingarten Werkzeuge GmbH Weingarten,
Germany
- - 96.02% FC
Umformcenter Erfurt GmbH Erfurt, Germany - - 96.02% FC
Schuler Guß GmbH & Co. KG Göppingen,
Germany
96.62% FC 96.02% FC

109 Notes to the consolidated financial statements
Vögtle Service GmbH Eislingen, Germany 96.62% FC 96.02% FC
Schuler France S.A. Strasbourg, France 96.62% FC 96.02% FC
Schuler Inc. Canton, USA 96.62% FC 96.02% FC
Prensas Schuler S.A. São Paulo, Brazil 96.62% FC 96.02% FC
BCN do Brasil Servicos e
Comercio Ltda.
São Paulo, Brazil 96.62% NC 96.02% NC
Shanghai Schuler Presses Co. Ltd. Shanghai, China 76.71% FC 76.23% FC
Schuler Systems & Services
Geschäftsführungs GmbH
Göppingen,
Germany
- - 96.02% NC
Gräbener Pressensysteme-Verwaltungs
GmbH
Netphen, Germany 96.62% NC 96.02% NC
Graebener Press Systems Inc. Warwick / Rhode
Island, USA
96.62% NC 96.02% NC
Schuler SMG Geschäftsführungs GmbH Göppingen,
Germany
- - 96.02% NC
Schuler Automation Geschäftsführungs
GmbH
Heßdorf, Germany 96.62% NC 96.02% NC
Schuler Cartec Geschäftsführungs
GmbH
Weingarten,
Germany
- - 96.02% NC
Schuler Lasertechnik Geschäftsführungs
GmbH
Göppingen,
Germany
- - 96.02% NC
Schuler Guß Geschäftsführungs GmbH Göppingen,
Germany
96.62% NC 96.02% NC
Schuler Iberica S.A.U. Sant Cugat del
Valles, Spain
96.62% NC 96.02% NC
Schuler Slovakia Services s.r.o. Dubnica nad Vahom,
Slowakai
96.62% NC 96.02% NC
Schuler India Private Limited Mumbai, India 96.62% NC 96.02% NC
Schuler Poland Service Sp. Z o.o. Kedzierzyn-Kozle,
Poland
96.62% NC 96.02% NC
Tianjin GMS Machine Tool Service
Co. Ltd.
Tianjin, China 48.31% NC 48.01% NC
Presse Italia S.p.A. Rome, Italy 91.79% NC 96.02% NC
Schuler Pressen Geschäftsführungs
GmbH
Göppingen,
Germany
- - 96.02% NC
ANDRITZ (Wuxi) Nonwoven Technology Co.
Ltd.
Wuxi, China 100.00% FC 100.00% FC
ANDRITZ Soutec AG Neftenbach,
Switzerland
100.00% FC 100.00% FC
Soutec Shanghai Ltd. Shanghai, China 100.00% NC 100.00% NC
Beheermaatschappij “G.M.F.” B.V. Waddinxveen, The
Netherlands
100.00% FC 100.00% FC
Vastgoedmaatschappij "G.M.F." B.V. Waddinxveen, The
Netherlands
100.00% FC 100.00% FC
ANDRITZ Gouda B.V. Waddinxveen, The
Netherlands
100.00% FC 100.00% FC
GMF-Gouda Singapore Pte Ltd. Singapore,
Singapore
100.00% NC 100.00% NC
S.A.S.J.E. Duprat & Cie La Roche Blanche,
France
100.00% NC 100.00% NC
GMF-Gouda China Co Ltd. Beijing, China 100.00% NC 100.00% NC
FC ... Full consolidation
EQ ... Equity valuation
NC ... Not consolidated due to minor importance
Graz, February 25, 2015
Wolfgang Leitner m.p. Humbert Köfler m.p. Friedrich Papst m.p Joachim Schönbeck m.p. Wolfgang Semper m.p.
(President and CEO)

110
Stat
We the
stan
mancert
We view
ards
busicom
Graz
The
STtement by the
confirm to the assets, liabilitie
ndards and tha
nce of the businainties the Grou
confirm to the bw of the assets,
s and that the
iness and the pmpany faces.
z, February 201
Executive Boa
Wolfgang Leitner
President and CEO
TATEMExecutive Bo
best of our knoes, financial pos
at the Group m
ness and the pup faces.
best of our kno liabilities, finan
management r
position of the c
15
rd of ANDRITZ
Humbe
PULP &
(Service
SEPAR
MENT ard, pursuant
owledge that thsition, and prof
anagement rep
osition of the G
owledge that thencial position, a
report gives a t
company, toget
AG
rt Köfler
& PAPER
& Units),
RATION
biom
BY THto Article 82 p
he consolidatedit or loss of the
port gives a tru
Group, togethe
e financial statend profit or loss
true and fair vi
her with a desc
Friedrich Papst
METALS,
HYDRO (pumps),
SEPARATION (feed
mass pelleting segm
HE EXE
Statement
para. 4 of the (
d financial statee Group as requ
ue and fair view
r with a descrip
ements of the ps as required by
iew of the dev
cription of the p
Joachim
d/
ments)
PULP &
(Capital
ECUT
by the Executiv
(Austrian) Stoc
ements give a tuired by the ap
w of the develo
ption of the prin
parent companyy the applicable
elopment and
principal risks an
Schönbeck
& PAPER
Systems)
IVE BO
ve Board
ck Exchange A
true and fair viepplicable accou
opment and pe
ncipal risks and
y give a true ane accounting st
performance o
nd uncertaintie
Wolfgang Sempe
HYDRO
OARDAct
ew of nting
erfor-
d un-
d fair tand-
of the
s the
r

111 Auditor’s report
Report on the consolidated financial statements
We have audited the accompanying consolidated financial statements of ANDRITZ AG, Graz, for the fiscal year from January 1, 2014 to December 31, 2014. These consolidated financial statements comprise the consolidat-
ed statement of financial position as of December 31, 2014, the consolidated income statement, the consolidat-
ed cash flow statement and the consolidated statement of changes in equity for the fiscal year ended December 31, 2014, and the notes.
Management’s responsibility for the consolidated financial statements and for the accounting system The Company’s management is responsible for the group accounting system and for the preparation and fair
presentation of the consolidated financial statements in accordance with International Financial Reporting
Standards (IFRSs) as adopted by the EU, and the additional requirements under Section 245a UGB. This re-sponsibility includes: designing, implementing and maintaining internal control relevant to the preparation and
fair presentation of consolidated financial statements that are free from material misstatement, whether due to
fraud or error; selecting and applying appropriate accounting policies; making accounting estimates that are reasonable in the circumstances.
Auditor’s responsibility and description of type and scope of the statutory audit Our responsibility is to express an opinion on these consolidated financial statements based on our audit. We
conducted our audit in accordance with laws and regulations applicable in Austria and Austrian Standards on
Auditing, as well as in accordance with International Standards on Auditing (ISAs) issued by the International Auditing and Assurance Standards Board (IAASB) of the International Federation of Accountants (IFAC). Those
standards require that we comply with professional guidelines and that we plan and perform the audit to obtain
reasonable assurance whether the consolidated financial statements are free from material misstatement.
An audit involves performing procedures to obtain audit evidence about the amounts and disclosures in the
consolidated financial statements. The procedures selected depend on the auditor’s judgment, including the assessment of the risks of material misstatement of the consolidated financial statements, whether due to fraud
or error. In making those risk assessments, the auditor considers internal control relevant to the Group’s prepa-
ration and fair presentation of the consolidated financial statements in order to design audit procedures that are appropriate in the circumstances, but not for the purpose of expressing an opinion on the effectiveness of the
Group’s internal control. An audit also includes evaluating the appropriateness of accounting policies used and
the reasonableness of accounting estimates made by management, as well as evaluating the overall presenta-tion of the consolidated financial statements.
We believe that the audit evidence we have obtained is sufficient and appropriate to provide a reasonable basis for our audit opinion.
Opinion Our audit did not give rise to any objections. In our opinion, which is based on the results of our audit, the con-
solidated financial statements comply with legal requirements and give a true and fair view of the financial posi-
tion of the Group as of December 31, 2014 and of its financial performance and its cash flows for the financial year from January 1, 2014 to December 31, 2014 in accordance with International Financial Reporting Stand-
ards (IFRSs) as adopted by the EU.
Comments on the management report for the Group
Pursuant to statutory provisions, the management report for the Group is to be audited as to whether it is con-
sistent with the consolidated financial statements and as to whether the other disclosures are not misleading with respect to the Company’s position. The auditor’s report also has to contain a statement as to whether the
management report for the Group is consistent with the consolidated financial statements and whether the
disclosures pursuant to Section 243a UGB (Austrian Commercial Code) are appropriate.
AUDITOR’S REPORT

112 Auditor’s report
In our opinion, the management report for the Group is consistent with the consolidated financial statements.
The disclosures pursuant to Section 243a UGB (Austrian Commercial Code) are appropriate.
Vienna, February 25, 2015
Deloitte Audit Wirtschaftsprüfungs GmbH
Mag. Walter MÜLLER Mag. Michael SCHOBER (Austrian) Certified Public Accountant (Austrian) Certified Public Accountant
This report is a translation of the original report in German, which is solely valid. Publication of the consolidated financial statements together
with our auditors’ opinion may only be made if the consolidated financial statements and the consolidated management report are identical with
the audited version attached to this report. Section 281 paragraph 2 UGB (Austrian Commercial Code) applies.
ANDRITZ AG
Stattegger Strasse 18 8045 Graz, Austria
Produced in-house using FIRE.sys
Disclaimer Certain statements contained in the 2014 annual report and in the 2014 annual financial report constitute “for-
ward-looking statements.” These statements, which contain the words “believe”, “intend”, “expect”, and words
of a similar meaning, reflect the Executive Board’s beliefs and expectations and are subject to risks and uncer-tainties that may cause actual results to differ materially. As a result, readers are cautioned not to place undue
reliance on such forward-looking statements. The company disclaims any obligation to publicly announce the
result of any revisions to the forward-looking statements made herein, except where it would be required to do so under applicable law. The 2014 annual report and the 2014 annual financial report contain assumptions and
forecasts based on the information available up to the copy deadline on February 25, 2015. If the premises for
these assumptions and forecasts do not occur, or risks indicated in the chapter “corporate risks” and in the management report in the 2014 annual financial report do arise, actual results may vary from the forecasts made
in the 2014 annual report and in the 2014 annual financial report. Although the greatest caution was exercised in
preparing data, all information related to the future is provided without guarantee.

FIN
AN
ZB
ER
ICH
T 2
014