Embed Size (px)
DESCRIPTION
And we continue with the hows and whys of analogue soundtracks, from conventional silver tracks over high magenta up to the final dye tracks. We will talk about the production process of an analogue soundtrack. Starting with the exposure of a sound negative. ST8D & ST9. - PowerPoint PPT Presentation
Citation preview
ab
And we continue with
the hows and whys of analogue soundtracks, from conventional
silver tracks over high magenta up to the final dye tracks.

ab
We will talk about the production process of an analogue soundtrack.
Starting with the exposure of a sound negative.
ST8D & ST9
And ending with a soundtrack on a positive print film.
CP20
ab
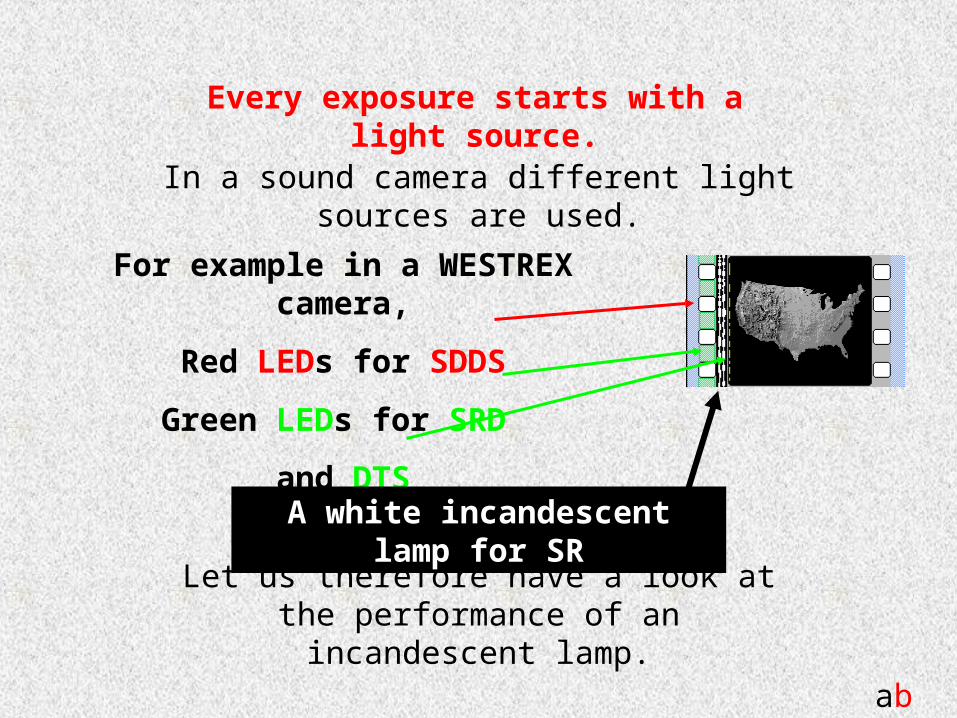
Every exposure starts with a light source.
In a sound camera different light sources are used.
For example in a WESTREX camera,
Red LEDs for SDDS
Green LEDs for SRD
and DTS
A white incandescent lamp for SR
Let us therefore have a look at the performance of an incandescent lamp.
ab
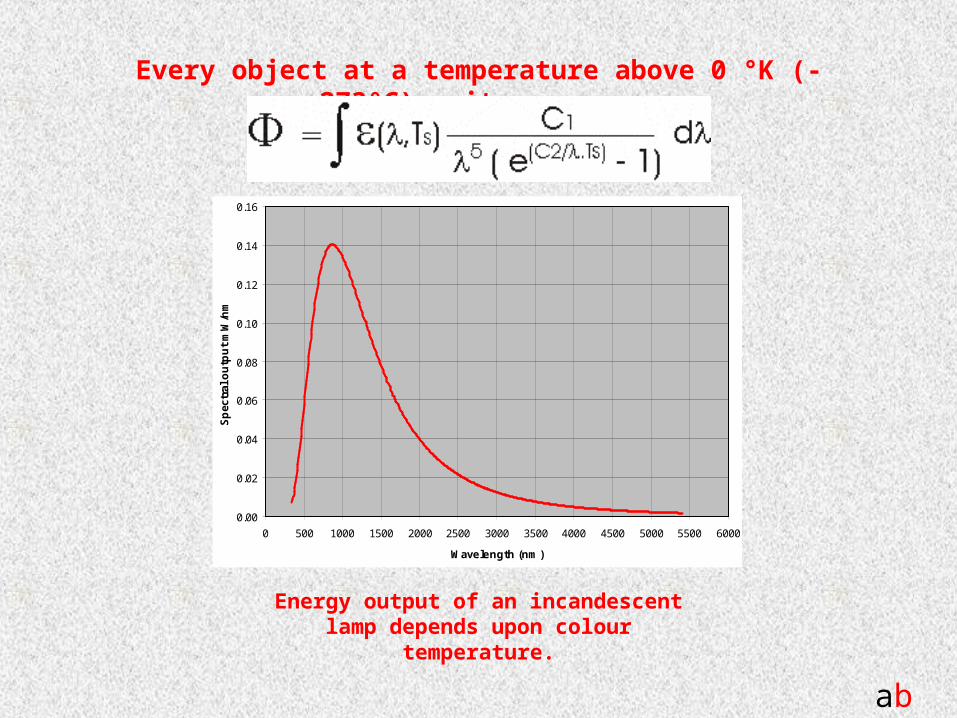
Every object at a temperature above 0 °K (-273°C) emits energy.
Energy output of an incandescent lamp depends upon colour temperature.
0.00
0.02
0.04
0.06
0.08
0.10
0.12
0.14
0.16
0 500 1000 1500 2000 2500 3000 3500 4000 4500 5000 5500 6000
Wavelength (nm)
Sp
ectr
al o
utp
ut
mW
/nm

ab
What about the spectral performance of an
FDT 12V 100W lamp, used in a Westrex sound camera ?
0.00
0.02
0.04
0.06
0.08
0.10
0.12
0.14
0.16
0.18
0.20
0 500 1000 1500 2000Wavelength (nm)
Sp
ec
tra
l po
we
r o
utp
ut
(mW
/nm
)
3500 K
3350 K
3000 K
2500 K
What happens at different colour temperatures ?
m = ( m)2898
Tr
Wien’s displacement law

ab
0.00
0.02
0.04
0.06
0.08
0.10
0.12
0.14
0.16
350 400 450 500 550 600 650 700 750 800
Wavelength (nm)
Sp
ectr
al o
utp
ut
mW
/nm
Light source to expose the sound negative in a Westrex camera.

ab
0.00
0.02
0.04
0.06
0.08
0.10
0.12
0.14
0.16
350 400 450 500 550 600 650 700 750 800
Wavelength (nm)
Sp
ectr
al o
utp
ut
mW
/nm
0.0
0.2
0.4
0.6
0.8
1.0
1.2
1.4
1.6
1.8
2.0
350 400 450 500 550 600 650 700 750 800Wavelength (nm)
Sen
sitiv
ity
What happens during the exposure of ST9 ?
The spectral output of the lamp
The spectral sensitivity of the film
x
0.00
0.20
0.40
0.60
0.80
1.00
1.20
1.40
1.60
1.80
2.00
350 400 450 500 550 600 650 700 750 800Wavelength (nm)
Act
inic
ene
rgy
(rel
)
Resulting actinic energy=
xExposure timeExposure dose <=
340 mW
0.0
0.5
1.0
1.5
2.0
2.5
3.0
3.5
4.0
4.5
0 0.5 1 1.5 2 2.5 3Exposure dose
Density
Sensitometry of sound negative

ab
Let us now see how with this kind of light source
a CP20 print film can be exposed.
First of all, we have to calculate the spectral emission for a 1200 Watt incandescent lamp.
0.00
0.20
0.40
0.60
0.80
1.00
1.20
1.40
1.60
1.80
2.00
350 400 450 500 550 600 650 700 750 800
Wavelength (nm)
Sp
ectr
al o
utp
ut
mW
/nm
This higher power lamp (1200 W instead of 100W) with the same colour temperature (3350 K), only differs in spectral output
magnitude.

ab
How is CP20 composed?
Polyester
YellowCyanMagenta
BlueRedGreen
Sensitized for Producing
On top of this, there is:
- a protective layer on both sides of the film
- a layer in between the dye producing layers
- an antihalation layer between the blue sensitive layer and the base, protecting the polyester in the case of laser subtitling.

ab
Let us calculate the actinic energy
0.00
0.20
0.40
0.60
0.80
1.00
1.20
1.40
1.60
1.80
2.00
350 400 450 500 550 600 650 700 750 800
Wavelength (nm)
Sp
ectr
al o
utp
ut
mW
/nm
-1.5
-1.0
-0.5
0.0
0.5
1.0
1.5
2.0
350 400 450 500 550 600 650 700 750 800Wavelength (nm)
Log
sens
itivi
ty
X
0
2
4
6
8
10
12
14
16
350 400 450 500 550 600 650 700 750 800Wavelength (nm)
Act
inic
ene
rgy
0
5
10
15
20
25
30
380 430 480 530 580 630 680 730 780Wavelength (nm)
Sen
sitiv
ity (l
in.)
Spectral sensitivity of the different layers
linear
=
Linear spectral sensitivity
Resulting actinic energy Spectral emission of the lamp
This is without the use of any optical filter !

ab
0%
10%
20%
30%
40%
50%
60%
70%
80%
90%
100%
350 400 450 500 550 600 650 700 750 800
Wavelength (nm)
Tra
nsp
ara
ncy (
%)
The use of optical filters
For normal analogue tracks only a yellow filter is used.
0%
10%
20%
30%
40%
50%
60%
70%
80%
90%
100%
350 400 450 500 550 600 650 700 750 800Wavelength (nm)
Tra
nsp
ara
ncy
(%
) W12 or L519
Cyan 40
Cyan 50
For high magenta a yellow filter and some cyan is used

ab
0.0
0.2
0.4
0.6
0.8
1.0
1.2
1.4
1.6
1.8
350 400 450 500 550 600 650 700 750 800
Wavelength (nm)
Sp
ectr
al e
ner
gy
(wW
/nm
)
Spectral emission of the lamp
0%
10%
20%
30%
40%
50%
60%
70%
80%
90%
100%
350 400 450 500 550 600 650 700 750 800
Wavelength (nm)
Tran
spar
ancy
(%)
0.00
0.20
0.40
0.60
0.80
1.00
1.20
1.40
1.60
1.80
2.00
350 400 450 500 550 600 650 700 750 800
Wavelength (nm)
Sp
ectr
al o
utp
ut
mW
/nm
Filter characteristic
Resulting spectral output
0
1
2
3
4
5
6
7
8
9
10
350 400 450 500 550 600 650 700 750 800Wavelength (nm)
Act
inic
ene
rgy
Resulting actinic energy
The effect of an optical filter
x
=

ab
So what is the difference ?
With yellow filterWithout yellow filter
0
2
4
6
8
10
12
14
350 400 450 500 550 600 650 700 750 800
Wavelength (nm)
Actin
ic e
nerg
y
0
2
4
6
8
10
12
14
350 400 450 500 550 600 650 700 750 800Wavelength (nm)
Actin
ic e
nerg
y

ab
And finally, colours are here...
Let us start with the dye densities
If we convert them into a linear scale...
0.0
0.2
0.4
0.6
0.8
1.0
1.2
350 400 450 500 550 600 650 700 750 800Wavelength (nm)
Dye
de
nsi
ty (
lin.)
0.0
0.5
1.0
1.5
2.0
2.5
3.0
3.5
4.0
350 400 450 500 550 600 650 700 750 800
Wavelength (nm)
Dy
e d
en
sit
y
ab
0.0
0.5
1.0
1.5
2.0
2.5
3.0
3.5
4.0
0 0.1 0.2 0.3 0.4 0.5 0.6 0.7 0.8 0.9 1Silver density
Dye
de
nsi
ty
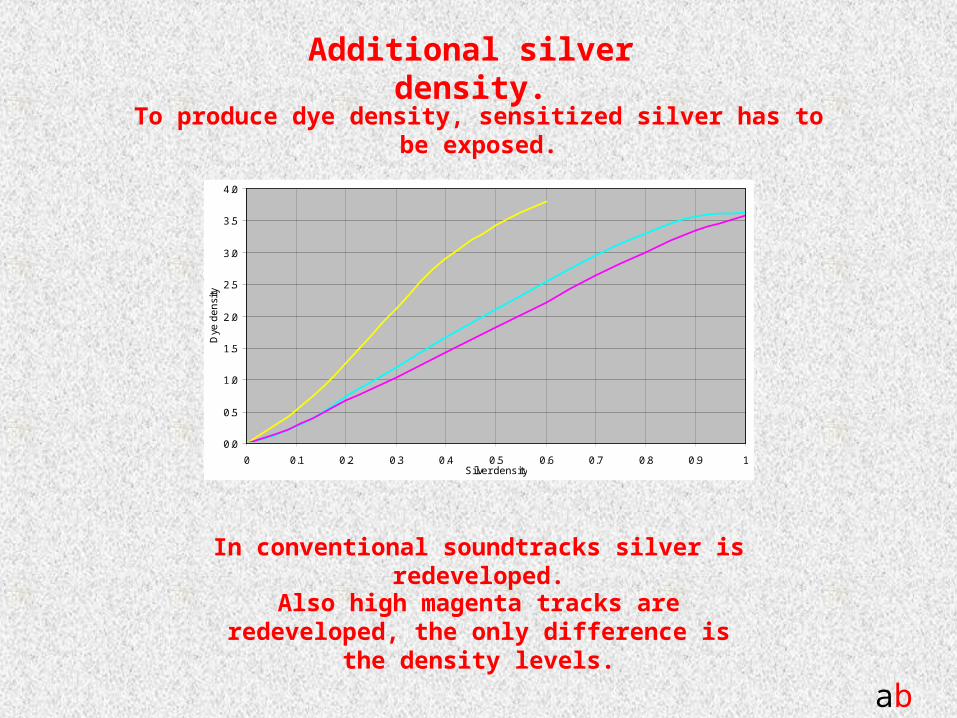
Additional silver density.
To produce dye density, sensitized silver has to be exposed.
In conventional soundtracks silver is redeveloped.
Also high magenta tracks are redeveloped, the only difference is the density levels.

ab
0.00
0.50
1.00
1.50
2.00
2.50
3.00
350 400 450 500 550 600 650 700 750 800
Wavelength (nm)
Den
sity
Total density Silver
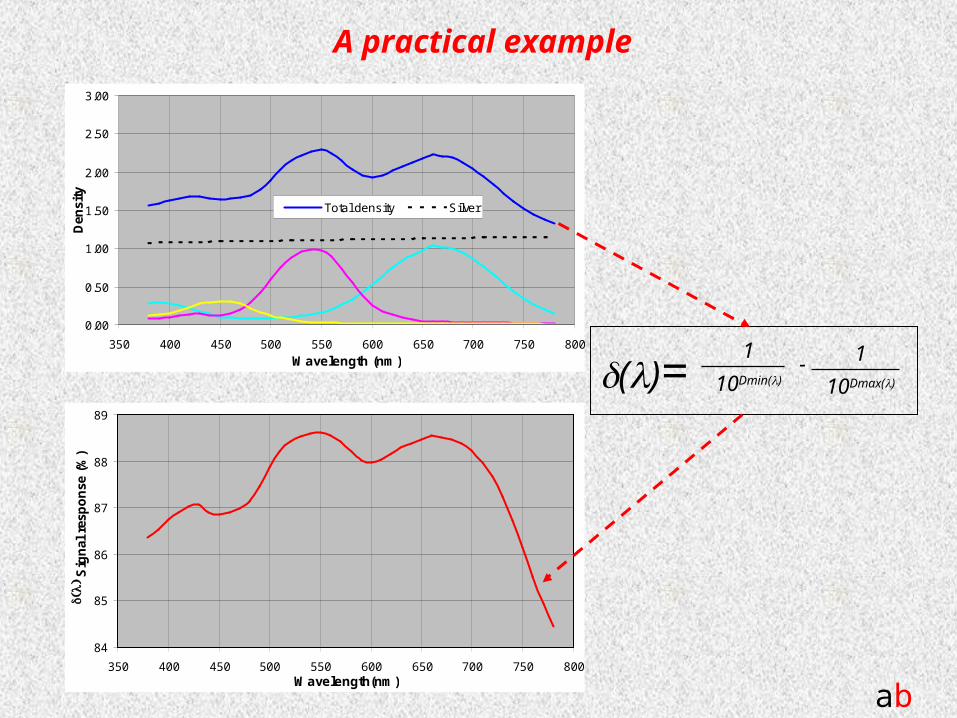
The final soundtrack.
The total soundtrack density is a mixture of different components.

ab
What about the soundtracks on the film ?
On the sound negative On the colour print
ab
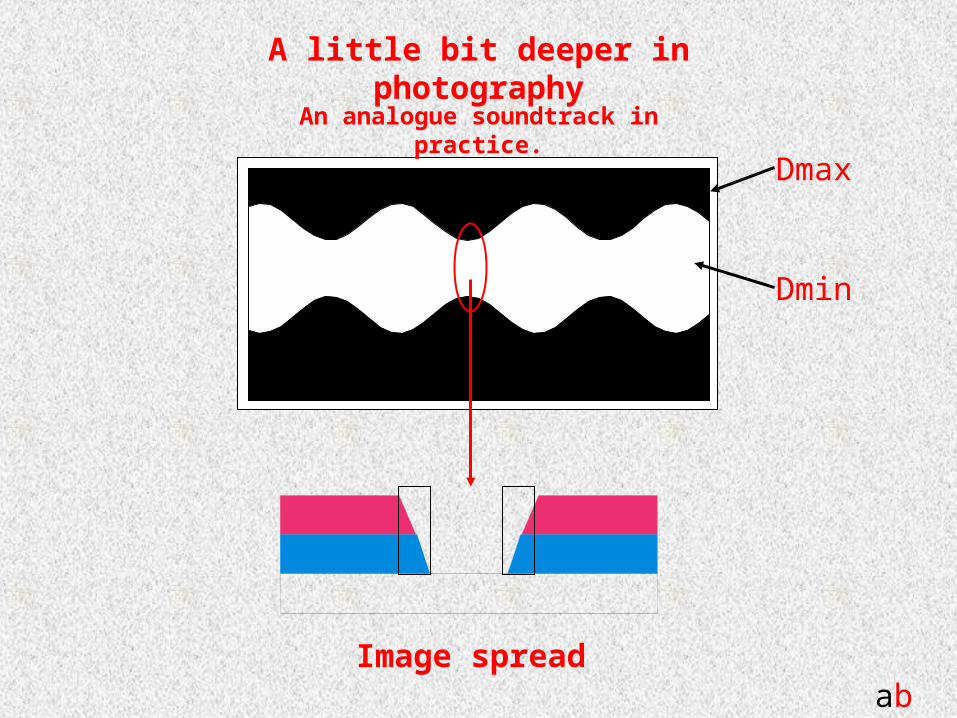
A little bit deeper in photography
An analogue soundtrack in practice.
Dmax
Dmin
Image spread

ab
Practical measurements on CP20 print film
D= 3
D= 1.5
D= 3.6

ab
D= 3.6
Practical measurements on a ST8D sound negative.
Because image spread is related to density, to find the optimum neg/pos combination a cross modulation test is
always necessary.
0
20
40
60
80
100
120
60 65 70 75 80 85 90 95 100Distance (m)
% o
f D
max D = 3.6
D = 3
ST8D (D=3.6)
0
20
40
60
80
100
120
60 65 70 75 80 85 90 95 100Distance (m)
% o
f D
ma
x
D = 3.6
D = 3
ST8D (D=3.6)
What does this mean ?

ab
-50
-40
-30
-20
-10
0
1 1.2 1.4 1.6 1.8 2Print density
Can
cella
tio
n (
dB
)
Dn= 2.46
Dn= 2.62
Dn= 2.87
Dn= 2.97
Dn= 3.08
Dn= 3.31
The results of a x-mod test.

ab
How does the analogue sound system reproduce
the recorded information?
-The sound is recorded in a double, variable area track.
-The film is transported through a reader system.
-The reader “looks” through a narrow slit.
-The reader detects area variations.

ab
A little bit of mathematics...
S(t) =
Sin t
10Dmin+
1- Sin t10Dmax

ab
-1.0
-0.8
-0.6
-0.4
-0.2
0.0
0.2
0.4
0.6
0.8
1.0
0 5 10 15 20 25 30 35 40 45 50Time
No
rma
lize
d s
ign
al l
ev
el
Antigonising signal
Resulting signal
DC level
The previous formula visualized.
- Sin t10Dmax
Sin t
10Dmin
110Dmax

ab
0.0
0.1
0.2
0.3
0.4
0.5
0.6
0.7
0.8
0.9
1.0
0 0.5 1 1.5 2Dmax - Dmin
No
rma
lize
d s
ign
al l
ev
el
Sound signal
DC level
Signal level as a function of contrast.
With the contrast of the analogue sound track defined as
Dcon = Dmax - Dmin
and the previous formula solved as a function of this contrast, leads us to the following graph,
Conclusion.
By means of the nominal density aim value a signal level reaching 90% of the theoretical maximum level
can be obtained.

ab
Exposure of a colour print film
Conventional silver trackDye trackConclusion
By means of the colour balance of both dyes, dye tracks can be adapted selectively to the spectral characteristics of the reader system.
However since there is a mixture of white and red readers in the field, track performance needs to be adapted to both of them, leading to high
magenta.

ab
Let’s go back to basics now.
S(t) =
Sin t
10Dmin+
1- Sin t10Dmax
S(t) = f(t) { - }1
10Dmin
1
10Dmax
S(t) = .f(t).()
() = 1
10Dmin()
1
10Dmax()
-
This equation defines
the signal level response completely.
ab
0.00
0.50
1.00
1.50
2.00
2.50
3.00
350 400 450 500 550 600 650 700 750 800
Wavelength (nm)
Den
sity
Total density Silver
84
85
86
87
88
89
350 400 450 500 550 600 650 700 750 800Wavelength(nm)
(
) Sig
nal
res
po
nse
(%
)
A practical example
1
10Dmin()
1
10Dmax()-()=

ab
0
20
40
60
80
100
120
140
160
180
350 400 450 500 550 600 650 700 750Wavelength (nm)
Em
itte
d p
ow
er
(mW
)
0.83
0.84
0.85
0.86
0.87
0.88
0.89
0.90
350 400 450 500 550 600 650 700 750Wavelength (nm)
Val
ue
of
d(f
)
0
10
20
30
40
50
60
70
80
90
350 450 550 650 750Wavelength (nm)
De
tec
tor
res
po
ns
e (
%)
0
10
20
30
40
50
60
70
80
90
100
350 400 450 500 550 600 650 700 750Wavelength (nm)
No
rma
lize
d s
ys
tem
re
sp
on
se
The reader with practical elements
Incandescent lamp
Film
Detector
Resulting signal
L()
()
D()
S()
0.83
0.84
0.85
0.86
0.87
0.88
0.89
0.90
350 400 450 500 550 600 650 700 750Wavelength (nm)
Val
ue
of
d(f
)
0
10
20
30
40
50
60
70
80
90
350 450 550 650 750Wavelength (nm)
De
tec
tor
res
po
ns
e (
%)
0
20
40
60
80
100
120
350 400 450 500 550 600 650 700 750
Wavelenth (nm)
No
rma
lize
d le
d o
utp
ut
(%)
0
20
40
60
80
100
120
350 400 450 500 550 600 650 700 750
Wavelenth (nm)
No
rma
lize
d le
d o
utp
ut
(%)
Red LED

ab
Introducing the film into this setup.
To introduce the film in this system without disturbing the response of itthe signal response () needs to be flat in the used part of the spectrum.
86
87
88
89
90
350 400 450 500 550 600 650 700 750 800Wavelength(nm)
(
) Sig
nal
res
po
nse
(%
)

ab
0.00
0.50
1.00
1.50
2.00
2.50
3.00
3.50
4.00
4.50
5.00
350 400 450 500 550 600 650 700 750 800Wavelength (nm)
Den
sity
Total density Silver
Corresponding dye characteristics

ab
0.00
0.50
1.00
1.50
2.00
2.50
3.00
3.50
4.00
4.50
5.00
350 400 450 500 550 600 650 700 750 800Wavelength (nm)
Den
sity
Total density Silver
Also other dye density ratio’s are possible !
The correct choice is defined by a X-mod test.

ab
0
20
40
60
80
100
300 400 500 600 700Wavelength(nm)
Tra
nsm
itta
nce
(%
)
0
20
40
60
80
100
350 450 550 650Wavelength (nm)
Tra
nsm
itta
nce
(%
)
AGFA L519
KODAK W12Y
-4
-3
-2
-1
0
1
300 400 500 600 700Wavelength (nm)
Lo
g s
ensi
tivi
ty
0
10
20
30
40
50
60
70
80
Filt
er
Tra
ns
mit
tan
ce
(%
)
PAN
ORTHO
BLIND
W12+50C+20C+20C
G00001
W57
Exposing the colour print film for a high magenta track.

ab
Recommended aim densities and filters.
Sound system Neg.density Print density Filter pack
Silver tracks 2.5 - 3.0 1.25 - 1.5 #12 Yellow
#2B UV blocker
High Magenta 2.5 - 3.3 R= 1.5 - 2.3 #12 Yellow
G <= 3.8 - 4 #90 - 120 Cyan
IR= 1 - 1.2 or AGFA G00004
Cyan dye track 2.3 - 3.2 R= 1.5 - 2.5 #29 Red
G&B= 0.3 - 0.5 or AGFA L622
SRD 1.2 - 1.75 1.2 - 1.4 #170 Yellow
# 20 Magenta
# 2B UV blocker
SDDS 2.0 - 2.5 R= 1.2 - 1.4 #29 Red
G <= 1 or
B <= 0.35 AGFA L622

ab
Why high magenta soundtracks ?
Red readers are being installed more and more:62 % in USA (NATO report)
25 % in Europe4 % in Eastern Europe.
A soundtrack, not exposed for high magentahas a signal loss of 12dB on a red reader system.
So the high magenta technology is an intermediate stepbetween conventional silver tracks and cyan dye tracks.

ab
What about the advantages of pure dye tracks ?
For the labs:No more redevelopment.
A safer processing.Therefore savings of cost.
For the theatre owner:A much higher reliability because of the red reader.
For the theatre visitor:A higher frequency response.

ab
What about the production of dye tracks ?
Because of the red readers,we only need CYAN dye density.
To print pure cyan dye trackswe only need a RED filter.
Dye tracks will end up with:the same quality compared to conventional silver tracks,
being produced at lower costs and lower risks.
ab
What is the situation for this moment ?
Distributors now ordering high magenta prints include:Warner Bros. (100% in USA)
Universal Studios (selected titles)Fox (100% in USA)
Fox SearchlightMiramaxNew Line
The introduction of dye trackswill be pre-announced at
Showest 2001

ab
And finally..
Let us always remember, that:
Experience is what you get
if you don’t get what you want…
Many thanks for being here today.


![[Insert Hospital Name/Logo] · Web view2 – Engagement - we will continue to engage with others in the coming year. The focus will be to continue working with other FHTs in the Champlain](https://img.dokumen.tips/doc/110x75/6064efb57673e2075f74802c/insert-hospital-namelogo-web-view-2-a-engagement-we-will-continue-to-engage.jpg)