Embed Size (px)
Citation preview

October 1997
CONVERGENCE CLUBS
AND DIVERGING ECONOMIES *
Dan Ben-David
Tel Aviv University,NBER and CEPR
ABSTRACT
This paper focuses on the question of income convergence among countries. Itexamines the incidence of reduction in income gaps among countries at differentlevels of development. Some evidence is found of convergence clubs among theworld’s wealthiest countries, though even within this set of countries, thelikelihood of finding convergence among randomly chosen countries is lower thanthe likelihood of finding divergence. Where the preponderance of convergenceclubs turns out to be the highest is actually among the world’s very poorestcountries. The nature of convergence at the top and bottom ends of the incomespectrum also differs: catch-up at the top and downward convergence at thebottom.
J.E.L. classifications: O1, O4, O5
Correspondence:
Berglas School of Economics Tel: 972 3 640-9912Tel Aviv University Fax: 972 3 640-9908Ramat Aviv, Tel Aviv 69978 [email protected]
* I would like to thank Leonardo Aurnheimer, William Baumol, Andrew Bernard, Dee Dechert, Peter Hartley,Michael Loewy, Dan Levin, Thomas Mayor, Michael Palumbo, David Papell, Danny Quah, Farhad Rassekh, RobertSolow and the seminar participants at the CEPR European Summer Symposium in Macroeconomics, DartmouthUniversity, the World Bank, the International Monetary Fund, the Hebrew University, Texas A&M University andthe University of Houston - Rice University Macroeconomics Workshop for their very helpful comments. Thisresearch was supported by a grant from the Centre for Economic Policy Research (CEPR).
I. I NTRODUCTION
Much has been written on the convergence issue in recent years. While the primary
emphasis has tended towards questions of conditional convergence, there still remains a question
regarding the behavior of actual income gaps over time. To the extent that similar income levels
reflect similar developmental levels, then what has been the behavior of income differentials
between countries with relatively similar incomes? Has actual income disparity among such
countries been falling or rising? Empirical evidence on this issue has been mixed and
apparently quite affected by the choice of countries chosen for inclusion in the different groups
analyzed by the various studies.
The goal here is to provide a descriptive account of the convergence issue and to shed
some light on the stylized facts regarding the disparity of incomes among countries and how
this disparity has been changing over time. Is there income convergence, and if so, what is the
preponderance of convergence clubs along the income spectrum? That issue is the focus of this
paper.
Using a combination of cross-sectional and time-series data, Rostow (1980) concludes that
countries do converge. He states that "the widely held notion that the rich typically get richer,
the poor relatively poorer, is supported neither by evidence from the contemporary scene nor by
that from the longer past" (pg. 259).
Kristensen (1982), focusing on the cross-section alone, grouped countries by their 1974
income levels and found a hump-shaped relationship between group’s 1970-79 growth rates and
their income levels, with the middle-income groups enjoying higher rates of growth than the
wealthier and the poorer groups. This finding of divergence among the poorer countries and
convergence among the relatively wealthier countries is supported by Chenery and Syrquin
(1986), who combine time-series and cross-sectional data for several countries and find a similar
hump-shaped development curve.
By testing for a negative relationship between average annual rates of growth and initial
1

levels of income, Baumol (1986) concluded that industrial countries appear to belong to one
convergence club, middle income countries to a separate, only moderately converging club, and
that low income countries actually diverged over time. He went on to note that these groups also
exhibited very little convergence with one another. De Long (1988) commented that the strong
convergence findings in the top group were primarily the result of an ex post selection of wealthy
countries rather than an ex ante selection.
Other studies have raised doubts about the plausibility of global convergence altogether.
In his examination of 115 countries, Romer (1987 and 1989) used a scatterplot that horizontally
measured the 1960 per capita incomes of each country and vertically measured their average
annual growth rates between 1960 and 1981. Global convergence requires a negative relationship
between the points on the plot. But Romer (1989) found that "in the cross-section, the mean
growth rate shows no variation with the level of per capita income" (pg. 55). One drawback to
this type of a plot is that average growth rates could be susceptible to the possibility that 1960
or 1981 may be outlier years.
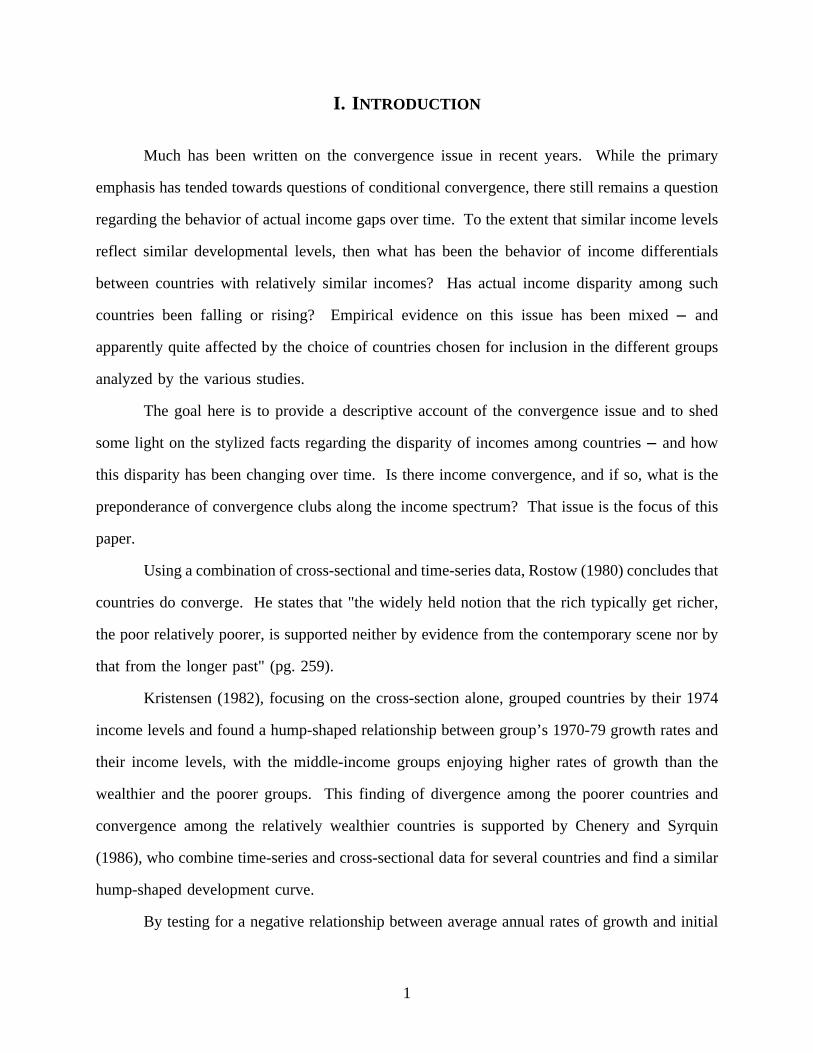
An alternative would be to horizontally plot each of the annual real incomes for each of
the 113 market economies in the Summers and Heston (1988) data set in each of the years
between 1960 and 1985 together with a vertical plot of the subsequent rate of growth experienced
by each country for the following year. Ben-David (1994) shows that these 2825 observations
are arrayed in a mean-preserving wedge that is very similar to the Romer plot. The lower the
incomes, the greater the number of observations, and the larger the variance in growth rates.
However, as Figure 1 indicates, there does not appear to be much fluctuation in the means.
The absence of evidence on global convergence was a major influence behind the seminal
papers by Romer (1986) and Lucas (1988). These were followed by a large number of new
growth models that endogenized technological progress and predicted very different outcomes
2
Dispersion of Annual Growth Ratesat Different Levels of Per Capita Incomes
113 Countries, 25 Years (2825 Observations)
Figure 1
concerning the behavior of income differentials over time. One characteristic of many such
models is the prediction that countries will converge to multiple equilibria rather than to a single
target. While there exists a broad consensus in the more recent literature suggesting an absence
of convergence to a single steady state, newer studies that control for various differing
characteristics across countries point to the existence of conditional convergence (see for
example: Mankiw, Romer and Weil, 1992; Barro, 1991; and Levine and Renelt, 1992).
The thread that ties together most of the above empirical literature on convergence is the
cross-sectional nature of the majority of the tests. Friedman (1992) and Quah (1993a) have
raised questions about the advisability of using such tests to indicate the existence of
3

convergence. Friedman echoes Hotelling’s (1933) view that convergence is best measured by
an examination of the behavior of cross-country income differentials over time. This concept
provides the basis for testing convergence in this paper.
It should be noted from the outset that the primary contribution of this paper is not the
convergence test used here, but rather the illustration of the convergence tendencies (or lack
thereof) among countries at different levels of income. Aside from the common practice of
regressing average growth rates on initial incomes, there are other methodologies available for
determining convergence among these: Bernard and Durlauf (1996) who use cointegration
analysis; and Quah (1993b) who uses distributional dynamics. Like these latter methods for
examining convergence, the convergence test used here utilizes the data from the interim years.
It was chosen primarily for its ease of use in repeated convergence tests within relatively small
groups of countries.
Baumol’s finding of convergence among the wealthier countries receives some support
in this study, though the convergence outcomes found here are not betweenall of the wealthy
countries (regardless of the subjective criteria employed to determine which countries should be
included under the "wealthy" heading). Rather, there appears to be a preponderance of income
convergence between subsets of the wealthy countries.
There appears to be an additional congregation of convergence clubs as well. This one
is situated at the very bottom of the income ladder.1 The difference between these two types
of "clubs" is the difference between what one might describe asupward convergenceversus
downward convergence. While upward convergence may be defined as a case of poorer club
members catching up to wealthier members, downward convergence is characterized by very low
(and even negative) growth among the top club members.
Section two provides some background and motivation. Section three continues with the
convergence analysis and section four concludes.
1 Quah (1993b) also provides evidence in support of this using transitional probability matrices, as do Blomström,Lipsey and Zejan (1992) within a conditional convergence setting.
4

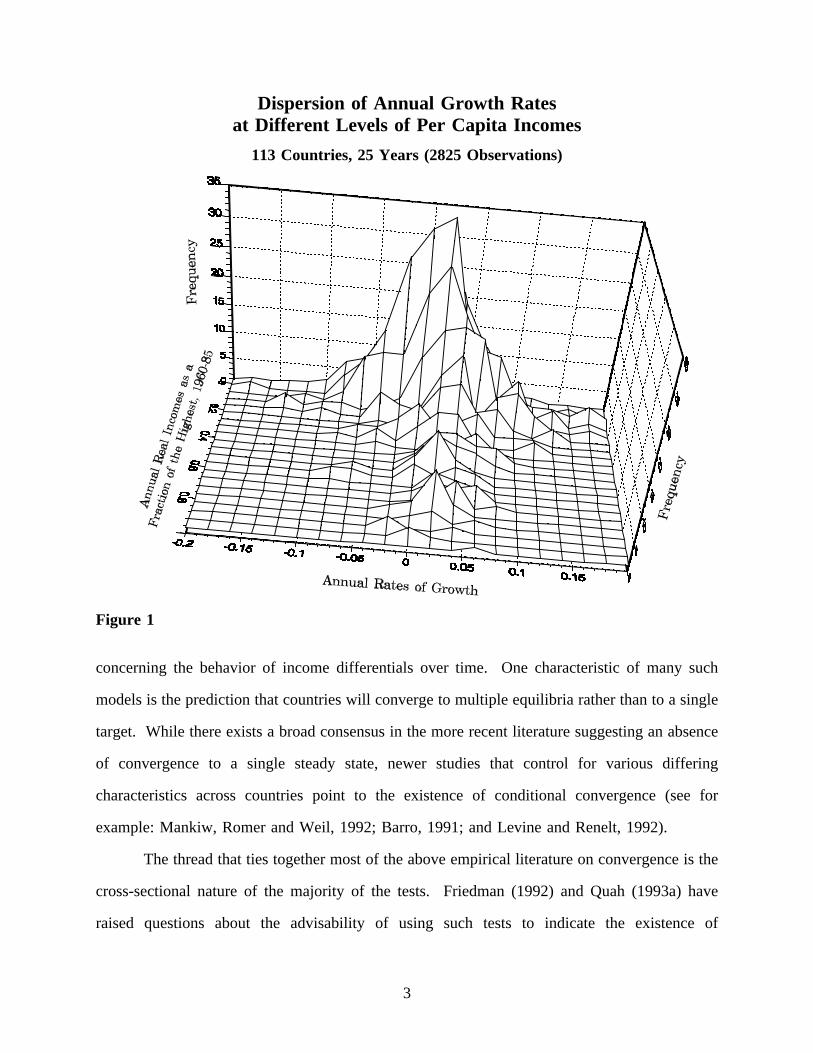
II. T HE SENSITIVITY OF COMPOSITION
Lorenz curves for the years 1960 and 1985 point to an increasing degree of disparity
among the 113 market economies in the Summers and Heston (1988) sample (Figure 2). The
curves appear to indicate that most of this rise in inequality was due primarily to a growing
discrepancy among the world’s relatively poorer nations.
The question is, what constitutes "wealthy", "poor", and other subgroupings? Each of the
studies mentioned in the introduction grouped countries differently, and each came up with
different results.
Kristensen’s (1982) results for the 1970-79 period depict convergence among the top four
Figure 2
of his seven income groupings. In his study for the years 1950-80, Baumol (1986) grouped
nations into three groups and found very little convergence between the groups. On the other
hand, he concluded that
countries within the wealthiest
group exhibited income
c o n v e r g e n c e a m o n g
themselves, thus constituting
what Baumol calls, a
"convergence club". Among
the middle income group,
Baumol found much less
convergence, while the poorest
group displayed diverging
economies.
In each of these instances, convergence was inferred by an examination of the relationship
between the starting level of per capita income and the countries’ average rates of growth over
5

the ensuing period.2 Whether this is representative of what happened in the interim is not
always obvious. Furthermore, since the world was partitioned into only a limited number of
country groupings, a question may be raised regarding the sensitivity of the results to group
membership.
To highlight the sensitivity of the convergence results to sample selection, take for
Figure 3
example, an analysis of the 1960-85 period, with a different grouping of countries than in either
of the above studies. Based on rankings of real per capita incomes in 1960, it is possible to
divide up the market economies of the world into 3 ad hoc income groups: wealthy, middle-
income and poor. Let the wealthy group be defined as those countries that maintained, as a
group, the same proportions of the world’s total product and total population in 1985 that they
had in 1960. The line dividing the middle income group from the low-income group is drawn
at the per capita income level of $2000 where there is a relatively sizeable gap between the
countries producing more than that amount and the countries producing less.
Sixteen countries comprise the top group and their incomes range from 60 to 100 percent
of the top country’s (the United
States) income in 1960. The
middle group consists of 15
countries with incomes ranging
from 25 to 60 percent of the
U.S. income. The poorest
group consists of the remaining
82 countries.
In 1960, the degree of
inequality within groups
(measured by the annual
2 Although Baumol, Blackman and Wolff (1989), for example, supplement their cross-section regressions withexaminations of annual income differentials as well.
6

standard deviation of the log real per capita incomes) appeared to be positively related to the
group’s average level of income (Figure 3). Furthermore, the disparity among the poorest
countries rose steadily from year to year. Income differentials among the middle income
countries also increased over time, while only the wealthiest countries appear to maintain any
semblance of preserving the status quo, and even this was accomplished only after the exclusion
of Venezuela (which was an outlier in the group).
The impact of one country, Venezuela, on the entire group, highlights the point raised
above. How robust are all these results to changes in the composition of the various groups?
Suppose that, rather than using the above criteria for partitioning the world, the segmentation into
groups is arbitrary.
For example, let the cutoff points between groups be set at 20 percent intervals of the
1960 U.S. level of income. In this case, the world is partitioned into 5 groups where the first
group comprises the four wealthiest countries with incomes between 80 to 100 percent of the
U.S. income. Incomes in group two range between 60 and 80 percent of the U.S. income in
1960. There are 12 countries in this group, 7 in the third group (40-60%), 18 in the fourth group
(20-40%), and 72 in the fifth and final group (0-20%).
T h e o n l y g r o u p
Figure 4
exhibiting no divergence at all
is group one, the wealthiest
group (Figure 4). The
countries within each of the
remaining groups displayed
income divergence, with the
degree of inequality tending to
be higher, the poorer the group.
Both figures provide support
for Baumol’s argument that disparity is higher among poorer countries, though these figures fail
7

to provide much visual support for the existence of a convergence club among the wealthier
countries. On the other hand, two sample segmentations of the world do not provide enough
evidence for determining the existence of one or more convergence clubs. The remainder of this
paper centers on exactly this point.
III. C ONVERGENCE CLUBS
Following Friedman (1992) and Hotelling (1933), convergence within a given group of
countries will be defined here as a decline in the degree of income disparity within the group
over time. As in the earlier graphical depictions, annual income differentials are measured as
standard deviations of log real per capita incomes. These are then regressed on trend. Negative
trend coefficients indicate convergence and positive coefficients indicate divergence.
Since the objective of this paper is to explore the sensitivity of convergence outcomes
with respect to (a) group membership i.e. the relative wealth of the countries in the group
and (b) group size, a different methodology than the conventional convergence test (which
regresses rates of growth on initial incomes) is preferable. Aside from the criticisms by Quah
(1993a), Friedman (1992) and others, the conventional method of determining convergence is
further handicapped in the context of this paper by the relatively low power of the test when
the analysis covers only a small group of countries. While there are other alternatives to the
conventional test, the method used here is purposefully straightforward and simple a feature
that readily facilitates testing for convergence within the many repeated samplings and
resamplings of the groups below.
Continuing with the exercise from the preceding section, the 113 market economies in the
Summers and Heston sample are ranked according to their 1960 real per capita incomes. The
wealthiest country is labeled country 1 and the poorest country is labeled 113. An examination
of all 113 countries together during the 1960 to 1985 period yields a significantly positive
estimated trend coefficient of 0.009 (Table 1), indicating that the overall income spectrum has
8

been widening over time.3 When the world is divided in half, both halves exhibit significant
divergence over time, though the rate of divergence is greater within the poorer half.
When the world is partitioned into three country ranges of equal size, all three ranges
exhibit divergence with the middle range diverging the fastest. Further partitioning of the world
into equally-sized ranges produces similar outcomes: there is significant divergence in nearly
every range regardless of its size or relative income level. These results differ from those of the
other studies mentioned above in that, not only do the wealthiest countries fail to converge, but
the countries whose income differentials exhibit the slowest rate of increase over time (and in
the bottom-most case where the world is divided into 8 groups they even appear to decline,
though not significantly) are the very poorest countries.
One of the first questions that comes to mind here is the sensitivity of these results to the
inclusion/exclusion of individual countries. This is best illustrated by the distortion that may be
caused by an outlier country such as Venezuela, a country that ranked among the ten wealthiest
in 1960, but which displayed negative average annual growth over the next quarter century.
As the size of the country ranges decreases, the exclusion of Venezuela from the
wealthiest category (in parentheses in Table 1) reduces the trend coefficient, though it is still not
negative. This accords with the visual evidence of non-convergence for the wealthiest groups
in Figures 3 and 4.
The lack of convergence in the top group is striking in that it does not corroborate the
common perception of convergence among industrialized countries. To what extent does this
outcome represent the convergence/divergence behavior withinsubsetsof countries from among
the 14 comprising the entire range? For that matter, how likely is it to find a convergence club
in a random drawing of countries from any of the larger ranges?
3 The issue of serial correlation, when it is found to exist, is addressed in the estimations.
9

Table 1 Trend Coefficients By Range
Country RangeFirst Last
TrendCoefficient t-statistic
R2
1 113 0.0090 (0.0095) 45.6 (46.5) 0.989 (0.989)
158
57113
0.0009 (0.0013)0.0121
2.0 (3.2)15.3
0.141 (0.300)0.911
13977
3876
113
0.0014 (0.0014)0.01880.0068
2.3 (2.5)22.010.2
0.176 (0.203)0.9540.812
1305886
295785
113
0.0047 (0.0061)0.01280.01880.0080
7.4 (4.0)26.114.212.9
0.696 (0.415)0.9660.8970.875
124466890
23456789
111
0.0051 (0.0032)0.01110.01750.01980.0100
10.7 (8.2)12.99.1
39.112.9
0.826 (0.737)0.8740.7840.9850.878
12038567492
1937557391
109
0.0045 (0.0002)0.00760.01390.02030.02070.0077
7.0 (0.2)8.8
12.28.7
31.58.8
0.671 (0.002)0.7720.8670.7660.9760.770
1183450668298
173349658197
113
0.0063 (0.0014)0.00720.01700.01530.02500.01630.0041
9.6 (2.3)6.7
20.223.416.217.54.5
0.792 (0.192)0.6590.9440.9580.9190.9270.469
1163044587286
100
15294357718599
113
0.0074 (0.0019)0.01050.01720.01430.02200.01860.0190
-0.0005
11.8 (4.2)7.7
23.015.123.823.525.0- 0.3
0.854 (0.438)0.7230.9560.9080.9590.9600.9630.005
The parentheses denote values without Venezuela. 26 observations.
10

Within each range of countries, smaller groups were formed and their trend coefficients
calculated.4 Continuing with the above example, if the world is divided into eight ranges of
equal sizes, each range will comprise fourteen countries. Within each range it is possible to
create smaller groupings of countries and examine whether these smaller groups behave similarly
to the range as a whole.
For example, suppose that from each range of 14 countries, groups comprising 6 countries
are drawn and their trend coefficients are calculated. There are 3003 different possible draws
of groups of 6 from within each range of 14.5 The cumulative distributions for the ranges
appear in Figure 5 while the outcomes are summarized in Table 2.
In six of the eight ranges (i.e., every range but the wealthiest and the poorest ranges),
Figure 5
there is a total of 18,001 groups with positive trend coefficients versus 17 groups with negative
trend coefficients (17,890 versus 0 in terms of significant outcomes). By contrast, 30% of the
country groupings in the
wealthiest range exhibit income
convergence, 20% significantly
so. The greatest likelihood of
finding convergence however,
is not among the wealthiest
countries, but among the
world’s poorest countries.
About half of the groups have
negative trend coefficients
and two-thirds of these are
4 For the remainder of the paper, Venezuela is excluded from the data.
5 In a range withn countries, it is possible to draw a maximum ofn!/(k!(n-k)!) different groups withk members.In other words, out of each range with 14 countries, 3003 groups with six countries can be drawn, 3432 with seven,etc.
11

significantly negative.Table 2
Distribution of Trend Coefficients(All 3003 Possible Groups of 6 Per Range of 14 Countries)
Sign of TrendCoefficients
Sign of Significant*
Trend Coefficients
Negative Positive Negative Positive
Total 3003 3003
12345678
8871050
110
1624
21163002300329983003299230031379
616000000
1021
1757297630022964300229572989839
In Percent
12345678
30%0%0%0%0%0%0%
54%
70%100%100%100%100%100%100%46%
21%0%0%0%0%0%0%
34%
59%99%
100%100%100%98%
100%28%
* significant at the 10% level.
Note that convergence
among the wealthy and divergence
among the middle-income
countries does not necessarily
imply that the middle income
countries are converging towards
the top. This would depend on
how the growth rates of the middle
income countries compare to the
growth rates of the richest
countries. With the exception of
fast growing Japan, Singapore and
Hong Kong in the third range of
countries (29-42), and Malaysia
from the fourth range (43-56), the
average growth rates of the top 4
ranges are roughly the same,
indicating no overall convergence trend towards the top. The bottom four ranges have decreasing
average growth rates from the 5th range (57-70) to the 8th range (99-112).
Although not shown here, altering the size of the groups does not change the conclusion
that most countries in the six intermediate ranges are diverging. Whereas this example was
performed on eight ranges with fourteen countries in each, the results are robust for other
partitions of the world as well. Most of the convergence appears to be concentrated among the
wealthiest countries and, in particular, among the poorest.
While there appears to be a clustering of convergence clubs at the two ends of the income
spectrum, the two types of groups exhibit quite different convergence characteristics. The
12

distinction between the upward convergence exhibited by the top groups, and the downward
convergence displayed by the bottom groups can be seen by comparing the average growth rates
of the countries in each of the ranges. The 7 countries comprising the upper half of the top range
grew at an average rate of 2.30 percent between 1960 and 1985. This compares with an average
growth rate of -0.04 percent for the top 7 countries of the bottom range.
IV . CONCLUSION
The primary purpose of this paper is to establish a stylized fact regarding the issue of
income convergence across countries. One of the main findings is that income gaps have
increased within most possible groupings of countries in the world. Where "convergence clubs"
tend to be more prevalent is at the two ends of the income spectrum.
Convergence among the wealthiest countries, which has received the most attention in the
literature, is indeed more prevalent than it is within all of the intermediate income ranges, but
it is still non-existent in the majority of possible country groupings. But the highest incidence
of convergence is not among the wealthier countries, it is among the world’s poorest countries.
This is not to say that the middle of the income spectrum is emptying out towards its two
ends it is not, as noted in the previous section. Instead, what appears to be occurring is a
widening of the overall income spectrum. At its very top, there is some evidence of
convergence. When this occurs, it tends to be a result of catching-up by some, though not all,
of the relatively wealthy countries. At the bottom of the income spectrum, there is evidence of
stagnancy and even negative growth which results in a higher incidence of convergence among
the very poorest countries.
What might be some possible explanations for the existence of convergence among the
poorest countries? Endogenous growth models (see for example: Azariadis and Drazen, 1990;
Becker, Murphy and Tamura, 1990; and Rebelo, 1992) have tended to focus on the contribution
of human capital to the growth process with countries that invest too little in the accumulation
13

of human capital being drawn into a poverty trap.6
But, as Solow (1956) showed in his classic paper, if the savings rate (s) is an increasing
function of the capital-labor ratio (k), with s < 0 for very smallk’s, then two steady states are
possible in the exogenous growth model as well. In an attempt at explaining the existence of the
poorer convergence clubs found here, Ben-David (1997) modifies the neoclassical growth model
by focusing on how living standards bordering subsistence in the very poorest countries can lead
to convergence among them. Using Stigler’s (1945) estimation of the least-cost subsistence diet,
as well as figures from the World Bank and the U.N., the paper provides evidence that the
concept of subsistence consumption may be quite an appropriate assumption to make for
countries belonging to the poorer convergence club. Furthermore, investment rates for each of
the 8 ranges of 14 countries are shown to be positively related to income levels. Hence, it is not
inconceivable thatnet savings rates in the poorest countries may in fact have been negative.
As noted above, while there is evidence that many countries are converging at the top end
of the income spectrum, this is far from a robust result that can be attributed to all developed
countries, or even to the majority of them. Is there a common element that can be found within
those groups of developed countries that converged which is not evident in those groups that did
not converge? Ben-David (1996) focuses on the contribution of international trade to the
convergence process, using bilateral trade statistics to create groups of major trade partners.
Nearly every one of the trade-based groups exhibits convergence in contrast with random
groupings (of the same countries that make up the trade groups) which do not exhibit any
propensity at all towards convergence. In other words, grouping the wealthier countries on the
basis of trade instead of on a random basis tends to provide a considerable boost to the incidence
of convergence findings.
6 Additional work on convergence-divergence outcomes may be found in Brezis, Krugman, and Tsiddon (1993) andGoodfriend and McDermott (1994). Galor (1996) discusses and compares some of the competing convergencehypotheses.
14

REFERENCES
Azariadis, Costas and Alan Drazen (1990), "Threshold Externalities in Economic Development,"Quarterly Journal of Economics, 105, 501-526.
Barro, Robert J. (1991), "Economic Growth in a Cross-Section of Countries,"Quarterly Journalof Economics, 106, 407-443.
Barro, Robert J. and Xavier Sala-i-Martin (1991), "Convergence Across States and Regions,"Brookings Papers on Economic Activity, 107-82.
Baumol, William J. (1986), "Productivity Growth, Convergence, and Welfare: What the Long-Run Data Show,"American Economic Review, 76, 1072-85.
Baumol, William J. and Edward N. Wolff (December 1988), "Productivity Growth, Convergence,and Welfare: Reply,"American Economic Review, 78, 1155-59.
Baumol, William J., Sue Ann B. Blackman and Edward N. Wolff (1989),Productivity andAmerican Leadership: The Long View, Cambridge, MA: MIT Press.
Becker, Gary S., Kevin M. Murphy, and Robert R. Tamura (1990), "Human Capital, Fertility,and Economic Growth,"Journal of Political Economy, 98, S12-S37.
Ben-David, Dan (1994), "Income Disparity Among Countries and the Effects of Freer Trade,"Economic Growth and the Structure of Long Run Development, in Luigi L. Pasinetti andRobert M. Solow (eds), London: Macmillan, 45-64.
Ben-David, Dan (1996), "Trade and Convergence Among Countries,"Journal of InternationalEconomics, 40, 279-298.
Ben-David, Dan (1997), "Convergence Clubs and Subsistence Economies," forthcomingJournalof Development Economics.
Bernard, Andrew B. and Steven N. Durlauf (1996), "Interpreting Tests of the ConvergenceHypothesis,"Journal of Econometrics, 71, 161-73.
Blomström, Magnus, Robert E. Lipsey, and Mario Zejan (1992), "What Explains DevelopingCountry Growth?," NBER working paper 4132.
Brezis, Elise S., Paul R. Krugman, and Daniel Tsiddon (1993), "Leapfrogging in InternationalCompetition: A Theory of Cycles in Technological Leadership,"American EconomicReview, 83, 1211-19.
i

Chenery, Hollis and Moshe Syrquin (1986), "Typical Patterns of Transformation," in HollisChenery, Sherman Robinson and Moshe Syrquin, eds.,Industrialization and Growth: AComparative Study, Oxford: Oxford University Press.
De Long, J. Bradford (1988), "Productivity Growth, Convergence, and Welfare: Comment,"American Economic Review, 78, 1138-54.
Friedman, Milton (1992), "Do Old Fallacies Ever Die?"Journal of Economic Literature, 30,2129-2132.
Galor, Oded (1996), "Convergence? Inferences from Theoretical Models,"The Economic Journal,106, 1056-69.
Goodfriend, Marvin and John McDermott (1994), "A Theory of Convergence, Divergence, andOvertaking," unpublished working paper.
Hotelling, Harold (1933), "Review ofThe Triumph of Mediocrity in Business, by Horace Secrist,"Journal of the American Statistical Association, 28(184), 463-65.
Kristensen, Thorkil (1982),Development in Rich and Poor Countries, New York: Praeger.
Levine, Ross and David Renelt (1992), "A Sensitivity Analysis of Cross-Country GrowthRegressions,"American Economic Review, 82, 942-63.
Lucas, Robert E. Jr. (1988), "On the Mechanics of Economic Development,"Journal ofMonetary Economics, 22, 3-42.
Mankiw, N. Gregory, David Romer and David N. Weil (1992), "A Contribution to the Empiricsof Economic Growth,"Quarterly Journal of Economics, 107.
Quah, Danny T. (1993a), "Galton’s Fallacy and Tests of the Convergence Hypothesis,"Scandinavian Journal of Economics, 95, 427-443.
Quah, Danny T. (1993b), "Empirical Cross-Section Dynamics in Economic Growth,"EuropeanEconomic Review, 37, 426-434.
Rebelo, Sergio (1992), "Growth in Open Economies,"Carnegie-Rochester Conference Series onPublic Policy, 36, 5-46.
Romer, Paul M. (1986), "Increasing Returns and Long Run Growth,"Journal of PoliticalEconomy, 94, 1002-38.
Romer, Paul M. (1987), "Crazy Explanations for the Productivity Slowdown," NBERMacroeconomics Annual, 163-210.
ii

Romer, Paul M. (1989), "Capital Accumulation in the Theory of Long Run Growth," in RobertBarro (ed.),Modern Business Cycle Theory, Cambridge: Harvard University Press.
Rostow, Walt W. (1980),Why the Poor Get Richer and the Rich Slow Down, Austin, TX:University of Texas Press.
Solow, Robert M. (1956), "A Contribution to the Theory of Economic Growth,"QuarterlyJournal of Economics, 70, Reprinted in Joseph E. Stiglitz and Hirofumi Uzawa (eds),Readings in the Modern Theory of Economic Growth, Cambridge: MIT Press, 58-87.
Stigler, George S. (1945), "The Cost of Subsistence,"Journal of Farm Economics, 27, 303-314.
Summers, Robert and Alan Heston (1988), "A New Set of International Comparisons of RealProduct and Price Levels Estimates for 130 Countries, 1950-1985,"Review of Income andWealth, 34, 1-25.
iii