Embed Size (px)
DESCRIPTION
Annual Report
Citation preview

For the year ended 31 March 2013
Anchor Trust
Annual Report & Financial Statements
Happy living for the years ahead

2Annual Report and Financial Statements

3For the year ended 31 March 2013
Contents4 Chairman’s and Chief Executive’s Statements
6 Operating and Financial Review
16 Corporate Governance Report
24 Board, Directors and Advisers
25 Directors’ Report
27 Independent Auditor’s Report
28 Consolidated Income and Expenditure Account
29 Consolidated Balance Sheet
30 Company Balance Sheet
31 Consolidated Cash Flow Statement
32 Notes to the Financial Statements
54 The Board
56 Executive Management Board
4Annual Report and Financial Statements
Chairman’s Statement
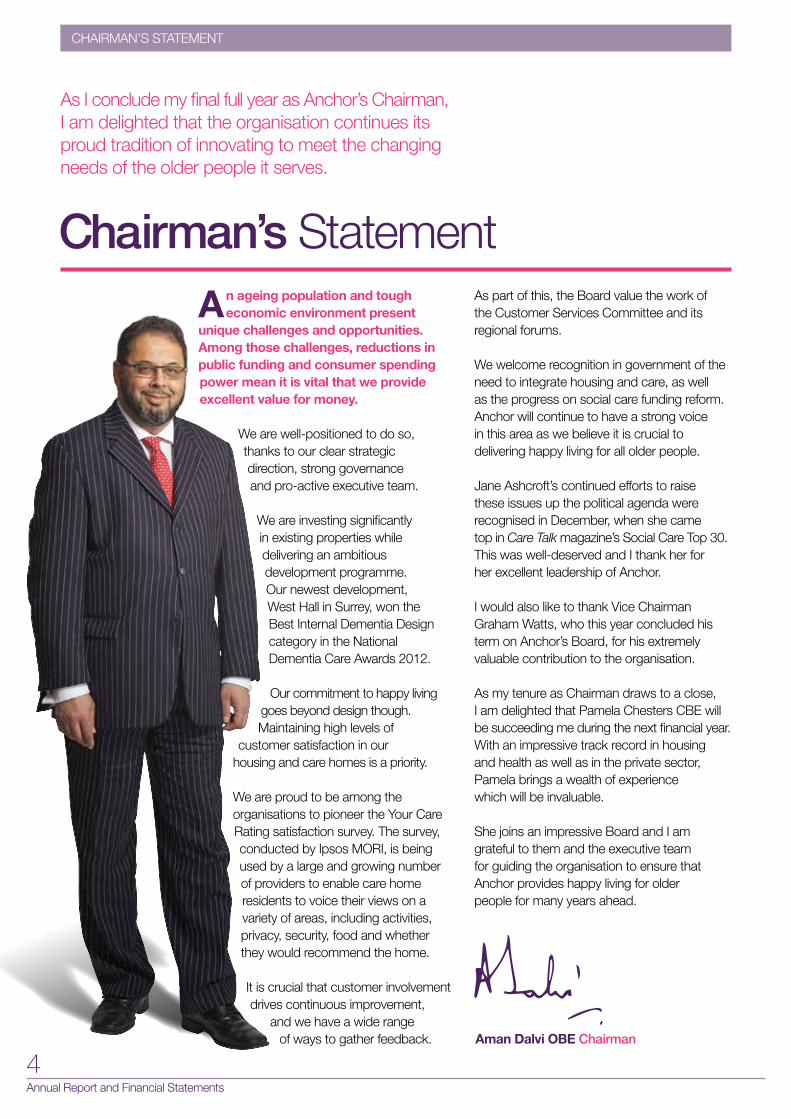
As I conclude my final full year as Anchor’s Chairman, I am delighted that the organisation continues its proud tradition of innovating to meet the changing needs of the older people it serves.
An ageing population and tough economic environment present
unique challenges and opportunities. Among those challenges, reductions in public funding and consumer spending power mean it is vital that we provide excellent value for money.
We are well-positioned to do so, thanks to our clear strategic direction, strong governance and pro-active executive team.
We are investing significantly in existing properties while delivering an ambitious development programme. Our newest development, West Hall in Surrey, won the Best Internal Dementia Design category in the National Dementia Care Awards 2012.
Our commitment to happy living goes beyond design though. Maintaining high levels of
customer satisfaction in our housing and care homes is a priority.
We are proud to be among the organisations to pioneer the Your Care Rating satisfaction survey. The survey, conducted by Ipsos MORI, is being used by a large and growing number of providers to enable care home residents to voice their views on a variety of areas, including activities, privacy, security, food and whether they would recommend the home.
It is crucial that customer involvement drives continuous improvement,
and we have a wide range of ways to gather feedback.
As part of this, the Board value the work of the Customer Services Committee and its regional forums.
We welcome recognition in government of the need to integrate housing and care, as well as the progress on social care funding reform. Anchor will continue to have a strong voice in this area as we believe it is crucial to delivering happy living for all older people.
Jane Ashcroft’s continued efforts to raise these issues up the political agenda were recognised in December, when she came top in Care Talk magazine’s Social Care Top 30. This was well-deserved and I thank her for her excellent leadership of Anchor.
I would also like to thank Vice Chairman Graham Watts, who this year concluded his term on Anchor’s Board, for his extremely valuable contribution to the organisation.
As my tenure as Chairman draws to a close, I am delighted that Pamela Chesters CBE will be succeeding me during the next financial year. With an impressive track record in housing and health as well as in the private sector, Pamela brings a wealth of experience which will be invaluable.
She joins an impressive Board and I am grateful to them and the executive team for guiding the organisation to ensure that Anchor provides happy living for older people for many years ahead.
CHAIRMAN’S STATEMENT
Aman Dalvi OBE Chairman

5For the year ended 31 March 2013
Chief Executive’s Statement
A strong demand for great housing and care coupled with tighter funding underpin our focus on quality value-for-money services.
Our ‘One Anchor’ approach is providing better integrated
services for our customers and clearer career paths for colleagues.
Our customers tell us they value the great support and service provided by Anchor people. Maintaining and improving that service, from an initial enquiry through the many years of our relationship with customers, is a priority.
We have invested in our colleagues through a reward plan which includes a commitment to move to the ‘living wage’, with strong progress made to date. And our ‘Your Say’ survey indicates colleagues feel they are benefiting from better learning and development opportunities. The achievement of a wide range of national awards, including an MBE for Customer Engagement Advisor Debbie Sharples, has been an excellent endorsement of this approach.
We are committed to openness and transparency, as has been evident in our work with our Customer Services Committee and Colleague Forum, just two of the many ways in which we listen to the views and advice of all customers and colleagues. Working with key stakeholders at a local and regional level ensures our services provide the best outcomes for everyone. The impact of loneliness on some older people has been identified nationally as a major issue, and I am proud that many people choose to live with Anchor because of the strong communities which my colleagues across England work so hard to support.
This approach has contributed to our strong performance on occupancy, quality of service, customer satisfaction and colleague engagement. It has also reinforced our commitment to maintaining
our scheme manager service, which we know is valued by housing customers and their families.
In these times of significant change, it is important that we focus on identifying and managing risk. This has been a priority for the executive team, with effective support and oversight from the Audit & Risk Committee members.
The hard work of all of my colleagues has contributed to a financial surplus which we are able to reinvest in our services for the benefit of existing and potential customers. Our five-year investment plan will ensure that our properties continue to be great places to live, and our plans for new services are continuing well, with further care villages and care homes in development and due to open in 2014.
We have been pleased to act with colleagues across the sector to improve the lives of older people, for example as members of the Care & Support Alliance, and to champion the development of new models as founder members of the Associated Retirement Community Operators (ARCO). We continue to meet the changing requirements of our current customers and, crucially, anticipate those of the older people of tomorrow.
Finally, I would like to take this opportunity to thank Aman for his contribution during his time on the Board and as Chairman of Anchor.
Jane Ashcroft Chief Executive
CHIEF ExECuTIVE’S STATEMENT
6Annual Report and Financial Statements
OpeRAting And FinAnciAl Review
Operating and Financial Review
Overview of the business
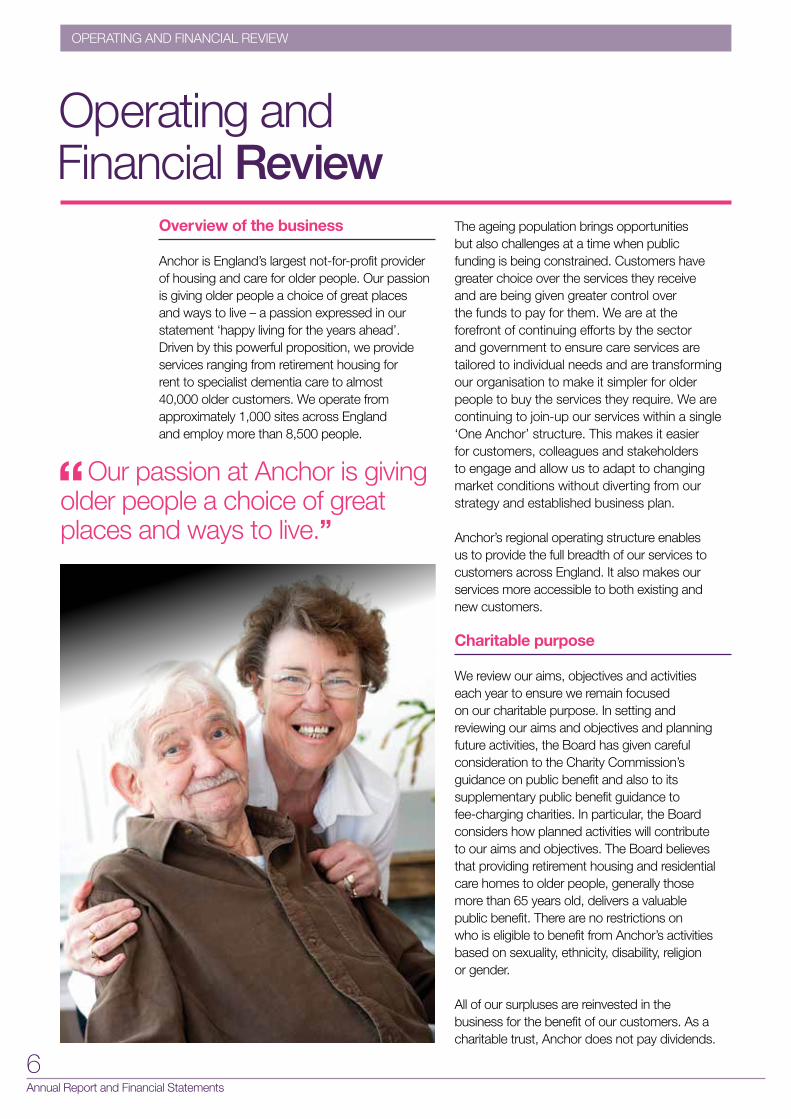
Anchor is England’s largest not-for-profit provider of housing and care for older people. Our passion is giving older people a choice of great places and ways to live – a passion expressed in our statement ‘happy living for the years ahead’. Driven by this powerful proposition, we provide services ranging from retirement housing for rent to specialist dementia care to almost 40,000 older customers. We operate from approximately 1,000 sites across England and employ more than 8,500 people.
The ageing population brings opportunities but also challenges at a time when public funding is being constrained. Customers have greater choice over the services they receive and are being given greater control over the funds to pay for them. We are at the forefront of continuing efforts by the sector and government to ensure care services are tailored to individual needs and are transforming our organisation to make it simpler for older people to buy the services they require. We are continuing to join-up our services within a single ‘One Anchor’ structure. This makes it easier for customers, colleagues and stakeholders to engage and allow us to adapt to changing market conditions without diverting from our strategy and established business plan.
Anchor’s regional operating structure enables us to provide the full breadth of our services to customers across England. It also makes our services more accessible to both existing and new customers.
Charitable purpose
We review our aims, objectives and activities each year to ensure we remain focused on our charitable purpose. In setting and reviewing our aims and objectives and planning future activities, the Board has given careful consideration to the Charity Commission’s guidance on public benefit and also to its supplementary public benefit guidance to fee-charging charities. In particular, the Board considers how planned activities will contribute to our aims and objectives. The Board believes that providing retirement housing and residential care homes to older people, generally those more than 65 years old, delivers a valuable public benefit. There are no restrictions on who is eligible to benefit from Anchor’s activities based on sexuality, ethnicity, disability, religion or gender.
All of our surpluses are reinvested in the business for the benefit of our customers. As a charitable trust, Anchor does not pay dividends.
Our passion at Anchor is giving older people a choice of great places and ways to live.”

7For the year ended 31 March 2013
Operating and Financial review
We provide properties to rent at almost 700 locations and our leasehold property management activity provides services to leaseholders at 225 estates.”
Retirement housing
More than 30,000 people live in retirement housing owned or managed by Anchor. We provide properties to rent at almost 700 locations and our leasehold property management activity provides services to leaseholders at 225 estates. Anchor also provides extra-care services in a small number of locations. We have exciting plans to develop retirement villages and continue to develop additional retirement housing with on-site care, support and amenities available.
Residential care homes
Anchor is one of the largest not-for-profit providers of residential care homes in England and is increasingly developing specialist services for those customers living with dementia. Our 96 care homes have more than 4,300 rooms and provide residential, dementia and nursing care. West Hall, a 117-room care home in Surrey, was opened in July 2012 and we plan to build and open other care homes in future years.
Anchor’s business aims, objectives and strategy
Our passion at Anchor is giving older people a choice of great places and ways to live. We do this by treating our customers and our colleagues as individuals and by building meaningful, long-term relationships based on happiness, openness and respect.
We are three years through our five-year business plan, which extends to 2015 and supports an ambitious business development strategy at a time when there are unprecedented levels of economic, social and regulatory change. These changes are having a major impact on the lives of older people, the framework in which we operate, and on our competitors. We will continue to focus on services where we are or can be the market leader, which play to our core strengths and values, and in which we can be financially successful.
Growth will be achieved by meeting the following objectives:• Focusing on serving the needs of older people
– a rapidly increasing group spanning several generations as people live longer and have increasingly complex needs.
• Continuously improving our affordable housing offer.
• Building new models of housing for sale and market rent to deliver significant turnover.
• Achieving significant reductions in the cost of delivery.
• Becoming an employer of choice.
• Becoming synonymous with happy colleagues and happy customers.
Through meeting our objectives we will continue to deliver a significant public benefit.
The focus in the first three years of the business plan was to develop value for money services and improve processes to enable colleagues to focus on individual relationships. We also embedded the regional structure for our operational teams, which means we have better utilised local knowledge to make Anchor’s full range of services accessible to all customers. In previous years we exited from other businesses so we could focus all our efforts on providing housing for rent and sale, and an on-site care service to our customers at Anchor properties and residential care homes.
The year’s achievements included:• Ensuring our customers enjoyed a consistent
high standard of service. This included introducing a clearer property standard, so that customers know what to expect from an Anchor property.
• The opening of West Hall on 24 July 2012.
• The improvement of our website so that it is easier for customers and their families to use.
• The introduction of a ‘Manager Direct’ helpline, so Anchor colleagues can access the assistance they require – avoiding the cost of colleagues travelling to locations to assist.
8Annual Report and Financial Statements
OpeRAting And FinAnciAl Review
• Workshops for our colleagues on ‘The Anchor Way’, to help colleagues understand how they can contribute to the success of the business.
• The implementation of changes to reduce internal paperwork, including making customer care plans easier and quicker to complete.
• The removal of inefficiencies across a number of support activities and reorganisation of functions so decisions can be made quickly, with fewer managerial layers, and in so reducing the cost of delivery, providing more cost-effective services to our customers.
The focus for the next two years is to continue to provide the new and more cost effective services that our customers demand and ensure a highly engaged workforce.
Anchor’s principal risks
The key external risks that influence and could impact adversely on the operational and financial performance of Anchor are:
• Reduced public expenditureFunds available to local authorities for the provision of social care will continue to be reduced. Pressures from government to seek greater value for money and reduce
expenditure on all services will require Anchor to work more closely with local authorities and seek efficiencies across our operations.
• Performance of the housing marketOur business plan assumes that we will generate surpluses from future sales of our leasehold housing developments which will be used to reinvest in developments and services. The proceeds from future sales are sensitive to housing capacity and the economic environment.
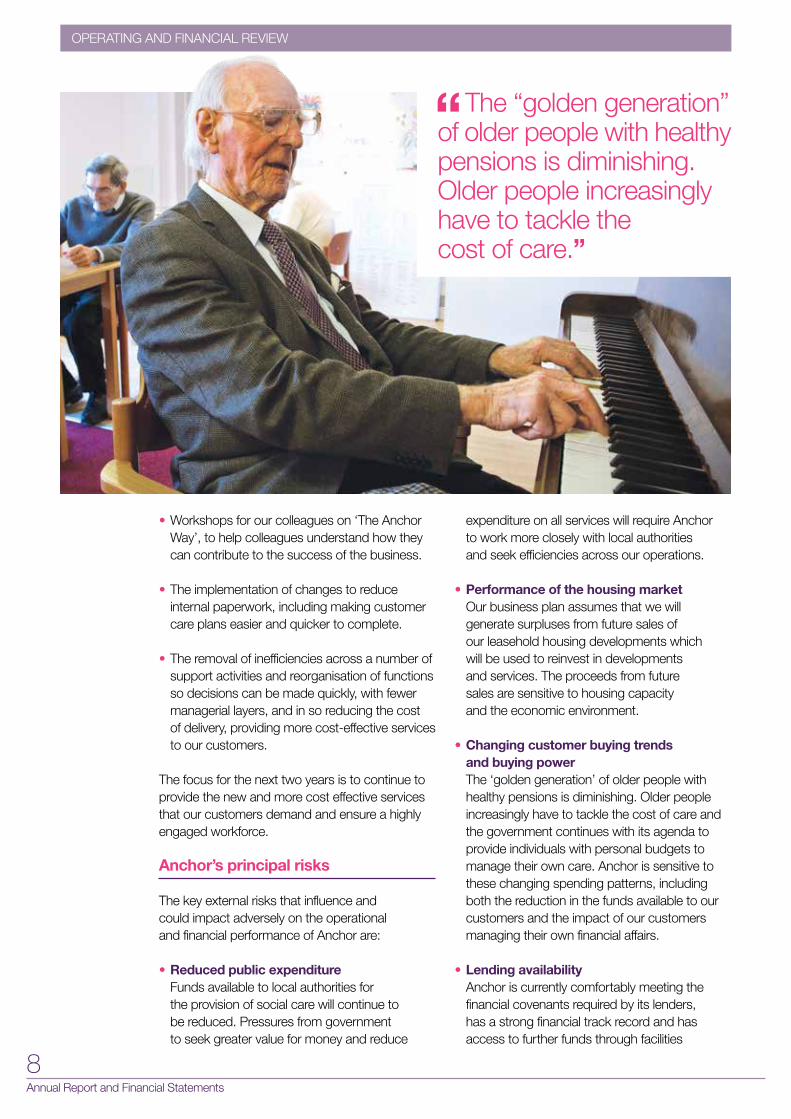
• Changing customer buying trends and buying powerThe ‘golden generation’ of older people with healthy pensions is diminishing. Older people increasingly have to tackle the cost of care and the government continues with its agenda to provide individuals with personal budgets to manage their own care. Anchor is sensitive to these changing spending patterns, including both the reduction in the funds available to our customers and the impact of our customers managing their own financial affairs.
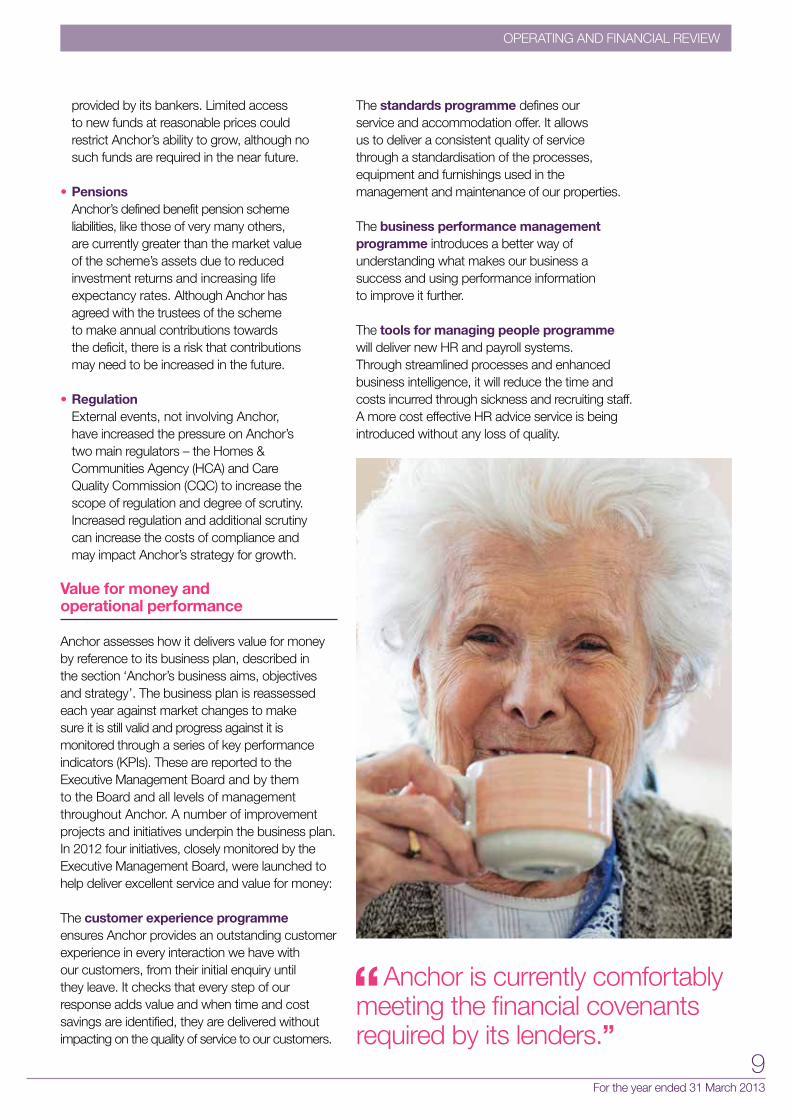
• Lending availabilityAnchor is currently comfortably meeting the financial covenants required by its lenders, has a strong financial track record and has access to further funds through facilities
The “golden generation” of older people with healthy pensions is diminishing. Older people increasingly have to tackle the cost of care.”
9For the year ended 31 March 2013
Operating and Financial review
The standards programme defines our service and accommodation offer. It allows us to deliver a consistent quality of service through a standardisation of the processes, equipment and furnishings used in the management and maintenance of our properties.
The business performance management programme introduces a better way of understanding what makes our business a success and using performance information to improve it further.
The tools for managing people programme will deliver new HR and payroll systems. Through streamlined processes and enhanced business intelligence, it will reduce the time and costs incurred through sickness and recruiting staff. A more cost effective HR advice service is being introduced without any loss of quality.
provided by its bankers. Limited access to new funds at reasonable prices could restrict Anchor’s ability to grow, although no such funds are required in the near future.
• Pensions Anchor’s defined benefit pension scheme liabilities, like those of very many others, are currently greater than the market value of the scheme’s assets due to reduced investment returns and increasing life expectancy rates. Although Anchor has agreed with the trustees of the scheme to make annual contributions towards the deficit, there is a risk that contributions may need to be increased in the future.
• RegulationExternal events, not involving Anchor, have increased the pressure on Anchor’s two main regulators – the Homes & Communities Agency (HCA) and Care Quality Commission (CQC) to increase the scope of regulation and degree of scrutiny. Increased regulation and additional scrutiny can increase the costs of compliance and may impact Anchor’s strategy for growth.
Value for money and operational performance
Anchor assesses how it delivers value for money by reference to its business plan, described in the section ‘Anchor’s business aims, objectives and strategy’. The business plan is reassessed each year against market changes to make sure it is still valid and progress against it is monitored through a series of key performance indicators (KPIs). These are reported to the Executive Management Board and by them to the Board and all levels of management throughout Anchor. A number of improvement projects and initiatives underpin the business plan. In 2012 four initiatives, closely monitored by the Executive Management Board, were launched to help deliver excellent service and value for money:
The customer experience programme ensures Anchor provides an outstanding customer experience in every interaction we have with our customers, from their initial enquiry until they leave. It checks that every step of our response adds value and when time and cost savings are identified, they are delivered without impacting on the quality of service to our customers.
Anchor is currently comfortably meeting the financial covenants required by its lenders.”

10Annual Report and Financial Statements
OpeRAting And FinAnciAl Review
How the Executive Management Board monitors value for money
The following key performance indicators are monitored by the Executive Management Board and reported by them to the Board on a monthly basis to confirm we are meeting our business plan objectives.
How we assess customer valueWe continually assess the value and quality of the services provided to customers. Information from annual and quarterly customer satisfaction surveys, supported by mystery shopping exercises, is used to identify and deliver service improvements and to monitor the value customers place on our services.
Formal meetings regarding the quality and cost of services are held with customers at every rented housing location twice a year. Standards of service delivery to be met at each location are reviewed with customers and published every year.
A performance report developed with our Customer Services Committee (CSC) enables customers to monitor services that are important to them. A customer scrutiny panel enables the CSC to commission further research into the value, effectiveness and cost we incur in providing services to them.
Property and returns on assetsAnchor’s property team is undergoing a structural review with the twin aims of improving customer engagement and delivering improved value for money. Progress to date includes the centralisation of ordering and the classification of repairs. This has saved £1.5m compared to
2013 Actual 2013 Target
Customer value
Customers satisfied with Anchor 92.0% 90.0%
Customer complaints resolved within 14 days 97.1% 92.0%
Property and returns on assets
Planned works programme delivery 86.0% 85.0%
Reactive repairs completed on time 97.3% 97.0%
Disposals programme on schedule 82.4% 100%
Efficiency or cost reduction
Housing re-let days 43 days 30 days
Occupancy of care homes 92.2% 93.8%
Compliance
Gas safety checks 100% 100%
CQC compliance 87.3% 100%
People
Colleague engagement (staff survey) 72.0% 74.0%
Sickness absence 3.8% 3.0%
11For the year ended 31 March 2013
Operating and Financial review
the costs incurred in 2011/12. Current initiatives include collaborative working with responsive repairs contractors to achieve cost savings via bulk purchasing and product sourcing.
Last year our approach to tendering contributed to an overall saving of 7% against our planned works budget.
The Net Present Value (NPV) of all of our locations is kept under constant review as part of our asset management strategy. Locations where the NPV and marketability are unfavourable are subject to a long-term viability check including a full option assessment. If we cannot deliver a turnaround plan, the location will be earmarked for disposal. In just over two years we saved £0.3m on security on empty locations awaiting disposal by moving from a visiting patrol to a live-in security system.
Efficiency and cost reductionThe procurement team is aligned to all key organisational initiatives, with the team’s performance being partly monitored through savings made from the renewal of significant contracts. Renegotiated rates are fed into the annual budget planning process. In 2012/13 the team delivered savings, against budgeted rates, of £1.1m.
The team operates a category management approach enabling the aggregation of supply and spend information, the establishment of market expertise and the monitoring of innovations and best practice in those markets. The planned extension of our e-Procurement usage will bring further efficiencies.
We monitor fundamentals and prices in the energy market daily to enable purchasing at optimum prices. This helped us win Energy Buyer of the Year at the 2012 Energy Awards. We have calculated that the cost of our gas and electricity usage is £7m lower when compared to the lowest average domestic tariff rate published by the government.
We have a programme of installing remote boiler controls into our locations. Since 2003, 410 locations have been fitted with such equipment. On average, these controls save 15% on gas energy costs. All remaining locations that are suitable for them will have these controls fitted by 2018.
Empty properties directly affect receivable income. Our focus on driving up our occupancy rate
resulted in 466 voids in March 2013, half the 933 voids recorded in April 2010.
New operating models in our Customer Centre have increased the level of customer contact while reducing costs.
Peopleunder the direction of our People Strategy we are delivering value for money through our workforce. We have reviewed the majority of non-customer facing functions to reduce complexity and duplication, clarify accountability and to streamline and speed up decision-making. Cost savings from this exercise have been reinvested into frontline pay and supporting the up-skilling of our managers, through our Leaders’ Academy.
Financial results for the year
Anchor’s financial performance for the year was encouraging.
• Operating performance in retirement housing once again benefited from a programme to fill empty properties, and a combination of the annual rent uplift and reduction in costs.
• The operating surplus from housing remained strong, with the £1.0m decrease year-on-year reflecting the closure of 14 housing schemes in the year.
• The trading environment for residential care homes continues to be tough. Considerable efforts to control costs have been successful, but have been partly offset by set-up costs incurred for West Hall.
• All but a few properties were sold at Denham Garden Village and The Laureates.

12Annual Report and Financial Statements
OpeRAting And FinAnciAl Review
* In 2012, turnover and operating deficit relating to discontinued operations were £3.7m and £(0.1m) respectively and related to the home care service.
Turnover – continuing operationsIn the year to 31 March 2013, turnover from continuing operations was £264.9m (2012: £263.8m). The main area of focus for the business continued to be retirement housing lettings of £128.6m (2012: £124.3m) and residential care homes of £119.2m (2012: £117.4m). Turnover from providing on-site care at Anchor locations was £5.4m (2012: £5.6m).
Non-social housing turnover includes leasehold management, £3.2m (2012: £3.2m) and property sales at Anchor’s two mixed tenure retirement developments. In total, 13 properties at Denham Garden Village and seven at The Laureates were sold, generating total sales of £6.0m (2012: £10.8m). Turnover from other activities was £2.6m (2012: £2.5m).
Operating surplus – continuing operationsAnchor’s surplus from continuing operations was £18.1m (2012: £25.5m).
Retirement housing surplus decreased by £1.0m to £26.3m (2012: £27.3m) due primarily to the closure of 14 schemes during the year, combined with a switch in expenditure on major works away from capital works. Residential care homes operating surplus at £1.6m, decreased
from last year (2012: £2.1m) due largely to set-up costs incurred for West Hall.
Expenditure on major works to our properties was £42.4m (2012: £41.9m). The Income and Expenditure Account incurred a higher charge than the previous year of £11.8m (2012: £9.8m) and conversely a lower cost was capitalised of £30.6m (2012: £32.1m). This mix away from capital works contributed towards the decrease in the retirement housing surplus for this financial year.
Property sales at Denham Garden Village and The Laureates contributed a surplus of £2.6m (2012: £4.6m).
The decision was taken to sell or transfer 14 retirement housing schemes during the year (2012: 10). The costs of disposal were £3.9m less than 2012.
In both 2013 and 2012, the exceptional credit arose from the release of unutilised provisions relating to the separation costs for Anchor Staying Put.
Interest receivable of £3.4m (2012: £2.9m) was £0.5m higher than last year, mainly due to £0.4m increased exchange rate gains.
Interest payable for the year decreased to £7.9m (2012: £10.6m), mainly due to finance lease interest payments decreasing by £2.8m.
Year to 31 March
2013 All continuing
£m
2012* Total
£m
2011 Total
£m
2010 Total
£m
2009 Total
£m
Turnover 264.9 267.5 280.8 286.5 267.0
Operating surplus before exceptional items 18.1 25.4 19.4 21.0 5.7
Surplus/(deficit) for the year 21.8 22.2 10.3 7.8 (13.2)
Financial review
A summary of Anchor’s financial results over the past five years is set out below:

13For the year ended 31 March 2013
Operating and Financial review
Balance sheet performance
A summary of Anchor’s balance sheet over the past five years is set out below:
At 31 March
2013 £m
2012 £m
2011 £m
2010 £m
2009 £m
Goodwill 0.1 0.2 0.2 0.4 1.0
Housing properties at cost less depreciation 887.7 891.2 888.0 897.0 899.9
Social Housing Grant (520.2) (525.0) (543.8) (550.5) (553.2)
Other capital grants (44.6) (47.7) (53.0) (54.3) (54.5)
Housing properties – net book value 322.9 318.5 291.2 292.2 292.2
Other tangible fixed assets 2.6 1.7 4.4 5.3 5.4
Investments 3.4 2.9 2.7 1.9 2.1
Net current assets 92.9 81.4 64.9 52.0 42.0
Total assets less current liabilities 421.9 404.6 363.4 351.8 342.7
Cash and short term deposits increased to £93.6m (2012: £82.7m), mainly due to the timing of new development expenditure.
The disposal of housing schemes resulted in the attributable Social Housing Grant moving into the total Recycled Capital Grant Fund, increasing the fund’s balance to £10.3m (2012: £7.0m), shown in note 21 of the Financial Statements.
At 31 March 2013, Anchor’s total assets increased to £421.9m (2012: £404.6m), of which £238.2m was represented by accumulated Income and Expenditure Reserve (2012: £223.9m). The Income and Expenditure Reserve increased by £21.8m from the surplus generated during the year and reduced by £7.5m from an actuarial loss following the annual valuation (performed in accordance with Financial Reporting Standard 17) of Anchor’s defined benefit pension scheme.
Continuing investment in our housing properties and construction of new care homes and other developments resulted in the net book value of housing properties increasing to £322.9m (2012: £318.5m).
Within net current assets, Anchor’s stock of housing for sale analysed in note 16 of the Financial Statements, reduced to £2.6m (2012: £5.7m). This includes four remaining properties held for sale at The Laureates, and ten properties at Denham Garden Village currently let out at market rents.
14Annual Report and Financial Statements
OpeRAting And FinAnciAl Review
Cash flow
The net movement in operating cash flow for the year was an inflow of £41.8m (2012: £49.6m).
As shown in note 29.1 of the Financial Statements, this cash flow was generated from an operating surplus of £18.1m (2012: £25.8m) and, after allowing for depreciation and other non-cash expenditure, was reduced by a £4.6m (2012: £5.0m) payment towards Anchor’s pension scheme deficit and increased working capital.
As shown in note 29.4 of the Financial Statements, £42.7m (2012: £61.5m) of cash was used to develop housing properties, a decrease of £18.8m. Housing fixed assets disposal proceeds were £18.4m (2012: £14.9m).
Cash at bank was £66.2m (2012: £30.5m), a net increase in cash of £35.7m (2012: £19.5m). In line with Treasury Policy, £24.8m was transferred out of short-term deposits into instant access accounts.
Investment in new developments
At 31 March 2013, development costs of £11.1m (2012: £27.1m) were added to fixed assets – housing properties under construction.
Programmes commenced to build a retirement village in Bishopstoke, Hampshire. The village will have a 48-bed care home and 209 housing units for sale. Anchor will take over the lease at a residential care home in Esher, Surrey once the building work has been completed. West Hall in West Byfleet, Surrey, Anchor’s largest care home development, comprising 117 rooms, opened in July 2012.
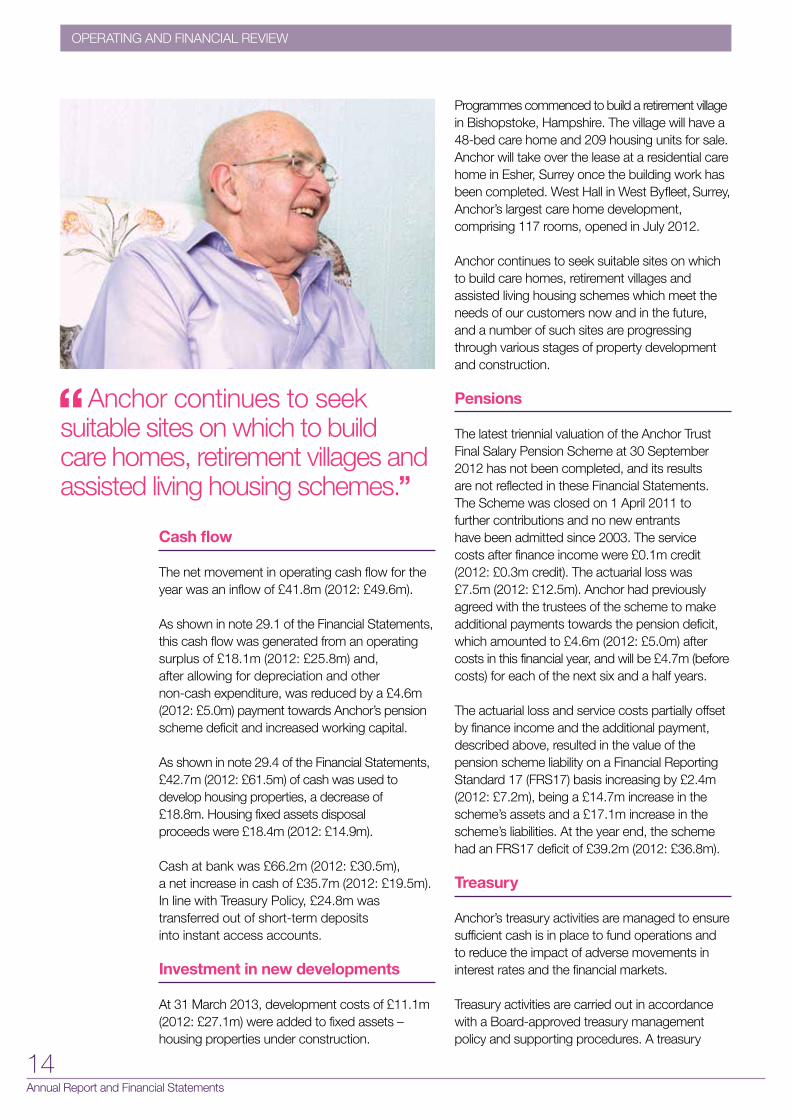
Anchor continues to seek suitable sites on which to build care homes, retirement villages and assisted living housing schemes which meet the needs of our customers now and in the future, and a number of such sites are progressing through various stages of property development and construction.
Pensions
The latest triennial valuation of the Anchor Trust Final Salary Pension Scheme at 30 September 2012 has not been completed, and its results are not reflected in these Financial Statements. The Scheme was closed on 1 April 2011 to further contributions and no new entrants have been admitted since 2003. The service costs after finance income were £0.1m credit (2012: £0.3m credit). The actuarial loss was £7.5m (2012: £12.5m). Anchor had previously agreed with the trustees of the scheme to make additional payments towards the pension deficit, which amounted to £4.6m (2012: £5.0m) after costs in this financial year, and will be £4.7m (before costs) for each of the next six and a half years.
The actuarial loss and service costs partially offset by finance income and the additional payment, described above, resulted in the value of the pension scheme liability on a Financial Reporting Standard 17 (FRS17) basis increasing by £2.4m (2012: £7.2m), being a £14.7m increase in the scheme’s assets and a £17.1m increase in the scheme’s liabilities. At the year end, the scheme had an FRS17 deficit of £39.2m (2012: £36.8m).
Treasury
Anchor’s treasury activities are managed to ensure sufficient cash is in place to fund operations and to reduce the impact of adverse movements in interest rates and the financial markets.
Treasury activities are carried out in accordance with a Board-approved treasury management policy and supporting procedures. A treasury
Anchor continues to seek suitable sites on which to build care homes, retirement villages and assisted living housing schemes.”

15For the year ended 31 March 2013
Operating and Financial review
strategy is in place to support delivery of the Group’s objectives and its operational and long-term plans are supported by financial budgets and forecasts. The treasury strategy is approved annually by the Board.
Cash flow requirements are monitored through a rolling forecasting process. Anchor’s policy is to minimise cash held by repaying debt as early as practicable, while ensuring sufficient access to funding to cover investment and development plans. This is achieved by the use of forecasts covering short, medium and long-term cash flows and the use of short-term investment and revolving facilities.
During 2013, surplus cash was held predominantly in a cash liquidity fund. A total of 50% of drawn borrowings were at fixed rates of interest at the year end (2012: 50%) for an average period of 13 years (2012: 14 years).
Anchor has access to undrawn committed borrowing facilities of £73.6m (2012: £73.6m). These facilities together with substantial unutilised security on the Balance Sheet ensure Anchor remains in a strong position to fund future growth plans and investment opportunities.
Net debt at 31 March 2013 was £30.0m (2012: £41.2m), as cash generated from operations was used to finance capital expenditure and working capital.
Anchor remains in compliance with its financial covenants, which are primarily based on interest cover and gearing. Covenants have been met with considerable headroom, due to low interest rates payable (as LIBOR has decreased) and a strong trading performance.
Tax and legal structure
Anchor has a non-charitable trading subsidiary company, Anchor 2020 Limited, which is used to procure design and construction services for the Group and manage the professional fees on new development projects.
Anchor has a second non-charitable trading subsidiary company, Anchor Lifestyle Developments Limited, which is used to operate any non-charitable services.
Surpluses from these subsidiaries are reinvested into Anchor Trust, for the benefit of Anchor Trust’s charitable activities.
Anchor remains in a strong position to fund future growth plans and investment opportunities.”
16Annual Report and Financial Statements
CoRpoRAte GoveRnAnCe RepoRt
Corporate Governance Report
Overview of Anchor’s corporate governance
Anchor is a private company limited by guarantee without share capital. Anchor does not have any shareholders and all of its surpluses are reinvested back into the business. As far as possible, Anchor is managed in line with corporate governance safeguards set out in the uK Corporate Governance Code. Anchor’s Board of Directors is entirely made up of Non-Executive Directors who normally serve for three-year terms, subject to a maximum of three terms.
The Board has the following committees: Audit & Risk (A&RC), Executive Remuneration and Nomination Committees. The Board also operates a Customer Services Committee which enables it to monitor the quality of services provided to Anchor’s customers.
Anchor is also monitored and supervised by external regulators including the Homes & Communities Agency, the Care Quality Commission and the Charity Commission.
The Board and its committees
At 31 March 2013, the Board comprised seven members led by the Chairman, Aman Dalvi. Graham Watts, Vice Chairman of the Board and Chairman of the Audit & Risk Committee, retired in September 2012 at the end of his term.
The Board controls Anchor’s strategic direction and reviews its operating and financial position. There is a formal schedule of matters reserved specifically to the Board, which ensures it takes all major strategy, governance, financial planning, investment and policy decisions. The appointment of the Chief Executive and the approval of standing orders and delegations of authority are matters reserved to the Board.
The Board undertakes an annual review of its schedule of matters reserved and the terms of reference for its committees to ensure that these documents remain in line with good practice.
During the financial year, an internal evaluation of the effectiveness of the Board, and the Board’s committees was undertaken and discussed at Board meetings. Overall, the Board concluded that Anchor has an effective governance structure and that there is strong teamwork and clear accountability in the way the Board operates.
The Board’s governance framework is designed to encourage all Board members to bring an independent judgement to bear on issues of strategy, performance, resources (including key appointments) and standards of conduct.
The Board controls Anchor’s strategic direction and reviews its operating and financial position.”

17For the year ended 31 March 2013
Corporate GovernanCe report
Board meetings
The Board met six times during the year. Member attendance at Board and committee meetings was as follows:
Each member of the Board brings different experiences and skills to the operation of the Board and its various committees. New Board members undergo a formal, tailored induction programme on joining. The programme includes background information about Anchor, details of meeting procedures, Board members’ responsibilities, including Directors’ Duties under the Companies Act 2006, and governance-related issues including the time commitment expected of Board members. The role of the Chairman and Chief Executive are clearly defined, with the former being a Non-Executive Director and the latter a member of the Executive Management Board.
The performance of each Board Director and the Chief Executive is evaluated by the Chairman. The Chairman’s performance is evaluated by Lesley James, Chair of the Nominations Committee.
The Board review and determine strategy for Anchor, based on the changing needs of older people, the economic environment, risk and opportunities. Regular reporting enables the Board to oversee the performance of the organisation and to work with the Chief Executive and Executive Management Board to determine priorities and areas for improvement.
The Board has in place formal procedures for the management of its meetings which require the Board to be supplied with timely and relevant information to enable it to discharge its duties. Board papers are distributed 10 days in advance of the relevant meeting, and the papers are sufficiently detailed to enable Board members to obtain a thorough grasp of Anchor’s management and financial performance. The Board’s terms of reference make provision for it to receive independent professional advice, at Anchor’s expense, to enable it to carry out its duties.
The Board composition is kept under review and when a new appointment is to be made, consideration is given to the experience which a potential new member could add to the existing mix. A transparent recruitment process is used, with advice from external consultants if required. Appointments to the Board are the responsibility of the full Board, with recommendations as appropriate from the Nominations Committee.
As described above, there are four committees of the Board: the Audit & Risk Committee, the Executive Remuneration Committee, the Nominations Committee and the Customer Services Committee.
* Retired in September 2012. ** Appointed to A&RC November 2012.
Board (6 meetings)
Audit & Risk Committee (4 meetings)
Executive Remuneration
Committee (3 meetings)
Nominations Committee (1 meeting)
Customer Services
Committee (3 meetings)
Aman Dalvi (Chairman) ������ ��� ���
Graham Watts (Vice-Chairman)* ��� � � �
Paul Doona ������ ���� ���
Angela Horsman ������ ��� � ���
Stephen Jack ������ ���� ��� �
Lesley James ������ ��� �
Rima Makarem** ������ � ��� � �
Chris Wood ������ ���� ���
Key: � Attended �

18Annual Report and Financial Statements
CoRpoRAte GoveRnAnCe RepoRt
Audit & Risk Committee (A&RC)
The committee consists of at least three Non-Executive Directors, two of whom constitute a quorum. Appointments to the A&RC are for an initial period of three years and are extendable for two further three-year periods.
Graham Watts chaired the A&RC until June 2012 when Stephen Jack took over as Chairman. Its other members during the year were Paul Doona, Chris Wood, and from November 2012, Rima Makarem. The committee structure requires the inclusion of at least one Non-Executive Director with significant, recent and relevant financial experience. Both Paul Doona and Stephen Jack fulfil this requirement.
The committee has written terms of reference that set out its authority and responsibilities. These are considered annually by the committee and any proposed changes are referred to the Board for approval.
The committee’s primary role is to provide assurance to the Board on:• the integrity of the financial reporting and
the audit process; and
• the maintenance of a sound internal control and risk management system.
In pursuing these objectives, the committee:• monitors and assesses the role of the internal
and the external auditors;
• considers the effectiveness of the internal and the external audit processes;
• reviews Anchor’s systems of internal control and the processes for monitoring and evaluating the risks facing Anchor; and
• makes recommendations to the Board on the appointment of the internal and external auditors.
The Chairman of the committee orally reports the outcome of each meeting to the Board and the Board receives an annual written report on the committee’s activities. In addition, the committee undertakes an annual effectiveness review.
In performing its duties, the committee has independent access to the services of the internal and external auditors, and may obtain outside professional advice as necessary. The internal and external auditors have direct access to the Chairman of the committee.
The Chairman of the committee attends the Annual General Meeting to answer questions on the activities of the committee.
The auditors were engaged to provide a range of services to Anchor, including advice on employment tax, advice on VAT, quality assurance of development business cases and pensions.”
19For the year ended 31 March 2013
Corporate GovernanCe report
Report on the committee’s activities for the financial year 2013
Meetings and attendanceThe committee met on four occasions timed to coincide with the internal and external financial reporting cycles of Anchor.
The Chief Executive, the members of the Executive Management Board and senior representatives of the internal and external auditors attended meetings by invitation. At each meeting there was an opportunity for the external and internal auditors to discuss matters with the committee without any executive management being present.
Financial reportingDuring the year the committee reviewed a wide range of accounting and financial issues including the annual Financial Statements prior to submission to the Board. The committee focussed on key accounting policies and practices adopted by the organisation and any significant areas of judgement that materially affected the reported results.
External auditorsThe committee is responsible for the development, implementation and monitoring of Anchor’s policies on external audit. These policies are designed to maintain the objectivity and independence of the external auditors and the appointment of the external auditors to undertake non-audit work.
During the year the auditors were engaged to provide a range of services to Anchor apart from audit activity, including advice on employment tax, advice on VAT, quality assurance of development business cases and pensions. Each appointment was made taking into account the requirements of the Board’s policy on the use of the auditors for non-audit work to ensure the auditor’s objectivity and independence was safeguarded. The Board policy defines the non-audit services that are permitted to be carried out by auditors and the non-audit services that are prohibited to be carried out by auditors. The A&RC receives annual reports from the auditors describing the safeguards in place to maintain their independence and also receives an annual report from the Chief Financial Officer describing the non-audit work undertaken by auditors.
In accordance with its remit, the committee reviewed and approved:• the external auditor’s plans for the
audit of Anchor’s Financial Statements for 2012/13;
• the terms of engagement for the audit and the proposed audit fee and associated expenses; and
• the content of the formal annual audit letter provided by the external auditors and management’s response, including major issues that arose on the audit and their resolution.
Internal auditorsThe committee reviewed:
• the internal auditor’s plan for the year and the achievement of the plan;
• the adequacy of management’s response to the matters raised during the year in reports from the internal auditors, including the implementation of recommendations made; and
• reports on the adequacy and effectiveness of Anchor’s internal control and risk management procedures.
The committee receives reports on outstanding management actions to internal audit recommendations and follows up on the reasons for any actions being outstanding.
Whistle-blowingAnchor’s whistle-blowing policy sets out the arrangements for colleagues to raise concerns or complaints regarding accounting, risk issues, internal controls and related matters with relevant line management or senior company executives. These matters are advised to internal audit for consideration and reported to the committee as appropriate. Any matters considered sufficiently significant by the committee will be brought to the attention of the Board, which will decide how the matter will be handled, including referral to an external agency if appropriate.
The A&RC regularly reviews the arrangements in place for handling whistle-blowing cases, to ensure that they provide for the proportionate and independent investigation of issues raised and for appropriate follow-up action.
20Annual Report and Financial Statements
CoRpoRAte GoveRnAnCe RepoRt
Executive Remuneration Committee
The Executive Remuneration Committee consists of at least three Directors (all Non-Executive Directors of the Board), with a quorum of two. Membership is reviewed annually by the Chairman of the committee. The committee meet three times during the year.
Lesley James chairs the committee, which has benefitted from the membership of all the non-executive members of the Board. Its members are Aman Dalvi, Paul Doona, Angela Horsman, Stephen Jack, Rima Makarem and Chris Wood. No person other than the members of the committee is entitled to be present at meetings but others may be invited by the committee to attend. Neither the Company Secretary nor any members of the Executive Management Board are present when the committee considers matters relating to them.
The Executive Remuneration Committee is responsible for determining the pay and benefits and contractual arrangements for the Executive Management Board. The committee’s aims are to develop and recommend remuneration strategies that drive performance and reward it appropriately.
The committee has written terms of reference and its responsibilities are: • to determine on behalf of the Board
the organisation’s broad policy for executive remuneration;
• in doing so, to encourage the Executive Management Board to enhance the organisation’s performance and to ensure that they are fairly but responsibly rewarded for their individual contributions;
• by delegated authority from the Board, determine any changes to the remuneration including salary, bonus, and other emoluments and all terms and conditions of employment of the Chief Executive;
• by delegated authority from the Board, and taking into account the recommendation of the Chief Executive, determine any changes to the remuneration, including salary, bonus, any other emoluments, and all terms and conditions of employment relating to the Executive Management Board;
• to keep the service agreements and terms of engagement of executives under review;
• to comply with appropriate Codes of Best Practice, ensuring transparency and voluntarily having regard to the requirements for public companies and public sector organisations; and
• to report and account for their decisions by submitting minutes of meetings to the members of the Board and producing an annual statement on executive remuneration to be included in the Annual Report and Financial Statements of Anchor Trust.
The committee reviews its terms of reference annually and any proposed changes are referred to the Board for approval. The committee has an executive remuneration policy that sets out the objectives and the approach for the work of the committee. It states, “the objective of Anchor’s remuneration policy is to attract, retain and motivate high calibre senior executives through competitive pay arrangements which are also in the best interests of all stakeholders”. Total remuneration is benchmarked against a comparator group reflecting the market in which Anchor operates. Remuneration is targeted at a median position, moving to upper quartile for exceptional performance. It is assessed through personal objectives aligned to business key performance indicators, measured through the annual performance management process.
In 2012 the remuneration committee approved a bonus scheme for senior executives linked to the achievement of key business objectives. The targets include five areas which are critical to Anchor’s services – customer satisfaction, colleague engagement, income, surplus, and compliance and service delivery. These are weighted within the total bonus payment, and targets in each category are benchmarked to ensure excellence.
The committee also ensures that executive remuneration is aligned with the remuneration philosophy for all Anchor colleagues. It is underpinned by a stated set of common reward principles: performance delivery, alignment to strategy, competitive and motivating, equitable and fair, and value for money. The committee endorsed the Executive Management Board’s decision that from 1 April 2012 all Anchor colleagues are paid above the National Minimum Wage, with a commitment to progressing towards the
21For the year ended 31 March 2013
Corporate GovernanCe report
Living Wage. This supports Anchor’s objective of being an employer of choice and cements Anchor’s commitment to ensure customers receive high quality care from a motivated workforce.
The committee has access to such information and advice both from within Anchor and externally at the expense of Anchor as it deems necessary. During the year the committee sought advice from New Bridge Street consultants.
Nominations Committee
The committee consists of at least three Non-Executive Directors with a quorum of two. Membership is reviewed annually by the Chairman of the committee. The committee met once during the year.
Lesley James chairs the Nominations Committee. Its members are Angela Horsman, Rima Makarem and Chris Wood. No person other than the members of the committee is entitled to be present at meetings but others may be invited by the committee to attend.
The committee has written terms of reference, which include: • to maintain and regularly review a policy
on nominations to the Board;
• to comply with appropriate Codes of Best Practice.
The committee reviews its terms of reference annually and any proposed changes are referred to the Board for approval.
The committee noted that Anchor’s Board comprises seven members of whom three are women, and therefore complies with the ‘Women on Boards’ report for FTSE 100 companies, issued by Lord Davies in February 2011.
During the year, the committee interviewed candidates to succeed the Chairman who retires in September 2013 and recommended that Pamela Chesters be appointed to the role. The committee also recommended that David Slater join the Executive Management Board (EMB), in the new position of Director of Operations. The EMB members are classified as Directors in the Financial Statements, the emoluments for all these posts are included in Director emoluments, within note 8 to the Financial Statements. The total Director emoluments remain appropriate for an organisation of Anchor’s size and complexity – at 1.2% of total payroll and 0.5% of turnover.
The committee has access to such information and advice both from within Anchor and externally at the expense of Anchor as it deems necessary. Recruitment services were sought from an executive recruitment firm in relation to the appointments of Pamela Chesters and David Slater.
22Annual Report and Financial Statements
CoRpoRAte GoveRnAnCe RepoRt
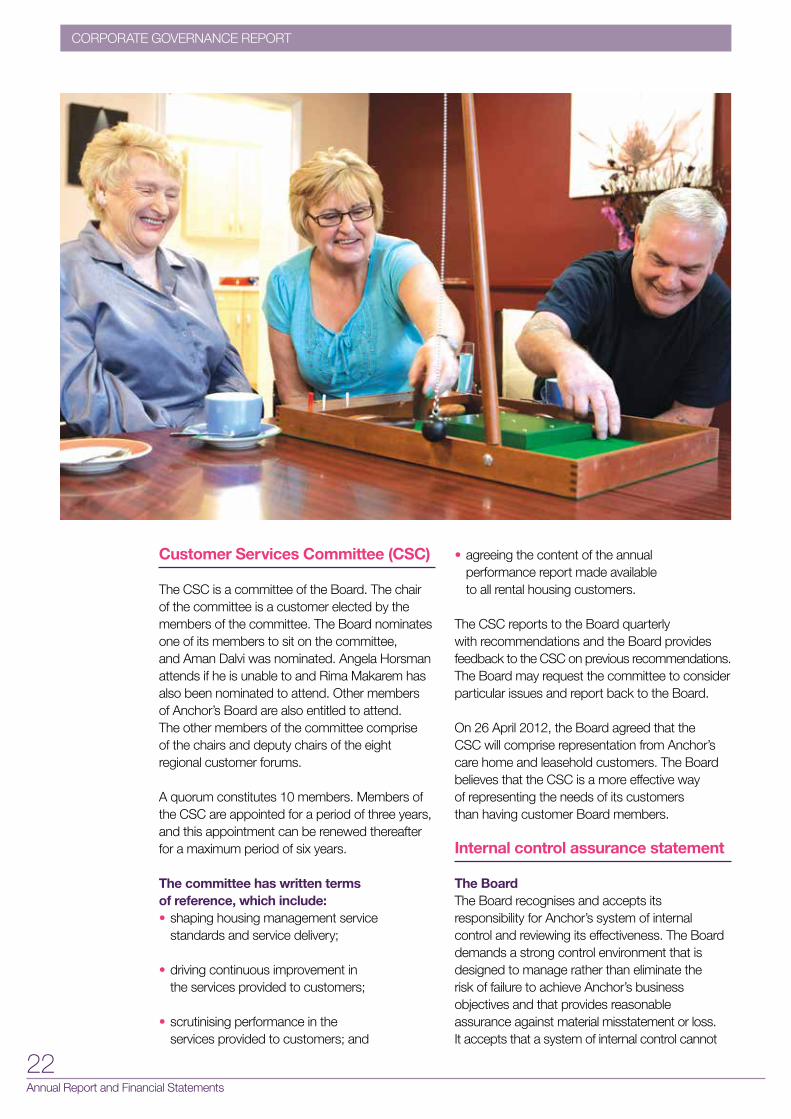
Customer Services Committee (CSC)
The CSC is a committee of the Board. The chair of the committee is a customer elected by the members of the committee. The Board nominates one of its members to sit on the committee, and Aman Dalvi was nominated. Angela Horsman attends if he is unable to and Rima Makarem has also been nominated to attend. Other members of Anchor’s Board are also entitled to attend. The other members of the committee comprise of the chairs and deputy chairs of the eight regional customer forums.
A quorum constitutes 10 members. Members of the CSC are appointed for a period of three years, and this appointment can be renewed thereafter for a maximum period of six years.
The committee has written terms of reference, which include: • shaping housing management service
standards and service delivery;
• driving continuous improvement in the services provided to customers;
• scrutinising performance in the services provided to customers; and
• agreeing the content of the annual performance report made available to all rental housing customers.
The CSC reports to the Board quarterly with recommendations and the Board provides feedback to the CSC on previous recommendations. The Board may request the committee to consider particular issues and report back to the Board.
On 26 April 2012, the Board agreed that the CSC will comprise representation from Anchor’s care home and leasehold customers. The Board believes that the CSC is a more effective way of representing the needs of its customers than having customer Board members.
Internal control assurance statement
The BoardThe Board recognises and accepts its responsibility for Anchor’s system of internal control and reviewing its effectiveness. The Board demands a strong control environment that is designed to manage rather than eliminate the risk of failure to achieve Anchor’s business objectives and that provides reasonable assurance against material misstatement or loss. It accepts that a system of internal control cannot

23For the year ended 31 March 2013
Corporate GovernanCe report
provide absolute assurance against material misstatement or loss.
The Board, through the Audit & Risk Committee, has reviewed the effectiveness of Anchor’s internal controls and risk management for the year ended 31 March 2013 and up to the date of approval of these Financial Statements. There is a range of established strategic and operational policies that ensure Anchor is viable, well governed and well managed. These policies are supported by strong management structures and clear accountability, which have been strengthened further during the year.
The Board is satisfied that the system of internal control has been operating effectively for the year and there are no incidents of weaknesses leading to material loss, contingency or uncertainty that require separate disclosure in the Financial Statements.
Throughout the year under review, Anchor has operated an effective process for identifying, evaluating and managing the significant risks it faces. The process is subject to regular review to ensure it is effective in the face of changing external conditions and reflects actual experience and good practice. Continuing the practice of previous years, a self-assessment process was undertaken by senior managers. This ensures that managers are fully aware of the control environment and that controls are matched to risk levels. The process has identified key actions needed to ensure that the likelihood and/or impact of failure to achieve corporate objectives are reduced. Risk management processes have continued since the year end.
Audit & Risk Committee (A&RC)The A&RC has reviewed its terms of reference during the year to ensure that it continues to provide assurance to the Board on Anchor Trust’s financial reporting, internal control and risk management, internal audit arrangements and external audit arrangements.
The A&RC has monitored the integrity of the Financial Statements and reviewed the actions and judgements of management in their preparation before they were submitted to the Board for approval. The A&RC pays particular attention to strategic processes for risk management, internal control and governance, critical accounting policies and practices.
The A&RC has reviewed the effectiveness of the internal control systems and is satisfied that the policies in relation to financial control, delegated authority, treasury management, fraud detection and reporting, risk management, internal audit, project management, strategic planning, business planning, asset management and performance reporting contribute to an effective control environment.
In reaching this conclusion the A&RC has considered reports from external and internal auditors, specifically, the annual report of the company’s internal auditors in which the internal auditors state, “our work identified low, moderate and high rated findings. Based on the work completed, it believes that these are isolated to specific systems and processes and when taken in aggregate are not considered pervasive to the system of internal control as a whole”. The A&RC has also considered reports from external regulatory bodies such as the Care Quality Commission, Homes & Communities Agency and the Charity Commission and from quality assurance and accreditation bodies. It has also reviewed the fraud register maintained in accordance with regulatory requirements.
The A&RC regularly reviews the ‘whistle-blowing’ policy during the year and continues to have responsibility for oversight of this.
Executive Management Board (EMB)The Executive Management Board is responsible for the operation of the internal control environment within Anchor.
Risk management procedures are applied throughout Anchor to support the achievement of the organisation’s objectives, with key strategic risks and the action taken to mitigate them reported to the Audit & Risk Committee and the Board. Risk identification and mitigation planning is included in the business planning process and also in the project management methodology adopted across Anchor.
The Executive Management Board has been diligent in taking action to mitigate risk where this has been needed. Where improvements in internal control have been needed, steps have been taken to ensure that systems and controls are improved and that material error or misstatement has not occurred.

24Annual Report and Financial Statements
BOARD, DIRECTORS AND ADVISERS
Board, Directors and Advisers
Patron
HRH Princess Alexandra
Members of the Board*
ChairmanAman Dalvi OBE
Members Paul Doona Angela Horsman Stephen Jack Lesley James CBE Rima Makarem Chris Wood
Executive Management Board **
Chief ExecutiveJane Ashcroft
Chief Financial OfficerDavid Springthorpe
MembersDavid Edwards Sue Ingrouille Howard Nankivell David Slater (Appointed July 2012)
Registered Office
2nd Floor 25 Bedford Street London WC2E 9ES
External Auditors
KPMG LLP
Internal Auditors
PricewaterhouseCoopers LLP
Bankers
Lloyds Banking Group PLC
Investment Managers
Schroder Investment Management Limited
Solicitors
Eversheds LLP
Treasury Advisers
Traderisks Limited
* Members are classified as Directors for the purposes of the Companies Act 2006. ** Members of the Executive Board are not classified as Directors for the purposes of the Companies Act 2006.

25For the year ended 31 March 2013
Directors’ reportDIRECTORS’ REPORT
Directors’ Report Legal status
Anchor Trust is a company limited by guarantee (number 3147851). It is registered under the Housing Act 1996 (registration number LH4095) and is a charity (number 1052183).
Review of the business
A review of the business is provided in the Chairman’s statement, Chief Executive’s statement and the Operating and Financial Review.
Directors
The Directors at 31 March 2013 and the date of approval of the Financial Statements are those listed on page 24.
On 27 July 2012, David Slater filled the newly created post of Director of Operations and joined the Executive Management Board. On 31 August 2012 Ian Morris and Gill Powell left the Executive Management Board.
Employment – equality and diversity
Our people strategy aims to cultivate motivated and supported colleagues who understand how they contribute to the organisation. Anchor consults with employees, who are called colleagues, in a range of ways, both formally and informally.
Anchor strives to comply with employment legislation and seeks to ensure that we employ a richly diverse and skilled workforce.
Applications for employment by disabled persons are always fully considered, bearing in mind the aptitudes of the individuals concerned. In the event of colleagues becoming disabled, every effort is made to ensure their employment within Anchor is continued and any necessary adaptations to their working environment or routine are made.
Health and safety
Anchor recognises the importance of managing health and safety risks in order to keep customers and colleagues safe. Anchor’s health and safety performance continues to be satisfactory with
health and safety measures being included in the key performance indicators and compliance in areas such as gas safety, electrical safety and lift maintenance being consistently good. Senior management provide clear and strong direction in striving for high standards of health and safety compliance and there is a health and safety management system in place to achieve this. A health and safety plan is in place with clear targets to further improve health and safety performance.
Donations
Neither Anchor nor any of its subsidiaries made any charitable donations or political donations, or incurred any political expenditure during the year.
Creditor payment policy
It is Anchor’s policy to settle the terms of payment with any suppliers when agreeing the terms of each transaction; to ensure those suppliers are made aware of the terms of payment; and to abide by them. Generally Anchor pays its creditors within 30 days. At the year end, there were 22 days (2012: 22 days) worth of purchases in trade creditors.
Post balance sheet events
There were no post balance sheet events that require disclosure in the Financial Statements.
Going concern
After making enquiries and examining major areas which could give rise to significant financial exposure, the Directors are satisfied that no material or significant exposures exist other than as reflected in these Financial Statements and that Anchor has adequate resources to continue its operations for the foreseeable future. For this reason they continue to adopt the going concern basis in preparing the Financial Statements.
Our people strategy aims to cultivate motivated and supported colleagues.”
26Annual Report and Financial Statements
DiRectoRS’ RepoRt
Auditor
KPMG LLP has expressed its willingness to continue in office as auditor to Anchor. A resolution proposing their reappointment will be made at the Annual General Meeting.
Disclosure of information to auditors
The Directors who held office at the date of approval of this Directors’ Report confirm that, so far as they are each aware, there is no relevant audit information (as defined in Section 418(2) of the Companies Act 2006) of which the company’s auditors are unaware; and each Director has taken all the steps that they ought to have taken as a Director to make themselves aware of any relevant audit information and to establish that the company’s auditors are aware of that information.
Statement of Directors’ responsibilities in respect of the Directors’ Report and the Financial Statements
The Directors are responsible for preparing the Directors’ Report and the Financial Statements in accordance with applicable law and regulations.
Company law requires the Directors to prepare Financial Statements for each financial year. under that law they have elected to prepare the Financial Statements in accordance with uK Accounting Standards and applicable law (uK Generally Accepted Accounting Practice).
under company law, the Directors must not approve the Financial Statements unless they are satisfied that they give a true and fair view of the state of affairs of the company and of
the surplus or deficit for that period. In preparing these Financial Statements, the Directors are required to:
• select suitable accounting policies and then apply them consistently;
• make judgements and estimates that are reasonable and prudent; and
• state whether applicable uK Accounting Standards and Statements of Recommended Practice have been followed, subject to any material departures disclosed and explained in the Financial Statements.
The Directors are responsible for keeping adequate accounting records that are sufficient to show and explain the company’s transactions and disclose with reasonable accuracy at any time the financial position of the company and enable them to ensure that the Financial Statements comply with the Companies Act 2006, the Housing and Regeneration Act 2008 and the Accounting Direction for Private Registered Providers of Social Housing 2012. They have general responsibility for taking such steps as are reasonably open to them to safeguard the assets of the company and to prevent and detect fraud and other irregularities.
The Directors are responsible for the maintenance and integrity of the corporate and financial information included on the company’s website. Legislation in the uK governing the preparation and dissemination of Financial Statements may differ from legislation in other jurisdictions.
By order of the Board
David Edwards Company Secretary 25 July 2013

27For the year ended 31 March 2013
Independent AudItor’s report
Independent Auditor’s Report Independent auditor’s report to the members of Anchor Trust
We have audited the Financial Statements of Anchor Trust Group and Company (“the company”) for the year ended 31 March 2013 set out on pages 28 to 52. The financial reporting framework that has been applied in their preparation is applicable law and uK Accounting Standards (uK Generally Accepted Accounting Practice).
This report is made solely to the company’s members, as a body, in accordance with section 128 of the Housing and Regeneration Act 2008 and Chapter 3 of Part 16 of the Companies Act 2006. Our audit work has been undertaken so that we might state to the company’s members those matters we are required to state to them in an auditor’s report and for no other purpose. To the fullest extent permitted by law, we do not accept or assume responsibility to anyone other than the company and the company’s members, as a body, for our audit work, for this report, or for the opinions we have formed.
Respective responsibilities of directors and auditor
As explained more fully in the Directors’ Responsibilities Statement set out on page 26, the Directors are responsible for the preparation of the Financial Statements and for being satisfied that they give a true and fair view. Our responsibility is to audit, and express an opinion on, the Financial Statements in accordance with applicable law and International Standards on Auditing (uK and Ireland). Those standards require us to comply with the Auditing Practices Board’s Ethical Standards for Auditors.
Scope of the audit of the Financial Statements
A description of the scope of an audit of Financial Statements is provided on the Financial Reporting Council’s website at www.frc.org.uk/auditscopeukprivate.
Opinion on Financial Statements
In our opinion the Financial Statements: • give a true and fair view of the state of affairs
of the company as at 31 March 2013 and of its surplus for the year then ended;
• have been properly prepared in accordance with uK Generally Accepted Accounting Practice; and
• have been prepared in accordance with the Companies Act 2006, the Housing and Regeneration Act 2008 and the Accounting Direction for Private Registered Providers of Social Housing 2012.
Opinion on other matters prescribed by the Companies Act 2006
In our opinion the information given in the Directors’ Report for the financial year for which the Financial Statements are prepared is consistent with the Financial Statements.
Matters on which we are required to report by exception
We have nothing to report in respect of the following matters where the Companies Act 2006 requires us to report to you if, in our opinion:
• adequate accounting records have not been kept, or returns adequate for our audit have not been received from branches not visited by us; or
• the Financial Statements are not in agreement with the accounting records and returns; or
• certain disclosures of Directors’ remuneration specified by law are not made; or
• we have not received all the information and explanations we require for our audit.
Chris Wilson Senior Statutory Auditor for and on behalf of KPMG LLP Statutory Auditor Chartered Accountants Arlington Business Park, Theale, Reading RG7 4SD 25 July 2013

28Annual Report and Financial Statements
FinAnciAl StAtementS
Consolidated Income and Expenditure Accountfor the year ended 31 March 2013
Note2013 £’000
2012 £’000
Turnover:Continuing operations Discontinued operations
264,851
–
263,756
3,706
Total turnover 4 264,851 267,462
Operating costs 4 (246,742) (242,071)
Operating surplus: Continuing operations Operating deficit: Discontinued operations
18,109 –
25,534 (143)
Operating surplus before exceptional items 4 18,109 25,391Exceptional items 5 34 451
Operating surplus: Continuing operations Operating surplus: Discontinued operations
18,109 34
25,534 308
Operating surplus 18,143 25,842
Surplus on disposal of fixed assets 14 8,192 3,721
Surplus on disposal of discontinued operations 4 – 323
Interest receivable and other income 10 3,350 2,874
Interest payable and similar charges 11 (7,860) (10,562)
Surplus for the year 21,825 22,198
Statement of total recognised surpluses and deficits Note2013 £’000
2012 £’000
Surplus for the year Actuarial loss on pension fund
26
21,825 (7,461)
22,198 (12,467)
Total recognised surplus for the year 14,364 9,731
Note of historical cost surpluses and deficits Note2013 £’000
2012 £’000
Reported surplus for the year Realised investment gains
15
21,825 (545)
22,198 (149)
Historical cost surplus for the year 21,280 22,049
The accompanying accounting policies and notes on pages 32 to 52 form an integral part of these Financial Statements.
29For the year ended 31 March 2013
Financial StateMentS
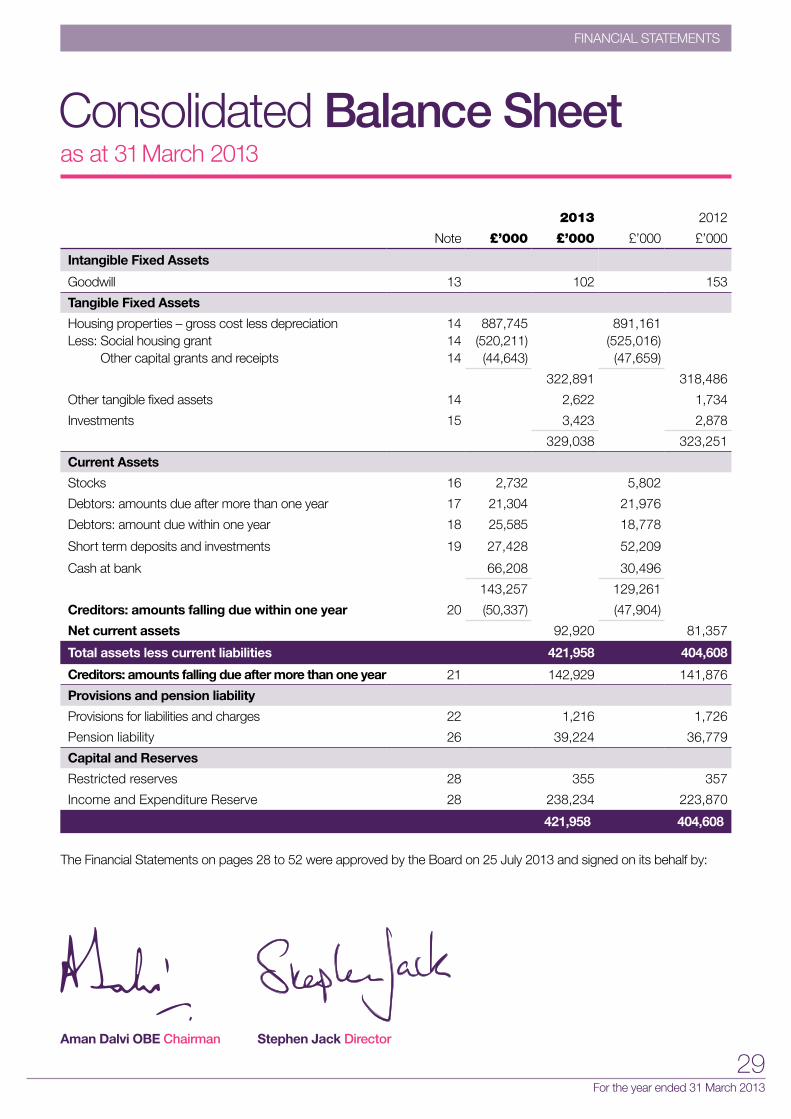
Consolidated Balance Sheetas at 31 March 2013
2013 2012
Note £’000 £’000 £’000 £’000
Intangible Fixed Assets
Goodwill 13 102 153
Tangible Fixed Assets
Housing properties – gross cost less depreciation Less: Social housing grant
Other capital grants and receipts
14 14 14
887,745 (520,211) (44,643)
891,161 (525,016) (47,659)
322,891 318,486
Other tangible fixed assets 14 2,622 1,734
Investments 15 3,423 2,878
329,038 323,251
Current Assets
Stocks 16 2,732 5,802
Debtors: amounts due after more than one year 17 21,304 21,976
Debtors: amount due within one year 18 25,585 18,778
Short term deposits and investments 19 27,428 52,209
Cash at bank 66,208 30,496
143,257 129,261
Creditors: amounts falling due within one year 20 (50,337) (47,904)
Net current assets 92,920 81,357
Total assets less current liabilities 421,958 404,608
Creditors: amounts falling due after more than one year 21 142,929 141,876
Provisions and pension liability
Provisions for liabilities and charges 22 1,216 1,726
Pension liability 26 39,224 36,779
Capital and Reserves
Restricted reserves 28 355 357
Income and Expenditure Reserve 28 238,234 223,870
421,958 404,608
The Financial Statements on pages 28 to 52 were approved by the Board on 25 July 2013 and signed on its behalf by:
Stephen Jack DirectorAman Dalvi OBE Chairman

30Annual Report and Financial Statements
FinAnciAl StAtementS
Company Balance Sheetas at 31 March 2013
2013 2012
Note £’000 £’000 £’000 £’000
Intangible Fixed Assets
Goodwill 13 53 104
Tangible Fixed Assets
Housing properties – gross cost less depreciation Less: Social housing grant
Other capital grants and receipts
14 14 14
888,171 (520,211) (44,643)
878,916 (525,016) (47,659)
323,317 306,241
Other tangible fixed assets 14 2,622 1,734
Investments 15 3,423 2,878
Investments in subsidiary undertakings 15 2,301 2,301
331,716 313,258
Current Assets
Stocks 16 2,732 5,802
Debtors: amounts due after more than one year 17 28,740 41,368
Debtors: amounts due within one year 18 25,478 17,656
Short term deposits and investments 19 27,428 52,209
Cash at bank 63,782 29,621
148,160 146,656
Creditors: amounts falling due within one year 20 (49,266) (45,536)
Net current assets 98,894 101,120
Total assets less current liabilities 430,610 414,378
Creditors: amounts falling due after more than one year 21 142,929 141,876
Provisions and pension liability
Provisions for liabilities and charges 22 1,216 1,726
Pension liability 26 39,224 36,779
Capital and Reserves
Restricted reserves 28 355 357
Income and Expenditure Reserve 28 246,886 233,640
430,610 414,378
The Financial Statements on pages 28 to 52 were approved by the Board on 25 July 2013 and signed on its behalf by:
Stephen Jack DirectorAman Dalvi OBE Chairman

31For the year ended 31 March 2013
Financial StateMentS
Consolidated Cash Flow Statementfor the year ended 31 March 2013
Note2013 £’000
2012 £’000
Net cash inflow from operating activities 29.1 41,831 49,558
Returns on investments and servicing of finance
Net cash outflow from returns on investments and servicing of finance
29.4 (5,457) (3,617)
Capital expenditure and finance investment
Net cash outflow from capital expenditure and financial investment 29.4 (25,259) (47,925)
Net cash inflow / (outflow) before use of liquid resources and financing 11,115 (1,984)
Management of liquid resources
Net cash inflow / (outflow) from management of liquid resources 29.4 24,781 (3,164)
Net cash inflow / (outflow) before financing 35,896 (5,148)
Financing
Net cash (outflow) / inflow from financing 29.4 (184) 24,652
Increase in cash 35,712 19,504
The accompanying accounting policies and notes on pages 32 to 52 form an integral part of these Financial Statements.

32Annual Report and Financial Statements
FinAnciAl StAtementS
1 Basis of accounting
The Financial Statements have been prepared on a going concern basis under the historical cost convention as modified by the revaluation of fixed asset investments and in accordance with accounting standards applicable in the united Kingdom.
They have been prepared in accordance with the Accounting Direction for Private Registered Providers of Social Housing 2012.
2 Basis of consolidation
The Group Financial Statements comprise those of Anchor Trust and its subsidiary undertakings.
3 Principal accounting policies
i) Turnover
Turnover is net of voids and Value Added Tax and includes:• Rents and service charges from
social housing lettings and leasehold management
• Residential care home charges• Home care charges• Revenue grants• Sales of leasehold properties• Supporting People contract income.
Turnover has been analysed in accordance with the requirements of the Accounting Direction for Private Registered Providers of Social Housing 2012 (see note 4).
Charges for services provided and Supporting People income are recognised as income when Anchor has provided the service concerned. Grants made as contributions to revenue expenditure are credited to income in the period in which the related expenditure is incurred.
Notes to the Financial Statementsfor the year ended 31 March 2013
Income from the sale of leasehold properties is recognised as turnover at the completion date of the sale of the property.
Voids represent rent losses arising from vacant accommodation and the amount is shown in Note 4.3, as required by the Accounting Direction for Private Registered Providers of Social Housing 2012.
ii) Interest payableInterest is capitalised on borrowings to finance developments to the extent that it accrues in respect of the period of development if it represents either:
a) interest on borrowings specifically financing the development programme after deduction of interest on social housing grant received in advance; or
b) interest on borrowings of Anchor Trust as a whole after deduction of interest on social housing grant received in advance to the extent that they can be deemed to be financing the development programme.
Other interest payable is charged to the Income and Expenditure Account in the year.
iii) PensionsDefined contribution pension costs are charged to the Income and Expenditure Account in the year they are incurred.
In respect of defined benefit pensions, the pension costs charged against income are based on an actuarial method and actuarial assumptions. Before the current financial year, these were designed to provide the anticipated pension cost over the average service lives of the employees in the scheme in a way that sought to ensure that the regular pension cost represented a broadly level percentage of the current and expected future pensionable payroll in the light of current actuarial assumptions.
33For the year ended 31 March 2013
Financial StateMentS
Variations from the current costs were spread over the average service lives of the employees in the scheme in a way that seeks to ensure that the regular pension cost represents a broadly level percentage of the current and expected future pensionable payroll in the light of current acturial assumptions. Variations from the current cost were spread over the remaining service lives of current employees in the pension scheme.
As the scheme was closed to further accrual as at 31 March 2011, the anticipated pension costs are primarily the scheme expenses and there is no remaining service life of employees assumed for the scheme.
iv) TaxationIncome and capital gains of Anchor Trust are exempt from tax where arising from charitable purposes.
v) Leases
• As LesseeAssets financed by leasing agreements which give rights approximating to ownership (finance leases) have been capitalised at their fair value and depreciation is provided on the basis of the Group depreciation policy. The capital elements of future obligations under finance leases are included as liabilities in the balance sheet and the current year’s interest element, having been allocated to accounting periods to give a constant periodic rate of charge on the outstanding liability, is charged to the Income and Expenditure Account. The annual payments under all other lease arrangements, known as operating leases, are charged to the Income and Expenditure Account on a straight-line basis.
• As Lessorupon completion of properties the development costs incurred under a Private Finance Initiative (PFI) contract are converted to a finance lease debtor. This debtor represents the total amount outstanding under the lease agreements less unearned income. Finance lease income, having been allocated to accounting periods to give a constant periodic rate of return on the net investment, is included in turnover.
vi) Housing propertiesRetirement housing and residential care home properties are stated at cost less social housing grant, other capital grants and depreciation.
Shared Ownership for the Elderly (SOE) schemes are held at the outstanding interest in the properties less social housing grant retained and depreciation. The outstanding interest in SOE schemes is stated at cost, plus cost of equity subsequently repurchased by Anchor Trust. Proceeds from first tranche disposals are accounted for in the Income and Expenditure Account in the year in which the disposal occurs.
Cost for housing properties includes the cost of acquiring land and buildings, construction costs including internal equipment and fittings, cost of capital employed during the development period and expenditure incurred in respect of improvements and extension of existing properties to the extent that it enhances the economic benefit derived from the assets.
The costs of housing properties are split between the structure and those major components which require periodic replacement. Replacement or restoration of such major components is capitalised and depreciated over the average estimated useful life which has been set taking into account professional advice, the Group’s asset management strategy and the requirements of the Decent Homes Standard. The lives attributable to assets capitalised in this way range from four to 50 years.
Housing properties in the course of construction are held at cost and are not depreciated. They are transferred to completed properties when ready for letting or sale.
The asset lives used are as follows:• Housing properties and residential care homes:
between 25 and 50 years except where the economic life of the property is dependent on a revenue support agreement in which case the life used is the initial term of that agreement.
For individual components the assets lives used are as follows:• Bathrooms and kitchens: 10 years• Windows: 15 years• SOE schemes: 99 years.
For all properties impairment reviews are carried out on an annual basis in accordance with Financial Reporting Standard 11.
34Annual Report and Financial Statements
FinAnciAl StAtementS
The depreciation policy relating to Housing Properties follows the SORP updated 2010 on Accounting by registered social landlords. Depreciation is calculated on cost net of any grant received.
vii) Social housing grantSocial housing grant is receivable from central government agencies and local authorities and is offset against the cost of housing properties on the face of the balance sheet. The purpose of social housing grant is to subsidise the capital cost of affordable housing.
Social housing grant due from such agencies or received in advance is included as a current asset or liability.
Where, following the sale of the property, social housing grant becomes repayable, to the extent that it is not subject to abatement, it is included as a liability until it is repaid or utilised.
Any social housing grant received in respect of revenue expenditure is credited to the Income and Expenditure Account in the same year as the expenditure to which it relates.
viii) Other grantsThe capital costs of housing properties are stated net of capital grants, other than social housing grant, receivable from public bodies. Grants in respect of revenue expenditure are credited to the Income and Expenditure Account in the same year as the expenditure to which they relate.
ix) Other tangible fixed assetsAll other tangible fixed assets are included at cost less depreciation.
Depreciation is provided on a straight line basis on the cost of the asset less the estimated residual value on all tangible fixed assets except land.
The asset lives used are as follows:• Motor vehicles: four years• Computer equipment: two to four years• Office equipment and fittings: four years
x) InvestmentsAll investments are stated at market value at the balance sheet date. Investments that are intended to be held to generate returns for use on a continuing basis in the activities of Anchor Trust are classified as fixed assets.
Investments held as part of short term treasury management for a planned expenditure purpose are classified as current assets.
xi) Restricted reservesRestricted reserves are funds received, the use of which is restricted by general law or by the terms on which the funds were given. These include funds where the donor has made a donation to be spent for a particular purpose or in a particular geographical area.
xii) ImpairmentWhen a review of individual fixed assets or income generating units indicates an impairment, this is recognised in the Income and Expenditure Account and included within cumulative depreciation.
xiii) StockStock comprise properties available for resale and goods for consumption, which are shown at cost. This is considered to be a reasonable approximation to the lower of cost and net realisable value.
xiv) Positive goodwillWhere the fair value consideration for an acquired business exceeds the fair value of its separable net assets, the difference is treated as purchased goodwill and is capitalised and amortised through the Income and Expenditure Account over its estimated economic life. The estimated useful economic life of goodwill is four to 10 years.
xv) Financing costsThe initial cost of raising finance is charged to the Income and Expenditure Account when incurred.
xvi) Provision for liabilitiesA provision is made when Anchor Trust has a legal or constructive obligation as a result of a past event and it is probable that an outflow of economic benefits will be required to settle the obligations. Anchor Trust closes retirement housing and care homes that are not financially viable in the ordinary course of business and provision is made accordingly.
xvii Related partiesAnchor Trust has taken advantage of the exemption contained in Financial Reporting Standard 8 and has therefore not disclosed transactions between Group companies that are eliminated on consolidation. All transactions between Group companies are on commercial terms.

35For the year ended 31 March 2013
Financial StateMentS
Social housing lettings comprise income from retirement housing and from residential care homes (see note 4.3).
Home Care income comprises income from care services delivered into customers’ homes.
After business disposal costs a net surplus of £nil (2012 – £323,000) was generated from the disposal of discontinued operations. In 2012 discontinued operations comprised the home care domiciliary care business.
Anchor’s costs relating to administration, offices and other support functions are allocated to Anchor Trust’s businesses, being Social Housing lettings, Home Care and Non-Social Housing activities. The amounts allocated were £35,424,000, £992,000 and £3,465,000 respectively. Anchor Trust, which operates the regulated Retirement Housing to let and Residential care home businesses, also transacts with other group companies, which are not regulated, and these transactions are described in note 32.
Social housing lettings
£’000
Home care
£’000
Non-social housing
activities £’000
Central overheads
and income £’000
2013 Total
£’000
2012 Total
£’000
Turnover:
Continuing 247,719 5,398 10,484 1,250 264,851 263,756
Discontinued – – – – – 3,706
Turnover 247,719 5,398 10,484 1,250 264,851 267,462
Operating costs (219,752) (6,362) (8,656) (11,972) (246,742) (242,071)
Operating surplus:
Continuing 27,967 (964) 1,828 (10,722) 18,109 25,534
Discontinued – – – – – (143)
Operating surplus before exceptional items
27,967 (964) 1,828 (10,722) 18,109 25,391
4 Particulars of turnover, operating costs and operating surplus
4.1 Analysis of turnover
4.2 Particulars of turnover from non-social housing activities2013
£’0002012
£’000
Leasehold management 3,196 3,169
Sales of leasehold properties 5,958 10,800
Other activities 1,330 1,140
Total 10,484 15,109
All turnover has been derived from activities within the united Kingdom.

36Annual Report and Financial Statements
FinAnciAl StAtementS
Retirement housing
to let £’000
Residential care homes
£’000
2013 Total
£’000
2012 Total
£’000
Income
Rent receivable net of identifiable service charges
80,404 118,104 198,508 191,735
Charges for support services 2,435 – 2,435 5,242
Service charge income 43,898 – 43,898 40,058
Net rental income 126,737 118,104 244,841 237,035
Other revenue grants 16 642 658 661
Other income from social housing lettings 1,799 421 2,220 4,026
Income from social housing lettings 128,552 119,167 247,719 241,722
Expenditure
Management 23,949 16,311 40,260 39,597
Service charge costs 40,528 88,012 128,540 123,461
Routine maintenance 7,877 1,309 9,186 10,429
Planned maintenance 9,421 2,427 11,848 9,757
Bad debts 766 298 1,064 739
Lease charges 101 510 611 517
Depreciation of housing properties 19,255 8,606 27,861 27,667
Other costs 309 73 382 148
Operating costs on social housing lettings 102,206 117,546 219,752 212,315
Operating surplus on social housing lettings 26,346 1,621 27,967 29,407
4.3 Particulars of turnover and operating costs from social housing lettings
Retirement housing
leasehold units
Retirement housing
units to let
Residential care homes
units
unit numbers available as at 1 April 2012 6,783 22,916 4,290
Additions 20 42 117
Disposals/De-registered – (464) (68)
Unit numbers available as at 31 March 2013 6,803 22,494 4,339
4.4 Property numbers
5 Exceptional items
The exceptional items arising are as follows:2013
£’0002012
£’000
Business disposal credit (34) (451)
Total exceptional items included in operating surplus (34) (451)
Exceptional income of £34,000 (2012: £451,000 income) related to discontinued operations. In both 2012 and 2013, the exceptional credit arose from the release of unutilised provisions relating to the separation costs for Anchor Staying Put.
The value of void losses was £2,704,000 (2012: £3,274,000).
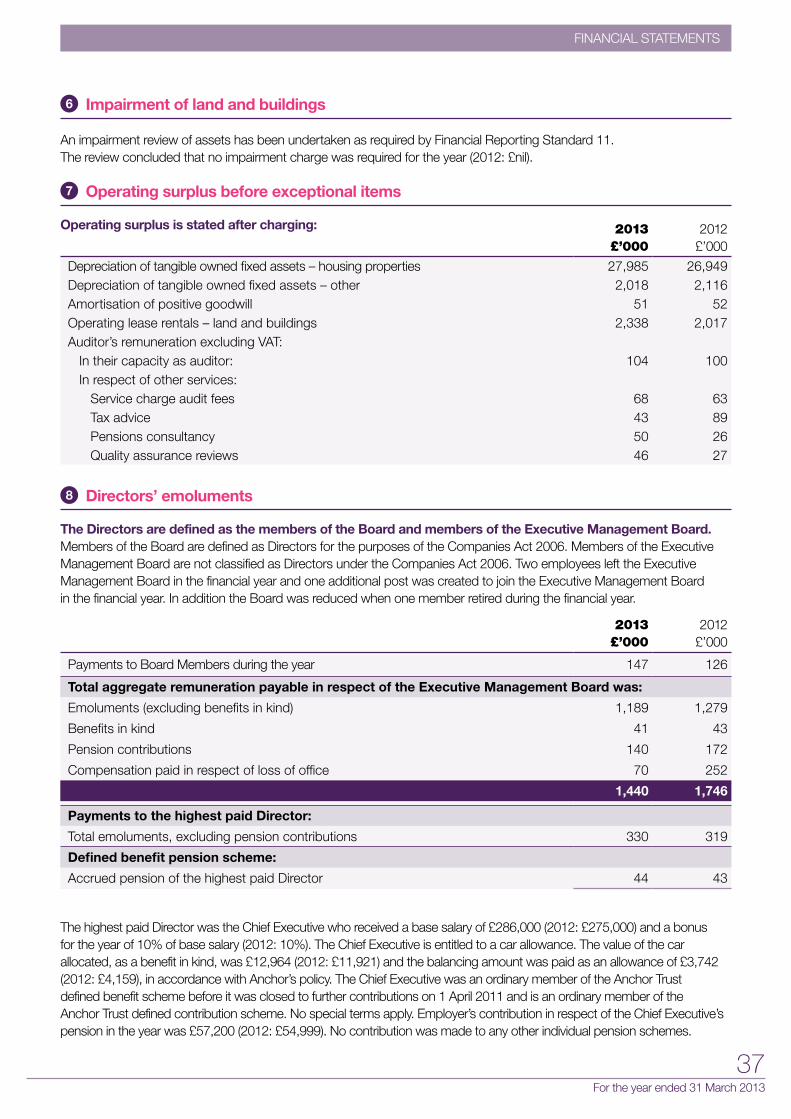
37For the year ended 31 March 2013
Financial StateMentS
6 Impairment of land and buildings
An impairment review of assets has been undertaken as required by Financial Reporting Standard 11. The review concluded that no impairment charge was required for the year (2012: £nil).
7 Operating surplus before exceptional items
Operating surplus is stated after charging: 2013 £’000
2012 £’000
Depreciation of tangible owned fixed assets – housing properties 27,985 26,949Depreciation of tangible owned fixed assets – other 2,018 2,116Amortisation of positive goodwill 51 52Operating lease rentals – land and buildings 2,338 2,017Auditor’s remuneration excluding VAT:
In their capacity as auditor: 104 100In respect of other services:
Service charge audit fees 68 63Tax advice 43 89Pensions consultancy 50 26Quality assurance reviews 46 27
8 Directors’ emoluments
The Directors are defined as the members of the Board and members of the Executive Management Board. Members of the Board are defined as Directors for the purposes of the Companies Act 2006. Members of the Executive Management Board are not classified as Directors under the Companies Act 2006. Two employees left the Executive Management Board in the financial year and one additional post was created to join the Executive Management Board in the financial year. In addition the Board was reduced when one member retired during the financial year.
2013 £’000
2012 £’000
Payments to Board Members during the year 147 126
Total aggregate remuneration payable in respect of the Executive Management Board was:
Emoluments (excluding benefits in kind) 1,189 1,279
Benefits in kind 41 43
Pension contributions 140 172
Compensation paid in respect of loss of office 70 252
1,440 1,746
Payments to the highest paid Director:
Total emoluments, excluding pension contributions 330 319
Defined benefit pension scheme:
Accrued pension of the highest paid Director 44 43
The highest paid Director was the Chief Executive who received a base salary of £286,000 (2012: £275,000) and a bonus for the year of 10% of base salary (2012: 10%). The Chief Executive is entitled to a car allowance. The value of the car allocated, as a benefit in kind, was £12,964 (2012: £11,921) and the balancing amount was paid as an allowance of £3,742 (2012: £4,159), in accordance with Anchor’s policy. The Chief Executive was an ordinary member of the Anchor Trust defined benefit scheme before it was closed to further contributions on 1 April 2011 and is an ordinary member of the Anchor Trust defined contribution scheme. No special terms apply. Employer’s contribution in respect of the Chief Executive’s pension in the year was £57,200 (2012: £54,999). No contribution was made to any other individual pension schemes.

38Annual Report and Financial Statements
FinAnciAl StAtementS
9 Employee costs and numbers
9.1 Employee costs2013
£’0002012
£’000
Wages and salaries 113,429 113,081
Social security costs 8,102 7,981
Pension costs 1,102 1,039
122,633 122,101
9.2 The average number of employees, including part-time staff, during the year was:2013
Number2012
Number
Office staff 743 773
Operational staff 7,942 8,370
8,685 9,143
9.3 The full-time equivalent number of employees during the year was:2013
Number2012
Number
Office staff 696 722
Operational staff 5,677 5,966
6,373 6,688
Full-time equivalents are calculated based on a standard working week of 37.5 hours.
The full-time equivalent number of employees whose total aggregate remuneration (including pension contributions and compensation payable in respect of loss of office) fell within the following bands was:
10 Interest receivable and other income
2013 £’000
2012 £’000
Interest receivable 2,373 2,432
Exchange rate gain 545 149
Other income 432 293
3,350 2,874
2013 Number
£60,001–£70,000 16
£70,001–£80,000 8
£80,001–£90,000 5
£90,001–£100,000 12
£100,001–£110,000 1
£110,001–£120,000 3
£120,001–£130,000 6
2013 Number
£130,001–£140,000 1
£140,001–£150,000 2
£160,001–£170,000 2
£170,001–£180,000 1
£210,001–£220,000 1
£270,001–£280,000 1
£380,001–£390,000 1
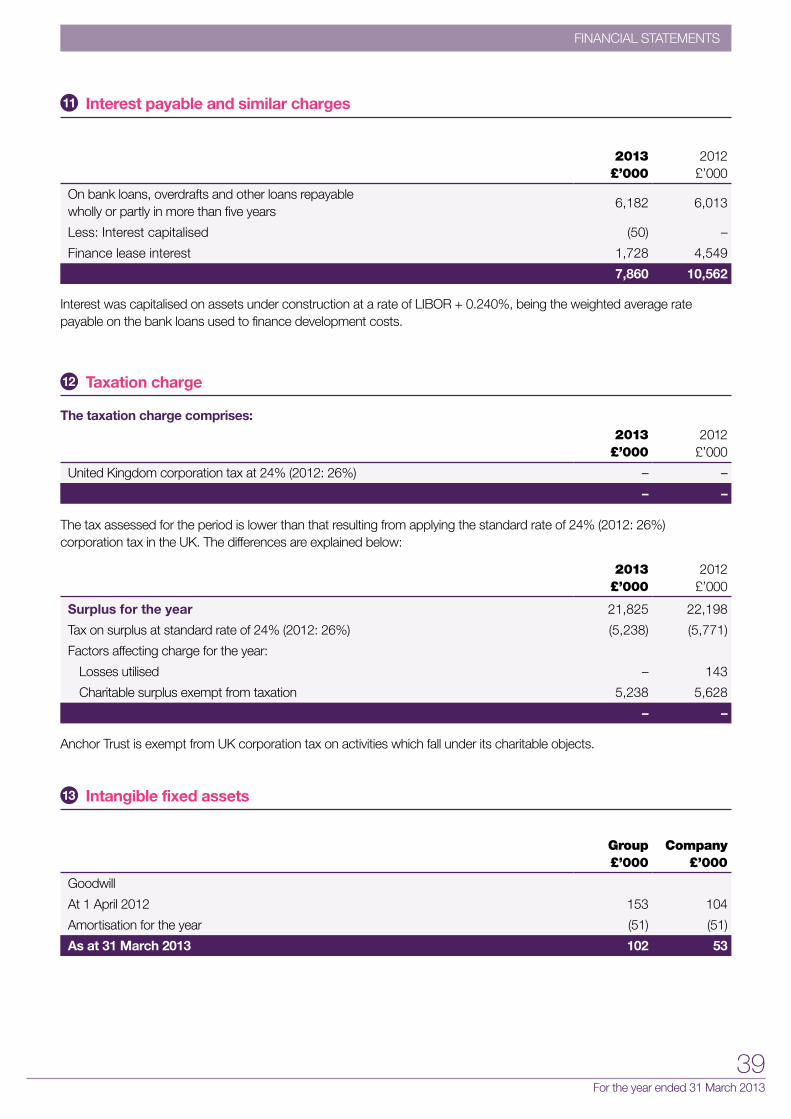
39For the year ended 31 March 2013
Financial StateMentS
11 Interest payable and similar charges
2013 £’000
2012 £’000
On bank loans, overdrafts and other loans repayable wholly or partly in more than five years
6,182 6,013
Less: Interest capitalised (50) –
Finance lease interest 1,728 4,549
7,860 10,562
Interest was capitalised on assets under construction at a rate of LIBOR + 0.240%, being the weighted average rate payable on the bank loans used to finance development costs.
12 Taxation charge
The taxation charge comprises:2013
£’0002012
£’000
united Kingdom corporation tax at 24% (2012: 26%) – –
– –
The tax assessed for the period is lower than that resulting from applying the standard rate of 24% (2012: 26%) corporation tax in the uK. The differences are explained below:
2013 £’000
2012 £’000
Surplus for the year 21,825 22,198
Tax on surplus at standard rate of 24% (2012: 26%) (5,238) (5,771)
Factors affecting charge for the year:
Losses utilised – 143
Charitable surplus exempt from taxation 5,238 5,628
– –
Anchor Trust is exempt from uK corporation tax on activities which fall under its charitable objects.
13 Intangible fixed assets
Group £’000
Company £’000
Goodwill
At 1 April 2012 153 104
Amortisation for the year (51) (51)
As at 31 March 2013 102 53

40Annual Report and Financial Statements
FinAnciAl StAtementS
Retirement housing
£’000
Residential care homes
£’000
Housing properties
under construction
£’000
Shared ownership
schemes
£’000
Total housing
properties
£’000
Cost
At 1 April 2012 834,116 204,477 52,968 4,751 1,096,312
Additions 23,223 7,343 11,146 – 41,712
Transfers (1,598) 29,554 (30,302) – (2,346)
Disposals (10,302) (12,799) (14,398) – (37,499)
As at 31 March 2013 845,439 228,575 19,414 4,751 1,098,179
Depreciation
At 1 April 2012 114,432 77,370 13,349 – 205,151
Provided in the year 19,372 8,613 – – 27,985
Transfers (549) 194 – – (355)
Disposals (4,392) (4,606) (13,349) – (22,347)
As at 31 March 2013 128,863 81,571 – – 210,434
Net book value at 31 March 2013 716,576 147,004 19,414 4,751 887,745
Net book value at 31 March 2012 719,684 127,107 39,619 4,751 891,161
Social housing grant (SHG)
At 1 April 2012 479,709 38,638 – 6,669 525,016
Transfer to Recycled Capital Grant Fund
(3,250) – – – (3,250)
Disposals (1,555) – – – (1,555)
As at 31 March 2013 474,904 38,638 – 6,669 520,211
Other capital grants
At 1 April 2012 25,564 22,095 – – 47,659
Transfers (22) – – – (22)
Disposals (9) (2,985) – – (2,994)
As at 31 March 2013 25,533 19,110 – – 44,643
Total SHG and other capital grants as at 31 March 2013
500,437 57,748 – 6,669 564,854
Total SHG and other capital grants as at 31 March 2012
505,273 60,733 – 6,669 572,675
Overall net book value as at 31 March 2013
216,139 89,256 19,414 (1,918) 322,891
Overall net book value as at 31 March 2012
214,411 66,374 39,619 (1,918) 318,486
14 Tangible fixed assets
14.1 Housing properties – Group
The cost, depreciation and grant as at 1 April 2012 have been restated to reflect the underlying accounting records of Anchor. There is no change to the net book value as at 1 April 2012.

41For the year ended 31 March 2013
Financial StateMentS
Retirement housing
£’000
Residential care homes
£’000
Housing properties
under construction
£’000
Shared ownership
schemes
£’000
Total housing
properties
£’000
Cost
At 1 April 2012 833,402 204,477 29,938 4,751 1,072,568
Additions 23,223 18,248 12,635 – 54,106
Transfers (1,598) 31,432 (32,180) – (2,346)
Disposals (10,302) (12,799) (2,622) – (25,723)
As at 31 March 2013 844,725 241,358 7,771 4,751 1,098,605
Depreciation
At 1 April 2012 114,432 77,370 1,850 – 193,652
Provided in the year 19,372 8,613 – – 27,985
Transfers (549) 194 – – (355)
Disposals (4,392) (4,606) (1,850) – (10,848)
As at 31 March 2013 128,863 81,571 – – 210,434
Net book value at 31 March 2013 715,862 159,787 7,771 4,751 888,171
Net book value at 31 March 2012 718,970 127,107 28,088 4,751 878,916
Social housing grant (SHG)
At 1 April 2012 479,709 38,638 – 6,669 525,016
Transfer to Recycled Capital Grant Fund
(3,250) – – – (3,250)
Disposals (1,555) – – – (1,555)
As at 31 March 2013 474,904 38,638 – 6,669 520,211
Other capital grants
At 1 April 2012 25,564 22,095 – – 47,659
Transfers (22) – – – (22)
Disposals (9) (2,985) – – (2,994)
As at 31 March 2013 25,533 19,110 – – 44,643
Total SHG and other capital grants as at 31 March 2013
500,437 57,748 – 6,669 564,854
Total SHG and other capital grants as at 31 March 2012
505,273 60,733 – 6,669 572,675
Overall net book value as at 31 March 2013
215,425 102,039 7,771 (1,918) 323,317
Overall net book value as at 31 March 2012
213,697 66,374 28,088 (1,918) 306,241
14.2 Housing properties – Company
The cost, depreciation and grant as at 1 April 2012 have been restated to reflect the underlying accounting records of Anchor. There is no change to the net book value as at 1 April 2012.

42Annual Report and Financial Statements
FinAnciAl StAtementS
Office equipment
and fittings £’000
Motor vehicles
£’000
Total other tangible fixed
assets £’000
Cost
At 1 April 2012 12,916 149 13,065
Additions 914 – 914
Transfers 2,346 – 2,346
Disposals (27) (52) (79)
As at 31 March 2013 16,149 97 16,246
Depreciation
At 1 April 2012 11,182 149 11,331
Provided in the year 2,018 – 2,018
Transfers 354 – 354
Disposals (27) (52) (79)
As at 31 March 2013 13,527 97 13,624
Net book value at 31 March 2013 2,622 – 2,622
Net book value at 31 March 2012 1,734 – 1,734
14.3 Housing properties held under finance leases – Group and CompanyThe balances for residential care homes include four residential care homes held under finance leases at gross cost £11,878,000 (2012: £11,878,000) with accumulated depreciation of £7,847,000 (2012: £7,338,000). The depreciation charge during the year was £509,000 (2012: £3,481,000).
14.4 Other tangible fixed assets – Group and Company
14.5 Housing properties Additions to housing properties in the course of construction during the period included capitalised interest of £50,000 (2012: £nil).
The net book value of housing properties at the balance sheet date comprises:
Group Company
2013 £’000
2012 £’000
2013 £’000
2012 £’000
Freehold land and buildings 291,114 285,540 291,540 273,295
Long leasehold land and buildings 31,777 32,946 31,777 32,946
322,891 318,486 323,317 306,241
The total amount of social housing grant received or receivable as at the balance sheet date was £520,211,000 (2012: £525,016,000).
14.6 Expenditure works to housing properties
Note2013
£’0002012
£’000
Total expenditure works to housing propertiesof which:
42,414 41,887
Amounts capitalised 30,566 32,130
Amounts charged to income and expenditure (planned maintenance) 4.3 11,848 9,757

43For the year ended 31 March 2013
Financial StateMentS
14.7 Surplus on disposal of housing properties2013
£’0002012
£’000
Receipts from disposal of housing properties 17,203 15,497
Net book value of property disposals (6,538) (3,869)
Transfer to Recycled Capital Grant Fund (3,250) (4,804)
Other disposal costs 777 (3,103)
Surplus on disposal of housing properties 8,192 3,721
15 Fixed asset investments
15.1 Fixed asset investments – Group and Company£’000
Market value at 1 April 2012 2,878
Realised investment gains 545
Market value at 31 March 2013 3,423
Historic cost at 31 March 2013 (2012: £2,730,000) 2,730
15.2 Fixed asset investments – Subsidiary undertakingsCompany
£’000
Cost at 1 April 2012 and 31 March 2013 2,301
The following subsidiary undertakings are controlled by Anchor Trust and are registered in England and Wales:
Company Nature of business Share
capital
Anchor Lifestyle Developments Limited Residential care homes and housing development £1
Anchor 2020 Limited Design and construction services £1
Anchor Trust Trading Limited Dormant £1,000
AMSA Retirement Homes Limited Dormant £100
Rain Healthcare Services Limited Dormant £1,000
Anchor Trust is regarded as the parent company for these companies on the grounds that it either owns 100% of the issued share capital or it has the sole right to nominate Directors.
16 Stock – Group and Company
2013 £’000
2012 £’000
Properties for resale 2,597 5,669
Raw materials and consumables 135 133
2,732 5,802
Stocks of raw materials and consumables relate to catering supplies within residential care homes.
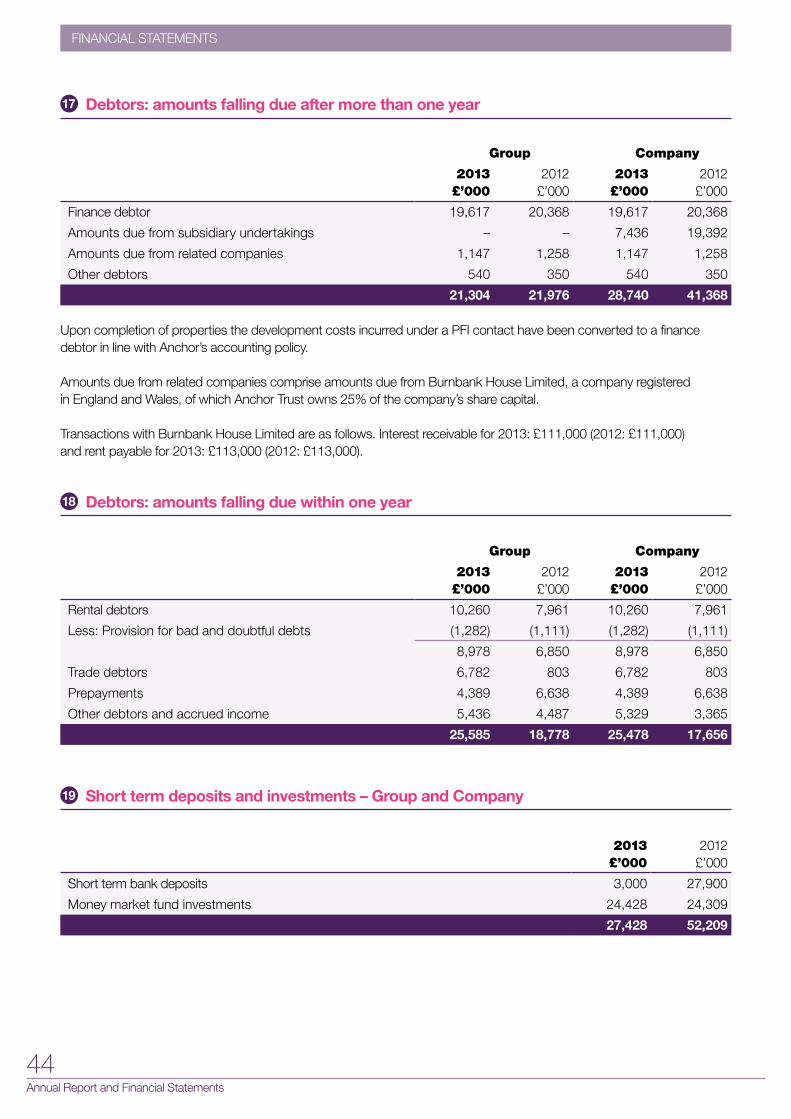
44Annual Report and Financial Statements
FinAnciAl StAtementS
upon completion of properties the development costs incurred under a PFI contact have been converted to a finance debtor in line with Anchor’s accounting policy.
Amounts due from related companies comprise amounts due from Burnbank House Limited, a company registered in England and Wales, of which Anchor Trust owns 25% of the company’s share capital.
Transactions with Burnbank House Limited are as follows. Interest receivable for 2013: £111,000 (2012: £111,000) and rent payable for 2013: £113,000 (2012: £113,000).
17 Debtors: amounts falling due after more than one year
Group Company
2013 £’000
2012 £’000
2013 £’000
2012 £’000
Finance debtor 19,617 20,368 19,617 20,368
Amounts due from subsidiary undertakings – – 7,436 19,392
Amounts due from related companies 1,147 1,258 1,147 1,258
Other debtors 540 350 540 350
21,304 21,976 28,740 41,368
18 Debtors: amounts falling due within one year
Group Company
2013 £’000
2012 £’000
2013 £’000
2012 £’000
Rental debtors 10,260 7,961 10,260 7,961
Less: Provision for bad and doubtful debts (1,282) (1,111) (1,282) (1,111)
8,978 6,850 8,978 6,850
Trade debtors 6,782 803 6,782 803
Prepayments 4,389 6,638 4,389 6,638
Other debtors and accrued income 5,436 4,487 5,329 3,365
25,585 18,778 25,478 17,656
19 Short term deposits and investments – Group and Company
2013 £’000
2012 £’000
Short term bank deposits 3,000 27,900
Money market fund investments 24,428 24,309
27,428 52,209

45For the year ended 31 March 2013
Financial StateMentS
Major repairs sinking funds for leasehold schemesMajor repairs sinking funds are maintained for most leasehold retirement estates to provide for repairs of a long term nature. Contributions are normally received from leasehold customers on the resale of properties by reference to the length of occupation and original purchase price of the property. Some leasehold customers contribute through the service charge.
Recycled capital grant fund
20 Creditors: amounts falling due within one year
Group Company
Note2013
£’0002012
£’0002013
£’0002012
£’000
Trade creditors 3,980 4,720 4,035 4,775
Rents received in advance 2,866 3,065 2,866 3,065
Surpluses carried forward on variable service charge schemes
3,162 2,072 3,162 2,072
Recycled capital grant fund 21 2,767 454 2,767 454
Housing loans: current instalments due on loans
23 701 680 701 680
Obligations under finance leases 25 169 83 169 83
Social security and other taxes 2,867 2,318 2,867 2,318
Other creditors 7,938 7,861 7,938 7,861
Accruals and deferred income 25,887 26,651 24,761 24,228
50,337 47,904 49,266 45,536
Note2013
£’0002012
£’000
Recycled capital grant fund 7,537 6,559
Housing loans 23 109,456 109,661
Obligations under finance leases 25 12,968 13,138
Loan stock 323 323
Major repairs sinking funds for leasehold schemes 10,169 9,732
Other creditors 2,476 2,463
142,929 141,876
21 Creditors: amounts falling due after more than one year – Group and Company
2013 £’000
2012 £’000
Fund at 1 April 7,013 5,005
Transferred to fund during the year 3,250 4,804
utilised during the year – (2,828)
Interest credited to fund 41 32
Fund at 31 March 10,304 7,013
Falling due within one year 2,767 454
Falling due after more than one year 7,537 6,559
10,304 7,013
The total recycled capital grant fund balance would be repayable to the Homes & Communities Agency in the event that it is not utilised.

46Annual Report and Financial Statements
FinAnciAl StAtementS
22 Provisions for liabilities and charges – Group and Company
Note
Onerous leases £’000
Restructuring
£’000
Business disposal
£’000
Tax liabilities
£’000
2013
£’000
2012
£’000
Balance as at 1 April 1,101 278 332 15 1,726 4,649
Balances utilised in the year (254) (278) (248) (7) (787) (2,491)
Balances released in the year 5 – – (34) – (34) (451)
Provisions raised during the year 311 – – – 311 19
Balance as at 31 March 1,158 – 50 8 1,216 1,726
2013 £’000
2012 £’000
Fixed rates
Orchardbrook Limited Interest payable at 11.615% 29,104 29,213
HACO 10.625% debenture stock 2017 15,000 15,000
Banks Between 6.15% – 6.58% 10,000 10,000
Local authorities Between 9.1% – 13.0% 17 17
Between 13.10% – 16.12% 95 105
Other Between 0.0% – 3.0% 590 590
54,806 54,925
Variable rates
Banks 0.175% – 0.450% above LIBOR 55,000 55,000
Orchardbrook Limited Interest payable 1.81% 351 376
Local authorities Between 0.0% – 9.0% – 40
55,351 55,416
Total housing loans 110,157 110,341
23 Housing loans – Group and Company
All housing loans from Orchardbrook Limited, HACO, local authorities and banks are secured by charges on certain of Anchor Trust’s housing properties and are repayable at varying rates of interest as follows:
The total net book value of housing properties used to secure liabilities to third parties is £119,200,000 (2012: £117,390,000).
Repayment instalments fall due as follows:2013
£’0002012
£’000
In one year or less 701 680
Greater than one year, but less than two 177 161
Greater than two years, but less than five 18,649 2,591
In five years or more 90,630 106,909
110,157 110,341
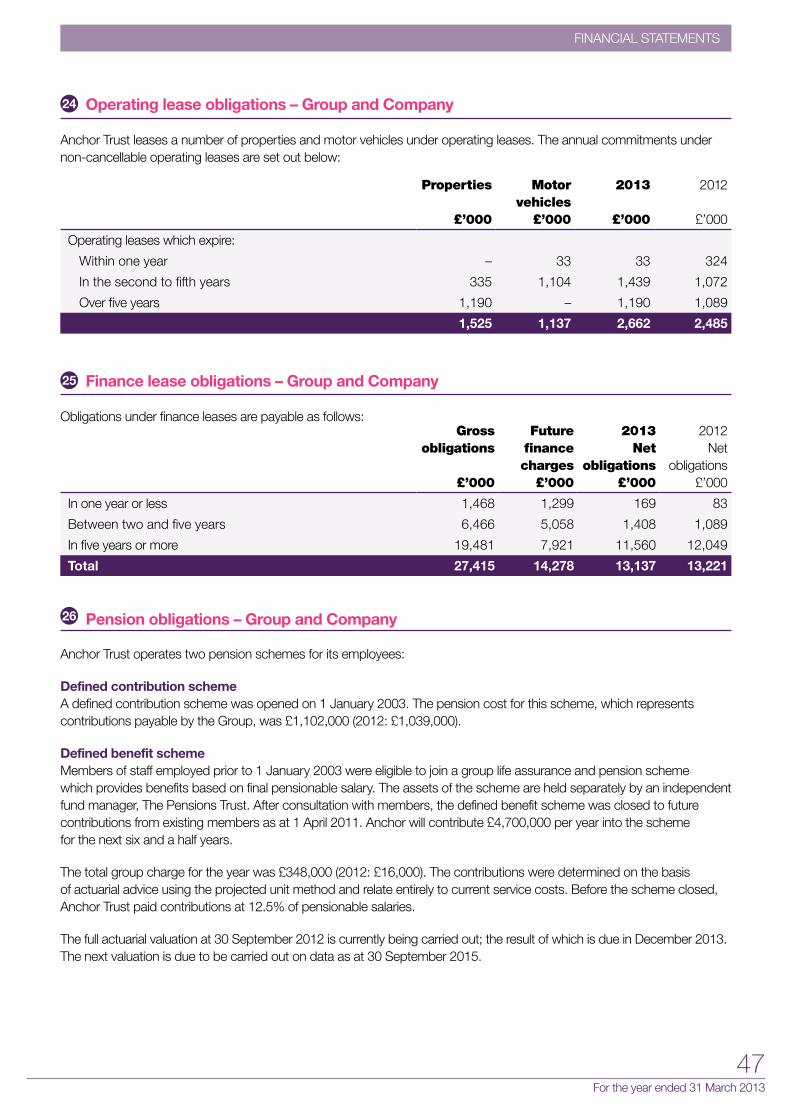
47For the year ended 31 March 2013
Financial StateMentS
24 Operating lease obligations – Group and Company
Anchor Trust leases a number of properties and motor vehicles under operating leases. The annual commitments under non-cancellable operating leases are set out below:
Properties
£’000
Motor vehicles
£’000
2013
£’000
2012
£’000
Operating leases which expire:
Within one year – 33 33 324
In the second to fifth years 335 1,104 1,439 1,072
Over five years 1,190 – 1,190 1,089
1,525 1,137 2,662 2,485
25 Finance lease obligations – Group and Company
Obligations under finance leases are payable as follows:Gross
obligations
£’000
Future finance charges
£’000
2013 Net
obligations £’000
2012 Net
obligations £’000
In one year or less 1,468 1,299 169 83
Between two and five years 6,466 5,058 1,408 1,089
In five years or more 19,481 7,921 11,560 12,049
Total 27,415 14,278 13,137 13,221
26 Pension obligations – Group and Company
Anchor Trust operates two pension schemes for its employees:
Defined contribution schemeA defined contribution scheme was opened on 1 January 2003. The pension cost for this scheme, which represents contributions payable by the Group, was £1,102,000 (2012: £1,039,000).
Defined benefit schemeMembers of staff employed prior to 1 January 2003 were eligible to join a group life assurance and pension scheme which provides benefits based on final pensionable salary. The assets of the scheme are held separately by an independent fund manager, The Pensions Trust. After consultation with members, the defined benefit scheme was closed to future contributions from existing members as at 1 April 2011. Anchor will contribute £4,700,000 per year into the scheme for the next six and a half years.
The total group charge for the year was £348,000 (2012: £16,000). The contributions were determined on the basis of actuarial advice using the projected unit method and relate entirely to current service costs. Before the scheme closed, Anchor Trust paid contributions at 12.5% of pensionable salaries.
The full actuarial valuation at 30 September 2012 is currently being carried out; the result of which is due in December 2013. The next valuation is due to be carried out on data as at 30 September 2015.
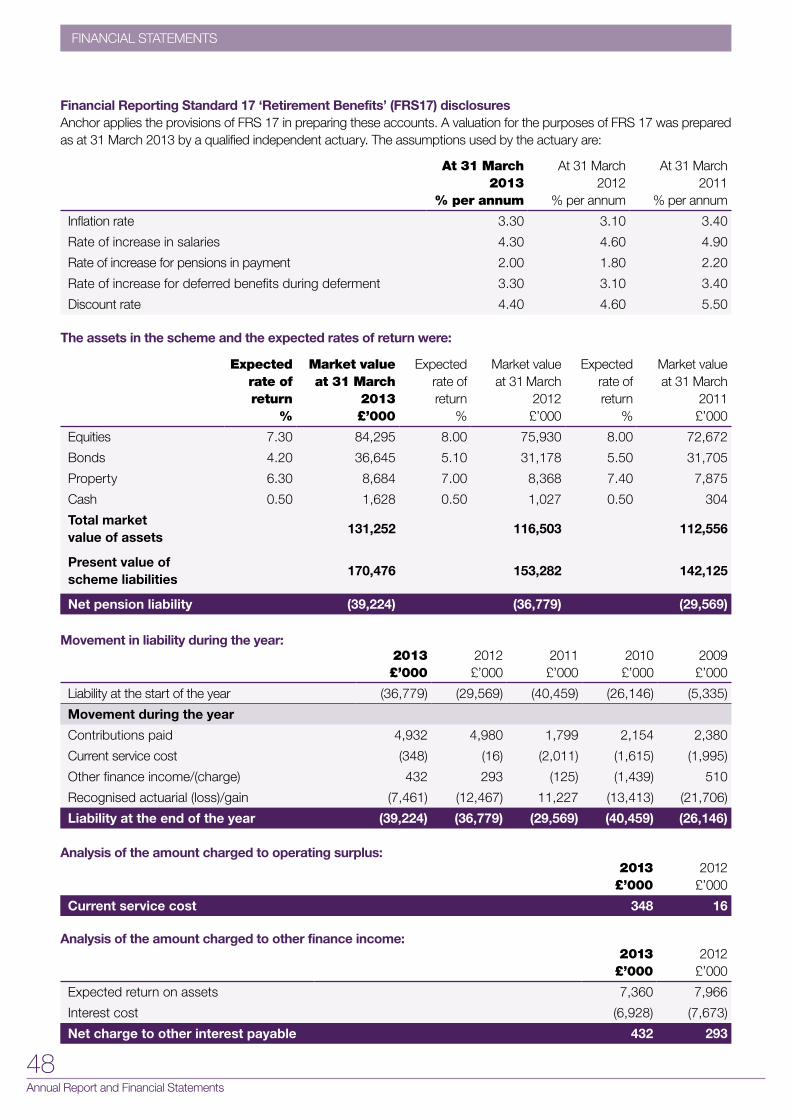
48Annual Report and Financial Statements
FinAnciAl StAtementS
Financial Reporting Standard 17 ‘Retirement Benefits’ (FRS17) disclosuresAnchor applies the provisions of FRS 17 in preparing these accounts. A valuation for the purposes of FRS 17 was prepared as at 31 March 2013 by a qualified independent actuary. The assumptions used by the actuary are:
At 31 March 2013
% per annum
At 31 March 2012
% per annum
At 31 March 2011
% per annum
Inflation rate 3.30 3.10 3.40
Rate of increase in salaries 4.30 4.60 4.90
Rate of increase for pensions in payment 2.00 1.80 2.20
Rate of increase for deferred benefits during deferment 3.30 3.10 3.40
Discount rate 4.40 4.60 5.50
Expected rate of return
%
Market value at 31 March
2013 £’000
Expected rate of return
%
Market value at 31 March
2012 £’000
Expected rate of return
%
Market value at 31 March
2011 £’000
Equities 7.30 84,295 8.00 75,930 8.00 72,672
Bonds 4.20 36,645 5.10 31,178 5.50 31,705
Property 6.30 8,684 7.00 8,368 7.40 7,875
Cash 0.50 1,628 0.50 1,027 0.50 304
Total market value of assets
131,252 116,503 112,556
Present value of scheme liabilities
170,476 153,282 142,125
Net pension liability (39,224) (36,779) (29,569)
The assets in the scheme and the expected rates of return were:
2013 £’000
2012 £’000
2011 £’000
2010 £’000
2009 £’000
Liability at the start of the year (36,779) (29,569) (40,459) (26,146) (5,335)
Movement during the year
Contributions paid 4,932 4,980 1,799 2,154 2,380
Current service cost (348) (16) (2,011) (1,615) (1,995)
Other finance income/(charge) 432 293 (125) (1,439) 510
Recognised actuarial (loss)/gain (7,461) (12,467) 11,227 (13,413) (21,706)
Liability at the end of the year (39,224) (36,779) (29,569) (40,459) (26,146)
Movement in liability during the year:
Analysis of the amount charged to operating surplus:2013
£’0002012
£’000
Current service cost 348 16
Analysis of the amount charged to other finance income:2013
£’0002012
£’000
Expected return on assets 7,360 7,966
Interest cost (6,928) (7,673)
Net charge to other interest payable 432 293
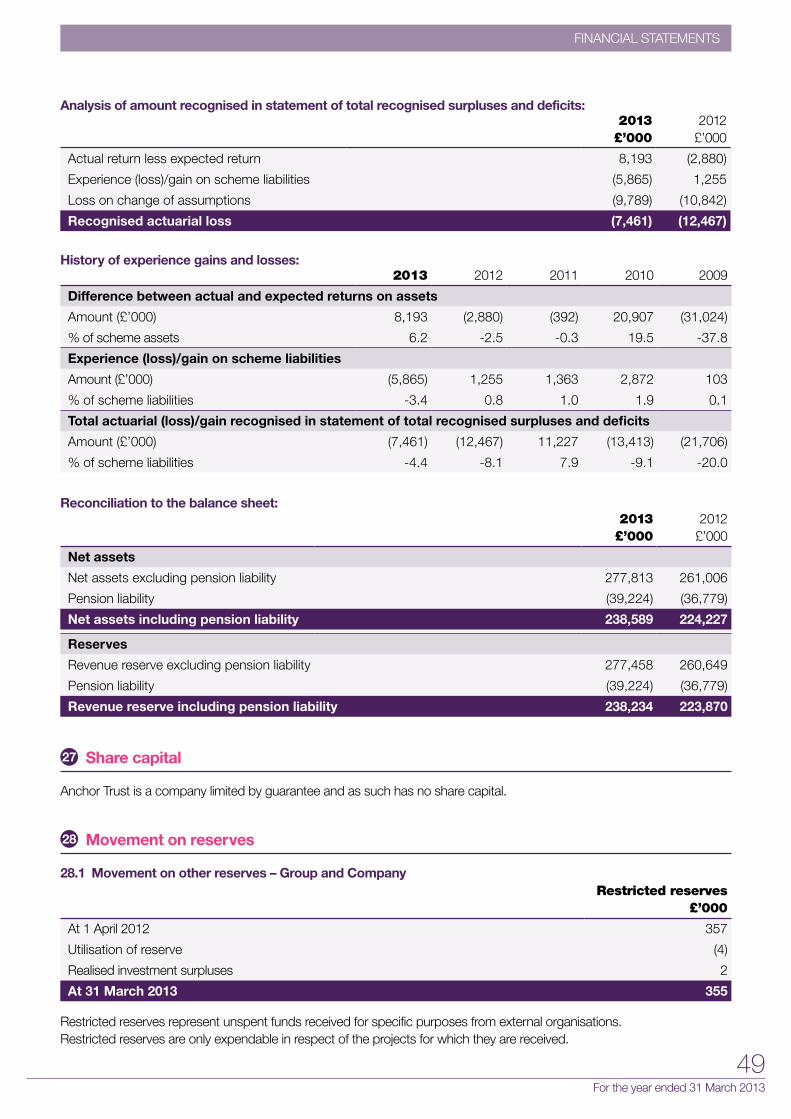
49For the year ended 31 March 2013
Financial StateMentS
Analysis of amount recognised in statement of total recognised surpluses and deficits:2013
£’0002012
£’000
Actual return less expected return 8,193 (2,880)
Experience (loss)/gain on scheme liabilities (5,865) 1,255
Loss on change of assumptions (9,789) (10,842)
Recognised actuarial loss (7,461) (12,467)
2013 2012 2011 2010 2009
Difference between actual and expected returns on assets
Amount (£’000) 8,193 (2,880) (392) 20,907 (31,024)
% of scheme assets 6.2 -2.5 -0.3 19.5 -37.8
Experience (loss)/gain on scheme liabilities
Amount (£’000) (5,865) 1,255 1,363 2,872 103
% of scheme liabilities -3.4 0.8 1.0 1.9 0.1
Total actuarial (loss)/gain recognised in statement of total recognised surpluses and deficits
Amount (£’000) (7,461) (12,467) 11,227 (13,413) (21,706)
% of scheme liabilities -4.4 -8.1 7.9 -9.1 -20.0
History of experience gains and losses:
Reconciliation to the balance sheet:2013
£’0002012
£’000
Net assets
Net assets excluding pension liability 277,813 261,006
Pension liability (39,224) (36,779)
Net assets including pension liability 238,589 224,227
Reserves
Revenue reserve excluding pension liability 277,458 260,649
Pension liability (39,224) (36,779)
Revenue reserve including pension liability 238,234 223,870
27 Share capital
Anchor Trust is a company limited by guarantee and as such has no share capital.
28 Movement on reserves
28.1 Movement on other reserves – Group and CompanyRestricted reserves
£’000
At 1 April 2012 357
utilisation of reserve (4)
Realised investment surpluses 2
At 31 March 2013 355
Restricted reserves represent unspent funds received for specific purposes from external organisations. Restricted reserves are only expendable in respect of the projects for which they are received.
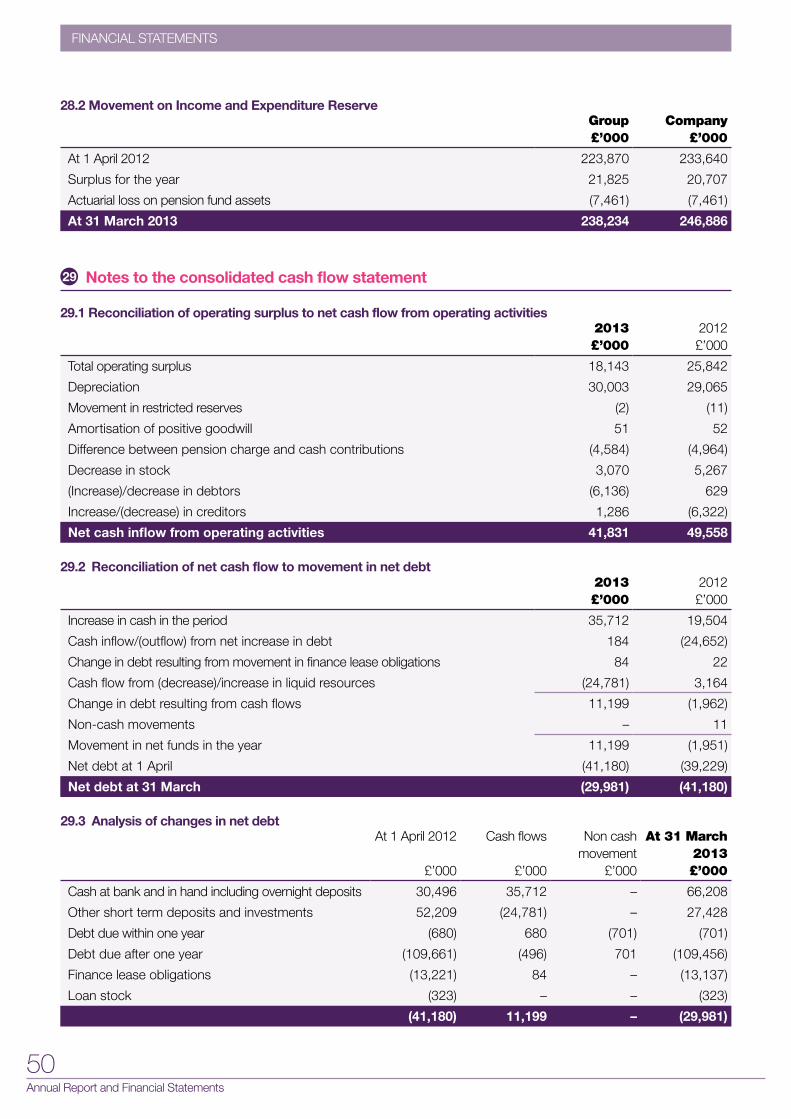
50Annual Report and Financial Statements
FinAnciAl StAtementS
28.2 Movement on Income and Expenditure ReserveGroup £’000
Company £’000
At 1 April 2012 223,870 233,640
Surplus for the year 21,825 20,707
Actuarial loss on pension fund assets (7,461) (7,461)
At 31 March 2013 238,234 246,886
2013 £’000
2012 £’000
Total operating surplus 18,143 25,842
Depreciation 30,003 29,065
Movement in restricted reserves (2) (11)
Amortisation of positive goodwill 51 52
Difference between pension charge and cash contributions (4,584) (4,964)
Decrease in stock 3,070 5,267
(Increase)/decrease in debtors (6,136) 629
Increase/(decrease) in creditors 1,286 (6,322)
Net cash inflow from operating activities 41,831 49,558
29 Notes to the consolidated cash flow statement
29.1 Reconciliation of operating surplus to net cash flow from operating activities
29.2 Reconciliation of net cash flow to movement in net debt2013 £’000
2012 £’000
Increase in cash in the period 35,712 19,504
Cash inflow/(outflow) from net increase in debt 184 (24,652)
Change in debt resulting from movement in finance lease obligations 84 22
Cash flow from (decrease)/increase in liquid resources (24,781) 3,164
Change in debt resulting from cash flows 11,199 (1,962)
Non-cash movements – 11
Movement in net funds in the year 11,199 (1,951)
Net debt at 1 April (41,180) (39,229)
Net debt at 31 March (29,981) (41,180)
29.3 Analysis of changes in net debtAt 1 April 2012
£’000
Cash flows
£’000
Non cash movement
£’000
At 31 March 2013 £’000
Cash at bank and in hand including overnight deposits 30,496 35,712 – 66,208
Other short term deposits and investments 52,209 (24,781) – 27,428
Debt due within one year (680) 680 (701) (701)
Debt due after one year (109,661) (496) 701 (109,456)
Finance lease obligations (13,221) 84 – (13,137)
Loan stock (323) – – (323)
(41,180) 11,199 – (29,981)
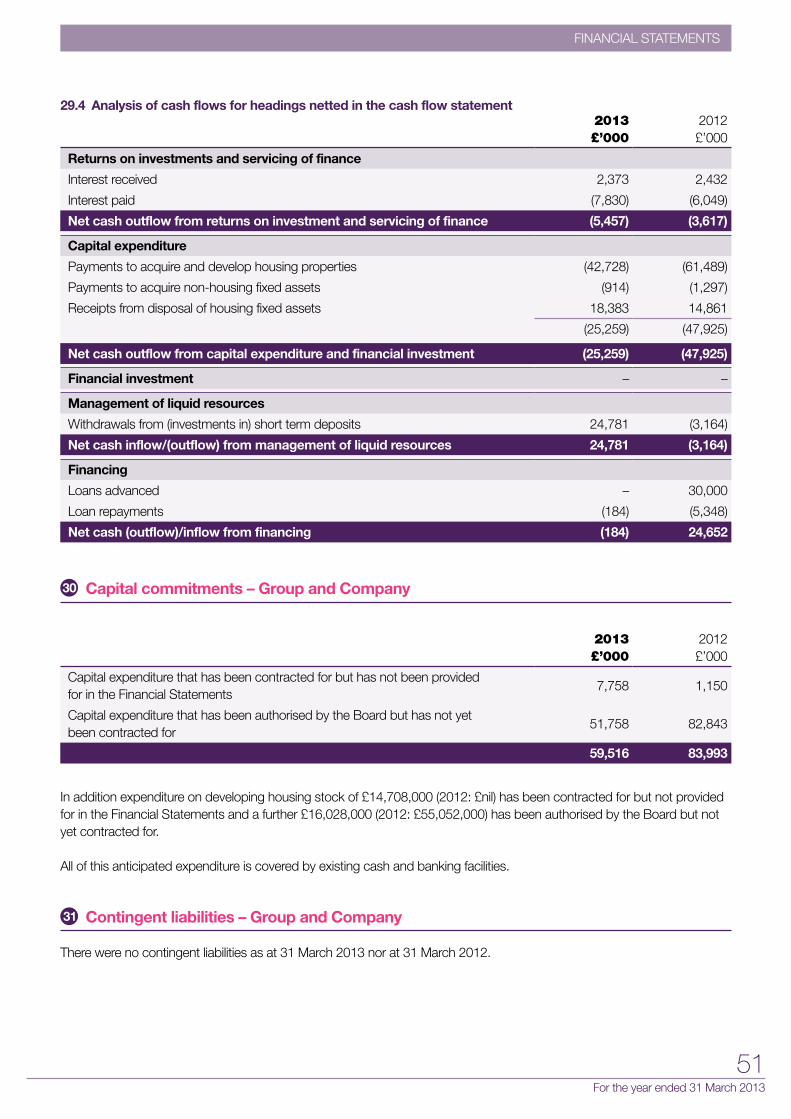
51For the year ended 31 March 2013
Financial StateMentS
29.4 Analysis of cash flows for headings netted in the cash flow statement 2013 £’000
2012 £’000
Returns on investments and servicing of finance
Interest received 2,373 2,432
Interest paid (7,830) (6,049)
Net cash outflow from returns on investment and servicing of finance (5,457) (3,617)
Capital expenditure
Payments to acquire and develop housing properties (42,728) (61,489)
Payments to acquire non-housing fixed assets (914) (1,297)
Receipts from disposal of housing fixed assets 18,383 14,861
(25,259) (47,925)
Net cash outflow from capital expenditure and financial investment (25,259) (47,925)
Financial investment – –
Management of liquid resources
Withdrawals from (investments in) short term deposits 24,781 (3,164)
Net cash inflow/(outflow) from management of liquid resources 24,781 (3,164)
Financing
Loans advanced – 30,000
Loan repayments (184) (5,348)
Net cash (outflow)/inflow from financing (184) 24,652
2013 £’000
2012 £’000
Capital expenditure that has been contracted for but has not been provided for in the Financial Statements
7,758 1,150
Capital expenditure that has been authorised by the Board but has not yet been contracted for
51,758 82,843
59,516 83,993
30 Capital commitments – Group and Company
In addition expenditure on developing housing stock of £14,708,000 (2012: £nil) has been contracted for but not provided for in the Financial Statements and a further £16,028,000 (2012: £55,052,000) has been authorised by the Board but not yet contracted for.
All of this anticipated expenditure is covered by existing cash and banking facilities.
31 Contingent liabilities – Group and Company
There were no contingent liabilities as at 31 March 2013 nor at 31 March 2012.

52Annual Report and Financial Statements
FinAnciAl StAtementS
32 Transactions with related parties
During the year Anchor Lifestyle Developments Limited made inter-group charges of £3,215,000 (2012: £421,000) in respect of interest on loans to Anchor Trust. Anchor 2020 Limited made inter-group charges of £668,000 (2012: £936,000) in respect of interest on loans, management charges and donations to Anchor Trust. In addition, Anchor Lifestyle Developments sales to Anchor Trust were £10,905,000 (2012: £nil) and Anchor 2020 Limited sales to Anchor Trust were £8,818,000 (2012: £16,404,000). All transactions between group companies are on normal commercial terms.
As at 31 March 2013, Anchor Trust was owed £12,788,000 and £2,164,000 (2012: £28,692,000 and £1,682,000) from Anchor Lifestyle Developments Limited and Anchor 2020 Limited respectively. Both these companies are 100% owned by Anchor Trust.
Transactions with Burnbank House Limited are described in Note 17.
There are no other related party transactions in the year to 31 March 2013 (2012: £nil).
33 Legislative provisions
Anchor Trust is registered under the following Acts:
Registration number
Companies Act 2006 3147851
Charities Act 1993 1052183
Housing Act 1996 LH4095
34 Post Balance Sheet Events – Group and Company
There were no post balance sheet events that require disclosure or adjustment to these Financial Statements.

53For the year ended 31 March 2013
Financial StateMentS

54Annual Report and Financial Statements
Aman Dalvi OBE Chairman
Aman is the Corporate Director of Development and Renewal at the London Borough of Tower Hamlets and is responsible for housing, regeneration, planning and building control, asset management, third sector and building schools for the future. Before he joined the council in 2008, Aman was Chief Executive of Gateway to London where he led the organisation in promoting and developing the
Thames Gateway area. He previously held senior roles in the Housing
Corporation and was Chief Executive of a London Housing Association.
Aman has been a Board member of the Olympic Park Legacy company and prior to that English Partnerships. He has also chaired a number of Registered Providers. He is currently a Non-Executive Director of ASRA
Housing Association.
THE BOARD
Lesley James CBE Chairman of the Executive Remuneration Committee
Lesley progressed through human resources roles with a number of retailers before joining Tesco in 1985. She became a main Board Director in 1994 with responsibility for all HR functions. Since leaving Tesco in 1999 Lesley has undertaken a range of non-executive roles in retail and customer service organisations, as well as with the Department for Trade and Industry and in charities. She is currently a Non-Executive Director of St Modwen Properties plc.
The Board
Paul Doona Trustee Director
Paul is a chartered accountant and was Finance Director and Company Secretary of St Modwen Properties plc from 1985 to 1999, managing the flotation and restructure of the company. After two years as Finance Director and then Chief Executive of Claims Direct plc, Paul undertook a number of chief executive and finance director roles in the gaming sector. Paul’s non-executive roles have encompassed various sectors including leisure, property, financial services, asset management and natural resources businesses.
Stephen Jack Chairman of Audit & Risk Committee
Stephen is a chartered accountant and has held a number of senior finance positions in international financial services organisations
including Dresdner Kleinwort Benson, ING Barings, and Collins Stewart Tullett plc (where he was Group Finance Director) and Compagnie Financière Tradition SA (where he was Group CFO). Since 2007, he has been the Chairman of the Independent Living Fund, a non-departmental public body sponsored by the Department for Work and Pensions, which provides support to nearly 18,000 disabled people across the uK. Stephen is the Interim Chair and the Treasurer of the Greater London Fund for the Blind, a charity which raises funds to support services delivered to visually impaired people living within
the bounds of the M25.

55For the year ended 31 March 2013
THE BOARD
Chris Wood Trustee Director
Chris has spent over 20 years of his career working in local government. He was Director of Housing in two London boroughs and then held the posts of Deputy and Chief Executive at the London Borough of Newham. Chris left local government in 2008 and for the last five years has worked as a partner with a housing and regeneration management consultancy company working with public and private sector clients. Chris is a Non-Executive Director of Sahara Homes (a private sector care provider for adults with learning disabilities), Fair Finance (a personal finance social enterprise) and Meridian Homestart (a housing
company wholly owned by the Royal Borough of Greenwich).
Rima Makarem Trustee Director
Rima has extensive experience in healthcare and the pharmaceutical industry. She currently runs her own interim management and consultancy business and holds a portfolio of non-executive positions. These include:
Non-Executive Director at university College London Hospitals; trustee of uCLH Charity; Associate Board member and Chair of the Risk Assurance Committee at Health Education
South London; and member of the Medical Research Council Audit Committee. She was until recently a Non-Executive Director and the Audit Chair at NHS London and at NHS Haringey before that. Previously Rima was Director of Competitive Excellence at GlaxoSmithKline and prior to that, a management consultant.
Angela Horsman Trustee Director
Angela is a marketing consultant with more than 25 years’ experience in leisure marketing and communications. She worked for Saga, the market leader in services for the over-50s, where she was Marketing Director for Saga Holidays and then Communications Director for the Saga Group. Angela was previously Marketing Director of London Zoo and Whipsnade Wild Animal Park and was Chief Executive of a tourism development action programme in Kent. Angela is a member of the Royal National Lifeboat Institution Council and its fundraising and communications committee. She is also a Trustee Director of The Brooke, an international animal welfare organisation dedicated to improving the lives of working horses, donkeys and mules in some of the world’s poorest communities.
Pamela Chesters CBE Trustee Director
Pamela joined the Board in April 2013. She is Chairman of Central London Community Healthcare Trust, and has also chaired the boards of the leading charity Action for Children and Royal Free Hampstead NHS Trust, one of the largest NHS trusts in the uK. She was Chairman of English Churches Housing Group from 2003 to 2009.
Pamela was a councillor at the London Borough of Camden from 1990 to 2000, including two years as leader of the opposition. In her executive roles, she was London Mayor Boris Johnson’s Advisor for Health & Families between 2009 and 2012. Prior to that, she spent nearly 20 years at British Petroleum Company, most recently as CEO of Duckhams Oils. Pamela will take up the role of Chairman of Anchor from September 2013.
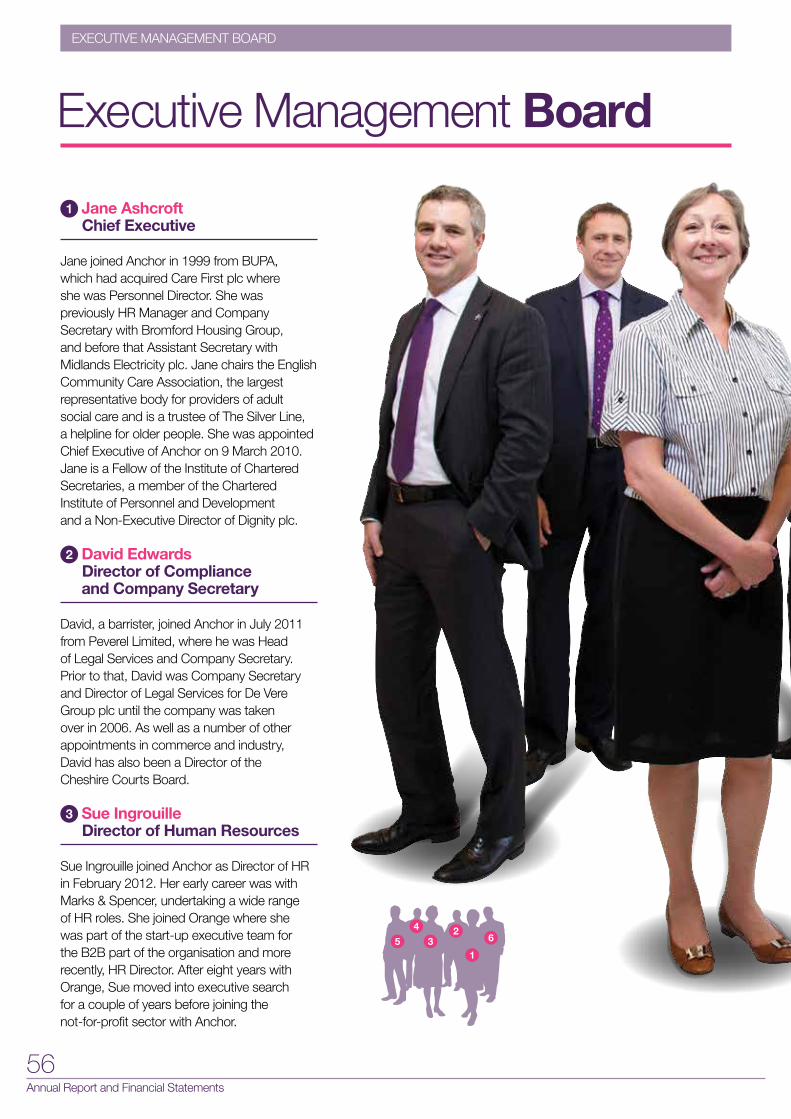
56Annual Report and Financial Statements
Executive Management Board
1 Jane Ashcroft Chief Executive
Jane joined Anchor in 1999 from BuPA, which had acquired Care First plc where she was Personnel Director. She was previously HR Manager and Company Secretary with Bromford Housing Group, and before that Assistant Secretary with Midlands Electricity plc. Jane chairs the English Community Care Association, the largest representative body for providers of adult social care and is a trustee of The Silver Line, a helpline for older people. She was appointed Chief Executive of Anchor on 9 March 2010. Jane is a Fellow of the Institute of Chartered Secretaries, a member of the Chartered Institute of Personnel and Development and a Non-Executive Director of Dignity plc.
2 David Edwards Director of Compliance and Company Secretary
David, a barrister, joined Anchor in July 2011 from Peverel Limited, where he was Head of Legal Services and Company Secretary. Prior to that, David was Company Secretary and Director of Legal Services for De Vere Group plc until the company was taken over in 2006. As well as a number of other appointments in commerce and industry, David has also been a Director of the Cheshire Courts Board.
3 Sue Ingrouille Director of Human Resources
Sue Ingrouille joined Anchor as Director of HR in February 2012. Her early career was with Marks & Spencer, undertaking a wide range of HR roles. She joined Orange where she was part of the start-up executive team for the B2B part of the organisation and more recently, HR Director. After eight years with Orange, Sue moved into executive search for a couple of years before joining the not-for-profit sector with Anchor.
ExECuTIVE MANAGEMENT BOARD
1
23
4
5 6
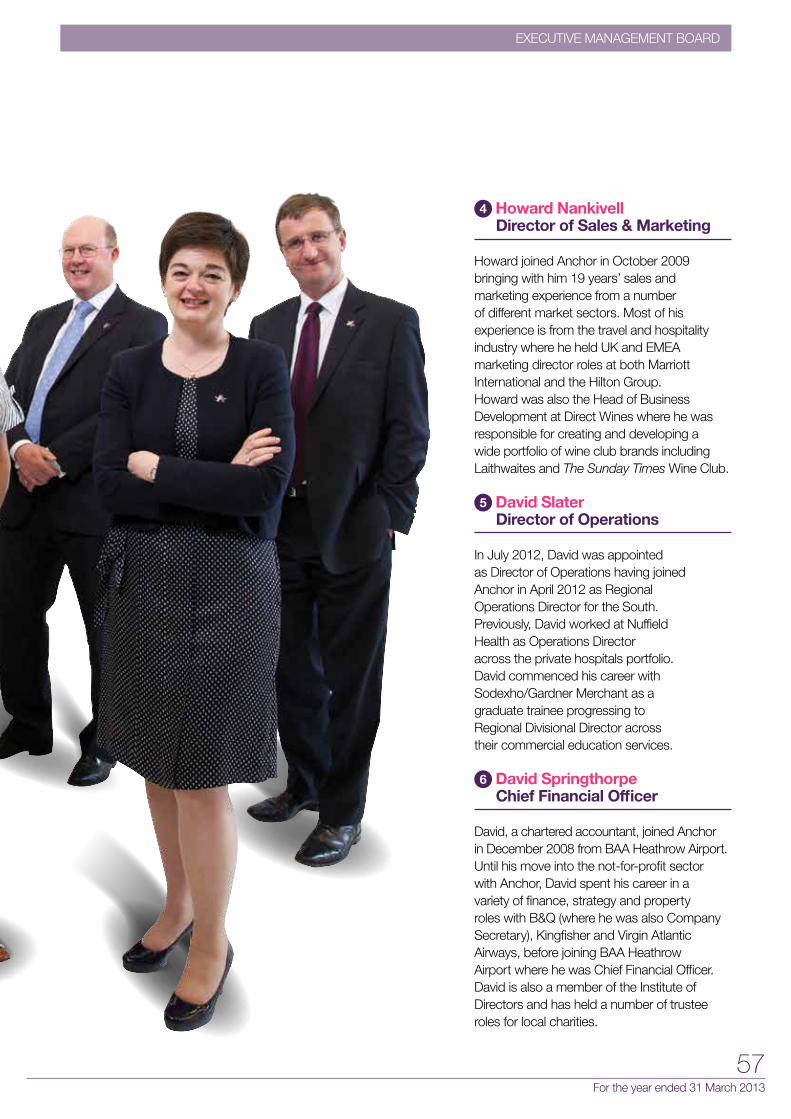
57For the year ended 31 March 2013
ExECuTIVE MANAGEMENT BOARD
4 Howard Nankivell Director of Sales & Marketing
Howard joined Anchor in October 2009 bringing with him 19 years’ sales and marketing experience from a number of different market sectors. Most of his experience is from the travel and hospitality industry where he held uK and EMEA marketing director roles at both Marriott International and the Hilton Group. Howard was also the Head of Business Development at Direct Wines where he was responsible for creating and developing a wide portfolio of wine club brands including Laithwaites and The Sunday Times Wine Club.
5 David Slater Director of Operations
In July 2012, David was appointed as Director of Operations having joined Anchor in April 2012 as Regional Operations Director for the South. Previously, David worked at Nuffield Health as Operations Director across the private hospitals portfolio. David commenced his career with Sodexho/Gardner Merchant as a graduate trainee progressing to Regional Divisional Director across their commercial education services.
6 David Springthorpe Chief Financial Officer
David, a chartered accountant, joined Anchor in December 2008 from BAA Heathrow Airport. until his move into the not-for-profit sector with Anchor, David spent his career in a variety of finance, strategy and property roles with B&Q (where he was also Company Secretary), Kingfisher and Virgin Atlantic Airways, before joining BAA Heathrow Airport where he was Chief Financial Officer. David is also a member of the Institute of Directors and has held a number of trustee roles for local charities.

58Annual Report and Financial Statements
THE ANCHOR COMMuNITY BAND
More than 350 people from Anchor’s retirement housing and care homes have been involved in recording a new song inspired by the wisdom and experiences of older people across the country.
The Anchor Community Band’s ‘See Yourself’ was released in June 2013 to raise money for the national charity Contact the Elderly, which aims to combat the loneliness faced by many older people aged 75 and over who live alone.
Search for ‘Anchor Community Band’ on YouTube or call our customer centre on 0845 140 2020 for more information.

59For the year ended 31 March 2013
AccessibilityThis document can be made available in large print, Braille, audio or electronic formats, or other languages on request.
Contact our Customer Participation Officer on 01274 381 654
ACCESSIBILITY
Thanks
Many thanks to all the Anchor customers and colleagues featured in this document.
• Front cover: Colleague uzma Shaheen and customer Gwendolyn Pogson at Kerria Court, Birmingham
• Page 6: Colleague Margaret Carr and customer Alan Davidson, Beverley Court, Gateshead
• Page 8: Customer Stanley Rose, Linwood, Thames Ditton• Page 9: Customer Elizabeth Moore (Mary), Annesley
Lodge, Nottingham• Page 11: Customer Olive Moorhouse and colleague
Debbie Lewis, Schofield Court, Morley• Page 13: Colleague Delaine Hyde and customer William
Rooke, Kerria Court, Birmingham• Page 14: Customer Frank Kioseff, Schofield Court, Morley• Page 15: Customer Pam Holmes, Palm Court, Prenton• Page 16: Customers Edna King and Marie Rapson,
Annesley Court, Hucknall, Nottingham; Customer Alice
Jeffcoate and colleague Mary Tate, Schofield Court, Morley• Page 18: Customers Jean Wilson and Joyce Greener,
Beverley Court, Gateshead; Customer Freddie Cranmer-Brown, Denham Garden Village, Buckinghamshire
• Page 21: Colleague Karim Taoujni and customer Kay Louca, Fairmead, Woking
• Page 22: Customers (left to right) Mary Linley, Kath Sharp and Rod Sharp, Schofield Court, Morley
• Back cover: Customer Mildred Marchant with colleague Sarah Gess, Linwood, Thames Ditton; Customer Halima Jokhia, Ashiana Lodge, Nelson and colleague Paul Campbell, Pembroke Court, Stockport; Customer Mary Fenwick, Beverley Court, Gateshead; Customers Howard Hyman, Fullers Court, Gloucester and David Hart, Knights Court, Basildon

Anchor, 2nd Floor, 25 Bedford Street, London WC2E 9ESTel: 020 7759 9100 www.anchor.org.uk
Company Number: 3147851Registered Charity Number: 1052183 (England and Wales)
Housing Association Number: LH4095