Embed Size (px)
Citation preview

1Past performance is no guarantee of future results. Financial term and index definitions are available in the appendix.
The Anatomy of a Recession: What to Look for and Where We’re Headed
First Quarter 2020
Investment Products: Not FDIC Insured • No Bank Guarantee • May Lose Value

2
Probabilities vs. PossibilitiesThe Wall of Worry
Middle East Geopolitics Junk Bond Collapse
Trade Wars North Korea Escalation
U.S. Recession Brexit Sovereign Debt Crisis
Earnings Recession Dollar Strengthens
Eurozone Breakup China Hard Landing
Populism EM Problems Intensify

3
Panic Attacks
Data as of Dec. 31, 2019. Source: MSCI. Past performance is not a guarantee of future results. Investors cannot invest directly in an index, and unmanaged index returns do not reflect any fees, expenses or sales charges.
400
500
600
700
2015 2016 2017 2018 2019 2020
MSCI ACWI
Trade War
Accelerates
Tariffs Scheduled for Last $300B of
Imports
Renewed Grexit Scare
Oil Falls, Dollar Rises
Greece Sets 7/5 Vote
Yuan Devalued & ETF Flash Crash
Third Ave Blows Up
EndgamePanic
Brent Bottoms at $27.88
JapanGoesNIRP
WTIBottoms
Brexit
RateHike
Scare
TrumpImpeachment
Scare
N. KoreaCrisis
ShortVolatilityUnwind
Trade WarEscalation
QuitalyFears Fed
Communication Error
U.S. Gov’tShutdown
2/10 YieldCurveInversion
“The definition of insanity is doing the same thing over and over again and expecting a different result.” - Attributed to Albert Einstein

4
Effects of Panic Attacks on Average Investors20 Years Annualized Returns (1999-2018)
Source: Bloomberg, June 30, 2019. Average asset allocation investor return is based on an analysis by DALBAR, Inc., which utilizes the net of aggregate mutual fund sales, redemptions and exchanges each month as a measure of investor behavior. Indices shown are as follows: REITs are represented by the NAREIT Equity REIT Index, U.S. Stocks are represented by the S&P 500 Index, International Equities are represented by the MSCI EAFE Index, Government-Related Bonds are represented by the Bloomberg Barclays U.S. Aggregate Bond Index, Homes are represented by U.S. existing home sales median price, Gold is represented by the U.S. dollar spot price of one troy ounce, Inflation is represented by the Consumer Price Index. Indices are unmanaged and cannot be purchased directly by investors. Index performance is shown for illustrative purposes only and does not predict or depict the performance of any investment. Past performance is no guarantee of future results.
9.9%
7.7%
5.6%
4.5%4.0%
3.4%
2.2%1.9%
0
2
4
6
8
10
12
REITs Gold U.S. Stock GovernmentRelated Bonds
InternationalEquities
Homes Inflation Average Investor
Investment Returns

5
S&P 500 Market Crashes vs. PullbacksCrashes are longer, more extreme, and more likely to be followed by a recession
Market Crashes defined as decline of 20% or greater in S&P 500 lasting at least 1 year. Pullbacks defined as declines of 15% or greater in S&P 500 (no time component). 1987 decline persisted at 20% or greater loss 1 year after Aug. 1987 peak despite trough coming in Dec. 1987. Source: S&P, NBER, and Bloomberg. Past performance is not a guarantee of future results. Investors cannot invest directly in an index, and unmanaged index returns do not reflect any fees, expenses or sales charges.
Market Crashes
Peak Trough Days S&P 500 Recession
Nov. 1968 May 1970 543 -36% Yes
Jan. 1973 Oct. 1974 630 -48% Yes
Nov. 1980 Aug. 1982 621 -27% Yes
Aug. 1987 Dec. 1987 101 -34% No
March 2000 Oct. 2002 929 -49% Yes
Oct. 2007 March 2009 517 -57% Yes
Average 557 -42% 83%
Pullbacks
Peak Trough Days S&P 500 Recession
Sept. 1976 March 1978 531 -19% No
Feb. 1980 March 1980 43 -17% Yes
July 1990 Oct. 1990 87 -20% Yes
July 1998 Oct. 1998 83 -19% No
April 2010 July 2010 70 -16% No
April 2011 Oct. 2011 157 -19% No
Sept. 2018 Dec. 2018 82 -19% No
Average 150 -18% 29%
557
150
Days
3.7x longer than a pullback
-42%
-18%
S&P 500 Drawdown
Market Crashes Pullbacks
2.3x assevere
83%
29%
Recession Probability
2.9x more likely to coincide with a recession

6
Strength of Economic Expansions
Data as of Sept. 30, 2019, most recent available as of Dec. 31, 2019. Source: FactSet, Bureau of Economic Analysis. U.S. economic expansions since 1948. Past performance is not a guarantee of future results. Investors cannot invest directly in an index, and unmanaged index returns do not reflect any fees, expenses or sales charges.
Current ExpansionHistorical Expansions
Average Rebound: 23%
2007 - Present
1948 - 1953
1960 - 1969
1969 - 19731973 - 1980
1981 - 1990
1990 - 2001
2001 - 2007
-10
0
10
20
30
40
50
60
0 5 10 15 20 25 30 35 40 45 50
Cum
ulat
ive
% G
row
th
Number of Quarters
7
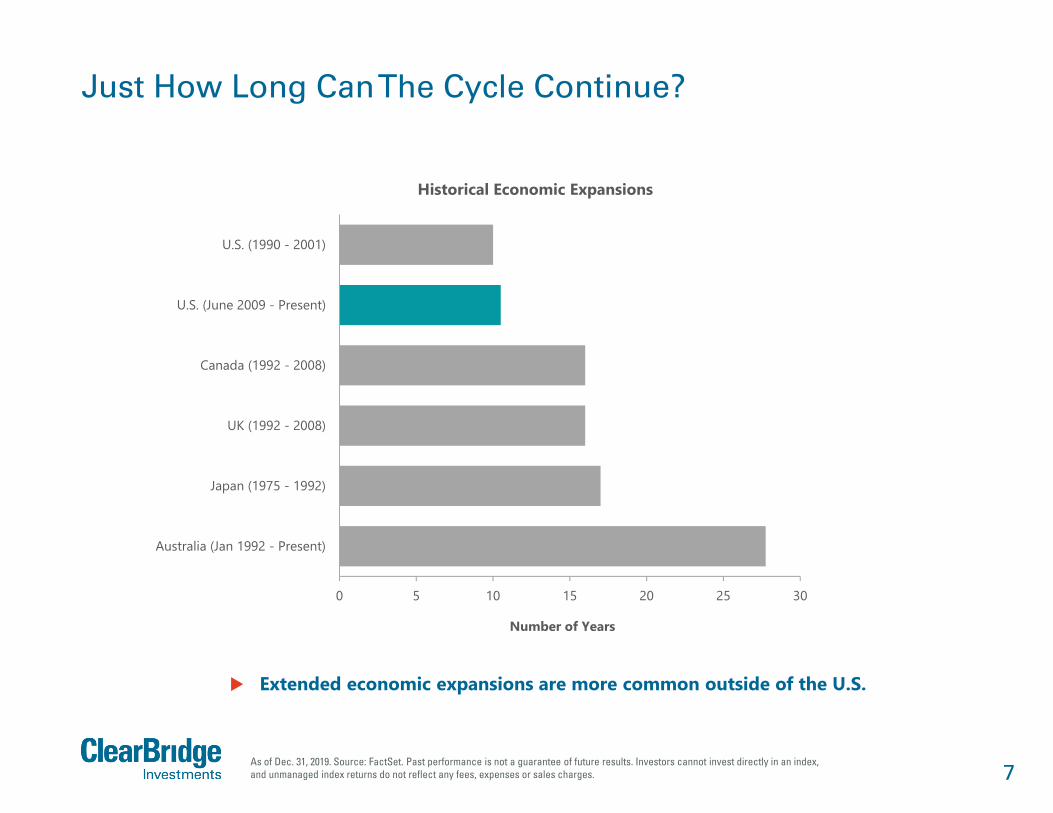
Just How Long Can The Cycle Continue?
As of Dec. 31, 2019. Source: FactSet. Past performance is not a guarantee of future results. Investors cannot invest directly in an index, and unmanaged index returns do not reflect any fees, expenses or sales charges.
0 5 10 15 20 25 30
Australia (Jan 1992 - Present)
Japan (1975 - 1992)
UK (1992 - 2008)
Canada (1992 - 2008)
U.S. (June 2009 - Present)
U.S. (1990 - 2001)
Number of Years
Historical Economic Expansions
Extended economic expansions are more common outside of the U.S.

8
U.S. Recession Risk Indicators
Data as of Dec. 31, 2019. Source: BLS, Federal Reserve, Census Bureau, ISM, BEA, American Chemistry Council, American Trucking Association, Conference Board, and Bloomberg. The ClearBridge Recession Risk Dashboard was created in January 2016. References to the signals it would have sent in the years prior to January 2016 are based on how the underlying data was reflected in the component indicators at the time.
• 12 variables have historically foreshadowed a looming recession• The overall signal suggests caution
Fourth Quarter 2019 Third Quarter 2019 Second Quarter 2019Fi
nanc
ial Yield Curve
Credit Spreads
Money Supply
Infla
tion Wage Growth
Commodities
Cons
umer
Housing Permits
Jobless Claims
Retail Sales
Job Sentiment
Busi
ness
Ac
tivity
ISM New Orders
Profit Margins
Truck Shipments
Overall Signal
Expansion Caution Recession

9
U.S. Recession Risk Indicators
Data as of Dec. 31, 2019. Source: BLS, Federal Reserve, Census Bureau, ISM, BEA, American Chemistry Council, American Trucking Association, Conference Board, and Bloomberg. The ClearBridge Recession Risk Dashboard was created in January 2016. References to the signals it would have sent in the years prior to January 2016 are based on how the underlying data was reflected in the component indicators at the time.
• 12 variables have historically foreshadowed a looming recession
• The overall signal suggests caution
Recession
Current 2007-2009 2001 1990-1991 1981-1982 1980 1973-1975 1969-1970
Fina
ncia
l Yield Curve
Credit Spreads
Money Supply
Infla
tion Wage Growth
Commodities
Cons
umer
Housing Permits
Jobless Claims
Retail Sales
Job Sentiment
Busi
ness
Activ
ity
ISM New Orders
Profit Margins
Truck Shipments n/a n/a
Overall
Expansion Caution Recession

10
U.S. Recession DashboardCase Study: 2006-2009
Source: BLS, Federal Reserve, Census Bureau, ISM, BEA, American Chemistry Council, American Trucking Association, Conference Board, and Bloomberg. The ClearBridge Recession Risk Dashboard was created in January 2016. References to the signals it would have sent in the years prior to January 2016 are based on how the underlying data was reflected in the component indicators at the time.
1,270
1,418
1,5031,468
1,280
600
800
1,000
1,200
1,400
1,600
Q2 2006 Q4 2006 Q2 2007 Q4 2007 Q2 2008
S&P
500
Overall Signal:
Overall Signal:
Overall Signal:
Fina
ncia
l Yield Curve
Credit Spreads
Money Supply
Infla
tion Wage Growth
Commodities
Cons
umer
Housing Permits
Jobless Claims
Retail Sales
Job Sentiment
Busi
ness
A
ctiv
ity
ISM New Orders
Profit Margins
Truck Shipments

11
Yield Curve Spread10-Year Treasury Bonds Minus 3-Month T Bills
Data as of Dec. 31, 2019. BPS = Basis Points, one hundredth of one percent. Source: Fed Reserve Bank of St. Louis, retrieved from FRED. Compiled: econpi.com. Past performance is not a guarantee of future results. Investors cannot invest directly in an index, and unmanaged index returns do not reflect any fees, expenses or sales charges.
0
100
200
300
400
500
600
1985 1990 1995 2000 2005 2010 2015-100
0
100
200
300
400
500
Recession Yield Curve Spread
Yield curve spread less than zero (inverted) occurs prior to recessions.
Basi
s Po
ints
(BPS
)
The yield curve typically un-inverts ahead of a recession. At the onset of the prior 3 recessions, the yield curve was 68 bps steep on average.

12
Shadow Fed Funds Rate
Data as of Dec. 31, 2019. Source: Wu and Xia (2015), Board of Governors of the Federal Reserve System (U.S.). Past performance is not a guarantee of future results. Investors cannot invest directly in an index, and unmanaged index returns do not reflect any fees, expenses or sales charges.
0
200
400
600
800
1,000
1,200
1,400
1960 1964 1969 1974 1979 1984 1989 1993 1998 2003 2008 2013 2018
Basi
s Po
ints
(BPS
)
Cumulative Fed Tightening
Series2Recession
When considering the impact of QE and forward guidance, Fed policy is muchtighter than indicated by the Fed Funds rate alone.
Since 1950, the average low in ISM Manufacturing has been 40.5 following ratehikes vs. 49.0 without them, suggesting further weakness ahead.

13
Has the Fed Saved the Day?
Source: BMO Investment Strategy Group, FRB, FactSet.Past performance is not a guarantee of future results. Investors cannot invest directly in an index, and unmanaged index returns do not reflect any fees, expenses or sales charges.
Rece
ssio
n
So
ft L
andi
ng
S&P 500 Performance Following Third Fed Rate Cut
Date of Third Fed Cut +3 Months +6 Months +12 Months +18 Months
Jan. 31, 1996 2.9% 0.6% 23.6% 50.0%
Nov. 17, 1998 7.4% 17.6% 23.8% 27.1%
Average 5.2% 9.1% 23.7% 38.6%
March 20, 2001 7.0% -13.8% 0.8% -26.0%
Dec. 11, 2007 -10.6% -9.6% -40.9% -36.1%
Average -1.8% -11.7% -20.1% -31.1%
Equity performance in the six months following the Fed's third rate cut can be an important barometer of recessionary risk.

14
Bear Case: Recession

15
Trade Wars Have Hurt Business Confidence
Data as of Dec. 31, 2019. Source: ISM, The Conference Board. Past performance is not a guarantee of future results. Investors cannot invest directly in an index, and unmanaged index returns do not reflect any fees, expenses or sales charges.
35
40
45
50
55
60
20
25
30
35
40
45
50
55
60
65
70
75
2005 2006 2007 2008 2009 2010 2011 2012 2013 2014 2015 2016 2017 2018 2019
ISM M
anufacturing IndexCEO
Bus
ines
s Co
nfid
ence
CEO Business Confidence (LHS) ISM, NAPM, Manufacturing, Purchasing Managers Index - United States (RHS)
FirstTariffs
Implemented
Lower business confidence could lead to slower economic growth.

16
Profit Margins Under Pressure
BEA = Bureau of Economic Analysis. Data as of Dec. 31, 2019. Source: U.S. Bureau of Labor Statistics. Past performance is not a guarantee of future results. Investors cannot invest directly in an index, and unmanaged index returns do not reflect any fees, expenses or sales charges.
1-19
20-49
50-499500-999
41%1000+
Employees
% of Workforce by Employer Size
Companies with fewer than 1000 workers employ 59% of the U.S. labor force. The average company in the Russell 2000 employs 3,679 workers.
July’s BEA revisions show that corporate profits have been flat for over 5 years and many small businesses are struggling to combat higher compensation costs.
59%<1000 Employees
500
750
1,000
1,250
1,500
1,750
2,000
2,250
1995 1998 2001 2004 2007 2010 2013 2016 2019$
(Bill
ions
)
U.S. Corporate Profits
RecessionCorp. Profits (Prior to Jul. 2019 Revision)Corp. Profits (Post Revision)

17
Corporations Have Been the Largest Buyers of Equities
Data as of Sept. 30, 2019, latest available as of Dec. 31, 2019. Source: Federal Reserve Bank, Deutsche Bank. Past performance is not a guarantee of future results. Investors cannot invest directly in an index, and unmanaged index returns do not reflect any fees, expenses or sales charges.
-3 -2 -1 0 1 2 3 4 5
Households
Pensions
Mutual Funds
Foreign Sectors
Other Domestic Buyers
ETFs
Non-Financial Corporations
Trillions ($)
Cumulative Equity Flows Since 2Q 2009
One of the key drivers of the current rally has been corporate buybacks. While tax cuts boosted buybacks in 2018 and 2019, a slowing pace of repatriation could
dampen share repurchases in the upcoming year.

18
Bull Case: Slowdown

19
S&P 500 Annual Returns, Recession Risk Indicators, and Select Economic Data as of December 31
1994 1995 1996 2018 2019 2020
S&P 500 Price Return
Overall Dashboard
Signal (Year End) ?
Real GDP YoY 4.0% 2.2% 3.8% 3.0% 2.3%* ?
Earnings 19% 28% 10% 20% 2.4% ?P/E Change (3.0x) 1.9x 1.0x (3.7x) 4.8x ?
Expansion Caution Recession
• Weak P/Es dragged the market down in 1994 despite strong earnings and economic growth. • The market bounced back in 1995, and despite a growth slowdown, a recession was ultimately averted after the
Fed cut rates and the market rally continued into 1996.
Historical Perspective: 1994-1996
*2019 GDP data is Bloomberg consensus. Data as of Dec. 31, 2019. Returns and economic data source: FactSet. Dashboard: BLS, Federal Reserve, Census Bureau, ISM, BEA, American Chemistry Council, American Trucking Association, Conference Board, and Bloomberg.
S&P 500 data: Total Price Return. Past performance is not a guarantee of future results. Investors cannot invest directly in an index, and unmanaged index returns do not reflect any fees, expenses or sales charges.
-1.5%
34.1%
20.1%
-6.2%
28.8%
???

20
Global Central Banks Are in Easing Mode
As of Nov. 30, 2019, most recent as of Dec. 31, 2019. Source: Bank for Int’l Settlements. Past performance is not a guarantee offuture results. Investors cannot invest directly in an index, and unmanaged index returns do not reflect any fees, expenses or sales charges.
0%
74%
26%
0
10
20
30
40
50
60
70
80
Hiking On Hold Cutting%
Current Breakdown as of November 30, 2019
42%
58%
0%0
10
20
30
40
50
60
70
80
Hiking On Hold Cutting
%
Breakdown as of December 31, 2018
Global central banks have reversed course in 2019, which should help loosen financial conditions.

21
Leverage Does Not Look Recessionary
Source: J.P. Morgan, IMF. Note: 5-Year Change in Household Debt to GDP & Non-Financial Corporate Debt to GDP. Past performance is not a guarantee of future results. Investors cannot invest directly in an index, and unmanaged index returns do not reflect any fees, expenses or sales charges.
While Corporations Have Taken on Additional Debt, Households Appear to Have Delevered
-10%
-5%
0%
5%
10%
15%
20%
25%
30%
1970 1973 1979 1981 1990 2000 2007 Q2 2019
5-Ye
ar C
hang
e in
Deb
t to
GD
P
Non-Financial Corporate Debt to GDP Household Debt to GDP Net Amount of Non-Financial and Household Debt
Total household and corporate leverage has risen 2.0%over the past 5 years,
much less than the 15% averageahead of previous recessions.
Average

22
Job Openings vs. Unemployed
Data as of Nov. 30, 2019, latest available as of Dec. 31, 2019. Source: FactSet, DOL, NBER. Past performance is not a guarantee of future results. Investors cannot invest directly in an index, and unmanaged index returns do not reflect any fees, expenses or sales charges.
0
2
4
6
8
10
12
14
16
18
2001 2003 2005 2007 2009 2011 2013 2015 2017 2019
Thou
sand
s
Recession
Job Openings, Non-Farm, US, Level, In Thous, SA, JOLTS - United States
Unemployment, Thous Persons - United States
7:1 Ratio
1:1 Ratio
At the peak in 2009, there were seven unemployed people for every job opening. Today, the ratio is less than 1:1.

23
Households Assets vs. Liabilities
1As of Date: Sept. 30, 2019, latest available as of Dec. 31, 2019. Source: Federal Reserve. Assets vs. Liabilities of households and nonprofit organizations. Past performance is not a guarantee of future results. Investors cannot invest directly in an index, and unmanaged index returns do not reflect any fees, expenses or sales charges.
Other LiabilitiesReal Estate
Deposits
Equities
Pensions
Other
$0
$25
$50
$75
$100
$125
$ Tr
illio
ns
Total Assets: $130 Trillion
U.S. Households Assets
Total Liabilities:$16 Trillion
Consumer CreditHome Mortgages
0%
5%
10%
15%
20%
25%
1952 1959 1966 1973 1981 1988 1995 2002 2010 2017
% o
f Tot
al A
sset
s
U.S. Households Leverage1
American households are in a strong financial position with robust balance sheets. Household leverage is the lowest it has been since 3Q 1984.

24
Flow Mismatch Could Propel Equities in 2020
Data as of Dec. 31, 2019. Source: JP Morgan. Past performance is not a guarantee of future results. Investors cannot invest directly in an index, and unmanaged index returns do not reflect any fees, expenses or sales charges.
-250
-50
150
350
550
750
950
2006 2007 2008 2009 2010 2011 2012 2013 2014 2015 2016 2017 2018 2019 2020
Net
Flo
ws
($ B
illio
ns)
Equity Fixed Income
1. Following periods of market volatility, investors flee stocks in favor of bonds.
2. As the market recovers, the fear of missing out replaces the fear of recession, attracting flows back into equities.
The $1.1T difference between fixed income and equity flows in 2019 is the largest gap in history.
There is currently $3.6 trillion in money market mutual funds today, up 22% year over year.
?
12
S&P 500 Returns 2.1% 16.0% 32.4% 1.4% 12.0% 21.8% -4.4% 31.5% ?Maximum Intra-Year Drawdown -18.6% -9.6% -5.6% -12.0% -10.3% -2.6% -19.4% -6.6% ?

25
Final Stages of Bull Markets Tend to Be StrongMissing the “Final” Bull Market Run-Up Could Be Quite Painful
Current Bull Market as of Dec. 31, 2019. Source: FactSet. Past performance is not a guarantee of future results. Investors cannot invest directly in an index, and unmanaged index returns do not reflect any fees, expenses or sales charges.
31%
16%
11%
9%
20%
29%
9%
12%
0%
5%
10%
15%
20%
25%
30%
35%
Last 2 Years Last Year Last 6 Months Last 3 Months
S&P
500
Retu
rn
Median S&P 500 Return at the End of Bull Markets Before Recessions (Since 1930) Current Market (as of 12/31/2019)
Since 1930, equities have rallied over 30% in the two years leading up to a recession suggesting further potential upside.

26
One Year OutlookThemes That Will Drive the Market Over the Next 12 Months
CurrencyInternationalU.S. Presidential
Agenda Negative Rates
Volatility ValuationsDebt Sentiment

27
U.S. Presidential Agenda

28
Presidential Cycle: The Economy
Source: Strategas Research Partners. Past performance is not a guarantee of future results. Investors cannot invest directly in an index, and unmanaged index returns do not reflect any fees, expenses or sales charges.
6
1
0
4
0
1
2
3
4
5
6
7
Year 1 Year 2 Year 3 Year 4
Number of Recessions Starting Per Year of the Presidential Cycle1948 – 2016
Since 1948, no recession has started in the 3rd year
of a presidential administration.

29
When It Comes to Re-election, It's All About the Economy
Source: National Bureau of Economic Research, Bureau of Labor Statistics and Wikipedia. Past performance is not a guarantee of future results. Investors cannot invest directly in an index, and unmanaged index returns do not reflect any fees, expenses or sales charges.
No Recession in 2 Years Before Election
Year President Change in Election Year Unemployment Rate Recession? Re-election? Margin of Victory (Popular Vote)
2012 Obama -1.6% No Yes 3.9%2004 Bush 43 -0.2% No Yes 2.5%1996 Clinton -0.6% No Yes 8.5%1984 Reagan -3.0% No Yes 18.2%1972 Nixon 0.1% No Yes 23.2%1964 Johnson -0.3% No Yes 22.6%1956 Eisenhower -1.8% No Yes 15.4%
Recession in 2 Years Before Election
Year President Change in Election Year Unemployment Rate Recession? Re-election? Margin of Victory (Popular Vote)
1992 Bush 41 1.4% Yes No -5.6%1980 Carter 1.7% Yes No -9.7%1976 Ford 1.7% Yes No -2.1%
Presidents facing re-election tend to win when the economy is strong, and not when conditions worsen ahead of voting day.

30
It Doesn’t Pay to Be Bearish Ahead of U.S. Elections
Source: Bloomberg. *1940 election excluded due to World War 2 Impact. Past performance is not a guarantee of future results.Investors cannot invest directly in an index, and unmanaged index returns do not reflect any fees, expenses or sales charges.
S&P 500 Performance Leading to Election Date
Election Prior 3 Months Prior 6 Months Prior 12 Months
1936 8% 24% 36%1944 2% 7% 12%1948 5% 8% 8%1952 -3% 4% 8%1956 -3% -2% 8%1960 -1% 1% -4%1964 3% 6% 15%1968 6% 5% 12%1972 7% 7% 21%1976 0% 1% 16%1980 7% 22% 26%1984 5% 7% 5%1988 2% 7% 10%1992 -1% 2% 7%1996 8% 11% 21%2000 -3% 0% 4%2004 2% 2% 8%2008 -19% -29% -33%2012 2% 4% 14%2016 -2% 4% 2%
Averages 1% 5% 10%% Times Positive 60% 85% 90%
In the last 20 U.S. election cycles, there have been only 2 instances of the markets being down in the 12 months leading to the election results.

31
International
International investments are subject to special risks, including currency fluctuations and social, economic and political uncertainties, which could increase volatility. These risks are magnified in emerging markets.
32
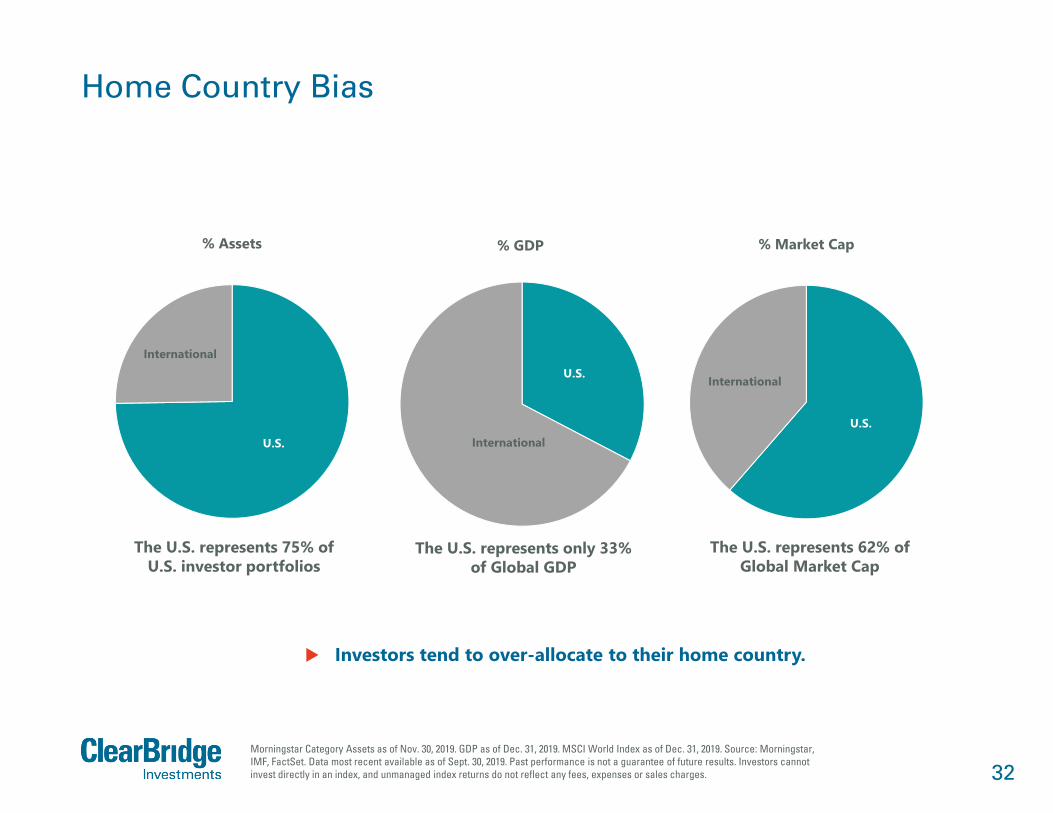
Home Country Bias
Morningstar Category Assets as of Nov. 30, 2019. GDP as of Dec. 31, 2019. MSCI World Index as of Dec. 31, 2019. Source: Morningstar, IMF, FactSet. Data most recent available as of Sept. 30, 2019. Past performance is not a guarantee of future results. Investors cannot invest directly in an index, and unmanaged index returns do not reflect any fees, expenses or sales charges.
U.S.
International
% Assets
The U.S. represents 75% of U.S. investor portfolios
U.S.
International
% GDP
The U.S. represents only 33% of Global GDP
Investors tend to over-allocate to their home country.
U.S.
International
% Market Cap
The U.S. represents 62% of Global Market Cap

33
U.S. vs. International Equity Performance
S&P 500 vs. MSCI EAFE. Data as of Dec. 31, 2019. Source: FactSet. Past performance is not a guarantee of future results. Investors cannot invest directly in an index, and unmanaged index returns do not reflect any fees, expenses or sales charges.
0.0
0.5
1.0
1.5
2.0
2.5
3.0
1978 1983 1988 1993 1998 2003 2008 2013 2018
Diff
eren
ces
Betw
een
Inde
xes
77.9%
U.S. Outperformed
174.9%
390.5%
International Outperformed
U.S
. O
utpe
rfor
med
U.S. Outperformed
157.6%
95.8%
International Outperformed
Geographic leadership tends to persist for multiple years.

34
Dollar Regimes Coincide With Global Equity Leadership
Data as of Dec. 31, 2019. *MSCI U.S. Index vs. MSCI All Country World ex.-U.S. Index in U.S. dollar terms. One year rolling periods. Source: FactSet. Past performance is not a guarantee of future results. Investors cannot invest directly in an index, and unmanaged index returns do not reflect any fees, expenses or sales charges.
-40
-30
-20
-10
0
10
20
30
40
1993 1996 1998 2000 2002 2004 2006 2008 2010 2012 2014 2016 2018
U.S
. vs.
Res
t of W
orld
One
-Yea
r Rel
ativ
e Pe
rfor
man
ce (%
)
Relative Stock Price: U.S. vs. Rest of World(Rolling 1-Year Periods)
Dollar Bull Dollar Bear Dollar Bull
Periods of sustained dollar strength have aligned with U.S. equity outperformance. Dollar weakness could lead to a shift in global equity market leadership.

35
Global Growth Expected to Inflect Higher
Data as of Dec. 31, 2019. *Rest of World growth rate is global excluding U.S. and is the PPP-based GDP-weighted average. Source: IMF, FactSet. Past performance is not a guarantee of future results. Investors cannot invest directly in an index, and unmanaged index returns do not reflect any fees, expenses or sales charges.
0.0
0.5
1.0
1.5
2.0
2.5
3.0
2010 2011 2012 2013 2014 2015 2016 2017 2018 2019 2020 E 2021 E 2022 E
Rest
of W
orld
Min
us U
.S. R
eal G
DP
Gro
wth
Rest of World Growth Rate Minus U.S. Real GDP Growth
An uptick in global growth could lead to better relative performance for international stocks.

36
Global Growth Rebounding?
Data as of Dec. 31, 2019. Source: Deutsche Bank. Past performance is not a guarantee of future results. Investors cannot invest directly in an index, and unmanaged index returns do not reflect any fees, expenses or sales charges.
30%
40%
50%
60%
70%
80%
90%
100%
2010 2012 2014 2016 2018
3-M
onth
Mov
ing
Aver
age
Share of Countries with Rising Export Orders
It appears that global growth may be on the rebound. Rising export orders typically lead to an acceleration in global GDP.

37
IFO Expectations vs. DAX
Data as of Dec. 31, 2019; represents period from 2005-present. Source: IFO, Deutsche Boerse, Bloomberg. Past performance is not a guarantee of future results. Investors cannot invest directly in an index, and unmanaged index returns do not reflect any fees, expenses or sales charges.
17.0%
8.2%6.5%
-10.2%
-15
-10
-5
0
5
10
15
20
<96 96-100 100-104 >104
Ger
man
DAX
12M
For
war
d Pr
ice
Retu
rn
German IFO Business Expectations
CurrentLevel
More Bearish More BullishExpectations
When IFO expectations are at current levels, returns tend to be above average.

38
Currency

39
U.S. Dollar Cycle
As of Dec. 31, 2019. Source: Federal Reserve Bank of St. Louis, Federal Reserve and FactSet. Major Currencies, Index Mar 1973=100, Monthly, Not Seasonally Adjusted. Past performance is not a guarantee of future results. Investors cannot invest directly in an index, and unmanaged index returns do not reflect any fees, expenses or sales charges.
60
70
80
90
100
110
120
130
140
150
1971 1976 1981 1986 1991 1996 2001 2006 2011 2016
Inde
x M
ar 1
973=
100
Trade-Weighted U.S. Dollar
17 years 15 years14 years
U.S. dollar cycles typically last approximately 15 years. The dollar’s peak in 2016 may have started a longer downtrend.

40
Twin Deficits: Budget and Trade
Data as of Sept. 30, 2019, most recent available as of Dec. 31, 2019. Source: BEA, Federal Reserve, FactSet. Past performance is not a guarantee of future results. Investors cannot invest directly in an index, and unmanaged index returns do not reflect any fees, expenses or sales charges.
-10
-8
-6
-4
-2
0
2
4
6
8
10
-30%
-20%
-10%
0%
10%
20%
30%
40%
1999 2001 2003 2005 2007 2009 2011 2013 2015 2017 2019
Twin D
eficits -5 Year ChangeRe
al T
rade
Wei
ghte
d D
olla
r -5
Year
Cha
nge
Real Trade Weighted Dollar (Lagged 2 Years, LHS) Twin Deficits as a % of GDP (RHS)
Twin deficits show the dollar should modestly weaken over the next several years.

41
The U.S. Dollar Dominates the International Monetary System
Data as of June 2018.Source: European Central Bank, BofA Merrill Lynch Global Research.
62.2
56.3
39.9
62.7
23.4 23.2
35.7
20.1
2.4 3.2 3.0 4.9
0.0 0.0 1.6 1.20%
10%
20%
30%
40%
50%
60%
70%
International Debt International Loans Global Payment Currency Foreign Exchange Reserves
Shar
e of
the
Inte
rnat
iona
l Sys
tem
USD EUR JPY Renminbi
The greenback is firmly entrenched as the world's reserve currency.

42
Negative Rates

43
U.S. Reigns Over Global Yield Landscape
As of Dec. 20, 2019. Source: Bank of America Merrill Lynch. Past performance is not a guarantee of future results. Investors cannot invest directly in an index, and unmanaged index returns do not reflect any fees, expenses or sales charges.
30%
40%
50%
60%
70%
80%
90%
100%
1996 1998 2000 2002 2004 2006 2008 2010 2012 2014 2016 2018
U.S. % of Global IG Yield
Over 85% of global investment grade yield exists in U.S. government and corporate bonds.

44
The Fed Lacks Rate Cut AmmunitionTotal Decline in Fed Funds Rate Around Past Recessions
Based on peak FFR beginning 12mo prior to recession beginning and trough FFR ending 6mo after recession end. Dec. 1969 to Nov. 1970 recession is based on Effective Fed Funds Rate, each period thereafter is based on Target Fed Funds Rate. Source: FRED, Federal Reserve Bank of St. Louis. Past performance is not a guarantee of future results. Investors cannot invest directly in an index, and unmanaged index returns do not reflect any fees, expenses or sales charges.
Recession Total Rate Cuts
December 1969 – November 1970 -8.3%
November 1973 – March 1975 -8.1%
January 1980 – July 1980 -11.0%
July 1981 – November 1982 -11.5%
July 1990 – March 1991 -3.0%
March 2001 – November 2001 -4.8%
December 2007 – June 2009 -5.0%
Average -7.4%
Over the last 7 recessions, the Fed has needed to lower short-term rates by 7.4%, on average, to jump-start the economy.
The Fed Funds rate peaked at 2.5%, which may cause the Fed to pursue other forms of stimulus.

45
U.S. Has More Room for QE
Data as of Sept. 30, 2019; most recent as of Dec. 31, 2019. Source: FactSet. Past performance is not a guarantee of future results. Investors cannot invest directly in an index, and unmanaged index returns do not reflect any fees, expenses or sales charges.
0%
20%
40%
60%
80%
100%
120%
2003 2006 2010 2014 2017
Size
of C
entr
al B
ank
Bala
nce
Shee
t as
a %
of G
DP
United States20.2%
Eurozone43.5%
Japan104.9%
The Fed’s smaller balance sheet as a % of GDP affords policymakers greater flexibility if the economy rolls over.

46
Debt

47
The Student Debt Crisis in Context
Data as of Dec. 31, 2017. Source: Federal Reserve Bank of New York. Past performance is not a guarantee of future results. Investors cannot invest directly in an index, and unmanaged index returns do not reflect any fees, expenses or sales charges.
0
2
4
6
8
10
12
14
Num
ber o
f Bor
row
ers
(Mill
ions
)
< $5K $5-10K $10-25K $25-50K $50-75K $75-100K $100-150K $150-200K > $200K
84% of borrowers have a balance that is lower than $50K
5.7% of borrowers have a balance that is higher than $100K

48
U.S. Credit Quality Deterioration
As of Dec. 31, 2019. Source: Bloomberg/Barclays. Past performance is not a guarantee of future results. Investors cannot invest directly in an index, and unmanaged index returns do not reflect any fees, expenses or sales charges.
Baa43.9%
A37.1%
Aa10.8%
Aaa8.1%
0%
10%
20%
30%
40%
50%
60%
70%
80%
90%
100%
1973 1976 1979 1982 1985 1988 1991 1994 1997 2000 2003 2006 2009 2012 2015 2018
In 1973, only 9% of credits were rated Baa versus 44% today.

49
U.S. Debt Levels Set to Rise Higher
Source: Deutsche Bank. Future debt levels are based on a Congressional Budget Office forecast. Past performance is not a guarantee of future results. Investors cannot invest directly in an index, and unmanaged index returns do not reflect any fees, expenses or sales charges.
0
20
40
60
80
100
120
140
160
1790 1815 1840 1865 1890 1915 1940 1965 1990 2015 2040
U.S
. Deb
t as
% o
f GD
P
Federal Debt Held by the Public Since 1790
Barring a change in spending, U.S. debt levels will grow substantially in the coming decades.

50
Sentiment

51
Year-Ahead Expectations Are Lowest in 14 YearsStocks Have a Low Hurdle to Clear with Muted Wall Street Expectations for 2020
Data as of Dec. 31, 2019. Source: Bloomberg. Past performance is not a guarantee of future results. Investors cannot invest directly in an index, and unmanaged index returns do not reflect any fees, expenses or sales charges.
0%
2%
4%
6%
8%
10%
12%
14%
16%
18%
20%
2005 2006 2007 2008 2009 2010 2011 2012 2013 2014 2015 2016 2017 2018 2019
S&P
500
Fore
cast
(Mov
e fo
r Fol
low
ing
Year
)
Forecast S&P 500 Move for Following Year Average
52
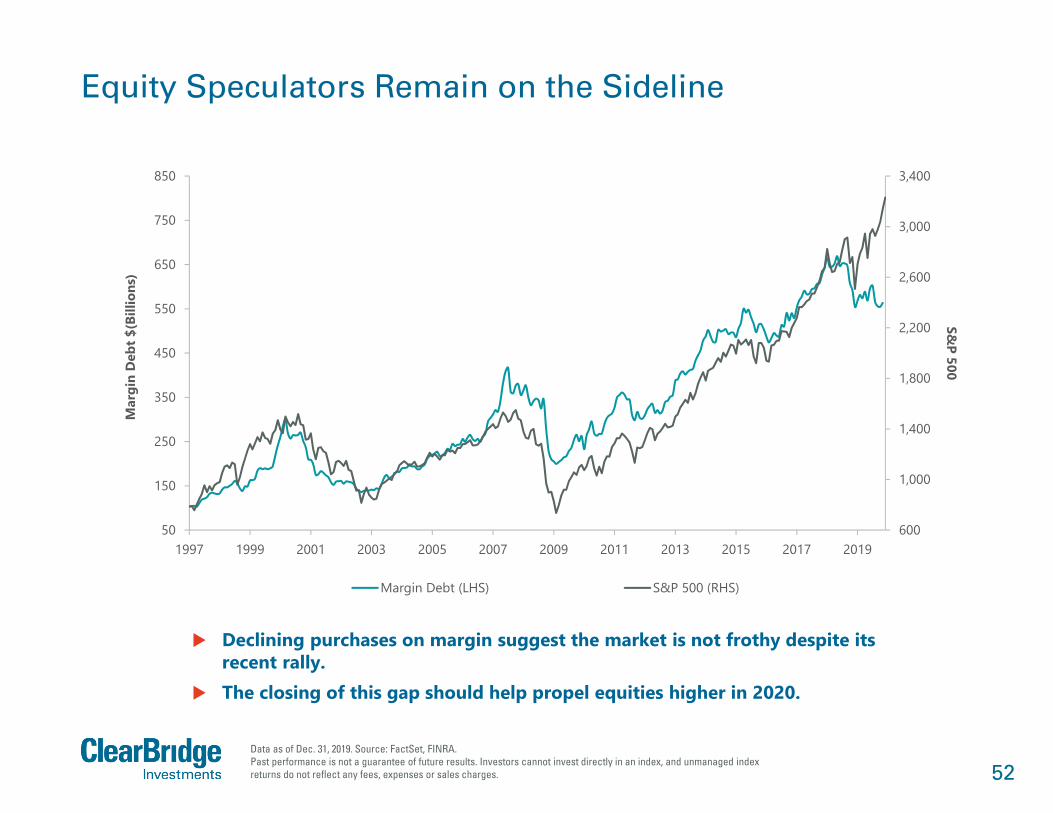
Equity Speculators Remain on the Sideline
Data as of Dec. 31, 2019. Source: FactSet, FINRA.Past performance is not a guarantee of future results. Investors cannot invest directly in an index, and unmanaged index returns do not reflect any fees, expenses or sales charges.
600
1,000
1,400
1,800
2,200
2,600
3,000
3,400
50
150
250
350
450
550
650
750
850
1997 1999 2001 2003 2005 2007 2009 2011 2013 2015 2017 2019
S&P 500
Mar
gin
Deb
t $(B
illio
ns)
Margin Debt (LHS) S&P 500 (RHS)
Declining purchases on margin suggest the market is not frothy despite its recent rally.
The closing of this gap should help propel equities higher in 2020.

53
Large Confidence Gaps Suggest Potential Trouble
Data as of Sept. 30, 2019, most recent as of Dec. 31, 2019. Source: FactSet. Past performance is not a guarantee of future results. Investors cannot invest directly in an index, and unmanaged index returns do not reflect any fees, expenses or salescharges.
-80%
-70%
-60%
-50%
-40%
-30%
-20%
-10%
0%
10%
20%
1977 1981 1985 1989 1993 1997 2001 2005 2009 2013 2017
CEO
Exp
ecta
tions
Min
us C
onsu
mer
Exp
ecta
tions
Recession The Conference Board: CEO Expectations Minus Consumer Expectations
Historically, large discrepancies between consumer and business confidence has been a signal of a maturing economic cycle.
A narrowing of this gap could suggest recessionary risks are rising.
Above 0%: Businesses More Confident
Below 0%: Consumers More Confident
?

54
Consumer Hesitancy on Large Purchases Concerning
Data as of Dec. 31, 2019. Source: FactSet. Past performance is not a guarantee of future results. Investors cannot invest directly in an index, and unmanaged index returns do not reflect any fees, expenses or sales charges.
35
45
55
65
75
85
2
3
4
5
6
7
8
9
10
11
12
1979 1981 1983 1985 1987 1989 1991 1993 1995 1997 1999 2001 2003 2005 2007 2009 2011 2013 2015 2017 2019
Good Tim
e to Buy Large Household G
oods (%, Inverted)
Une
mpl
oym
ent R
ate
(%)
Recessions Unemployment Rate - U.S. (LHS) Lagged 12 Months U. Mich, Good Time To Buy Large Household Goods - U.S. (MOV 3M) (RHS)
A drop in consumer appetite for large ticket items typically precedes rising unemployment and recessions.

55
Volatility

56
Volatility Usually Follows the Yield CurveThe Yield Curve Flattening Points to a Higher VIX
Data as of Dec. 31, 2019. Source: CBOE, U.S. Treasury. Note: 3-month moving average. Past performance is not a guarantee of future results. Investors cannot invest directly in an index, and unmanaged index returns do not reflect any fees, expenses or sales charges.
-1.0
-0.5
0.0
0.5
1.0
1.5
2.0
2.5
3.0
3.5
4.010
20
40
1993 1996 1999 2002 2005 2008 2011 2014 2017 2020
U.S. 10Y vs. 3M
Treasury Spread (Inverted)VI
X (L
og S
cale
)
VIX (LHS) US 10Y vs. 3M Treasury Spread (Inverted, Leading 3Y, RHS)

57
-50%
-40%
-30%
-20%
-10%
0%
10%
20%
30%
40%
50%
1983 1985 1987 1989 1991 1993 1995 1997 1999 2001 2003 2005 2007 2009 2011 2013 2015 2017 2019
S&P 500 Calendar Year Total Return S&P 500 Largest Intra-Year Price Decline (%)
Median Intra-Year
Price Decline-9.9%
Median Annualized Total Return+15.1%
Volatility Does Not Equal a Financial Loss Unless You Sell
Data as of Dec. 31, 2019. Source: FactSet. Past performance is not a guarantee of future results. Investors cannot invest directly in an index, and unmanaged index returns do not reflect any fees, expenses or sales charges.
58
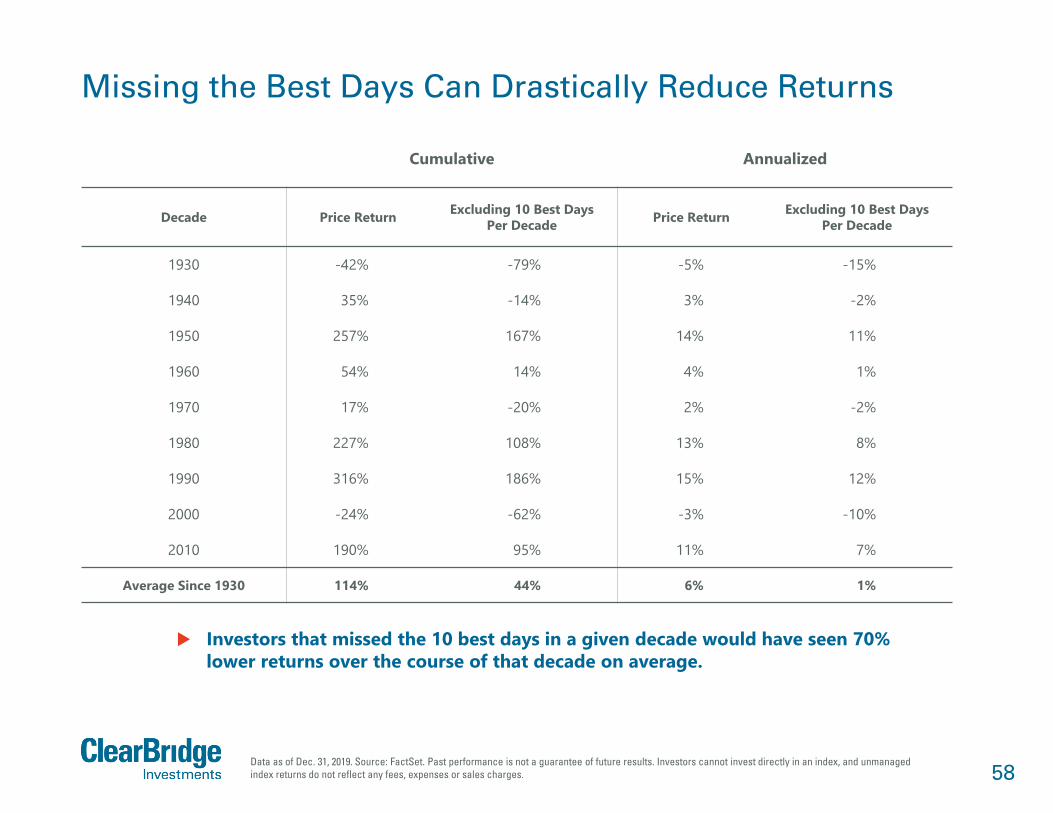
Missing the Best Days Can Drastically Reduce Returns
Data as of Dec. 31, 2019. Source: FactSet. Past performance is not a guarantee of future results. Investors cannot invest directly in an index, and unmanaged index returns do not reflect any fees, expenses or sales charges.
Cumulative Annualized
Decade Price Return Excluding 10 Best Days Per Decade Price Return Excluding 10 Best Days
Per Decade
1930 -42% -79% -5% -15%
1940 35% -14% 3% -2%
1950 257% 167% 14% 11%
1960 54% 14% 4% 1%
1970 17% -20% 2% -2%
1980 227% 108% 13% 8%
1990 316% 186% 15% 12%
2000 -24% -62% -3% -10%
2010 190% 95% 11% 7%
Average Since 1930 114% 44% 6% 1%
Investors that missed the 10 best days in a given decade would have seen 70% lower returns over the course of that decade on average.

59
Which Equities Do Well During Periods of Market Volatility?During the Last Seven Major Market Drawdowns, Some Sectors Held Up Better than Others
Source: FactSet. Note: Severe declines defined as declines of 15% or greater in S&P 500 since 1987. Hit rate defined as % of severe declines with relative outperformance vs. S&P 500. Past performance is not a guarantee of future results. Investors cannot invest directly in an index, and unmanaged index returns do not reflect any fees, expenses or sales charges.
100%
100%
100%
57%
86%
29%
29%
14%
29%
14%
0% 20% 40% 60% 80% 100%
Consumer Staples
Utilities
Health Care
Energy
Comm. Services
Materials
Cons. Discretionary
Industrials
IT
Financials
Hit Rate
20%
14%
12%
7%
5%
1%
-2%
-4%
-6%
-7%
-10% -5% 0% 5% 10% 15% 20% 25%
Consumer Staples
Utilities
Health Care
Energy
Comm. Services
Materials
Cons. Discretionary
Industrials
IT
Financials
Relative Performance
During periods of market turmoil, defensive sectors such as Staples, Utilities, and Health Care have historically tended to deliver better relative performance.

60
Typical Market Leadership in a Downturn
Note: Average performance: average performance during selloffs of 5% or more, Hit Rate: Hit rate of outperformance during 5%+ selloffs, 2005 – present. Benchmarks used: Large Value: S&P 500 Value, Large Blend: S&P 500, Large Growth: S&P 500 Growth; Mid Value: S&P 400 Value, Mid Blend: S&P 400, Mid Growth: S&P 400 Growth; Small Value: S&P 600 Value, Small Blend: S&P 600, Small Growth: S&P 600 Growth. Outperformance frequency calculated relative to S&P 1500 index. Source: S&P, Bloomberg. Past performance is not a guarantee of future results. Investors cannot invest directly in an index, and unmanaged index returns do not reflect any fees, expenses or sales charges.
Mar
ket C
ap
Smal
lM
idLa
rge
Value Blend Growth
Investment Style
Large Cap Value
-12.9%Avg. Perf.
38% Hit Rate
Mid Cap Value
-13.9%Avg. Perf.
21% Hit Rate
Small Cap Value
-14.6%Avg. Perf.
17% Hit Rate
Large Cap
-12.3%Avg. Perf.
83% Hit Rate
Mid Cap
-13.6%Avg. Perf.
25% Hit Rate
Small Cap
-14.1%Avg. Perf.
21% Hit Rate
Large Cap Growth
-11.6%Avg. Perf.
75% Hit Rate
Mid Cap Growth
-13.2%Avg. Perf.
33% Hit Rate
Small Cap Growth
-13.5%Avg. Perf.
42% Hit Rate
Most Defensive
LeastDefensive
Less
Def
ensi
ve
Less Defensive

61
Valuations

62
65
14 14
20
35
0
5
10
15
20
25
30
35
<-20% -20% - 10% -10% - 0% 0% - 10% 10% - 20% >20%
Year
s
S&P 500 Annual Total Return Ranges
19271928193319351936193819421943194519501951195419551958196119631967197519761980198219831985198919911995199619971998199920032009201320172019
193019311937197420022008
19411957196619732001
19291932193419391940194619531962196919771981199020002018
19471948195619601970197819841987199219942005200720112015
19261944194919521959196419651968197119721979198619881993200420062010201220142016
Market Annual Returns Distribution of S&P 500 Total Returns Since 1926
As of Dec. 31, 2019. Source: Strategas Research Partners.

63
Price/Earnings Is Not The Only Indicator To Watch
Data as of Dec. 31, 2019. Source: Bloomberg. Past performance is not a guarantee of future results. Investors cannot invest directly in an index, and unmanaged index returns do not reflect any fees, expenses or sales charges.
Dec. 2007 17.5
Sept. 200923.2
10
15
20
25
2003 2004 2005 2006 2007 2008 2009 2010 2011 2012 2013 2014 2015 2016 2017 2018 2019
Recession S&P 500 Price/Earnings Ratio

64
Valuations Not Stretched Relative to Past Market Peaks
Data as of Dec. 31, 2019.Source: JP Morgan. Past performance is not a guarantee of future results. Investors cannot invest directly in an index, and unmanaged index returns do not reflect any fees, expenses or sales charges.
S&P 500 Peak Date Before Recession Trailing P/E at Peak 5-Year Average % Premium
May 1946 21.9 12.3 77.4%
Jan. 1953 11.1 8.1 36.4%
Aug. 1956 14.0 11.2 25.5%
Aug. 1959 17.8 14.0 27.4%
Nov. 1968 19.0 17.6 8.3%
Jan. 1973 18.7 17.3 8.4%
Feb. 1980 7.9 9.5 -17.0%
June 1990 17.3 15.1 14.3%
March 2000 30.5 24.0 27.0%
Oct. 2007 19.9 21.3 -6.4%
Median 18.2 14.5 24.5%
Current 24.3 22.7 6.8%
Traditionally, the S&P 500 will trade at a substantial premium to it’s 5-year average at market peaks.
Today, the market trades at a slight discount suggesting further upside.

65
Earnings Price YieldS&P 500 Minus Yield to Maturity of 10-Year Treasury
Source: S&P, Federal Reserve, NBER, Bloomberg. Data as of Dec. 31, 2019. Past performance is not a guarantee of future results. Investors cannot invest directly in an index, and unmanaged index returns do not reflect any fees, expenses or sales charges.
Valuations at Equity Market Peaks Ahead of Recessions
Date Earnings Yield 10-Year Treasury Yield Spread Length of Economic
Expansion (Years)
Nov. 1968 5.6% 5.8% -0.2% 8.8
Jan. 1973 5.2% 6.5% -1.3% 3.0
Feb. 1980 12.6% 12.7% -0.1% 4.8
Nov. 1980 11.0% 12.7% -1.8% 1.0
July 1990 6.0% 8.3% -2.3% 7.7
March 2000 3.2% 6.0% -2.8% 10.0
Oct. 2007 5.5% 4.5% 1.1% 6.1
Average - - -1.1% 5.9
Current 4.1% 1.9% 2.2% 10.5
Compared to the longest US economic expansions, the current valuation of stocks compared to bonds appears attractive.

66
Dividend Paying Equities Attractive
As of Dec. 31, 2019. Source: FactSet. Past performance is not a guarantee of future results. Investors cannot invest directly inan index, and unmanaged index returns do not reflect any fees, expenses or sales charges.
0%
5%
10%
15%
20%
25%
30%
35%
40%
45%
1999 2001 2003 2005 2007 2009 2011 2013 2015 2017 2019
% o
f S&
P 50
0 St
ocks
w/
Div
iden
d Yi
eld
> 3
0 Ye
ar T
reas
ury
Yiel
d
36% of S&P stocks now have a dividend yield greater than the 30-year Treasury.

67
New Secular Bull Market?
Secular bear market average drawdown includes selloff beginning September 1929. Data as of Dec. 31, 2019. Source: Bloomberg, FactSet. Past performance is not a guarantee of future results. Investors cannot invest directly in an index, and unmanaged index returns do not reflect any fees, expenses or sales charges.
1
5
25
125
625
3125
1930 1940 1950 1960 1970 1980 1990 2000 2010
S&P
500
Inde
x (L
og-S
cale
)
S&P 500
1930-1950All-Time Highs: 0
Cumulative Return: -22.2%
1950-1970All-Time Highs: 365
Cumulative Return: 451.9%
1970-1980All-Time Highs: 35
Cumulative Return: 17.2%
1980-2000All-Time Highs: 500Cumulative Return:
1,261.2%
2000-2010All-Time Highs: 13
Cumulative Return: -24.1%
2010-PresentAll-Time Highs:
242Cumulative
Return: 190%
Secular Bear: Average Drawdown -46.1%Secular Bull: Average Drawdown -25.3%

68
Name and Position Industry Experience
ClearBridge Tenure Education, Experience and Professional Designations
Jeffrey Schulze CFA Director, Investment Strategist
14 years • Joined ClearBridge in 2014
• Member of the CFA Institute• Lord Abbett & Co., LLC – Portfolio Specialist• BS in Finance from Rutgers University
Josh Jamner CFAVice President, Investment Strategy Analyst
10 years • Joined ClearBridge in 2017
• Member of the CFA Institute• RBC Capital Markets - Assistant Vice President, Associate Strategist - U.S. Equity• Bessemer Trust - Assistant Vice President, Client Portfolio Analyst • BA in Government from Colby College
Biographies

69
Glossary of Terms
BEA: Bureau of Economic Analysis
GDP: Gross Domestic Product
P/E Ratio: Price/Earnings ratio
PMI: Purchasing Manager’s Index
Quantitative easing (QE): Monetary policy implemented by a central bank in which it increases the excess reserves of the banking system through the direct purchase of debt securities.
Yield Curve: Comparison of interest rates at a point in time of bonds with equal credit quality but different maturity dates.
YoY: Year Over Year
U.S. Treasurys: Direct debt obligations issued and backed by the "full faith and credit" of the U.S. government. The U.S. government guarantees the principal and interest payments on U.S. Treasuries when the securities are held to maturity. Unlike U.S. Treasury securities, debt securities issued by the federal agencies and instrumentalities and related investments may or may not be backed by the full faith and credit of the U.S. government. Even when the U.S. government guarantees principal and interest payments on securities, this guarantee does not apply to losses resulting from declines in the market value of these securities.
S&P 500 Index: Unmanaged index of 500 stocks that is generally representative of the performance of larger companies in the U.S.
Shibor: Shanghai Interbank Offered Rate

70
Additional Important InformationPast performance is no guarantee of future results.
©2020 Legg Mason Investor Services, LLC, member FINRA, SIPC. “Anatomy of a Recession” is a trademark of ClearBridge Investments, LLC. Legg Mason Investor Services, LLC and ClearBridgeInvestments, LLC are subsidiaries of Legg Mason, Inc.
All opinions and data included in this presentation are as of January 2020 unless noted otherwise and are subject to change. The opinions and views expressed herein are of the presenter and may differ from other managers, or the firm as a whole, and are not intended to be a forecast of future events, a guarantee of future results or investment advice. This information should not be used as the sole basis to make any investment decision. The statistics have been obtained from sources believed to be reliable, but the accuracy and completeness of this information cannot be guaranteed. Neither ClearBridge Investments nor its information providers are responsible for any damages or losses arising from any use of this information.
All investments involve risk, including loss of principal. Equity securities are subject to price fluctuation and possible loss of principal. Fixed-income securities involve interest rate, credit, inflation, and reinvestment risks; and possible loss of principal. As interest rates rise, the value of fixed-income securities falls. An investor cannot invest directly in an index. Unmanaged index returns do not reflect any fees, expenses or sales charges.
Any information, statement or opinion set forth herein is general in nature, is not directed to or based on the financial situation or needs of any particular investor, and does not constitute, and should not be construed as, investment advice, forecast of future events, a guarantee of future results, or a recommendation with respect to any particular security or investment strategy or type of retirement account. Investors seeking financial advice regarding the appropriateness of investing in any securities or investment strategies should consult their financial professional.
923354-CBAX539422
This material is approved for distribution in those countries and to those recipients listed below. Note: this material may not be available in all regions listed.
All investors and eligible counterparties in Europe, the UK, Switzerland: In Europe (excluding UK and Switzerland), this financial promotion is issued by Legg Mason Investments (Ireland) Limited, registered office 6th Floor, Building Three, Number One Ballsbridge, 126 Pembroke Road, Ballsbridge, Dublin 4, D04 EP27. Registered in Ireland, Company No. 271887. Authorised and regulated by the Central Bank of Ireland.
All Qualified Investors in Switzerland: In Switzerland, this financial promotion is issued by Legg Mason Investments (Switzerland) GmbH, authorised by the Swiss Financial Market Supervisory Authority FINMA. Investors in Switzerland: The representative in Switzerland is FIRST INDEPENDENT FUND SERVICES LTD., Klausstrasse 33, 8008 Zurich, Switzerland and the paying agent in Switzerland is NPB Neue Privat Bank AG, Limmatquai 1, 8024 Zurich, Switzerland. Copies of the Articles of Association, the Prospectus, the Key Investor Information
documents and the annual and semi-annual reports of the Company may be obtained free of charge from the representative in Switzerland.
All investors in the UK: In the UK this financial promotion is issued by Legg Mason Investments (Europe) Limited, registered office 201 Bishopsgate, London EC2M 3AB. Registered in England and Wales, Company No. 1732037. Authorized and regulated by the Financial Conduct Authority. Client Services +44 (0)207 070 7444
All Investors in Hong Kong and Singapore: This material is provided by Legg Mason Asset Management Hong Kong Limited in Hong Kong and Legg Mason Asset Management Singapore Pte. Limited (Registration Number (UEN): 200007942R) in Singapore.
This material has not been reviewed by any regulatory authority in Hong Kong or Singapore.
All Investors in the People’s Republic of China ("PRC"): This material is provided by Legg Mason Asset Management Hong Kong Limited to intended recipients in the PRC. The content of this document is only for Press or the PRC investors investing in the QDII Product offered by PRC’s commercial bank in accordance with the regulation of China Banking Regulatory Commission. Investors should read the offering document prior to any subscription. Please seek advice from PRC’s commercial banks and/or other professional advisors, if necessary. Please note that Legg Mason and its affiliates are the Managers of the offshore funds invested by QDII Products only. Legg Mason and its affiliates are not authorized by any regulatory authority to conduct business or investment activities in China.
This material has not been reviewed by any regulatory authority in the PRC.
Distributors and existing investors in Korea and Distributors in Taiwan: This material is provided by Legg Mason Asset Management Hong Kong Limited to eligible recipients in Korea and by Legg Mason Investments (Taiwan) Limited (Registration Number: (98) Jin Guan Tou Gu Xin Zi Di 001; Address: Suite E, 55F, Taipei 101 Tower, 7, Xin Yi Road, Section 5, Taipei 110, Taiwan, R.O.C.; Tel: (886) 2-8722 1666) in Taiwan. Legg Mason Investments (Taiwan) Limited operates and manages its business independently.
This material has not been reviewed by any regulatory authority in Korea or Taiwan.
All Investors in the Americas: This material is provided by Legg Mason Investor Services LLC, a U.S. registered Broker-Dealer, which includes Legg Mason Americas International. Legg Mason Investor Services, LLC, Member FINRA/SIPC, and all entities mentioned are subsidiaries of Legg Mason, Inc.
All Investors in Australia: This material is issued by Legg Mason Asset Management Australia Limited (ABN 76 004 835 839, AFSL 204827) (“Legg Mason”). The contents are proprietary and confidential and intended solely for the use of Legg Mason and the clients or prospective clients to whom it has been delivered. It is not to be reproduced or distributed to any other person except to the client’s professional advisers.