Embed Size (px)
Citation preview

Analyzing the Factors Underlying the Structure and Computation of theMeaning of Chipmunk, Cherry, Chisel, Cheese, and Cello
(and Many Other Such Concrete Nouns)
George S. Cree and Ken McRaeUniversity of Western Ontario
Seven trends regarding the categories that tend to be impaired/preserved in category-specific semanticdeficits were identified. The authors hypothesized that these trends arise despite the multiple sources ofvariation in patient testing because numerous factors that structure semantic memory probabilisticallyconverge to make some categories of knowledge more susceptible to damage than others. Analysis ofsemantic feature norms and corpus data for 541 concepts revealed that differences in the distribution ofknowledge types across categories are sufficient to explain 6 of the trends and are necessary to explainloss of knowledge about nonliving things. Feature informativeness, concept confusability, visual com-plexity, familiarity, and name frequency contributed to this patterning and provide insight into whyknowledge about living things is most often impaired.
From infancy on, human beings acquire vast amounts of knowl-edge about living and nonliving things from watching them, usingthem, observing others use them, and talking and reading aboutthem. In a typical day, people watch animals move about; manip-ulate tools and utensils; prepare, smell, and taste food; and hearmusical instruments. From these interactions, people develop in-ternal representations that allow them to discuss and reason aboutthese objects. This knowledge is often referred to as semanticknowledge, and the memory systems involved in the representationand processing of such knowledge are called semantic memory.People are amazed by the development of semantic knowledge ininfants and troubled by its loss in debilitating conditions likedementia of the Alzheimer type, but for most of their adult lives,they simply take semantic knowledge for granted.
In this article, we provide insight into how information aboutentities and objects is represented, organized, and computed. Ourapproach involved combining data generated from a large set ofsemantic feature production norms with constraints imposed by thepatterns of impairments observed in patients with category-specific semantic deficits. The goal was to evaluate the efficacy ofcurrent models of semantic memory by assessing the major factorsthought to structure semantic memory and influence semanticcomputations.
Category-Specific Semantic Deficits
Cases of category-specific semantic deficits are of particularinterest to those studying semantic memory because regularities inpatterns of impairment can be used to derive constraints on pos-sible theories of semantic memory. Over 100 case studies havebeen reported, with deficits generally manifesting themselves asthe loss of knowledge about items in some semantic domains(living things) relative to others (nonliving things).1 Regularitieswithin and across patients in terms of the sets of concepts that tendto be impaired/spared together constrain theories of the organiza-tion of semantic representations. One strategy for understandingtheir cause is to interpret first the primary dimensions along whichthe clusters of impaired and spared concepts can be discriminatedand then the factors underlying these dimensions. Thus, the goal isto uncover factors that can be explained in terms of both thespecific processing responsibilities of distinct brain regions and thegeneral processing characteristics of the brain.
The most well-documented pattern of category-specific seman-tic deficits is where the concepts with which patients tend to havethe most trouble come from either creatures, fruits/vegetables, ornonliving things. For example, a patient may have impaired abilityto name (or provide information about) pictures of creatures andyet may retain the ability to do so for fruits/vegetables and non-living things. The most transparent interpretation is that there issomething special about belonging to various domains that causesinformation about all items from those domains to be stored in adistinct manner and perhaps in distinct neural regions (Caramazza& Shelton, 1998; Collins & Quillian, 1969; Sartori & Job, 1988).
1 Throughout the article, we use domain to refer to large superordinatecategories such as living versus nonliving things, category when referringto midlevel categories such as vehicle and insect, and concept or exemplarwhen referring to the concepts that we have normed, such as truck andgrasshopper, the vast majority of which would be considered at the basiclevel by most researchers. Note, however, that we use category-specificdeficits generically. Features are presented in �angled brackets�.
George S. Cree and Ken McRae, Department of Psychology, Universityof Western Ontario, London, Ontario, Canada.
This work was supported by an Ontario Graduate Scholarship and aNatural Sciences and Engineering Research Council Doctoral Scholarshipto George S. Cree and by Natural Sciences and Engineering ResearchCouncil Grant OGP0155704 to Ken McRae. Part of this article formed partof George S. Cree’s University of Western Ontario doctoral thesis.
We thank Larry Barsalou, Mike Dixon, Jeff Elman, Albert Katz, andTim Shallice for valuable suggestions regarding this research.
Correspondence concerning this article should be addressed to GeorgeS. Cree, who is now at the Department of Psychology, University ofVictoria, P.O. Box 3050 STN CSC, Victoria, British Columbia V8W 3P5,Canada. E-mail: [email protected]
Journal of Experimental Psychology: General Copyright 2003 by the American Psychological Association, Inc.2003, Vol. 132, No. 2, 163–201 0096-3445/03/$12.00 DOI: 10.1037/0096-3445.132.2.163
163

However, this explanation is deemed unsatisfactory by most re-searchers. Not only does it violate current knowledge of brainorganization (Farah, Meyer, & McMullen, 1996), in that there isstrong evidence that brain systems are organized by functionand/or modality (Martin, Ungerleider, & Haxby, 2000; Thompson-Schill, Aguirre, D’Esposito, & Farah, 1999), but in addition anumber of patients have presented with patterns of deficits thatcross domain boundaries, making it unlikely that knowledge isorganized by domain (e.g., impaired knowledge of creatures andfruits/vegetables, musical instruments, nonliving foods, and gem-stones vs. relatively spared knowledge of other nonliving things;Warrington & Shallice, 1984).
A number of theories of semantic memory organization havebeen proposed to account for these patterns of deficits. The majortheories include the conceptual structure account (Tyler & Moss,2001), the correlated and distinguishing features account (Devlin,Gonnerman, Anderson, & Seidenberg, 1998; Gonnerman, Ander-son, Devlin, Kempler, & Seidenberg, 1997), the domain-specifichypothesis (Caramazza & Shelton, 1998), the hierarchical interac-tive theory (HIT; Humphreys & Forde, 2001), the organized uni-tary content hypothesis (OUCH; Caramazza, Hillis, Rapp, & Ro-mani, 1990), the psychological distance theory (Dixon, Bub, &Arguin, 1997, 1998; Gaffan & Heywood, 1993), the sensory/functional theory (Warrington & Shallice, 1984), and the closelyrelated sensory/motor theory (Martin et al., 2000). The theoriesdifferentially emphasize the importance of several factors, includ-ing the types of knowledge typically used to describe and com-municate about objects (e.g., sensory vs. functional knowledge;Farah & McClelland, 1991; Warrington & Shallice, 1984); theproportion of information available about an object that distin-guishes it from other objects (Devlin et al., 1998; Warrington &McCarthy, 1987); similarity among objects, both visually andconceptually (Dixon et al., 1997, 1998; Humphreys, Riddoch, &Quinlan, 1988); the complexity of the object’s appearance (Funnell
& Sheridan, 1992; Humphreys et al., 1988); how often one en-counters, hears, or reads about various objects (concept familiarityand concept name frequency; Warrington, 1975); and regularitiesin the degree to which features tend to co-occur (Caramazza et al.,1990; Gonnerman et al., 1997; McRae, de Sa, & Seidenberg, 1997;Tyler & Moss, 2001). Thus, the theories can be compared andcontrasted on the basis of the importance placed on each factor.
Table 1 summarizes the factors implicated in explainingcategory-specific semantic deficits. The implicated factors columndelineates the factors that are explicitly stated to be important ineach theory. The absence of a factor from a cell in this columndoes not necessarily mean that it is inconsistent with the theory;rather, the factor does not play an explanatory role in currentexpositions of the theory. The inconsistent factors column, how-ever, highlights those factors that, if empirically supported, couldbe used to argue against a theory. The sparseness of entries in thiscolumn suggests that the theories share more similarities thandifferences.
Many of the similarities among the theories are due to sharedunderlying assumptions about the structure of the semantic system.All theories admit the existence of distinct representational areasfor distributed visual, semantic, and lexical representations. Be-tween layers, they all allow for weighted mappings that determinehow the representational layers influence one another as parts of adynamic, interactive system. To a large extent, these similaritiesare captured by the most recent model, Humphreys and Forde’s(2001) HIT, and the general acceptance of these principles isreflected in the primarily positive tone of the commentaries ac-companying that article. In Figure 1, we depict the general archi-tecture that can be abstracted from across all the models and mapout the regions of the architecture at which each of the factorsmentioned in Table 1 would be expected to have their primaryinfluences.
Table 1Description of the Theories Designed to Account for Category-Specific Semantic Deficits
Theories Implicated factors Inconsistent factorsTypes of deficits for which thetheory is designed to account
Conceptual structure account Correlated features Knowledge types Semantic deficitsDistinguishing featuresConcept similarity
Correlated and distinguishing features Correlated features Semantic deficitsDistinguishing featuresConcept similarity
Domain-specific hypothesis Domain-specific processing channels Semantic deficitsNaming deficits
Hierarchical interactive theory Visual similarity Visual deficitsConcept similarity Semantic deficitsKnowledge types Naming deficitsFamiliarityConcept name frequency
Organized unitary content hypothesis Concept similarity Knowledge types Semantic deficitsCorrelated features
Psychological distance account Visual similarity Visual deficitsVisual complexity Semantic deficitsConcept similarity
Sensory/functional theory Knowledge types Semantic deficitsDistinguishing features
164 CREE AND MCRAE
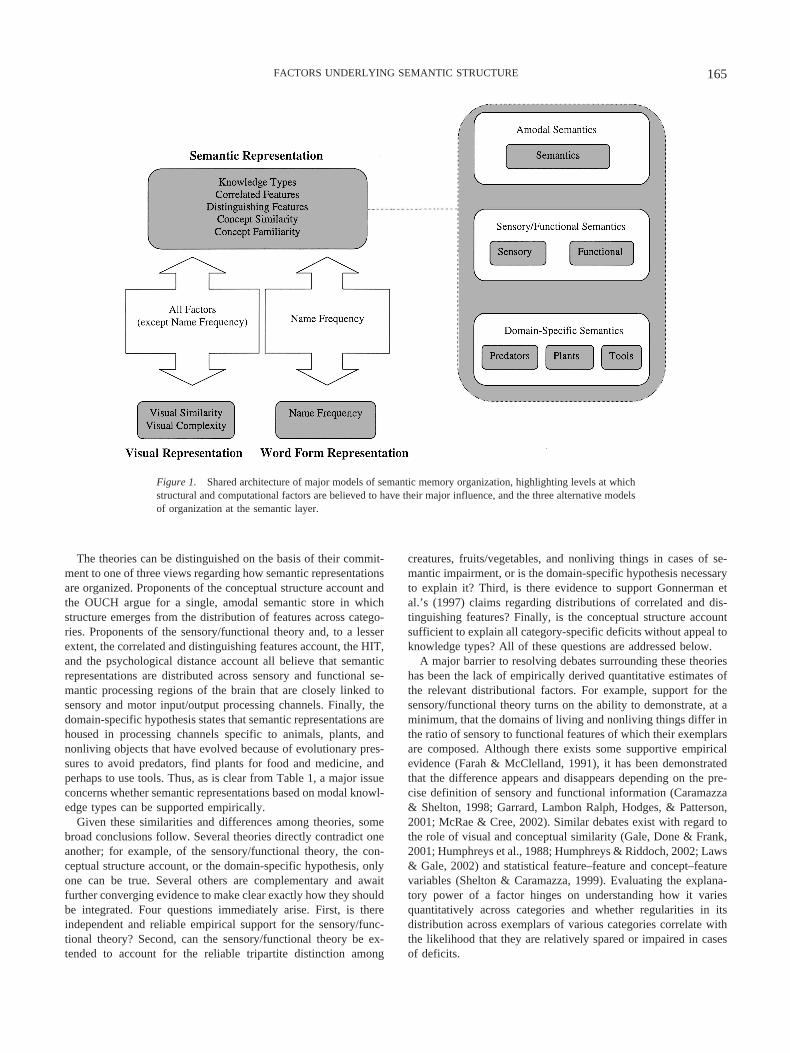
The theories can be distinguished on the basis of their commit-ment to one of three views regarding how semantic representationsare organized. Proponents of the conceptual structure account andthe OUCH argue for a single, amodal semantic store in whichstructure emerges from the distribution of features across catego-ries. Proponents of the sensory/functional theory and, to a lesserextent, the correlated and distinguishing features account, the HIT,and the psychological distance account all believe that semanticrepresentations are distributed across sensory and functional se-mantic processing regions of the brain that are closely linked tosensory and motor input/output processing channels. Finally, thedomain-specific hypothesis states that semantic representations arehoused in processing channels specific to animals, plants, andnonliving objects that have evolved because of evolutionary pres-sures to avoid predators, find plants for food and medicine, andperhaps to use tools. Thus, as is clear from Table 1, a major issueconcerns whether semantic representations based on modal knowl-edge types can be supported empirically.
Given these similarities and differences among theories, somebroad conclusions follow. Several theories directly contradict oneanother; for example, of the sensory/functional theory, the con-ceptual structure account, or the domain-specific hypothesis, onlyone can be true. Several others are complementary and awaitfurther converging evidence to make clear exactly how they shouldbe integrated. Four questions immediately arise. First, is thereindependent and reliable empirical support for the sensory/func-tional theory? Second, can the sensory/functional theory be ex-tended to account for the reliable tripartite distinction among
creatures, fruits/vegetables, and nonliving things in cases of se-mantic impairment, or is the domain-specific hypothesis necessaryto explain it? Third, is there evidence to support Gonnerman etal.’s (1997) claims regarding distributions of correlated and dis-tinguishing features? Finally, is the conceptual structure accountsufficient to explain all category-specific deficits without appeal toknowledge types? All of these questions are addressed below.
A major barrier to resolving debates surrounding these theorieshas been the lack of empirically derived quantitative estimates ofthe relevant distributional factors. For example, support for thesensory/functional theory turns on the ability to demonstrate, at aminimum, that the domains of living and nonliving things differ inthe ratio of sensory to functional features of which their exemplarsare composed. Although there exists some supportive empiricalevidence (Farah & McClelland, 1991), it has been demonstratedthat the difference appears and disappears depending on the pre-cise definition of sensory and functional information (Caramazza& Shelton, 1998; Garrard, Lambon Ralph, Hodges, & Patterson,2001; McRae & Cree, 2002). Similar debates exist with regard tothe role of visual and conceptual similarity (Gale, Done & Frank,2001; Humphreys et al., 1988; Humphreys & Riddoch, 2002; Laws& Gale, 2002) and statistical feature–feature and concept–featurevariables (Shelton & Caramazza, 1999). Evaluating the explana-tory power of a factor hinges on understanding how it variesquantitatively across categories and whether regularities in itsdistribution across exemplars of various categories correlate withthe likelihood that they are relatively spared or impaired in casesof deficits.
Figure 1. Shared architecture of major models of semantic memory organization, highlighting levels at whichstructural and computational factors are believed to have their major influence, and the three alternative modelsof organization at the semantic layer.
165FACTORS UNDERLYING SEMANTIC STRUCTURE
Main Hypothesis
One method that has shown promise for providing relevantevidence is feature norming. Feature-norming studies involve ask-ing participants to list the features they think are important forentities and objects. This method has provided novel insights intoaccounts of living/nonliving dissociations (Devlin et al., 1998;Garrard, Lambon Ralph, Hodges, & Patterson, 2001). However,those analyses have used small sets of concepts (see, e.g., Garrard,Lambon Ralph, Hodges, & Patterson, 2001, used 64 concepts) andtherefore do not provide insight into the full breadth of factorsacross a large set of concepts. This was remedied by McRae andCree (2002), who used a large set of feature-production norms for549 concepts to investigate how domains and categories differ interms of the ratios of knowledge types and the proportion ofcorrelated and distinguishing features of which their exemplars arecomposed. More specifically, McRae and Cree used a detailedcognitive knowledge-type taxonomy (28 types) developed by Wuand Barsalou (2002; henceforth referred to as WB) to analyze howthe exemplars of 37 empirically derived categories differed interms of the types of features provided by participants. Contrary toclaims that living and nonliving things do not differ in terms of theratio of sensory to functional features, they differed by at least a2:1 ratio on 15 of the 28 knowledge types. McRae and Cree thenconstructed a representation of the 37 categories in terms of theimportance of each knowledge type in each category. Hierarchicalcluster analyses based on this representation provided insight intomany of the patterns of impairment that have been reported in theliterature. Finally, when the categories were sorted on the basis ofthe proportion of each exemplar’s features that are distinguishing,they clearly grouped by domain, with the nonliving things havingthe most distinguishing features, followed by the fruits/vegetables,and finally the musical instruments and creatures. McRae and Creeconcluded that it may be possible to explain the observed patternsof impairment in the patient data through appeal to a combinationof the factors that structure semantic representations and influencesemantic computations. These findings served as a major impetusfor conducting the research reported herein.
In the current study, we derived quantitative estimates from a setof semantic feature production norms for 541 concepts span-ning 34 categories, easily the largest such set in existence. Wesignificantly extended our previous research by improving themajor knowledge type, distinguishing features, and correlated fea-tures analyses; by presenting knowledge-type analyses based onbrain regions; and by presenting analyses of feature distinctive-ness, visual similarity, semantic similarity, visual complexity, con-cept familiarity, and word frequency. One further factor, form–function correlations, has also been hypothesized to play a role inexplaining category-specific semantic deficits (Caramazza et al.,1990; De Renzi & Lucchelli, 1994; Tyler & Moss, 1997, 2001).Unfortunately, we were not able to test this hypothesis because itwas not clear how to derive a measure of the strength of thesecorrelations from our feature norms.
We used these measures to provide insight into the followingobservations: The specific patterns of data reported in cases ofcategory-specific semantic deficits arise from numerous sources,including the type and location of brain damage, variation inpatients’ premorbid knowledge, and variation in the tasks andstimuli used to establish deficits. Yet, despite this variability in
testing, stable results have emerged in terms of the categories thattend to be relatively impaired or spared together. This suggested tous that, contrary to theories that focus on individual factors, theremust be numerous factors contributing to the structure and com-putation of the meaning of concrete nouns that converge probabi-listically to produce stability in results. Our goal was to provideempirical evidence regarding the role of each factor. We accom-plished this by showing how the variables are distributed quanti-tatively across categories and by testing whether these distribu-tional statistics can account for the regularities in patterns ofimpairment observed across patients. In this article, we describehow we tested each factor independently, then at the end present ananalysis that combines them. Focus is placed on analyses at thelevel of superordinate categories such as fruits and tools and onsets of superordinate categories such as creatures, fruits/vegeta-bles, and nonliving things. We also focus on data generalizedacross patients, rather than specific cases, so that we deal withrelatively stable empirical phenomena. We then use these results toderive conclusions regarding current theories of semantic memoryand associated accounts of category-specific deficits.
Sources of Variability in Case Studies
A number of sources of variability across case studies haveimplications for category-specific deficits. First, the diverse causesof brain damage (e.g., herpes simplex encephalitis, dementia of theAlzheimer type, cerebral infarcts) produce variation in both thedegree to which the anterior and inferolateral temporal regions ofcortex are affected (see Gainotti, 2000, for a review) and the natureof the damage in these regions (focal vs. nonfocal). Second, timeis a source of variability in two ways: the influence that braindamage can have on concentration and attention within and acrosstest sessions, affecting test–retest reliability (Hultsch, MacDonald,Hunter, Levy-Bencheton, & Strauss, 2000; Shallice, 1988), and interms of the time period between the occurrence of damage, oronset of disease, and patient testing. Third, differences in patients’premorbid knowledge can influence the detail and complexity ofsemantic representations across categories (Dixon, Desmarais,Gojmerac, Schweizer, & Bub, 2002; Tanaka & Taylor, 1991).Some such differences have been linked to gender (e.g., womenmay know more about furniture and fruits/vegetables, whereasmen may know more about tools; Albanese, Capitani, Barbarotto,& Laiacona, 2000), and these differences might be amplified inolder populations who are more likely to have a stroke or adegenerative disease. Fourth, case studies differ in the tasks used,usually involving a subset of picture naming, word–picture match-ing, spoken-to-written-word matching, naming to definition, def-inition from words or pictures, object decision, feature verification,sound identification, identification from touch, part decision (doesthis part belong on this object?), and viewpoint matching. Thesetasks vary in numerous ways, including difficulty and the types ofknowledge and computations required for performance. Finally,there is variation across studies in the categories, concepts, andfeatures used as probes. Often, a small set of items is selected froma large domain without regard to how exemplars vary on thetargeted factor and how the chosen subset of exemplars score onthat factor. At the extreme, some patients’ reported deficits havereversed when tested on different exemplars (Laws, 1998; Moss,Tyler, & Jennings, 1997).
166 CREE AND MCRAE
Behavioral Trends in the Patient Data
Despite the numerous sources of variation in tests for category-specific semantic deficits, there exist consistent trends in the datain terms of the categories that tend to be impaired/spared together.We identified 10 studies that both reported their items and encom-passed the spectrum of patterns of deficits typically reported. Ourtrends are based primarily, but not exclusively, on the following 10articles: Caramazza and Shelton (1998); Farah and Wallace(1992); Hart, Berndt, and Caramazza (1985); Hart and Gordon(1992); Hillis and Caramazza (1991); Hillis, Rapp, Romani, andCaramazza (1990); Sacchett and Humphreys (1992); Silveri andGainotti (1988); Warrington and McCarthy (1983); and War-rington and Shallice (1984).
Trend 1: Creature categories pattern together and can be sep-arately impaired. Note that we use the term creatures (e.g., ani-mals, mammals, birds, reptiles) to avoid confusion with animals,which is one of the 34 categories we examined.
Trend 2: Nonliving-things categories pattern together and canbe separately impaired. These exclude musical instruments andfoods.
Trend 3: Fruits/vegetables pattern together and can be sepa-rately impaired.
Trend 4: Fruits/vegetables can pattern with either the creaturesor the nonliving things.
Trend 5: Nonliving foods can be impaired along with livingthings. When patients have been tested on the category of foods, ithas almost always included only nonliving exemplars such as cake,bread, and cheese. It is therefore interesting that foods can beimpaired along with living things.
Trend 6: Musical instruments can be impaired along with livingthings. This is peculiar, given that they are nonliving things.
Trend 7: Living-things deficits are much more frequent thannonliving-things deficits.
We used these trends as the target behavioral phenomena for ourinvestigation because they are most often the bases for argumentsregarding theories of category-specific deficits. Furthermore, ournorms include a number of exemplars of the relevant categories.We are unable to comment on an additional trend that body partscan be impaired along with nonliving things because our norms donot include body parts (see Barbarotto, Capitani, & Laiacona,2001, for a recent review). We decided against collecting normsfor body parts because they are, by definition, parts, whereas ournormed concepts refer to entire objects.
Semantic Feature Production Norms
The analyses presented herein, with the exception of those basedon concept familiarity and word frequency, are based on semanticrepresentations derived from a large set of semantic feature pro-duction norms that have been collected over several years. The 541concepts in the norms were chosen to include those most oftenused in studies of concepts and categorization, semantic memory,and impairments of semantic memory. In the norming task, par-ticipants, primarily undergraduate students, were given 20 or 24concept names such as cat and chair, with 10 blank lines beneatheach name, and were asked to list features of the things to whichthe words referred. Each participant received no more than twosimilar concepts (e.g., cougar and leopard), and if two similar
concepts were given to the same participant, they were presentedon separate pages. Thirty participants listed features for eachconcept. After the experimenters recorded the features in a com-puter file (which is described in detail for a subset of the conceptsin McRae et al., 1997), a representation was derived for eachconcept by retaining all features listed by at least 5 of 30 partici-pants so that idiosyncratic responses were excluded. Thus, thenorms provide empirically based featural representations for 541concepts. Examples of two representations are presented in Ap-pendix A.
As we and others have argued previously (Barsalou, 1999;McRae et al., 1997), we do not believe that semantic knowledge isstored in the brain literally as a list of verbalizable features. We dobelieve, however, that when participants call to mind features tolist in the norming task, they directly tap into representations thathave developed through repeated multisensory exposure to, andinteractions with, the various objects. These representations arealso shaped by the types of explicit knowledge highlighted inknowledge-based theories of conceptual representation (Barrett,Abdi, Murphy, & Gallagher, 1993). Thus, empirically derivedfeatures are assumed to provide a window into semantic memory,rather than a veridical record of semantic representations. Further-more, we do not claim that the level of information tapped by thefeature listing task is all that there is to semantic knowledge.Clearly, people know a lot more than this about category structure,including relations among features, causal relations, and categorycoherence (Sloman, Love, & Ahn, 1998; Waldmann, Holyoak, &Fratianne, 1995), and accounting for performance on some tasksdemands more complex types of knowledge than features provide(Keil, 1989). However, the fact that participants in feature normingstudies provide information that is important to many types ofsemantic tasks is evidenced by the multiple empirical successes ofthis approach (Hampton, 1997; McRae, Cree, Westmacott, & deSa, 1999; Rosch & Mervis, 1975). Crucially in the present case,because the behavioral phenomena associated with category-specific semantic deficits appear to best be captured by feature-based representations, we focused exclusively on this level ofrepresentation.
Categories
To study how the relevant factors are distributed quantitativelyacross categories, we needed to derive categories and their exem-plars. Typically, researchers have designated categories and theirexemplars a priori on the basis of intuition. In contrast, the normsenabled an empirical approach because participants were told thatit was acceptable to include in their feature lists the category (orcategories) to which the concept belongs, and they often producedthis information. To determine category membership, we selectedfrom the norms all concepts for which a superordinate categorywas produced by at least two participants. A superordinate cate-gory was included in our analyses if there were at least sixconcepts for which it was produced by at least two participants andthere were at least two concepts for which it was listed by morethan four participants. Bug was excluded as a category because itwas synonymous with insect, which was included, and toy wasexcluded because although some participants categorized conceptssuch as tractor as a toy, the features they listed pertained to realtractors rather than toy ones.
167FACTORS UNDERLYING SEMANTIC STRUCTURE

A concept was included as an exemplar of a category if at leasttwo participants listed the category name as a feature of theconcept, with a few exceptions. Because food has been tested inthe category-specific deficits literature using only nonliving thingssuch as cake and pie, we removed all fruits, vegetables, and fish,plus rice and walnut, from the category food. In addition, weremoved 26 exemplars in total because they were blatant errors(e.g., salamander as a fish). These selection criteria resulted in 34categories, ranging in size from 133 exemplars (animal) to 6exemplars (food). Concepts varied in the number of categories towhich they belonged. An extreme example is alligator, which wasincluded in the animal, reptile, carnivore, and predator categories.At the other end of the continuum, 110 nonliving things were notincluded in any category (e.g., anchor, certificate). These wereanalyzed as a miscellaneous nonliving-things category. Finally,three trees were not in any category (birch, cedar, pine). Note,therefore, that results reported for the 34 categories are based on538 concepts, rather than 541.2 The list of those 538 concepts bycategory is presented in Appendix B.
Factor 1: Knowledge Types
One of the most active debates in this area concerns the degreeto which different kinds of semantic knowledge are distributedacross the cortex. On one side stand those who believe thatsemantic knowledge is instantiated as distributed patterns of ac-tivity across modality-specific processing regions that are situatedbeside and are closely linked to perceptual-processing areas (All-port, 1985; A. R. Damasio, 1989; Farah & McClelland, 1991;Humphreys & Forde, 2001; Warrington & McCarthy, 1987; War-rington & Shallice, 1984). Thus, a concept’s representation is thesum of the activation across primary sensory-processing channels,motor/action areas, higher order abstract-knowledge areas, andmediating association areas. On the other side are those who claimthat semantic knowledge is stored in a modality-neutral semanticprocessing area (Caramazza et al., 1990; Sartori & Job, 1988;Tyler & Moss, 2001) and that semantic knowledge is transducedfrom patterns of activation in sensory processing regions intoamodal semantic representations.
Empirical support for the modality-specific viewpoint rests ondemonstrating the differential importance of sensory versus func-tional knowledge in the representations of living and nonlivingthings, respectively (Farah & McClelland, 1991). Proponents as-sume that the principles governing the formation of neural con-nections make it likely that semantic information related to spe-cific input/output modalities is stored in regions close to theirrelated sensory-input and motor-output processing regions (H.Damasio, Grabowski, Tranel, Hichwa, & Damasio, 1996; McGuire& Plaut, 1997; Tranel, Damasio, & Damasio, 1997). One type ofevidence supporting the sensory/functional theory is analyses ofthe verbal descriptors people use when they define and talk aboutobjects (Farah & McClelland, 1991; Garrard, Patterson, Watson &Hodges, 1998; McRae & Cree, 2002). The validity of these anal-yses is predicated on the assumption that when people define ordescribe objects, they instantiate a multisensory image (e.g., aperceptual symbol-system simulation; Barsalou, 1999) and readthe salient features from that image, perhaps with some emphasison the features that distinguish the object from other similarobjects. Thus, if certain modalities of knowledge correspond to
particular modalities of information in an object’s representation,this will be reflected in the relative proportions of each type offeature listed in a norming task. The second type of evidencesupporting the sensory/functional theory consists of neuroimagingstudies that explore the cortical regions activated when peopleengage in semantic computations involving various types of objectknowledge (Martin & Chao, 2001; Martin, Wiggs, Ungerleider, &Haxby, 1996). The validity of data from neuroimaging studies ispredicated on the assumption that when people perform relevantconceptual tasks, the neural regions responsible for processingtypes of knowledge are differentially activated.
The first empirical evidence to support the differential weight-ing hypothesis was presented by Farah and McClelland (1991),who had participants underline visual and functional descriptors indictionary definitions of living and nonliving things. Participantsunderlined a greater number of visual descriptors for living (2.60)than for nonliving things (1.57) but fewer functional descriptorsfor living (0.35) than for nonliving things (1.11). Farah and Mc-Clelland concluded first, that visual information is relatively moreimportant than functional information for living things, whereasthis is not so for nonliving things, and second, that visual infor-mation in terms of the number of attributes underlined is prevalentfor both, whereas functional information is prevalent for nonlivingthings only. Supportive evidence has been reported both in theneuroimaging literature (Thompson-Schill et al., 1999) and inFarah and McClelland’s computational model that simulated therelevant behavioral phenomena of the time. Thompson-Schill et al.(1999) used functional magnetic resonance imaging (fMRI) todemonstrate that visual-processing areas (left fusiform gyrus) areactivated when accessing both visual and functional knowledgeabout living things but are activated when accessing only visualknowledge about nonliving things. They concluded that becausefunctional knowledge is relatively impoverished for living things,
2 Note that there are a number of changes from McRae and Cree (2002).First, three small categories (amphibian, boat, and tree) were excludedwhen the criterion changed from a minimum of five to six exemplars.Second, in the present case, it was assumed that when subjects listed �acar� for concepts such as jeep, they were using a short, high-frequencyword that is synonymous with �an automobile�. Therefore, the produc-tion frequencies of those two taxonomic features were amalgamated,resulting in a new category, automobile. Third, instrument is no longer acategory and actually should not have been in McRae and Cree. Fourth, wedid not remove gun because it was both an exemplar and a category.Furthermore, this criterion was inconsistently applied in McRae and Cree,in that house and building were included in their analyses. Fifth, themiscellaneous nonliving-things category was added herein to include thoseitems in the analyses. Sixth, seven concepts have since been removed fromthe norms because of ambiguity apparent in participants’ responses (club:stick vs. organization; crane: bird vs. machine; file: nail file vs. paper in acabinet; needle: sewing vs. hypodermic; skates: ice vs. roller; squash:vegetable vs. sport; and vice: tool vs. bad habit), and one has been removedbecause of unfamiliarity (many participants mistook herring for heron).Note also that although the text of McRae and Cree stated that all exem-plars listed by at least one participant were included, this was an error. Asin the present case, exemplars listed by at least two participants wereincluded. Finally, the norms were scrutinized once again with the help ofa colleague, and some of the revisions that ensued from that processresulted in small changes in various statistics.
168 CREE AND MCRAE

computing it requires support from visual representations, whereasthis is not the case for nonliving things.
However, neither of these sources of evidence have gone un-challenged. Caramazza and Shelton (1998) claimed that Farah andMcClelland’s (1991) instructions of what should count as sensory(visual appearance) and functional knowledge (“what the itemdoes or what it is for,” Farah & McClelland, 1991, p. 342) wereoverly restrictive. Indeed, when they replicated Farah and McClel-land’s study using broader definitions (all sensory vs. all non-sensory properties), they found no evidence to support themodality-specific viewpoint (see also McRae & Cree, 2002). Con-cerns also surround the neuroimaging evidence. For example,demonstrating that a neural area is activated reliably by items froma specific domain of knowledge does not imply that the area isnecessary for performing the task at hand (Bub, 2000; Bub &Bukach, 2001). Furthermore, questions have been raised about theappropriateness of statistical tests used to evaluate neuroimagingstudies and inconsistencies across studies in the areas claimed tobe involved in semantic processing (Devlin et al., 2002; Tyler &Moss, 2001). Finally, tests that purport to investigate differences inthe processing of visual versus functional knowledge have useditems that were inadequately controlled for difficulty (Caramazza& Shelton, 1998) and appropriateness of content (Cree & McRae,2001). Although more recent and detailed analyses of the ratios ofsensory to functional features in feature norms (Garrard, LambonRalph, Hodges, & Patterson, 2001; McRae & Cree, 2002) andrecent neuroimaging studies using high-resolution fMRI scanners(Chao, Haxby, & Martin, 1999) have alleviated some of theseconcerns, a healthy skepticism is warranted. More importantly,even if these issues were resolved, a fundamental problem stillremains for the current formulation of the sensory/functional the-ory: The sensory/functional theory, in its current formulation, isincapable of accounting for reports that the domains of creatures(Caramazza & Shelton, 1998), fruits/vegetables (Farah & Wallace,1992), and nonliving things (Warrington & McCarthy, 1987) canbe independently impaired (i.e., the tripartite distinction).
There simply are too few degrees of freedom in a modality-specific theory with only two types of knowledge to account forthe first six trends in impairment outlined above. Although re-searchers have stated that a more complete formulation of thetheory will include all relevant modality-specific processing chan-nels (sound, smell, taste, touch; Allport, 1985; Warrington &McCarthy, 1987), effectively adding degrees of freedom, this hasyet to be formulated and defended empirically. As Caramazza andShelton (1998) have pointed out,
The claim that the relative weighting of the sensory and functionalproperties for discriminating among members of a semantic categoryprovides the binding factor for some of the observed associations ofcategory-specific deficits has never been developed in enough detailto allow serious consideration of its merits. (p. 5)
To remedy this situation, we present two detailed analyses of themodality-specific theory of semantic organization.
The first analysis used the WB detailed knowledge-type taxon-omy, which was developed independently of issues regardingcategory-specific deficits. Initially, we classified our features ac-cording to this taxonomy to better understand our norms and todevelop stimuli for experiments with normal participants (McRaeet al., 1999) and then only more recently applied it to category-
specific deficits. We previously presented analyses using thisknowledge-type taxonomy in McRae and Cree (2002). The firstanalysis presented herein was designed to obviate possible con-cerns with our previous analysis. The second analysis was basedon a knowledge-type taxonomy that reflects known cortical pro-cessing regions, thus testing a version of the sensory/functionaltheory extended to nine knowledge types on the basis of currentunderstanding of cortical processing regions. To date, little empir-ical evidence has been brought forth to support a specific decom-position into knowledge types in this manner and to provide aprecise demonstration of the role that each knowledge type mightplay in distinguishing among categories (although, see Martin etal., 2000, and Tranel, Damasio, & Damasio, 1997, for evidencepertaining to, and discussion of, these issues).
Wu and Barsalou’s (2002) Knowledge-Type Taxonomy
WB developed a knowledge-type taxonomy as part of studyingperceptual simulations. They took a number of factors into account(L. W. Barsalou, personal communication, December 1999). First,the feature types were designed to cover the tremendous varietythat participants generate when describing conceptual content.Second, they were intended to capture the wide variety of infor-mation found in ontological kinds (Keil, 1989) and in event framesand verb arguments (Barsalou, 1992; Fillmore, 1968; Schank &Abelson, 1977). Third, they were designed to correspond system-atically to the modality-specific regions of the brain. Fourth, thefeature types for entities reflect well-established channels of sen-sory information in perception (e.g., shape, surface, occlusion,movement). Fifth, they reflect aspects of introspective experience,as well as sensory-motor experience. The resultant taxonomypartitions features into four major classes: entity, situation, intro-spective, and taxonomic features. Features are then further subdi-vided within each class.
Given differences in the norming procedures used by WB andourselves and resulting discussions with them, we have madeseveral minor adjustments to the WB taxonomy. First, we addedthe feature type made-of because made-of features are frequent inour norms yet they did not fit into any existing WB feature type(they have subsequently added it). Second, ontological featureswere combined with superordinate features to avoid introducing aliving/nonliving distinction. Third, abstract features were coded assystemic features (bread �is nutritious�). Finally, because theWB taxonomy was designed to capture information about objectsand the typical situations into which they enter whereas our normsare designed to capture information about the objects themselves,there are no spatial relations, situation quantities, situation events,situation states of the world, representational states, or introspec-tive quantities in our norms. Furthermore, there are no repetitionsin our norms, and metacomments are idiosyncratic.
We previously used the WB taxonomy to examine how thesalience of knowledge types differs across the domains of livingversus nonliving things and across 37 categories (McRae & Cree,2002). The present analyses differ in a few ways. First, we wereconcerned that distinctions among categories were in part attrib-utable to the fact that living things typically belong to morecategories than do nonliving things and therefore have more tax-onomic features (in particular, superordinates). Therefore, all fivetypes of taxonomic features were omitted from the present analy-
169FACTORS UNDERLYING SEMANTIC STRUCTURE
ses. In fact, no taxonomic feature is included in any analysispresented in this article (although the superordinates formed thebasis for deriving categories, of course). Second, we collapsedaction and manner features into one class because of their closerelationship. Thus, the current WB analyses are based on 22feature types, as presented in Appendix C. Finally, as outlinedabove, the slightly revised criteria for selecting categories resultedin 34 categories for all analyses presented herein.
To explore the role that feature types play in discriminatingamong the relevant sets of categories, we conducted a hierarchicalcluster analysis and interpreted it with respect to the category-leveltrends. We constructed a matrix in which the 34 categories wererepresented in terms of the salience of each WB feature type. Eachmatrix element corresponded to the number of features of a spe-cific feature type summed across all of the category’s exemplars.For example, because 131 WB function features were listed forthe 34 tool exemplars, the tool–WB function element had a valueof 131. This representation captures the salience of the featuretypes for each category by ignoring the specific feature but regis-tering that a feature of that type was listed for a category exemplar.An important consequence of coding vectors by feature type, asopposed to individual features, is that the resulting representationcarries some information about feature similarity. In representa-tions based on individual features, such as those used in publisheddistributed models of semantic memory (Hinton & Shallice, 1991;McRae et al., 1997), the degree to which features are similar is notrepresented in any direct manner (although it may be representedto some extent in terms of feature correlations). For example, ifeach feature is represented by a separate node, �made of cotton�is as similar to �has wings� as it is to �made of wool�. Incontrast, coding by feature type captures feature similarity at thislevel.
The matrix was entered into an average-linkage between-groupshierarchical cluster analysis using SPSS. This method of formingclusters begins by treating each of the 34 categories as a separatecluster and then agglomerating categories on the basis of the meandistances of all members in each cluster. Thus, categories and theresulting clusters are grouped on the basis of overall similarity ofentire clusters, rather than the options of using nearest or farthestneighbors of clusters. Cosine, a measure of the angle between thecategory vector representations (the inner product of two vectorsdivided by the product of the vector lengths), was used as themeasure of similarity. Comparable results were found using otherclustering algorithms and measures of similarity. The resultantdendogram is presented in Figure 2.
A dendogram represents similarity in two ways. The distancebetween terminal symbols (category names in Figure 2) generallyreflects similarity. For example, vehicle is directly above automo-bile, and herbivore is directly above mammal. However, the morereliable indicator of similarity is the distance at which categories orclusters of categories are joined. The closer that the vertical linejoining two clusters is to 0 on the scale at the top of Figure 2, themore similar are the clusters. This scale is arbitrary except that 0indicates identical clusters, whereas 25 indicates minimal clustersimilarity for these data.
Figure 2 shows definable clusters corresponding to each of thethree major domains of creatures, fruits/vegetables, and nonlivingthings, respecting the tripartite distinction. In addition, the clusteranalysis closely mirrors the other category-level trends, in that
musical instruments do not cluster closely with any category andjoin the nonliving things at a very late stage, and foods cluster withthe fruits/vegetables. To understand the solution, we compared thevariances of the feature types across categories. A feature type’svariance is related directly to its influence on the cluster results; ifthe cases (categories) do not vary on a variable (feature type), thereis no basis on which to differentiate among them and thus clusterthem. We began by normalizing the representations for the 34categories, correcting for differences in the raw number of con-cepts and features by category. This is part of the cosine measureused in the cluster analysis. The variance of each feature type wasthen calculated across the 34 categories. In decreasing order,variance was greatest for WB functions, entity behaviors, externalcomponents, made-of features, internal surface properties, externalsurface properties, locations, and internal components. It decreasedby 37% from the internal components (0.0108), which we includedwhen investigating why the analysis succeeded, to the first ex-cluded feature type, systemic properties (0.0068). We then con-ducted a principal components analysis on the matrix that wasentered into the cluster analysis. The eight most variant featuretypes loaded on the first three principal components. On the basisof these two criteria, we scrutinized those eight feature types,which constituted 82% of the total number of features relevant tothe cluster analysis.
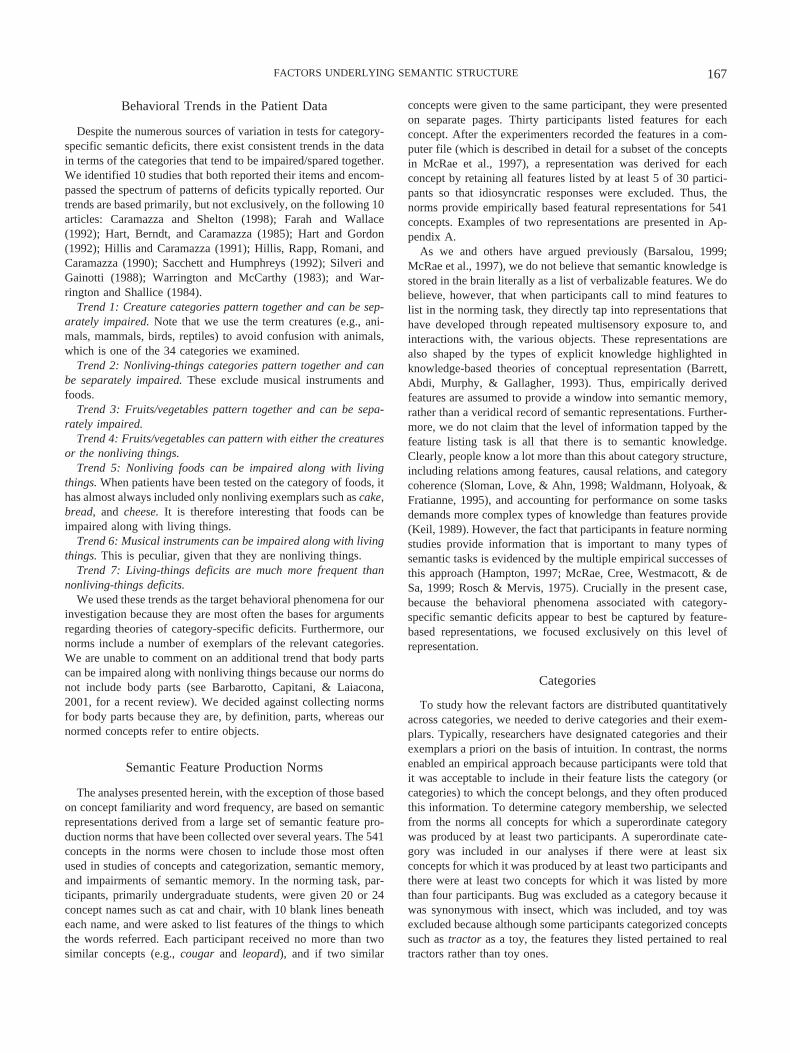
To illustrate how the categories differ in terms of the importanceof feature types, we provide eight figures depicting the distributionof feature-type salience for the categories that contain the crea-tures, nonliving things, fruits/vegetables, and test cases (Figures3A–3H). The x-axis represents the scores, ranging from 0 to 0.799,increasing in increments of 0.05, with the first column of conesreflecting a score of 0, the next 0.001 to 0.05, and so on. A scoreof 0 reflects the fact that not a single feature of that type was listedfor any of the relevant exemplars. A score falling between 0.75and 0.799, which is the maximum range, implies that the featuretype was extremely prevalent in representations of the relevantexemplars. Along the y-axis are the three domains and the two testcases. The z-axis reflects the number of categories within eachdomain that fell within each range. The number of categoriesappears on each cone and is visually depicted by the volume of thecone for easy comparison.
Creatures. The 12 creature categories cluster at the top ofFigure 2. The creatures possess few WB functions (Figure 3A;creatures serve few functions for people), many entity behaviors(Figure 3B; creatures do many things on their own), no made-offeatures (Figure 3D; people do not think of a creature as made ofsomething), and few internal surface properties (Figure 3E; thisinformation is not salient to people, so it is rarely listed in featurenorms). In addition, 11 of the 14 highest ranked categories in termsof external components were creatures (Figure 3C; creatures pos-sess many salient external components). However, the creatureswere not distinguished from nonliving things on the basis ofexternal surface properties (Figure 3F), locations (Figure 3G), orinternal components (Figure 3H). That external surface propertiesplayed little role in discriminating between the domains is some-what surprising given the role that sensory features have played intheories of category-specific deficits, although external compo-nents were important.
Nonliving things. The 16 nonliving-things categories cluster inthe middle of Figure 2. They are high on WB functions (Figure
170 CREE AND MCRAE

3A), and the made-of features perfectly distinguish them from theother two domains (Figure 3D; what a nonliving thing is made ofis salient but does not apply to creatures or fruits/vegetables). Theyare separated from the creatures on entity behaviors (Figure 3B;nonliving things tend to do little on their own), with the fruits/vegetables interspersed among them. They also tend to possessfewer external components than do creatures (Figure 3C). Internalsurface properties (Figure 3E) do not distinguish the nonlivingthings from the creatures, although they do distinguish them fromthe fruits/vegetables and foods. Finally, the nonliving things werenot discriminated from the other categories in terms of externalsurface properties (Figure 3F), locations (Figure 3G), or internalcomponents (Figure 3H).
Fruits/vegetables. The four fruits/vegetables categories clustertightly, and they cluster at a late stage with the nonliving things
rather than the creatures. The fruits/vegetables are distinguished onthe basis of internal surface properties (Figure 3E). Furthermore,they are ranked 4th, 8th, 9th, and 10th in terms of internal com-ponents (Figure 3H). These results reflect the fact that their insidesare salient because people open them up and eat them. Likewise,external surface properties are relatively salient for fruits/vegeta-bles (Figure 3F), reflecting the fact that color and shape areimportant aspects of their representations. They cluster with thenonliving rather than the living things because they are inter-spersed throughout them on the basis of WB function (Figure 3A;people peel, cook, bake, and eat them), entity behaviors (Figure3B; they do very little on their own), and external components(Figure 3C; they tend to have few external components other than,for example, a peel and a stem). Finally, the fruits/vegetables are
(text continues on page 174)
Figure 2. Dendogram produced by the Wu and Barsalou (2002) knowledge-types hierarchical cluster analysis.misc. nonlt � miscellaneous nonliving thing.
171FACTORS UNDERLYING SEMANTIC STRUCTURE

Figure 3. Cone graphs depicting the salience of each Wu and Barsalou (WB; 2002) knowledge typecontributing significantly to the clustering solution for the 34 categories, presented by domain and test cases: (A)WB functions, (B) entity behaviors, (C) external components, (D) made-of, (E) internal surface properties, (F)external surface properties, (G) locations, and (H) internal components.

Figure 3. (continued)

not distinguished from the other categories on the basis of loca-tions (Figure 3G).
Foods. Although foods contain only nonliving things such ascake and pie, they cluster with the fruits/vegetables. Foods groupwith them in terms of WB function (Figure 3A; people cook andeat them), entity behaviors (Figure 3B; they do very little on theirown), and internal surface properties (Figure 3E; their inside issalient because it is a major factor determining whether they aregood to eat). Foods cluster relatively late with the fruits/vegetablesbecause they possess a greater number of made-of features (Figure3D; an apple is not made of something, but a cake is), fewerlocation features (Figure 3G; the locations in which fruits/vegeta-bles grow are relatively salient), and fewer internal components(Figure 3H; cake, pie, and bread have few internal components).Thus, the cluster analysis indicates that foods may be impairedwith living things because of their close relationship to fruits/vegetables in terms of salient feature types.
Musical instruments. This category serves as a valuable testcase because it often has been found, counterintuitively, to patternwith living things. In Figure 2, the musical instruments are thefinal category to cluster with the other nonliving things, highlight-ing the fact that they are different from these categories on severaldimensions. Musical instruments are relatively low in WB functionfeatures, with only one nonliving-things category ranking lower(Figure 3A; they are used for basically one reason, to play music).They are high in entity behaviors (Figure 3B), ranking with thecreatures, primarily because of the sounds that they make. It isinteresting to note that when Tranel, Logan, Frank, and Damasio(1997) conducted principal components analyses based on partic-ipants’ ratings of a number of dimensions of living and nonlivingthings, they found that sounds are important for discriminatingamong categories. Musical instruments are ranked higher than allbut two nonliving-things categories in terms of external surfaceproperties (Figure 3F) and lower than all of them in terms of
Figure 3. (continued)
174 CREE AND MCRAE

locations (Figure 3G) and internal components (Figure 3H). Fi-nally, they are in the middle of the nonliving things in terms ofexternal components (Figure 3C), made-of features (Figure 3D),and internal surface properties (Figure 3E). The clustering resultwith musical instruments is the only important difference betweenthis WB analysis and the WB analysis presented in McRae andCree (2002), in which they clustered late with the creatures. Thereare two things to note, however. First, musical instruments remainan outlier and clearly do not fit in well with the categories desig-nated as nonliving things. Second, a number of the susceptibilityanalyses presented below demonstrate why musical instrumentsoften pattern with the living things in terms of impairment.
Beyond a Sensory/Functional Dichotomy
Contrary to recent claims that theories based on differentialratios of knowledge types are insufficient to account for thetripartite distinction (Caramazza & Shelton, 1998; Mahon & Cara-mazza, 2001; Shelton & Caramazza, 1999), this knowledge-typeanalysis accounts for the distinction because it is more detailedthan a sensory/functional dichotomy. Furthermore, it providesinsight into the category-level trends, which are a more stringenttest. We outline three of the primary ways in which movingbeyond a sensory/functional dichotomy was essential to thissuccess.
First, in the WB taxonomy, internal components and internalsurface properties are separated from other sensory features. Theseknowledge types are important in explaining part of the tripartitedistinction in that they help distinguish the fruits/vegetables, forwhich these feature types are important, from creatures and non-living things, for which they are not. They also were a key reasonwhy foods clustered with the fruits/vegetables rather than with thenonliving things. It is difficult to know how these feature typeswould have been classified in, for example, the Farah and McClel-land (1991) dictionary-definition underlining task.
Second, it was important to separate entity behaviors (what athing does) from functional information (what humans use it for).Pulling apart these knowledge types is one reason why the crea-tures cluster separately from the fruits/vegetables and the nonliv-ing things. It also is part of the explanation of why musicalinstruments cluster so late with the other nonliving things. In Farahand McClelland’s (1991) dictionary-definition underlining task inwhich functional features were defined as “what it does or what itis used for,” these knowledge types would have been conflated,masking their potential role. Finally, made-of features played animportant role in several contrasts. Not only did they pull thenonliving things away from the other domains but, because theyare more salient for foods than for fruits/vegetables, they were onereason why foods clustered with the fruits/vegetables at a some-what late stage. It is unclear whether, in a dictionary-definitionunderlining task, participants would count this type of knowledgeas being sensory or non-sensory. For example, although the feature�made of metal� implies sensory properties such as being silverand shiny, it might also be considered to be a non-sensory state-ment about the manner in which the object is made.
Brain Region Knowledge-Type Taxonomy
An appealing aspect of the sensory/functional theory is that aclear argument can be made concerning how these knowledge
types map onto neural processing regions. A theoretical limitationof the WB knowledge-type analysis is that it is far from clear howthe 22 (or even the 8 most important) knowledge types map ontobrain regions. We believe that it would be misguided to attemptsuch a mapping because many of the knowledge types containfeatures that clearly map onto different brain areas. For example,the internal surface properties include features referring to taste,smell, texture, color, and other aspects of visual appearance. Anal-yses of this sort would be more convincing, and ultimately moreuseful for researchers who wish to tie knowledge types to brainregions that may be differentially damaged, if the taxonomy re-flected the brain regions thought to be responsible for processingeach type of knowledge. Therefore, we developed a knowledge-type taxonomy that we believe both can be linked to neuralprocessing regions and incorporates minimal assumptions. Weclassified features into nine knowledge types, three correspondingto visual information (visual–color, visual–parts and surfaceproperties, and visual–motion), four corresponding to other pri-mary sensory-processing channels (smell, sound, tactile, andtaste), one corresponding to functional/motor information regard-ing the ways in which people interact with objects (function), andone (encyclopedic) corresponding to all other knowledge types.Although we believe that these nine knowledge types are not theonly important types of information processed in distinct neuralregions, these are the only ones that we felt comfortable positinggiven the current state of the literature.
As was discussed earlier, proponents of knowledge-types theo-ries typically argue that semantic knowledge corresponding toeach modality is stored in brain regions close to, or even overlap-ping with, the primary sensory/motor processing channels in whichsemantic knowledge is grounded (Allport, 1985; H. Damasio et al.,1996; Martin & Chao, 2001; Warrington & McCarthy, 1987).Evidence for this type of theory comes in several forms. Detailedneurophysiological studies of neural systems have revealed sepa-rate processing channels for different types of sensory informationat early processing stages (e.g., color, form, and stereopsis; Hubel& Livingstone, 1987) that may continue into deeper processingregions. Evidence that semantic information is stored close torelated perceptual processing regions comes from positron emis-sion tomography, fMRI, and event-related potential (ERP) studiesin which regions close to, but not identical to, the perceptualprocessing regions were activated in tasks that tapped semanticknowledge pertaining to distinct modalities (see Martin & Chao,2001, for a review). We present a brief overview of this evidenceas it relates to the nine brain region knowledge types that wehypothesize.
Retrieval of knowledge about object color has been found toactivate ventral regions of the posterior temporal lobes (bilateralfusiform gyrus; Chao & Martin, 1999; Martin, Haxby, Lalonde,Wiggs, & Ungerleider, 1995) just anterior to ventral occipital areasactive during color perception (Corbetta, Miezin, Dobmeyer, Shul-man, & Peterson, 1990; Sakai et al., 1995; Zeki et al., 1991).Reports of similar patterns of activation during generation of colorimagery in unimpaired participants (Howard et al., 1998) and incolor-word synesthetes (Paulesu et al., 1995) provide convergingevidence that these areas are not simply driven by external input.Thus, we placed all color features in their own knowledge type(visual–color).
175FACTORS UNDERLYING SEMANTIC STRUCTURE

Second, knowledge about high-level visual form is thought to behoused in ventrooccipitotemporal cortex (Martin et al., 1996;Thompson-Schill et al., 1999). Overlapping regions plus those justanterior to these form-processing areas are activated when partic-ipants viewed real objects relative to nonsense objects (Martin etal., 1996). Thus, the visual–parts and surface properties knowledgetype included all external and internal components and all externaland internal surface properties that refer to visual aspects, exclud-ing color. Although the made-of features (e.g., key �made ofmetal�) could be interpreted as either visual (silver, shiny) ortactile (hard, cold) information (ignoring more complex semanticinformation that participants may have been trying to convey in acompact manner), we believed that participants were most likelyconveying visual information, so we coded them as visual–partsand surface properties.3
Third, generating action names when given the name of anonmanipulable nonliving thing (e.g., cart) produces activation inthe posterior region of the left middle temporal gyrus, just anteriorto sites active during motion perception (Martin et al., 1995).Areas superior to this, in the superior temporal sulcus, have beenimplicated in the processing of biological motion (Oram & Perrett,1994). Furthermore, damage to areas at the borders of the occipital,temporal, and parietal lobes can cause impaired motion perception(Zeki, 1991; Zihl, Von Cramon, Mai, & Schmid, 1991), andactivation in this area has been reported in unimpaired participantswho were viewing object motion (Beauchamp, Cox, & De Yoe,1997). The majority of entity behaviors in our norms correspond tobiological motion (e.g., �jumps�), albeit without capturing thecomplex relational information about the parts that make up themovements. The relevant features from that WB feature type wereclassified as visual–motion features.4
Likewise, few researchers would disagree that there are distinctsensory-processing channels for auditory, olfactory, taste, andtactile information. Recently, Allen, Inoue, Osterhout, andMcLaughlin (2002) presented fMRI data revealing activations inthe dominant hand and finger areas of primary somatosensory andmotor cortex when participants read adjectives referring to tactileproperties of objects and peak activation in olfactory areas (piri-form cortex and right lateral orbital-frontal cortex) when partici-pants read sentences containing adjectives referring to olfactoryinformation. Consistent with these patterns of activation, corre-sponding ERP data revealed large sources of current flow in theleft sensory-motor area for tactile adjectives and right lateral-frontal areas for olfactory adjectives 200–400 ms after word onset.On the basis of this and similar evidence, we removed all sound,smell, taste, and tactile features from their WB knowledge typesand placed them in their respective brain region knowledge types.
Objects with associated motor actions (function) activated re-gions in the left ventral premotor cortex when participants viewedpictures of them or name actions associated with them (Chao &Martin, 2000; Grabowski, Damasio, & Damasio, 1998; Grafton,Fadiga, Arbib, & Rizzolatti, 1997; Martin et al., 1996). Indeed,imagining manipulating objects can produce activation in theventral premotor cortex (Gerardin et al., 2000). Thus, because theaction/manner features in the WB taxonomy correspond roughly towhat people think of when they describe the motor movementsassociated with objects and the function and participant featuresdescribe the complex ways in which people interact with objects,
we hypothesized the existence of a function knowledge type thatcontained these three WB knowledge-type features (function).
Finally, features that did not fit the other eight knowledge typeswere classified as encyclopedic. Essentially, the encyclopedicknowledge type served as a catchall for semantic information thatcould not be clearly linked to a neural processing region or forwhich there was an insufficient number of features to justifycreating a new knowledge type. For example, although affect/emotion features could be argued to be linked to limbic regions, weclassified them as encyclopedic because there were only 23 suchfeatures.
We conducted a hierarchical cluster analysis and interpreted thesolution in terms of the category-level trends in impairment. Themethods were identical to those of the WB cluster analysis. Thedendogram, presented in Figure 4, can be interpreted as formingthree main clusters—creatures, fruits/vegetables, and nonlivingthings—thus preserving the tripartite distinction. In addition, thefoods cluster at a late stage with the fruits/vegetables, and themusical instruments essentially form their own cluster and join ata late stage with the nonliving things. Overall, the results areremarkably similar to those of the WB cluster analysis given thesubstantial differences between taxonomies.
We interpreted the cluster analysis using the same techniques asfor the WB cluster analysis. The knowledge types, in decreasingorder of magnitude of variance, were function, visual–motion,visual–parts and surface properties, encyclopedic, visual–color,taste, sound, tactile, and smell. We conducted a principal compo-nents analysis on the matrix that was entered into the clusteranalysis. Because all nine knowledge types loaded highly on thethree principal components with eigenvalues greater than one, theywere used to interpret the cluster analysis.
Creatures. The creature categories cluster together at the topof Figure 4. They are 12 of the 14 lowest in function features(Figure 5A; creatures serve few functions for people) and arethe 12 highest in visual–motion features (Figure 5B; creaturesengage in self-initiated actions). Thus, these two feature typesessentially separate creatures from all other categories. In addition,creatures are above the majority of the nonliving things but belowthe majority of the fruits/vegetables in visual–color features.
Nonliving things. The nonliving things cluster in the middle ofFigure 4. They differ from creatures by having a greater number offunction features (Figure 5A), and fewer visual–motion (Figure5B) and visual–color features (Figure 5E). They differ from thefruits/vegetables by having more salient visual–parts and surfaceproperties (Figure 5C) and fewer visual–color (Figure 5E) andtaste features (Figure 5F). The gun category is the final nonliving-things category to cluster with the others (besides musical instru-
3 We conducted this analysis with the made-of features included in thetactile knowledge type and found essentially the same results. See theanalyses included in this section and the Combining the Factors section forfurther discussion of which knowledge types contribute most to producingthe clustering solutions.
4 Our visual–motion features correspond quite closely to what Tyler andMoss (2001) have termed biological function features. We prefer visual–motion to avoid any confusion that may arise between these features, whichdo not involve human interaction, and what we have termed WB functionor function features, which do involve human interaction.
176 CREE AND MCRAE

ments and foods) because guns are the second highest category onsound features, behind only musical instruments (Figure 5G).
Fruits/vegetables. The fruits/vegetables cluster together, sep-arate from the creatures and nonliving things, and they cluster at alate stage with the nonliving rather than the living things. They aredistinguished from the creatures and nonliving things by beinghigh in both visual–color (Figure 5E) and taste features (Figure5F). Additionally, they are distinguished from the creatures bybeing low in visual–motion (Figure 5B), visual–parts and surfaceproperties (Figure 5C), and sounds (Figure 5G). Finally, the fruits/vegetables cluster at a late stage with the nonliving things becausethey are similar to them in being high in functions (Figure 5A;people eat and prepare them) and low in visual–motion features(Figure 5B).
Foods. Although the foods category contains only nonlivingthings, it clusters with the fruits/vegetables, which are all livingthings. Foods are similar to the fruits/vegetables in terms of func-tion (Figure 5A; people prepare and eat them), taste (Figure 5F;being the highest category on this knowledge type), tactile (Figure5H), and smell features (Figure 5I). In addition, the foods deviatefrom the nonliving things by being high in taste (Figure 5F) andsmell features (Figure 5I) and the lowest category on visual–partsand surface properties (Figure 5C). Finally, foods are the highestcategory on encyclopedic features (Figure 5D).
Musical instruments. The musical instruments cluster at a latestage with the nonliving things. They are best distinguished fromthem by their high number of sound features (Figure 5G; most of
(text continues on page 181)
Figure 4. Dendogram produced by the brain region feature types hierarchical cluster analysis. misc. nonlt �miscellaneous nonliving thing.
177FACTORS UNDERLYING SEMANTIC STRUCTURE

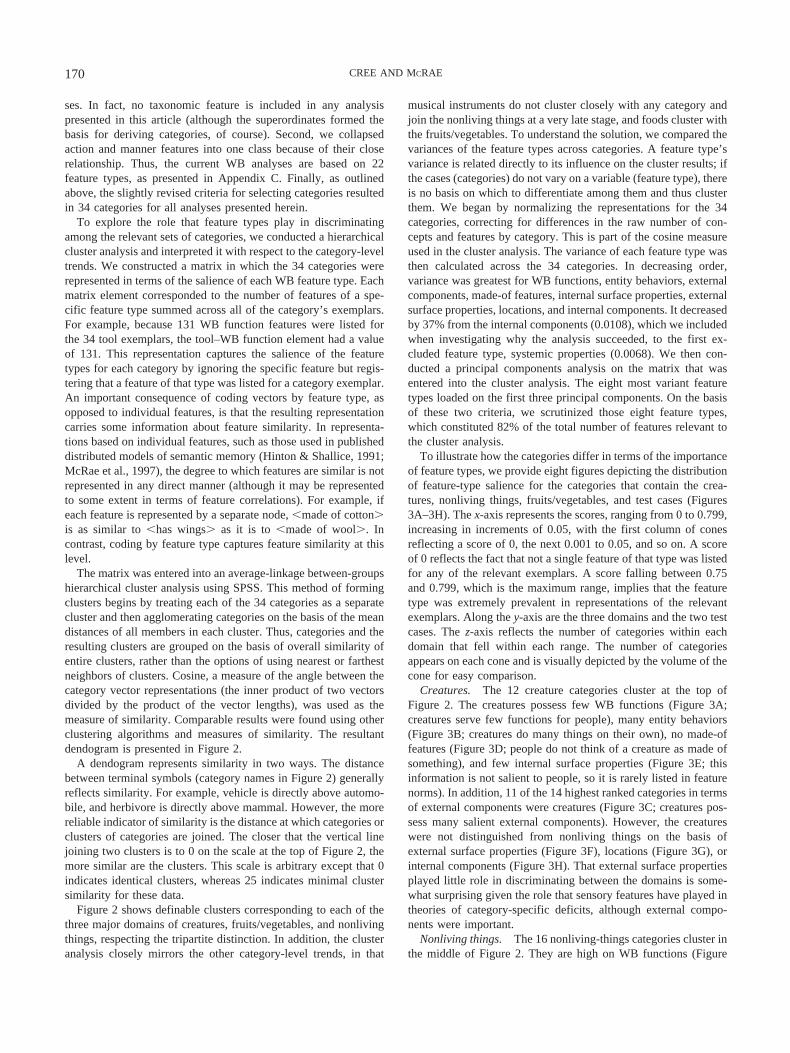
Figure 5. Cone graphs depicting the salience of each of the brain region knowledge types contributingsignificantly to the clustering solution for the 34 categories, presented by domain and test cases: (A) function,(B) visual–motion, (C) visual–parts and surface properties, (D) encyclopedic, (E) visual–color, (F) taste, (G)sound, (H) tactile, and (I) smell.
178 CREE AND MCRAE

Figure 5. (continued)
179FACTORS UNDERLYING SEMANTIC STRUCTURE
Figure 5. (continued)
180 CREE AND MCRAE

people’s experience with them is through recorded music), andthey are higher than all but one nonliving-things category onvisual–color features (Figure 5E). They are distinguished from thecreatures by having no visual–motion (Figure 5B), taste (Figure5F), or smell (Figure 5I) features. Finally, they are the lowestcategory on encyclopedic features (Figure 5D).
Beyond the Sensory/Functional Theory
In summary, like the WB knowledge-types analysis, this anal-ysis accounts for the first six category-level trends. No singleknowledge type, or even pair of knowledge types, is capable ofexplaining the first six category-level trends in impairment. In-stead, the interpretation of the cluster analysis must be based oninteractions among the nine knowledge types, implying that theyall play a role in distinguishing among the categories. There are,however, several contrasts that are particularly important. First, thecreatures are distinguished from the other categories by havingmany visual–motion and few function features. Fruits/vegetablesare distinguished from both creatures and nonliving things by boththe high salience of visual–color and taste features and the lownumber of visual–parts and surface properties in their representa-tions. Foods are high in tactile, taste, and encyclopedic featuresand are low in visual–parts and surface properties, distinguishingthem from the creatures and nonliving things. Sounds are salientfor musical instruments, as are their visual–parts and surfaceproperties, whereas musical instruments are low in encyclopedicfeatures, implying that little about them is salient to the averageperson other than their sounds, appearances, and function. Thus,on the basis of these analyses, we conclude that damage to specificneural regions (or combinations of regions) that are responsible forprocessing modality-specific types of semantic knowledge couldcontribute to category-specific semantic deficits.
To understand why the WB and brain region knowledge-typetaxonomies produced similar clustering solutions, we examinedthe extent to which the features that contribute most to eachsolution dominate particular knowledge types in the two taxono-mies and interpreted this in relation to data presented in Figures 3and 5. First, functions are critical for distinguishing betweencreatures and nonliving things in both analyses. This is true re-gardless of whether one uses a slightly restricted definition offunction, as in WB, or includes action/manner and participantinformation, as in the brain region taxonomy. Second, that crea-tures engage in self-initiated motion is also important for distin-guishing between creatures and nonliving things. Motion informa-tion dominates the entity-behavior knowledge type in the WBanalysis and constitutes the entire visual–motion knowledge typein the brain region analysis. Third, in both analyses, the fruits/vegetables and foods are like the nonliving things in terms of thetwo most important distinctions just mentioned (function andmotion) and thus cluster with the nonliving things at a late stage inboth analyses. However, they form their own cluster in bothanalyses because of the importance of internal surface propertiesand components in the WB analysis and of taste information(which forms a subset of the internal properties features) in thebrain region analysis. The fact that tactile and visual–color fea-tures are pulled out of the external surface properties (WB) for thebrain region analysis serves to amplify the distinctions between
fruits/vegetables and the other domains in the brain region analysisand to compensate for the role that internal surface properties andcomponents play in the WB analysis. Finally, sound features,which are particularly important in the representations of musicalinstruments, pull this category away from the other nonlivingthings. This information is included as entity behaviors in the WBanalysis and as its own knowledge type in the brain region anal-ysis, resulting in a magnification of this effect. Thus, although theWB knowledge types cannot be mapped clearly onto distinct brainregions, they obviously capture many of the distinctions that areimportant for explaining category-specific deficits and provideinsight at an emergent cognitive level.
Finally, a current point of contention regarding knowledge-typetheories concerns how to define functional knowledge (Caramazza& Shelton, 1998; McRae & Cree, 2002). One possible reason thatmost researchers have used broad definitions of functional knowl-edge is that knowledge about motor programs may be a type ofprocedural knowledge that is relatively cognitively impenetrable.Therefore, standard tasks used in the cognitive literature to assesspeople’s knowledge about objects are not likely to reveal much ofthis type of knowledge. The function features we used in the brainregion cluster analysis included action/manner, participant, andfunction features from the WB taxonomy. To test whether thebrain region cluster analysis results would change substantially ifwe limited the features included in the function knowledge type toonly motor-program-type knowledge, we reconducted the analysesincluding only the WB action/manner features as functional fea-tures and designated the remaining ones as encyclopedic features.This yielded the same pattern of clustering that was observed in themain brain region cluster analysis, but the creatures and nonlivingthings primarily were distinguished on the basis of visual–motionand encyclopedic (rather than function) features. There simplywere not enough action/manner features to discriminate neatlybetween these domains. Most importantly, regardless of whether anarrow or broad definition of function knowledge is used, theanalyses account for the tripartite distinction among creatures,fruits/vegetables, and nonliving things and provide insight intowhy the interesting test cases of foods and musical instrumentspattern as they do in impairment. Finally, more broadly, therecurrently are theories of functional knowledge such as HIPE(history, intentional perspective, physical environment, event se-quences; Barsalou, Sloman, & Chaigneau, in press) that argue thatfour domains of knowledge with 14 components nested withinthem are necessary to account for the full breadth of conceptual-izations regarding functional knowledge. We regard the varioustypes of function features in our norms as referencing importantsubsets of this knowledge.
Before presenting further interpretation of the relation be-tween lesion sites and the patterns of deficits they imply, wepresent data regarding the influence of other factors that maycontribute to the structure and computation of concrete nounconcepts. Taken in isolation, the knowledge-type analysis ap-pears to offer no insight into Trend 7, the fact that living-thingsimpairments occur much more frequently than nonliving-thingsimpairments. Therefore, we tested a number of factors for theirpotential influence on the susceptibility of domains and cate-gories to impairment.
181FACTORS UNDERLYING SEMANTIC STRUCTURE

Susceptibility to Impairment
It appears that additional elements must be added to aknowledge-type theory for it to explain why some categories aremore susceptible to impairment than others. One possibility (anexample of which was outlined above) is a linking theory tyingknowledge types to distinct brain regions, accompanied either byevidence that the relevant brain regions are differentially suscep-tible to damage or by evidence regarding the precise area(s) ofdamage in specific patients. This approach has been adopted byproponents of the sensory/functional theory (Gainotti, Silveri,Daniele, & Giustolisi, 1995). For example, it often is argued thathigher level visual computations necessary for distinguishingamong living things are housed in the inferior temporal regions,which are particularly susceptible to damage from herpes simplexviral encephalitis. In contrast, cross-modal sensory integrationcomputations of functional/motor information necessary for dis-criminating among nonliving things are believed to occur in theinferior parietal lobe, which may be damaged by cerebral infarct.Living-things deficits are more prevalent because a greater numberof the patients who present with category-specific deficits sufferfrom herpes simplex viral encephalitis than from cerebral infarcts.
It is also possible that further factors are partially, if not pri-marily, responsible for determining the prevalence of various typesof impairments. These factors may be important because braindamage is typically not well circumscribed to a specific area andbecause damage to an area can have consequences for computa-tions in other brain regions. In addition, factors that are not regionspecific may be required to account for category-specific deficitsin patients with nonfocal damage. In the following sections, wedescribe analyses of a number of factors that have been invoked toaccount for differential susceptibility.
Factor 2: Distinguishing Among Concepts
Distinguishing Features
Distinguishing features correspond to the aspects of people’sknowledge that discriminate among concepts in general or amongsets of similar concepts. For example, �moos� distinguishescows from other large four-legged animals (and in this case, fromamong all other things), whereas �eats� does not because manythings eat. Distinguishing features play a role in accounting for anumber of primary empirical phenomena regarding normal partic-ipants’ performance in semantic tasks, such as typicality judg-ments (Rosch & Mervis, 1975), similarity judgments (Tversky,1977), and category verification (Smith, Shoben, & Rips, 1974).
Distinguishing features may be crucial to understandingcategory-specific semantic deficits because many tasks used toestablish the existence of such deficits, such as picture naming,word-to-picture matching, defining, and naming from definition,require distinguishing a specific concept from among similar con-cepts. For example, a patient can identify something as a zebrarather than a horse only if he or she has preserved knowledge ofthe features that distinguish them. Given the probabilistic nature ofbrain damage, the likelihood that a patient can discriminate aconcept from among similar concepts may be related to the num-ber or proportion of that concept’s features that are distinguishing(Gonnerman et al., 1997).
We investigated whether the proportion of a concept’s featuresthat are distinguishing could account for trends in the patient data,including the seventh trend (prevalence). We calculated the per-centage of a concept’s features that are distinguishing, with afeature defined as distinguishing if it occurred in only one or twoconcepts in the norms (as established across all 541 concepts).The 34 categories were then sorted on the mean percentage of theexemplars’ features that are distinguishing, from least likely to beimpaired at the top to most likely to be impaired at the bottom. Allsorts are presented in this fashion, from least susceptible at the topto most susceptible at the bottom.
Table 2 shows that the creatures categories possess a lowpercentage of distinguishing features; the 12 creatures categoriesare among the 15 lowest ranked on this variable. The nonliving-things categories, with the exception of gun, each possess a greaterpercentage of distinguishing features than any of the creatures orfruits/vegetables categories. In addition, the fruits/vegetablesgroup between the creatures and nonliving things, with the excep-tion of fruit, which has a lower percentage of distinguishingfeatures than the other fruits/vegetables categories. Therefore, if itis assumed that feature knowledge is lost probabilistically, then allelse being equal, the distinguishing knowledge of creatures will be
Table 2Categories Sorted on Percentage of Distinguishing Features
Domain CategoryPercentage of
distinguishing features
Nonliving Appliance 49.1 (17.5)Nonliving Miscellaneous nonliving thing 47.8 (17.7)
Foods 45.4 (12.3)Nonliving Building 45.3 (12.7)Nonliving Machine 43.3 (14.2)Nonliving Tool 40.4 (18.2)Nonliving Fashion accessory 36.8 (17.1)Nonliving Shelter 35.8 (19.7)Nonliving Clothing 35.6 (17.4)Nonliving House 35.2 (19.8)Nonliving Container 34.5 (18.4)Nonliving Vehicle 33.7 (16.3)Nonliving Automobile 33.7 (17.1)Nonliving Furniture 33.1 (15.4)Nonliving Utensil 30.4 (17.4)Nonliving Weapon 29.3 (15.4)Fruit/vegetable Root/tuber 28.6 (22.7)Fruit/vegetable Vegetable 28.3 (18.0)Fruit/vegetable Plant 28.0 (17.0)Creature Insect 26.4 (12.9)
Musical instruments 25.3 (15.8)Creature Mammal 25.1 (16.0)Creature Rodent 21.6 (15.2)Creature Animal 21.0 (14.4)Fruit/vegetable Fruit 20.7 (12.5)Creature Pet 20.7 (15.2)Creature Carnivore 20.1 (11.9)Nonliving Gun 19.7 (12.5)Creature Scavenger 19.7 (12.8)Creature Predator 19.4 (10.0)Creature Reptile 17.8 (7.8)Creature Fish 16.0 (15.7)Creature Bird 16.0 (11.9)Creature Herbivore 15.7 (12.7)
Note. Standard deviations are in parentheses.
182 CREE AND MCRAE
lost before that of fruits/vegetables, which in turn are more sus-ceptible than the nonliving things.
The results also provide insight into Trends 5 and 6. In thecluster analyses, foods cluster with the fruits/vegetables. Thus, onthe basis of knowledge type alone, it seems unlikely that foodswould deviate from the fruits/vegetables in terms of impairment.However, if they did, the distinguishing features analysis suggeststhat foods would be relatively preserved because their exemplarstend to possess a greater percentage of distinguishing features.Interestingly, Hart et al. (1985) reported that foods can be sparedwhen fruits/vegetables are relatively impaired, and the oppositeresult has not been reported. Furthermore, this analysis providesanother reason why musical instruments might be impaired alongwith living things: They possess a relatively low proportion ofdistinguishing features compared with the nonliving things. Insummary, distinguishing features capture the category-leveltrends.
Feature Distinctiveness
The dichotomy between distinguishing and nondistinguishingfeatures is somewhat artificial because features fall on a continuumregarding the amount of information they provide about a con-cept’s identity. For example, whereas �moos� is highly distin-guishing, �lives on farms� is only somewhat distinguishing,�has 4 legs� is even less distinguishing, and �eats� is not verydistinguishing at all. Therefore, concepts might differ not just intheir proportion of distinguishing features but also, and possiblyeven differentially, in terms of the amount of distinguishing infor-mation provided by the set of features of which they are composed.A measure used to reflect this continuum is distinctiveness, alsoknown as informativeness (Devlin et al., 1998; Garrard, LambonRalph, Hodges, & Patterson, 2001).
Distinctiveness has been defined in two ways in the category-specific literature. Devlin et al. (1998) defined it as the inverse ofthe number of concepts in which a feature appears. Garrard,Lambon Ralph, Hodges, and Patterson (2001) defined it in thesame manner but limited the contrast set to concepts within acategory. We prefer Devlin et al.’s definition because it is unclearto us if or exactly how the contrast set should be limited. Distinc-tiveness is nonlinear, meaning that the difference in distinctivenessfor a feature appearing in one versus two concepts is larger than fora feature appearing in two versus three concepts, and so on. Thus,the measure captures the intuition that features occurring in rela-tively few concepts should be treated as more informative thanthose occurring in many concepts.
We calculated the distinctiveness of every feature in the norms(based on all 541 concepts) and then the mean feature distinctive-ness for each concept. We next calculated the mean for eachcategory across its exemplars and sorted the categories based onthis value. The sort presented in Table 3 mirrors the distinguishingfeatures sort (Table 2) quite closely. The tripartite distinction ispreserved, with creatures having low mean distinctiveness, non-living things high mean distinctiveness, and fruits/vegetables fall-ing in the middle. Foods have high mean distinctiveness and thuscluster with the nonliving things again. Musical instruments arefound near the bottom of the nonliving things, just above thefruits/vegetables and creatures, again providing insight into whythey may pattern with the living things in cases of impairment.
Note that we also sorted the categories on mean cue validity ofthe features of each category’s exemplars. Cue validity is similarto distinctiveness but includes an estimate of feature salience. Cuevalidity of a feature for a specific concept was calculated as itsproduction frequency for that concept (number of participants outof 30 who listed the feature for the concept) divided by the sum ofthe feature’s production frequencies for all concepts in the set of541. The sort mirrored both the distinguishing features and dis-tinctiveness sorts.
In summary, given probabilistic damage, the likelihood of cor-rectly responding on a typical task used to establish category-specific semantic deficits is related to the likelihood that theknowledge that distinguishes among similar concepts is preserved.Analyses based on distinguishing features and feature distinctive-ness group the relevant sets of categories in a manner that followsthe patient data.
Factor 3: Similarity
A common way of thinking about semantic representations is aspoints in a multidimensional state space in which the dimensionsare defined by features. Concept similarity is reflected in the
Table 3Categories Sorted on Mean Feature Distinctiveness
Domain CategoryMean feature
distinctiveness
Nonliving Building 0.51 (0.09)Nonliving Appliance 0.50 (0.12)Nonliving Miscellaneous nonliving thing 0.48 (0.16)Nonliving Machine 0.45 (0.18)
Foods 0.45 (0.11)Nonliving Shelter 0.42 (0.15)Nonliving Tool 0.41 (0.18)Nonliving House 0.41 (0.14)Nonliving Container 0.37 (0.17)Nonliving Clothing 0.37 (0.14)Nonliving Automobile 0.37 (0.15)Nonliving Vehicle 0.35 (0.13)Nonliving Fashion accessory 0.35 (0.10)Nonliving Furniture 0.33 (0.12)Nonliving Utensil 0.32 (0.16)
Musical instruments 0.31 (0.15)Nonliving Weapon 0.31 (0.13)Fruit/vegetable Vegetable 0.30 (0.14)Fruit/vegetable Root/tuber 0.30 (0.16)Fruit/vegetable Plant 0.30 (0.13)Creature Insect 0.29 (0.13)Creature Mammal 0.28 (0.13)Creature Rodent 0.26 (0.12)Fruit/vegetable Fruit 0.25 (0.09)Creature Pet 0.24 (0.13)Creature Reptile 0.24 (0.08)Creature Animal 0.24 (0.12)Nonliving Gun 0.23 (0.08)Creature Predator 0.23 (0.07)Creature Carnivore 0.22 (0.09)Creature Scavenger 0.20 (0.09)Creature Herbivore 0.19 (0.08)Creature Bird 0.19 (0.10)Creature Fish 0.18 (0.11)
Note. Standard deviations are in parentheses.
183FACTORS UNDERLYING SEMANTIC STRUCTURE

proximity of the points (or attractor basins) that correspond to theconcepts. Similarity is related to the distinctiveness of a concept’sfeatures because, overall, the less distinctive the features, the moresimilar the concepts must be to one another and the closer they arein state space. Semantic similarity has played an important role inmany cognitive theories. For example, the distance of items fromone another in state space can determine how participants parsenovel concepts into new categories and how easily a predeter-mined category structure is learned (Kruschke, 1992). It is alsorelated to category verification latency (Smith et al., 1974) and themagnitude of short stimulus onset asynchrony semantic primingeffects (Cree, McRae, & McNorgan, 1999). Most important for thepresent discussion, variability in the density of regions of semanticspace has served as the basis of several of the most influentialtheories of category-specific semantic deficits, including theOUCH (Caramazza et al., 1990) and the cascade processing modelof visual object recognition (Humphreys et al., 1988). Visualsimilarity has played a particularly important role because picturenaming and word–picture matching are the most commonly useddiagnostic tasks.
Visual Similarity
The time it takes to classify, name, or perform an object decisionabout a visually presented object is related to the density of thevisual neighborhood of that object. For example, unimpaired par-ticipants were faster to make domain-level classifications (living/nonliving) of pictures of objects from categories with structurallysimilar exemplars (e.g., birds, insects, fruits, and vegetables) thanfrom categories with dissimilar exemplars (e.g., clothing and fur-niture; Riddoch & Humphreys, 1987). The opposite pattern hasbeen found when participants were asked to name objects (Hum-phreys et al., 1988) or make object decisions (Lloyd-Jones &Humphreys, 1997). These seemingly contradictory results arosebecause of the different types of information that are necessary forperforming these tasks (see Humphreys et al., 1988; Humphreys,Lamote, & Lloyd-Jones, 1995; Riddoch & Humphreys, 1987, forfurther discussion). Thus, any evidence suggesting that categoriesdiffer systematically in terms of the visual similarity of eachexemplar’s nearest neighbors might provide insight into the be-havioral trends.
Both subjective and objective measures have provided evidencethat living things tend to have more visually similar neighbors thando nonliving things. When participants rated pairwise visual sim-ilarity of a set of pictures, living things were judged more struc-turally similar (Humphreys, Lloyd-Jones, & Fias, 1995; Sartori,Job, Miozzo, Zago, & Marchiori, 1993). Corresponding resultshave been obtained using objective measures such as contouroverlap of standardized pictures (Humphreys et al., 1988) or imageoverlap of standardized pictures (Tranel, Logan, et al., 1997).Tranel, Logan, et al. (1997) reported significant variability be-tween categories when they measured visual similarity as thecommon subcategory silhouette of line drawings of objects, withfruits/vegetables being the most similar, followed by vehicles,animals, and musical instruments, followed by tools and utensils.When Humphreys et al. (1988) asked participants to list the partsof objects, living things had more shared parts than nonlivingthings. Finally, monkeys trained to discriminate among standard-ized line drawings of living and nonliving things took longer to
learn the living things, presumably because they are more difficultto discriminate (Gaffan & Heywood, 1993).
Given the role of visual similarity in accounts of category-specific deficits, we tested whether a measure of visual similarityderived from the feature norms would provide insight into theseven trends. Claims about the role of visual similarity havefocused on structural descriptions of objects, the kind of visualinformation that is necessary for computations that occur afterinitial retinal and early visual processing of objects and that allowfor stable, viewpoint-invariant object representations to be com-puted. Because this kind of information is typically thought to maponto contours and parts, we included only the features that fell intothe visual–parts and surface properties and visual–color knowl-edge types in the brain region taxonomy. Only two concepts, cakeand toy, did not have any of these knowledge types and wereexcluded from the analysis. To derive a measure of density foreach exemplar, we calculated the mean proximity of the fourclosest concepts (regardless of category) to each exemplar bycomputing the cosine of the angle between the visual featurevectors of each concept pair and selecting the four closest. Eachfeature was represented by its production frequency in this calcu-lation, rather than being binary. We then calculated the mean ofthese values for each category.
Table 4 shows a slight overall tendency for the closest visualneighbors of exemplars from the creatures and fruits/vegetablescategories to be more proximal than those of the nonliving-thingscategories. Although the visual similarity measure roughly cap-tures differences among categories, it does not appear to be sen-sitive enough to provide insight into the seven trends. It perhaps isnot surprising that a measure of visual structural similarity derivedfrom verbal semantic feature production norms did not fare well inproviding insight into the trends. Although the norms do contain asizeable number of visual features that correlate with visual struc-ture (e.g., �has a handle� correlates with the presence of long,protruding appendages), they fail to capture some of the kinds ofvisual information that intuitively seem important for visual sim-ilarity judgments (e.g., contour overlap, similarity in patterns ofshading, spatial relations among parts). Measures based on contourand pixel overlap of line drawings may provide a better approxi-mation of visual similarity (see Laws & Gale, 2002, and Hum-phreys & Riddoch, 2002, for discussion). Other promising ap-proaches for assessing visual similarity include forced choice fromamong a set of pictures of category exemplars following a verybriefly displayed (e.g., 15 ms) and masked presentation of acategory exemplar (Bukach, Bub, Masson, & Lindsay, 2002).
On the other hand, the results could be interpreted as demon-strating that visual similarity plays a less important role in dis-criminating among categories than has previously been thought.Tranel, Logan, et al. (1997) also found only small differencesbetween animals/birds, fruits/vegetables, tools/utensils, vehicles,and musical instruments when they had participants rate the visualambiguity of items in terms of the size of the class of entities thatare visually similar, yet distinct, from the target items. Perhapsmore troubling, Laws and Gale (2002) claimed that visual simi-larity measures that consider only contour overlap are underrep-resentative of true visual similarity because they ignore detailwithin the contours of drawings. When this additional informationwas considered, they found that nonliving things were more visu-ally similar to one another than were living things. Clearly, further
184 CREE AND MCRAE

work is necessary to determine the aspects of visual representa-tions used in computing visual similarity.
Semantic Similarity
It is difficult to separate visual and semantic similarity becausemany visual features are correlated with semantic features andthere exists strong evidence for top-down influences of semanticsimilarity on visual processing. Humphreys et al. (1988), forexample, reported that J.B. was impaired in a word–picture match-ing test only when the distractors were visually and semanticallysimilar to the target (as rated on a 7-point Likert scale by unim-paired participants) but performed normally when distractors werevisually and semantically dissimilar and when they were visuallydissimilar but semantically related to the target. Similarly, Dixonet al. (1997) have demonstrated effects of semantic similarity onperceptual tasks in E.L.M.’s performance. Their psychologicaldistance theory proposes that object representations exist in aspace defined by both visual and semantic dimensions (Schweizer,Dixon, Westwood, & Piskopos, 2001). Thus, musical instrumentsthat share shape, action/manner, sound, and other types of features
(e.g., guitar, cello, and violin) will be closer together in space thanmachines that are distinguished by their shapes and functions (e.g.,blender, projector, and typewriter). In addition, models in whichvisual and semantic information resides in separate representa-tional layers allow for reentrant activation from semantic layersback to visual layers during processing (Humphreys & Forde,2001). In support of the interaction between visual and other typesof knowledge, Dixon et al. have demonstrated an influence ofsemantic similarity on visual tasks in unimpaired adults.
Little empirical evidence has been provided for the role ofsemantic similarity in theories of category-specific semantic def-icits because it is difficult to derive a measure of semantic simi-larity for a large number of concepts. Semantic similarity hastypically been measured subjectively by having participants ratepairwise similarity of a set of concepts when presented with theconcepts’ names. In contrast, we derived a measure of semanticsimilarity directly from the feature norms by defining semanticsimilarity as the cosine of the angle between two feature vectorrepresentations (including production frequency information). Asin the visual similarity analysis, we next calculated the meansimilarity of the four closest semantic neighbors to each concept toprovide a measure of potential confusability and then sorted thecategories.
In Table 5, 12 of the 15 categories composed of exemplarshaving the least similar neighbors are nonliving things (furniture,utensil, weapon, and gun are the exceptions). Fruit, vegetable, andplant are interspersed within the creatures whereas root/tubergroups with the nonliving things, having few semantically similarneighbors. The musical instruments group with the creatures nearthe bottom because they tend to have highly semantically similarneighbors and thus would easily be confused with one another,providing a further reason why they might pattern with creatures interms of deficits. Foods again are found with the nonliving-thingscategories, providing further insight into why foods may be sparedin cases of fruits/vegetables deficits. We found similar results inanalyses of the mean distance of the closest one, two, and threeconcepts, as well as analyses of the mean number of conceptswithin various distances from a target concept. In summary, thesemantic similarity analysis accounts for several of the trends butdoes not clearly explain the tripartite distinction, providing somesupport for theories of category-specific deficits that emphasizethe importance of semantic similarity.
Why did this analysis fail to provide insight into the tripartitedistinction, whereas the two knowledge-type analyses, which werealso based on similarity, were successful? We believe that it has todo with the levels at which the two types of analyses wereconducted. The knowledge-type analyses ignore differences acrosscategory exemplars in the specific features of which they arecomposed; only the type of feature matters. Stated another way,the semantic similarity analysis is working in a 2,526-dimensionalspace, whereas the cluster analyses are working in 9- or 22-dimensional spaces. We believe that it is at this more generalknowledge-type level that the most unique insights into category-specific deficits are most likely to be found.
Factor 4: Visual Complexity
Because visual complexity is thought to influence picture-naming accuracy and latency, when researchers have designed sets
Table 4Mean Visual Similarity of Four Closest Concepts to EachConcept in a Category
Domain CategoryMean distance of 4
closest concepts (cosine)
Nonliving Building 0.54 (0.16)Nonliving Machine 0.58 (0.23)Nonliving Clothing 0.58 (0.16)Nonliving Shelter 0.60 (0.19)Nonliving Container 0.61 (0.20)Fruit/vegetable Root/tuber 0.61 (0.16)Creature Mammal 0.62 (0.13)Nonliving Appliance 0.62 (0.13)Nonliving Miscellaneous nonliving thing 0.62 (0.20)Nonliving House 0.63 (0.16)Nonliving Fashion accessory 0.65 (0.15)Creature Carnivore 0.65 (0.17)Creature Rodent 0.66 (0.11)Creature Reptile 0.66 (0.07)Creature Predator 0.66 (0.16)Nonliving Furniture 0.67 (0.20)Creature Insect 0.68 (0.12)Creature Animal 0.68 (0.15)Nonliving Vehicle 0.68 (0.13)
Musical instruments 0.68 (0.22)Creature Herbivore 0.68 (0.11)Nonliving Tool 0.69 (0.16)
Foods 0.69 (0.12)Nonliving Automobile 0.70 (0.13)Fruit/vegetable Fruit 0.70 (0.12)Creature Pet 0.70 (0.11)Nonliving Utensil 0.71 (0.14)Nonliving Weapon 0.72 (0.17)Fruit/vegetable Plant 0.72 (0.14)Fruit/vegetable Vegetable 0.74 (0.14)Nonliving Gun 0.76 (0.15)Creature Scavenger 0.76 (0.13)Creature Fish 0.78 (0.12)Creature Bird 0.78 (0.13)
Note. Standard deviations are in parentheses.
185FACTORS UNDERLYING SEMANTIC STRUCTURE
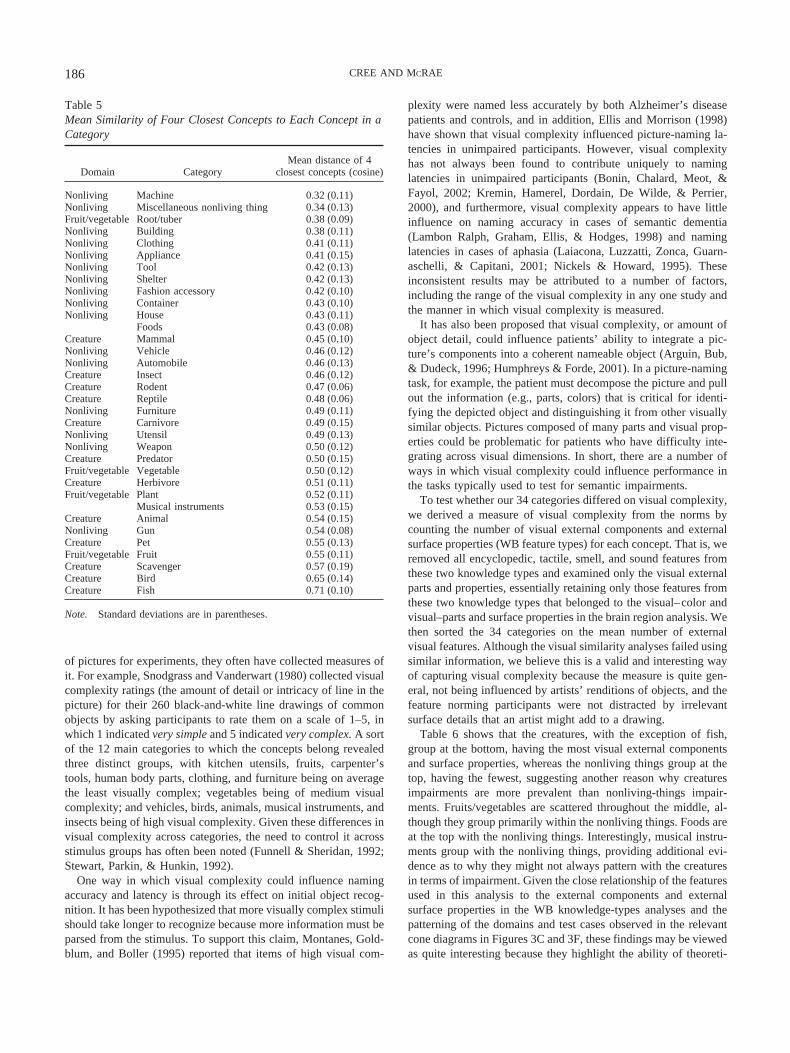
of pictures for experiments, they often have collected measures ofit. For example, Snodgrass and Vanderwart (1980) collected visualcomplexity ratings (the amount of detail or intricacy of line in thepicture) for their 260 black-and-white line drawings of commonobjects by asking participants to rate them on a scale of 1–5, inwhich 1 indicated very simple and 5 indicated very complex. A sortof the 12 main categories to which the concepts belong revealedthree distinct groups, with kitchen utensils, fruits, carpenter’stools, human body parts, clothing, and furniture being on averagethe least visually complex; vegetables being of medium visualcomplexity; and vehicles, birds, animals, musical instruments, andinsects being of high visual complexity. Given these differences invisual complexity across categories, the need to control it acrossstimulus groups has often been noted (Funnell & Sheridan, 1992;Stewart, Parkin, & Hunkin, 1992).
One way in which visual complexity could influence namingaccuracy and latency is through its effect on initial object recog-nition. It has been hypothesized that more visually complex stimulishould take longer to recognize because more information must beparsed from the stimulus. To support this claim, Montanes, Gold-blum, and Boller (1995) reported that items of high visual com-
plexity were named less accurately by both Alzheimer’s diseasepatients and controls, and in addition, Ellis and Morrison (1998)have shown that visual complexity influenced picture-naming la-tencies in unimpaired participants. However, visual complexityhas not always been found to contribute uniquely to naminglatencies in unimpaired participants (Bonin, Chalard, Meot, &Fayol, 2002; Kremin, Hamerel, Dordain, De Wilde, & Perrier,2000), and furthermore, visual complexity appears to have littleinfluence on naming accuracy in cases of semantic dementia(Lambon Ralph, Graham, Ellis, & Hodges, 1998) and naminglatencies in cases of aphasia (Laiacona, Luzzatti, Zonca, Guarn-aschelli, & Capitani, 2001; Nickels & Howard, 1995). Theseinconsistent results may be attributed to a number of factors,including the range of the visual complexity in any one study andthe manner in which visual complexity is measured.
It has also been proposed that visual complexity, or amount ofobject detail, could influence patients’ ability to integrate a pic-ture’s components into a coherent nameable object (Arguin, Bub,& Dudeck, 1996; Humphreys & Forde, 2001). In a picture-namingtask, for example, the patient must decompose the picture and pullout the information (e.g., parts, colors) that is critical for identi-fying the depicted object and distinguishing it from other visuallysimilar objects. Pictures composed of many parts and visual prop-erties could be problematic for patients who have difficulty inte-grating across visual dimensions. In short, there are a number ofways in which visual complexity could influence performance inthe tasks typically used to test for semantic impairments.
To test whether our 34 categories differed on visual complexity,we derived a measure of visual complexity from the norms bycounting the number of visual external components and externalsurface properties (WB feature types) for each concept. That is, weremoved all encyclopedic, tactile, smell, and sound features fromthese two knowledge types and examined only the visual externalparts and properties, essentially retaining only those features fromthese two knowledge types that belonged to the visual–color andvisual–parts and surface properties in the brain region analysis. Wethen sorted the 34 categories on the mean number of externalvisual features. Although the visual similarity analyses failed usingsimilar information, we believe this is a valid and interesting wayof capturing visual complexity because the measure is quite gen-eral, not being influenced by artists’ renditions of objects, and thefeature norming participants were not distracted by irrelevantsurface details that an artist might add to a drawing.
Table 6 shows that the creatures, with the exception of fish,group at the bottom, having the most visual external componentsand surface properties, whereas the nonliving things group at thetop, having the fewest, suggesting another reason why creaturesimpairments are more prevalent than nonliving-things impair-ments. Fruits/vegetables are scattered throughout the middle, al-though they group primarily within the nonliving things. Foods areat the top with the nonliving things. Interestingly, musical instru-ments group with the nonliving things, providing additional evi-dence as to why they might not always pattern with the creaturesin terms of impairment. Given the close relationship of the featuresused in this analysis to the external components and externalsurface properties in the WB knowledge-types analyses and thepatterning of the domains and test cases observed in the relevantcone diagrams in Figures 3C and 3F, these findings may be viewedas quite interesting because they highlight the ability of theoreti-
Table 5Mean Similarity of Four Closest Concepts to Each Concept in aCategory
Domain CategoryMean distance of 4
closest concepts (cosine)
Nonliving Machine 0.32 (0.11)Nonliving Miscellaneous nonliving thing 0.34 (0.13)Fruit/vegetable Root/tuber 0.38 (0.09)Nonliving Building 0.38 (0.11)Nonliving Clothing 0.41 (0.11)Nonliving Appliance 0.41 (0.15)Nonliving Tool 0.42 (0.13)Nonliving Shelter 0.42 (0.13)Nonliving Fashion accessory 0.42 (0.10)Nonliving Container 0.43 (0.10)Nonliving House 0.43 (0.11)
Foods 0.43 (0.08)Creature Mammal 0.45 (0.10)Nonliving Vehicle 0.46 (0.12)Nonliving Automobile 0.46 (0.13)Creature Insect 0.46 (0.12)Creature Rodent 0.47 (0.06)Creature Reptile 0.48 (0.06)Nonliving Furniture 0.49 (0.11)Creature Carnivore 0.49 (0.15)Nonliving Utensil 0.49 (0.13)Nonliving Weapon 0.50 (0.12)Creature Predator 0.50 (0.15)Fruit/vegetable Vegetable 0.50 (0.12)Creature Herbivore 0.51 (0.11)Fruit/vegetable Plant 0.52 (0.11)
Musical instruments 0.53 (0.15)Creature Animal 0.54 (0.15)Nonliving Gun 0.54 (0.08)Creature Pet 0.55 (0.13)Fruit/vegetable Fruit 0.55 (0.11)Creature Scavenger 0.57 (0.19)Creature Bird 0.65 (0.14)Creature Fish 0.71 (0.10)
Note. Standard deviations are in parentheses.
186 CREE AND MCRAE

cally motivated conjunctions of factors—in this case, two knowl-edge types—to contribute to an understanding of category-specificdeficits. Finally, these findings accord with similar analyses con-ducted with smaller sets of items (Snodgrass & Vanderwart, 1980)and provide further evidence that visual complexity should becontrolled when designing experiments.
Factor 5: Concept Familiarity
Familiarity is a ubiquitous factor in psychology. With respect tosemantic memory, increased experience with a concept’s referentsleads to a more robust representation. The process through whichthis occurs can be explained by numerous models. For example,following the principles of Hebbian learning, the more often apattern is processed, the stronger the connections among its con-stituent representational elements become (Hebb, 1949). In thestudy of category-specific semantic deficits, familiarity has mostoften been relegated to the role of a nuisance variable. Funnell andSheridan (1992) and Stewart et al. (1992) pointed out that livingthings are generally less familiar than nonliving things and thattherefore, it is more likely that one would find a living-thingsdeficit if familiarity influences processing and items are selected
randomly from these domains. When the factors contributing todeficits have been examined post hoc, it has repeatedly been foundthat concept familiarity is a strong predictor of preservation ofknowledge (Farah et al., 1996; Lambon Ralph, Graham, et al.,1998). In addition, when Funnell and de Mornay-Davies (1996)retested J.B.R. (Warrington & Shallice, 1984), they found thatalthough the living-things deficit remained, it was the low-familiarity living-things items that were giving J.B.R. the mostdifficulty, with no difference in impairment between high-familiarity living and nonliving things.
We tested the prediction that familiar concepts would be morelikely to be preserved in the face of damage. Twenty participantsrated their familiarity with our concepts (“How familiar are youwith the thing the word refers to?”) on a scale of 1–9, with 1corresponding to not at all familiar and 9 corresponding to highlyfamiliar. We then sorted the 34 categories on mean concept fa-miliarity. Table 7 shows that with regard to the tripartite distinc-tion, creatures are generally less familiar than nonliving things andfruits/vegetables are more familiar than the creatures, embeddedwithin the nonliving things. Furthermore, foods are highly famil-iar, again grouping with the nonliving things, providing furthersupport for why foods may tend to be preserved when fruits/vegetables knowledge is lost. Finally, musical instruments tend to
Table 7Mean Familiarity of All Members Within a Category
Domain Category Mean familiarity
Nonliving Furniture 7.95 (1.11)Foods 7.72 (0.54)
Nonliving Appliance 7.63 (1.05)Nonliving Fashion accessory 7.21 (1.55)Nonliving Utensil 6.91 (1.90)Nonliving Container 6.90 (1.70)Nonliving Clothing 6.76 (1.75)Nonliving Miscellaneous nonliving thing 6.59 (1.73)Nonliving Shelter 6.34 (1.68)Fruit/vegetable Vegetable 6.34 (1.48)Fruit/vegetable Fruit 6.26 (1.38)Nonliving Automobile 6.16 (2.12)Fruit/vegetable Root/tuber 6.01 (1.86)Nonliving Building 5.81 (0.78)Fruit/vegetable Plant 5.81 (1.47)Nonliving Tool 5.64 (1.72)Nonliving House 5.61 (1.89)Creature Insect 5.61 (1.21)Nonliving Vehicle 5.58 (1.76)Nonliving Machine 4.97 (2.06)Creature Rodent 4.87 (1.71)Creature Pet 4.40 (1.76)Creature Fish 4.12 (1.25)Creature Herbivore 4.11 (1.44)Creature Animal 4.02 (1.42)Creature Mammal 3.99 (1.46)
Musical instruments 3.98 (1.14)Nonliving Weapon 3.86 (1.90)Creature Bird 3.82 (1.33)Creature Predator 3.46 (1.33)Creature Carnivore 3.45 (1.39)Creature Scavenger 3.35 (1.24)Creature Reptile 3.22 (1.15)Nonliving Gun 2.79 (0.66)
Note. Standard deviations are in parentheses.
Table 6Categories Sorted on Visual Complexity
Domain Category
Mean number ofexternal parts &visual features
Foods 1.83 (0.98)Nonliving Building 2.43 (1.51)Nonliving Gun 2.43 (1.62)Nonliving Appliance 2.50 (1.22)Nonliving Miscellaneous nonliving thing 2.75 (1.55)Nonliving House 2.75 (1.39)Nonliving Fashion accessory 2.89 (1.17)Nonliving Machine 3.00 (2.18)Nonliving Weapon 3.03 (1.77)Nonliving Utensil 3.18 (1.79)
Musical instruments 3.22 (1.56)Creature Fish 3.27 (1.49)Nonliving Shelter 3.40 (1.17)Nonliving Container 3.43 (2.21)Nonliving Tool 3.59 (1.83)Fruit/vegetable Vegetable 3.68 (1.56)Fruit/vegetable Plant 3.94 (1.51)Fruit/vegetable Root/tuber 4.00 (2.16)Nonliving Clothing 4.00 (2.32)Nonliving Furniture 4.00 (2.00)Fruit/vegetable Fruit 4.10 (1.35)Nonliving Vehicle 4.26 (1.95)Nonliving Automobile 4.78 (1.99)Creature Reptile 5.10 (1.37)Creature Predator 5.12 (2.09)Creature Insect 5.23 (1.54)Creature Carnivore 5.26 (2.10)Creature Animal 5.33 (2.10)Creature Mammal 5.61 (2.49)Creature Bird 5.64 (1.55)Creature Pet 6.18 (2.22)Creature Rodent 6.20 (2.70)Creature Scavenger 6.38 (3.07)Creature Herbivore 6.50 (1.86)
Note. Standard deviations are in parentheses.
187FACTORS UNDERLYING SEMANTIC STRUCTURE

be unfamiliar, reflecting the fact that most people do not come intodirect contact with them in their daily lives. This provides supportfor why musical instruments may be impaired along with crea-tures. Finally, gun is the least familiar of all categories, suggestingthat although it diverged from the other nonliving things in thebrain region cluster analysis due to their highly salient sounds, itwould probably not serve as a good test category because mostpeople do not have extensive direct experience with its exemplars(note that the familiarity ratings were collected in Canada).
In summary, familiarity provides insight into the six majortrends in patterns of impairment, as well as the seventh trend inthat creatures are less familiar than nonliving things and thereforeare more likely to be impaired. However, fruits/vegetables aremore familiar than the creatures, which may be one reason whyfruits/vegetables can be spared when knowledge about creatures islost.
Factor 6: Word Frequency
Word frequency can be viewed as a mixture of indices of nameand concept familiarity. The frequency with which a word isencountered influences how quickly and easily that word can berecognized and produced (Duncan, 1977; Forster & Chambers,1973; McRae, Jared, & Seidenberg, 1990). Word frequency isimportant for category-specific deficits because most tasks used toprobe for such deficits require either producing or recognizing thename of a picture or object. The more often the name has beenencountered and produced, then, all else being equal, the easier itshould be to produce it or to match it to a picture. In addition, themore frequently a word is read or heard, the more frequently theconceptual representation of the entity is computed. Therefore,word frequency presumably influences how easily the meaning ofa word can be computed.
We collected word frequency counts for the concept namesusing the British National Corpus online search engine (Burnard,2000), which accesses a 100,000,000-word body of written andspoken language designed to capture a broad spectrum of languageusage. Frequency counts for the singular and plural forms of eachconcept name were summed. The natural logarithm of the wordfrequency (ln[word frequency]) was used to control for outliers, asis standard in studies of word frequency (Zipf, 1932). Meanln[word frequency] was computed for each category, and thecategories were sorted. Table 8 shows that although the wordfrequency counts were derived from a different source than thefamiliarity scores, the results of the two sorts are similar. With theexception of guns, the creatures and nonliving things are separatedentirely. Foods again group with the nonliving things and musicalinstruments with the living things.
In contrast to the familiarity sort, fruits/vegetables group withthe creatures rather than the nonliving things in terms of namefrequency. This occurs presumably because people interact withfruits/vegetables every day but their names do not show up a greatdeal in the sorts of materials found in text corpora. This differencebetween the familiarity and word frequency of fruits/vegetablesmay explain an interesting aspect of fruits/vegetables deficits. Twocases of specific naming deficits for fruits/vegetables have beenreported in which patients demonstrated preserved knowledgeabout fruits/vegetables but a profound difficulty in naming them
(Farah & Wallace, 1992; Hart et al., 1985). This could haveoccurred because fruits/vegetables are highly familiar on average,whereas their names are not. In addition, the ln[word frequency] ofthe category labels fruit(s) (8.5) and vegetable(s) (7.9) is high,indicating that they are available as alternative labels (it is scoredas an error if a patient responds with one of these labels).
Factor 7: Correlated Features
Correlations among features are viewed as central to semanticorganization (Malt & Smith, 1984; Rosch, 1978; Rosch, Mervis,Gray, Johnson, & Boyes-Braem, 1976). Features are said to becorrelated if they tend to occur together in the same basic-levelconcepts. For example, the features �flies� and �has feathers�are correlated because they occur together in almost all birds.Rosch (1978) claimed that pockets of correlated features serve asthe foundation upon which conceptual representations are formed,and Rosch et al. (1976) claimed that the basic level of conceptualrepresentation (e.g., dog, cat) corresponds to the level at whichfeature correlations best cohere within categories and can be usedto distinguish among them.
Table 8Mean ln[Word Frequency] (British National Corpus) of AllMembers Within a Category
Domain CategoryMean
ln[word frequency]
Nonliving Shelter 7.86 (1.68)Nonliving Building 7.63 (1.52)Nonliving Furniture 7.63 (1.47)Nonliving House 7.55 (1.44)
Foods 7.49 (0.98)Nonliving Container 7.35 (1.13)Nonliving Miscellaneous nonliving thing 6.91 (1.68)Nonliving Appliance 6.78 (1.46)Nonliving Vehicle 6.68 (2.19)Nonliving Automobile 6.67 (2.88)Nonliving Fashion accessory 6.61 (1.01)Nonliving Machine 6.48 (1.24)Nonliving Clothing 6.30 (1.82)Nonliving Weapon 6.27 (1.73)Nonliving Utensil 6.13 (1.85)Nonliving Tool 6.04 (1.54)Creature Carnivore 6.00 (1.75)Creature Pet 6.00 (1.84)Creature Predator 5.98 (1.60)Creature Mammal 5.98 (1.87)Creature Animal 5.81 (1.55)Fruit/vegetable Root/tuber 5.81 (1.34)Nonliving Gun 5.78 (1.36)Creature Insect 5.76 (1.48)Fruit/vegetable Plant 5.69 (1.51)Creature Fish 5.69 (0.77)Fruit/vegetable Fruit 5.67 (1.55)Fruit/vegetable Vegetable 5.67 (1.65)Creature Bird 5.63 (1.55)Creature Scavenger 5.52 (1.55)
Musical instruments 5.46 (1.74)Creature Herbivore 5.35 (1.45)Creature Reptile 5.18 (0.90)Creature Rodent 5.15 (2.47)
Note. Standard deviations are in parentheses.
188 CREE AND MCRAE

Feature correlations have been hypothesized to play a role inexplaining patterns of category-specific deficits observed in casesof semantic impairment due to progressive diseases such as de-mentia of the Alzheimer type. Specifically, they are thought topreserve conceptual representations in cases of mild damage but torender those same representations inaccessible in cases of moder-ate to severe damage (Devlin et al., 1998; Gonnerman et al., 1997).This interaction is predicted from examining the weights that formbetween correlated versus noncorrelated features in connectionistmodels. In such models, groups of correlated features tend todevelop strong weights among one another because the presence ofone typically indicates the presence of the others. During process-ing, these weights allow activation to accrue faster in these featuresthan in noncorrelated features, all else being equal. In these mod-els, brain damage typically is simulated by removing connectionsbetween features. In cases of mild brain damage, only a smallnumber of connections between features are removed, and there-fore, the remaining, strong connections between correlated fea-tures allow these features to activate one another and preserveaccess to them relative to other features. However, in cases ofmoderate to severe damage, when sufficient numbers of connec-tions have been lost, the reinforcing effect no longer operates, andentire clumps of correlated features are lost, effectively destroyingthe representations of which they are a part. It has been claimedthat living things tend to cohere around clusters of intercorrelatedfeatures more so than do nonliving things (Devlin et al., 1998;Gelman, 1988; Keil, 1989; McRae et al., 1997). Because the natureof a patient’s category-specific deficit typically is tested only afterthe presence of a semantic deficit has been observed, most patientswith progressive impairments are tested only after their damagehas reached at least a moderate stage, and therefore, living-thingsdeficits are predicted to be more likely than nonliving-thingsdeficits (Devlin et al., 1998).
To test whether feature correlations differed by category, wesorted the 34 categories on the mean percentage of their exem-plars’ feature pairs that are correlated from least to most likely tobe impaired in moderate to severe progressive damage. The mostnoticeable aspect of Table 9 is the large amount of variation withineach domain, so that the sets do not group cleanly. Perhaps theonly stable finding is that fruits/vegetables are dense in correlatedfeature pairs. The musical instruments and foods fall in the middleof the sort, providing little insight into why these categories shouldpattern with either living or nonliving things. In summary, wefound little, if any, evidence to suggest that the domains differsystematically in terms of the percentage of correlated features ofwhich their exemplars are composed, suggesting that correlationsamong features may not serve as a major organizational factor ofsemantic memory.
We have previously demonstrated that feature correlations areimportant for semantic computations in unimpaired populations(McRae et al., 1997, 1999). For example, in a speeded feature-verification task, participants were faster to verify that a featurewas part of a concept if the feature was strongly intercorrelatedwith the other features of the concept versus weakly intercorrelatedwith them. Therefore, although the influence of feature correla-tions is evident when testing knowledge at the featural level, itdoes not provide insight into the category-level trends.
Summary: Susceptibility to Impairment
The susceptibility factors provide insight into the trends inimpairment. Creatures pattern separately from nonliving things onall susceptibility factors except the visual similarity and correlatedfeatures. However, with regard to visual similarity, several re-searchers who have tapped visual similarity using analyses ofpictures or drawings have separated the domains on this variable.The fruits/vegetables tend to group together, residing sometimesbetween the creatures and the nonliving things (distinguishingfeatures and feature distinctiveness), sometimes with the creatures(concept similarity and word frequency), and sometimes with thenonliving things (visual complexity and concept familiarity).Foods group consistently with the nonliving things. In contrast,musical instruments either group with the creatures (distinguishingfeatures, concept similarity, concept familiarity, and word fre-quency) or sit near the junction of the creatures, fruits/vegetables,and nonliving things (feature distinctiveness). The one exception isvisual complexity, on which musical instruments group with thenonliving things. Therefore, taken together, the susceptibility fac-tors correctly suggest that creatures impairments should be morefrequent than nonliving-things impairments, that knowledge about
Table 9Percentage of Correlated Feature Pairs for All Features in aCategory
Domain CategoryPercentage of
correlated feature pairs
Nonliving Machine 12.0 (9.6)Creature Insect 12.0 (7.5)Nonliving Utensil 13.8 (12.1)Nonliving Miscellaneous nonliving thing 15.3 (15.7)Creature Rodent 15.5 (5.7)Creature Reptile 16.2 (5.3)Nonliving Tool 16.2 (15.6)Nonliving Container 16.6 (18.3)Creature Herbivore 19.4 (7.9)Nonliving House 19.9 (20.6)Creature Mammal 20.2 (8.7)Creature Carnivore 21.3 (9.3)Nonliving Furniture 21.5 (14.3)Nonliving Weapon 22.3 (17.4)Creature Predator 22.4 (8.5)Nonliving Vehicle 22.5 (13.3)Nonliving Shelter 22.9 (15.8)
Musical instruments 22.9 (12.4)Foods 23.2 (17.8)
Creature Scavenger 23.3 (11.4)Creature Pet 24.8 (11.4)Nonliving Automobile 24.8 (13.6)Nonliving Appliance 25.6 (18.9)Creature Animal 26.0 (14.7)Fruit/vegetable Root/tuber 26.6 (7.8)Fruit/vegetable Plant 27.4 (16.0)Fruit/vegetable Vegetable 29.3 (17.5)Nonliving Fashion accessory 29.3 (18.3)Nonliving Clothing 32.1 (16.1)Fruit/vegetable Fruit 32.9 (14.8)Nonliving Gun 33.1 (9.9)Creature Bird 37.2 (15.3)Creature Fish 41.6 (21.4)Nonliving Building 45.3 (28.3)
Note. Standard deviations are in parentheses.
189FACTORS UNDERLYING SEMANTIC STRUCTURE

musical instruments should often be impaired when knowledgeabout living things is impaired, that fruits/vegetables impairmentsshould be variable, and that foods may be preserved when fruits/vegetables are impaired.
Given these eight susceptibility factors, one issue that arisesconcerns the degree to which they measure independent aspects ofsemantic representation. To address this issue statistically, wecalculated correlations among the susceptibility factors, and theseare presented in Table 10. The correlations were calculated acrossall 538 concepts that were included in at least one of the 34categories. Because of the large number of cases (df � 536), allcorrelation coefficients presented in Table 10 are significant (al-though many are rather small, �0.3 � r � 0.3). There are a fewresults of note. As expected, the two feature informativenessmeasures (distinguishing features and distinctiveness) are highlycorrelated and thus provide essentially the same information. Thisis comforting because the criterion of designating a feature asdistinguishing was somewhat arbitrary. Furthermore, semanticsimilarity has relatively high negative correlations with the infor-mativeness measures, although the sort based on it did not mirrorthe trends as closely. The informativeness measures are dominatedby features that occur in very few concepts, and these featurespresumably play an important role in differentiating among basic-level concepts and thus being able to recognize, name, or provideunique information about them. The fact that these measures bestmirror the behavioral trends implies that preserved computation ofthese features is critical to patients’ performance. At the other endof the spectrum, visual complexity, which reflects the degree ofdifficulty in visually parsing objects or pictures of them, is rela-tively independent of the other measures, and the sort based on itcaptured the behavioral trends reasonably well. Percentage ofcorrelated feature pairs is also relatively independent, although itfailed to provide insight into the behavioral trends. Finally, con-cept familiarity and concept name frequency are also relativelyindependent of all other measures and are only moderately corre-lated with one another. Therefore, given that both measures pro-vided insight into the trends in impairment, they appear to provideuseful information that is relatively independent of the other mea-sures. The fact that they provide somewhat different insight, par-ticularly in terms of fruits/vegetables deficits, has been discussedabove.
Combining the Factors
The final question we address is whether one can gain a betterunderstanding of how the factors converge to produce the trends in
impairment by simultaneously analyzing the brain region knowl-edge type and susceptibility factors. We conducted a cluster anal-ysis using the same procedures as in the previous two clusteranalyses. We included only one feature informativeness measure,distinguishing features, because the strong correlation between itand feature distinctiveness suggests that they index the sameunderlying factor. Thus, we analyzed a 34 (category) � 16 (vari-able) matrix, in which each knowledge type and susceptibilityfactor counts as a separate variable. To control for scaling differ-ences, we rescaled the scores of each variable to range between 0and 1 (rescaled score � (score � min.)/(max. � min.)).
Figure 6 shows a clear replication of the major findings pre-sented in the previous cluster analyses. Creatures, fruits/vegeta-bles, and nonliving things each form distinguishable clusters.Foods cluster with the fruits/vegetables, and then, this entire clus-ter groups with the nonliving things. The only notable differencefrom the knowledge-type cluster analyses is that the musicalinstruments no longer cluster with the nonliving things, insteadforming their own cluster that includes guns and weapons.
To interpret this solution and to explore groupwise relationsamong variables, we conducted a principal components analysis.Examination of the varimax-rotated component matrix presentedin Table 11 reveals four principal components that account for77% of the total variance. We used this matrix in conjunction withthe component score matrix to interpret the components. Compo-nent 1 has high positive loadings on visual–motion and visualcomplexity and high negative loadings on distinguishing features,concept familiarity, concept name frequency, and functions.Therefore, it can be interpreted as discriminating between crea-tures and nonliving things. Component 2 has high positive load-ings on sound, visual similarity, and semantic similarity and highnegative loadings on distinguishing features, concept familiarity,and concept name frequency. In the component score matrix,musical instruments and guns have the highest positive scores onComponent 2, both having highly salient sounds, whereas build-ings, miscellaneous nonliving things, shelters, houses, and foodshave the lowest scores, all of which are particularly high indistinguishing features and concept name frequency. We inter-preted Component 2 as being responsible for producing the musi-cal instruments, guns, and weapons cluster. Component 3 has highpositive loadings on the tactile, visual–color, and taste knowledgetypes and a high negative loading on visual–parts and surfaceproperties. The component score matrix reveals that Component 3primarily distinguishes the fruits/vegetables and foods from theother categories, thus explaining why they form a unique cluster.
Table 10Correlations Among Susceptibility Factors
Factor 1 2 3 4 5 6 7 8
1. Percentage of distinguishing features —2. Distinctiveness .95 —3. Visual similarity �.31 �.35 —4. Semantic similarity �.63 �.66 .59 —5. Visual complexity �.28 �.28 —6. Familiarity .29 .31 �.26 —7. ln[word frequency] .21 .22 .45 —8. Percentage of correlated feature pairs �.21 .37 —
Note. Blank cells indicate r � .20.
190 CREE AND MCRAE
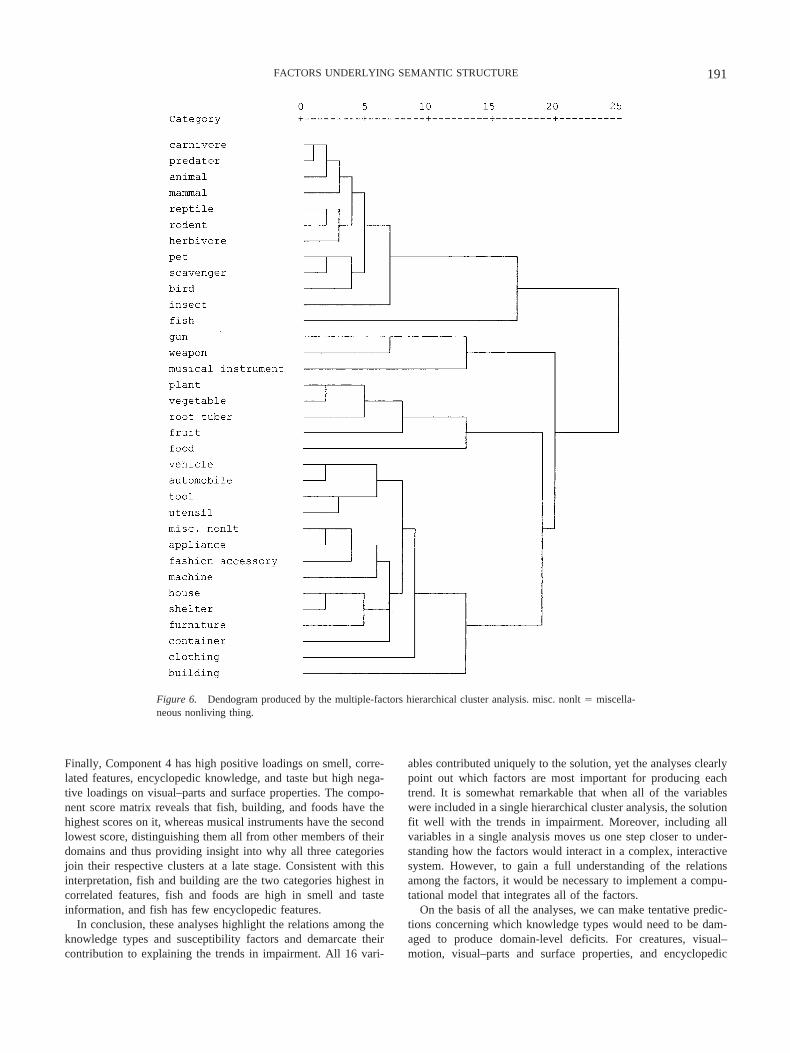
Finally, Component 4 has high positive loadings on smell, corre-lated features, encyclopedic knowledge, and taste but high nega-tive loadings on visual–parts and surface properties. The compo-nent score matrix reveals that fish, building, and foods have thehighest scores on it, whereas musical instruments have the secondlowest score, distinguishing them all from other members of theirdomains and thus providing insight into why all three categoriesjoin their respective clusters at a late stage. Consistent with thisinterpretation, fish and building are the two categories highest incorrelated features, fish and foods are high in smell and tasteinformation, and fish has few encyclopedic features.
In conclusion, these analyses highlight the relations among theknowledge types and susceptibility factors and demarcate theircontribution to explaining the trends in impairment. All 16 vari-
ables contributed uniquely to the solution, yet the analyses clearlypoint out which factors are most important for producing eachtrend. It is somewhat remarkable that when all of the variableswere included in a single hierarchical cluster analysis, the solutionfit well with the trends in impairment. Moreover, including allvariables in a single analysis moves us one step closer to under-standing how the factors would interact in a complex, interactivesystem. However, to gain a full understanding of the relationsamong the factors, it would be necessary to implement a compu-tational model that integrates all of the factors.
On the basis of all the analyses, we can make tentative predic-tions concerning which knowledge types would need to be dam-aged to produce domain-level deficits. For creatures, visual–motion, visual–parts and surface properties, and encyclopedic
Figure 6. Dendogram produced by the multiple-factors hierarchical cluster analysis. misc. nonlt � miscella-neous nonliving thing.
191FACTORS UNDERLYING SEMANTIC STRUCTURE

features are particularly salient. For nonliving things, function,visual–parts and surface properties, and encyclopedic features areimportant. For fruits/vegetables, function, visual–parts and surfaceproperties, visual–color, taste, tactile, and encyclopedic featuresare salient. Extracting the knowledge types that discriminateamong domains, visual–motion information is important only forcreatures, functional information is important only for nonlivingthings and fruits/vegetables, and visual–color, taste, and tactileinformation is important only for fruits/vegetables. On the basis ofthis evidence, one might be tempted to conclude that if a patientwere found for whom one of these groups of knowledge types wasimpaired, he or she would be expected to present with the corre-sponding domain-level deficit. However, the susceptibility analy-ses and combined analyses suggest that making such predictionsmay be premature. Although the salience of a knowledge type canpoint in the right direction, it is necessary to examine how allvariables interact in a dynamic, interactive system before firmpredictions can be derived. Similar concerns motivated Farah andMcClelland (1991) to implement the sensory/functional theory ina computational model. Extensions of existing connectionist mod-els (Cree et al., 1999; Devlin et al., 1998; Hinton & Shallice, 1991;McRae et al., 1997; Rogers & McClelland, in press), in whichsemantic memory would be instantiated across pools of knowledgetypes instead of homogeneous semantic layers, should prove to bea valuable avenue for future research in this domain. Note thatthese types of models are sensitive to all of the susceptibilityfactors given appropriate architectures and training regions, en-abling simultaneous influences of the critical variables.
General Discussion
Our primary hypothesis was that for the regularities in patternsof deficits to exist as they do despite the numerous sources ofvariability in the testing of patients with category-specific deficits,a number of factors regarding the organization and computation ofthe meaning of concrete nouns must converge to produce them.
The major contributions of this article stem from the fact that ourlarge set of feature norms enabled testing the efficacy of the factorsin a manner that is much more detailed than in any previousresearch. We have presented evidence supporting knowledge typeswhen expanded from existing binary distinctions, the degree towhich features are informative about a concept’s identity (mea-sured as distinguishing features and feature distinctiveness), con-cept similarity, visual complexity, concept familiarity, and wordfrequency. Visual similarity and correlations among features werenot supported. On the basis of this empirical evidence, we haveargued that a multifactor theory of the structure and computationof concrete noun concepts is capable of accounting for the primarybehavioral phenomena concerning category-specific semantic def-icits. We now elaborate on this conclusion, engaging currentlyunresolved debates, to argue for the stronger conclusion that amultifactor account is necessary to explain the full spectrum ofdeficits.
The Necessity of Knowledge Types
A central claim of any knowledge-type theory is that the rele-vant sets of categories differ systematically in terms of the salienceof the knowledge types of which their exemplars are composed.Given our analyses, particularly the brain regions cluster analysis,as well as evidence from recent related articles (Garrard, LambonRalph, Hodges, & Patterson, 2001; McRae & Cree, 2002), webelieve that overwhelming evidence now supports the validity ofthis claim.
It has repeatedly been argued that because the sensory/func-tional theory is incapable of accounting for the tripartite distinc-tion, a knowledge-type theory therefore is inadequate as a theoryof semantic organization (Caramazza & Shelton, 1998; Mahon &Caramazza, 2001; Santos & Caramazza 2002; Shelton & Car-amazza, 1999). At the heart of this argument is the claim that thesensory/functional theory contains insufficient degrees of freedomto account for the data. Given the cases that have been reported
Table 11Rotated Component Matrix Produced by the Principal Components Analysis in the Multiple-Factors Hierarchical Cluster Analysis
Type of factor Factor Component 1 Component 2 Component 3 Component 4
Knowledge type Function �.921Knowledge type Visual–motion .910Susceptibility Visual complexity .904Susceptibility Distinguishing features �.701 �.616Susceptibility Visual similarity .781Susceptibility Semantic similarity .770Knowledge type Sound .718Susceptibility Name frequency �.543 �.596Susceptibility Familiarity �.560 �.586Knowledge type Tactile .813Knowledge type Visual–color .768Knowledge type Taste .753 .452Knowledge type Visual–parts & surface
properties�.691 �.467
Knowledge type Smell .762Susceptibility Correlated features .748Knowledge type Encyclopedic .624
Note. Blank cells indicate loading scores less than or greater than �.400.
192 CREE AND MCRAE

since the sensory/functional theory was first introduced, we concurwith the inadequacies of the sensory/functional theory. However,we disagree that this argument can be extended to encompass allknowledge-type theories. Our cluster analyses serve as strongevidence that knowledge-type theories can account for the patternsof impairment. Furthermore, the susceptibility factors show that itis not essential for a knowledge-type theory to explain all relevantbehavioral phenomena because there are other factors that contrib-ute to explaining specific components of the patterns of deficits.
Along similar lines, it has been argued that knowledge-typetheories fail to explain category-specific deficits in cases of non-focal damage. Thus, it has been suggested that there must be othervariables at work, such as feature correlations and feature distinc-tiveness (Devlin et al., 1998; Gonnerman et al., 1997). Our mul-tifactor account makes predictions regarding patients with nonfo-cal damage. First, Garrard, Lambon Ralph, Watson, et al. (2001)discussed evidence suggesting that some brain regions typicallyare targeted by dementia of the Alzheimer type before others, thusraising the possibility that damage to specific knowledge typescould underlie the deficits of some Alzheimer’s disease patients.Specifically, the areas involved in visual object processing usuallyare affected prior to the areas involved in processing functionalinformation, although this can vary by patient. Therefore, on thebasis of knowledge types, living-things deficits might be expectedto be found more often than nonliving-things deficits in thesepatients. If, however, some cases are indeed truly nonfocal, then anaccount most likely depends on other factors. When the suscepti-bility factors are considered, the prediction is obvious: If nonfocalpatients show category-specific deficits, they should virtually al-ways be deficits to creatures rather than to nonliving things. Thedata currently support this prediction (Garrard, Lambon Ralph,Watson, et al., 2001).
If the susceptibility factors can explain how category-specificsemantic deficits might arise from nonfocal damage, perhaps theyare sufficient to account for all cases (Tyler & Moss, 2001).Contrary to this proposal, our analyses suggest that knowledgetypes are necessary to account for nonliving-things deficits. Ouranalyses as a whole correctly predict that nonliving-things deficitsshould be much less prevalent than living-things deficits (whereliving things usually include a combination of creatures and fruits/vegetables). On the other hand, nonliving-things deficits do exist.Therefore, given that the susceptibility factors suggest that non-living things are the least susceptible, this strongly suggests thatnonliving-things deficits are indeed tied to specific types of knowl-edge and thus that knowledge types are necessary to account forthe full spectrum of deficits.
Living-Things Deficits Do Not Necessarily Imply Deficitsto Perceptual Knowledge
It has often been claimed that a central prediction that can bederived from the sensory/functional theory is that there should bea correlation between impaired categories and impaired types ofknowledge (Caramazza & Shelton, 1998). In other words, if sen-sory knowledge is particularly salient for living things and func-tional knowledge for nonliving things and if category-specificdeficits are due to damage to modality-specific processing chan-nels, then when a patient presents with a deficit in one of the twodomains, he or she should also experience difficulty in accessing
the type of knowledge that is purported to underlie the deficit.Thus, living-things deficit patients should have trouble computingvisual knowledge about both living and nonliving things, and thesame should apply for functional knowledge in cases of nonliving-things deficits. Supporting these claims, cases of general deficits tovisual knowledge for both living and nonliving things have beenreported (Forde, Francis, Riddoch, Rumiati, & Humphreys, 1997;Humphreys Riddoch, & Price, 1997; Silveri & Gamotti, 1988).However, the data are not clear. Both living-things and sensory-knowledge deficits have been reported in isolation (Laiacona,Barbarotto, & Capitani, 1993). Patient E.W. (Caramazza & Shel-ton, 1998) had a creatures deficit and was found to be equallyimpaired on visual and functional knowledge. Patient S.E. (Laws,Evans, Hodges, & McCarthy, 1995) had a living-things deficitwith poor associative knowledge. Patient I.W. (Lambon Ralph,Howard, Nightingale, & Ellis, 1998) had a deficit in visual knowl-edge but spared living-things knowledge. In addition, patients withdeficits in naming the color of objects do not necessarily havefruits/vegetables deficits (Luzzatti & Davidoff, 1994; Miceli et al.,2001). The inconsistency in obtaining the predicted correlationsbetween concept domain and knowledge type has been interpretedas evidence against the sensory/functional theory and, by extrap-olation, all knowledge-type theories.
In contrast, our susceptibility analyses clearly show that thereare a number of ways that living-things deficits, and creaturesdeficits in particular, might arise. Our analyses demonstrate thatliving-things deficits do not necessarily have to be accompanied byimpairments to visual sensory knowledge. Therefore, interpretingthe source of living-things deficits may demand data concerningthe precise location of brain damage. It is highly likely, givencurrent understanding of the location of damage in many living-things deficits patients, that the damage includes, but may not belimited to, visual and other multimodal sensory integration areas.The point we wish to highlight, however, is that if the damage isin an area that encodes information important to all categories,such as visual information, or if damage is not restricted to acircumscribed area, then the susceptibility factors may conspire toproduce a creatures (or living-things) deficit. Therefore, the sus-ceptibility factors could produce a living-things deficit eventhough damage to visual knowledge is such that no marked deficitin specific visual knowledge is evidenced in tests of feature-levelknowledge.
There are further reasons why the evidence regarding correla-tions between knowledge types and type of impairment must beinterpreted with caution. Several researchers have claimed thatitems used in these tests have not been equated adequately forknowledge type, difficulty of knowledge, or a myriad of otherfactors that must be considered when testing at the level of features(Caramazza & Shelton, 1998; Cree & McRae, 2001; Humphreys &Forde, 2001). These factors include concept familiarity, featureinformativeness, and other measures of feature saliency and type.Constrained by the sensory/functional hypothesis, researchers haveoften treated all types of sensory knowledge as equivalent, com-paring, for example, questions about the parts of living things withthe colors of nonliving things, as though these knowledge typeswere a priori equally salient and accessible. Likewise, to testresidual functional knowledge, researchers have been forced toextend the meaning of the term functional to devise questionsabout living things (e.g., “Does a squirrel climb trees?”). Thus,
193FACTORS UNDERLYING SEMANTIC STRUCTURE

knowledge about how people use nonliving things has been com-pared with entity behaviors or visual motion features of livingthings. Unfortunately, because most articles do not include theiritems, it is impossible to use the feature norms to evaluate fully thevalidity of the available evidence. When we consider all of theseproblems together, we conclude that the data necessary to resolvethis debate remain to be collected. We hope that our feature normswill serve as a valuable tool in this regard.
Do Highly Distributed, Highly OverlappingRepresentations Imply Amodal Semantics?
A final argument regarding knowledge types concerns the va-lidity of the neuroimaging evidence supporting modality-specificsemantic processing regions. Devlin et al. (2002) and Tyler andMoss (2001) claimed that the regions activated across studies byexemplars of particular categories are far from consistent and thatthe only consistent finding has been that tools activate the leftposterior middle temporal gyrus (H. Damasio et al., 1996; Martinet al., 1996). They argued that the discrepant findings can beattributed to a number of factors, including poorly controlledstimuli and task differences. Furthermore, they argued that studiesclaiming to find category-specific areas of activation may bereporting false positives that occur because of uncontrolled alphalevels across multiple voxel-level comparisons. In their own re-search, they found that living and nonliving things both activate anextensive network of neural areas, including left frontotemporalregions, with no category-level or domain-level differences (Dev-lin et al., 2002), and therefore, they argued against the existence ofmodality-specific semantic processing regions.
Devlin et al.’s, (2002) criticisms can be synthesized withmodality-specific organization, however. Martin and Chao (2001;see also Kiefer & Spitzer, 2001) recently reviewed a growing bodyof evidence supporting the claim that object representations arebest characterized as complex patterns of peaks and valleys ofactivation in the ventral temporal and occipital cortex (Haxby etal., 2001). Items from various object categories elicit maximalpeaks of activity in regions of these distributed areas based on theparticular visual features and semantic knowledge types of whichthey are composed. Furthermore, Martin and Chao reported thatthe arrangement of these peaks is consistent across subjects andtasks. As Devlin et al. pointed out, many of the studies on whichtheir own meta-analysis was based used poorly controlled stimuliand almost certainly did not control for differences in knowledgetypes across categories. It is therefore perhaps not surprising thatDevlin et al. failed to find areas of activation that can be consis-tently associated with specific categories. Differences in familiar-ity, imageability, visual complexity, and structural similarity inprevious studies—and most importantly, knowledge types in theirown studies—may have masked these differences. Therefore, al-though there is no doubt that vast distributed processing areas are,and should be, activated when concrete noun concepts are com-puted, the interesting question is whether some regions are acti-vated differentially from others when processing stimuli controlledfor the salience of different knowledge types (and other factors),not category.
“Category”-Specific Deficits?
A similar line of reasoning can be applied to all behavioralstudies of category-specific semantic deficits. Although the studyof patients exhibiting category-specific deficits has led researchersto look closely at the structure of concrete noun concepts tounderstand what may underlie these category-level differences, itis ironic that these studies may point to the conclusion that thedeficits are not categorical in nature at all. Instead, what appear tobe category-specific deficits may just be the result of tests that usecategory exemplars that group at various ends of the continua ofpossible scores on the factors discussed in this article (Tranel,Logan, et al., 1997, reached a similar conclusion). Certainly,exception categories that do not pattern with their respectivedomains in terms of impairment, such as foods, musical instru-ments, and body parts, point to this conclusion.
The analyses presented herein highlight the variability acrosscategories on the factors thought to structure semantic memory andinfluence computations. Our analyses show that category exem-plars vary on these factors within sets of categories. Consider fishand insects. If a researcher were testing for residual creatureknowledge, it would be unwise to use items from these twocategories. Across susceptibility factors, fish and insects are atopposite ends of the range of scores within the domain of creatureson many of them and, most importantly, are not typical of crea-tures. Likewise, for nonliving things, it would be unwise to com-pare residual knowledge about vehicles and buildings, which notonly vary on multiple susceptibility factors but also differ system-atically across knowledge types (e.g., many vehicles have salientvisual–motion features, whereas buildings do not). We believe thatour analyses contribute to the growing body of work demonstrat-ing the importance of either controlling or systematically varyingthe factors known to influence semantic processing when testingfor deficits.
An intriguing notion is that it may be possible to devise sets ofstimuli that vary on relevant factors but do not necessarily obeycategory distinctions. For example, with nonfocal damage such asdementia of the Alzheimer type, one should be able to showrelative deficits within creatures and within nonliving things byjudiciously choosing items based on the distributional statistics ofsusceptibility factors across individual exemplars. This may evenbe true for patients with relatively focal damage. For example, itmay be possible to elucidate within-domain differential deficits byusing imaging to localize the neural damage in a herpes simplexviral encephalitis patient and then devising test items based on thesusceptibility factors plus the degree to which individual conceptsdepend on specific knowledge types. We hope that our featurenorms and the related measures can assist those who wish toconduct such studies.
Implications for Theories
We began by highlighting the similarities and differences thatexist among current theories of semantic memory organization(Table 1). We argued that even though each theory emphasizes theimportance of specific factors over others, the theories generallyshare more similarities than differences. Thus, it is perhaps notsurprising that the view we advocate overlaps to varying degreeswith all of the relevant theories. A number of theories, most
194 CREE AND MCRAE
prominently the sensory/functional theory (Farah & McClelland,1991; Martin et al., 2000; Warrington & Shallice, 1984) and theHIT (Humphreys & Forde, 2001), propose that knowledge typesare central to explaining deficits. We extended these theoriesbeyond a binary distinction and accounted for the tripartite dis-tinction among creatures, fruits/vegetables, and nonliving things(as well as foods and musical instruments). Feature informative-ness in various guises plays a prominent role in several theories(Devlin et al., 1998; Garrard, Lambon Ralph, Hodges, & Patterson,2001; Tyler & Moss, 2001). Although this factor has yet to beincorporated explicitly into the other theories, it is doubtful thatresearchers would predict that it would not play at least some rolein explaining observed patterns of deficits. Various researchershave emphasized visual complexity (Dixon et al., 1997) and neigh-borhood density in terms of visual and semantic similarity (Cara-mazza et al., 1990; Dixon et al., 1997, 1998; Humphreys & Forde,2001). Our analyses showed that both visual complexity andsemantic similarity are part of an explanation of the behavioraltrends. We also believe that visual similarity plays a role, but ouranalyses failed to provide sufficient insight. All theories posit thatthe probability that a concept will be preserved following damageis determined partially by the degree to which its referents andname are encountered, as estimated herein by concept familiarityratings and word frequency counts respectively. Our analysesprovided further evidence that this is indeed the case. Finally,although some theories have postulated a role for feature correla-tions (Devlin et al., 1998; Gonnerman et al., 1997; Tyler & Moss,2001), we found that it provides little insight into the trends. Insummary, we suggest that all of these factors, with the exceptionof feature correlations, must be amalgamated to account for the fullbreadth of the behavioral phenomena.
Our view runs contrary, however, to any theory that dismissesknowledge types, as do the conceptual structure account (Tyler &Moss, 2001) and OUCH (Caramazza et al., 1990). This is not tosay that we disagree with all aspects of these theories. Both havemade important contributions to our understanding of the impor-tance of shared features, distinguishing features, and form–function correlations (which we were unable to test). If thesetheories were amended to include knowledge types, which webelieve our evidence argues they must be, it is not clear that theywould make any empirical predictions that would distinguish themfrom the other available theories, including our own multifactoraccount.
Finally, dissatisfaction with existing knowledge-type theorieshas prompted some authors to appeal to an evolution-baseddomain-specific hypothesis (Caramazza & Shelton, 1998). In ourview, part of the appeal of the domain-specific hypothesis is theelegant manner with which it accounts for both the tripartitedistinction and the failure to find convincing evidence for corre-lations among impaired categories and impaired knowledge types.We have presented data and arguments that can also explain thesephenomena while avoiding many of the problems introduced by anevolutionary account (Rogers & Plaut, 2002). We believe, there-fore, that although further research into how evolutionary pres-sures may have shaped representations and computations used bythe brain may broaden the understanding of neural and cognitiveprocessing, our view obviates the need to turn to the domain-specific hypothesis to explain category-specific semantic deficits.
Conclusions
A multifactor account of the structure and computation of con-crete noun concepts can explain the primary behavioral phenom-ena associated with category-specific semantic deficits. This ac-count includes not only the knowledge types that may underliethese concepts in the mind and brain but also a number of otherdistributional factors that influence the representation and compu-tation of concrete noun concepts. We believe that all of thesefactors influence the way in which these concepts are structuredand computed and that therefore they must be integrated in acomplete model of semantic memory.
References
Albanese, E., Capitani, E., Barbarotto, R., & Laiacona, M. (2000). Seman-tic category dissociations, familiarity and gender. Cortex, 36, 733–746.
Allen, M., Inoue, K., Osterhout, L., & McLaughlin, J. (2002, April).Primary sensory cortex and word meanings. Poster presented at theCognitive Neuroscience Society Ninth Annual Meeting, San Francisco,CA.
Allport, D. A. (1985). Distributed memory, modular systems and dyspha-sia. In S. K. Newman & R. Epstein (Eds.), Current perspectives indysphasia (pp. 32–60). Edinburgh, Scotland: Churchill Livingstone.
Arguin, M., Bub, D., & Dudeck, G. (1996). Shape integration for visualobject recognition and its implications in category specific visual agno-sia. Visual Cognition, 3, 221–275.
Barbarotto, R., Capitani, E., & Laiacona, M. (2001). Living musicalinstruments and inanimate body parts? Neuropsychologia, 39, 406–414.
Barrett, S. E., Abdi, H., Murphy, G. L., & Gallagher, J. M. (1993).Theory-based correlations and their role in children’s concepts. ChildDevelopment, 64, 1595–1616.
Barsalou, L. W. (1992). Frames, concepts, and conceptual fields. In E.Kittay & A. Lehrer (Eds.), Frames, fields, and contrasts: New essays insemantic and lexical organization (pp. 21–74). Hillsdale, NJ: Erlbaum.
Barsalou, L. W. (1999). Perceptual symbol systems. Behavioral and BrainSciences, 22, 577–660.
Barsalou, L. W., Sloman, S. A., & Chaigneau, S. E. (in press). The HIPEtheory of function. In L. Carlson & E. van der Zee (Eds.), Representingfunctional features for language and space: Insights from perception,categorization, and development. New York: Oxford University Press.
Beauchamp, M. S., Cox, R. W., & De Yoe, E. A. (1997). Graded effects ofspatial and featural attention on human area MT and associated motionprocessing areas. Journal of Neurophysiology, 78, 516–520.
Bonin, P., Chalard, M., Meot, A., & Fayol, M. (2002). The determinants ofspoken and written picture naming latencies. British Journal of Psychol-ogy, 93, 89–114.
Bub, D. (2000). Methodological issues confronting PET and fMRI studiesof cognitive function: With special reference to Human Brain Function(1997). Cognitive Neuropsychology, 17, 467–484.
Bub, D., & Bukach, C. (2001). Limitations on current explanations ofcategory-specific agnosia: Commentary on G. W. Humphreys &E. M. E. Forde, “Hierarchies, Similarity and Interactivity in ObjectRecognition: ‘Category-Specific’ Neuropsychological Deficits.” Behav-ioral and Brain Sciences, 24, 479–480.
Bukach, C. M., Bub, D. N., Masson, M. E. J., & Lindsay, D. S. (2002).Category specificity in normal episodic learning: Applications to objectrecognition and category-specific agnosia. Manuscript submitted forpublication.
Burnard, L. (2000). British National Corpus user reference guide Ver-sion 2.0. Retrieved May 20, 2002, from British National Corpus, OxfordUniversity Computing Service Web site: http:/www.hcu.ox.ac.uk/BNC/World/HTML/urg.html
Caramazza, A., Hillis, A. E., Rapp, B. C., & Romani, C. (1990). The
195FACTORS UNDERLYING SEMANTIC STRUCTURE

multiple semantics hypothesis: Multiple confusions? Cognitive Neuro-psychology, 7, 161–189.
Caramazza, A., & Shelton, J. R. (1998). Domain-specific knowledgesystems in the brain: The animate–inanimate distinction. Journal ofCognitive Neuroscience, 10, 1–34.
Chao, L. L., Haxby, J. V., & Martin, A. (1999). Attribute-based neuralsubstrates in posterior temporal cortex for perceiving and knowing aboutobjects. Nature Neuroscience, 2, 913–919.
Chao, L. L., & Martin, A. (1999). Cortical representation of perception,naming, and knowing about colour. Journal of Cognitive Neuro-science, 11, 25–35.
Chao, L. L., & Martin, A. (2000). Representation of manipulable man-made objects in the dorsal stream. NeuroImage, 12, 478–484.
Collins, A. M., & Quillian, M. R. (1969). Retrieval time from semanticmemory. Journal of Verbal Learning and Verbal Behavior, 8, 240–247.
Corbetta, M., Miezin, F. M., Dobmeyer, S., Shulman, G. L., & Peterson,S. E. (1990, June 22). Attentional modulation of neural processing ofshape, color, and velocity in humans. Science, 248, 1556–1559.
Cree, G. S., & McRae, K. (2001). Commentary on G. W. Humphreys &E. M. E. Forde, “Hierarchies, Similarity and Interactivity in ObjectRecognition: ‘Category-Specific’ Neuropsychological Deficits.” Behav-ioral and Brain Sciences, 24, 480–481.
Cree, G. S., McRae, K., & McNorgan, C. (1999). An attractor model oflexical conceptual processing: Simulating semantic priming. CognitiveScience, 23, 371–414.
Damasio, A. R. (1989). Time-locked multiregional retroactivation: Asystems-level proposal for the neural substrates of recall and recognition.Cognition, 33, 25–62.
Damasio, H., Grabowski, T. J., Tranel, D., Hichwa, R. D., & Damasio,A. R. (1996, April 11). A neural basis for lexical retrieval. Nature, 380,499–505.
De Renzi, E., & Lucchelli, F. (1994). Are semantic systems separatelyrepresented in the brain? The case of living category impairment. Cor-tex, 30, 3–25.
Devlin, J. T., Gonnerman, L. M., Anderson, E. S., & Seidenberg, M. S.(1998). Category-specific semantic deficits in focal and widespreaddamage: A computational account. Journal of Cognitive Neuro-science, 10, 77–94.
Devlin, J. T., Russell, R. P., Davis, M. H., Price, C. J., Moss, H. E., Fadili,M. J., & Tyler, L. K. (2002). Is there an anatomical basis for category-specificity? Semantic memory studies in PET and fMRI. Neuropsycho-logia, 40, 54–75.
Dixon, M. J., Bub, D. N., & Arguin, M. (1997). The interaction of objectform and object meaning in the identification performance of a patientwith category-specific visual agnosia. Cognitive Neuropsychology, 14,1085–1130.
Dixon, M. J., Bub, D. N., & Arguin, M. (1998). Semantic and visualdeterminants of face recognition in a prosopagnosic patient. Journal ofCognitive Neuroscience, 10, 362–376.
Dixon, M. J., Desmarais, G., Gojmerac, C., Schweizer, T. A., & Bub, D. N.(2002). The role of premorbid expertise on object identification in apatient with category-specific visual agnosia. Cognitive Neuropsychol-ogy, 19, 401–419.
Duncan, C. P. (1977). Effects of frequency on retrieval from a semanticcategory. Bulletin of the Psychonomic Society, 10, 57–59.
Ellis, A. W., & Morrison, C. M. (1998). Real age of acquisition effects inobject naming. Journal of Experimental Psychology: Learning, Memory,and Cognition, 24, 515–523.
Farah, M. J., & McClelland, J. L. (1991). A computational model ofsemantic memory impairment: Modality specificity and emergent cate-gory specificity. Journal of Experimental Psychology: General, 120,339–357.
Farah, M. J., Meyer, M. M., & McMullen, P. A. (1996). The living/
nonliving dissociation is not an artifact: Giving an a priori implausiblehypothesis a strong test. Cognitive Neuropsychology, 13, 137–154.
Farah, M. J., & Wallace, M. A. (1992). Semantically-bounded anomia:Implications for the neural implementation of naming. Neuropsycholo-gia, 30, 609–621.
Fillmore, C. J. (1968). The case for case. In E. Bach & R. Harms (Eds.),Universals in linguistic theory (pp. 1–88). New York: Holt, Rinehart &Winston.
Forde, E. M. E., Francis, D., Riddoch, M. J., Rumiati, R. I., & Humphreys,G. W. (1997). On the links between visual knowledge and naming: Asingle case study of a patient with a category-specific impairment forliving things. Cognitive Neuropsychology, 14, 403–458.
Forster, K. I., & Chambers, S. M. (1973). Lexical access and naming time.Journal of Verbal Learning and Verbal Behavior, 12, 627–635.
Funnell, E., & de Mornay-Davies, P. (1996). JBR: A reassessment ofconcept familiarity and a category-specific disorder for living things.Neurocase, 2, 461–474.
Funnell, E., & Sheridan, J. (1992). Categories of knowledge? Unfamiliaraspects of living and nonliving things. Cognitive Neuropsychology, 9,135–153.
Gaffan, D., & Heywood, C. A. (1993). A spurious category-specific visualagnosia for living things in normal human and nonhuman primates.Journal of Cognitive Neuroscience, 5, 118–128.
Gainotti, G. (2000). What the locus of brain lesion tells us about the natureof the cognitive defect underlying category-specific disorders: A review.Cortex, 36, 539–559.
Gainotti, G., Silveri, M. C., Daniele, A., & Giustolisi, L. (1995). Neuro-anatomical correlates of category-specific semantic disorders: A criticalsurvey. Memory, 3, 247–264.
Gale, T. M., Done, D. J., & Frank, R. J. (2001). Visual crowding andcategory specific deficits for pictorial stimuli: A neural network model.Cognitive Neuropsychology, 18, 509–550.
Garrard, P., Lambon Ralph, M. A., Hodges, J. R., & Patterson, K. (2001).Prototypicality, distinctiveness, and intercorrelation: Analyses of thesemantic attributes of living and nonliving concepts. Cognitive Neuro-psychology, 18, 125–174.
Garrard, P., Lambon Ralph, M. A., Watson, P. C., Powis, J., Patterson, K.,& Hodges, J. R. (2001). Longitudinal profiles of semantic impairmentfor living and nonliving concepts in dementia of Alzheimer’s type.Journal of Cognitive Neuroscience, 13, 892–909.
Garrard, P., Patterson, K., Watson, P. C., & Hodges, J. R. (1998).Category-specific semantic loss in dementia of Alzheimer’s type:Functional–anatomical correlations from cross-sectional analyses.Brain, 121, 633–646.
Gelman, S. (1988). The development of induction within natural kind andartifact categories. Cognitive Psychology, 20, 65–95.
Gerardin, E., Sirigu, A., Lehericy, S., Poline, J. B., Gaymard, B., Marsault,C., et al. (2000). Partially overlapping neural networks for real andimagined hand movements. Cerebral Cortex, 10, 1093–1104.
Gonnerman, L. M., Anderson, E. S., Devlin, J. T., Kempler, D., & Sei-denberg, M. S. (1997). Double dissociation of semantic categories inAlzheimer’s disease. Brain and Language, 57, 254–279.
Grabowski, T. J., Damasio, H., & Damasio, A. R. (1998). Premotor andprefrontal correlates of category-related lexical retrieval. NeuroImage, 7,232–243.
Grafton, S. T., Fadiga, L., Arbib, M. A., & Rizzolatti, G. (1997). Premotorcortex activation during observation and naming of familiar tools. Neu-roImage, 6, 231–236.
Hampton, J. A. (1997). Conceptual combination: Conjunction and negationof natural concepts. Memory and Cognition, 25, 888–909.
Hart, J., Berndt, R. S., & Caramazza, A. (1985, August 1). Category-specific naming deficit following cerebral infarction. Nature, 316, 439–440.
196 CREE AND MCRAE
Hart, J., & Gordon, B. (1992, September 3). Neural subsystems for objectknowledge. Nature, 359, 60–64.
Haxby, J. V., Gobbini, M. I., Furey, M. L., Ishai, A., Schouten, J. L., &Pietrini, P. (2001, September 28). Distributed and overlapping represen-tations of faces and objects in ventral temporal cortex. Science, 293,2425–2430.
Hebb, D. O. (1949). The organization of behaviour: A neuropsychologicaltheory. New York: Wiley.
Hillis, A. E., & Caramazza, A. (1991). Category-specific naming andcomprehension impairment: A double dissociation. Brain, 114, 2081–2094.
Hillis, A. E., Rapp, B., Romani, C., & Caramazza, A. (1990). Selectiveimpairment of semantics in lexical processing. Cognitive Neuropsychol-ogy, 7, 191–243.
Hinton, G. E., & Shallice, T. (1991). Lesioning an attractor network:Investigations of acquired dyslexia. Psychological Review, 98, 74–95.
Howard, R. J., Ffytche, D. H., Barnes, J., McKeefry, D., Ha, Y., Woodruff,P. W., et al. (1998). The functional anatomy of imagined and perceivedcolor. Neuroreport, 9, 1019–1023.
Hubel, D. H., & Livingstone, M. S. (1987). Segregation of form, color andstereopsis in primate Area 18. Journal of Neuroscience, 7, 3378–3415.
Hultsch, D. F., MacDonald, S. W. S., Hunter, M. A., Levy-Bencheton, J.,& Strauss, E. (2000). Intraindividual variability in cognitive perfor-mance in older adults: Comparison of adults with mild dementia, adultswith arthritis, and healthy adults. Neuropsychology, 14, 588–598.
Humphreys, G. W., & Forde, E. M. E. (2001). Hierarchies, similarity andinteractivity in object recognition: “Category-specific” neuropsycholog-ical deficits. Behavioral and Brain Sciences, 24, 453–509.
Humphreys, G. W., Lamote, C., & Lloyd-Jones, T. J. (1995). An interac-tive activation approach to object processing: Effects of structural sim-ilarity, name frequency, and task in normality and pathology. Memory, 3,535–586.
Humphreys, G. W., Lloyd-Jones, T. J., & Fias, W. (1995). Semanticinterference effects on naming using a post-cue procedure: Tapping thelinks between semantics and phonology with pictures and words. Jour-nal of Experimental Psychology: Learning, Memory, and Cognition, 21,961–980.
Humphreys, G. W., & Riddoch, M. J. (2002). Do pixel-level analysesdescribe psychological perceptual similarity? A comment on “Category-Specific Naming and the ‘Visual’ Characteristics of Line Drawn Stim-uli” by Laws and Gale. Cortex, 38, 3–5.
Humphreys, G. W., Riddoch, M. J., & Price, C. J. (1997). Top-downprocesses in object identification: Evidence from experimental psychol-ogy, neuropsychology and functional anatomy. Philosophical Transac-tions of the Royal Society (B), 352, 1275–1282.
Humphreys, G. W., Riddoch, M. J., & Quinlan, P. T. (1988). Cascadeprocesses in picture identification. Cognitive Neuropsychology, 5, 67–103.
Keil, F. C. (1989). Concepts, kinds, and cognitive development. Cam-bridge, MA: MIT Press.
Kiefer, M., & Spitzer, M. (2001). The limits of a distributed account ofconceptual knowledge. Trends in Cognitive Sciences, 5, 469–471.
Kremin, H., Hamerel, M., Dordain, M., De Wilde, M., & Perrier, D.(2000). Age of acquisition and name agreement as predictors of meanresponse latencies in picture naming of French adults. Brain and Cog-nition, 43, 286–291.
Kruschke, J. K. (1992). ALCOVE: An exemplar-based connectionistmodel of category learning. Psychological Review, 99, 22–44.
Laiacona, M., Barbarotto, R., & Capitani, E. (1993). Perceptual and asso-ciative knowledge in category specific impairment of semantic memory:A study of two cases. Cortex, 29, 727–740.
Laiacona, M., Luzzatti, C., Zonca, G., Guarnaschelli, C., & Capitani, E.(2001). Lexical and semantic factors influencing picture naming inaphasia. Brain and Cognition, 46, 184–187.
Lambon Ralph, M. A., Graham, K. S., Ellis, A. W., & Hodges, J. R. (1998).Naming in semantic dementia: What matters? Neuropsychologia, 36,775–784.
Lambon Ralph, M. A., Howard, D., Nightingale, G., & Ellis, A. W. (1998).Are living and non-living category-specific deficits causally linked toimpaired perceptual or associative knowledge? Evidence from acategory-specific double dissociation. Neurocase, 4, 311–338.
Laws, K. R. (1998). Why leopards never change their spots: A reply toMoss, Tyler, & Jennings. Cognitive Neuropsychology, 15, 467–479.
Laws, K. R., Evans, J. J., Hodges, J. R., & McCarthy, R. A. (1995).Naming without knowing and appearance without associations: Evi-dence for constructive processes in semantic memory? Memory, 3,409–433.
Laws, K. R., & Gale, T. M. (2002). Category-specific naming and the“visual” characteristics of line drawn stimuli. Cortex, 38, 2002.
Lloyd-Jones, T. J., & Humphreys, G. W. (1997). Perceptual differentiationas a source of category effects in object processing: Evidence fromnaming and object decision. Memory and Cognition, 25, 18–35.
Luzzatti, C., & Davidoff, J. (1994). Impaired retrieval of object-colorknowledge with preserved color naming. Neuropsychologia, 32, 1–18.
Mahon, B., & Caramazza, A. (2001). The sensory/functional assumption orthe data: Which do we keep? Commentary on G. W. Humphreys &E. M. E. Forde, “Hierarchies, Similarity and Interactivity in ObjectRecognition: ‘Category-Specific’ Neuropsychological Deficits.” Behav-ioral and Brain Sciences, 24, 488–489.
Malt, B., & Smith, E. E. (1984). Correlated properties in natural categories.Journal of Verbal Learning and Verbal Behavior, 23, 250–269.
Martin, A., & Chao, L. L. (2001). Semantic memory and the brain:Structure and processes. Current Opinion in Neurobiology, 11, 194–201.
Martin, A., Haxby, J. V., Lalonde, F. M., Wiggs, C. L., & Ungerleider,L. G. (1995, October 6). Discrete cortical regions associated with knowl-edge of color and knowledge of action. Science, 270, 102–105.
Martin, A., Ungerleider, L. G., & Haxby, J. V. (2000). Category-specificityand the brain: The sensory/motor model of semantic representations ofobjects. In M. S. Gazzaniga (Ed.), The cognitive neurosciences (2nd ed.;pp. 1023–1036). Cambridge, MA: MIT Press.
Martin, A., Wiggs, C. L., Ungerleider, L. G., & Haxby, J. V. (1996,February 15). Neural correlates of category-specific knowledge. Nature,379, 649–652.
McGuire, S., & Plaut, D. C. (1997). Systematicity and specialization insemantics: A computational account of optic aphasia. In Proceedings ofthe 19th Annual Conference of the Cognitive Science Society (pp. 502–507). Hillsdale, NJ: Erlbaum.
McRae, K., & Cree, G. S. (2002). Factors underlying category-specificsemantic deficits. In E. M. E. Forde & G. W. Humphreys (Eds.),Category-specificity in brain and mind (pp. 211–249). East Sussex,England: Psychology Press.
McRae, K., Cree, G. S., Westmacott, R., & de Sa, V. R. (1999). Furtherevidence for feature correlations in semantic memory. Canadian Journalof Experimental Psychology, 53, 360–373.
McRae, K., de Sa, V. R., & Seidenberg, M. S. (1997). On the nature andscope of featural representations of word meaning. Journal of Experi-mental Psychology: General, 126, 99–130.
McRae, K., Jared, D., & Seidenberg, M. S. (1990). On the roles offrequency and lexical access in word naming. Journal of Memory andLanguage, 29, 43–65.
Miceli, G., Fouch, E., Capasso, R., Shelton, J. R., Tomaiuolo, F., &Caramazza, A. (2001). The dissociation of color from form and functionknowledge. Nature Neuroscience, 4, 662–667.
Montanes, P., Goldblum, M. C., & Boller, F. (1995). Naming colour andblack–white pictures from living and nonliving things in Alzheimer’sdisease. Journal of the International Neuropsychological Society, 1,39–48.
197FACTORS UNDERLYING SEMANTIC STRUCTURE

Moss, H. E., Tyler, L. K., & Jennings, F. (1997). When leopards lose theirspots: Knowledge of visual properties in category-specific deficits forliving things. Cognitive Neuropsychology, 14, 901–950.
Nickels, L. A., & Howard, D. (1995). Aphasic naming: What matters?Neuropsychologia, 33, 1281–1303.
Oram, M. W., & Perrett, D. I. (1994). Reponses of anterior superiortemporal polysensory (STPa) neurons to biological motion stimuli. Jour-nal of Cognitive Neuroscience, 6, 99–116.
Paulesu, E. J., Harrison, J., Baron-Cohen, S., Watson, J. D. G., Goldstein,L., Heather, J., et al. (1995). The physiology of colored hearing: A PETactivation study of color-word synaesthesia. Brain, 118, 661–676.
Riddoch, M. J., & Humphreys, G. W. (1987). Picture naming. In G. W.Humphreys & M. J. Riddoch (Eds.), Visual object processing: A cog-nitive neuropsychological approach (pp. 107–143). London: Erlbaum.
Rogers, T. T., & McClelland, J. L. (in press). Semantic cognition: Aparallel distributed processing approach. Cambridge, MA: MIT Press.
Rogers, T. T., & Plaut, D. C. (2002). Connectionist perspectives oncategory-specific deficits. In E. M. E. Forde & G. W. Humphreys (Eds.),Category-specificity in brain and mind (pp. 251–290). East Sussex,England: Psychology Press.
Rosch, E. (1978). Principles of categorization. In E. Rosch & B. B. Lloyd(Eds.), Cognition and categorization (pp. 27–48). Hillsdale, NJ:Erlbaum.
Rosch, E., & Mervis, C. B. (1975). Family resemblances: Studies in theinternal structure of categories. Cognitive Psychology, 7, 573–695.
Rosch, E., Mervis, C. B., Gray, W. D., Johnson, D. M., & Boyes-Braem,P. (1976). Basic objects in natural categories. Cognitive Psychology, 8,382–439.
Sacchett, C., & Humphreys, G. W. (1992). Calling a squirrel a squirrel buta canoe a wigwam: A category-specific deficit for artefactual objects andbody parts. Cognitive Neuropsychology, 9, 73–86.
Sakai, K., Watanabe, E., Onodera, Y., Uchida, I., Kato, H., Yamamoto, E.,et al. (1995). Mapping the human colour centre with echo-planar mag-netic resonance imaging. Proceedings of the Royal Society of London(B), 261, 89–98.
Santos, L. R., & Caramazza, A. (2002). The domain-specific hypothesis: Adevelopmental and comparative perspective on category-specific defi-cits. In E. M. E. Forde & G. W. Humphreys (Eds.), Category-specificityin brain and mind (pp. 1–24). East Sussex, England: Psychology Press.
Sartori, G., & Job, R. (1988). The oyster with four legs: A neuropsycho-logical study on the interaction of visual and semantic information.Cognitive Neuropsychology, 5, 105–132.
Sartori, G., Job, R., Miozzo, M., Zago, S., & Marchiori, G. (1993).Category-specific form-knowledge deficit in a patient with herpes sim-plex encephalitis. Journal of Clinical and Experimental Neuropsychol-ogy, 15, 280–299.
Schank, R. C., & Abelson, R. (1977). Scripts, plans, goals, and under-standing. Hillsdale, NJ: Erlbaum.
Schweizer, T. A., Dixon, M. J., Westwood, D., & Piskopos, M. (2001).Contribution of visual and semantic proximity to identification perfor-mance in a viral encephalitis patient. Brain and Cognition, 46, 260–264.
Shallice, T. (1988). From neuropsychology to mental structure. Cam-bridge, England: Cambridge University Press.
Shelton, J. R., & Caramazza, A. (1999). Deficits in lexical and semanticprocessing: Implications for models of normal language. PsychonomicBulletin and Review, 6, 5–27.
Silveri, M. C., & Gainotti, G. (1988). Interaction between vision andlanguage in category-specific semantic impairment. Cognitive Neuro-psychology, 5, 677–709.
Sloman, S. A., Love, B. C., & Ahn, W. K. (1998). Feature centrality andconceptual coherence. Cognitive Science, 22, 189–228.
Smith, E. E., Shoben, E. J., & Rips, L. J. (1974). Structure and process insemantic memory: A feature model for semantic decisions. Psycholog-ical Review, 81, 214–241.
Snodgrass, J. G., & Vanderwart, M. (1980). A standardized set of 260pictures: Norms for name agreement, image agreement, familiarity andvisual complexity. Journal of Experimental Psychology: Human Learn-ing and Memory, 6, 174–215.
Stewart, F., Parkin, A. J., & Hunkin, N. M. (1992). Naming impairmentsfollowing recovery from herpes simplex encephalitis. Quarterly Journalof Experimental Psychology, 44A, 261–284.
Tanaka, J. W., & Taylor, M. (1991). Object categories and expertise: Is thebasic level in the eye of the beholder? Cognitive Psychology, 23,457–482.
Thompson-Schill, S. L., Aguirre, G. K., D’Esposito, M., & Farah, M. J.(1999). A neural basis for category and modality specificity of semanticknowledge. Neuropsychologia, 37, 671–676.
Tranel, D., Damasio, H., & Damasio, A. R. (1997). A neural basis for theretrieval of conceptual knowledge. Neuropsychologia, 37, 671–676.
Tranel, D., Logan, C. G., Frank, R. J., & Damasio, A. R. (1997). Explain-ing category-related effects in the retrieval of conceptual and lexicalknowledge for concrete entities: Operationalization and analysis offactors. Neuropsychologia, 35, 1329–1339.
Tversky, A. (1977). Features of similarity. Psychological Review, 84,327–352.
Tyler, L. K., & Moss, H. E. (1997). Functional properties of concepts:Studies of normal and brain-damaged patients. Cognitive Neuropsychol-ogy, 14, 511–545.
Tyler, L. K., & Moss, H. E. (2001). Towards a distributed account ofconceptual knowledge. Trends in Cognitive Sciences, 5, 244–252.
Waldmann, M. R., Holyoak, K. J., & Fratianne, A. (1995). Causal modelsand the acquisition of category structure. Journal of Experimental Psy-chology: General, 124, 181–206.
Warrington, E. K. (1975). The selective impairment of semantic memory.Quarterly Journal of Experimental Psychology, 27, 635–657.
Warrington, E. K., & McCarthy, R. (1983). Category specific accessdysphasia. Brain, 106, 859–878.
Warrington, E. K., & McCarthy, R. (1987). Categories of knowledge:Further fractionations and an attempted integration. Brain, 110, 1273–1296.
Warrington, E. K., & Shallice, T. (1984). Category specific semanticimpairments. Brain, 107, 829–854.
Wu, L. L., & Barsalou, L. W. (2002). Grounding concepts in perceptualsimulation: 1. Evidence from property generation. Manuscript submittedfor publication.
Zeki, S. (1991). Cerebral akinotopsia (visual motion blindness). Brain,114, 811–824.
Zeki, S., Watson, J. D. G., Lueck, C. J., Friston, K. J., Kennard, C., &Frackowiak, R. S. J. (1991). A direct demonstration of functional spe-cialization in human visual cortex. Journal of Neuroscience, 11, 641–649.
Zihl, J. D., Von Cramon, D., Mai, N., & Schmid, C. H. (1991). Disturbanceof movement vision after bilateral posterior brain damage. Brain, 114,2235–2252.
Zipf, G. K. (1932). Selected studies of the principle of relative frequency inlanguage. Cambridge, MA: Harvard University Press.
198 CREE AND MCRAE
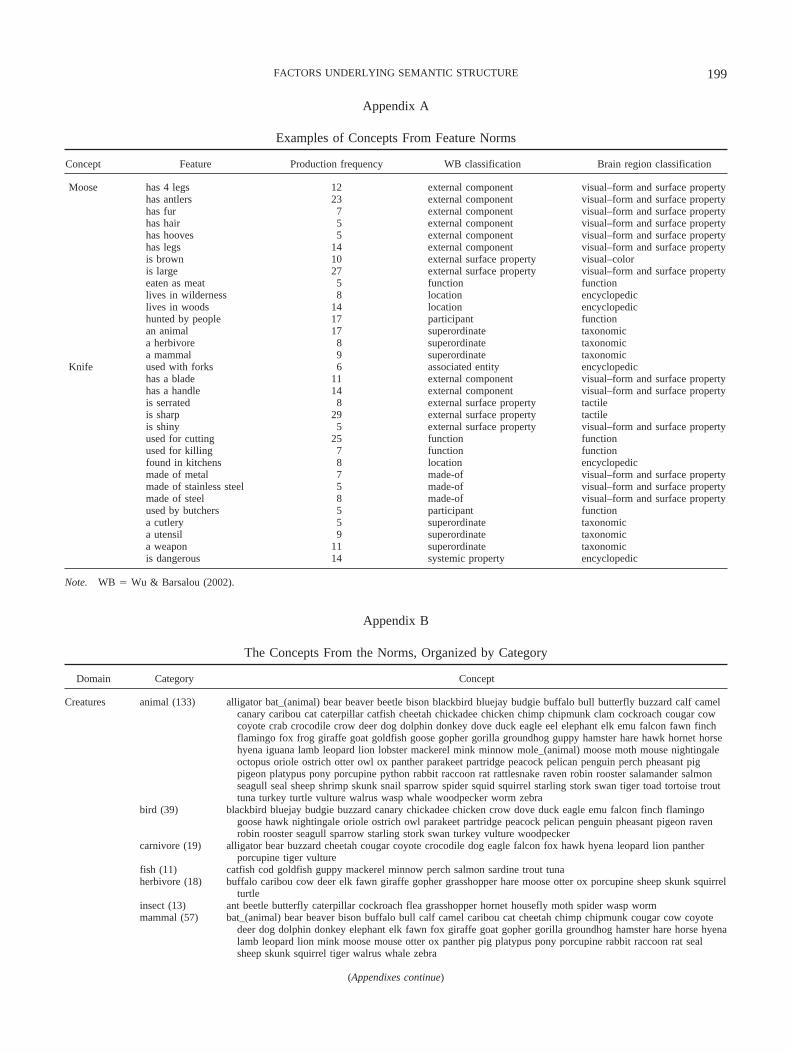
Appendix A
Examples of Concepts From Feature Norms
Concept Feature Production frequency WB classification Brain region classification
Moose has 4 legs 12 external component visual–form and surface propertyhas antlers 23 external component visual–form and surface propertyhas fur 7 external component visual–form and surface propertyhas hair 5 external component visual–form and surface propertyhas hooves 5 external component visual–form and surface propertyhas legs 14 external component visual–form and surface propertyis brown 10 external surface property visual–coloris large 27 external surface property visual–form and surface propertyeaten as meat 5 function functionlives in wilderness 8 location encyclopediclives in woods 14 location encyclopedichunted by people 17 participant functionan animal 17 superordinate taxonomica herbivore 8 superordinate taxonomica mammal 9 superordinate taxonomic
Knife used with forks 6 associated entity encyclopedichas a blade 11 external component visual–form and surface propertyhas a handle 14 external component visual–form and surface propertyis serrated 8 external surface property tactileis sharp 29 external surface property tactileis shiny 5 external surface property visual–form and surface propertyused for cutting 25 function functionused for killing 7 function functionfound in kitchens 8 location encyclopedicmade of metal 7 made-of visual–form and surface propertymade of stainless steel 5 made-of visual–form and surface propertymade of steel 8 made-of visual–form and surface propertyused by butchers 5 participant functiona cutlery 5 superordinate taxonomica utensil 9 superordinate taxonomica weapon 11 superordinate taxonomicis dangerous 14 systemic property encyclopedic
Note. WB � Wu & Barsalou (2002).
Appendix B
The Concepts From the Norms, Organized by Category
Domain Category Concept
Creatures animal (133) alligator bat_(animal) bear beaver beetle bison blackbird bluejay budgie buffalo bull butterfly buzzard calf camelcanary caribou cat caterpillar catfish cheetah chickadee chicken chimp chipmunk clam cockroach cougar cowcoyote crab crocodile crow deer dog dolphin donkey dove duck eagle eel elephant elk emu falcon fawn finchflamingo fox frog giraffe goat goldfish goose gopher gorilla groundhog guppy hamster hare hawk hornet horsehyena iguana lamb leopard lion lobster mackerel mink minnow mole_(animal) moose moth mouse nightingaleoctopus oriole ostrich otter owl ox panther parakeet partridge peacock pelican penguin perch pheasant pigpigeon platypus pony porcupine python rabbit raccoon rat rattlesnake raven robin rooster salamander salmonseagull seal sheep shrimp skunk snail sparrow spider squid squirrel starling stork swan tiger toad tortoise trouttuna turkey turtle vulture walrus wasp whale woodpecker worm zebra
bird (39) blackbird bluejay budgie buzzard canary chickadee chicken crow dove duck eagle emu falcon finch flamingogoose hawk nightingale oriole ostrich owl parakeet partridge peacock pelican penguin pheasant pigeon ravenrobin rooster seagull sparrow starling stork swan turkey vulture woodpecker
carnivore (19) alligator bear buzzard cheetah cougar coyote crocodile dog eagle falcon fox hawk hyena leopard lion pantherporcupine tiger vulture
fish (11) catfish cod goldfish guppy mackerel minnow perch salmon sardine trout tunaherbivore (18) buffalo caribou cow deer elk fawn giraffe gopher grasshopper hare moose otter ox porcupine sheep skunk squirrel
turtleinsect (13) ant beetle butterfly caterpillar cockroach flea grasshopper hornet housefly moth spider wasp wormmammal (57) bat_(animal) bear beaver bison buffalo bull calf camel caribou cat cheetah chimp chipmunk cougar cow coyote
deer dog dolphin donkey elephant elk fawn fox giraffe goat gopher gorilla groundhog hamster hare horse hyenalamb leopard lion mink moose mouse otter ox panther pig platypus pony porcupine rabbit raccoon rat sealsheep skunk squirrel tiger walrus whale zebra
(Appendixes continue)
199FACTORS UNDERLYING SEMANTIC STRUCTURE

Appendix B (continued)
Domain Category Concept
Creatures(continued)
pet (22) bat_(animal) budgie canary cat chickadee dog finch goldfish guppy hamster hare iguana mink mouse parakeetpigeon pony python rabbit rat salamander turtle
predator (17) alligator cat cheetah cougar coyote eagle falcon fox hawk hyena leopard lion mink owl panther tiger vulturereptile (10) alligator crocodile eel iguana python rattlesnake salamander toad tortoise turtlerodent (10) chipmunk gopher groundhog hamster mole_(animal) mouse rabbit raccoon rat squirrelscavenger (8) buzzard crow hawk hyena raccoon rat raven vulture
Nonlivingthings
appliance (14) blender dishwasher drill fan_(appliance) freezer fridge kettle microwave mixer oven radio stove telephone toaster
automobile (9) ambulance car dunebuggy jeep limousine taxi trolley truck vanbuilding (7) barn cathedral chapel church inn shed skyscraperclothing (39) apron belt blouse boots bra camisole cap_(hat) cape cloak coat dress earmuffs gloves gown hose_(leggings) jacket
jeans leotards mink_(coat) mittens nightgown nylons pajamas pants parka robe scarf shawl shirt shoes skirtslippers socks sweater swimsuit tie trousers veil vest
container (14) ashtray bag barrel basket bin_(waste) bottle box bucket freezer jar mug pot sack urnfashion
accessory (9)belt bracelet buckle gloves necklace scarf shawl tie vest
furniture (15) bed bench bookcase bureau cabinet chair couch desk dresser lamp rocker shelves sofa stool_(furniture) tablegun (7) bayonet bazooka cannon pistol revolver rifle shotgunhouse (8) apartment building bungalow cabin cottage hut shack shellmachine (9) blender catapult crane_(machine) helicopter mouse_(computer) projector tank_(army) tractor typewritershelter (10) apartment barn building bungalow cabin cottage house shack shed tenttool (34) axe bolts broom brush chain chisel clamp comb corkscrew crowbar drill fork hammer hatchet hoe ladle level
microscope paintbrush pencil pliers rake sandpaper scissors screwdriver screws shovel sledgehammer spadespear stick tomahawk wheelbarrow wrench
utensil (22) bowl broom colander corkscrew cup dish fork grater hatchet knife ladle mixer mug paintbrush pan pen pencil potspatula spoon strainer tongs
vehicle (27) airplane ambulance bike boat bus canoe car cart dunebuggy helicopter jeep motorcycle sailboat scooter shipskateboard submarine tank_(army) tractor trailer train tricycle trolley truck van wagon yacht
weapon (39) armor axe baton bat_(baseball) bayonet bazooka belt bomb bow_(weapon) cannon catapult crossbow crowbardagger grenade gun hammer harpoon hatchet hoe knife machete missile pistol revolver rifle rock rocket shieldshotgun shovel sledgehammer slingshot spear stick stone sword tomahawk whip
miscellaneous(110)
anchor ball balloon banner basement bathtub bedroom beehive board_(black) board_(wood) book bouquetbow_(ribbon) brick bridge buggy bullet cage candle cap_(bottle) card_(greeting) carpet cellar certificatechandelier cigar cigarette clock closet coin cork crayon crown cupboard curtains cushion doll door doorknobdrain drapes elevator emerald envelope escalator faucet fence football garage gate helmet hook hose jet keykite lantern magazine marble mat medal menu mirror muzzle napkin pearl peg pier pillow pin pipe_(plumbing)pipe_(smoking) plate plug_(electric) pyramid racquet raft rattle razor ring_(jewelry) rope ruler saddle sandalssaucer sink skillet skis sled sleigh stereo subway surfboard tack tank_(container) tap tape_(scotch) thermometerthimble toilet toy tray tripod umbrella unicycle wall walnut wand wheel whistle
Fruits/vegetables
fruit (29) apple avocado banana blueberry cantaloupe cherry coconut cranberry grape grapefruit honeydew lemon limemandarin nectarine olive orange peach pear pineapple plum prune pumpkin raisin raspberry rhubarb strawberrytangerine tomato
plant (18) asparagus beans beets celery corn cucumber dandelion eggplant honeydew oak onions parsley pineapple rhubarbseaweed tomato vine willow
root/tuber (7) beets carrot garlic potato radish turnip yamvegetable (31) asparagus avocado beans beets broccoli cabbage carrot cauliflower celery corn cucumber eggplant garlic lettuce
mushroom olive onions parsley peas pepper pickle potato pumpkin radish rhubarb rice spinach tomato turnipyam zucchini
Salientexceptions
food (6) biscuit bread cake cheese pickle pie
musicalinstruments(18)
accordion bagpipe banjo cello clarinet drum flute guitar harmonica harp harpsichord keyboard_(musical) pianosaxophone trombone trumpet tuba violin
Note. Numbers in parentheses after category names are the number of concepts included as exemplars of that category. Words in parentheses afterconcepts are qualifiers used to disambiguate the concepts they are joined to by an underscore.
200 CREE AND MCRAE

Received August 22, 2002Revision received December 2, 2002
Accepted December 4, 2002 �
Appendix C
Example of Each Wu and Barsalou (2002) Feature Type Listed for the 541 Concepts
Class Feature type N Example
Entity associated abstract entity 19 harp �associated with angels�entity behavior 525 clock �ticks�external component 1,084 tricycle �has pedals�external surface property 1,179 apple �is red�internal component 192 cherry �has a pit�internal surface property 178 fridge �is cold�larger whole 15 ant �lives in a colony�made-of 476 sink �made of enamel�quantity 14 slippers �come in pairs�systemic feature 298 dolphin �is intelligent�
Situation action/manner 186 screws �used by turning�associated entity 158 saucer �used with tea cups�function 1,145 tomato �eaten�location 466 cupboard �found in kitchens�origin 64 walnut �grows on trees�participant 187 wand �used by magicians�time 85 turkey �eaten at Thanksgiving�
Taxonomic coordinate 52 coyote �dog�individual 3 deer �Bambi�subordinate 45 lettuce �romaine�superordinate 601 deer �a mammal�synonym 29 calf �baby cow�
Introspective affect emotion 11 wasp �is annoying�cognitive operation 30 magazine �like a book�contingency 93 garlic �causes bad breath�evaluation 105 gown �is fancy�negation 19 ostrich �cannot fly�
Total 7,259
201FACTORS UNDERLYING SEMANTIC STRUCTURE