Embed Size (px)
Citation preview
SMA SOLAR TECHNOLOGY AGAnalyst / Investor PresentationHalf-Yearly Financial Results: January to June 2017Pierre-Pascal Urbon, CEOUlrich Hadding, CFOAugust 10, 2017

Disclaimer
IMPORTANT LEGAL NOTICEThis presentation does not constitute or form part of, and should not be construed as, an offer or invitation to subscribe for, underwrite or otherwise acquire, any securities of SMA Solar Technology AG (the "Company") or any present or future subsidiary of the Company (together with the Company, the "SMA Group") nor should it or any part of it form the basis of, or be relied upon in connection with, any contract to purchase or subscribe for any securities in the Company or any member of the SMA Group or commitment whatsoever.All information contained herein has been carefully prepared. Nevertheless, we do not guarantee its accuracy or completeness and nothing herein shall be construed to be a representation of such guarantee. The information contained in this presentation is subject to amendment, revision and updating. Certain statements contained in thispresentation may be statements of future expectations and other forward-looking statements that are based on the management's current views and assumptions and involve known and unknown risks and uncertainties. Actual results, performance or events may differ materially from those in such statements as a result of, among others, factors, changing business or other market conditions and the prospects for growth anticipated by the management of the Company. These and other factors could adversely affect the outcome and financial effects of the plans and events described herein. The Company does not undertake any obligation to update or revise any forward-looking statements, whether as a result of new information, future events or otherwise. You should not place undue reliance on forward-looking statements which speak only as of the date of this presentation.This presentation is for information purposes only and may not be further distributed or passed on to any party which is not the addressee of this presentation. No part of this presentation must be copied, reproduced or cited by the addressees hereof other than for the purposefor which it has been provided to the addressee.This document is not an offer of securities for sale in the United States of America. Securities may not be offered or sold in the United States of America absent registration or an exemption from registration under the U.S. Securities Act of 1933 as amended.
2

SMA’s Managing Board Raised Guidance for 2017 due to High Order Intake and Improved Market Outlook
3
Top-Line
Outlook
Profitability/ Bankability
> In H1/17, SMA generated sales of €381m (H1/16: 482m) with an sales increase of 20% in Q2/17 compared to the previous quarter.
> Sales decline in all key segments year-over-year (Residential -12%, Commercial -3%, Utility -47%); Strong Sales in Service and Other Business (+15% and +52% Y/Y).
> Strong sales in APAC in all segments (+57% Y/Y); Sales decline in Americas after record year 2016 (-60% Y/Y), EMEA is stable.
> Slow sales impacted gross margin (H1/2017: 19%; H1/2016: 25%).> Accordingly, EBITDA declined to €29m (H1/2016: €71m).> Depreciation/amortization of €27m in H1/2017 (H1/2016: €33m).> Net income of €9m (H1/2016: €19m).> Free cash flow (adj.) remains high (H1/2017: €26m; H1/2016: €44m).> Rock solid balance sheet structure with 50% equity ratio, > €400m net cash and €100m long-term
credit facility.> Market Outlook adjusted until 20191mainly due to higher demand in China: In 2017, Global new
PV installation expected to reach 84 GW, thereof 36 GW in China (previously: 71 GW and 24GW); Global inverter revenues expected to increase to €5.1bn, thereof €1.1bn in China (previously: €4.9bn and €0.6bn) with strong growth in the storage segment.
> Section 201 trade case is already starting to have an impact on U.S. market.> Management raised guidance with sales of €900m to €950m and EBITDA of €85m to €100m.2> Market launch of new products on track; SMA slightly increased selling prices in selected markets.
SMA’s management expects the second half year to be stronger than the first six months 2017.1. 2018: 92 GW and €5.8bn (previously: 65GW and €4.9bn); 2019: 100 GW and €6.2bn (previously 68GW and €4.9bn)2. Previously: Sales €830m to €900m; EBITDA €70m to €90m

SMA Increased its Order Backlog to €673m,Thereof €280m for Products
4
1.H1/2017 w/o the book gain from the sale of the Railway Technology business division: Impairment on working capital (neg.); thereof in COGS (€-4m)2.NWC= inventory+trade receivables-trade payables (no advanced payments included); as of last twelve months’ sales3. Including the book gain from the sale of the Railway Technology business division
H1/16 H1/17
MW sold 3,876 3,830 -1%Sales 482 381 -21%Residential 107 94 -13%Commercial 128 123 -3%Utility 205 108 -47%Service 25 28 15%Other Business 18 28 52%
Gross margin 25% 19%EBITDA 71 29 -59%EBIT 39 3 -93%
Thereof One-Offs1 -2 -5Free cash flow (adj.) 44 26 -41%Depreciation/Amortization 33 27 -20%Capex (incl. R&D) 12 15 28%
2016/12/31 2017/06/30
Net cash 362 402 11%Total assets 1,211 1,190 -2%NWC ratio2 24% 24%
2016 2017Q3 Q4 Q1 Q2
Sales 227 238 173 208Residential 43 33 37 57Commercial 71 68 57 66Utility 84 108 49 59Service 14 6 15 13Other Business 15 23 15 13
Gross margin 27% 27% 19% 20%EBITDA 37 34 163 13One-Offs1 -9 -20 -1 -4
Key Financials (in € million) Key Financials (in € million)

MARKET OUTLOOK ADJUSTED UNTIL 2019: MAINLY DUE TO HIGHER DEMAND IN CHINA
GLOBAL PV INVERTER REVENUE GROWTH EXPECTED UNTIL 2019
SYSTEM TECHNOLOGY FOR STORAGE WILL BE THE MAIN GROWTH DRIVER IN THE FUTURE
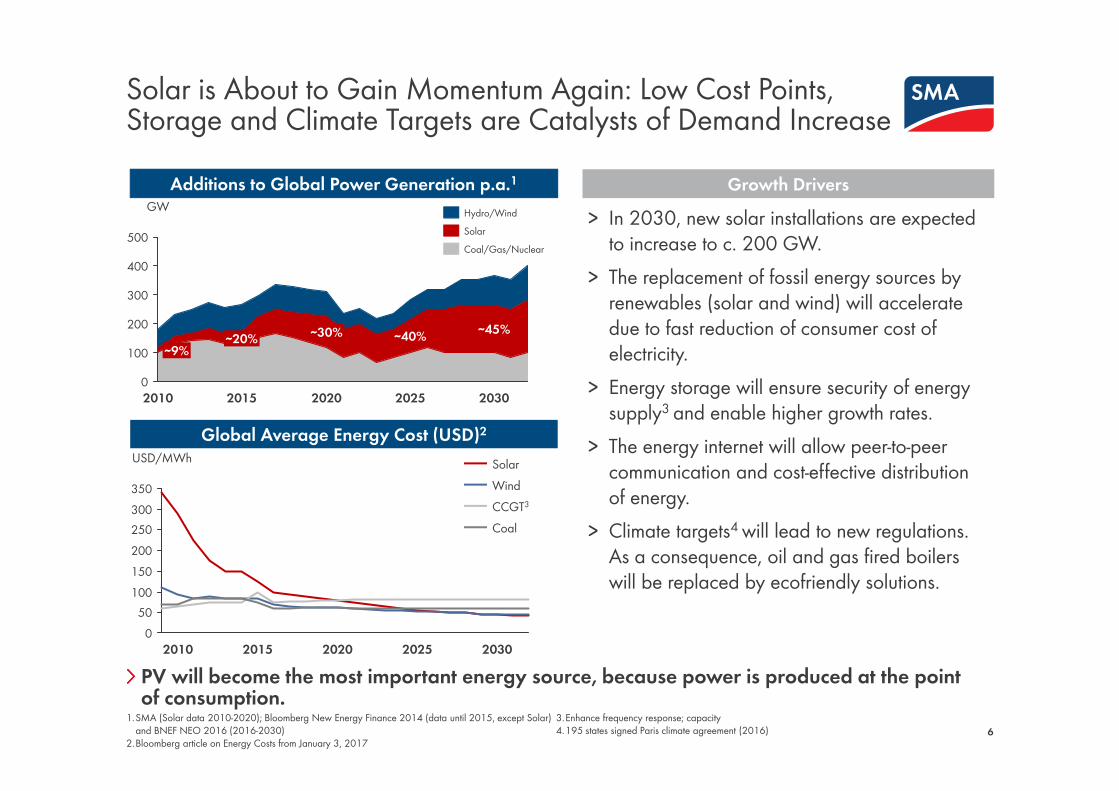
Solar is About to Gain Momentum Again: Low Cost Points, Storage and Climate Targets are Catalysts of Demand Increase
6
PV will become the most important energy source, because power is produced at the point of consumption.
> In 2030, new solar installations are expected to increase to c. 200 GW.
> The replacement of fossil energy sources by renewables (solar and wind) will accelerate due to fast reduction of consumer cost of electricity.
> Energy storage will ensure security of energy supply3 and enable higher growth rates.
> The energy internet will allow peer-to-peer communication and cost-effective distribution of energy.
> Climate targets4 will lead to new regulations. As a consequence, oil and gas fired boilers will be replaced by ecofriendly solutions.
Growth Drivers
0
100
200
300
400
500
GW
2030
∼45%
2025
∼40%
2020
∼30%
2015
∼20%
2010
∼9%
Coal/Gas/NuclearSolarHydro/Wind
050
100150200250300350
USD/MWh
2020 2025 203020152010
CCGT3
Coal
SolarWind
Global Average Energy Cost (USD)2
Additions to Global Power Generation p.a.1
1.SMA (Solar data 2010-2020); Bloomberg New Energy Finance 2014 (data until 2015, except Solar) and BNEF NEO 2016 (2016-2030)
2.Bloomberg article on Energy Costs from January 3, 2017
3.Enhance frequency response; capacity 4.195 states signed Paris climate agreement (2016)

SMA Increased its Global Market Outlook for the Coming Years – a 100-GW-Market is Already in Sight
7
SMA supports free trade. Import tariffs will limit the growth of PV and thus local employment.
> Demand in China much stronger than initially expected (+63 GW until 2019) due to the change of 5-year-plan.1
> Strong volume growth (+13% p.a.) in international markets (excl. CN) expected until 2019.
> Section 201 trade case in front of U.S. International Trade Commission is already starting to have an impact on U.S market.5
> Retrofit market is about to gain momentum in coming years.
CommentsGlobal New PV Installation(GWdc)3,4
Regions
15(29%)
2016
78
10 (13%)
17(22%)
16(21%)
34(44%)
2015
52
10 (20%)10 (19%)
16(32%)
2017
37(41%)
23(25%)
37(37%)
17(19%)
14(15%)
92
36(43%)
11 (13%)
84
16(19%)
21(25%)
+8% p.a.
EMEAAmericas
APAC2China1 25
(25%)
2019
18(18%)
100
20(20%)
2018Segments
UtilityCommercialResidential
34(65%)
2015
12 (23%)6 (12%)
52
78
58(74%)
14 (18%)7 (9%)
2019
100
14 (14%)
24(24%)
62(62%)
2018
92
11 (12%)
24(26%)
57(62%)
2017
84
10 (12%)
20(23%)
54(65%)
2016
1.China (NEA) revised guidance for solar installations in 13th Five-Year-Plan on July 19th 20172.w/o China3.SMA MI Market Model Q3 2017; Res ≤10kW plants, Com >10kW to 1MW plants, Uti >1MW plants
4. Incl. ∼1 GW Off-Grid installations p.a.: residential, remote and micro-grid applications 5. ITC report to President (November 13, 2017); Presidential action latest on January 12, 2018
43 48

The Strong Growth of Energy Storage Applications will Lead to Global Revenue Growth
8
It’s not only about energy production anymore. Customers ask for compliant technology that allows energy cost savings.
> So far, demand for storage applications is impacted by limited battery production capacity.
> Price pressure in utility remains high in all regions due to low PPA prices and tender processes.
> Price decline for commercial applications is driven by new technologies. Automated load management will become value driver.
> Prices for residential application depend on functionality of the inverter. MLPE becomes value driver.
CommentsAdditional Global Inverter Revenues (€bn)3,4,5
Regions
Segments
+7% p.a.
EMEAAmericas
APAC2
China1
2019
6.2
2.0(32%)
1.4(22%)
1.8(29%)
1.1(18%)
2018
5.8
1.6(28%)
1.3(23%)
1.7(30%)
1.1(19%)
2017
5.1
1.2(24%)
1.2(24%)
1.6(31%)
1.1(21%)
2016
5.1
1.0(20%)
1.5(29%)
1.6(32%)
0.9(18%)
2015
4.7
1.1(24%)
1.1(23%)
1.9(41%)
0.6(12%)
Commercial
UtilityStorage
2019
5.5-6.2
1.6(27%)
1.1(18%)
1.8(29%)
0.9-1.7(27%)
2018
5.2-5.8
1.5(26%)
1.1(20%)
1.7(30%)
0.8-1.4(24%)
2017
4.9-5.1
1.5(29%)
1.1(22%)
Residential
1.7(34%)
0.6-0.8(15%)
2016
5.1
1.2(24%)
1.1(22%)
2.3(45%)
0.5(9%)
2015
4.7
1.3(27%)
1.2(26%)
1.9(39%)
0.4(8%)
1.China (NEA) revised guidance for solar installations in 13th Five-Year-Plan on July 19th 20172.w/o China3.SMA MI Market Model Q3 2017; Res ≤10kW plants, Com >10kW to 1MW plants, Uti >1MW plants
4. Incl. ∼1 GW Off-Grid installations p.a.: residential, remote and micro-grid applications5. Incl. inverter potential for retrofit

SMA OFFERS A COMPLETE PORTFOLIO FOR ALL TRADITIONAL PV-APPLICATIONS AND ALL REGIONS
SMA IS BEST POSITIONED TO BENEFIT FROM GROWTH IN THE STORAGE MARKET
SMA HAS THE SERVICE INFRASTRUCTURE TO SECURE GRID STABILITY AND SAFETY
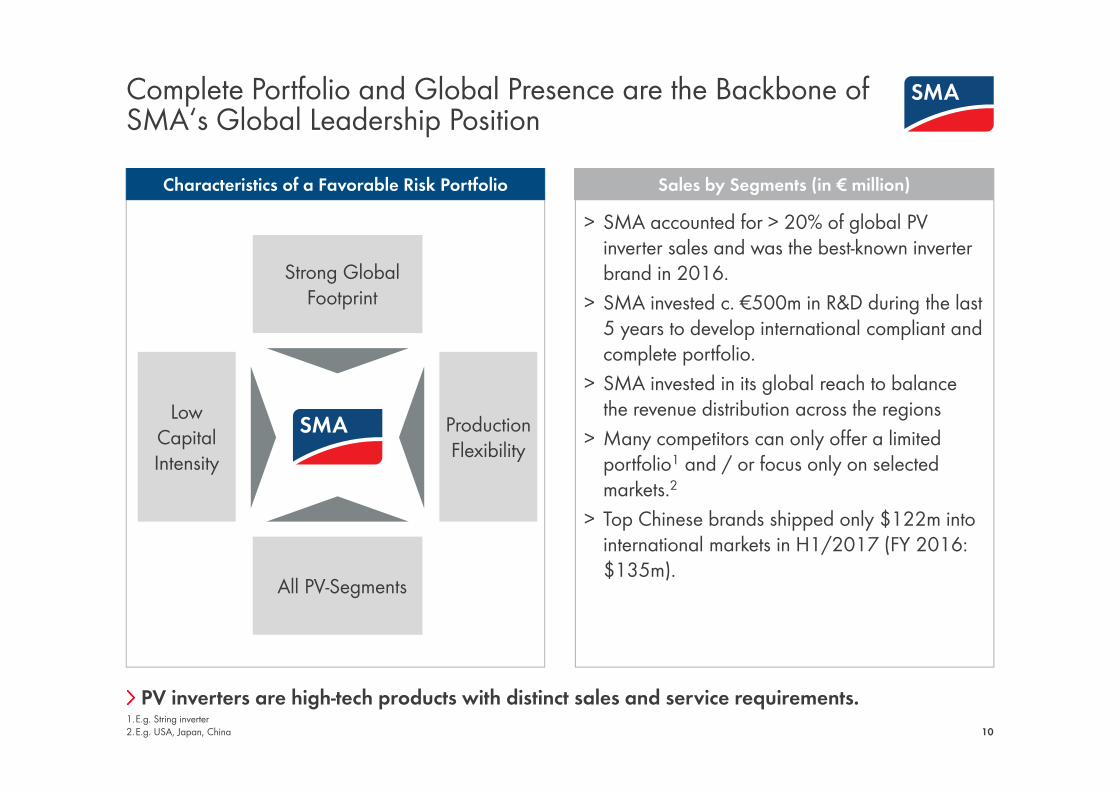
Complete Portfolio and Global Presence are the Backbone of SMA‘s Global Leadership Position
101.E.g. String inverter2.E.g. USA, Japan, China
PV inverters are high-tech products with distinct sales and service requirements.
Strong Global Footprint
All PV-Segments
Production Flexibility
Low Capital Intensity
Sales by Segments (in € million)> SMA accounted for > 20% of global PV
inverter sales and was the best-known inverter brand in 2016.
> SMA invested c. €500m in R&D during the last 5 years to develop international compliant and complete portfolio.
> SMA invested in its global reach to balance the revenue distribution across the regions
> Many competitors can only offer a limited portfolio1 and / or focus only on selected markets.2
> Top Chinese brands shipped only $122m into international markets in H1/2017 (FY 2016: $135m).
Characteristics of a Favorable Risk Portfolio

PV Know-how: SMA is an Engine of Innovation with Unmatched Competencies in the PV Industry
11
Technology is protected by >960 patents and utility models, c. 600 ongoing application procedures and >850 trademarks.
SMA’s Test Center is a Competitive Advantage> Computer–based simulations for various PV
generators and country-specific grid conditions.
> Electromagnetic measurements and optimization certified by UL.
> Lifecycle test; all ambient conditions worldwide can be replicated.
490 Employees in R&D Develop Tomorrow’s Products
• Portal• Data mining• Algorithms for PV
specific problems
• Safety & protection technology
• Comprehensive test equipment
• Power supplies• PV system
technology• Medium- and
high voltage
• Grid system and simulation
• Grid management
• O&M• Energy Monitoring• Energy & Power
Management
• Good R&D network• Practical knowledge
solar generator • Model-driven
development
• Market leadingsystem technology
• All battery technologies
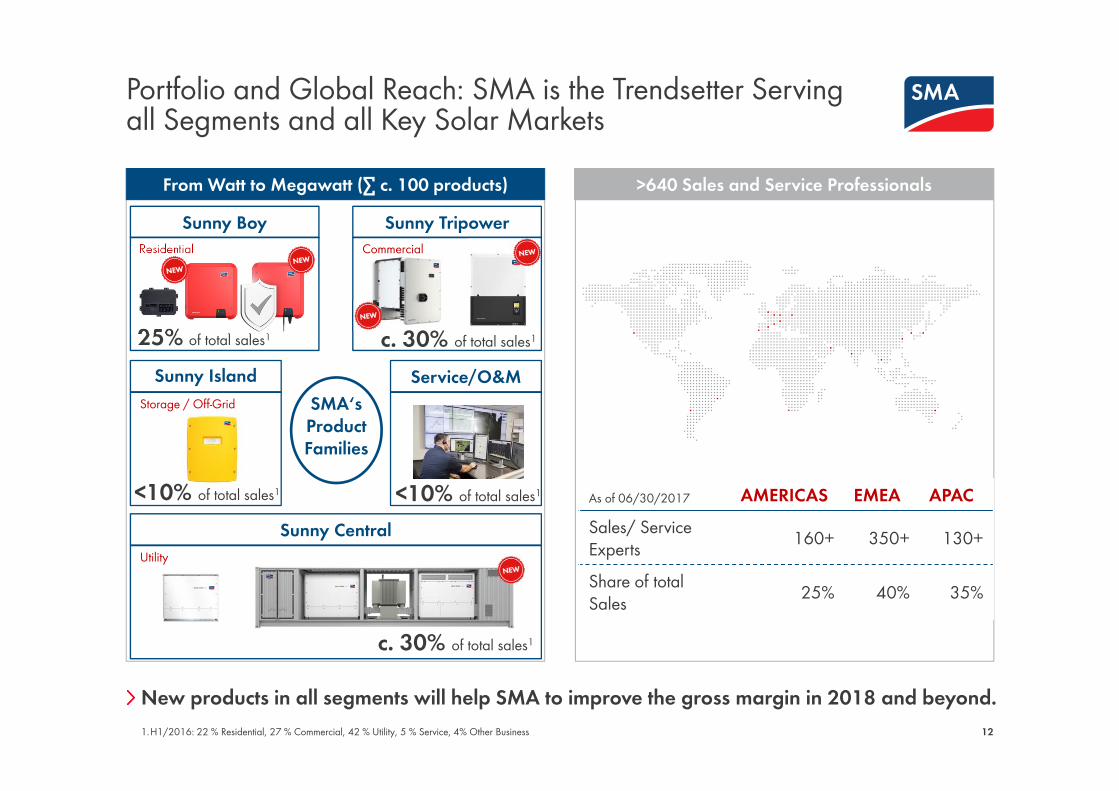
Portfolio and Global Reach: SMA is the Trendsetter Serving all Segments and all Key Solar Markets
12
New products in all segments will help SMA to improve the gross margin in 2018 and beyond.
>640 Sales and Service ProfessionalsFrom Watt to Megawatt (∑ c. 100 products)
1.H1/2016: 22 % Residential, 27 % Commercial, 42 % Utility, 5 % Service, 4% Other Business
As of 06/30/2017 AMERICAS EMEA APACSales/ Service Experts 160+ 350+ 130+
Share of total Sales 25% 40% 35%
Residential
c. 30% of total sales1
Sunny BoyCommercial
Sunny Tripower
Storage / Off-GridSunny Island Service/O&M
UtilitySunny Central
SMA‘s Product Families
c. 30% of total sales1
<10% of total sales1
25% of total sales1
<10% of total sales1

SMA GENERATED SALES OF €381M
EQUITY RATIO OF 50% AND NET CASH INCREASED TO MORE THAN €400M
BACKLOG OF €673M; POSITIVE BOOK-TO-BILL RATIO SINCE JANUARY 2017
SMA’S MANAGING BOARD RAISED GUIDANCE FOR 2017

Sales Growth of >50% in APAC could not fully Compensate Weaker Demand in North America after a Record Year 2016
14
The most important markets in H1/2017 were the U.S., followed by Germany, India, Australia and Japan.
Sales by Segments (in € million)
18
25
28
28
94
OtherBusiness
Service
Utility108
205
Commercial123128
Residential 107
-21%
APAC
EMEA
Americas
H1/2017
381
35%
40%
H1/2016
482
18%
33%
49%
2016
947
24%
30%
46%
GW 8.2
Group Sales (in € million)
25%
H1/2017H1/2016
3.9 3.8

Reduced Sales Volume Impacted Gross Margin, EBITDA also Affected by One-Offs
151.H1/2017 (w/o the book gain from the sale of the Railway Technology business division): Impairment on working capital (neg.); thereof in COGS (€-4m)
Utility not profitable due to heavy decline of the U.S. market; will regain momentum in H2 and especially 2018.
EBIT-margin by Segments
29
71
142
EBITDA
2016 H1/2016
-59%
H1/2017
Depreciation/Amortization
One-Offs1
EBITDA (in € million)
-31
-77
-2
-33 -27
Residential
-2%16%
0%Commercial 5%
-1%-6%
OtherBusiness
Utility
3%-6%
Service19%
10%
H1/2016H1/2017
-5

With an Equity Ratio of 50% and Net Cash of More Than €400m SMA is Well Prepared for the Future
161.NWC= inventory+trade receivables-trade payables (no advanced payments included); As of last twelve months sales2.Not interest-bearing3.w/o not-interest-bearing derivatives: €1m (H1/2016: €18m)
The net working capital ratio was in the guidance range of 22% to 25% of sales.
Group Balance Sheet, reclassified (in € million)Net Working Capital (in € million)
-109 -110
98 107
59
165 130
58
June 30, 2017
203
17
Dec. 31, 2016
13
225
Raw materials and consumables
Trade payablesTrade receivables
Unfinished goodsFinished goods
NWC ratio1 24% 24% 2016/12/31 2017/06/30 Non-current assets 426 391 -8%Working capital 334 313 -6%Other assets 66 63 -5%Total cash 385 423 10%
Shareholders’ equity 585 592 1%Provisions2 177 160 -10%Trade payables 109 110 1%Financial liabilities3 23 22 -4%Other liabilities2 317 306 -3%Total 1,211 1,190 -2%

H1/2016 H1/2017
Net Income 19 9 -53%Gross Cash Flow 60 22 -63%Cash Flow from Operating Activities 55 39 -29%
Net Capex1 -11 -13 18%Free Cash Flow (Adj.) 44 26 -41%
Net Investments from Securities and Other Financial Assets 1 -50 n.m.Cash inflow from divestments 0 17 n.m.Acquisition -19 0 n.m.
Free Cash Flow (IFRS) 26 -7 n.m.
SMA‘s Business is not Capital Intense; Therefore, SMA Offers an Attractive Cash Flow Profile
171.Thereof R&D capitalization H1/2017: €8m (H1/2016: €7m)
Cash Flow (in € million)
Our non-capital intense business model allows us to generate positive Free Cash Flows even in months with low sales volumes.

SMA’s Order Backlog Remains Strong; Order Backlog for Products Increased by >90% since Beginning of the Year
181.As of June 30, 20172.Order backlog in Service will be recognized over a period of 5 to10 years
Strong book-to-bill ratio of 1.4 in H1/2017 and high incoming orders in July 2017 back up Management’s expectation that H2/2017 will see higher sales volumes.
Order Backlog by Segments (in €m)1 Order Backlog by Regions (in %)1
69
41
16115%
64%
21%
EMEAAmericas
APAC
∑ 673
58
9557
393
70
UtilityCommercialResidentialService2
Other Business

Managing Board Raised Guidance for 2017
19
With cost-optimized products and the development of its solution business, SMA expects to increase profitability from 2018 onwards.
Comments on Guidance 2017
Depreciation/Amortization77 60-70
20162017
Guidance 2017 (in € million)
Sales EBITDA
142 85-100
900-950947
GW8.2 > 9
> SMA expects sales of €900m to €950m in fiscal year 2017 (previously: €830m to €900m).
> EBITDA is expected to reach €85m to €100m (previously: €70m to €90m).
> Net working capital ratio will be between 22% and 25% of sales.
> SMA plans to invest about €50m (incl. capitalized R&D).
> Net Cash will rise to more than €450m (previously: €400m).
> It is SMA‘s policy to distribute 20% to 40% of the group net income to shareholders.

Investment Highlights: Attractive Investment Opportunity
20
Direct exposure to the global solar market
SMA has been the #1 for solar inverters for more than 2 decades
Proven technology and new solutions for the energy Internet
Flexible business model and best-cost sourcing strategy
Powerful sales and service infrastructure
Bankable partner due to high equity ratio, net cash position and credit facility
Stable shareholder structure with Danfoss as strategic anchor investor
Experienced management team with proven track record

SMA Solar Technology AG
BACK UP

22
Investor Relations Contacts and Financial Calendar
Financial Calendar:August 10, 2017 Publication of the Half-Yearly Financial Report: January to June 2017
Analyst Conference Call: 09:00 a.m. (CET)September 22, 2017 Macquarie 10th Alternative Energy Conference, LondonNovember 9, 2017 Publication of the Quarterly Financial Results: January to September 2017
Analyst Conference Call: 09:00 a.m. (CET)January 26, 2018 Capital Markets Day, KasselMarch 29, 2018 Publication of the SMA Group 2017 Annual Report
Analyst Conference Call: 09:00 a.m. (CET)May 24, 2018 Annual General Meeting 2018
Appendix
Visit our IR website http://www.ir.sma.de
Investor Relations Contact:Pierre-Pascal Urbon, CEOStephanie Peschinger, Investor RelationsE-Mail: [email protected]

SOCIAL MEDIAwww.SMA.de/Newsroom


![Investor Presentation - Analyst / Institutional Investor Meeting [Company Update]](https://img.dokumen.tips/doc/110x75/577c98301a28ab163a8b4855/investor-presentation-analyst-institutional-investor-meeting-company-update.jpg)