Embed Size (px)
Citation preview

Investor/Analyst DayInvestor/Analyst Day
June 7, 2002

Larry KurtzLarry KurtzVice President, Investor RelationsVice President, Investor Relations
3
Safe Harbor Clause: Some of the information in this presentation may constitute forward-looking statements which are subject to various uncertainties which could cause actual results to differ materially from those projected or implied. These uncertainties are described in the Company’s reports and exhibits filed with the Securities and Exchange Commission. Please refer to the statement contained in the disclaimer on the Company’s home page, www.mckesson.com, for additional information and details.
DisclaimerDisclaimer

4
AgendaAgendann Company and Strategy Overview Company and Strategy Overview
nn Financial ReviewFinancial Review
nn McKesson Supply Management OverviewMcKesson Supply Management Overview
nn MedicalMedical--Surgical Distribution Surgical Distribution
nn Pharmaceutical DistributionPharmaceutical Distribution
nn AutomationAutomation
nn Information SolutionsInformation Solutions
nn Summary and Q&ASummary and Q&A
John H. HammergrenJohn H. HammergrenPresident and CEOPresident and CEO

6
Healthcare Market DriversHealthcare Market Drivers
nn Aging population drives consumption of drugs, suppliesAging population drives consumption of drugs, supplies
nn Influx of new drugs drives specialty servicesInflux of new drugs drives specialty services
nn Cost and consumer pressures drive need for qualityCost and consumer pressures drive need for quality
nn Focus on quality drives adoption of new clinical softwareFocus on quality drives adoption of new clinical software
nn Clinician shortage drives automation, information Clinician shortage drives automation, information
technology and outsourcingtechnology and outsourcing
nn Med error crisis drives automation/information solutionsMed error crisis drives automation/information solutions
nn HIPAA drives systems standardization and connectivityHIPAA drives systems standardization and connectivity
7
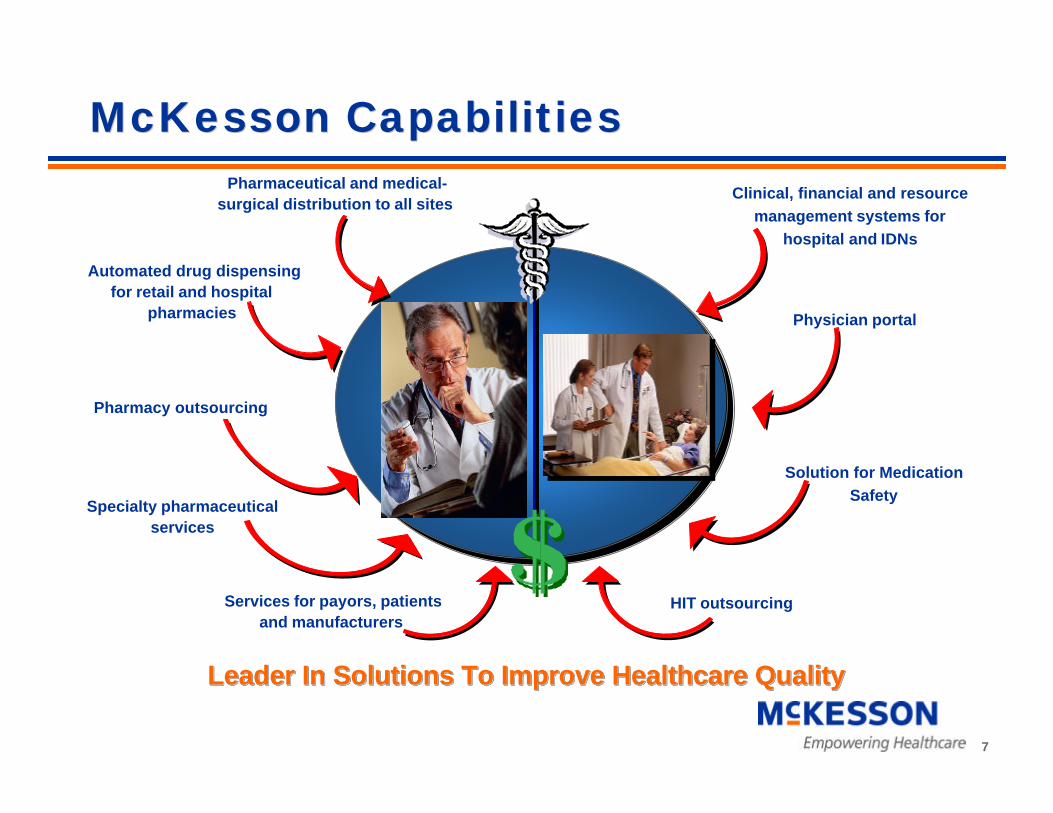
McKesson CapabilitiesMcKesson Capabilities
Leader In Solutions To Improve Healthcare QualityLeader In Solutions To Improve Healthcare QualityLeader In Solutions To Improve Healthcare Quality
Services for payors, patientsand manufacturers
HIT outsourcing
Pharmaceutical and medical-surgical distribution to all sites
Automated drug dispensing for retail and hospital
pharmacies
Pharmacy outsourcing
Specialty pharmaceuticalservices
Clinical, financial and resource management systems for
hospital and IDNs
Physician portal
Solution for Medication Safety

8

9
Business ScorecardBusiness Scorecard
Customer Success Workforce Success
Financial Success
Business Process Success
Strategy / ValueProposition
MetricMetric--Driven Driven ExecutionExecution

10
McKesson Financial PerformanceMcKesson Financial Performance
Five Quarters of Earnings MomentumFive Quarters of Earnings Momentum
FY01*FY01*
Operating Profit YOperating Profit Y--OO--YY
Q4Q4FY02*FY02*
Q1Q1 Q2Q2
**All results exclude warehouse sales and special items and includAll results exclude warehouse sales and special items and include impact of FAS 142e impact of FAS 142
17%17%
33%33%
41%41%
16%16%
34%34%
41%41%
19%19%
38%38%
45%45%
Revenue YRevenue Y--OO--YY
EPS YEPS Y--OO--YY
Q3Q3
20%20%
39%39%
58%58%
Q4Q4
16%16%
42%42%
55%55%

11
Supply Management GoalsSupply Management Goals
U.S. Pharma YU.S. Pharma Y--OO--YY
FY02FY02 FY03 TargetFY03 Target
20%20%
Canada YCanada Y--OO--YY 9%9% Same range Same range as FY02as FY02
MedMed--Surg YSurg Y--OO--YY 1%1% Same range Same range as FY02as FY02
Low to midLow to mid--teens teens growth, in line growth, in line with market, with market, adjusted for adjusted for customer mixcustomer mix
Operating Operating Margin ImprovementMargin Improvement
+16bp+16bp +10bp+10bp

12
Information Solutions GoalsInformation Solutions Goals
FY02 TargetFY02 Target
Revenues YRevenues Y--OO--YY
FY03 TargetFY03 Target
+10%+10% +9+9--10%10%
Bookings YBookings Y--OO--YY +40%+40%
Operating Operating Margin Ratio Margin Ratio YY--OO--YY
5.5%5.5% +200+200--300bp300bp

13
Strategic GoalsStrategic Goals
Pharmaceutical DistributionPharmaceutical Distributionn Strong market position throughout North American Focus on customer value creation and continued margin expansionn 3-year I.T. plan well underway
MedicalMedical--SupplySupplyDistributionDistribution
n Well positioned in growth segmentsn Focus on operational restructuring to drive quality and margin
.improvement
AutomationAutomationn Broadest footprint and fully-integrated product offeringn Focus on commercialization of innovative new productsn Enhance cross selling channels with other McKesson business units
Information SolutionsInformation Solutionsn Capitalize on largest footprint to drive clinical leadership and revenue
growthn Continued investment in new product developmentn Improve operating margins through productivity gains
Bill GraberBill GraberCFO CFO
June 7, 2002June 7, 2002

15
$36.8$31.3$28.0
$8.7$10.7
$13.2
2000 2001 2002
Revenue Warehouse Sales
Revenues Revenues ($ in billions)($ in billions)
$36.7
$50.0CAGR 17%
$42.0

16
$555$586
$809
2000 2001 2002
EBIT* EBIT* ($ in millions)($ in millions)
* Excluding Special Charges
CAGR 21%

17
EBIT Margin* EBIT Margin*
2.20%
1.87%1.98%
1.50%
2.00%
2.50%
2000 2001 2002
% o
f R
even
ue
ex. W
hse
. Sal
es
* Excluding Special Charges

18
$0.94 $0.99
$1.49
2000 2001 2002
EPS* EPS* (Pro Forma)(Pro Forma)
* Excluding Special Charges
CAGR 26%

19
Balance SheetsBalance Sheets($ in billions)
2000 2001 2002Receivables $3.0 $3.4 $4.0Inventory 4.1 5.1 6.0 Other Assets 2.6 2.5 2.7
Total $9.8 $11.1 $12.8Payables (3.9) (5.4) (6.3) Other Liabilities (1.5) (1.2) (1.4)
Net Capital Employed $4.4 $4.5 $5.0
Net Debt 0.7 0.8 0.9 Equity & Pref. Securities 3.8 3.7 4.1
Net Capital Employed $4.4 $4.5 $5.0
Net Debt/Net Capital 14.8% 17.5% 17.3%Long-Term Debt $1.3 $1.2 $1.4

20
ReceivablesReceivables
$96
$161
$71
2001 2002
P&L Impact of Additional Allowances
CustomerSettlements
NormalizedAllowances
$257
$420$320
2001 2002
Allowances for Doubtful Accounts Balances
($112) ($171)
2001 2002
Deductions to Allowances
21
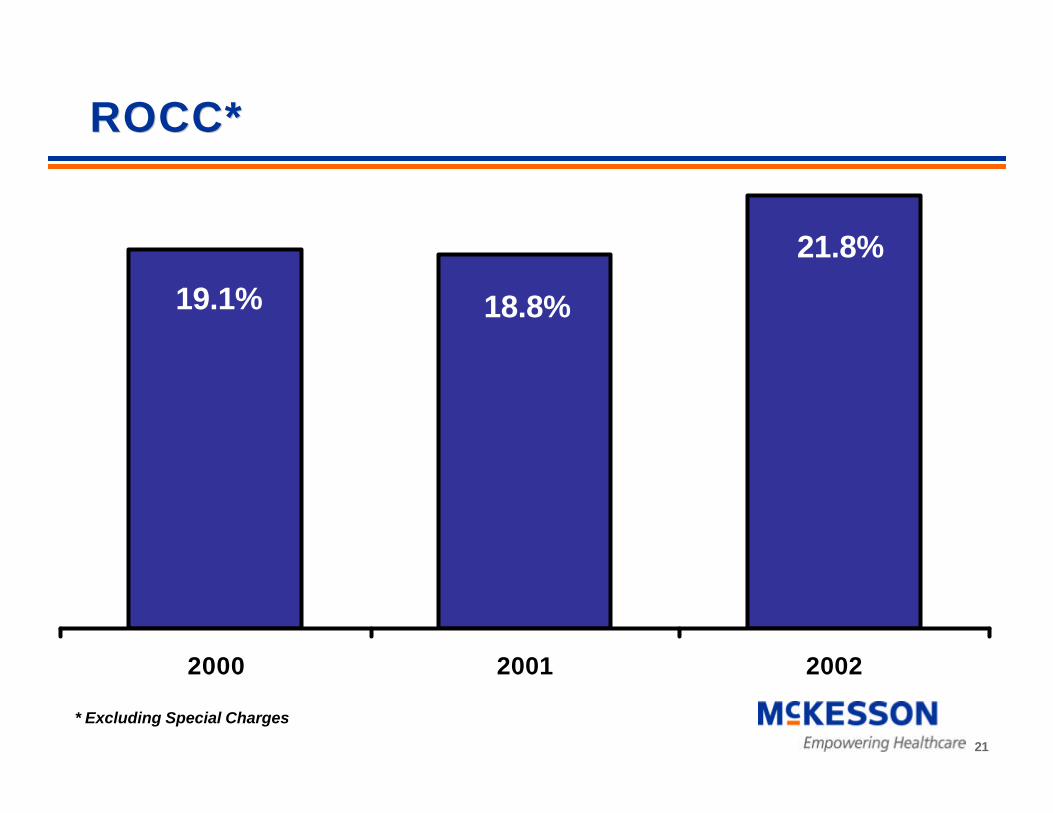
ROCC* ROCC*
19.1% 18.8%
21.8%
2000 2001 2002
* Excluding Special Charges

22
Operating Cash Flow Operating Cash Flow ($ in millions)($ in millions)
($315)
$332 $329
2000
2001 2002

23
Liquidity Liquidity
17.5%
14.8%
17.3%
2000 2001 2002
Net Debt/Net Capital Employed

24
Credit Facilities Credit Facilities ($ in millions)($ in millions)
FY00 FY01 FY02Ratings BBB BBB BBB
Credit Facilities- 364 Day $875 $825 $1,075- 5 Year 400 400 400 - A/R Sales $750 $850 $850Total Credit Capacity $2,025 $2,075 $2,325
25
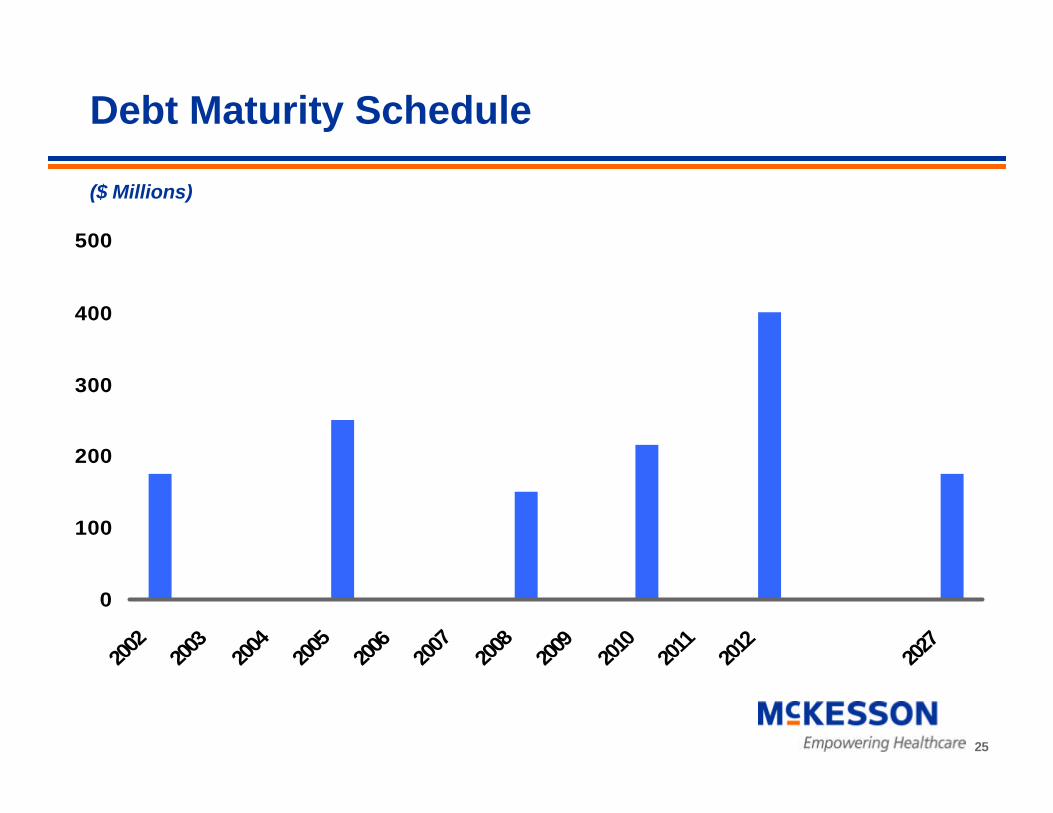
Debt Maturity Schedule
0
100
200
300
400
500
2002
2003
2004
2005
2006
2007
2008
2009
2010
2011
2012
2027
($ Millions)

26
McKesson Relative ValuationMcKesson Relative ValuationIndustry Trading Below HistoricalIndustry Trading Below Historical
Valuation TrendsValuation Trends
20021 1994-20012
McKesson 20.7 14.2-30.2
AmerisourceBergen 22.9 14.3-22.4
Cardinal Health 22.0 20.6-30.7
Cerner 37.8 n/a
S&P 500 31.2 15.5-29.2
P/E Ratio
1. Based on Calendar 2002 EPS consensus First Call estimate1. Based on Calendar 2002 EPS consensus First Call estimate
2. Based on Calendar 19942. Based on Calendar 1994--2001 forward EPS2001 forward EPS

27
SummarySummary
nn Excellent Financial PerformanceExcellent Financial Performance
nn Solid Balance SheetSolid Balance Sheet
nnWell Positioned for Future ImprovementWell Positioned for Future Improvement