Embed Size (px)
Citation preview

Analyst Day15 AUGUST 2019

13.45 – 14.00 Opening remarksTorbjörn Magnusson Group CEO and President, Sampo Group, as of 1 Jan 2020
14.00 – 14.40 Comeback SwedenPer LångsvedCountry Senior Executive Sweden and Head of Personal Banking Sweden, Nordea
14.40 – 15.20 Digital@IfMorten Thorsrud CEO, If P&C Ingrid Janbu Holte, Head of BA Private, If P&C
15.20 – 15.40 Coffee break15.40 – 16.20 Finnish Life Insurance Landscape
Petri Niemisvirta, CEO, Mandatum Life
16.20 – 17.00 Sampo Group’s Capital Position Knut Arne Alsaker, Group CFO, Sampo Group Kai Sotamaa, CRO, Sampo Group
15 August 2019
Agenda

This presentation may contain forward-looking statements that reflect management’s current views with respect to certain future events and potential financial performance. Although Sampo believes that the expectations reflected in such forward looking statements are reasonable, no assurance can be given that such expectations will prove to have been correct. Accordingly, results could differ materially from those set out in the forward-looking statements as a result of various factors.
Important factors that may cause such a difference for Sampo include, but are not limited to: (i) the macroeconomic development, (ii) change in the competitive climate and (iii) developments in capital markets.
This presentation does not imply that Sampo has undertaken to revise these forward-looking statements, beyond what is required by applicable law or applicable stock exchange regulations if and when circumstances arise that will lead to changes compared to the date when these statements were provided.
Disclaimer
15 August 2019

Opening remarksAnalyst Day, 15 August 2019
Torbjörn MagnussonGroup CEO and President, Sampo Group, as of 1 Jan 2020

Source: Refinitiv Datastream
10 11 12 13 14 15 16 17 18 190
100
200
300
400
500Sampo
STOXX EUROPE 600 Banks/Insurance
Sampo’s total shareholder return vs. comparison index, 10Y
Average annual total return 15%
15 August 2019

15 August 2019
Sampo Group profit before taxes
EURm
415
105
313388
-46
1 153
440
146 137222
31
981
-200
0
200
400
600
800
1 000
1 200
1 400
If Topdanmark Mandatum Life Nordea Holding (excl.associates)
Sampo Group
1-6/2018 1-6/2019
Sampo Group’s business areas are expected to report good operating results for 2019. However, the marked-to-market results are, particularly in life insurance, highly dependent on capital market developments. The continuing low interest rate level also creates a challenging environment for reinvestment in fixed income instruments.If is expected to reach a combined ratio of 84–86 per cent in 2019. With regard to Topdanmark reference is made to the profit forecast model that the company publishes quarterly. Nordea’s contribution to the Group’s profit is expected to be significant.
Outlook for 2019
15 August 2019

Investor PresentationNordea Sweden
Per Långsved, Country Senior Executive Sweden and Head of Personal Banking Sweden15 Aug 2019

1. Introduction
2. Personal Banking
3. A challenging transformation
4. Comeback Sweden
5. Building on the positive trend
Agenda

Personal Banking 2018 overviewIncome1
Share of group income
FY 2018
38%
Personal Banking at a glance
33%
Split per Country
15%
23%
29%3.46bn
Operating Profit1
Share of group operating profit
FY 2018
37%
41%
Split per Country3
18%
21%
26%1.47bn
3
• Universal relationship bank strategy• Omnichannel service model is increasingly
anchored around our mobile banking app
~9 million customers
~360 Branches
PeB SE
PeB NO
PeB FI
50%
51%
72%
C/I
#3
#2
#2
Division
PeB DK 65% #2
Total
Cost/income ratio
62%
2008 2018
-67%-94%
Locations Locations with manual cash
Q416 Q417 Q418
-10%
Banking unitsProducts, digital, IT and operations
Number of branch locations
FTE development2
1) Total Personal Banking shown excl. Distribution agreement with Asset & Wealth Management, country splits shown including Distribution Agreement2) Note: Following organizational changes (Technology moved to Group units), No. of employees are 9,439k at end of April 20193) PeB Other counts for -6% of operating profit
Market position
~145 EURbn in lending
~76 EURbn in deposits
PeB SE
PeB NO
PeB FI
Division
PeB DK
Confidential
4
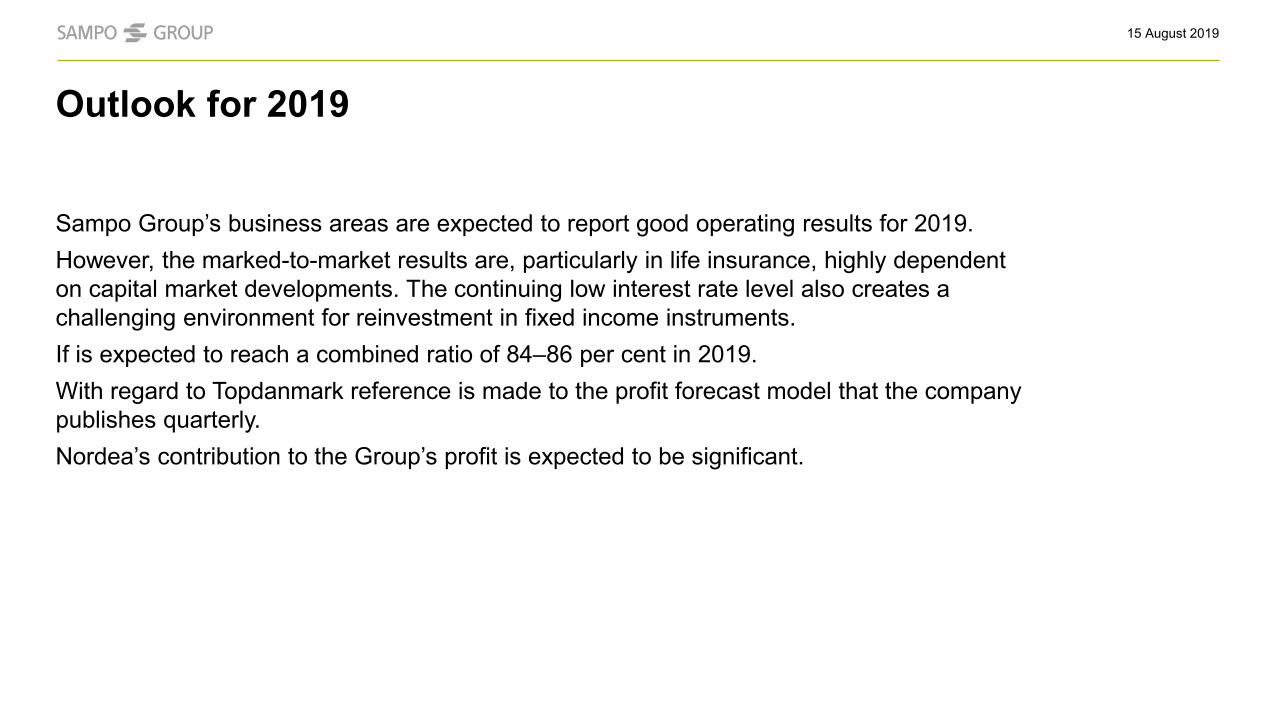
118 Locations
11 Online branches
5 Branches with cash
~ 1 900 Employees
~ 3 950 000 Household customers
PeB Sweden

5
PeB Sweden Q2 19
EUR 277m Total income
49,5% C/I ratio
13,8% ROCAR

When industry drivers change customer behaviour, we adapt
IMPATIENT & EMPOWERED
INTEGRATED & CONNECTED
REQUIRE RELEVANCE
DRIVERS OF CHANGED
CUSTOMER BEHAVIOUR
NEW TECHNOLOGY
INCREASED REGULATORY REQUIREMENTS
CHANGING COMPETITIVE LANDSCAPE
BIG GLOBAL ACTORS
6
MACRO DYNAMICS
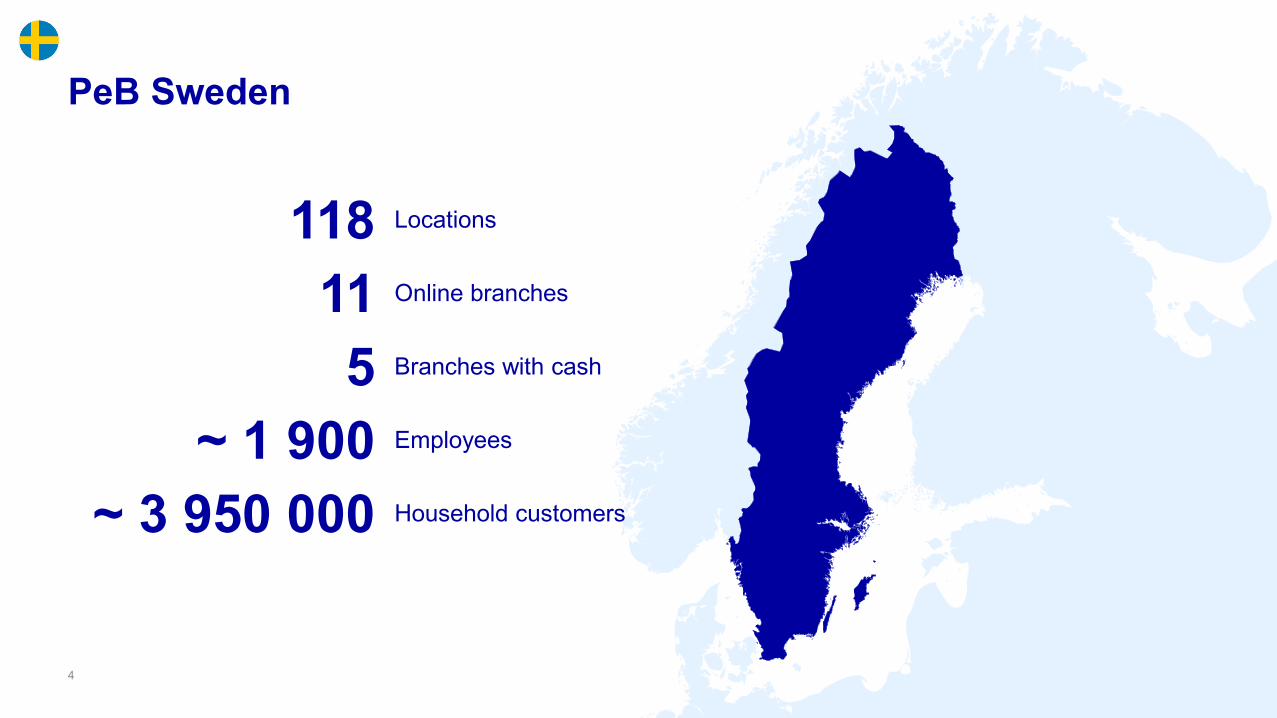
Customers drive our vision
7
Safe and trusted
Anywhere and anytime
Relevant and competent
Easy to deal with
Personal and digital relationship

The mobile as the core of an omnichannel experience
8
Online and face-to-face meetings
Full service and product provider
Chat, chatbots,calls – 24/7
Aggregated open banking
services
Global wallets
Local providers

Confidential
A challenging transformation
Developing the service model
AML maturity
Panama
De-risking and margin increase
Moving HQ to Finland
Increased competition and new entrants
IT transformation

10
Challenging years 2016-2018
Weakbusiness momentum
Angrycustomers
Unengagedpeople
Volumes down
AML issues HQ move
New regu-lationsIT-systems

11
Challenging years affecting the business
-4,00
-2,00
0,00
2,00
4,00
6,00
Net flows savings (SEKbn, Deposit & Inv products)
13,00%
13,50%
14,00%
14,50%
15,00%
15,50%
-10,00%
-5,00%
0,00%
5,00%
10,00%
Market shares mortgages and Nordea's share of market growth
Confidential
12
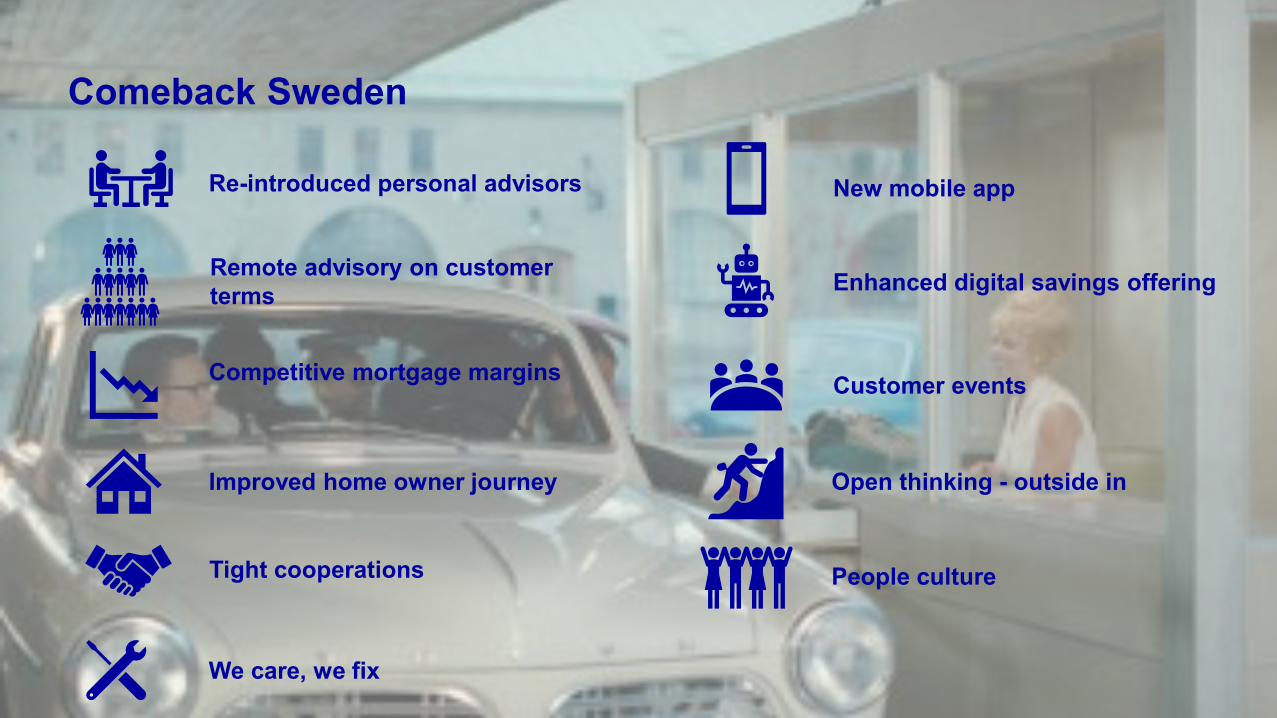
Comeback Sweden
Re-introduced personal advisors
Remote advisory on customer terms
New mobile app
Competitive mortgage margins
Improved home owner journey
We care, we fix
Enhanced digital savings offering
Open thinking - outside in
People cultureTight cooperations
Customer events

13
Satisfaction boostCustomer satisfaction
40
50
60
70
Q1 18 Q2 18 Q3 18 Q4 18 Q1 19 Q2 19
Employee satisfaction
-40
-20
0
20
40

14
The turn of business trends
-4,00
-2,00
0,00
2,00
4,00
6,00
Net flows savings (SEKbn, Deposit & Inv products)
-10,00%
-5,00%
0,00%
5,00%
10,00%
15,00%
Market shares mortgages (Nordea's share of market growth)

0
0,5
1
1,5
2
2,5
3
3,5
4
4,5
5
A leading new mobile bank according to our customers
Average 3,46
Nisch bank Universal bank
App store rating of bank apps in Sweden
258’ ratings

Mortgages - closing the gap
Definition:New mortgage customers/volume: Customer with mortgage loans current month, but lacking mortgage loans previous month.Lost mortgage customers/volume: Customer with mortgage loans previous month, but lacking mortgage loans current month.
New and lost mortgage customers
-2 720
2 0202 326
-2 752
Sep 18
-3 299
Jan 19
2 014 2 091 1 7412 223
-3 424
2 413
-3 595
Jul 19
-2 699
May 19Nov 18
-2 822
2 123
-2 900
2 097
-2 570
2 198
-2 604
2 435
-2 684
3 036 3 030
-3 983
2 988
Mar 19
-2 657-3 027
Jul 18
Net customersNew customersLost customers
Market share and share of growth
5,08% 9,64% 7,78% 10,49%5,73%6,92%
13,90%14,71% 11,75%8,41%
16,63% 12,67% 12,76%
3,80%
8,20%
24,10%
22,38%
12,06% 11,62%
22,47%
20,22%
16,09% 17,34%
13,76%
5,84%
15,80% 17,02%
13,53% 13,85% 13,12%
Market share
1,94%
2,30%
Share of growth 2018
1,27%
1,91%
Share of growth Q2-19 Share of growth 201906
Nordea
SEB
SHB
SWBDB
SBABLF
SkandiabankenOther
1,31%
3,61%
Monthly growth rate (%)
0,51
0,49
Sep 17
Mar 17
Jun 17
Dec 18
Dec 17
Mar 18
Jun 18
Sep 18
Mar 19
Jun 19
Market Nordea
The increased number of lost customer is mainly due to an increase number of lost co-account holder with limited impact on the volume growth.
Confidential
17
We care, we fix
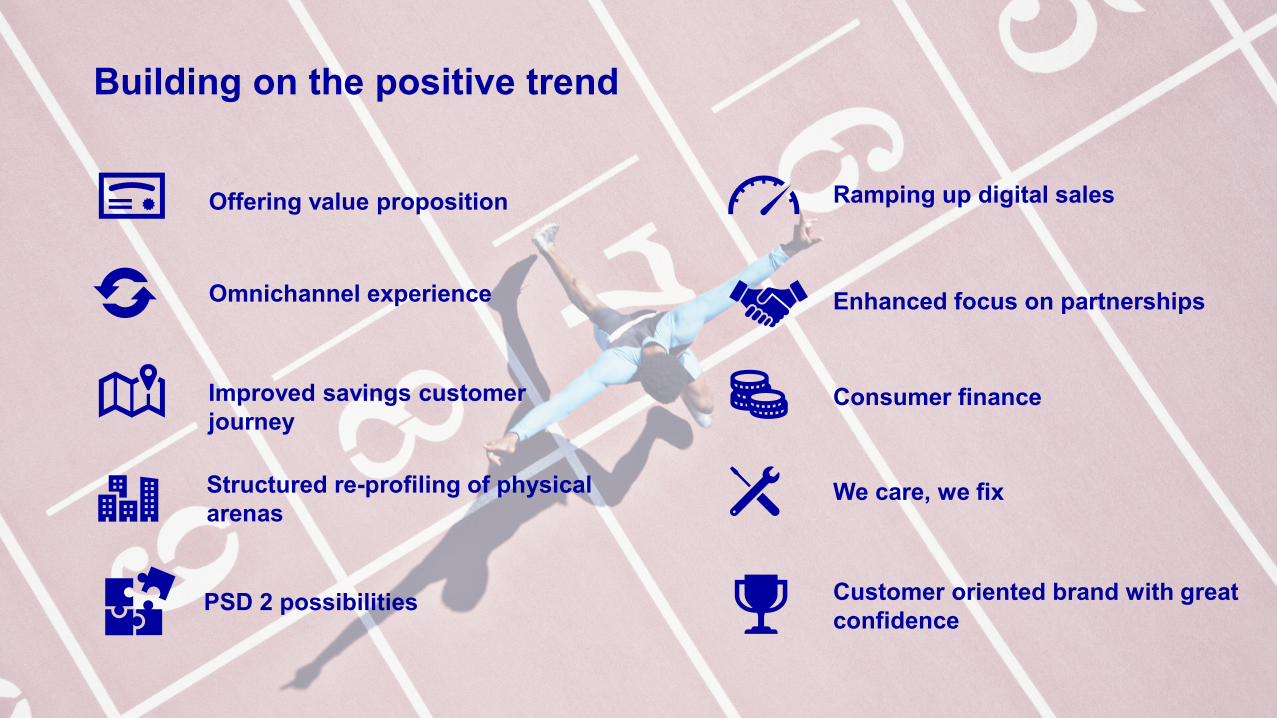
Building on the positive trend
Offering value proposition
Improved savings customer journey
Omnichannel experience
Consumer finance
Structured re-profiling of physical arenas
Customer oriented brand with great confidence
PSD 2 possibilities
Enhanced focus on partnerships
Ramping up digital sales

Thank you!

Appendix
20
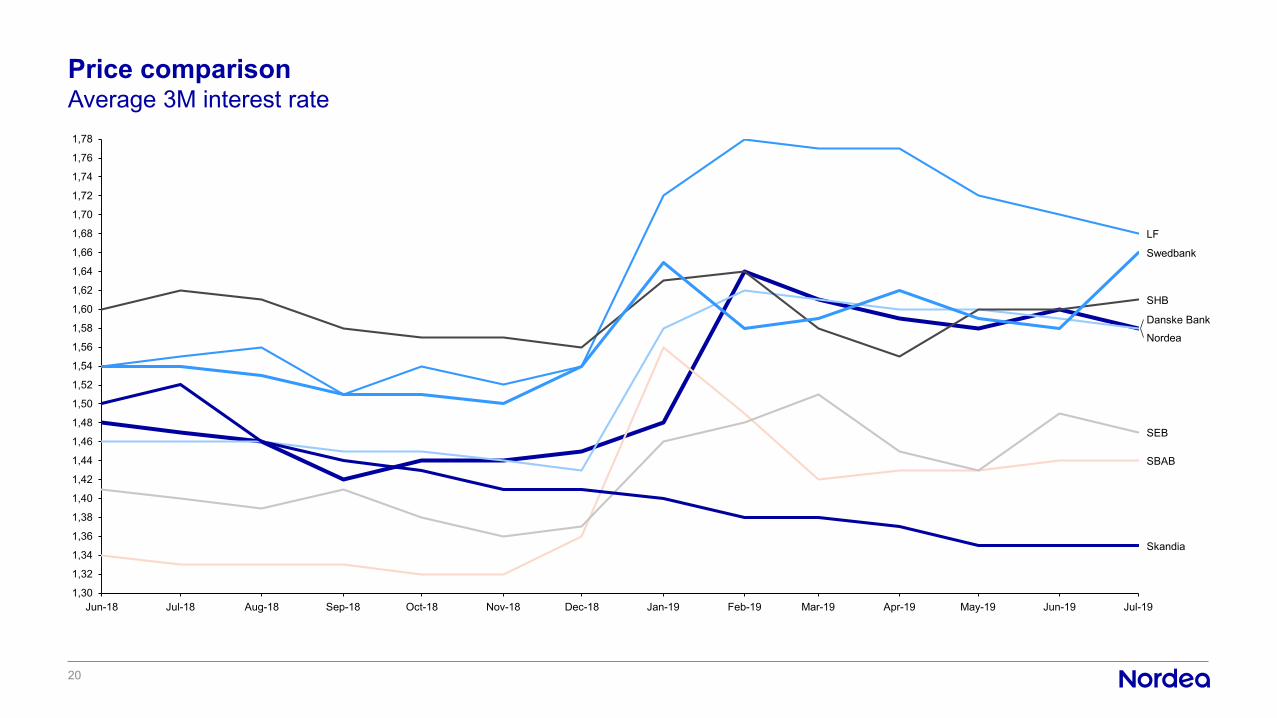
Price comparisonAverage 3M interest rate
1,30
1,32
1,34
1,36
1,38
1,40
1,42
1,44
1,46
1,48
1,50
1,52
1,54
1,56
1,58
1,60
1,62
1,64
1,66
1,68
1,70
1,72
1,74
1,76
1,78
Jan-19 Jul-19Sep-18 Nov-18 Mar-19 May-19Jun-18 Aug-18 Oct-18 Dec-18 Feb-19 Apr-19 Jun-19Jul-18
Swedbank
Nordea
SBAB
LF
Danske Bank
SEB
SHB
Skandia
Morten Thorsrud, CEO
Ingrid Janbu Holthe, Head of BA Private
Sampo Group Analyst Day
DIGITAL @ IF

6M 2019 UPDATE – KEY FINANCIAL FIGURES
Meur 6M 2019 6M 2018 CHANGE %GWP 2 772 2 701 4,3%¹
Technical result 334 306 9,2%
Investment result 127 128 -0,8%
Operating result 440 415 6,0%
Risk Ratio 63,0% 64,0% -1,0%-p
Cost Ratio 21,7% 21,8% -0,1%-p
Combined Ratio 84,7% 85,8% -1,1%-p
Investment result MTM 381 62 515%
¹ Excluding currency effects

PREMIUM GROWTH AND COMBINED RATIO DEVELOPMENT
0,0% -0,3%
0,9%
3,4%
4,3%
6M 2015 6M 2016 6M 2017 6M 2018 6M 2019
GWP Growth Combined ratio
85,2% 84,5% 85,7% 85,1% 83,0%
Q2 2015 Q2 2016 Q2 2017 Q2 2018 Q2 2019
Excluding currency effects ¹ Excluding non-recurring items
¹
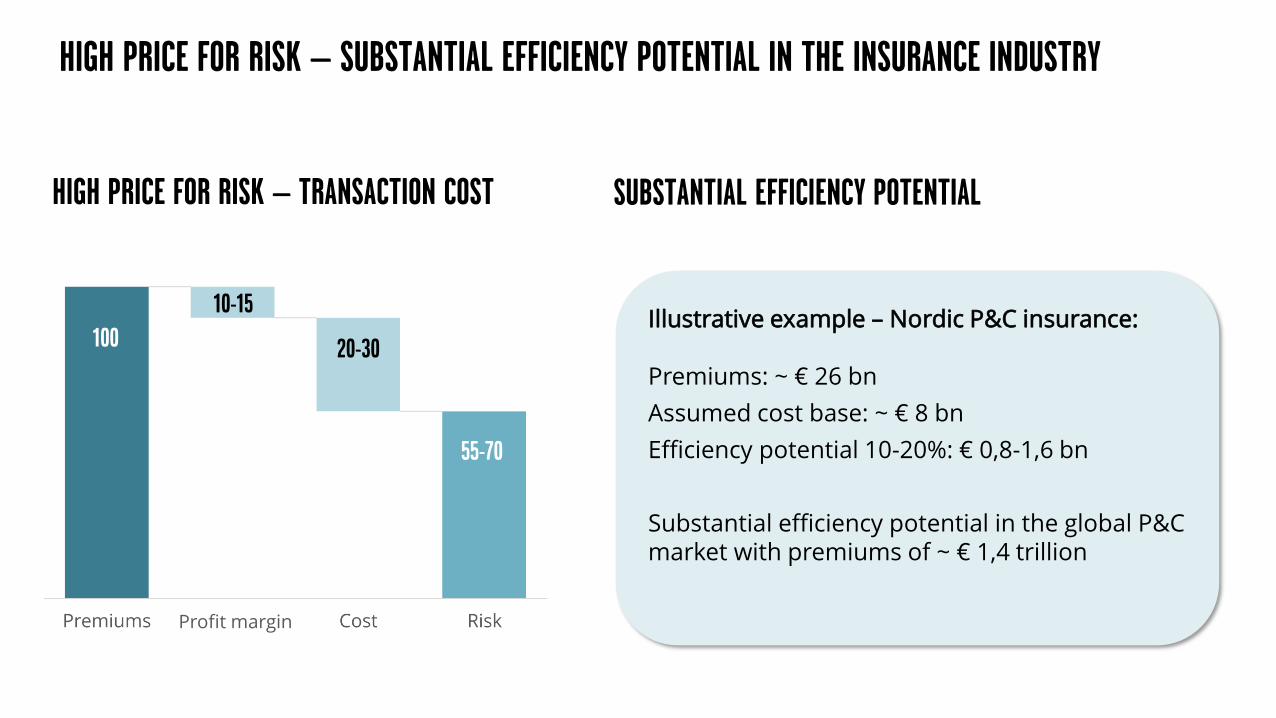
HIGH PRICE FOR RISK – SUBSTANTIAL EFFICIENCY POTENTIAL IN THE INSURANCE INDUSTRY
Illustrative example – Nordic P&C insurance:
Premiums: ~ € 26 bn
Assumed cost base: ~ € 8 bn
Efficiency potential 10-20%: € 0,8-1,6 bn
Substantial efficiency potential in the global P&C market with premiums of ~ € 1,4 trillion
High price for risk – transaction cost Substantial efficiency potential
100
10-15
20-30
55-70
Profit margin

CONTINUED HIGH LEVEL OF INVESTMENTS IN IT AND DIGITAL SOLUTIONS
27%
2014 2019F
DIGITAL RELATED INVESTMENTS % OF TOTAL IT DEVELOPMENT COST
66
2014 2019F
Total it development costmeur

WAYPOINT – NORDIC CORE INSURANCE SYSTEM
EfficiencyOne integrated price and production
system serving all markets
Business valueDelivering underwriting excellence in
practice
QualityWorld class competence and technology
platform

Simplified customer journey
Telematics – pay per mile
Artificial intelligence
chatbots
Track my claim
Ecosystem partnerships
Car damage recognition Multiple vehicle webshop

COMPETITIVE EDGE IN THE NORDIC MARKET DUE TO SIZE, DIGITAL DISTRIBUTION AND STRATEGIC PARTNERSHIPS. IMPORTANCE OF NORDIC SCALE IS INCREASING
Scale advantage as the biggest P&C insurer in the Nordics
Increasingly digital insurance policy distribution
Credibility as a partner with several existing partnerships
16%
10%9% 9%
8%
If LF Tryg Gjensidige RSA
11%13%
15%
18%
22%
2014 2015 2016 2017 2018
Top 5 Nordic P&C insurers in terms of estimated market share
Internet sales as % of total sales (objects)

DIGITALIZATION IS IMPACTING ALL PARTS OF OUR OPERATING MODELRequires all parts to be more analytics and customer insight driven
Product & pricing
CRM & Marketing
Claims
Partners
Customer service
Digital sales & service

DIGITAL CHANNELS IN A KEY ROLE IN OUR DISTRIBUTION MODEL
Our distribution model relies largely on customer centers, partners and digital channels1
Characteristics of other players’ distribution models vary significantly by country
• Direct and remote distribution dominating with a fewplayers having local branch offices
• Growth in online distribution while offline still the mostcommon way of distribution
• Distribution largely through traditional channels (ownsalesforce, car dealers and franchise)
• Increasing share of online sales and some distributorsfocusing solely on digital channels
• Some of the largest insurers rely mainly on internaldistribution, whereas others use also external distribution
• Increasing focus on online distribution
• Distribution largely through physical distribution channels
• Low share of online distribution
Customer Centers• Flagship offices• Other smaller offices
37%of sales
Partners• Car dealers• Banks• Other partners
27%of sales
Digital• Website• Other digital channels
22%of sales
Other• External franchises• External agents
14%of sales
¹ Sales as % of total sales in objects

WE HAVE ADOPTED A DIGITAL, FLAGSHIP-FOCUSED OPERATING MODEL ACROSS COUNTRIES
Shift to a digital, flagship-focused operating model has allowed us to reduce the number of branch offices
Large share of customer activities are currently carried out online
Trondheim
Turku
Stamholmen
Gothenburg
Grimstad
Flagship customer centers
Total # of branch offices1
% of insurances objects sold online
% of claims reported online
% of customers are E-customers (customers with both electronic documents only and electronic payment)
55%
¹ Including branch offices with 5 or more employees
50-75%
55%30-60%
55%10-40%

INSURANCE DISTRIBUTION IS BECOMING INCREASINGLY DATA DRIVEN
Insurance distribution is becoming increasingly complex and customers will have multiple channels to choose from
Analytics play a key role in understanding customer behavior and responding to ever-changing customer needs
Machine learning model to predict likely sales hits and value for outbound leads
Machine learning model to recommend most likely product(s) for a customer and initiate churn preventive activities

LARGE SHARE OF ONLINE SALES AND SELF SERVICE REQUIRES SEAMLESS PROCESSES ACROSS CHANNELS
Web shop for customers Web shop for front liners
• Same pricing and productsacross channels
• Holistic overview of thecustomer across channels
• Similar solutions forcustomers and front liners toensure smooth customerand employee experience
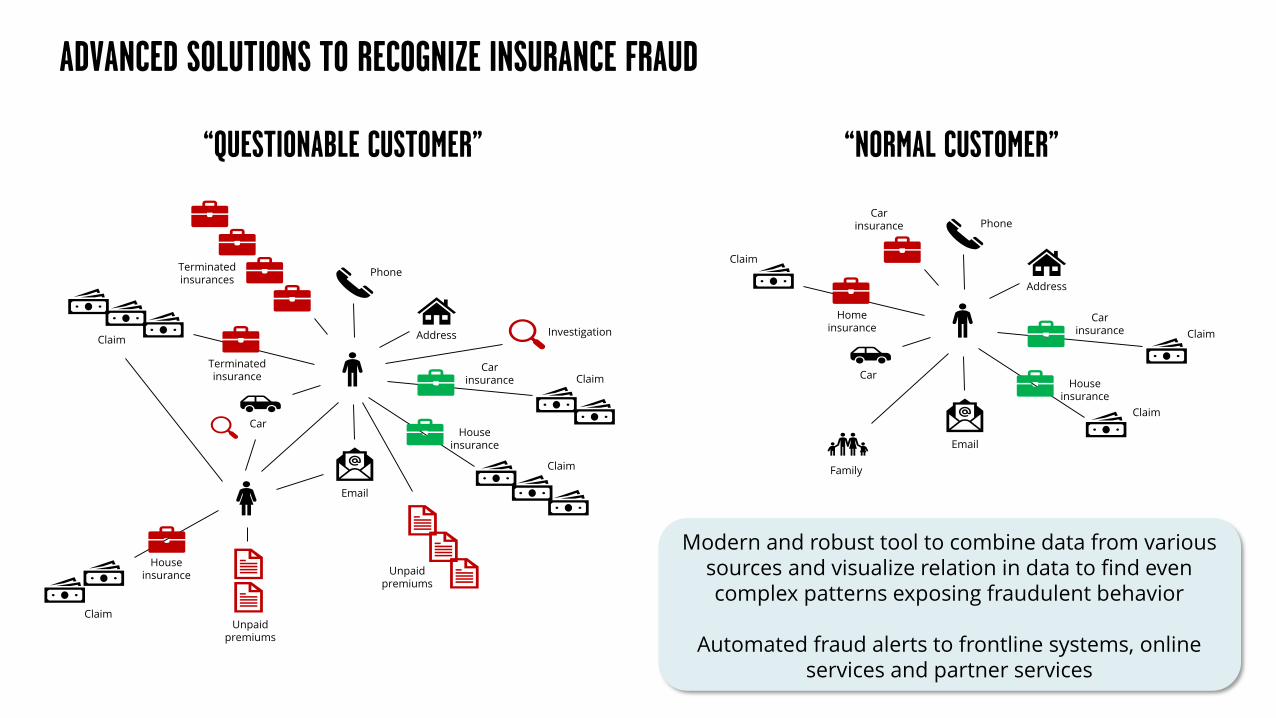
ADVANCED SOLUTIONS TO RECOGNIZE INSURANCE FRAUD
Phone
Address
Car insurance
House insurance
Unpaid premiums
Claim
Investigation
Terminated insurances
Claim
Terminated insurance
Car
House insurance
Unpaid premiums
Claim
Claim
Phone
Address
Car insurance
House insurance
Claim
Car insurance
Claim
Home insurance
Car
Claim
Family
“Questionable customer” “Normal customer”
Modern and robust tool to combine data from various sources and visualize relation in data to find even complex patterns exposing fraudulent behavior
Automated fraud alerts to frontline systems, online services and partner services


Finnish Life InsuranceLandscape
Petri NiemisvirtaCEO, Mandatum Life

Life InsuranceMarket in Finland

3
Household assets 2018 (Bn€)
100,2
55,6 33,0
23,0
83,1
8,1
Deposits Insurance savings StocksFunds Unlisted stocks Others
Asset class 2012-2018 2015-2018
Deposits 2,7% 4,7%
Insurance savings 3,3% -2,1%
Stocks 4,6% 1,2%
Funds 7,5% 4,3%
Unlisted stocks 8,2% 4,3%
Others -6,1% -8,3%
Average growth (p.a.)

Life Insurance SavingsFinland 12/2018
6 855
29 245
Private householdsTotal 36 100 m€
WP UL
6 068
6 636
CorporateTotal 12 704 m€
WP UL

Mandatum Life’s market shares of total life insurance premiums* of Corporate and Private
customers in Finland 1.-12.2018
*) Gross Written Premium excl. statutory employees’ group life insurance
53,1 %
40,3 %
52,5 %
23,1 %26,5 %
48,5 %52,4 %
40,1 % 42,0 %
22,4 %27,8 %
47,5 %
0%
10%
20%
30%
40%
50%
60%
Capitalredemption
Endowment Grouppension
Privatepension
Risk Total
Corporate customers, Market shares
793
16247 111 76
1 2431 160
18257 104 77
1 616
-
500
1 000
1 500
2 000
Capitalredemption
Endowment Grouppension
Privatepension
Risk Total
Milli
ons
Total life insurance premiums
1.-12.2017 1.-12.2018
7,5 %
17,0 %
22,6 %
10,3 %
14,9 %
10,7 %9,2 %
19,9 %
9,9 % 10,5 %
0%
5%
10%
15%
20%
25%
Capitalredemption
Endowment Privatepension
Risk Total
Private customers, Market shares
681
2 037
233 239
3 190
671
1 531
214 233
2 650
- 500
1 000 1 500 2 000 2 500 3 000 3 500
Capitalredemption
Endowment Privatepension
Risk Total
Milli
ons
Total life insurance premiums
1.-12.2017 1.-12.2018
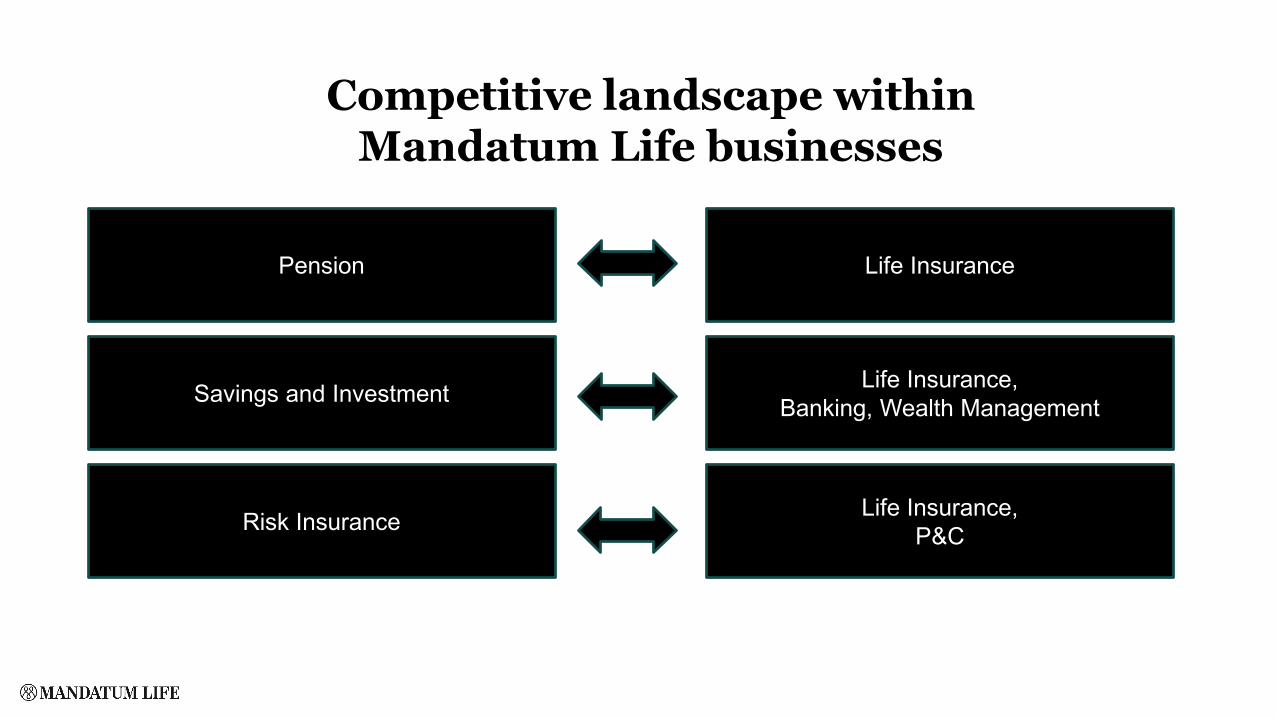
Competitive landscape withinMandatum Life businesses
Pension
Savings and Investment
Risk Insurance
Life Insurance
Life Insurance, Banking, Wealth Management
Life Insurance, P&C

14.8.2019 7
Pensions

8
Finnish demographics31.12.2018
Source: Kela
Population’s age structure1865 - 2018
Male FemaleAge
1000 personsPensioners living in FinlandOther population
% of totalpopulation
Age / % 2010 2020* 2030* 2040* 2050* 2060*0 - 14 17 16 14 13 13 1215 - 64 66 62 60 60 59 57-65 18 23 26 27 29 31Population(1000) 5 375 5 543 5 612 5 602 5 532 5 448

14.8.2019 9
Trends
High pressure towards statutory pension system
Role of individual savings and planning growing

Pressure doesn’t create action … yet
Household savings-% 1975 - 2018

14.8.2019 11
Development of insurance savings in Group pension market
515 492
846 085
1 189 515
363 622
572 685
796 911
0
200 000
400 000
600 000
800 000
1 000 000
1 200 000
1 400 000
EUR
100
0
Unit linked Group pension, market Unit linked Group pension, ML

14.8.2019 12
Mandatum LifeActions
• Mandatum Life has dominant position in Finnish pension market⎯ Mandatum Life is operating as a market maker⎯ New sales from corporate market⎯ Private customer’s individiual pension savings only through old individual pension portfolio
• Reward and remuneration consultancy supports sales of corporate solutions
• Personnel funds can also have a significant role in the future⎯ Already approx. 114 000 members in personnel funds (Finland total 12/2018)⎯ Strong political support

14.8.2019 13
Investments

14
Presentaation nimi / Tekijä
Household assetsFinland 12/2018
Average wealt according to age group
Eur
Net wealth (investments – debts)All
Deposits
Unlisted stocks
InsuranceStocksFunds
mEur Household assets 1997 Q4 – 2018 Q4
• Asset base reflects the low savings intencity• Undeveloped savings culture• Organic growth still in deposits• To be seen how new Equity Savings Account (1.1.2020) changes the flows
>

14.8.2019 15
Development of insurance savings in Endowmentmarket
5 238 548
8 421 633
15 275 805
17 375 337
1 028 953 1 296 014 2 101 133 2 193 235
02 000 0004 000 0006 000 0008 000 000
10 000 00012 000 00014 000 00016 000 00018 000 00020 000 000
EUR
100
0
Unit linked Endowment, market Unit linked Endowment, ML

14.8.2019 16
Development of insurance savings in Capital redemption market
1 959 020
7 675 559
11 042 462
728 756 1 676 652
2 519 170
0
2 000 000
4 000 000
6 000 000
8 000 000
10 000 000
12 000 000
EUR
100
0
Unit linked Capital redemption, market Unit linked Capital redemption, ML

14.8.2019 17
Development of insurance savings in corporatecustomers Capital redemption market
974 961
2 143 823
3 666 574
656 791 951 063
1 795 891
0
500 000
1 000 000
1 500 000
2 000 000
2 500 000
3 000 000
3 500 000
4 000 000
EUR
100
0
Unit linked Capital redemption, corporate customers, marketUnit linked Capital redemption, corporate customers, ML

Mandatum LifeActions
• Growth through institutional clients and HNWI-operation⎯ Unique investment possibilities with Sampo Group⎯ Strong growth within alternative investments
• Broadening the offered solution scope⎯ Direct fund offering through Lux fund company⎯ New trading platform with Saxo bank technology (Mandatum Trader)⎯ Reducing the dependency on life products in the changing savings and investments market
environment

Danske CooperationUpside potential after several modest years

Danske Bank´s life insurance annual premiums in Finland
274 274
408
473439
466
318
216
153
67
0
50
100
150
200
250
300
350
400
450
500
2010 2011 2012 2013 2014 2015 2016 2017 2018 1-6/2019
Mill
ions
Fall 2016: Mandatum Life announcenot to continue agencyagreement
2017: Danske’s sales organization waiting for a new life insurance partner. Cooperation with Mandatum suffers.
June 2018: New agency agreementsigned between Danske and Mandatum.Mutually agreed focus areas:1) Loan insurance, Fall 20182) Pension portfolio, year end 20183) Saving policies, Spring 2019

New loan insurance policies and offers in Finland
21
• Clear growth in volumes aftersigning of new agencyagreement.
• Further growth expected
• Sales ratio (new loaninsurance/new mortgage loan)increased from all time low 8 %to current 25 %. Year end targetlevel 35 %
Offers (right axis)New policies
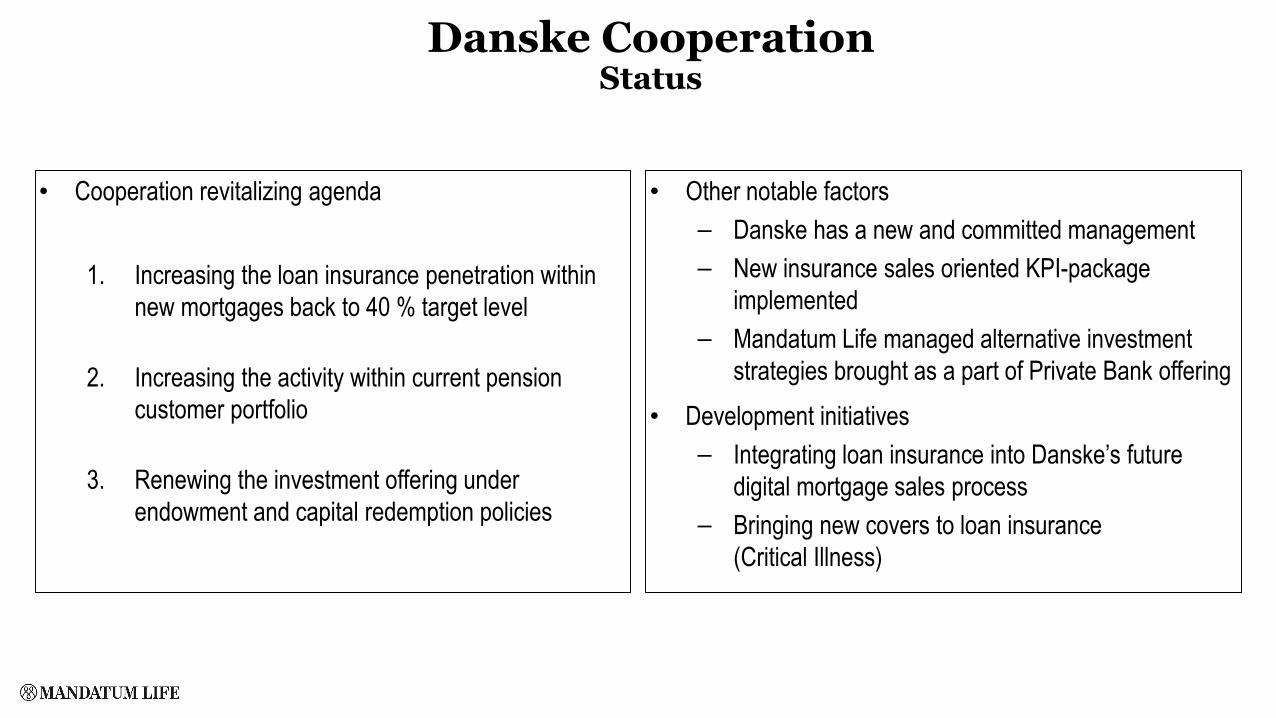
Danske CooperationStatus
• Cooperation revitalizing agenda
1. Increasing the loan insurance penetration withinnew mortgages back to 40 % target level
2. Increasing the activity within current pensioncustomer portfolio
3. Renewing the investment offering underendowment and capital redemption policies
• Other notable factors⎯ Danske has a new and committed management⎯ New insurance sales oriented KPI-package
implemented ⎯ Mandatum Life managed alternative investment
strategies brought as a part of Private Bank offering• Development initiatives
⎯ Integrating loan insurance into Danske’s futuredigital mortgage sales process
⎯ Bringing new covers to loan insurance (Critical Illness)

Thank You!

Sampo Group’sCapital Position
Knut Arne Alsaker, Group CFO, Sampo Group
Kai Sotamaa, GCRO, Sampo Group
Analyst Day, 15 August 2019
This presentation may contain forward-looking statements that reflect management’s current views with respect to certain future events and potential financial performance. Although Sampo believes that the expectations reflected in such forward looking statements are reasonable, no assurance can be given that such expectations will prove to have been correct. Accordingly, results could differ materially from those set out in the forward-looking statements as a result of various factors.
Important factors that may cause such a difference for Sampo include, but are not limited to: (i) the macroeconomic development, (ii) change in the competitive climate and (iii) developments in capitalmarkets.
This presentation does not imply that Sampo has undertaken to revise these forward-looking statements, beyond what is required by applicable law or applicable stock exchange regulations if and when circumstances arise that will lead to changes compared to the date when these statements were provided.
Disclaimer
2
15 August 2019

1) Sampo Group Solvency• FICO and SII Solvency as of 30 June 2019• Changes in SII from Q1 -> Q2
2) Timeline for Nordea Deconsolidation Expected by SampoNOTE: In this presentation “Nordea deconsolidation” refers to the distribution of an extra dividend in the form of Nordea shares which took Sampo’s ownership in Nordea below 20% and consequently treating Nordea in Sampo’s S-II calculations as a normal equity investment and to a termination of the conglomerate rules (FICO) solvency calculations, which is subject to formal approval by the FIN-FSA. This does not refer to the consolidation of Nordea as an associated company in Sampo Group’s financial statements (IFRS), which remains unchanged.
3) Nordea Deconsolidation• Changes in Solvency Capital Requirement and Own Funds for Sampo Group• Extra Dividend in the Form of Nordea shares – Impact on P/L• Nordea as an Equity Investment• Pro forma issuing capacity• Group solvency Nordea deconsolidation
4) Sampo Group Solvency Sensitivities to Market Risk Factors
Agenda
3
15 August 2019

1 507
1 160547
4 596
225
8 102
10 523
67
0
2 000
4 000
6 000
8 000
10 000
12 000
If P&C Topdanmark Sampo plc Group’s Own Funds
Own Funds and Solvency by FICO Rules
Group Solvency ratio 130%*EURm
Sampo Group Solvency 30 June 2019
BufferEUR 2,421m
3 862
4 6648 527
11 654
0
2 000
4 000
6 000
8 000
10 000
12 000
14 000
ConsolidatedGroup SCR*
Nordea andOther
financialsector
Group SCR Total EligibleOwn Funds
Eligible Own Funds and Solvency June 30th 2019by Solvency II RulesRatio of Eligible Own Funds to Group SCR 137% EURm
*) Standard formula
MandatumLife
Sampo plc´sshares ofNordea/
NDX Intressenter
Totalcapital
requirement
* Includes a deducted EUR 791 m dividend (proportionally as of H1)BufferEUR 3,127m
EUR 2,335m excl. dividend
4
15 August 2019
5
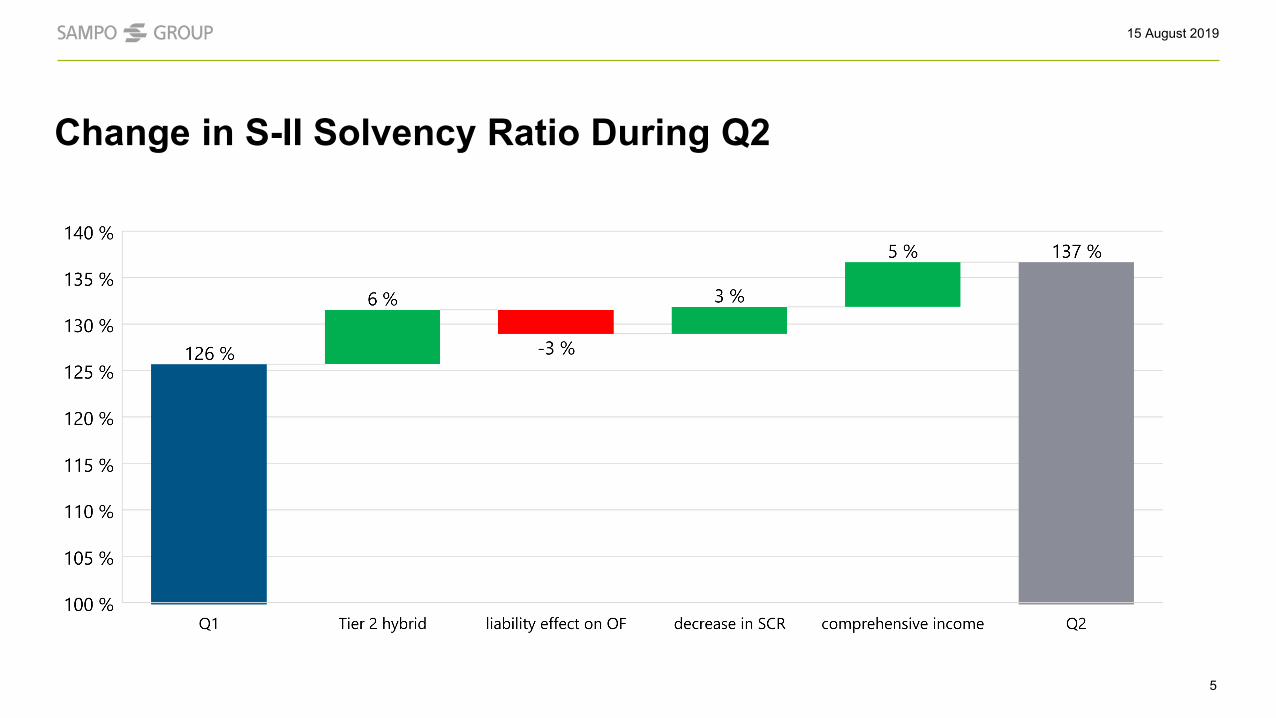
Change in S-II Solvency Ratio During Q2
15 August 2019
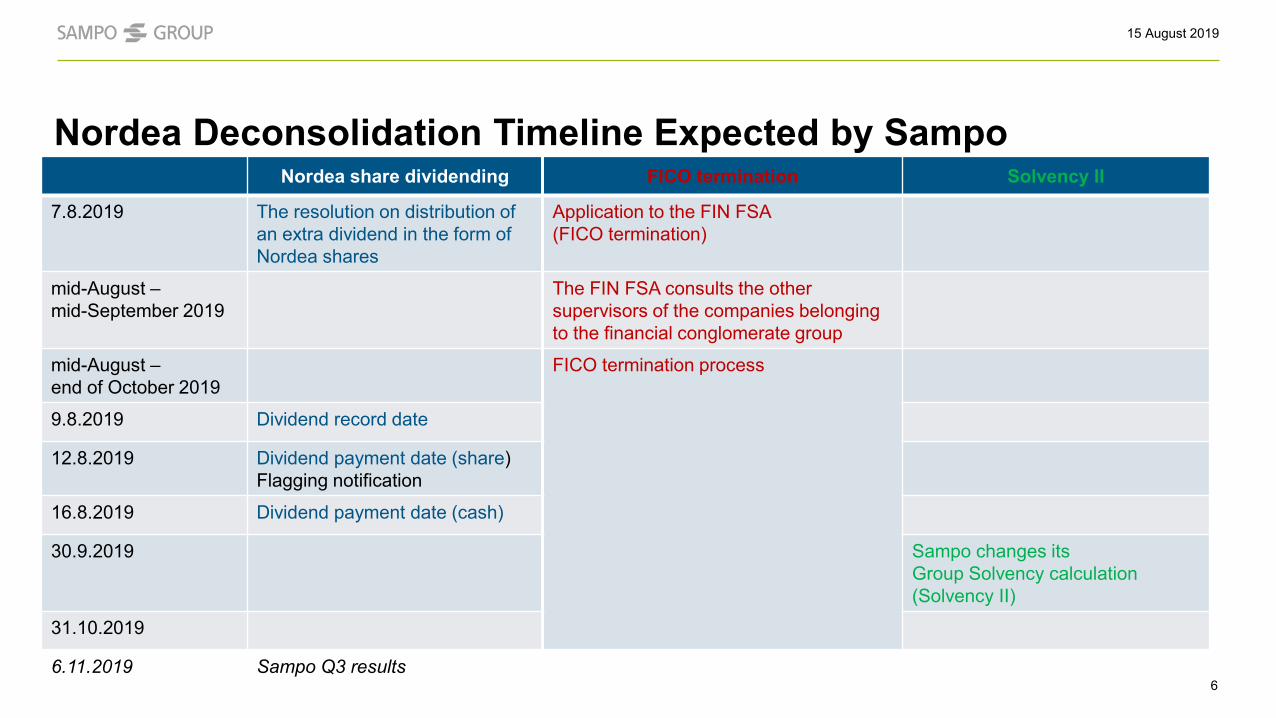
Nordea share dividending FICO termination Solvency II
7.8.2019 The resolution on distribution of an extra dividend in the form of Nordea shares
Application to the FIN FSA (FICO termination)
mid-August –mid-September 2019
The FIN FSA consults the other supervisors of the companies belonging to the financial conglomerate group
mid-August –end of October 2019
FICO termination process
9.8.2019 Dividend record date
12.8.2019 Dividend payment date (share)Flagging notification
16.8.2019 Dividend payment date (cash)
30.9.2019 Sampo changes its Group Solvency calculation(Solvency II)
31.10.2019
6.11.2019 Sampo Q3 results
Nordea Deconsolidation Timeline Expected by Sampo
6
15 August 2019
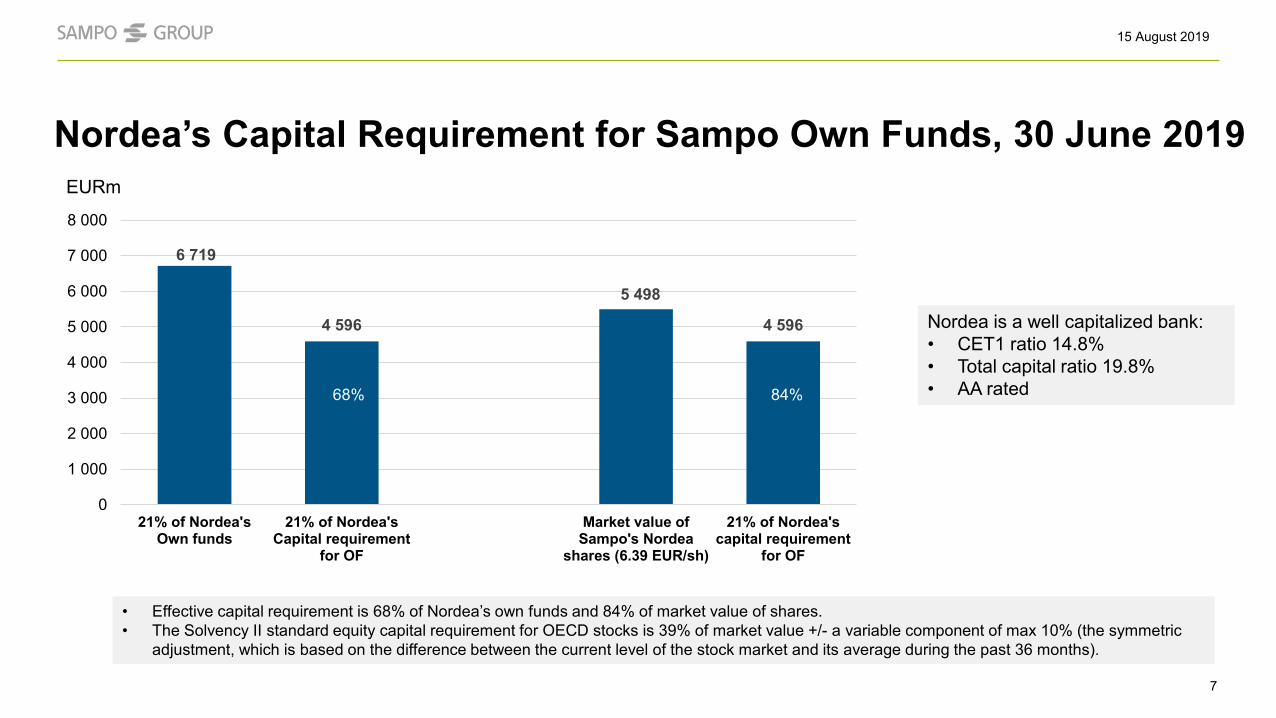
Nordea’s Capital Requirement for Sampo Own Funds, 30 June 2019
7
69%
Nordea is a well capitalized bank:• CET1 ratio 14.8%• Total capital ratio 19.8%• AA rated
• Effective capital requirement is 68% of Nordea’s own funds and 84% of market value of shares.• The Solvency II standard equity capital requirement for OECD stocks is 39% of market value +/- a variable component of max 10% (the symmetric
adjustment, which is based on the difference between the current level of the stock market and its average during the past 36 months).
6 719
4 596
5 498
4 596
0
1 000
2 000
3 000
4 000
5 000
6 000
7 000
8 000
21% of Nordea'sOwn funds
21% of Nordea'sCapital requirement
for OF
Market value ofSampo's Nordea
shares (6.39 EUR/sh)
21% of Nordea'scapital requirement
for OF
84%68%
EURm
15 August 2019

6 719
5 6774 871
5 677
0
1 000
2 000
3 000
4 000
5 000
6 000
7 000
8 000
21% of Nordea'sOwn funds
21% of Nordea'sCapital requirement
for OF
Market value ofSampo's Nordea
shares (5.66 EUR/sh)
21% of Nordea'scapital requirement
for OF
Nordea’s Capital Requirement for Sampo Own Funds, Pro forma 1 January 2020 with an Average ECB P2R of 1.8%
8
• Effective capital requirement is 84% of Nordea’s own funds and 117% of market value of shares.• The Solvency II standard equity capital requirement for OECD stocks is 39% of market value +/- a variable component of max 10% (the symmetric
adjustment, which is based on the difference between the current level of the stock market and its average during the past 36 months).
117%84%
EURm
15 August 2019

11 6549 213
7 0884 557
90
0
2 000
4 000
6 000
8 000
10 000
12 000
14 000
Own funds 30.6.19 Nordea's book valuededucted
Nordea's marketvalue added
Intangibles andsectoral items
deducted, net impact
Pro forma own funds
9
Group Solvency Nordea Deconsolidation – S-II Own Funds
EURm
15 August 2019

Extra Dividend in the Form of Nordea Shares
10
EURm
No. of shares held at 30.6.201921.25%, 860.4 million
No. of shares to be distributed1.38%, ~55.5 million
Fair value of shares, EUR 5.66/share
314
Proportional reduction in the Group carrying amount
-457
Valuation loss in the Group -143
Effects on Sampo plc level EURm
Dividending out at book value of EUR 6.46, decrease of associate share
359
Shares at fair value of EUR 5.66/sh 314
Realised valuation difference effect in P&L -44
Effects on Sampo Group level EURm
Realised loss from the disposal -143
Recyclying of previous OCI items thru P&L -12
Total financial effect in P&L -155
15 August 2019

11 6549 213
3 9315 482
4 596
0
2 000
4 000
6 000
8 000
10 000
12 000
14 000
SII Own Funds 12/18 Group SCR SII Own Funds EST** Group SCR EST***
Nordea Consolidated Group + others
Nordea as Equity Investment After Extra Dividend and S-II Deconsolidation
8,527
Eligible Own Funds/Group SCR 137% Eligible Own Funds/Group SCR 168%EURm
** Changes: In SII balance sheet Nordea’s BV removed and replaced with market value of shares. Deductions, such as intangibles, and additions, such as AT1/T2 capital, removed. *** 39% risk-weight for Nordea (5.66 EUR/sh., 805 m shares)
11
BufferEUR 3,731m
EUR 2,940m excl. dividend
Buffer * EUR 3,127m
EUR 2,335m excl. dividend
* Pro forma capital requirement incl. 3% SRB = 8,964 EURm⇒ EUR 2,690m buffer, EUR 1,899m excl. dividend
15 August 2019
12
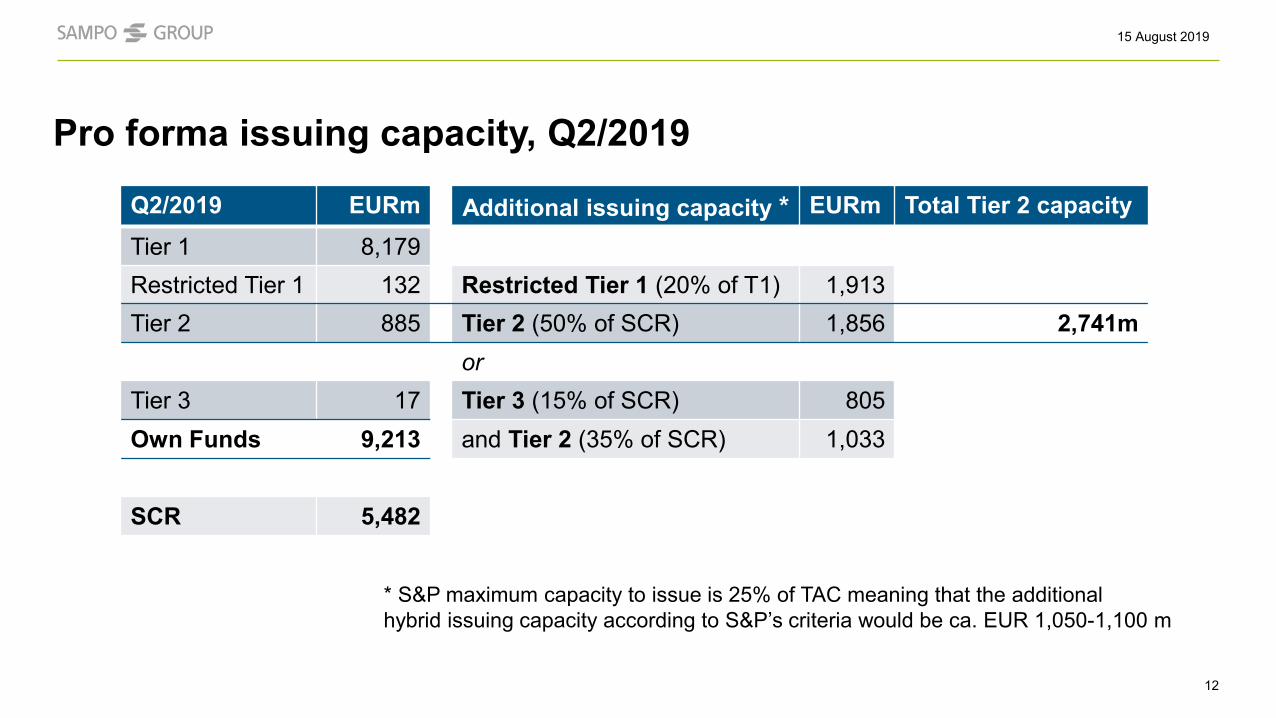
Pro forma issuing capacity, Q2/2019
Q2/2019 EURm Additional issuing capacity * EURm Total Tier 2 capacityTier 1 8,179Restricted Tier 1 132 Restricted Tier 1 (20% of T1) 1,913Tier 2 885 Tier 2 (50% of SCR) 1,856 2,741m
orTier 3 17 Tier 3 (15% of SCR) 805Own Funds 9,213 and Tier 2 (35% of SCR) 1,033
SCR 5,482
* S&P maximum capacity to issue is 25% of TAC meaning that the additionalhybrid issuing capacity according to S&P’s criteria would be ca. EUR 1,050-1,100 m
15 August 2019

Group Solvency Nordea Deconsolidation
13
• Solvency ratio increases from 137% to 168%• Consolidated Group SCR increases by 1,551 MEUR but total SCR decreases by 3,045• As stand-alone, concentration risk would increase by 503 MEUR but the correlation structure of
the Standard Formula mitigates the effect of the concentration risk increase to a very high degree.
Assumptions: • 804 922 858 shares left after deconsolidation.• Share price 5.661 EUR.• Equity shock of 39% +/- symmetric adjustment applied
EURm
Solvency ratio 137% Solvency ratio 168%
8,527
3,931
5,48211 654
9 213
3 862 3 8625 413
4 664
68
68-4 596
1 518
23 10
0
2 000
4 000
6 000
8 000
10 000
12 000
14 000
OF 19Q2 SCR 19Q2 Deduct NordeaSCR
SCR withoutNordea
Add Nordeaequity risk
Addconcentration
risk
Add spread risk SCR - Nordeaas an equityinvestment
OF - Nordea asan equity
investmentOwn funds Consolidated group SCR Nordea & other financials Changes in treatment
15 August 2019

Sampo Group Solvency Sensitivities to Market Risk Factors / 30.6.2019 (pro forma with S-II deconsolidated Nordea 5,66 EUR/sh.)
14
-20
-15
-10
-5
0
5
10
15
rates:-100 bps
rates:+100 bps
spreads:+100 bps
equity prices:-10 %
equity prices:-20 %
equity prices:-30 %
Change in Solvency Ratio (percentage points)
15 August 2019

Equity Risk and the Symmetric Adjustment (1/2)
15
• If equity risk was the only risk factor affecting Own Funds (OF) and SCR (and there would be no S-II SymmetricAdjustment), a solvency ratio (SR = OF/SCR) neutral amount of equity investments would be equal to OF.- This is because now SCR = 39%*OF and SR = OF / (39%*OF), i.e. SR would not react to changes in OF and be a constant
of 1/39% (= 256%).- If in this hypothetical example the amount of equity investments would be less than OF, the SR would rise when equities
would fall (due to the numerator in SR decreasing proportionally less than the denominator) and vice versa.- In reality there are of course other risk factors in addition to equities, and the SCR would change proportionally less than
equity prices in an equity market shock. This decreases the “SR neutral” amount of equities to being less than OF.
• However, the S-II Symmetric Adjustment (SA) increases the equity market beta of the SCR as the S-IIequity shock will be decreased when equities have fallen and vice versa. Consequently, the SR can in factoften increase when equity prices fall in a uniform fashion, as long as the SA is within its limits.
15 August 2019

Equity Risk and the Symmetric Adjustment (2/2)
16
• In order to prevent pro-cyclical behavior of equities exposures, the equity capital charge is adjusted with the SA.The calculation of the symmetric adjustment is based on the behavior of an equity index built by EIOPA exclusivelyfor that purpose. Its constituents are mostly European equity price indices.
The symmetric adjustment is detailed in the Commission Delegated Regulation 2015/35 article 172.It is described by the the following formula:
where:• CI = current value of the EIOPA equity index• AI = average value over 3 years of the EIOPA equity index
The symmetric adjustment may not be lower than -10 % or higher than +10 %.
The constant of 8% in the formula takes into account an expected growth rate in equity prices. The SA is zero when CI = 1,08*AI, i.e. when the equity markets are 8% above their 3 year moving average. With a constant price growth rate this would be achieved when annual price growth is some 5,4 %.
𝑆𝑆𝑆𝑆 =12
𝐶𝐶𝐶𝐶 − 𝑆𝑆𝐶𝐶𝑆𝑆𝐶𝐶
− 8%−10%
+10%
-10%
-8%
-6%
-4%
-2%
0%
2%
4%
6%
8%
10%
90%
100%
110%
120%
130%
140%
150%
EIOPA equity index SA
15 August 2019

Equity Risk and Nordea
17
• After S-II deconsolidation of Nordea, its shares constitute over half of Sampo Group’s equity risk exposure. If the Nordea share price movesin tandem with the equity market, its solvency impact is buffered by the SA as a part of Sampo’s overall equity exposure.
• However, to the extent that changes in Nordea’s stock price deviate from the EIOPA equity index, the SA has no buffering effect.This justifies additional solvency sensitivity analysis on the Nordea shares alone (assuming a constant end of Q2 SA of -1,72%):
100%
110%
120%
130%
140%
150%
160%
170%
180%
190%
200%
50% 40% 30% 20% 10% 0% -10% -20% -30% -40% -50%
Sam
po G
roup
pro
form
a So
lven
cy R
atio
(e
nd o
f Q2
with
S-II
dec
onso
lidat
ed N
orde
a)
Change in Nordea Share Price (vs. 5,66 EUR/sh.)
15 August 2019

18
Spread Risk and the Volatility Adjustment
• The Volatility Adjustment (VA) is an add-on adjustment to the risk-free interestrates used in valuing insurance liabilities. It mitigates the effect of short-termvolatility of bond spreads on insurers’ solvency positions. The VA, like the SA, isintended to prevent pro-cyclical investment behavior.
• When an insurer applies the VA, the basis point value of its solvency spread riskposition is given roughly by:= [𝛽𝛽𝐹𝐹𝐶𝐶 MVFI DURFI – 𝛽𝛽𝑉𝑉𝑆𝑆 PVLIAB DURLIAB]/10,000
where𝛽𝛽𝐹𝐹𝐶𝐶 = fixed income investments spread beta to market spreads𝛽𝛽𝑉𝑉𝑆𝑆 = VA beta to market spreads
The VA is calculated as 65% of the risk-corrected spreads of a reference portfolio
VA = 65%(market spreadportfolio – risk correctionportfolio)
where the risk correction represents an amount of spread not expected to be earned
A hypothetical example for a random insurer:𝛽𝛽𝐹𝐹𝐶𝐶 = 1,0𝛽𝛽𝑉𝑉𝑆𝑆 = 0,5MVFI = 20 bnPVLIAB = 20 bnDURFI = 4DURLIAB = 10
basis point value of the solvencyspread risk position = -2 m
This insurer’s solvency would benefit from a spread widening due to the VA
Without the VA, the position of this insurer would be +8 m instead of -2 m
15 August 2019

Sampo Group Solvency Sensitivities to Market Risk Factors / 30.6.2019 (pro forma with S-II deconsolidated Nordea 5,66 EUR/sh.)
Solvency II no changes rates:-100 bps
rates:+100 bps
spreads: +100 bps
equity prices: -10 %
equity prices: -20 %
equity prices: -30 %
Solvency Ratio 168 % 151 % 182 % 166 % 171 % 167 % 155 %
Change in Solvency Ratio -17 % +13 % -2 % +3 % -1 % -13 %
• From end of Q2 equity index levels the S-II Symmetric Adjustment buffers equity risk for decreases in the equity markets of up to 20%• Spread risk is buffered significantly by the S-II Volatility Adjustment applied by Mandatum and Topdanmark
19
15 August 2019

• Change of SII calculation basis as of 30th September
• FICO termination process expected to end by 6th November
• Pro forma Solvency ratio as of 30.6.2019: 168%
• Accounting loss of EUR 155m booked in Q3
• Net capital generation of appr. EUR 1 billion
• Solvency can withstand significant volatility in the Nordea share price
20
Summary
15 August 2019

Sampo plcFabianinkatu 2700100 Helsinki, Finland
Phone: +358 10 516 0100Business ID: 0142213-3
www.sampo.com@Sampo_plcsampo-plc
Analyst Day15 AUGUST 2019