Embed Size (px)
Citation preview
ANALYSIS REPORT 1 (14)
SHEET METAL CENTER 25.05.2015
REPORT 2015-23 CUSTOMER: Linnan Kehitys Oy, Rainer Jakobsson / Hovisuunnittelijat, Ari Rinne
ASSIGNMENT: Numerical Analyses of RHS Truss Joints and Lap Shear Testing of Bolt Connections for Strengthening Solution
CONTENT: 1. Introduction
2. Analysis of isolated truss joints 3. Analysis of full truss model 4. Lap shear testing of bolted connections 5. Summary 6. References
APPENDICES: A1. Design loads at ULS A2. Material model for FE analysis DATE: Hämeenlinna 25.05.2015 Zhongcheng Ma Jarmo Havula Senior Lecturer Director of Research Unit +358 50 4361383 +358 40 8241955 [email protected] [email protected] DISTRIBUTION: Customer Original HAMK Sheet Metal Centre Original
ANALYSIS REPORT 2 (14)
SHEET METAL CENTER 25.05.2015
1. INTRODUCTION
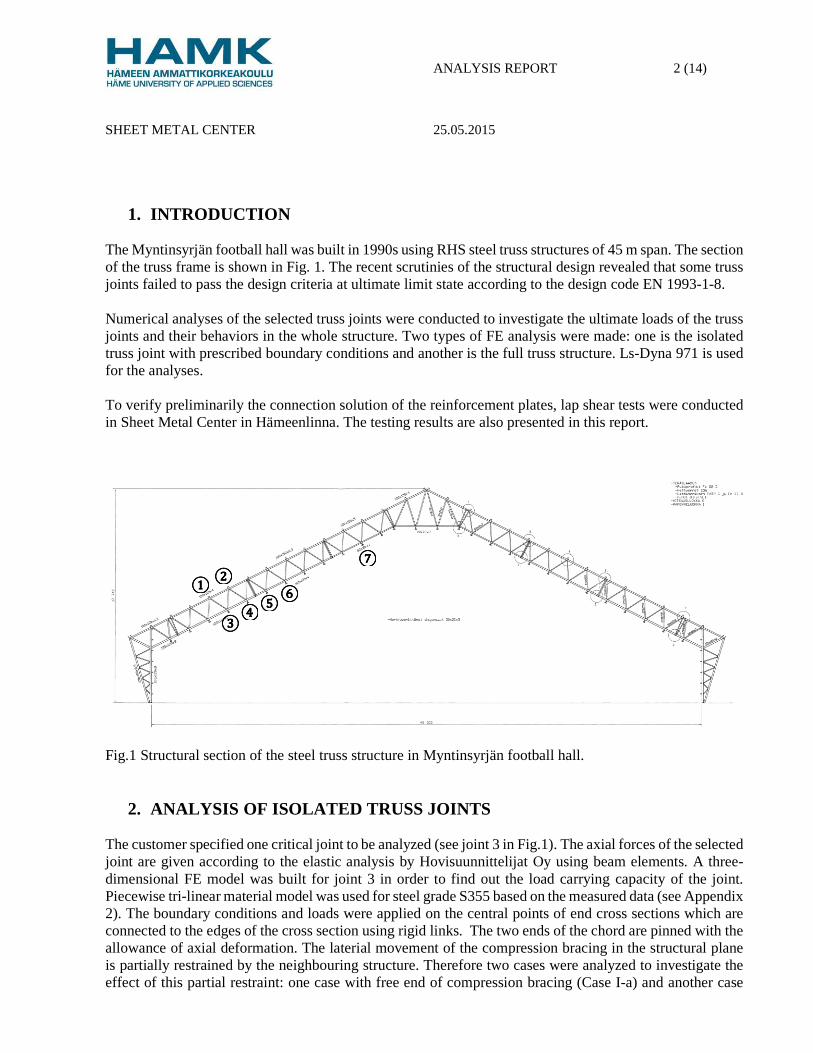
The Myntinsyrjän football hall was built in 1990s using RHS steel truss structures of 45 m span. The section of the truss frame is shown in Fig. 1. The recent scrutinies of the structural design revealed that some truss joints failed to pass the design criteria at ultimate limit state according to the design code EN 1993-1-8. Numerical analyses of the selected truss joints were conducted to investigate the ultimate loads of the truss joints and their behaviors in the whole structure. Two types of FE analysis were made: one is the isolated truss joint with prescribed boundary conditions and another is the full truss structure. Ls-Dyna 971 is used for the analyses. To verify preliminarily the connection solution of the reinforcement plates, lap shear tests were conducted in Sheet Metal Center in Hämeenlinna. The testing results are also presented in this report.
Fig.1 Structural section of the steel truss structure in Myntinsyrjän football hall.
2. ANALYSIS OF ISOLATED TRUSS JOINTS The customer specified one critical joint to be analyzed (see joint 3 in Fig.1). The axial forces of the selected joint are given according to the elastic analysis by Hovisuunnittelijat Oy using beam elements. A three-dimensional FE model was built for joint 3 in order to find out the load carrying capacity of the joint. Piecewise tri-linear material model was used for steel grade S355 based on the measured data (see Appendix 2). The boundary conditions and loads were applied on the central points of end cross sections which are connected to the edges of the cross section using rigid links. The two ends of the chord are pinned with the allowance of axial deformation. The laterial movement of the compression bracing in the structural plane is partially restrained by the neighbouring structure. Therefore two cases were analyzed to investigate the effect of this partial restraint: one case with free end of compression bracing (Case I-a) and another case
①①①①
④④④④
②②②②
③③③③
⑤⑤⑤⑤
⑦⑦⑦⑦
⑥⑥⑥⑥

ANALYSIS REPORT 3 (14)
SHEET METAL CENTER 25.05.2015
with full restraint of laterial movement perpendicular to the momber’s axial direction (Case I-b). The FE model is illustrated in Fig. 2.
Fig. 2 FE model of joint 3. The loads in the chord and bracings were applied axially and proportionally up to failure. The proportion is determined according to the internal forces at ultimate limit state based on the elastic analysis by Hovisuunnittelijat Oy. Table 1 lists the axial forces of the structural members based on the elastic analysis. Table 1 Cross section dimensions and axial forces at ULS from elastic analysis. Structural members
Chord left Chord right Compression bracing
Tension bracing
Cross section 120x120x5 120x120x5 70x70x3 50x50x3 Axial forces (kN) -828.81 -635.66 -192.65 191.76
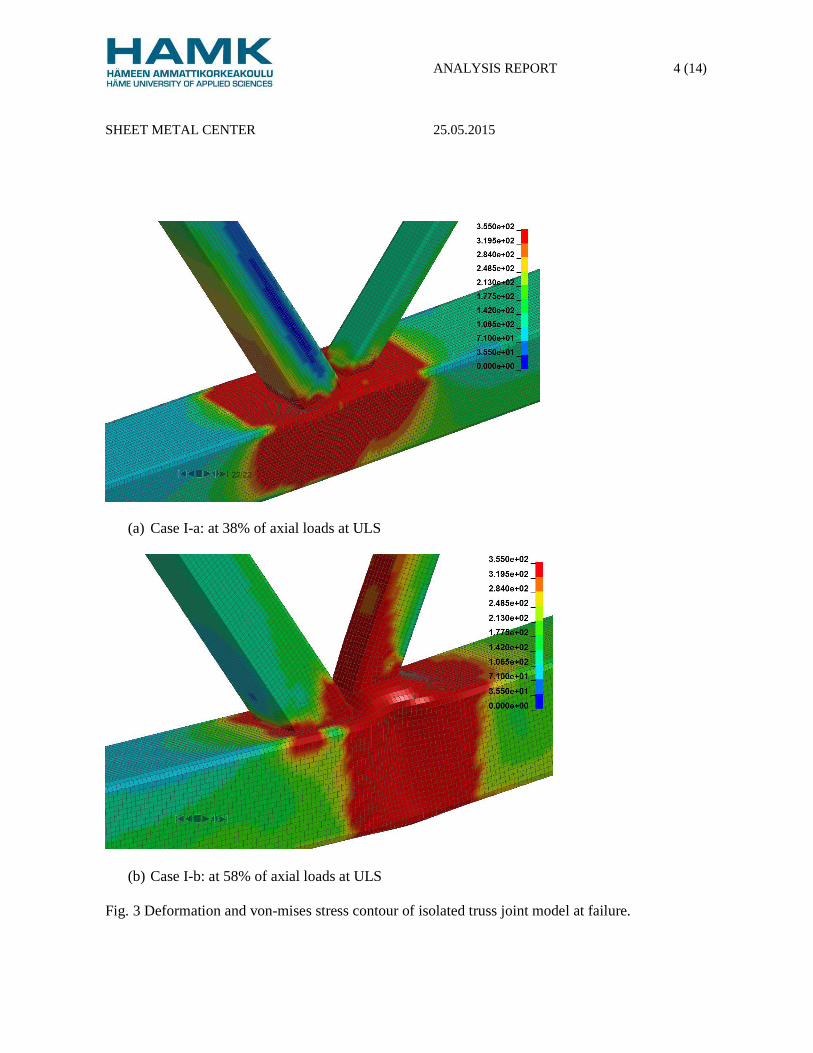
Fig. 3 illustrates the deformation and stress contour of the analyzed truss joint at failure. It can be seen that the chord face yields significantly if the compression bracing is not restrained at all. Significant displacement perpendicular to the axial direction of the compression bracing (bracing rotation) occurred prior to joint failure. The analysis shows that the failure occurs at 38% of the axial forces at ultimate limit state (ULS). If the end of compression bracing is restrained in the direction perpendicular to the member’s axis, the chord face yield in the region of tension bracing, and a shear failure occurred in the cross section of chord. In this case, the ultimate failure load is 58% of the axial forces at ULS.
Compression bracing
Tension bracing
ANALYSIS REPORT 4 (14)
SHEET METAL CENTER 25.05.2015
(a) Case I-a: at 38% of axial loads at ULS
(b) Case I-b: at 58% of axial loads at ULS Fig. 3 Deformation and von-mises stress contour of isolated truss joint model at failure.
ANALYSIS REPORT 5 (14)
SHEET METAL CENTER 25.05.2015
3. ANALYSIS OF FULL TRUSS MODEL
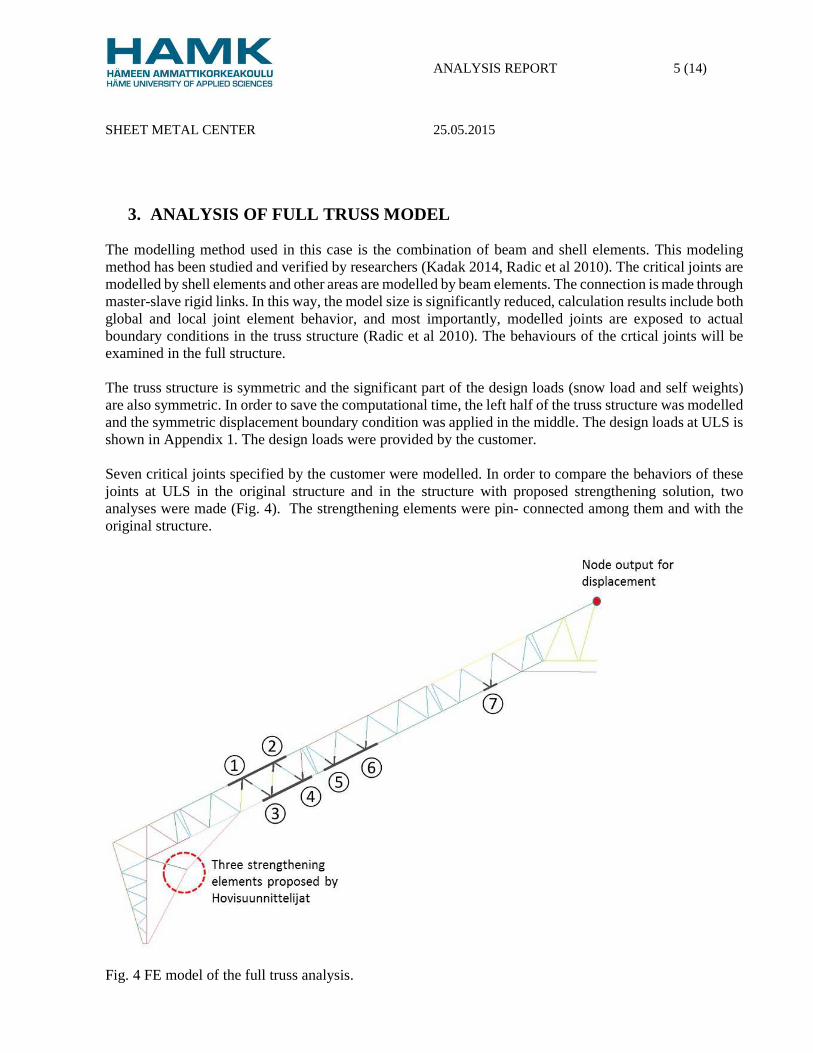
The modelling method used in this case is the combination of beam and shell elements. This modeling method has been studied and verified by researchers (Kadak 2014, Radic et al 2010). The critical joints are modelled by shell elements and other areas are modelled by beam elements. The connection is made through master-slave rigid links. In this way, the model size is significantly reduced, calculation results include both global and local joint element behavior, and most importantly, modelled joints are exposed to actual boundary conditions in the truss structure (Radic et al 2010). The behaviours of the crtical joints will be examined in the full structure. The truss structure is symmetric and the significant part of the design loads (snow load and self weights) are also symmetric. In order to save the computational time, the left half of the truss structure was modelled and the symmetric displacement boundary condition was applied in the middle. The design loads at ULS is shown in Appendix 1. The design loads were provided by the customer. Seven critical joints specified by the customer were modelled. In order to compare the behaviors of these joints at ULS in the original structure and in the structure with proposed strengthening solution, two analyses were made (Fig. 4). The strengthening elements were pin- connected among them and with the original structure.
Fig. 4 FE model of the full truss analysis.
ANALYSIS REPORT 6 (14)
SHEET METAL CENTER 25.05.2015
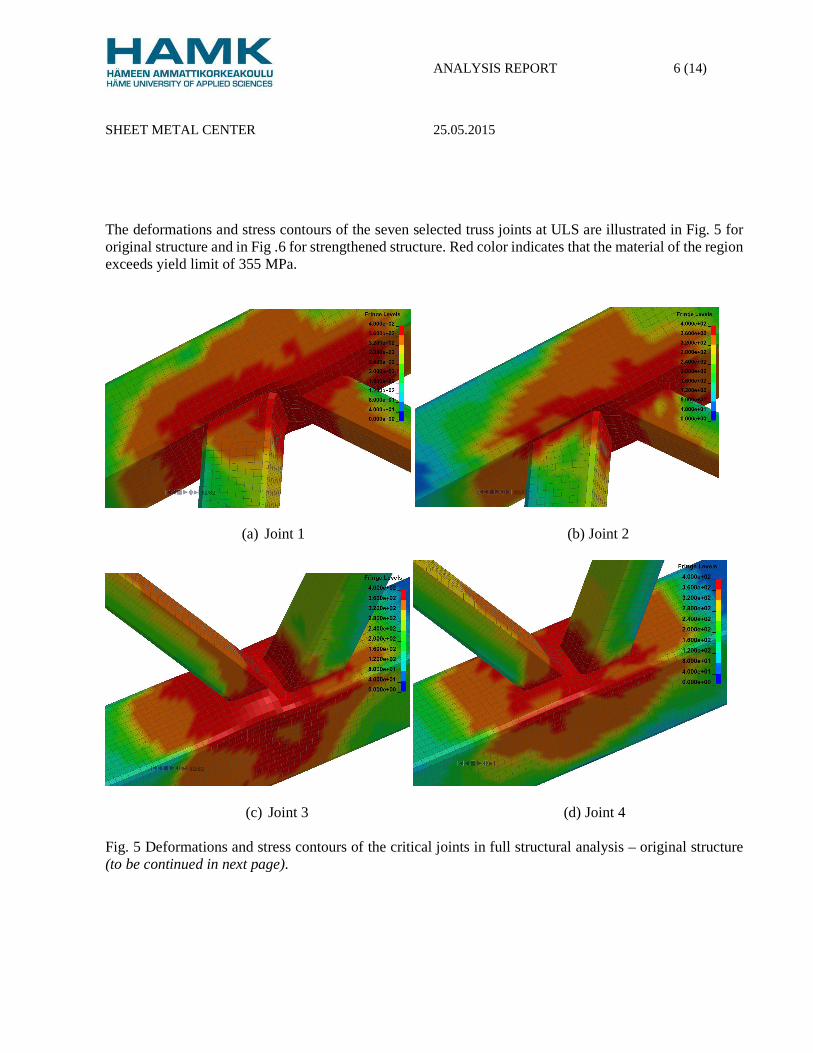
The deformations and stress contours of the seven selected truss joints at ULS are illustrated in Fig. 5 for original structure and in Fig .6 for strengthened structure. Red color indicates that the material of the region exceeds yield limit of 355 MPa.
(a) Joint 1 (b) Joint 2
(c) Joint 3 (d) Joint 4 Fig. 5 Deformations and stress contours of the critical joints in full structural analysis – original structure (to be continued in next page).
ANALYSIS REPORT 7 (14)
SHEET METAL CENTER 25.05.2015
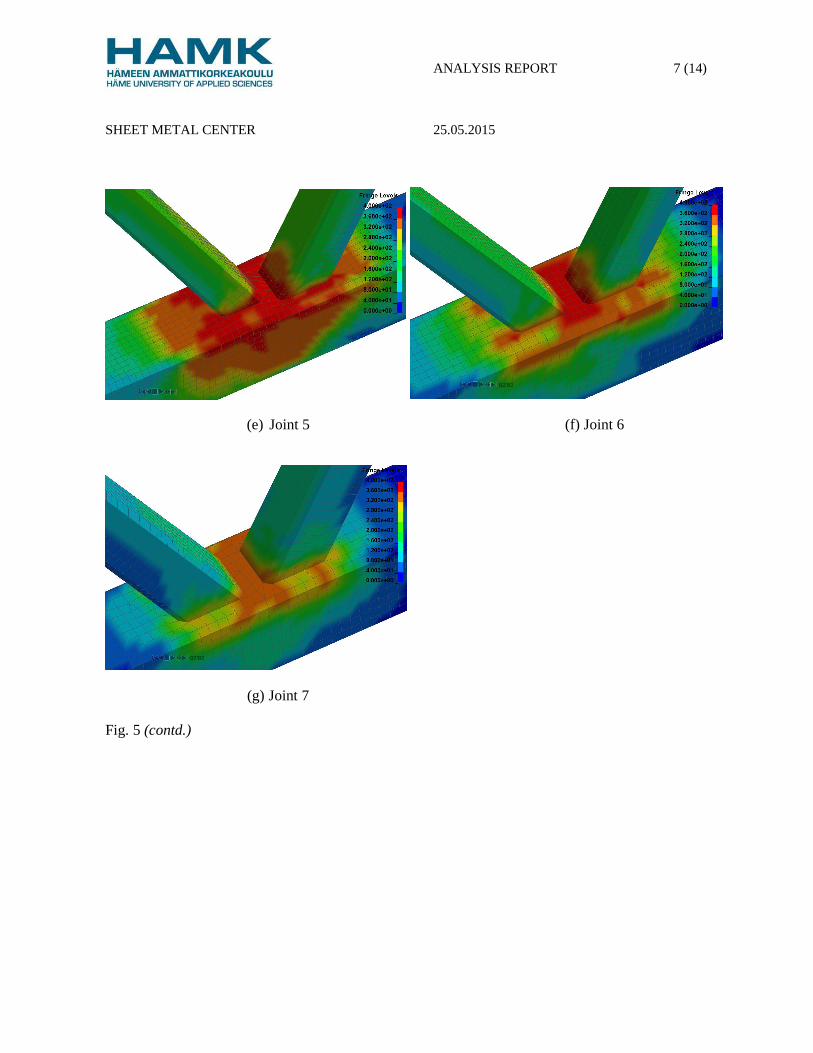
(e) Joint 5 (f) Joint 6
(g) Joint 7 Fig. 5 (contd.)
ANALYSIS REPORT 8 (14)
SHEET METAL CENTER 25.05.2015
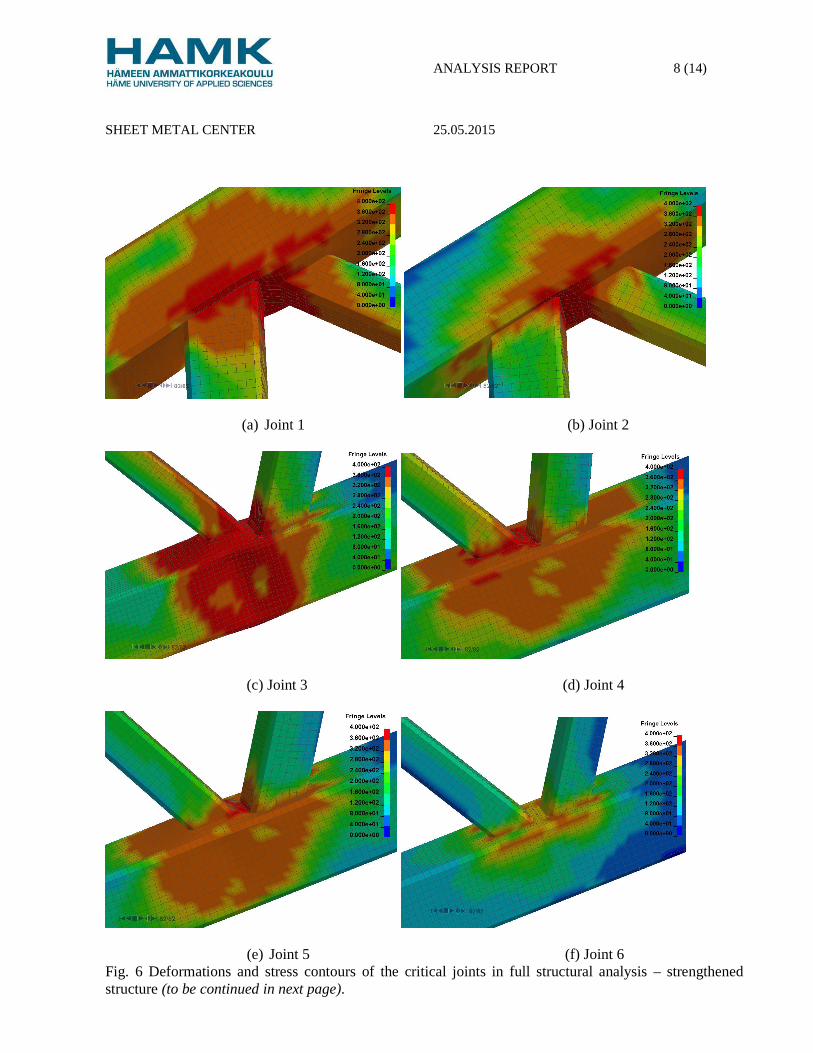
(a) Joint 1 (b) Joint 2
(c) Joint 3 (d) Joint 4
(e) Joint 5 (f) Joint 6 Fig. 6 Deformations and stress contours of the critical joints in full structural analysis – strengthened structure (to be continued in next page).
ANALYSIS REPORT 9 (14)
SHEET METAL CENTER 25.05.2015
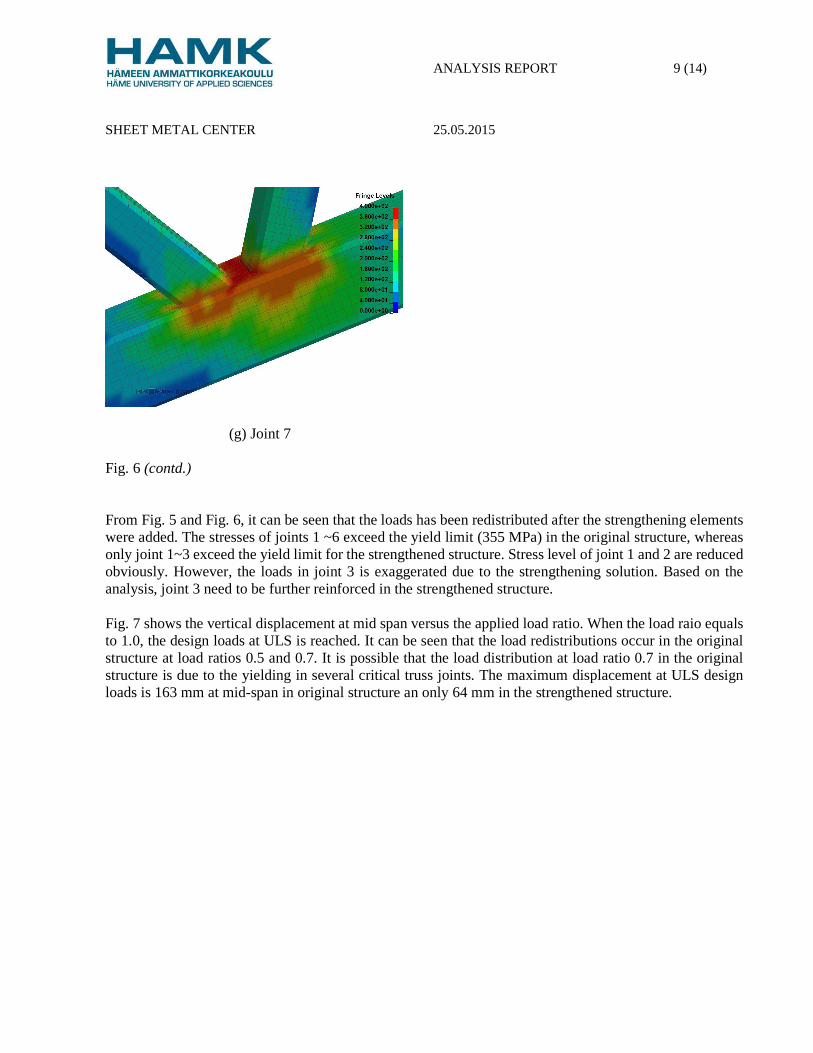
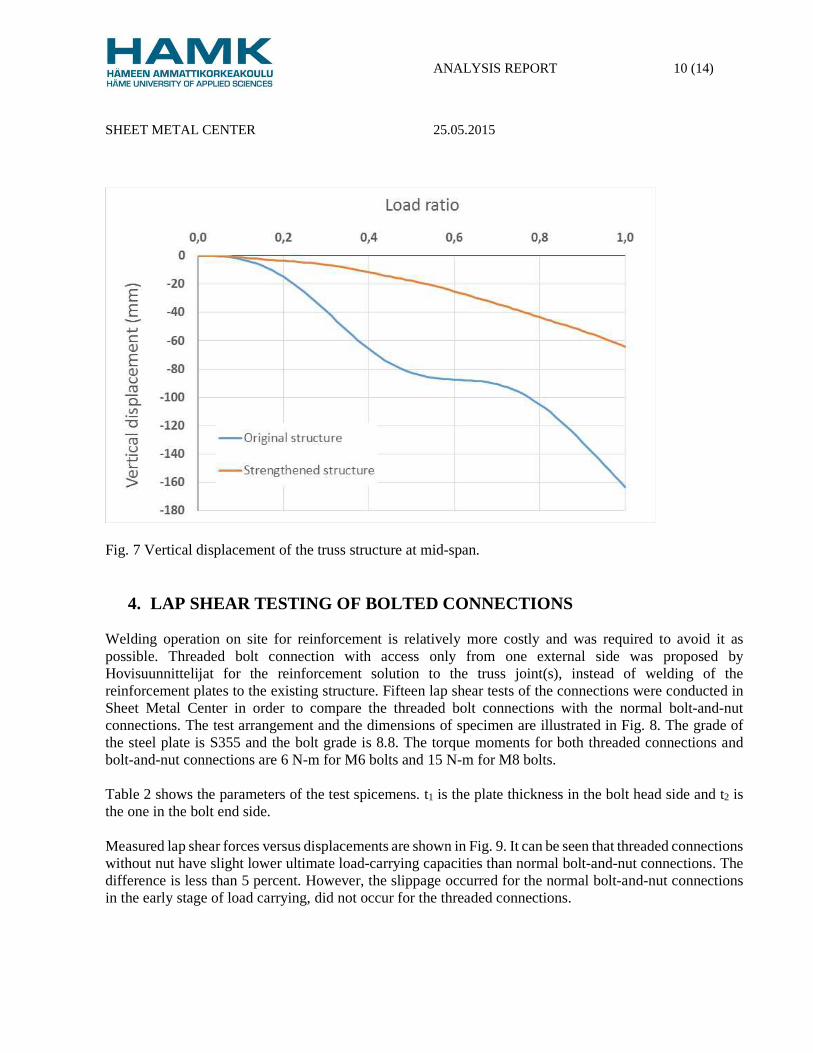
(g) Joint 7 Fig. 6 (contd.) From Fig. 5 and Fig. 6, it can be seen that the loads has been redistributed after the strengthening elements were added. The stresses of joints 1 ~6 exceed the yield limit (355 MPa) in the original structure, whereas only joint 1~3 exceed the yield limit for the strengthened structure. Stress level of joint 1 and 2 are reduced obviously. However, the loads in joint 3 is exaggerated due to the strengthening solution. Based on the analysis, joint 3 need to be further reinforced in the strengthened structure. Fig. 7 shows the vertical displacement at mid span versus the applied load ratio. When the load raio equals to 1.0, the design loads at ULS is reached. It can be seen that the load redistributions occur in the original structure at load ratios 0.5 and 0.7. It is possible that the load distribution at load ratio 0.7 in the original structure is due to the yielding in several critical truss joints. The maximum displacement at ULS design loads is 163 mm at mid-span in original structure an only 64 mm in the strengthened structure.
ANALYSIS REPORT 10 (14)
SHEET METAL CENTER 25.05.2015
Fig. 7 Vertical displacement of the truss structure at mid-span.
4. LAP SHEAR TESTING OF BOLTED CONNECTIONS
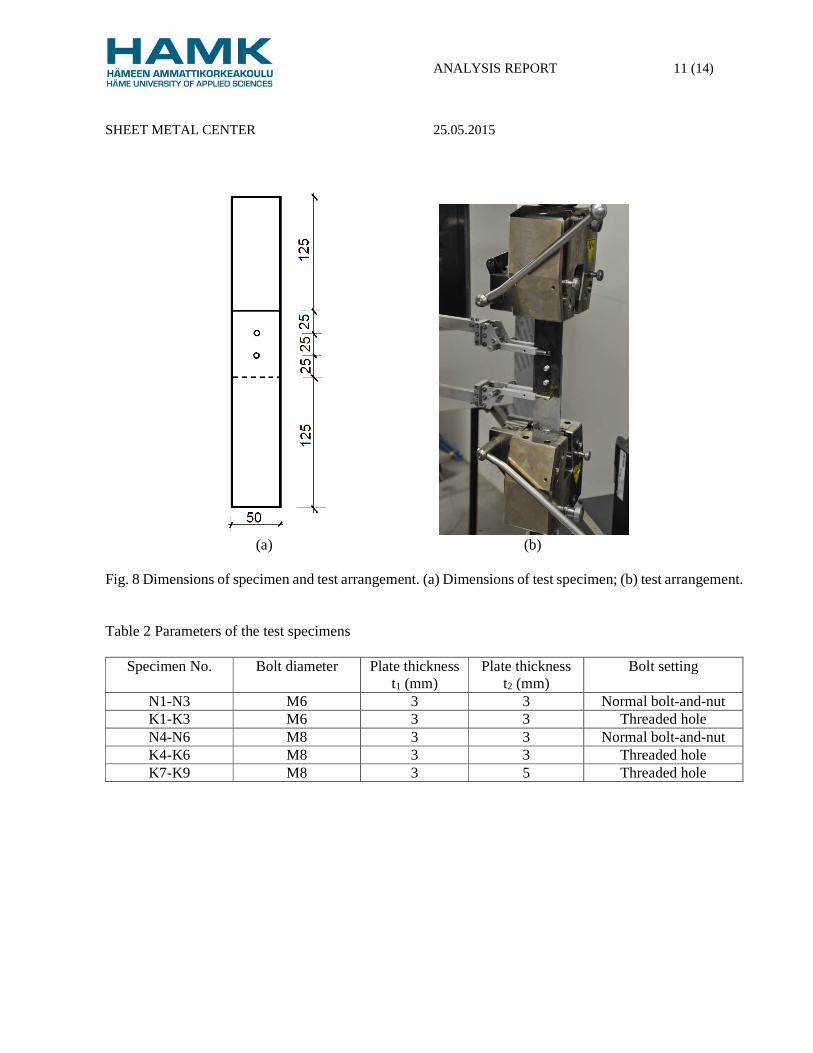
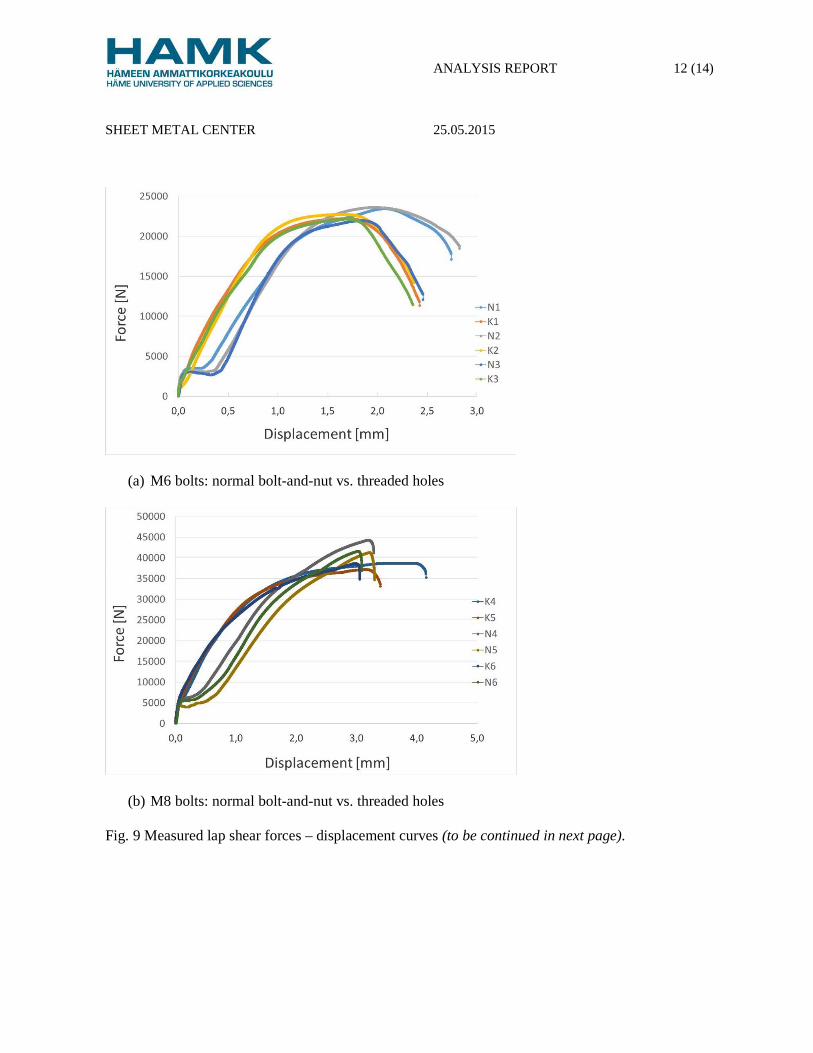
Welding operation on site for reinforcement is relatively more costly and was required to avoid it as possible. Threaded bolt connection with access only from one external side was proposed by Hovisuunnittelijat for the reinforcement solution to the truss joint(s), instead of welding of the reinforcement plates to the existing structure. Fifteen lap shear tests of the connections were conducted in Sheet Metal Center in order to compare the threaded bolt connections with the normal bolt-and-nut connections. The test arrangement and the dimensions of specimen are illustrated in Fig. 8. The grade of the steel plate is S355 and the bolt grade is 8.8. The torque moments for both threaded connections and bolt-and-nut connections are 6 N-m for M6 bolts and 15 N-m for M8 bolts. Table 2 shows the parameters of the test spicemens. t1 is the plate thickness in the bolt head side and t2 is the one in the bolt end side. Measured lap shear forces versus displacements are shown in Fig. 9. It can be seen that threaded connections without nut have slight lower ultimate load-carrying capacities than normal bolt-and-nut connections. The difference is less than 5 percent. However, the slippage occurred for the normal bolt-and-nut connections in the early stage of load carrying, did not occur for the threaded connections.
ANALYSIS REPORT 11 (14)
SHEET METAL CENTER 25.05.2015
(a) (b)
Fig. 8 Dimensions of specimen and test arrangement. (a) Dimensions of test specimen; (b) test arrangement. Table 2 Parameters of the test specimens
Specimen No. Bolt diameter Plate thickness t1 (mm)
Plate thickness t2 (mm)
Bolt setting
N1-N3 M6 3 3 Normal bolt-and-nut K1-K3 M6 3 3 Threaded hole N4-N6 M8 3 3 Normal bolt-and-nut K4-K6 M8 3 3 Threaded hole K7-K9 M8 3 5 Threaded hole
ANALYSIS REPORT 12 (14)
SHEET METAL CENTER 25.05.2015
(a) M6 bolts: normal bolt-and-nut vs. threaded holes
(b) M8 bolts: normal bolt-and-nut vs. threaded holes Fig. 9 Measured lap shear forces – displacement curves (to be continued in next page).

ANALYSIS REPORT 13 (14)
SHEET METAL CENTER 25.05.2015
(c) M8 bolt: threaded connections with t1=3mm and t2=5mm Fig. 9 (contd.)
5. SUMMARY Numerical analyses for both an isolated truss joint and seven truss joints in the full truss model were made in Sheet Metal Center of HAMK using Ls-Dyna. Failure load was found by the numerical analyses for the isolated joint, and the behaviours of seven selected truss joints were further examined in the full truss model. The details of truss joints were modeled using shell elements and the other structural members were modelled using beam elements. Rigid links were used for the connections between the beam elements and 3D shell elements in the corresponding regions. Non-linear FE analyses reveal that the load-carrying capacity of joint 3 is 38~58% of the axial design loads at ULS from 1D elastic analysis, depending on the supporting condition of the free end of the compression bracing member. The behaviors of seven truss joints were analyzed for the cases of original structure and strengthened structure. Analysis showed that there were insufficient load-carrying capacities in the truss joints 1 to 6 of original structure and significant yielding occurred at the ULS loads. For the strengthened structure, the stresses in the selected truss joints were reduced obviously, except that stress in joint 3 were exaggerated. Based on the analysis, truss joint 3 in the strengthened structure need to be reinforced. Fifteen lap shear tests were conducted in Sheet Metal Center in order to compare the threaded bolt connections with the normal bolt-and-nut connections. Testing results showed that the ultimate loads for threaded connections were slightly lower than normal bolt-and-nut connections, but the deformation behavior was improved and no slippage occurred in the early stage of loading.

ANALYSIS REPORT 14 (14)
SHEET METAL CENTER 25.05.2015
6. REFERENCES
Kadak, J. (2014). Effect of steel strength on the welded joint between a plate and two tubular cross-sections. Master Thesis at Aalto University. Available from: https://aaltodoc.aalto.fi/handle/123456789/13489. [Accessed on 25.5.2015] Radic, I., Markulak, D. and Mikdin, M. (2010). Design and FEM modeling of steel truss girder joints. Strojarstvo, 52 (2): 125-135.
ANALYSIS REPORT 1 (2)
SHEET METAL CENTER 25.05.2015
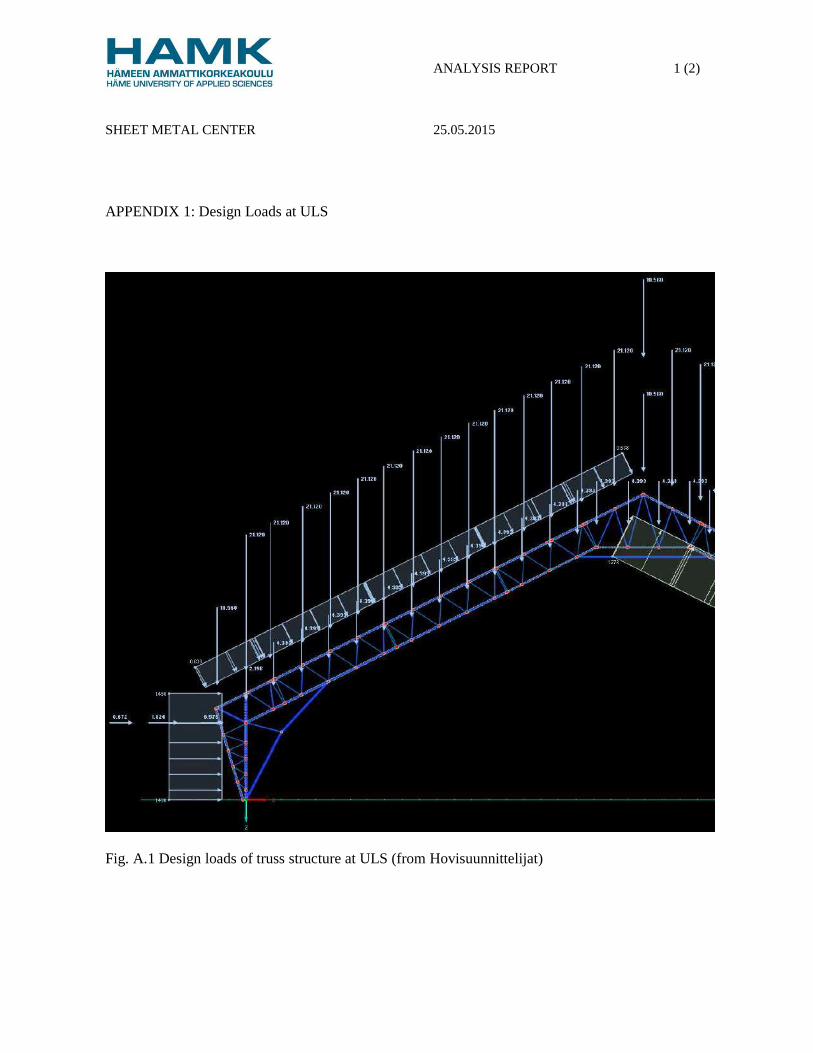
APPENDIX 1: Design Loads at ULS
Fig. A.1 Design loads of truss structure at ULS (from Hovisuunnittelijat)
ANALYSIS REPORT 2 (2)
SHEET METAL CENTER 25.05.2015
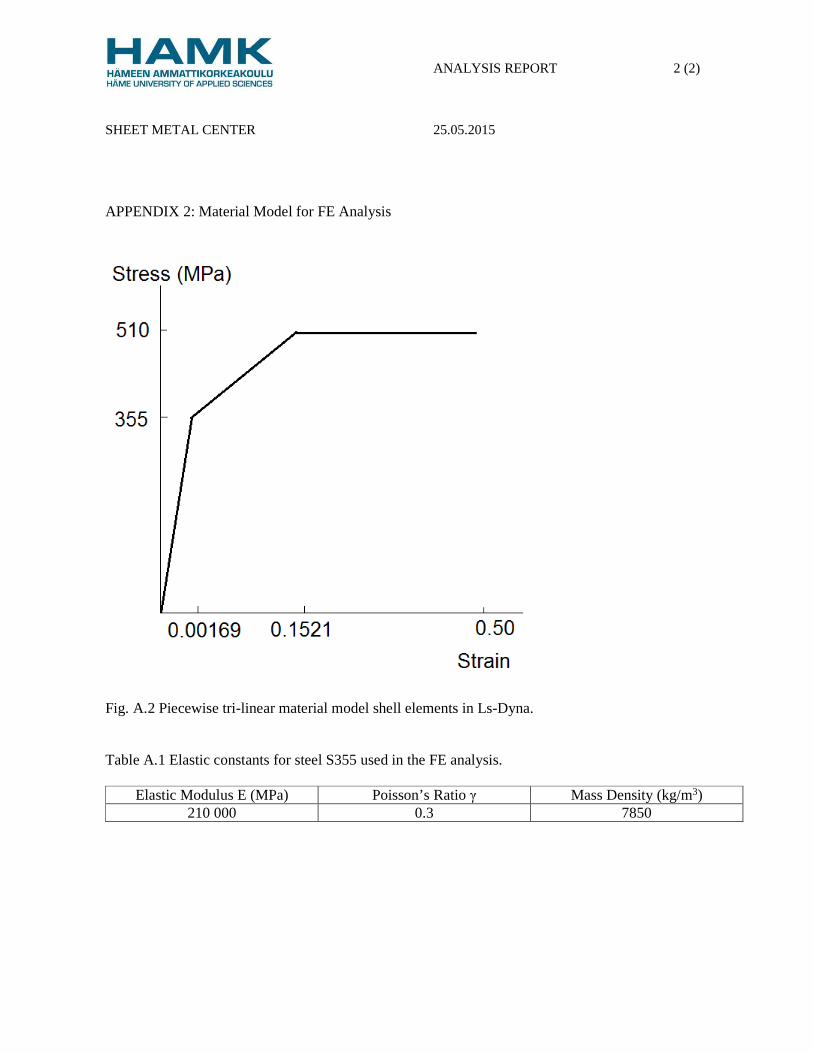
APPENDIX 2: Material Model for FE Analysis
Fig. A.2 Piecewise tri-linear material model shell elements in Ls-Dyna. Table A.1 Elastic constants for steel S355 used in the FE analysis.
Elastic Modulus E (MPa) Poisson’s Ratio γ Mass Density (kg/m3) 210 000 0.3 7850


![09 Truss Analysis[1]](https://img.dokumen.tips/doc/110x75/545e3836b1af9f7c648b48ce/09-truss-analysis1-558450d9e30b6.jpg)


