Embed Size (px)
Citation preview
ANALYSIS ON NOISE DISTRIBUTION AT DIFFERENT MONORAIL STATION
IN KUALA LUMPUR
AHMAD ARIF BIN ALIAS
A dissertation report submitted in partial
Fulfillment of requirement for the award of
Master of Science in Railway Engineering
Centre of Graduate Studies
Universiti Tun Hussein Onn Malaysia
JUNE 2015

vi
ABSTRACT
Railway services in Malaysia has grown rapidly over the past decades. At present the
noise level problems in the stations area created uncomfortable condition to consumers.
This dissertation focusses on the monitoring of noise level in selected monorail station
areas in Kuala Lumpur. The objective of the project was to monitor the noise levels at
the selected station. The two selected station were Maharajalela Station, and Titiwangsa
Station. Sound Level Meter (SLM) was used in the measurements. For each station, data
was collected during day (09:00 am – 04:30 pm) and evening (08:30 pm – 11:00 pm) for
three days. The measurements were taken at an interval of one second at appropriate
points in accordance with Department of Environment Malaysia Standard. It should be
noted that monitored noise levels were in terms of (Leq), maximum noise level (Lmax),
and Minimum noise level (Lmin) around the platform area. Noise levels at Titiwangsa
Station were higher than Maharajalela Station. Result shows, at Maharajalela station, the
noise level ranged between 71 dB(A) to 75 dB(A). Besides that, at Titiwangsa station,
noise levels ranged between 73 dB(A) to 76 dB(A). The SPL’s generated have exceeded
the recommended level, which is 70 dB(A) by the Department of Environment (DOE).
For each point at MHJS and TTS during daytime, the maximum noise levels happened
by seconds only. Even though it happened for a while, it does effects users, especially
children and elderly people. It was found that, one of the main factors that contribute to
this station noise is noise released by the movement of traffic under the station. As a
result of this research, some suggestions on how to control the noise generated in the
monorail station are drawn. Appropriate materials that can absorb noise generated at the
station should be installed, especially at the waiting area/platform. Other than that,
always ensure that the brake system of the monorail is maintained properly.

vii
ABSTRAK
Perkhidmatan keretapi di Malaysia telah pesat membangun sejak sedekad yang lalu.
Pada masa sekarang masalah bunyi yang terhasil di stesen, telah menimbulkan keadaan
yang kurang selesa dikalangan pengguna. Disertasi ini memberi tumpuan kepada tahap
bunyi di dua buah stesen monorel terpilih di Kuala Lumpur. Objektif projek ini adalah
untuk memantau tahap bunyi di stesen yang dipilih. Kedua-dua stesen yang dipilih
adalah Stesen Maharajalela dan Stesen Titiwangsa. Sound Level Meter (SLM) telah
digunakan sebagai alat mencerap bunyi. Bagi setiap stesen, data diambil antara waktu
siang (09:00 pagi – 04:30 petang) dan malam antara (08:30malam – 11:00 malam), ini
menepati kaedah yang digariskan oleh Bahagian Persekitaran, Jabatan Sumber
Semulajadi dan Persekitaran Malaysia. Perlu diketahui, tahap bunyi berterusan (Leq),
tahap bunyi maksimum (Lmax), dan tahap bunyi minimum (Lmin) dicerap untuk
mendapatkan menilai nilai bunyi yang dihasilkan di stesen. Keputusan menunjukkan
bahawa tahap bunyi di stesen Maharajalela adalah antara 71 dB (A) sehingga 75 dB (A),
dan di stesen Titiwangsa adalah antara 73 dB (A) sehingga 76 dB (A ). Keputusan yang
diperoleh mendapati, ia melebihi tahap yang disyorkan oleh Jabatan Alam Sekitar (JAS)
iaitu 70 dB (A). Bagi setiap titik pengukuran di stesen Maharajalela (MHJS) dan stesen
Titiwangsa (TTS), ia mendapati nilai cerapan bunyi tinggi berlaku hanya pada masa
yang singkat. Walaupun bunyi dihasilkan pada masa yang singkat ini, ia boleh memberi
kesan kepada pengguna, terutamanya kanak-kanak dan orang tua. Antara faktor utama
yang menyumbang kepada bunyi di stesen ini adalah bunyi yang dikeluarkan oleh
pergerakan lalu lintas di bawah stesen, selain daripada bunyi dari sistem penghawa
dingin, Selain itu, bunyi daripada sistem penghawa dingin (HVAC) dan apabila

viii
penggunaan “parking brake” antara penyumbang bunyi di stesen. Hasil daripada kajian
ini, beberapa cadangan bagi mengurangkan bunyi bising di stesen dicadangkan.
Antaranya, dengan pemasangan bahan yang boleh menyerap bunyi di stesen,
terutamanya di kawasan tempat menunggu/platfom. Selain daripada itu, mesti
memastikan sistem brek monorel diselenggara dengan baik.

xv
LIST OF TABLES
2.1 Background Noise Level Correction 7
2.2 Examples of Sound Pressure Levels in Relation To Hearing
Threshold and Pain Threshold 9
2.3 Addition of Sound Level 12
2.4 WHO Recommended Guideline Values for Community
Noise in Specific Environments Data Selected 19
2.5 Duration (in hours) of Allowable Exposures Based on
OSHA and NIOSH criteria 20
2.6 Detailing the Maximum Sound Level of Trains Including Transit 22
2.7 Noise Level Guideline by Each Organization 24
2.8 Several Previous Studies 25
2.9 Average User OD Matrix KL Monorail August 2008 29
2.10 Average Satisfaction and Handling Priority for Various Factors. 30
3.1 Procedure Detail. 39
3.2 List of Devices Used 46
3.3 Specification for TES-1358 Sound Analyzer 47
3.4 Specification for Distance Meter - Leica DISTO X310 laser 48
4.1 Difference T.N and B.N at MHJS during Daytime 52

xvi
4.2 Difference after T.N minus B.N at MHJS during Daytime 53
4.3 Noise Level after Correction at MHJS during Daytime 53
4.4 Average Noise Level at MHJS during Daytime 54
4.5 Difference T.N and B.N at MHJS during Evening Time 54
4.6 Difference after T.N minus B.N at MHJS during
Evening Time 55
4.7 Noise Level after Correction at MHJS during
Evening Time 55
4.8 Average Noise Level at MHJS during Evening Time 55
4.9 Difference T.N and B.N at TTS during Daytime 56
4.10 Difference after T.N minus B.N at TTS during Daytime 57
4.11 Noise Level after correction at TTS during Daytime 57
4.12 Average Noise Level at TTS during Daytime 57
4.13 Difference T.N and B.N at TTS during Evening Time 58
4.14 Difference after T.N minus B.N at TTS during Evening Time 58
4.15 Noise Level after Correction at TTS during Evening Time 59
4.16 Average Noise Level at TTS during Evening Time 59
4.17 Noise Level after Correction at MHJS during Day and
Evening Time 59
4.18 Noise Level after Correction at TTS during Day and
Evening time 60
4.19 Summary of Noise Level at MHJS and TTS during Day and
Evening Time 60

xvii
4.20 Different Noise Level at both Station 62
4.21 Result Noise Level Type Test (Static Test –Interior Noise) 67
4.22 Material used for both Stations 67
4.23 Noise Level Difference at MHJS (Day and Evening) 76
4.24 Noise level Difference at TTS (Day and Evening) 77

xviii
LIST OF FIGURES
2.1 Typical Classifications of Sound Events - Steady,
Intermittent, Time-Varying and Impulsive Sounds 9
2.2 Graph for Adding Decibel 11
2.3 Graph for Subtracting Decibel 13
2.4 Elevated Side Platform Station Layout 16
2.5 Elevated Station with Ticket Hall below Platform Layout 17
2.6 Technical Section Detail (Station) 18
2.7 The Increasing Number of Users of KL Monorail 29
2.8 Arrangements of Sound Sources at the (a) Center (b) End of
the Platform, and Images of the Setup at the (c) Center
and (d) End of the Platform 33
2.9 Cross-sectional designs of the above-ground stations
[with (a) Side and (b) Island Platforms] and Underground
Stations [with (c) Side and (d) Island Platforms] 34

xix
2.10 Receiver Positions in (a) Side and (b) Island Platforms in the
Underground Stations 35
3.1 Safety Vest and Caution Tape was Used 41
3.2 Monorail Map 42
3.3 Titiwangsa Station 43
3.4 Maharajalela Station 43
3.5 Location of Each Point at the Platform Area 44
3.6 (1) HVAC System, (2) Door, (3) Gangway 44
3.7 Location Devices at Platform 45
3.8 Detail Drawing of the 2 Car Train; (1) HVAC System
, (2) Door, (3) Gangway 46
3.9 TES-1358 Sound Analyzer 47
3.10 Distance Meter 48
3.11 Flowchart for MHJS Analysis 49
3.12 Flowchart for TTS Analysis 49
4.1 Station Expansion Project 61
4.2 Obstacle at the End of the Platform TTS 61
4.3 Obstacle at the End of the Platform MHJS 61
4.4 Average Noise Level Differences between MHJS and TTS 63
4.5 MHJS with PAGS and TTS without PAGS 64
4.6 Noise Level at MHJS (with PAGS) and TTS (without PAGS) 64
4.7 Road Traffic at the TTS and MHJS 65
4.8 Graph T.N at Platform B.N Different at Platform and
Road Traffic Noise at MHJS 66

xx
4.9 Difference between B.N and T.N at point 1 MHJS (Daytime) 70
4.10 Difference between B.N and T.N at point 2 MHJS (Daytime) 71
4.11 Difference between B.N and T.N at point 3 MHJS (Daytime) 72
4.12 Difference between B.N and T.N at point 1 TTS (Daytime) 73
4.13 Difference between B.N and T.N at point 2 TTS (daytime) 74
4.14 Difference between B.N and T.N at point 3 TTS (daytime) 75

xxi
LIST OFABBREVIATION
ATP Automatic Train Protection
dB(A) A-Weighted decibel
DOE Department of Environment
DOSH Department of Occupational Safety and Health
EDT Early Decay Time
EIA Environmental Impact Assessment
ERL Express Rail Line
EPA Environmental Protection Agency
EQATS Engineering Quality Assurance Technical Services
EU European Union
FMA Factories and Machinery Act
HVAC Heating Ventilating Air Conditioning
IPA Importance Performance Analysis
IRWN International Workshop on Railway Noise
ISO International Organization for Standardization
KLMFEP Kuala Lumpur Monorail Fleet Expansion Project
KTMB Keretapi Tanah Melayu Berhad
LRT Light Rail Transit

xxii
MHJS Maharajalela Station
MRT Mass Rapid Transit
NIOSH National Institute of Occupational Safety and Health
NIHL Noise-Induced Hearing Loss
OD Origin-and-Destination
OSHA Occupational Safety and Health Administration
PEL Permissible Exposure Limit
REL Recommended Exposure Limit
SCADA Supervisory Control and Data Acquisition
SLM Sound Level Meter
SPAD Suruhanjaya Pengangkutan Awam Darat
SPNB Syarikat Prasarana Negara Berhad
SPSS Statistical Packages for the Social Science
SPL Sound Pressure Level
STAIRRS Strategies and Tools to Assess and Implement
Noise Reducing Measures for Railway Systems
TTS Titiwangsa Station

xxiii
LIST OF APPENDICES
A Method of Statement 86
B Work Site Permit 91
C Example Data Sheet Form 92
D Sample of Data Obtain 93
E1 Reading Noise Level at MHJS (Day – Point 1, 2, 3) 95
E2 Reading Noise Level at MHJS (Evening – Point 1, 2, 3) 96
F1 Reading Noise Level at TTS (Day – Point 1, 2, 3) 97
F2 Reading Noise Level at TTS (Evening – Point 1, 2, 3) 99
G Graph Temperature and Humidity 101
H Diffraction Explanation 102

CHAPTER 1
INTRODUCTION
1.1 Introduction
Malaysia is approaching one of the developed countries status by 2020. The
transportation sector is one of the fastest growing service sectors in Malaysia. The
transportation is a basic necessity in life, whether private or public usage. Public
transport is one of the alternatives in the ownership of the vehicle itself. Where it helps
to reduce traffic congestion, reduce the cost of living in the paying car loans, able to
save the environment by saving energy and reducing the consumption of fuel. Today our
country has a wide range of public transport that can be an option for some users in the
city, such as in Malaysia, Kuala Lumpur. We can use bus, taxi, monorail, train,
commuter, Light Rapid Transit (LRT), planes and ferries.
Rail service in Malaysia began to grow rapidly over the past one decade, when it
was first built to transport tin. Starting with Keretapi Tanah Melayu (KTM) in year 1886
[1], LRT network then began to operate in 1998 in conjunction with the Commonwealth
in Bukit Jalil, Kuala Lumpur. In 2002 the Express Rail Line (ERL) service was
introduced, and later in 2003 monorail service was launched. At present, the Mass Rapid
Transit (MRT) project is in progress and is expected to operate in January 2017 [2].

2
As a result of the rapid development in the rail transportation sector, people
living in the city has to face the impacts of the development, especially related to their
daily and night activities.
Basically in Malaysia, the studies about the transportation noise are more related
to road traffic noise. The railway noise generally and monorail in particular, the research
is relatively new in this country.
1.2 Problem Statement
The study by previous researcher, conducted by Noor Hafiza [3], showed that the
highest noise level generated inside the monorail was 77 dBA, compared to other rail
transport system.
The questionnaire study Consumers Satisfaction Of Public Transport In Kuala
Lumpur Monorail User conducted by Amsori Muhammad Das and others [4], the level
of comfort when boarding the train was in a less comfortable position and he suggested
to improve passenger comfort when using the monorail.
This becomes a major factor for the researchers to carry out studies on the sound
produced. This study focuses only on the noise generated at the train station. From the
meetings and discussions together with the Engineering Quality Anssurance Technical
Servives (EQATS) group under Monorail line Management. It is one of the department
under Mnagement of Monorail line. It was agreed that, the primary sources that generate
noise are from the Heating, Ventilation and Air-Conditioning (HVAC), Compressor and
noise from breaking system. The secondary noise was produced by the announcement,
passenger conservation, and audio speaker.

3
1.3 Objective
The main objectives of this research are:
1. To determine the noise level at the platform areas while train passing the
monorail stations.
2. To analyze the noise distribution inside the monorail stations.
3. To propose suitable method to reduce noise level at the monorail stations.
1.4 Scope
The scopes of this research are:
1. The study on noise distribution is involved only at two different monorail station
in Kuala Lumpur which are Maharajalela Station and Titiwangsa Station.
2. Determine the reasons why level of noise produce in the both stations vary.
3. Determine the effect to the passengers due to noise exposure at the station.
4. Compare the noise level at selected monorail station with standard that has been
issued by Department of Environment (DOE) Malaysia.
5. Give suggestions how to reduce level of noise resulting from the stations
involved.
1.5 Significant of Research
This research was performed to help the EQATS to identify the noise level emitted by
the various type of monorail and noise distribution for both monorail stations more
accurately. Besides that, this is to ensure the resulting noise level in the station complies
with the standards provided by Department of Environment (DOE) Malaysia or not. This
research is important to monitor the effects of noise pollution on the daily lives of train

4
passengers and staff for the both station. In addition, the results of this study should
serve as a warning to other agencies that build new transit lines or stations in highway
median.
1.6 Limitations
Like every research conducted, there are some constraints that cannot be avoided that
affect the research. In this research, there were some constraints noted during this
research listed below:
i. Background noises of station expansion works at stations, that indirectly
interfered with the retrieval of data.
ii. The variety of measured noises of monorail trains, where each train
produces a unique noise levele based on its maintance schedual, thus
reading had to be averaged in order to obtain reliable data. this is due to
the itinerary set by the monorail operation. The itinerary varies depending
on the monorail.
1.7 Research Organization
This research paper has been divided into five chapters. Chapter one has provided the
background to the research, problem statement, objectives, scopes, significant of
research and limitations during this research. Chapter two provides some fundamental
concepts about noise, and provides an overview of on-going directions in goal-driven
research. This chapter also traces the previous studies and also some basic of the noise.
Chapter three deals with the research methodology. This is followed by Chapter four,
which provides an analysis of the noise distribution. This chapter also discusses other
factors that affect noise distribution. Finally in this research concludes with
consideration of the suggestions and recommendation for future research initiatives, all
presented in Chapter five.

CHAPTER 2
LITERATURE REVIEW
2.1 Introduction
There are several ways to reduce the noise impact to the user, which is modify the paths
by which the noise travels through the air to the people exposed, such as use barriers and
screens to block the direct path of sound at the platform station. This can helps to reduce
the noise produced by a train directly to consumers. The effects of unpleasant noise can
cause psychological disorders to consumers, resulting in emotional distress when at
workplace and will greatly affect the quality of work produced.
In this study, several monorail stations were selected to analyze the sound level,
by using sound analyzer and compare the noise level that produce by both stations with
the standard that has been issued by Department of Environmental (DOE) Malaysia.
With the existence of this study, it can assist a company which involved in the
construction of railway stations, reduce sound produced.
In this section, the context of previous research and scholarly material pertaining
to the topic, it is also presents a critical synthesis of empirical literature according to
relevant themes or variables. The entire variable related to this study was justified in this
chapter.

6
2.2 Noise
Any sound that is undesired by the recipient. It is an unavoidable part of our daily lives
and has increasingly become a major burden on the quality of lives. Noise pollution is
defined as a form of air pollution that is an audible unwanted sound that poses a threat to
a persons and well-being [5,6]. Noise pollution can be from simple sources such as an
air conditioner, traffic, a loud radio, human conversation, traffic, a dog barking, to more
complex machinery such as large trucks and airplanes [7]. In this study, the source of the
sound is from the monorail, this raises an uncomfortable situation to consumers when
the train arrived until depart from the station.
2.2.1 Noise Descriptor
The universal descriptor used for environmental noise is the A-weighted sound level. It
describes the level of noise measured at a receiver at any moment in time and is read
directly from noise monitoring equipment [8].
2.2.2 Decibel (dBA)
The decibel (dB) is a unit used to measure sound intensity and other physical quantities
[9]. A decibel is one tenth of a bel (B), a unit named after Graham Bell, the inventor of
the telephone.
The decibel of sound pressure level (dB SPL) takes as a reference the minimum
sound pressure level that the average human ear can detect. The lowest audible sound to
humans is typically 0 dB SPL (hearing threshold). In practice, “dB” often stands for “dB
SPL”.

7
Because the decibel scale is logarithmic, a three-decibel increase in sound level
already represents a doubling of intensity. For example, a normal conversation may be
about 65 dB and someone shouting can typically be around 80dB. The difference is only
15 dB but the shouting is 30 times as intensive.
The perception of loudness is not exactly the same as sound pressure level. To
account for the fact that are particularly low and high-pitched sounds appear less loud to
the human ear, noise is usually measured in A-weighted decibels dB(A).
2.2.3 Background noise
A description of the ambient or background noise (excluding the rail activity under
dispute) at the noise receptor(s) must be included in the assessment. In the absence of
adequate justification of background noise levels through ambient noise monitoring, the
background noise may be estimated by the use of known baseline levels from areas of
similar acoustical environments. Table 2.1 below shows the background noise level
correction [10].
Table 2.1: Background Noise Level Correction [10]
Total Noise Level(dB)
minus Background Noise Level (dB)
Value to subtract from Total Noise
Level to get noise
due to the source
8 – 10 0.5
6 – 8 1
4.5 – 6 1.5
4 - 4.5 2
3.5 2.5
3 3
2 4
1 7
2.2.4 Environmental noise
Environmental noise is a major issue in most countries, especially in areas of high
population, and the sources of noise and their adverse effects on our wellbeing are
varied. In terms of assessing the impact of these issues, it need to be able to make

8
suitable noise measurements, or in some cases, monitor the noise levels for longer
periods.
2.2.5 Equivalent Continuous Sound Pressure Level, Leq
This is a widely used noise descriptor that is commonly adopted in many developed
countries. It is the constant noise level which, under a given situation and time period,
contains the same acoustic energy as the actual time-varying noise level. As Leq
measures the energy content of a noise over a period of time, noise with different
characteristics, such as fluctuating like from traffic or impulsive noise like from
hammering as described in the next section, can give the same Leq Level. When noise or
sound is measured in dB(A), it is customary to denote the equivalent continuous sound
pressure level as LAeq [11]. Calculations are mainly performed in decibels, mainly for
addition, averaging, and subtraction.
2.3 Category of Sound
Sounds are generally classified in the following categories [10]:
a. Steady sound levels (such as ventilation equipment associated with railway
infrastructures).
b. Steady, but intermittent sound levels (such as idling of trains on a main track)
c. Time-varying sound (such as individual pass-by or several pass-by over a
specific time period).
d. Impulsive sound signals that may include one or more impulses (such as train
shunting, coupling, stopping, starting, and so on).
The type of sound has a bearing on how it is to be measured, what type of sound
level meter setting should be used, and what descriptors and other data should be

9
presented. Figure 2.1 illustrate typical classifications of sound level events: steady,
intermittent, time-varying, and impulsive sounds.
Figure 2.1: Typical Classifications of Sound Events - Steady, Intermittent, Time-
Varying and Impulsive Sounds [10]
2.4 Noise Level
In the logarithmic scale the range of human ear’s audible sounds is from 0 dB SPL
(hearing threshold) to 120-140 dB SPL (pain threshold), as shown in the Table 2.2
below.
Table 2.2: Examples of sound pressure levels in relation to hearing threshold and pain
threshold [10]
Item dB
Hearing threshold 0 dB
Leaves fluttering 20 dB
Whisper in an ear 30 dB
Normal speech conversation for a participant 60 dB
Cars/vehicles for a close observer 60-100 dB
Airplane taking-off for a close observer 120 dB
Pain threshold 120-140 dB
10
The range of human ear’s audible sounds goes from 0 dB SPL (hearing
threshold) to 120-140 dB SPL (pain threshold).
2.5 Cause of Noise
Railway operational noise originates from a number of sources. This include the engines
and cooling fans of trains, the under-floor engines of “diesel multiple units”, gears,
aerodynamic effects at higher speeds, and the interaction of wheels and rails [12]. The
latter source tends to have an influence on overall noise levels at speeds above 50 km/h
and is normally predominant at speeds above around 100 km/h.
Rolling noise results from the vibration excitation of the wheels and track as the
wheel rolls on the rail. The excitation is provided by the combined surface roughness at
the interface, or “contact patch”, between the wheel and the rail. Because the entire
wheel and track system is excited by the combined roughness at the interface, it is this
combined value that determines the level of rolling noise rather than the individual rail
and wheel roughness components.
2.6 Noise Calculation
Sound level is generally expressed in decibels. Equation below show how sound level
calculated [12]:
L = 10 log10(∑10(Li/10)
) (2.1)
Lpi = Instantaneous sound pressure level unit dB(A)
11
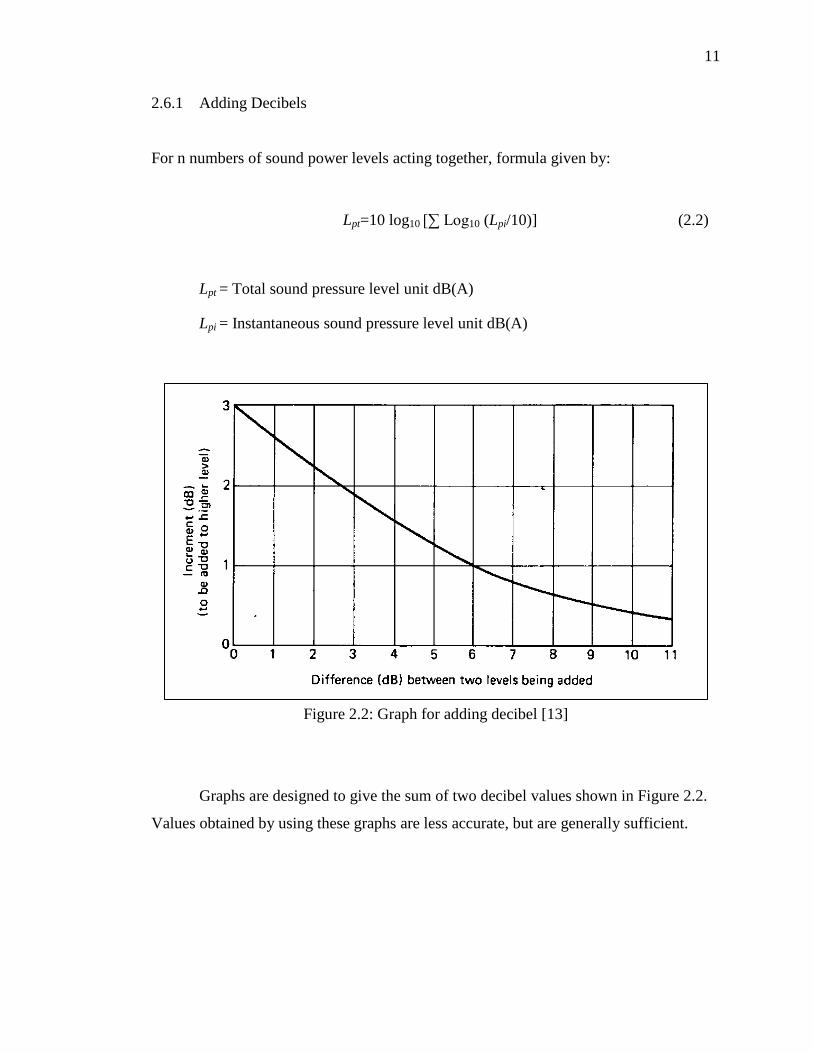
2.6.1 Adding Decibels
For n numbers of sound power levels acting together, formula given by:
Lpt=10 log10 [∑ Log10 (Lpi/10)] (2.2)
Lpt = Total sound pressure level unit dB(A)
Lpi = Instantaneous sound pressure level unit dB(A)
Figure 2.2: Graph for adding decibel [13]
Graphs are designed to give the sum of two decibel values shown in Figure 2.2.
Values obtained by using these graphs are less accurate, but are generally sufficient.

12
Table 2.3: Addition of sound level [14]
Different between the two level Add to higher level
0 3
1 2.5
2-3 2
4 1.5
5-7 1
8-9 0.5
≥ 10 0
2.6.2 Averaging Decibels
It follows from equation that the time average decibel level, Lp, is given by:
Lpt=10 log10[(1/n)∑ Log10 (Lpi/10)] (2.3)
Lpt = Total sound pressure level unit dB(A)
Lpi = Instantaneous sound pressure level unit dB(A)
n = Total number of reading
2.6.3 Subtracting Decibels
In certain instances, it is desirable to subtract an ambient or background sound pressure
level from a total measured level. This allows one to determine the sound pressure level
produced by a particular source. In general, it is not possible to make meaningful
measurements of sound pressure level unless the background sound pressure level is at
least 3 dB(A) below the level of the source under consideration. The sound pressure
level due to the machine is:
Lps = 10 log10 [log-1(Lpt/10) - log-1(Lpb/10)] (2.4)
Lpt = Total Sound Pressure Level unit dB(A)
Lpb= Background Sound Pressure Level unit dB(A)

13
Figure 2.3: Graph for subtracting decibel [13]
Figure 2.3 above are graph to help the subtraction of decibel values. In case the
background noise level is close to or even greater than the sound level of the source,
more advanced methods which measure sound intensity have to be used for analysis of
sound power.
2.7 Health Effects of Noise Exposures
Several studies have shown that, excessive noise from transport modes can lead to sleep
disturbance and other health impacts, not just annoyance. Recent research by WHO in
year 2011, Bluhm in 2007, Muzet in 2007, and Grazulevicien in 2004, supports earlier
findings that the shorter-term health effects of sleep disturbance due to excessive noise
exposure can affect quality of life during the subsequent waking hours. Symptoms may
include fatigue, moodiness, irritability, headaches, stomach upsets, lack of concentration
14
and reduced work ability, but these symptoms can be associated with many other causes.
These shorter-term effects do not appear to be reduced through repeated exposure and
habituation [14].
There is also evidence that noise has an effect on children’s learning ability. The
study reported that children exposed to high levels of environmental noise may display
sustained and visual attention deficits, difficulty concentrating, reduced auditory
discrimination and speech perception, poorer memory that requires high processing
demands of semantic material, and reduced reading ability and school performance on
national standardized tests.
2.8 Monorail
The KL Monorail is a straddle system and the guideway runs mainly above the median
of main roads in KL's central business district. Since it has to pass through very
developed and expensive areas, a monorail running over the median of public main
roads was the most cost-effective construction choice.
Kuala Lumpur Monorail started with the construction of building facilities and
runway depot building a monorail aboveground (elevated) along the 8.6 km. The
maximum speed is 80 km/h. Consisting of eleven station stops extending from the first
station KL Sentral in Brickfields which is across the golden triangle and ends up
Titiwangsa is eleventh station in Jalan Tun Razak [8]. Therefore, the system can operate
at a headway of 2.5 minutes. Each car has 24 seats and each two-car train can carry 107
people. To assure absolute safety, the driver-only trains are supervised by an Automatic
Train Protection (ATP) system at all times.
The stations are constructed mostly from lightweight materials making maximum
use of precast concrete components and fabricated steel assembled off-site. With a
platform length of 40 m, each station can accommodate trains of up to four cars in
length. The 750-Vdc power for traction is drawn from the national power grid,
transformed, rectified and supplied to power rails.

15
The signalling system uses bi-directional fixed blocks with both trackside and
cab signals for extra safety. The Supervisory Control and Data Acquisition (SCADA)
and associated systems are managed from an operation control room in an operations
control centre.
Project transportation spends of RM 1,180 million and started operating on
August 31, 2003 by the KL Infrastructure Group Company which holds the concession
for 40 years operating monorail from the royal government of Malaysia. On May 15,
2007 with the financial crisis in the company, KL Monorail was taken over by Syarikat
Prasarana Negara Berhad (SPBN), a Government Company under the Ministry of
Finance, it subsequent operation carried out by KL Star Rail Sdn Bhd.
2.9 Station Description
In this study, the type of station involved is elevated station, where elevated station is
divided into two types, namely types Elevated Station with Side Platforms and Elevated
Station with Ticket Hall Platforms Below. The major difference between the two
stations is position of the ticket counter, where the Elevated Station ticket Hall with
below platforms, ticket counters at the top of the platform, while the Elevated Station
ticket Hall with below platforms, ticket is under the platform [15]. More information
about both the station will be described in the next section.
2.10 Side Platform
A side platform is a platform positioned to the side of a pair of tracks at a railway
station. A pair of side platforms is often provided on a dual track line with a single side
platform being sufficient for a single track line.

16
2.10.1 Elevated Station with Side Platforms
In the example Figure 2.4 below, elevated railways are still popular in cities, despite
their history of noise creation and generally unfriendly environmental image. The poor
image has been considerably reduced with modern techniques of sound reduction and
the use of reinforced and pre-stressed concrete structures. They are considerably cheaper
than underground railways (at least half the price, sometimes considerably less than that)
and can be operated with reduced risk of safety and evacuation problems. Modern
elevated railways have been built in such cities as Miami, Bangkok, Manila and
Singapore.
Figure 2.4: Elevated Side Platform Station Layout [15]
2.10.2 Elevated Station with Ticket Hall below Platforms
In the example illustrated immediately above, the ticket office and gate lines are below
the platform level. This can be done to allow one ticket office to serve both platforms
but it requires the space to be available below track level and this, in turn, requires
enough height in the structure. Since many stations are built at road intersections, the
location of the station structure might have to permit road traffic to pass beneath it and
this requires an adequate height structure to be built. It is sometimes better to position

17
the structure to one side of the road intersection to allow room below for the ticket
office.
Figure 2.5: Elevated Station with ticket Hall below Platform Layout [15]
For this study, the type of station that will be studied is an elevated station with
the ticket hall below the platform, the Figure 2.6 below shows a more detailed layout for
one the station, which is the ticket counter under the station, it make easy to operator to
serve both platform.
Figure 2.6: Technical Section Detail (Station)
Ticket
Counter

18
2.11 Institution that Governs Noise Exposure
2.11.1 The World Health Organization (WHO)
The World Health Organization has intensively addressed the problem of community
noise. In 1992, WHO Regional Office for Europe convened a task force meeting which
set up health-based guidelines for community noise (Berglund et al, 1999), aimed at
serving as the basis for deriving noise standards within a framework of noise
management. Table 2.4 below shows the guideline values for selected environments
[16].
Table 2.4: WHO recommended guideline values for community noise in specific
environments data selected from Berglund et al (1999) [16]
Specific environment Critical health effect(s) Leq
(dB) Time-base (h) LAmax (dB) (fast)
Outdoor living area Moderate annoyance,
daytime and evening
55 16 -
50 16 -
Dwelling, indoors
Speech intangibility and
moderate annoyance, daytime
and evening
35 16 -
Inside bedrooms
Outside bedrooms
Sleep disturbance, night time 30 8 45
Sleep disturbance, window
open (outdoor value) 45 8 60
Hospitals, wardrooms,
indoor
Sleep disturbance, night time 30 8 40
Sleep disturbance, day time
and evening 30 16 -
Industrial, Commercial,
shopping and traffic areas,
indoors and outdoors
Hearing Impairment 70 24 110
Ceremonies, Festivals
And entertainment event Hearing Impairment 100 4 110

19
2.11.2 Occupational Safety and Health Administration (OSHA) and National Institute
for Occupational Safety and Health (NIOSH)
Occupational Safety and Health Administration (OSHA) is part of the U.S. Department
of Labor and it is responsible for developing and enforcing workplace safety and health
regulations. The OSHA standard carries behind it the force of law and employers in the
industrial sector are bound to comply with it. Those employed in mining, railroad, coast
guard, military, and construction are bound by their own standards.
NIOSH is part of the Centers for Disease Control and Prevention in the U.S.
NIOSH conducts research and provides information, education, training, and
recommendations regarding occupational safety and health. As such, NIOSH is in a
position to recommend standards and best practices, but it is not in a position to regulate
or enforce standards. Damage risk criteria provide the basis for recommending noise
exposure limits based on noise level and exposure time. Duration (in hours) of allowable
exposures based on OSHA and NIOSH criteria is shown in Table 2.5 below..
Table 2.5: Duration (in hours) of allowable exposures based on OSHA and NIOSH
criteria [17]
Level
in dBA 85 88 90 92 94 95 100 105 110 115
OSHA,
PEL 16 8 4 2 1 0.5 0.25
NIOSH 8 4 1 0.25
*PEL = Permissible Exposure Limit; REL = Recommended Exposure Limit.
OSHA permits exposures of 85dB(A) for 16 hours per day. Table 2.5 are
assumed to have equal risk to each other. That is, 16 hours at 85 dB carries the same
auditory risk as 8 hours at 90 dB, 4 hours at 95 dB, 2 hours at 100 dB, and so on.
NIOSH recommends an exposure limit of 85 dB(A) for 8 hours per day. The
time/intensity values shown on the NIOSH REL line in Table 2.5 are assumed to have
equal risk to each other. That is, 8 hours at 85 dB carries the same auditory risk as 4
hours at 88 dB, 2 hours at 91 dB, and so on.

20
The differences in OSHA criteria and NIOSH recommendations for exposure
limits produce different outcomes. There is the more lenient OSHA values allow for
higher exposures for longer durations and the more conservative NIOSH values
recommend lower exposures for shorter durations. The NIOSH values are based on
scientific studies relating noise exposure to hearing loss, and are more protective of
hearing. It should be noted that both standards are based on the assumption that the
noise occurs as part of a work environment, and both assume non-occupational quiet.
That is, the limits are based on an 8-hour workday.
2.11.3 Department of Occupational Safety and Health (DOSH)
The Department of Occupational Safety and Health (DOSH) is a department under the
Ministry of Human Resources, Malaysia. Which department is responsible for ensuring
the safety, health and welfare of people at work as well as protecting other people from
the safety and health hazards arising from the activities sectors which include:
a) Manufacturing
b) Mining and Quarrying
c) Construction
d) Hotels and Restaurant
e) Agriculture, Forestry and Fishing
f) Transport, Storage and Communication
g) Public Services and Statutory Authorities
h) Utilities - Gas, Electricity, Water and Sanitary Services
i) Finance, Insurance, Real Estate and Business Services
j) Wholesale and Retail Trades
As a government agency, the department is responsible for the administration
and enforcement of legislations related to occupational safety and health of the country,
with a vision of becoming an organization which leads the nation in creating a safe and
healthy work culture that contributes towards enhancing the quality of working life [18].

21
Sources of noise in workplace include lift trucks, compressors and conveyor
systems. Such sources may give rise to potentially hazardous levels of noise which can
cause incurable hearing damage. Noise at work can cause other problems such as
disturbance, interference with communication and stress.
It is an obligation on all employers to reduce the risk of damage to the hearing of
their employees from exposure to noise to the lowest level reasonably practicable. There
are three action levels of noise defined in the Regulations:
(a) First Action Level -a daily personal noise exposure (LEP,d) of 85 dB(A).
(b) Second Action Level -a daily personal noise exposure (LEP,d) of 90 dB(A).
(c) Peak Action Level -a peak sound pressure of 200 Pascals (140 dB).
As a rough guide the First Action Level is likely to be reached when peoples
speaking normally have difficulty in being heard clearly by someone who is about two
meters away. The employers are required to take certain basic steps where an employee
is likely to be exposed to noise at or above the First Action Level. These steps together
with additional action must also be taken where an employee is likely to be exposed at
or above the Second or Peak Action Level.
2.11.4 Department of Environment (DOE)
In Malaysia, Environmental Quality Act 1974 enforced by the Department of
Environment (DOE). It generally gives importance to noise which are spread into
environment from building, factory and contraction site. Planning Guidelines and
Limitations Sound Control (Department of Environment Malaysia, 2004b) detailing the
maximum sound level for a project planned. Maximum Equivalent sound level (Leq)
limited of trains including transit (for new construction and realignment ) shown in the
Table 2.6 below [19].

22
Table 2.6: Detailing the maximum sound level of trains including transit [19]
Land use category Daytime
7:00am-10:00pm (dBA)
Nighttime
10:00pm-7:00am (dBA)
Lmax
(Day and Night)
Noise sensitive areas , areas
of deployment , low density 60 50 75
Suburban and urban
settlement 65 60 80
Commercial , business 70 65 80
Industry 75 65 N/A
2.11.5 Factories and Machinery Act (FMA)
Factories and Machinery Act (FMA) is to provide the control of factories on matters
relating to the safety, health and welfare of persons, and the registration and inspection
of machinery. As Stated in Section 9, Factories and Machineries (Noise Exposure)
Regulations, 1989 (FMA 1989) [20]. An Employer shall carry out initial noise
monitoring at workplace and must comply with the following limits:
Action level - 85 dB(A)
PEL (Permission Exposure Level) - 90 dB(A)
Maximum at any Time - 115 dB(A)
Initial Noise Monitoring limited to one or more representative employee from
group of employee performing same work. The Monitoring would be carried out
according to DOSH Requirement As per Factories and Machineries (Noise
Exposure) Regulations, 1989. Assessment must carried out by DOSH Registered
Noise Monitoring Competent Person. The Noise survey should cover all possible
noise source (Machines), Area (Working Sections) and Employee Noise Monitoring.
2.11.6 International Organization for Standardization (ISO)
There are two ISO standards that refer by the researcher. It is based on Noise Level Type
Test procedure, document number KLMFEP-RST00-TT0003, conducted by Scomi Rail
Bhd [21].
23
2.11.6.1 ISO 3095: 2005 - Railway applications Acoustics - Measurement of noise
emitted by railroad vehicle
ISO 3095:2005 specifies the conditions for obtaining reproducible and comparable
measurement results of levels and spectra of noise emitted by all kinds of vehicles
operating on rails or other types of fixed track, except for track maintenance vehicles in
operation. It is applicable to type testing and periodic monitoring testing. The results
may be used, for example, to characterize the noise emitted by these trains, to compare
the noise emission of various vehicles on a particular track section, and to collect basic
source data for trains.
2.11.6.2 ISO 3381: 2005 - Railway applications Acoustics - Measurement of noise
inside rail bound vehicles
ISO 3381:2005 specifies the conditions for obtaining reproducible and comparable
measurement results of levels and spectra of noise inside all kinds of vehicles on rails or
other types of fixed track, except for track maintenance vehicles in operation. It is
applicable to type testing and periodic monitoring testing. The results may be used, for
example, to characterize the noise inside these vehicles and to compare the internal noise
of various vehicles on a particular track section.
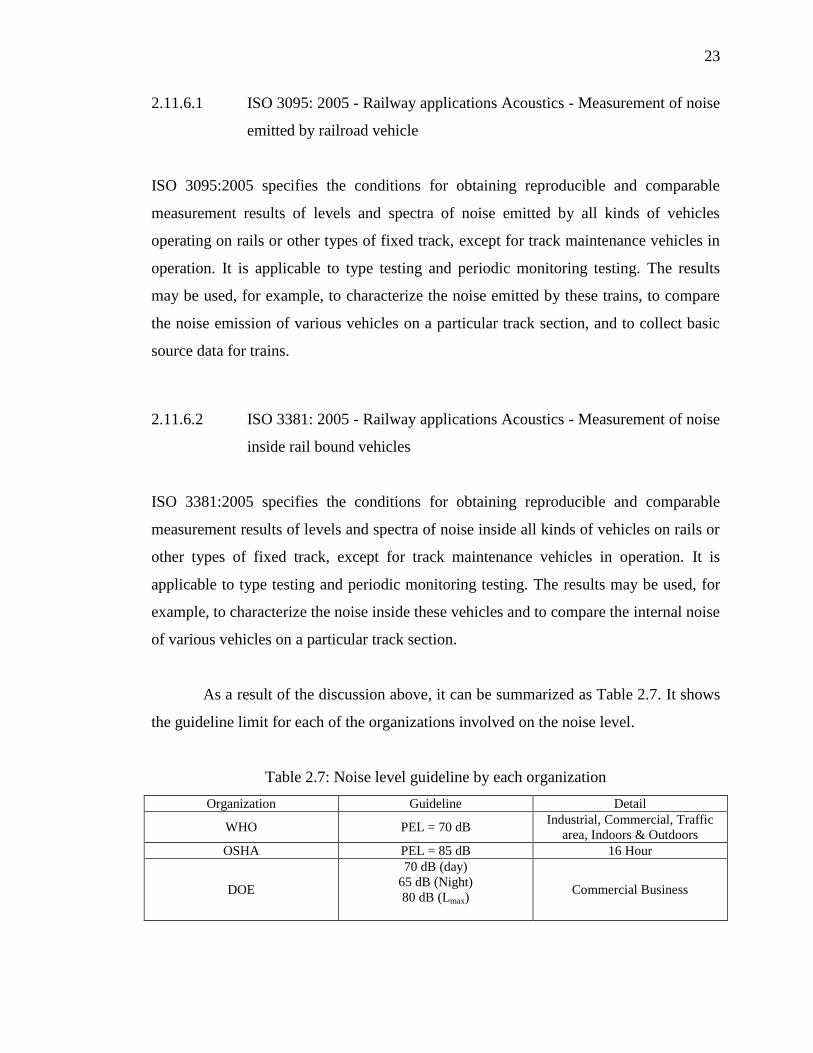
As a result of the discussion above, it can be summarized as Table 2.7. It shows
the guideline limit for each of the organizations involved on the noise level.
Table 2.7: Noise level guideline by each organization
Organization Guideline Detail
WHO PEL = 70 dB Industrial, Commercial, Traffic
area, Indoors & Outdoors
OSHA PEL = 85 dB 16 Hour
DOE
70 dB (day)
65 dB (Night)
80 dB (Lmax)
Commercial Business

24
Table 2.7: Noise level guideline by each organization (continue)
FMA
Action Level = 85 dB
PEL= 90 dB
Max. at any time = 115 dB
Permissible Exposure Limit
NIOSH REL = 85 dB 8 Hour
PEL = Permissible Exposure Limit, REL = Recommended Exposure Limit
2.12 List of Previous Study
Some previous studies used as reference for this research. Table 2.8 shows the previous
study.
Table 2.8: Several previous study that related to this research study:
No Title Year Author
1. Railway noise levels, annoyance and
countermeasures in Assiut, Egypt 2004 Sayed Abas Ali
2. Railway environmental noise control in
China 2006 Gu Xiaoan
3. Study of noise level in railway station 2005 V. Kanakasabai, G Sethilkumar,
E Chandrasekar
4.
Consumers Satisfaction Of
Public Transport
Monorail User In Kuala Lumpur
2013
Amsori Muhammad Das
Mohd Azizul Ladin
Amiruddin Ismail
Rizaatiq O.K. Rahmat
5. Urban Transportation: Issue and Solution 2008 Haryati Shafii Sharifah Meryam
Shareh Musa
6. Developing noise control strategies for
entire railway networks 2006 Jakob Oertli
7.
Sound field characteristics of underground
railway stations – Effect of interior material
and noise source position
2012 Ryota Shimokura, Yoshiharu
Soeta
8.
Characteristics of train noise in above-
ground and underground station with side
and island platforms.
2010 Ryota Shimokura, Yoshiharu
Soeta
9. Pilot Survey of Subway & Bus Stop Noise
Level 2006 Robyn R.M. Gershon
10. Passenger Exposure To Noise at Transit
Platforms in Los Angeles 2012 Alexander Schaffer
11. Change of acoustic characteristics caused
by screen doors in train stations 2011
Ryota Shimokura, Yoshiharu
Soeta
12. Problems of Railway Noise—A Case Study 2011
Małgorzata Szwarc, Bożena
Kostek, Józef Kotus, Maciej
Szczodrak, Andrzej Czyżewski
13.
Analisis dan kajian penentuan Parameter
Tahap Keselesaan di dalam Koc bagi sistem
transit rel yang berbeza
2014 Noor Hafiza Binti Nordin

REFERENCES
[1] Mohd Firdhaus Mohd Sahabuddin (2012). The Evolution of Railway Station in Kuala
Lumpur. University of Edinburgh: Research report.
[2] Leong Shen Li (October 2013). MRT News, Volume 2, issues 4, retrieve from
http://www.mymrt.com.my/download/newsletter/MRTnewsletter-OCT2013-ENG.pdf.
[3] Noor Hafiza Binti Nordin (2014). Analisis dan Kajian Penentuan Parameter Tahap
Keselesaan di dalam Koc bagi Sistem Transit Rel yang Berbeza. Universiti Tun Hussein
Onn Malaysia: MSc. Dissertation.
[4] Amsori Muhammad DAS, et al (2013). Journal of Engineering Science and Technology,
Consumers Satisfaction of Public Transport Monorai User in Kuala Lumpur.
Vol. 8, (No. 3), 272 – 283.
[5] Goines, L, Hagler, L. (March, 2007). Noise Pollution: A Modern Plague. Southern
Medical Journal. 100(3):287-293.
[6] Regecova, V, Kellerova, E. (1995). Effects of urban noise pollution on blood pressure
and heart rate in preschoo children. Journal of Hypertension, 13, pg 405-412.
[7] Isabelle Lane, Noise Pollution, MPHP 439, Case Western Reserve University,
http://www.cwru.edu/med/epidbio/mphp439/noise_pollution.pdf.
[8] (April, 2007). Interim Guideline for the Assessment of Noise from Rail Infrastructure
Projects, Department of Environment and Climate Change NSW, retrieved from
http://www.epa.nsw.gov. au /resources/noise/07187rninfra.pdf.

83
[9] European Commission (September, 2008). Scientific Committee on Emerging and Newly
Identified Health Risks Potential health risks of exposure to noise from personal music
players and mobile phones including a music playing function, retrieved from
http://ec.europa.eu/health /opinions /en/hearing -loss-personal-music-player-mp3/l-3/2-
sound-measurement-decibel.htm.
[10] Minister of Public Works and Government Services Canada (August 2011). Railway
Noise Measurement and reporting Methodology, Canadian Transportation Agency.
Retrieve from https://www.otc-cta.gc.ca/eng/railway_noise_measurement.
[11] Environmental Protection Department (1997). Annex 13 in Technical Memorandum on
Environmental Impact Assessment (Environmental Impact Assessment Ordinance. Cap.
499, S16). EPD-HKSAR, Hong Kong.
[12] L.C. (Eelco) den Boer, A. (Arno) Schroten (August 2007). Traffic noise reduction in
Europe Health effects, social costs and technical and policy options to reduce road and
rail traffic noise. Code 07.4451.27.
[13] Professor Colin H Hansen, Fundamentals of Acoustics, Department of Mechanical
Engineering University of Adelaide South Australia 5005 Australia, retrieve from
http://www.who.int/occupational_health/publications/noise1.pdf.
[14] Rachel Burgess, (2012) Guideline Noise Assessment. Department of Environment and
Heritage Protection.pg 1-17.
[15] Railway Technical Web Pages Railway Systems, Technologies and Operations Across
The World (2013) Railway Station Design, retrieved from http://www.railway-
technical.com/stations.shtml.
[16] Birgitta Berglund, Thomas Lindval, Dietrich H Schwela (April 1999). Guideline for
Community Noise. World Health Organization,Geneva.
[17] Patricia T Johnson, Noise Exposure: Explanation of OSHA and NIOSH Safe‑Exposure
Limits and the Importance of Noise Dosimetry, retrieve from
https://www.oaktreeproducts.com /site /prodInfo/pdf//pdf/noisedosimeter.pdf.
[18] Dosh Profile, retrieve from http://www.dosh.gov.my/index.php?option=com_
content&view=article&id=1455&Itemid=172&lang=en.

84
[19] Hamidi Abdul Aziz (2008). Pencemaran Bunyi Teori,sumber, perundangan, dan
kawalan. Universiti Sains Malaysia.
[20] Siti Norsalehah Bt Othman (2011). A Study on The Compliance Of Manufacturing
Company To The Factories And Machinery Act 1967 (Act 139): A Case Study. Faculty Of
Manufacturing Engineering. Universiti Teknikal Malaysia Melaka.
[21] Scomi Rail Bhd, Noise Level Type Test procedure, document number KLMFEP-RST00-
TT0003, Perform by ISO 3095 : 2005 - Railway applications Acoustics retrieve from
https://www.iso.org/obp /ui/#iso:std:iso:3095:ed-3:v1:en.
[22] Sayed Abas Ali (2004). Department of Architecture, Faculty of Engineering, Assiut
University, Assiut, Egypt Railway noise levels, annoyance and countermeasures in
Assiut, Egypt.
[23] Gu Xiaoan (2005). Environment Control & Labor Hygiene Research Institute, China
Academy of Railway Sciences, 2 Railway environmental noise control in China Vo
[24] V Kanakasabai, et. al. (September 2005). Journal of Science &Industrial Research, Study
of Noise Level in Railway Station. Vol 64, pp 957-959.
[25] Haryati Shafii & Sharifah Meryam Shareh Musa (2008). Journal of Techno-Social
Pengangkutan di bandar: Isu dan Penyelesaian. Universiti Tun Hussein Onn Malaysia.
[26] Jakob Oertli (2006). Journal of Sound and Vibration, Developing noise control strategies
for entire railway networks Vol.293 1086–1090.
[27] Ryota Shimokura, Yoshihsru Soeta (June 2012). Journal Applied Acoustics, Sound field
characteristics of underground railway stations – Effect of interior materials and noise
source positions. Health Research Institute, National Institute of Advanced Industrial
Science and Technology. Japan.
[28] Ryota Shimokura, Yoshihsru Soeta (June 2010). Journal of Sound and Vibration,
Characteristics of train noise in above-ground and underground stations with side and
island platforms. Health Research Institute, National Institute of Advanced Industrial
Science and Technology. Japan.
[29] Robyn R.M. Gershon. et al. (Jun 2006). Journal Urban Health, Pilot Survey of Subway
and Bus Stop Noise Levels. PMC.

85
[30] TES-1358 Sound Analyzer, Retrieve from http://storeinfinity.com/tes-1358-sound-
analyzer-sound-level-meter-real-time-1-1-1-3-octave-band-analysis.html.
[31] Distance Meter, retrieve from http://www.instrumentchoice.com.au/instrument-
choice/other-meters/distance-meters.
[32] CR Nave (August 2005). HyperPhysics, Georgia State University.Canada, retrieve from
http://hyperphysics.phy-astr.gsu.edu/hbase/sound/diffrac.html.
[33] Choong Mek Zhin (January 13, 2015). Installation of automatic gate system to improve
safety of passengers. The Star: Community.p12.